Embed Size (px)
Citation preview

– 1 –
The Securities and Futures Commission of Hong Kong, Hong Kong Exchanges and Clearing
Limited, The Stock Exchange of Hong Kong Limited and Hong Kong Securities Clearing
Company Limited take no responsibility for the contents of this announcement, make no
representation as to its accuracy or completeness and expressly disclaim any liability
whatsoever for any loss howsoever arising from or in reliance upon the whole or any part of the
contents of this announcement.
This announcement does not constitute nor is intended to constitute an offer to sell or a
solicitation of an offer to buy any securities.
(a Hong Kong collective investment scheme authorized under section 104 of
the Securities and Futures Ordinance (Chapter 571 of the Laws of Hong Kong))
(Stock Code: 01426)
Managed bySpring Asset Management Limited
ANNUAL RESULTS ANNOUNCEMENTFOR THE YEAR ENDED 31 DECEMBER 2016
ANDCLOSURE OF REGISTER OF UNITHOLDERS
Distribution
The board of directors (the “Board”) of Spring Asset Management Limited (the “Manager”),
for and on behalf of Spring Real Estate Investment Trust (“Spring REIT” or the “Group”) has
resolved to declare a final distribution for the period from 1 July 2016 to 31 December 2016
of HK10.0 cents per Unit (“2016 Final Distribution”) to holders or Units (“Unitholders”)
on the register of Unitholders on 19 April 2017. Such 2016 Final Distribution, however, may
be subject to adjustment in the event of any issuance of new Units between 1 January 2017
and 19 April 2017 (the “Record Date”). Before such adjustment and together with the interim
distribution of HK13.0 cents per Unit, total distribution for the year ended 31 December 2016
(the “Reporting Year”) amounts to a total of HK23.0 cents per Unit (2015: HK26.6 cents per
Unit), representing a payout ratio of approximately 93%.

– 2 –
All distribution will be paid in Hong Kong dollars. The HKD/US$ exchange rate adopted for
the 2016 Final Distribution adopted by the Manager is 7.7574, which represents the average
mid price of the opening indicative counter exchange rate, as published by the Hong Kong
Association of Banks, for the five (5) business days immediately preceding 31 December 2016.
The amount of the 2016 Final Distribution does not include any element which is capital in
nature. In arriving at the total distributable income for the Reporting Year, adjustments have
been made to the consolidated profit after tax before transactions with Unitholders for the
Reporting Year to eliminate the effects of certain Adjustments (as defined in the Trust Deed).
Please refer to the Statement of Distributions in the consolidated financial statements for further
details.
Based on the closing price of HKD3.22 per Unit as at 31 December 2016, DPU for the
Reporting Year represents a distribution yield of 7.1%. For details of the distribution, please
refer to the section headed “Statement of Distributions” in the financial information.
Closure of Register of Unitholders
The Record Date of the 2016 Final Distribution will be 19 April 2017, Wednesday. The register
of Unitholders will be closed for the purpose of determining the identity and holdings of
Unitholders from 18 April 2017, Tuesday to 19 April 2017, Wednesday, both days inclusive,
during which period no transfer of Units will be registered. The 2016 Final Distribution is
expected to be payable on 28 April 2017, Friday to Unitholders whose names appear on the
register of Unitholders on the Record Date.
In order to qualify for the 2016 Final Distribution, all completed transfer forms in respect of
transfer of Units (accompanied by the relevant Unit certificates) must be lodged with Spring
REIT’s unit registrar in Hong Kong, being Computershare Hong Kong Investor Services
Limited, at Shops 1712–1716, 17th Floor, Hopewell Centre, 183 Queen’s Road East, Wanchai,
Hong Kong, for registration no later than 4:30 p.m. on 13 April 2017, Thursday.

– 3 –
RESULTS HIGHLIGHTS
(in US$’ million unless otherwise specified)
For the Year Ended 31 December 2016 2015 Change
Revenue 75.43 80.52 (6.3%)
Property operating expenses (18.59) (19.24) (3.4%)
Net property income 56.84 61.28 (7.2%)
Net property income margin 75.4% 76.1%
Profit after taxation 91.29 40.37 126.1%
Total distributable income 35.87 41.23 (13.0%)
As at 31 December 2016 2015 Change
Property valuation 1,296.62 1,283.55 1.0%
Total assets 1,381.16 1,377.19 0.3%
Total borrowings 480.50 477.30 0.3%
Net asset value 866.68 864.22 0.3%
Gearing ratio 34.8% 34.7%
Units Information 2016 2015 Change
DPU (HK cents) 23.0 26.6 (13.5%)
Payout ratio 93% 93%
Net asset value per Unit (HK$) 5.95 5.98 (0.5%)
Number of Units outstanding 1,130,562,940 1,120,158,306 +0.9%
During the Reporting Year, the market condition has become more challenging for the Manager
amid tax changes. Against this backdrop, the net property income of Spring REIT decreased by
2.0% year-on-year to Renminbi (“RMB”, the lawful currency of the People’s Republic of China
(the “PRC”)) 377.21 million (US$56.84 million), as property performance, though supported
by a stable occupancy rate and an improved passing rent, was dragged down by higher property
expenditure due to changes in the tax regime. While expenses including finance cost at the trust
level remained stable, the volatility in the currency market has also taken its toll and as a result,
total distributable income in US dollars’ term recorded a year-on-year decrease of 13.0% to
US$35.87 million.
– 4 –
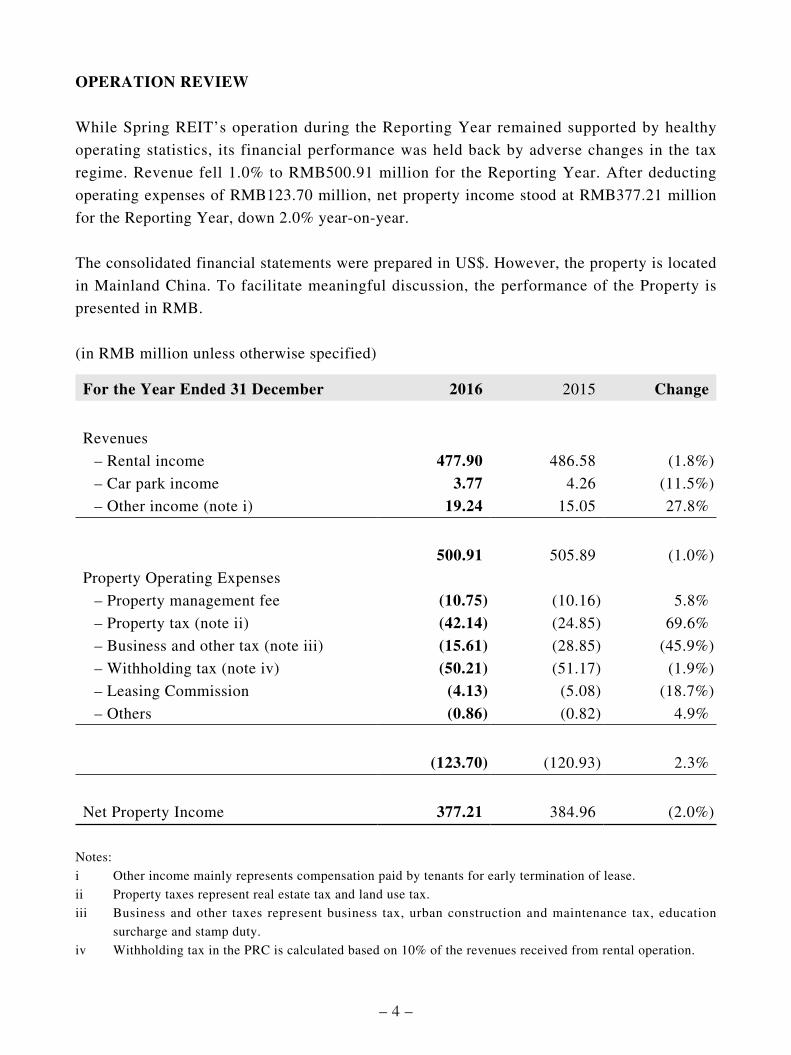
OPERATION REVIEW
While Spring REIT’s operation during the Reporting Year remained supported by healthy
operating statistics, its financial performance was held back by adverse changes in the tax
regime. Revenue fell 1.0% to RMB500.91 million for the Reporting Year. After deducting
operating expenses of RMB123.70 million, net property income stood at RMB377.21 million
for the Reporting Year, down 2.0% year-on-year.
The consolidated financial statements were prepared in US$. However, the property is located
in Mainland China. To facilitate meaningful discussion, the performance of the Property is
presented in RMB.
(in RMB million unless otherwise specified)
For the Year Ended 31 December 2016 2015 Change
Revenues
– Rental income 477.90 486.58 (1.8%)
– Car park income 3.77 4.26 (11.5%)
– Other income (note i) 19.24 15.05 27.8%
500.91 505.89 (1.0%)
Property Operating Expenses
– Property management fee (10.75) (10.16) 5.8%
– Property tax (note ii) (42.14) (24.85) 69.6%
– Business and other tax (note iii) (15.61) (28.85) (45.9%)
– Withholding tax (note iv) (50.21) (51.17) (1.9%)
– Leasing Commission (4.13) (5.08) (18.7%)
– Others (0.86) (0.82) 4.9%
(123.70) (120.93) 2.3%
Net Property Income 377.21 384.96 (2.0%)
Notes:
i Other income mainly represents compensation paid by tenants for early termination of lease.
ii Property taxes represent real estate tax and land use tax.
iii Business and other taxes represent business tax, urban construction and maintenance tax, education
surcharge and stamp duty.
iv Withholding tax in the PRC is calculated based on 10% of the revenues received from rental operation.

– 5 –
For the Reporting Year, Spring REIT reported a 1.8% decrease in rental income to RMB477.90 million, affected by the tax reform that replaced the 5% business tax rate with a value-added tax (“VAT”) at a rate of 11% levied on rental revenues (the “B2V Reform”) that was put in place in May 2016. Discounting such tax impact, net rental would have grown by approximately 1.1% to RMB463.42 million.
In terms of operating statistics, the Office Tower 1 and Office Tower 2 in China Central Place (“CCP”) along with a total of approximately 600 car parking lots (the “Property”) recorded an average occupancy for the Reporting Year of 94.3% (2015: 95.2%). A total of 54,658 sqm was leased out, 28.1% of which was attributable to new lettings while the remainder was renewal. The average net passing rent of the Property for the Reporting Year, where the impact of B2V Reform has been discounted, stood at RMB343 per sqm, up 1.6% year-on-year on the back of a respectable average rental reversions of 7.5% (2015: 8.6%).
For the Year Ended 31 December 2016 2015 Change
Average Monthly Passing Rent (RMB/sqm)− Gross passing rent 372 355 + 4.7%− Net passing rent 343 337 + 1.6%
Average Occupancy 94.3% 95.2%
2010
179
188
191
201
2011 2012
215
226
2013 2014 2015
274
288 334
352 355372
2016
337343
Gross average monthly passing rentNet average monthly passing rent
(RMB per sq.m. per month)
Note: Gross passing rent represents effective passing rent on a gross basis, inclusive of BT or VAT, as applicable. Net passing rent represents effective passing rent on a net basis, exclusive of BT or VAT, as applicable.

– 6 –
As at 31 December 2016, the weighted average lease expiry in terms of GFA was 753 days for
the Property. Leases expiring on or before year ending 31 December 2017 and 31 December
2018 account for 28% and 19% of the total leased GFA respectively, and the average unit rents
for the expiring leases were RMB334 per sqm and RMB343 per sqm respectively.
2017 2018 2019 >=2020
334 343 340
383
28%
19%
32%
21%
% of Total Expiring Rent
Tenancy base
Spring REIT’s Property had a total of 182 tenancies as at 31 December 2016. The top five
tenant accounted for 22.9% of total revenue for the Reporting Year and occupied 25.4% of total
GFA as at 31 December 2016. Details of the top five tenants occupying the largest GFA are set
out in the table below.
Tenants % of total leased office GFA
Deutsche Bank 6.4%
EPSON 6.0%
Conde Nast 4.8%
Zhong De Securities 4.3%
Xinyuan Real Estate 3.9%
Total 25.4%

– 7 –
By Leased Office GFA(As of 31 December 2016)
By monthly rental revenue(For December 2016)
39%Financialinstitution/insurance/investment
10%Machinery/equipment
manufacturing
3%Pharmaceutical/
health care
17%Professional& business
service
8%Real estate/
retail/consumerproducts
5%Technology
5%Energy/resources/shipping/trading
10%Education/media/sports
3%Businesscenter andothers
40%Financialinstitution/insurance/investment
10%Machinery/equipment
manufacturing
3%Pharmaceutical/
health care
17%Professional& business
service
8%Real estate/
retail/consumerproducts
6%Technology
6%Energy/resources/shipping/trading
7%Education/media/sports
3%Businesscenter andothers
Carpark income
For the Reporting Year, car park income amounted to RMB3.77 million, representing 0.8% of
total revenue. Car park income declined 11.5% when compared with RMB4.26 million in 2015,
and the decrease was partly attributable to the B2V Reform. Unlike office leases, the Manager
has not been able to pass on the heavier tax burden by increasing car park rates. Discounting the
impact of B2V Reform, car park income would have decreased by 5.6% to RMB4.02 million.
Cost
Property operating expenses mainly comprise of tax expenses, namely withholding tax,
business and other tax (excluding stamp duty), and property tax. Tax expenses in aggregate
accounted for 86.3% of the total property operating expenses. Property management fee,
payable at 2.0% of total revenue, accounted for 8.7% of the property operating expenses.
The mild increase of property operating expenses of 2.3% year-on-year to RMB123.70 million
(2015: RMB120.93 million) was primarily due to the increase in property tax of 69.6% to
RMB42.14 million being partially offset by a fall in business and other tax of 45.9% to
RMB15.61 million. Due to the nature of VAT, it is netted off with the rental income and not
presented as a separate line item in the income statement.

– 8 –
Top 5 Real Estate Agents and Contractors for the Reporting Year
Real estate agents and contractors Nature of services
Value of contract/
commission paid
Relevant percentage
RMB
Beijing Hua-re Real Estate Consultancy Co. Ltd.1 Property Management 10,748,547 72.2%
升輝置地(北京)房地產經紀有限公司 Leasing 1,003,821 6.7%
北京博睿環球房地產經紀有限公司 Leasing 796,525 5.4%
北京凱利聯行房地產經紀有限公司 Leasing 518,490 3.5%
北京仲量聯行物業管理服務有限公司 Leasing 416,626 2.8%
TOTAL 13,484,008 90.6%
1 Beijing Hua-re Real Estate Consultancy Co. Ltd is owned as to 40% by Mercuria which in turn holds 90.2%
shareholding in the Manager.
FINANCIAL REVIEW
As RMB continued to weaken during the Reporting Year, the RMB/US$ monthly average
exchange rate adopted was 5.4% lower than that in 2015. Partly as a result, Spring REIT
reported revenue of US$75.43 million, representing a year-on-year decrease of 6.3%. After
deducting property operating expenses of US$18.59 million, net property income amounted to
US$56.84 million, representing a retreat of 7.2% year-on-year. Net property income margin
remained stable at 75.4 % for the Reporting Year (2015: 76.1%).
During the Reporting Year, professional fees and administrative expenses remained stable at US$9.43 million. Meanwhile, total finance costs stood at US$51.90 million (2015: US$46.84 million) including a foreign exchange loss of US$32.16 million (2015: a loss of US$21.47 million) from translating US$ bank borrowings to RMB. Cash interest payment for the Reporting Year amounted to US$16.54 million, which implied an effective interest rate of 3.4%, compared with 3.3% in 2015.

– 9 –
After taking into account the mark-to-market value of foreign currencies hedging instruments which carried a US$4.45 million loss, profit after taxation for the Reporting Year was US$91.29 million (2015: US$40.37 million), principally reflecting a larger increase in fair value of the Property as compared with that of the previous financial year.
Total distributable income of Spring REIT for the Reporting Year was US$35.87 million, representing a decrease of 13.0% from that of the previous year. The reported amount has, among other adjustments, included the adding back of the foreign exchange loss of non-cash nature and the mark-to-market loss of foreign currencies hedging instruments.
FINANCIAL POSITION
The Property was appraised by Knight Frank Petty Limited (“Knight Frank” or the “Principal Valuer”) at RMB9,005.00 million (equivalent to US$1,296.62 million) as at 31 December 2016, represents an approximately 8.0% increase in RMB terms (1.0% in US$ terms) over the valuation a year ago. The valuation of the Property was arrived at using the income capitalization approach and cross-checked by the direct comparison approach. The increase in valuation was attributable mainly to a reduction in capitalization rate to 5.8% (31 December 2015: 6.5%) with consideration given to the asset performance of the Property and comparable market transactions.
With effect from 1 January 2016, Knight Frank was appointed as the Principal Valuer of Spring REIT by the Trustee pursuant to the REIT Code to succeed Colliers International (Hong Kong) Limited upon its retirement. Knight Frank is an independent qualified professional valuer, which has appropriate professional qualifications and recent experience in the valuation of similar properties in comparable locations.
As at 31 December 2016, Spring REIT had in place total loan facilities of US$500.00 million, comprising term loan facility of US$480.00 million which was fully drawn down and an uncommitted facility of US$20.00 million that remained undrawn. The amount of total outstanding borrowings remained unchanged from that as at 31 December 2015. The facilities bear an interest margin of 2.75% per annum over 3-month US$ LIBOR.
The term loan facility of US$480.00 million was recognized to be US$480.50 million in the
financial results as at 31 December 2016, as such bank borrowing was carried at amortized
cost in accordance with International Financial Reporting Standards. Bank borrowings are
recognized initially at fair value, net of transaction costs incurred. They are subsequently
carried at amortized cost; any difference between the proceeds (net of transaction costs) and the
redemption value is recognized in the income statement over the period of the borrowings using
the effective interest method.
– 10 –
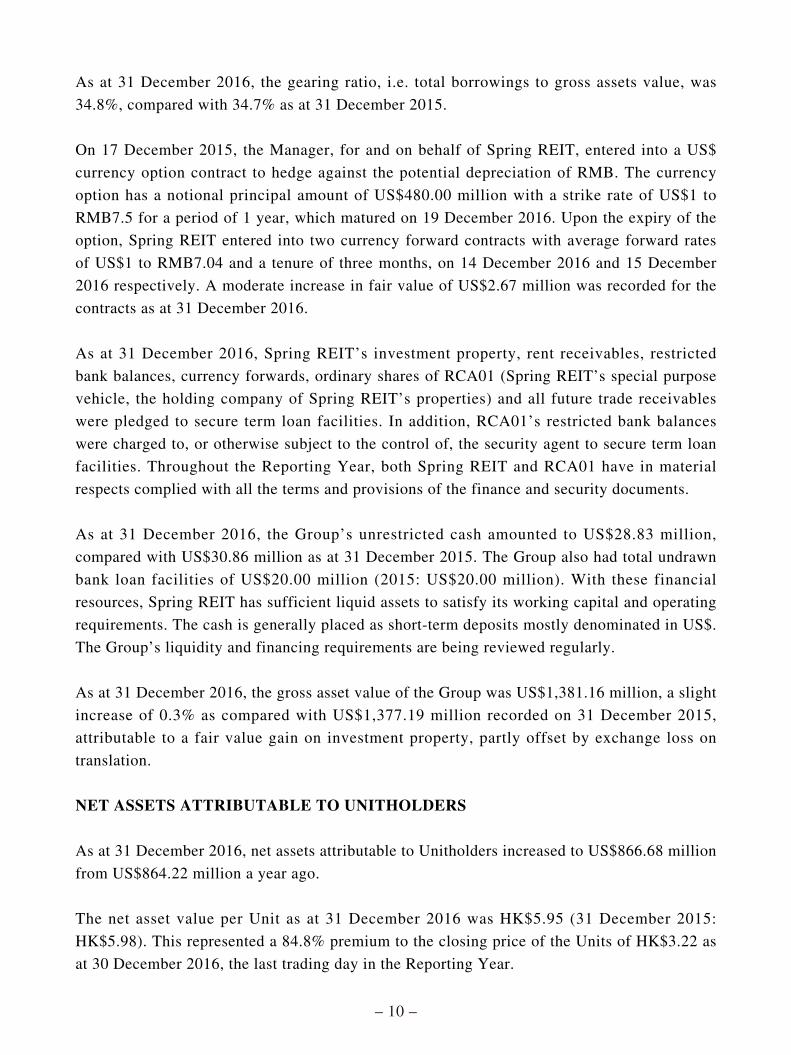
As at 31 December 2016, the gearing ratio, i.e. total borrowings to gross assets value, was
34.8%, compared with 34.7% as at 31 December 2015.
On 17 December 2015, the Manager, for and on behalf of Spring REIT, entered into a US$
currency option contract to hedge against the potential depreciation of RMB. The currency
option has a notional principal amount of US$480.00 million with a strike rate of US$1 to
RMB7.5 for a period of 1 year, which matured on 19 December 2016. Upon the expiry of the
option, Spring REIT entered into two currency forward contracts with average forward rates
of US$1 to RMB7.04 and a tenure of three months, on 14 December 2016 and 15 December
2016 respectively. A moderate increase in fair value of US$2.67 million was recorded for the
contracts as at 31 December 2016.
As at 31 December 2016, Spring REIT’s investment property, rent receivables, restricted
bank balances, currency forwards, ordinary shares of RCA01 (Spring REIT’s special purpose
vehicle, the holding company of Spring REIT’s properties) and all future trade receivables
were pledged to secure term loan facilities. In addition, RCA01’s restricted bank balances
were charged to, or otherwise subject to the control of, the security agent to secure term loan
facilities. Throughout the Reporting Year, both Spring REIT and RCA01 have in material
respects complied with all the terms and provisions of the finance and security documents.
As at 31 December 2016, the Group’s unrestricted cash amounted to US$28.83 million,
compared with US$30.86 million as at 31 December 2015. The Group also had total undrawn
bank loan facilities of US$20.00 million (2015: US$20.00 million). With these financial
resources, Spring REIT has sufficient liquid assets to satisfy its working capital and operating
requirements. The cash is generally placed as short-term deposits mostly denominated in US$.
The Group’s liquidity and financing requirements are being reviewed regularly.
As at 31 December 2016, the gross asset value of the Group was US$1,381.16 million, a slight
increase of 0.3% as compared with US$1,377.19 million recorded on 31 December 2015,
attributable to a fair value gain on investment property, partly offset by exchange loss on
translation.
NET ASSETS ATTRIBUTABLE TO UNITHOLDERS
As at 31 December 2016, net assets attributable to Unitholders increased to US$866.68 million
from US$864.22 million a year ago.
The net asset value per Unit as at 31 December 2016 was HK$5.95 (31 December 2015:
HK$5.98). This represented a 84.8% premium to the closing price of the Units of HK$3.22 as
at 30 December 2016, the last trading day in the Reporting Year.

– 11 –
NEW UNITS ISSUED
As at 31 December 2016, the total number of issued Units was 1,130,562,940, compared with
that as at 31 December 2015, a total of 10,404,634 new Units were issued during the Reporting
Year.
Date Particulars No. of Units
31 December 2015 Beginning balance of total number of Units in issue. 1,120,158,306
21 March 2016 Issue of new Units to the Manager at the price of
HK$3.216 per Unit (being the Market Price as defined in
the Trust Deed) as payment of 80% of the Manager’s base
fee for the 3-month period ended 31 December 2015.
+2,679,924
10 May 2016 Issue of new Units to the Manager at the price of
HK$3.358 per Unit (being the Market Price as defined
in the Trust Deed) as payment of 80% of the Manager’s
base fee for the 3-month period ended 31 March 2016.
+2,532,286
11 August 2016 Issue of new Units to the Manager at the price of
HK$3.501 per Unit (being the Market Price as defined
in the Trust Deed) as payment of 80% of the Manager’s
base fee for the 3-month period ended 30 June 2016.
+2,427,696
8 November 2016 Issue of new Units to the Manager at the price of
HK$3.258 per Unit (being the Market Price as defined in
the Trust Deed) as payment of 80% of the Manager’s base
fee for the 3-month period ended 30 September 2016.
+2,764,728
31 December 2016 Ending balance of total number of Units in issue. 1,130,562,940

– 12 –
CAPITAL COMMITMENTS
On 17 March 2017, DB Trustee in its capacity as trustee of Spring REIT entered into a
share purchase agreement pursuant to which Spring REIT agreed to purchase 84 commercial
properties in the United Kingdom. For details, please refer to the announcement dated 17 March
2017 related to the acquisition and the circular dated 21 March 2017 related to continuing
connected party transactions at those properties.
EMPLOYEES
Spring REIT is managed by the Manager and did not directly employ any staff during the
Reporting Year.
OUTLOOK
The year of 2016 is marked by geopolitical uncertainties. 2017 will see these changes play
out: the Trump presidency, key post-Brexit elections in Europe, volatile currencies and rising
interest rates. Closer to home, macro environment seems more upbeat as China’s economic
growth remains resilient, demonstrated by sustainable economic numbers, and in particular, a
robust property market.
In Beijing, the year 2016 marked the beginning of a pipeline of new office supply. However,
the Manager understands what differentiates Spring REIT is the quality of its product. We
are pleased to witness cases of returning tenants since our inception, evidencing not only our
superior property locations but also the quality of service we provide. We are proud to note
that out of the 182 tenancies as at 31 December 2016, 127 of them, representing 73.7% of
the building’s GFA, has remained with us since our listing in December 2013. In view of the
potential supply in Beijing, the Manager has begun and will continue to enter into leases with
longer duration in order to enhance stability and certainty of future revenue.

– 13 –
In the coming year, lease contracts constituting 28% and 31% of Spring REIT’s total GFA and
rental income respectively are due for renewal. While we are striving to achieve positive rental
reversion for new lettings and renewals, we are also aware that the tax changes introduced
during the course of 2016 will have their impact for the full year in 2017. In this regard, in the
absence of significant improvement in the office leasing market, we expect a decline in net
property income for the Property in 2017.
Going forward, the Manager will continue to devote substantial effort in modifying the capital
structure, with a view to enhancing the financial flexibility of Spring REIT. We believe an
optimal capital structure should strike a balance among various factors, including an acceptable
debt to equity range, a low cost of capital and controlled exposure to interest rate and currency
volatility. While the refinancing exercise completed in 2015 has enhanced return to our
Unitholders by offering a cheaper source of fund and a longer tenure, we are constantly looking
for room for further improvement. We would take action again to finetune the debt profile
through diversification in currencies and maturities, and to rebalance the mix of equity and
debts as well as fixed and floating rates as and when appropriate.
At Spring REIT, we are always looking for enhancement and expansion opportunities and we
believe this can be done through acquisition. While timing, pricing and market conditions are
all important factors when assessing a target, accretion and quality of cash flow remain the key
consideration for the Manager. At the extraordinary general meeting held on 20 May 2015, we
received the Unitholders’ support to expand Spring REIT’s investment scope to encompass
investment opportunities outside Asia. While China is expected to remain as the mainstay, new
opportunities to be emerged elsewhere are also what we shall explore from time to time.
In regard to the above, with the support of our sponsor Mercuria, together with its associated
company Itochu Corporation (“ITOCHU”), on 17 March 2017, DB Trustee in its capacity as
trustee of Spring REIT entered into a share purchase agreement pursuant to which Spring REIT
agreed to purchase 84 commercial properties in the United Kingdom. For details, please refer
to the announcement dated 17 March 2017 related to the acquisition and the circular dated 21
March 2017 related to continuing connected party transactions at those properties.

– 14 –
CORPORATE GOVERNANCE
With the objectives of establishing and maintaining high standards of corporate governance, certain policies and procedures have been put in place to promote the operation of Spring REIT in a transparent manner and with built-in checks and balances. The corporate governance policies of Spring REIT have been adopted with due regard to the requirements under Appendix 14 of the Rules Governing the Listing of Securities (the “Listing Rules”) on the Stock Exchange, with necessary changes as if those rules were applicable to real estate investment trusts in Hong Kong.
The Manager was established for the sole purpose of managing Spring REIT. The Manager is committed to maintaining good corporate governance practices and procedures. The corporate governance principles emphasize on accountability to all Unitholders, resolution of conflict of interest issues, transparency in reporting, compliance with relevant procedures and guidelines. The Manager has adopted its compliance manual (the “Compliance Manual”) for use in relation to the management and operation of Spring REIT, which sets out the key processes, systems and measures, and certain corporate governance policies and procedures to be applied for compliance with all applicable regulations and legislation.
Throughout the Reporting Year, both the Manager and Spring REIT have in material terms complied with the provisions of the Trust Deed, the Code on Real Estate Investment Trusts (the “REIT Code”) and applicable provisions of the Securities and Futures Ordinance (the “SFO”) and the Listing Rules.
The Manager and Spring REIT have also in material terms complied with the provisions of the Compliance Manual and the corporate governance policy throughout the Reporting Year. Key components of the governance framework and the corporate governance report for the year ended 31 December 2016 will be set out in the forthcoming annual report.
AUTHORIZATION STRUCTURE
Spring REIT is a collective investment scheme authorised by the Securities and Futures Commission (the “SFC”) under Section 104 of the SFO (Chapter 571 of the laws of Hong Kong) and regulated by the SFC pursuant to the applicable provisions of certain laws, regulations and documents including the provisions of the REIT Code. The Manager is licensed by the SFC under Section 116 of the SFO to conduct the regulated activity of asset management. As at the date of this announcement, Mr. LAU Jin Tin, Don, Mr. LEUNG Kwok Hoe, Kevin, Mr. Nobumasa SAEKI (Executive Directors of the Manager) and Mr. CHUNG Wai Fai (Senior Vice President of the Manager) are the responsible officers of the Manager pursuant to the requirements under Section 125 of the SFO and Paragraph 5.4 of the REIT Code. Mr. Lau Jin Tin, Don, an Executive Director, was approved by the SFC as an approved person of the Manager pursuant to Sections 104(2) and 105(2) of the SFO.

– 15 –
DB Trustees (Hong Kong) Limited, the trustee of Spring REIT, is registered as a trust
company under Section 77 of the Trustee Ordinance (Chapter 29 of the Laws of Hong Kong).
It is qualified to act as a trustee for collective investment schemes authorised under the SFO
pursuant to the REIT Code.
PURCHASE, SALE OR REDEMPTION OF UNITS
There was no purchase, sale or redemption of the Units by the Manager on behalf of Spring
REIT or any of the special purpose vehicles that are owned and controlled by Spring REIT
during the Reporting Year.
INVESTMENTS IN PROPERTY DEVELOPMENT AND RELEVANT INVESTMENTS
As at 31 December 2016, Spring REIT did not enter into any (i) investments in Property
Development and Related Activities (as defined in paragraph 2.16A of the REIT Code); and (ii)
Relevant Investments (as defined in paragraph 7.2B of the REIT Code).
FOREIGN ACCOUNT TAX COMPLIANCE ACT (“FATCA”)
Spring REIT met the “regularly traded on an established securities market” criteria for the
calendar year of 2015 and should therefore be excluded from having “financial accounts”
under FATCA for the calendar year 2016, and hence was not required to perform account due
diligence, reporting or withholding for its account holders under FATCA for the calendar year
2016.
PUBLIC FLOAT OF THE UNITS
Based on information that is publicly available and within the knowledge of the Manager,
Spring REIT maintained a public float of not less than 25% of the issued and outstanding Units
as at 31 December 2016.
REVIEW OF ANNUAL RESULTS
The consolidated annual results of Spring REIT for the Reporting Year have been reviewed
by the Disclosures Committee and Audit Committee of the Manager in accordance with their
respective terms of reference.

– 16 –
The consolidated annual results of Spring REIT for the Reporting Year have also been agreed
by the auditor of Spring REIT, PricewaterhouseCoopers, certified public accountants, to the
amounts set out in the Spring REIT’s consolidated financial statements for the Reporting
Year. The work performed by PricewaterhouseCoopers in this respect did not constitute an
assurance engagement in accordance with International Standards on Auditing, International
Standards on Review Engagements or International Standards on Assurance Engagements and
consequently no assurance has been expressed by PricewaterhouseCoopers on the preliminary
announcement.
ISSUANCE OF THE ANNUAL REPORT 2016
The annual report of Spring REIT for the year ended 31 December 2016 will be published
on the respective websites of the Hong Kong Exchanges and Clearing Limited at
www.hkexnews.hk and Spring REIT at www.springreit.com, and will be sent to Unitholders on
or before 30 April 2017.
ANNUAL GENERAL MEETING
The 2017 annual general meeting of Spring REIT will be held on or around 25 May, 2017,
Thursday notice of which will be published and given to Unitholders in due course.
By order of the Board
Spring Asset Management Limited(as manager of Spring Real Estate Investment Trust)
Mr. Toshihiro ToyoshimaChairman of the Manager
Hong Kong, 22 March 2017
As at the date of this announcement, the directors of the Manager are Toshihiro Toyoshima
(Chairman and non-executive director); Lau Jin Tin, Don, Nobumasa Saeki and Leung Kwok
Hoe, Kevin (executive directors); Hideya Ishino (non-executive director); and Simon Murray,
Lam Yiu Kin and Liping Qiu (independent non-executive directors).

– 17 –
CONSOLIDATED INCOME STATEMENTFOR THE YEAR ENDED 31 DECEMBER 2016
Year ended 31 December2016 2015
Notes US$’000 US$’000
Revenues 5 75,431 80,515Property operating expenses 6 (18,593) (19,239)
Net property income 56,838 61,276General and administrative expenses 7 (9,428) (9,320)Fair value gain of investment property 12 100,477 35,543Other losses, net 8 (5,214) (854)
Operating profit 142,673 86,645Finance income 519 559Finance costs on interest-bearing borrowings 9 (51,898) (46,837)
Profit for the year, before transactions with Unitholders (note i) 91,294 40,367
Distributions paid to Unitholders:– 2014 final distribution – (17,931)– 2015 interim distribution – (20,135)– 2015 final distribution (note ii) (18,238) –– 2016 interim distribution (note ii) (18,902) –
54,154 2,301
Represented by:Change in net assets attributable to Unitholders,
excluding issuance of new units (2,004) (34,791)Amount arising from exchange reserve movements
regarding translations of financial statements 56,158 37,092
54,154 2,301
Notes:
(i) Earnings per unit, based upon profit for the year, before transactions with Unitholders and the weighted average number of units in issue, is set out in note 11.
(ii) 2016 interim distribution and 2015 final distribution of US$18,902,000 and US$18,238,000 respectively were paid during the year ended 31 December 2016. Total distribution for the year ended 31 December 2016 is presented in the statement of distributions.
The notes on pages 26 to 48 are an integral part of these consolidated financial statements.

– 18 –
CONSOLIDATED STATEMENT OF COMPREHENSIVE INCOMEFOR THE YEAR ENDED 31 DECEMBER 2016
Before transactions
withUnitholders
Transactionswith
Unitholders(note i)
After transactions
with Unitholders
Notes US$’000 US$’000 US$’000
For the year ended31 December 2016
Profit for the year 91,294 (35,136) 56,158
Other comprehensive loss:Items that may be reclassified to
consolidated income statementExchange losses on translation of
financial statements (56,158) – (56,158)
Total comprehensive incomefor the year ii 35,136 (35,136) –
For the year ended31 December 2015
Profit for the year 40,367 (3,275) 37,092
Other comprehensive loss: Items that may be reclassified to
consolidated income statementExchange losses on translation of
financial statements (37,092) – (37,092)
Total comprehensive incomefor the year ii 3,275 (3,275) –
Notes:
(i) Transactions with Unitholders comprise the distributions paid to Unitholders of US$37,140,000 (2015: US$38,066,000), and change in net assets attributable to Unitholders excluding issuance of new units, which is a decrease of US$2,004,000 (2015: a decrease of US$34,791,000).
(ii) In accordance with the Trust Deed, Spring REIT is required to distribute not less than 90% of total distributable income to Unitholders for each financial year. Accordingly, the units contain contractual obligations of Spring REIT to pay cash distributions. The Unitholders’ funds are therefore classified as a financial liability rather than equity in accordance with International Accounting Standard 32: Financial Instruments: Presentation. Consistent with Unitholders’ funds being classified as a financial liability, the distributions to Unitholders and change in net assets attributable to Unitholders, excluding issuance of new units, are part of finance costs which are recognized in the consolidated income statement. Accordingly, the total comprehensive income, after transactions with Unitholders is zero.
The notes on pages 26 to 48 are an integral part of these consolidated financial statements.

– 19 –
STATEMENT OF DISTRIBUTIONSFOR THE YEAR ENDED 31 DECEMBER 2016
2016 2015
US$’000 US$’000
Profit before transactions with Unitholders 91,294 40,367
Adjustments:
– Fair value gain of investment property (100,477) (35,543)
– Net fair value losses of derivative financial instruments 4,447 72
– Manager’s fee expenses in units in lieu of cash 4,506 4,477
– Amortization of transaction cost for the bank borrowings 3,199 7,278
– Derecognization of loan arrangement fee upon early
repayment of previous bank borrowings – 2,358
– Unrealized foreign exchange losses 32,903 22,225
Distributable income for the year (note i) 35,872 41,234
Total distributions of the year (note ii) 33,451 38,389
Represented by:
Interim distribution, paid (note iii) 18,902 20,135
Final distribution, to be paid 14,549 18,254
Total distributions of the year (note ii) 33,451 38,389
Percentage of total distribution over distributable
income for the year 93% 93%
Distributions per unit to Unitholders
– Interim distribution per unit, paid (note iii) HK13.0 cents HK14.0 cents
– Final distribution per unit, to be paid (note iv) HK10.0 cents HK12.6 cents
Distribution per unit for the year (note iv) HK23.0 cents HK26.6 cents

– 20 –
Notes:
(i) Under the terms of the Trust Deed, the distributable income represents the profit for the year before transactions with Unitholders, adjusted to eliminate the effects of certain non-cash transactions which have been recorded in the consolidated income statement for the year.
(ii) In accordance with the terms of the Trust Deed, Spring REIT is required to distribute to Unitholders not less than 90% of its total distributable income for each financial year. As disclosed in the offering circular dated 25 November 2013, it is the Manager’s intention to distribute 100% of Spring REIT’s total distributable income for the period from the Listing Date to 31 December 2014, and thereafter not less than 90% of its total distributable income for each subsequent financial period. The Manager also has the discretion to make distributions over and above the minimum 90% of Spring REIT’s total distributable income if and to the extent Spring REIT has funds surplus to meet its business requirements.
(iii) The interim distribution per unit for the six months ended 30 June 2016 was calculated based on the interim distribution of US$18,902,000 for the period and 1,127,798,212 units in issue. The interim distribution was paid to Unitholders on 23 September 2016.
(iv) The final distribution per unit of HK10.0 cents for the year ended 31 December 2016 is calculated based on the final distribution to be paid to Unitholders of US$14,549,000 for the second half of the financial year and 1,130,562,940 units in issue as at 31 December 2016, rounded to the nearest HK$0.1 cents, without taking into account any consideration or subdivision of units which may have occurred between the dates of declaration of the distribution and 19 April 2017 (the “Record Date”). The final distribution for the year ended 31 December 2016 is expected to be paid to Unitholders on 28 April 2017. Such final distributions per unit, however, may be subject to adjustment upon the issuance of new units between 1 January 2017 and the Record Date, if any.
The final distribution per unit of HK12.6 cents for the year ended 31 December 2015 was calculated based on the final distribution paid to the Unitholders of US$18,254,000 for the second half of the financial year and 1,120,158,306 units in issue as at 31 December 2015, rounded to the nearest HK0.1 cent. The final distribution for the year ended 31 December 2015 was paid to Unitholders on 20 April 2016.
(v) All distributions to Unitholders are determined and paid in Hong Kong dollar.
The notes on pages 26 to 48 are an integral part of these consolidated financial statements.

– 21 –
CONSOLIDATED STATEMENT OF FINANCIAL POSITIONAS AT 31 DECEMBER 2016
As at 31 December2016 2015
Notes US$’000 US$’000Non-current assetInvestment property 12 1,296,616 1,283,552
Total non-current asset 1,296,616 1,283,552
Current assetsTrade and other receivables 14 2,421 1,455Derivative financial instruments 13 2,670 7,117Restricted bank balances 15 50,631 54,208Cash and cash equivalents 15 28,825 30,857
Total current assets 84,547 93,637
Total assets 1,381,163 1,377,189
Current liabilitiesTrade and other payables 16 13,342 13,258Rental deposits 16 20,640 22,406
Total current liabilities 33,982 35,664
Non-current liabilities, excluding net assetsattributable to Unitholders
Interest-bearing borrowings 17 480,499 477,301
Total liabilities, excluding net assets attributableto Unitholders 514,481 512,965
Net assets attributable to Unitholders 866,682 864,224
Units in issue (’000) 18 1,130,563 1,120,158
Net asset value per unit attributable to UnitholdersIn US$ 0.77 0.77In HK$ 5.95 5.98

– 22 –
The notes on pages 26 to 48 are an integral part of these consolidated financial statements.
For and on behalf of the Board of Directors of
Spring Asset Management Limited, as the Manager
Lau Jin Tin, Don Nobumasa SaekiExecutive Director Executive Director

– 23 –
CONSOLIDATED STATEMENT OF CHANGES IN EQUITY AND NET ASSETSATTRIBUTABLE TO UNITHOLDERSFOR THE YEAR ENDED 31 DECEMBER 2016
Reserves(note)
Net assetsattributable to
Unitholders US$’000 US$’000
As at 1 January 2016 – 864,224
Profit for the year, before transactions with Unitholders – 91,294Exchange losses on translation of financial statements (56,158) –Amount arising from exchange reserve movements 56,158 (56,158)Distributions paid to Unitholders:
– 2015 final distribution – (18,238)– 2016 interim distribution – (18,902)
Change in net assets attributable to Unitholders
for the year ended 31 December 2016,
excluding issues of new units – (2,004)
Issuance of units – 4,462
As at 31 December 2016 – 866,682
Note: Reserves include exchange reserve, arising from translation of financial statements and retained earnings,
representing amount set aside to offset exchange reserve movements.

– 24 –
Reserves
(note)
Net assets
attributable to
Unitholders
US$’000 US$’000
As at 1 January 2015 – 894,154
Profit for the year, before transactions with Unitholders – 40,367
Exchange losses on translation of financial statements (37,092) –
Amount arising from exchange reserve movements 37,092 (37,092)
Distributions paid to Unitholders:
– 2014 final distribution – (17,931)
– 2015 interim distribution – (20,135)
Change in net assets attributable to Unitholders
for the year ended 31 December 2015,
excluding issues of new units – (34,791)
Issuance of units – 4,861
As at 31 December 2015 – 864,224
Note: Reserves include exchange reserve, arising from translation of financial statements and retained earnings,
representing amount set aside to offset exchange reserve movements.

– 25 –
CONSOLIDATED STATEMENT OF CASH FLOWSFOR THE YEAR ENDED 31 DECEMBER 2016
Year ended 31 December2016 2015
Notes US$’000 US$’000
Cash flows from operating activitiesCash generated from operations 19 50,883 56,047
Interest received 519 559
Net cash generated from operating activities 51,402 56,606
Cash flows from investing activityAdditions to investment property (1,124) –
Net cash used in investing activity (1,124) –
Cash flows from financing activitiesProceeds from borrowings, net of transaction cost – 471,924
Repayment of borrowings – (465,000)
Interest paid (16,542) (15,741)
Decrease in restricted bank balances 1,456 4,959
Distributions to Unitholders (37,140) (38,066)
Purchase of derivative financial instrument – (7,104)
Net cash used in financing activities (52,226) (49,028)
Net (decrease)/increase in cash and cashequivalents (1,948) 7,578
Cash and cash equivalents at the beginning
of the year 30,857 24,286
Exchange loss on cash and cash equivalents (84) (1,007)
Cash and cash equivalents at end of year 28,825 30,857

– 26 –
NOTES TO THE CONSOLIDATED FINANCIAL STATEMENTS
1 GENERAL INFORMATION
Spring Real Estate Investment Trust (“Spring REIT”) is a Hong Kong collective investment scheme authorized under section 104 of the Securities and Futures Ordinance (Chapter 571 of the Laws of Hong Kong). Spring REIT was established on 25 November 2013 and its units are listed on the main board of The Stock Exchange of Hong Kong Limited (the “HKSE”) on 5 December 2013. Spring REIT is governed by the Trust Deed entered into between Spring Asset Management Limited (the “Manager”) and DB Trustees (Hong Kong) Limited (the “Trustee”) on 14 November 2013 as amended by First Supplemental Deed dated 22 May 2015 (together the “Trust Deed”), and the Code on Real Estate Investment Trusts issued by the Securities and Futures Commission of Hong Kong (the “REIT Code”). The addresses of the registered offices of the Manager and the Trustee are Room 2801, 28/F, Man Yee Building, 68 Des Voeux Road Central, Hong Kong and 52/F, International Commerce Centre, 1 Austin Road West, Kowloon, Hong Kong, respectively.
The principal activity of Spring REIT and RCA01, its wholly owned subsidiary (together, the “Group”) is to own and invest in income-producing real estate assets.
The consolidated financial statements are presented in United States dollars (“US$”). The functional currency of Spring REIT is Hong Kong dollars (“HK$”), the distribution of Spring REIT is determined and paid in HK$.
2 SUMMARY OF SIGNIFICANT ACCOUNTING POLICIES
The principal accounting policies applied in the preparation of these consolidated financial statements are set out below. These policies have been consistently applied during the year unless otherwise stated.
(a) Basis of preparation
The consolidated financial statements have been prepared in accordance with International Financial Reporting Standards (“IFRSs”), the requirements of the Trust Deed and the relevant disclosure requirements as set out in Appendix C of the REIT Code issued by the Securities and Futures Commission of Hong Kong.
The consolidated financial statements have been prepared under the historical cost convention, as modified by the revaluation of investment property and derivative financial instruments, which are carried at fair value.
The preparation of financial statements in conformity with IFRSs requires the use of certain critical accounting estimates. It also requires management to exercise its judgement in the process of applying the Group’s accounting policies. The areas involving a higher degree of judgement or complexity, or areas where assumptions and estimates are significant to the consolidated financial statements are disclosed in note 4.
New standards, amendments and improvements to existing standards adopted by the Group
The Group has adopted all of the new standards, amendments and improvements to existing standards issued by the International Accounting Standards Board that are relevant to the Group’s operations and mandatory for annual accounting periods beginning 1 January 2016.

– 27 –
New standards, amendments and improvements to existing standards effective in 2016 which are relevant to the Group’s operations:
IAS 1 Amendments Disclosure InitiativeIAS 16 and IAS 38 Amendments Clarification of Acceptable Methods of Depreciation
and AmortizationIAS 16 and IAS 41 Amendments Agriculture: Bearer PlantsIAS 27 Amendments Equity Method in Separate Financial StatementsIFRS 10, IFRS 12, and IAS 28
AmendmentsInvestment Entities: Applying the Consolidation
ExceptionIFRS 11 Amendments Accounting for Acquisitions of Interests in Joint
OperationIFRS 14Annual Improvements Project
Regulatory Deferral AccountsAnnual Improvements to IFRSs 2012-2014 cycle
The adoption of these new standards, amendments and improvements to existing standards does not have a material impact on the accounting policies or results and the financial position of the Group and/or as the disclosure set out in these consolidated financial statements.
New standards and amendments to existing standards not yet adopted
The following new standards and amendments to existing standards are in issue but not yet effective, and have not been early adopted by the Group.
Effective for accounting
periodsbeginning on
or after
IAS 7 Amendments Disclosure initiative 1 January 2017IAS 12 Amendments Recognition of Deferred Tax Assets for
Unrealized Loss1 January 2017
IFRS 2 Amendments Classification and measurement ofShare-based Payment Transactions
1 January 2018
IFRS 9 Financial Instruments 1 January 2018IFRS 15 Revenue from Contracts with Customers 1 January 2018IFRS 16 Leases 1 January 2019IFRS 10 and
IAS 28 AmendmentsSale or Contribution of Assets between an
Investor and its Associate or Joint VentureTo be
determined
The Group will apply the above new standards and amendments to existing standards as and when they become effective. The Group has already commenced an assessment of the impact of these new standards and amendments to existing standards, and anticipated that the adoption of new standards and amendments to existing standards will not have a material effect on the Group’s operating result or financial position.
(b) Consolidation
The consolidated financial statements incorporate the assets and liabilities of Spring REIT and its subsidiary as at 31 December 2016 and their results for the year then ended.

– 28 –
A subsidiary is an entity (including a structured entity) over which the Group has control. The Group
controls an entity when it is exposed to, or has rights to, variable returns from its involvement with
the entity and has the ability to affect those returns through its power over the entity. Subsidiaries
are consolidated from the date on which control is transferred to the Group. They are deconsolidated
from the date that control ceases.
Inter-company transactions, balances and unrealized gains on transactions between Group companies
are eliminated in full on consolidation. Unrealized losses are also eliminated unless the transaction
provides evidence of impairment of the asset transferred.
(c) Revenue recognition
Revenue is measured at the fair value of the consideration received or receivable, for rental income
in the ordinary course of the Group’s activities. The Group recognizes revenue when the amount
of revenue can be reliably measured; when it is probable that future economic benefits will flow to
the entity; and when specific criteria have been met for each of the Group’s activities, as described
below.
(i) Rental and car park income
Operating lease rental income from investment property is recognized in the consolidated
income statement on a straight-line basis over the terms of lease agreements. Lease incentives
provided, such as rent-free periods, are amortized on a straight-line basis and are recognized
as a reduction of rental income over the respective term of the lease.
(ii) Interest income
Interest income is recognized on a time proportion basis using the effective interest method.
(d) Investment property
Investment property, principally comprising leasehold land and buildings, is held for long-term rental
yields or for capital appreciation or both, and that is not occupied by the Group. It also includes
properties that are being constructed or developed for future use as investment properties. Land held
under operating leases are accounted for as investment properties when the rest of the definition of an
investment property is met. In such cases, the operating leases concerned are accounted for as if they
were finance leases. Investment property is initially measured at cost, including related transaction
costs and where applicable borrowing costs.
After initial recognition, investment properties are carried at fair value, representing open market
value determined at each reporting date by external valuer. Fair value is based on active market
prices, adjusted, if necessary, for any difference in the nature, location or condition of the specific
asset. If the information is not available, the Group uses alternative valuation methods such as recent
prices on less active markets or discounted cash flow projections. Changes in fair values are recorded
in the consolidated income statement as part of a valuation gain or loss.

– 29 –
(e) Derivative financial instruments
Derivatives are initially recognized at fair value on the date a derivative contract is entered into and
are subsequently remeasured at its fair value at the end of each reporting year. The change in the fair
value is recognized in the consolidated income statement. At the initial recognition of the derivatives
financial instrument, the difference between the transaction price and the valuation using valuation
technique that applies only the market observable date is not recognized in income statements, such
difference will be amortised over the life of the derivatives in a systematic basis.
(f) Trade and other receivables
Trade and other receivables are recognized initially at fair value and subsequently measured at
amortized cost, less provision for impairment. A provision for impairment of trade and other
receivables is established when there is objective evidence that the Group will not be able to collect
all amounts due according to the original terms of the receivables. The amount of the provision is the
difference between the asset’s carrying amount and the present value of estimated future cash flows,
discounted at the effective interest rate. The amount of the provision is recognized in the consolidated
income statement.
In the event that lease incentives, including rent free periods, are given to enter into operating leases,
such incentives are recognized as deferred rent receivables. The aggregate benefit of incentives is
recognized as a reduction of rental income on a straight-line basis.
(g) Cash and cash equivalents
Cash and cash equivalents includes cash in hand and deposits held at call with banks with original
maturities of three months or less.
(h) Interest-bearing borrowings
Borrowings are recognized initially at fair value, net of transaction costs incurred. Borrowings are
subsequently carried at amortized cost; any difference between the proceeds (net of transaction costs)
and the redemption value is recognized in the consolidated income statement over the period of the
borrowings using the effective interest method.
Fees paid on the establishment of loan facilities are recognized as transaction costs of the loan to the
extent that it is probable that some or all of the facility will be drawn down. In this case, the fee is
deferred until the draw-down occurs. To the extent there is no evidence that it is probable that some
or all of the facility will be drawn down, the fee is capitalized as a pre-payment for liquidity services
and amortized over the period of the facility to which it relates.
Borrowings are classified as current liabilities unless the Group has an unconditional right to defer
settlement of the liability for at least 12 months after the end of the reporting period.
(i) Borrowing costs
Borrowing costs are recognized in the consolidated income statement in the period in which they are
incurred.

– 30 –
(j) Payables and provisions
(i) Trade and other payables
Trade and other payables are obligations to pay for goods or services that have been acquired
in the ordinary course of business from suppliers. Trade and other payables are classified as
current liabilities if payment is due within one year or less (or in the normal operating cycle of
the business if longer). If not, they are presented as non-current liabilities.
Trade and other payables are recognized initially at fair value and subsequently measured at
amortized cost using the effective interest method.
(ii) Provisions
Provisions are recognized when there is a present legal or constructive obligation as a
result of past events, it is probable that an outflow of resources will be required to settle the
obligation and a reliable estimate of the amount can be made. Where a provision is expected
to be reimbursed, the reimbursement is recognized as a separate asset but only when the
reimbursement is virtually certain.
Provisions are measured at the present value of the expenditures expected to be required to
settle the obligation that reflects current market assessments of the time value of money and
the risks specific to the obligation.
(iii) Rental deposit
Rental deposits arise when the Group enters into lease agreement directly with a tenant. Such
deposits are included in current liabilities, as they are expected to be realized in the Group’s
normal business operating cycle.
(k) Taxation
The current taxation charge is calculated on the basis of the tax laws enacted or substantively enacted
at the end of the reporting year in the People’s Republic of China (“PRC”) where the Group operates
and generates taxable income. Management periodically evaluates positions taken in tax returns with
respect to situations in which applicable tax regulation is subject to interpretation. It establishes
provisions where appropriate on the basis of amounts expected to be paid to the tax authorities.
Deferred income tax is recognized, using the liability method, on temporary differences arising
between the tax bases of assets and liabilities and their carrying amounts in the consolidated financial
statements.

– 31 –
(l) Foreign currency translation
(a) Functional and presentation currency
Items included in the financial statements of each of the Group’s entities are measured
using the currency of the primary economic environment in which the entity operates (the
“functional currency”). Spring REIT’s functional currency is HK$. The consolidated financial
statements are presented in US$ to facilitate analysis of financial information by Unitholders.
The Group’s functional currency is different from the presentation currency and the results and
financial position are translated into the presentation currency as follows:
(i) assets and liabilities for each consolidated statement of financial position presented are
translated at the closing rate at the date of that statement of financial position;
(ii) income and expenses for each consolidated income statement are translated at average
exchange rates (unless this average is not a reasonable approximation of the cumulative
effect of the rates prevailing on the transaction dates, in which case income and
expenses are translated at the dates of the transactions); and
(iii) all resulting exchange differences are recognized in other comprehensive income.
(b) Transactions and balances
Foreign currency transactions are translated into the functional currency using the exchange
rates prevailing at the dates of the transactions or valuation where items are re-measured.
Foreign exchange gains and losses resulting from the settlement of such transactions and from
the translation at year-end exchange rates of monetary assets and liabilities denominated in
foreign currencies are recognized in the consolidated income statement.
Foreign exchange gains and losses that relate to borrowings are presented in the consolidated
income statement within ‘finance costs’. All other foreign exchange gains and losses are
presented in the consolidated income statement within other gains or losses.
Translation differences on non-monetary financial assets and liabilities such as derivatives
held at fair value through profit or loss are recognized in the consolidated income statement as
part of the fair value gains or losses. Translation differences on other non-monetary financial
assets are included in other comprehensive income.
(m) Unitholders’ funds as a financial liability
In accordance with the Trust Deed, Spring REIT is required to distribute to Unitholders not less than
90% of the Group’s total distributable income for each financial year. Accordingly, the units contain
a contractual obligation of the trust to pay to its Unitholders cash distributions. The Unitholders’
funds are therefore classified as a financial liability rather than equity in accordance with IAS 32:
Financial Instruments: Presentation. It is shown on the consolidated statement of financial position as
the net assets attributable to Unitholders.
– 32 –
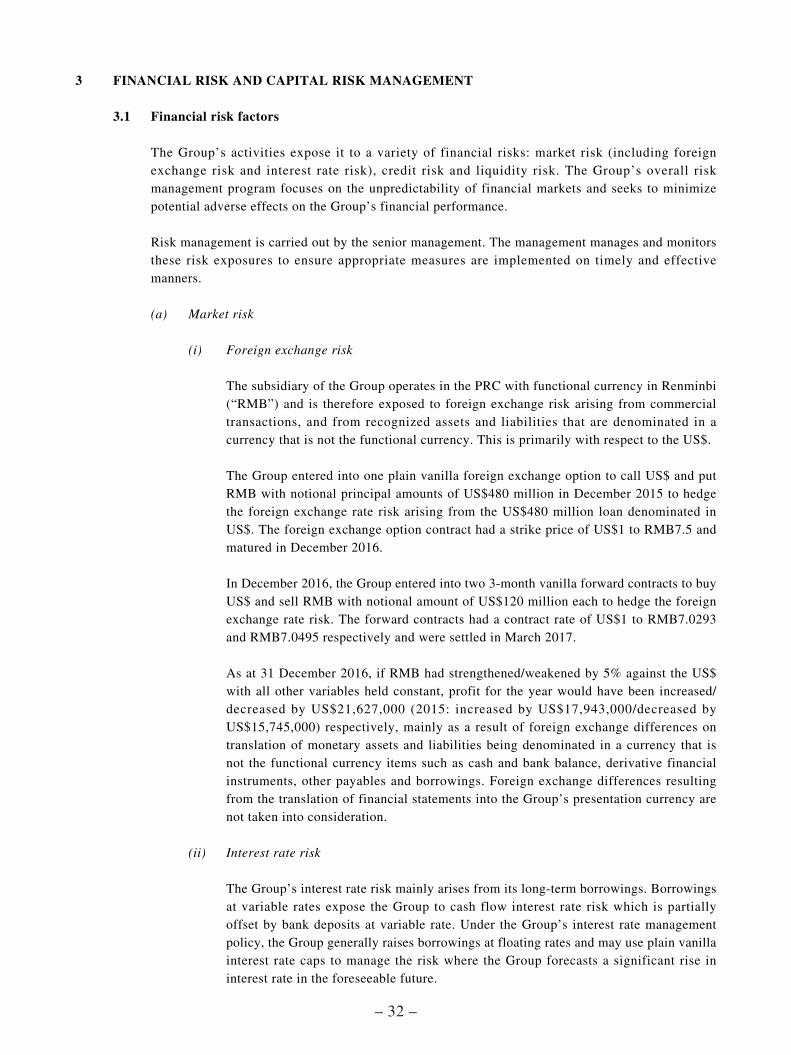
3 FINANCIAL RISK AND CAPITAL RISK MANAGEMENT
3.1 Financial risk factors
The Group’s activities expose it to a variety of financial risks: market risk (including foreign exchange risk and interest rate risk), credit risk and liquidity risk. The Group’s overall risk management program focuses on the unpredictability of financial markets and seeks to minimize potential adverse effects on the Group’s financial performance.
Risk management is carried out by the senior management. The management manages and monitors these risk exposures to ensure appropriate measures are implemented on timely and effective manners.
(a) Market risk
(i) Foreign exchange risk
The subsidiary of the Group operates in the PRC with functional currency in Renminbi (“RMB”) and is therefore exposed to foreign exchange risk arising from commercial transactions, and from recognized assets and liabilities that are denominated in a currency that is not the functional currency. This is primarily with respect to the US$.
The Group entered into one plain vanilla foreign exchange option to call US$ and put RMB with notional principal amounts of US$480 million in December 2015 to hedge the foreign exchange rate risk arising from the US$480 million loan denominated in US$. The foreign exchange option contract had a strike price of US$1 to RMB7.5 and matured in December 2016.
In December 2016, the Group entered into two 3-month vanilla forward contracts to buy US$ and sell RMB with notional amount of US$120 million each to hedge the foreign exchange rate risk. The forward contracts had a contract rate of US$1 to RMB7.0293 and RMB7.0495 respectively and were settled in March 2017.
As at 31 December 2016, if RMB had strengthened/weakened by 5% against the US$ with all other variables held constant, profit for the year would have been increased/decreased by US$21,627,000 (2015: increased by US$17,943,000/decreased by US$15,745,000) respectively, mainly as a result of foreign exchange differences on translation of monetary assets and liabilities being denominated in a currency that is not the functional currency items such as cash and bank balance, derivative financial instruments, other payables and borrowings. Foreign exchange differences resulting from the translation of financial statements into the Group’s presentation currency are not taken into consideration.
(ii) Interest rate risk
The Group’s interest rate risk mainly arises from its long-term borrowings. Borrowings at variable rates expose the Group to cash flow interest rate risk which is partially offset by bank deposits at variable rate. Under the Group’s interest rate management policy, the Group generally raises borrowings at floating rates and may use plain vanilla interest rate caps to manage the risk where the Group forecasts a significant rise in interest rate in the foreseeable future.

– 33 –
As at 31 December 2016, if interest rates had been 50 basis points higher/lower with all
other variables held constant, profit for the year would have been US$2,003,000 (2015:
US$1,975,000) lower/higher respectively, mainly as a result of higher/lower interest
expense on floating rate borrowings.
(b) Credit risk
Credit risk arises from the potential failure of the Group’s counterparties to meet their
obligations under financial contracts. The Group is exposed to credit risk on its deposits with
financial institutions, derivative financial instruments as well as trade and other receivables.
For deposits with financial institutions, the Group has limited its credit exposure by restricting
their selection of financial institutions to reputable banks with sound credit ratings.
In respect of credit exposures to tenants, credit risk exposure is minimized by undertaking
transactions with a large number of counterparties and conducting credit evaluations on
prospective tenants before lease agreements are entered into with tenants. Monthly rentals are
payable in advance by tenants in accordance with the leases. The Group also has policies in
place to ensure that rental security deposits are required from tenants prior to commencement
of leases. It also has other monitoring procedures to ensure that follow-up actions are taken
to recover overdue debts. In addition, the Group regularly reviews the recoverable amount
of each individual trade receivable to ensure that adequate provision for impairment losses is
made for irrecoverable amounts.
(c) Liquidity risk
Cash flow forecasting is performed by the Group’s finance function (“Group Finance”).
Group Finance monitors rolling forecasts of the Group’s liquidity requirements to ensure
it has sufficient cash to meet operational needs while maintaining sufficient headroom on
its borrowing facilities (note 17) at all times so that the Group does not breach borrowing
limits or covenants (where applicable) on any of its borrowing facilities. Such forecasting
takes into consideration the Group’s debt financing plans, covenant compliance, compliance
with internal financial position ratio targets and, if applicable external regulatory or legal
requirements.
Liquidity risk management includes maintaining sufficient cash, the availability of funding
from operating cash flow and seeking stable financing activities. The Group will continue to
monitor market conditions to assess the possibility of arranging longer term refinancing at
favorable rates and extending the maturity profile of its debts.

– 34 –
The table below analyses the Group’s financial liabilities into relevant maturity groupings
based on the remaining period at the reporting date to the contractual maturity dates. The
amounts disclosed in the table are the contractual undiscounted cash flows which comprise
both interest and principal cash flows.
Within1 year
Between1 and
2 years
Between2 and
5 yearsOver
5 yearsUS$’000 US$’000 US$’000 US$’000
At 31 December 2016
Accruals and other payables 2,712 – – –Rental deposit 5,204 4,804 10,269 363Interest payable on borrowings 19,105 21,889 31,959 –Interest-bearing borrowings – – 480,000 –
Within
1 year
Between
1 and
2 years
Between
2 and
5 years
Over
5 years
US$’000 US$’000 US$’000 US$’000
At 31 December 2015
Accruals and other payables 2,432 – – –
Rental deposit 9,603 6,075 6,715 13
Interest payable on borrowings 17,595 20,584 54,388 –
Interest-bearing borrowings – – 480,000 –
3.2 Capital risk management
The Group’s objectives when managing capital are to safeguard the Group’s ability to continue as a
going concern in order to provide returns for Unitholders.
The Group monitors capital on the basis of the gearing ratio. The gearing ratio is calculated as total
borrowings divided by total assets.
As at 31 December2016 2015
US$’000 US$’000
Total borrowings (note 17) 480,499 477,301
Total assets 1,381,163 1,377,189
Gearing ratio 34.8% 34.7%

– 35 –
3.3 Fair value estimation
The table below analyses the Group’s financial instruments carried at fair value as at 31 December 2016 by level of the inputs to valuation techniques used to measure fair value. Such inputs are categorized into three levels within a fair value hierarchy as follows:
• Quoted prices (unadjusted) in active markets for identical assets or liabilities (level 1).
• Inputs other than quoted prices included within level 1 that are observable for the asset or liability, either directly (that is, as prices) or indirectly (that is, derived from prices) (level 2).
• Inputs for the asset or liability that are not based on observable market data (that is, unobservable inputs) (level 3).
The following table presents financial instruments that are measured at fair values.
Level 1 Level 2 Level 3 TotalAt 31 December 2016 US$’000 US$’000 US$’000 US$’000
AssetDerivative financial instruments – 2,670 – 2,670
Level 1 Level 2 Level 3 TotalAt 31 December 2015 US$’000 US$’000 US$’000 US$’000
AssetDerivative financial instruments – – 7,117 7,117
There were no transfers between levels 1, 2 and 3 during the year.
Valuation techniques used to derive the fair values of the derivatives are as follows:
As at 31 December 2016, the level 2 derivative financial instruments represented vanilla forward contracts which are not traded in an active market The fair values of these derivative financial instruments are based on prices quoted by financial institutions, which are determined using forward prices at the end of the reporting period.
As at 31 December 2015, the level 3 derivative financial instruments represented plain vanilla foreign exchange option which are not traded in an active market. At the initial recognition of the derivatives financial instrument, the difference between the transaction price and the valuation using valuation technique that applies only the data from observable markets will not recognize in income statements, such difference will be amortised over the life of the derivatives in a systematic basis. The valuation using valuation technique that applies only the market observable data is based on prices quoted by financial institutions, which are determined using forward prices at the end of the reporting period.
There were no changes in valuation techniques during the year.
The disclosures of the investment property, that is measured at fair value, are set out in note 12.

– 36 –
4 CRITICAL ACCOUNTING ESTIMATES AND JUDGEMENTS
Estimates and judgements are continually evaluated and are based on historical experience and other
factors, including expectations of future events that are believed to be reasonable under the circumstances.
The Group makes estimates and assumptions concerning the future. The resulting accounting estimates will,
by definition, seldom equal the related actual results. The estimates and assumptions that have a significant
effect on carrying amounts of assets and liabilities within the next financial year are discussed below.
(a) Estimates of fair value of investment property
The fair value of each investment property is individually determined at each reporting date by
independent valuer using valuation techniques. Details of the judgement and assumptions have been
disclosed in note 12.
(b) Estimates of fair values of derivative financial instruments
Fair values of derivative financial instruments have been arrived at using valuations provided by the
counterparty banks for each reporting year with reference to market data such as interest rates and
exchange rates. Actual results may differ when assumptions and selections of valuation technique
changes.
(c) Taxation
The Group is a foreign enterprise established outside the PRC. The Group is subject to various
taxes in the PRC. Significant judgement is required in determining the provision for taxation
including deferred taxation. There are many transactions and calculations for which the ultimate tax
determination is uncertain during the ordinary course of business. The Group recognizes or writes
back liabilities for anticipated tax issues based on estimates of whether additional taxes will be due or
reversal to be made. Where the final tax outcome of these matters is different from the amounts that
were initially recorded, such differences will impact the taxation and deferred tax.
5 REVENUE AND SEGMENT INFORMATION
The Group holds an investment property in the PRC and is principally engaged in property investment.
Revenue mainly consists of rental income from tenants. Management has determined the operating
segments based on the reports reviewed by the chief operating decision-maker, that are used to make
strategic decisions. Given that management review the operating results of the Group on an aggregate basis,
no segment information is therefore presented.
The Group’s revenues from tenants are derived solely from its operation in the PRC and the non-current
assets of the Group are also mainly located in the PRC.

– 37 –
An analysis of revenues of the Group is as follows:
Year ended 31 December2016 2015
US$’000 US$’000
Revenues
Rental income (note i) 72,645 78,154
Car park income 566 678
Other income (note ii) 2,220 1,683
75,431 80,515
Note:
(i) With effect from 1 May 2016, the business tax formerly applicable to the Group was replaced by the
value-added tax (“VAT”). VAT is a tax detached from selling price and pursuant to the IFRS, the
rental income from 1 May 2016 onwards is presented in the financial statements as excluding any
VAT collected by Spring REIT on behalf of the relevant tax authorities. Relevant business tax of
rental income borne by the Group before 1 May 2016 was included in property operating expenses
(note 6).
(ii) Other income mainly represents compensation paid by tenants for early termination of lease.
6 PROPERTY OPERATING EXPENSES
Year ended 31 December2016 2015
US$’000 US$’000
Property management fee 1,617 1,618
Property tax (note i) 6,286 3,955
Business and other taxes (note ii) 2,373 4,591
Withholding tax (note iii) 7,564 8,142
Leasing commission 623 803
Others 130 130
18,593 19,239
Notes:
(i) Property taxes represent real estate tax and land use tax.
(ii) Business and other taxes represent business tax, urban construction and maintenance tax, education
surcharge and stamp duty. With effect from 1 May 2016, the business tax formerly applicable to the
Group was replaced by the VAT.
(iii) Withholding tax in the PRC is calculated based on 10% of the revenues received from rental
operation.
– 38 –
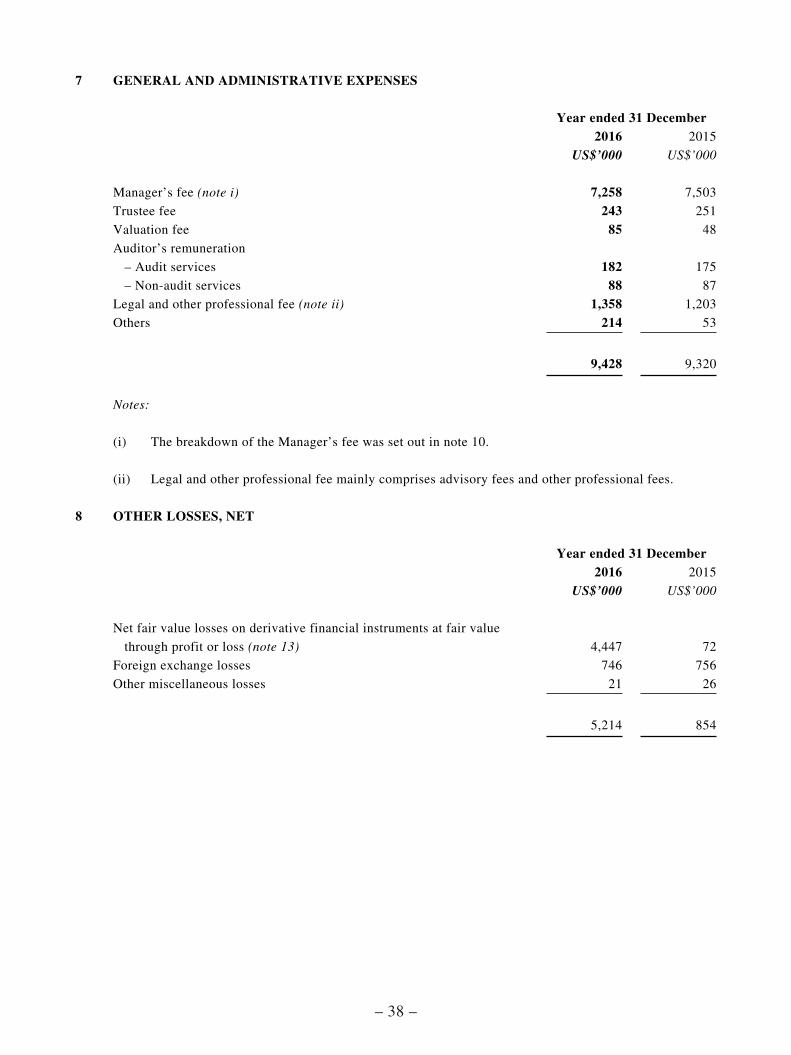
7 GENERAL AND ADMINISTRATIVE EXPENSES
Year ended 31 December2016 2015
US$’000 US$’000
Manager’s fee (note i) 7,258 7,503
Trustee fee 243 251
Valuation fee 85 48
Auditor’s remuneration
– Audit services 182 175
– Non-audit services 88 87
Legal and other professional fee (note ii) 1,358 1,203
Others 214 53
9,428 9,320
Notes:
(i) The breakdown of the Manager’s fee was set out in note 10.
(ii) Legal and other professional fee mainly comprises advisory fees and other professional fees.
8 OTHER LOSSES, NET
Year ended 31 December2016 2015
US$’000 US$’000
Net fair value losses on derivative financial instruments at fair value
through profit or loss (note 13) 4,447 72
Foreign exchange losses 746 756
Other miscellaneous losses 21 26
5,214 854

– 39 –
9 FINANCE COSTS
Year ended 31 December2016 2015
US$’000 US$’000
Interest expenses on bank borrowings (note i) 19,741 23,010
Foreign exchange losses on bank borrowings (note ii) 32,157 21,469
Other incidental borrowing costs (note iii) – 2,358
Total 51,898 46,837
Notes:
(i) Interest expenses on bank borrowings comprised contractual loan interest and amortized loan
arrangement fee, which were recognized using the effective interest rate method.
(ii) Foreign exchange losses on bank borrowings arise upon translating the bank borrowings denominated
in foreign currencies to RMB. The exchange losses on bank borrowings during the year ended 31
December 2015 and 2016, were mainly arisen from the depreciation of RMB against US$.
(iii) Other incidental borrowing costs in 2015 represent derecognition of unamortized loan arrangement
fee. In April 2015, the Group early repaid a bank borrowing, resulting in a derecognition of loan
arrangement fee upon early repayment of bank borrowings of US$2,358,000 during the year ended 31
December 2015.
10 MANAGER’S FEE
Year ended 31 December2016 2015
US$’000 US$’000
Base fee 5,635 5,607
Variable fee 1,623 1,896
7,258 7,503

– 40 –
Pursuant to the Trust Deed, the Manager is entitled to receive remuneration for its services as the manager
of Spring REIT, which is the aggregate of:
(i) Base fee at 0.4% per annum of the value of the Deposited Property (“Base Fee”, as defined in the
Trust Deed).
(ii) Variable fee at 3.0% per annum of the Net Property Income (“Variable Fee”, as defined in the Trust
Deed) (before deduction therefrom of the Base fee and Variable fee).
(iii) Based on the election made by the Manager dated 9 December 2015 in relation to the Manager’s
elections for the Base Fee to be paid to the Manager in the form of cash as to 20% and in the form
of Units as to 80%, and Variable Fee to be paid to the Manager in the form of cash entirely. Such
election is unchanged from the one made for the financial year ended 31 December 2016.
11 EARNINGS PER UNIT
2016 2015
US$’000 US$’000
Profit for the year, before transactions with Unitholders 91,294 40,367
Weighted average number of units for the year for calculating
basic earnings per unit 1,125,241,731 1,114,844,025
Adjustment for units issuable in respect of the Manager’s fee 2,719,873 2,958,587
Weighted average number of units for the year for calculating
diluted earnings per unit 1,127,961,604 1,117,802,612
Basic earnings per unit based upon profit before transactions
with Unitholders US8.11 cents US3.62 cents
Diluted earnings per unit based upon profit before transactions
with Unitholders US8.09 cents US3.61 cents

– 41 –
12 INVESTMENT PROPERTY
For the year ended31 December2016 2015
US$’000 US$’000
At beginning of the year 1,283,552 1,306,583
Additions 1,124 –
Exchange differences recognized in other comprehensive income (88,537) (58,574)
Changes in fair value recognized in consolidated income statement 100,477 35,543
At end of the year 1,296,616 1,283,552
The investment property comprises office towers 1 & 2 and approximately 600 car parking spaces located at
No. 79 and 81 Jianguo Road, Beijing, the PRC. Land use rights have been granted to RCA01 for a 50-year
term expiring on 28 October 2053.
As at 31 December 2016, the Group had no unprovided contractual obligations for future repairs and
maintenance of the investment property.
As at 31 December 2015 and 31 December 2016, the investment property was pledged to secure the Group’s
bank borrowings (note 17).
Valuation process
The Group’s investment property was valued by an independent professionally qualified valuer not
connected to the Group who holds a recognized relevant professional qualification and has recent
experience in the locations and segments of the investment property valued.
The Manager reviewed the valuation performed by the independent valuer for financial reporting purpose.
Discussions of valuation processes and results are held between the Manager and the independent valuer at
least once every six months, in line with the Group’s interim and annual reporting dates. As at 31 December
2016, the fair value of the investment property has been determined by Knight Frank Petty Limited (2015:
Colliers International (Hong Kong) Limited). The independent valuer adopted the income capitalization
approach and cross-checked by the direct comparison approach (2015: income capitalization approach and
discounted cash flow method) for the valuation.

– 42 –
Valuation techniques
The income capitalization approach estimates the values of the properties on an open market basis by capitalizing rental income on a fully leased basis having regard to the current passing rental income from existing tenancies and potential future reversionary income at the market level. In calculating the net rental income, no deduction has been made from the passing rental income which is exclusive of property management fee. In this valuation method, the total rental income is divided into a current passing rental income over the existing lease term (the term income) and a potential future reversionary rental income over the residual land use term (the reversionary income). The term value involves the capitalization of the current passing rental income over the existing lease term. The reversionary value is taken to be current market rental income upon the expiry of the lease over the residual land use rights term and is capitalized on a fully leased basis. It is then discounted back to the date of valuation. In this approach, the independent qualified valuer has considered the term yield and reversionary yield. The term yield is used for capitalization of the current passing rental income as at the date of valuation whilst the reversionary yield is used to convert reversionary rental income.
The direct comparison approach is based on comparing the properties to be valued directly with other comparable properties which recently changed hands.
Fair value hierarchyFair value measurements using
Level 1 Level 2 Level 3US$’000 US$’000 US$’000
Recurring fair value measurements As at 31 December 2016 – – 1,296,616
As at 31 December 2015 – – 1,283,552
There were no transfers between levels 1, 2 and 3 during the year.
Key unobservable inputs used to determine fair values
(a) Capitalization rate
This is estimated based on the market lease over market value on comparable. The higher the capitalization rates used, the lower the fair values of the investment property. In the 31 December 2016 valuation, a capitalization rate of 5.8% (2015: 6.5%) is used in the income capitalization approach.
(b) Base rent
Base rent is the standard rent payable under the lease exclusive of any other charges and reimbursements. This was estimated based on the market lease comparable. The higher the base rent used, the higher the fair values of the investment property. The average gross monthly office unit base rent of RMB405 per square meter exclusive of VAT is used in the valuation. The corresponding amount inclusive of VAT is RMB450 (2015: RMB430) per square meter.
As at 31 December 2016, if the market value of investment property had been 5% higher/lower with all other variables held constant, the carrying value of the Group’s investment property would have been US$64.8 million (2015: US$64.2 million) higher/lower.

– 43 –
13 DERIVATIVE FINANCIAL INSTRUMENTS
As at 31 December2016 2015
US$’000 US$’000
Current
Fair value of the currency option (note i) – 7,117
Fair value of the forward contracts (note ii) 2,670 –
2,670 7,117
Notes:
(i) The Group has entered into a currency option as part of its financial risk management but did not
account for these as accounting hedges under IAS 39. Plain vanilla currency option is used to hedge
the relevant foreign exchange rate risk.
The aggregated notional principal amount of the currency option was US$480 million and matured in
December 2016.
The Group recorded fair value loss on currency option for the year ended 31 December 2016
amounting to US$7,117,000 (2015: fair value gain of US$13,000) (note 8) which were charged to the
consolidated income statement.
(ii) The Group has entered into two 3-month vanilla forward contracts as part of its financial risk
management but did not account for these as accounting hedges under IAS 39. Vanilla forward
contracts are used to hedge the relevant foreign exchange rate risk.
The aggregated notional principal amount of the forward contracts as at 31 December 2016 was
US$240 million (2015: Nil) and were settled in March 2017.
The Group recorded fair value gains on forward contracts for the year ended 31 December 2016
amounting to US$2,670,000 (2015: Nil) (note 8). The gains were credited to the consolidated income
statement.
The maximum exposure to credit risk at the reporting date is the carrying values of the derivative
financial instruments.

– 44 –
14 TRADE AND OTHER RECEIVABLES
As at 31 December2016 2015
US$’000 US$’000
Rent receivables 178 53Deferred rent receivables 1,871 1,000Prepayments 372 402
2,421 1,455
Notes:
(i) Trade and other receivables are mainly denominated in RMB and the carrying amounts of these receivables approximate their fair values.
There are no specific credit terms given to the tenants.
Monthly rentals are payable in advance by tenants in accordance with the leases while daily gross receipts from car parks are received from the car park operators in arrears.
(ii) The Group’s exposure from outstanding rent receivables is generally fully covered by the rental deposits from the corresponding tenants (note 16).
(iii) As at 31 December 2016 and 2015, the Group’s rent receivables and all future rent receivables were pledged to secure the Group’s bank borrowings (note 17).
15 RESTRICTED BANK BALANCES AND CASH AND CASH EQUIVALENTS
As at 31 December2016 2015
US$’000 US$’000
Restricted bank balances 50,631 54,208Cash and cash equivalents 28,825 30,857
79,456 85,065
Cash and cash equivalents and restricted bank balances are denominated in the following currencies:
As at 31 December2016 2015
US$’000 US$’000
US$ 49,873 51,153RMB 28,103 32,644HK$ 1,480 1,268
79,456 85,065

– 45 –
Restricted bank balances are related to bank accounts restricted under the bank borrowing facility
agreements and were charged to the facility agent, The Australia and New Zealand Banking Group Limited,
of the Group’s bank borrowings (note 17). Prior consent from facility agent must be obtained before transfer
and withdrawal of funds in the restricted bank accounts.
The conversion of RMB denominated balances into foreign currencies and the remittance of such foreign
currencies denominated bank balances and cash out of the PRC are subject to relevant rules and regulations
of foreign exchange control promulgated by the PRC government. Included in the unrestricted bank
balances, there is an amount of US$6,000 which is denominated in RMB as at 31 December 2016 (2015:
US$ 1,000).
16 RENTAL DEPOSITS AND TRADE AND OTHER PAYABLES
As at 31 December2016 2015
US$’000 US$’000
Rental deposits (note i) 20,640 22,406
Trade and other payables:Rental receipts in advance 7,676 6,870
Provision for withholding tax – 698
Provision for other taxes (note ii) 15 391
VAT payable 21 –
Accrued expenses and other payables 5,630 5,299
13,342 13,258
Notes:
(i) Rental deposits are classified as current liabilities on the basis that it is expected to be realized in the
Group’s normal rental business operating cycle. The ageing analysis is as follows:
As at 31 December2016 2015
US$’000 US$’000
Within 1 year 5,204 9,603
Over 1 year 15,436 12,803
20,640 22,406
(ii) Provision for other taxes represents provision for business tax, urban construction and maintenance
tax, education surcharge and stamp duty.
The carrying amounts of rental deposits and trade and other payables approximate their fair values and
mainly denominated in RMB.

– 46 –
17 INTEREST-BEARING BORROWINGS
As at 31 December2016 2015
US$’000 US$’000
Non-currentBank borrowings 480,499 477,301
The exposure of the Group’s borrowings to interest rate changes and the contractual re-pricing dates at the
end of the reporting year are as follows:
As at 31 December2016 2015
US$’000 US$’000
6 months or less 480,499 477,301
The carrying amounts of bank borrowings approximate their fair value, as the borrowings were at floating
interest rate.
The Group’s bank borrowings are denominated in US$.
Notes:
(i) The term loan facility will be repayable in full on 29 April 2020. The borrowing bears interest of
2.75% above 3-month LIBOR. The Group had also entered into a US$20 million uncommitted
revolving facility, which is to be used to facilitate the general working capital needs of the Group
in the future. Both the term loan facility and uncommitted revolving facility are guaranteed by the
Trustee. The Group’s subsidiary’s shares were pledged to secure the Group’s term loan facility and
uncommitted revolving facility.
(ii) As at 31 December 2016 and 31 December 2015, the Group’s investment property (note 12),
derivative financial instruments (note 13), rent receivables and all future rent receivables (note 14),
restricted bank accounts (note 15) and subsidiary of the Group’s share were pledged to secure the
Group’s term loan facility.
18 UNITS IN ISSUE
Number of units
Balance as at 31 December 2015 1,120,158,306
New units issued for Manager’s fee 10,404,634
Balance as at 31 December 2016 1,130,562,940
Traded market value of the units as of 31 December 2016 was HK$3.22 per unit. Based on 1,130,562,940
units, the market capitalization was US$469.37 million.

– 47 –
19 NOTES TO STATEMENTS OF CASH FLOWS
Cash generated from operating activities
Year ended 31 December2016 2015
US$’000 US$’000
Profit for the year, before transactions with Unitholders 91,294 40,367
Fair value gain of investment property (100,477) (35,543)
Net fair value losses on derivative financial instruments 4,447 72
Manager’s fee expenses in units in lieu of cash 4,462 4,861
Interest income (519) (559)
Finance costs on interest-bearing borrowings 51,898 46,837
Foreign exchange losses 746 756
Increase in trade and other receivables (1,058) (703)
Decrease in rental deposits (310) (135)
Increase in trade and other payables 400 94
50,883 56,047
Material non-cash movements:
(i) For the year ended 31 December 2015, the unamortized loan arrangement fee upon early termination
of the previous term loan was US$2,358,000 as disclosed in note 9.
(ii) For the year ended 31 December 2016, the Manager’s fee amounting US$4,462,000 (2015:
US$4,861,000) was settled by issuance of new units.
20 FUTURE MINIMUM RENTAL RECEIVABLES
As at 31 December 2016, the analysis of the Group’s aggregate future minimum rental receivable under
non-cancellable leases is as follows:
As at 31 December2016 2015
US$’000 US$’000
Within 1 year 67,519 59,452
After 1 year, but within 5 years 120,201 47,616
After 5 years 3,901 204
191,621 107,272
Note: Most of the operating leases are on fixed terms and of terms of 3 years (2015: 3 years).

– 48 –
21 SUBSIDIARY
Name
Place of establishment and kind of legal entity/place of operations Principal activities
Particulars ofissued share capital Interest held
Directly held:
RCA01 Cayman Islands,
limited liability
Property investment 1,000 of
US$1 each
100%
22 CAPITAL COMMITMENT
Year ended 31 December2016 2015
US$’000 US$’000
Capital commitments in respect of the investment property
Contracted but not provided for – 726
23 EVENT AFTER THE REPORTING PERIOD
On 17 March 2017, the Manager, in its capacity as the manager of Spring REIT, has entered into sales and
purchase agreement with an independent third party seller to acquire the entire issued share capital of a
company that owns 84 separate commercial properties located in the United Kingdom leased to chained car
servicing operator, an associated company of the Manager.
24 APPROVAL OF THE CONSOLIDATED FINANCIAL STATEMENTS
The consolidated financial statements were authorized for issue by the Manager on 22 March 2017.