Embed Size (px)
Citation preview

The Seasonal Maxima of Ceratium trip os with Particular Reference to a . Major New York Bight Bloom
JUNE 1978

The Seasonal Maxima of Ceratiurn tripos
with Particular Reference to a Major New York Bight Bloom
by
John B. Mahoney
Sandy Hook Laboratory Northeast Fisheries Center
National Marine Fisheries Service National Oceanic and Atmospheric Administration
U. S. Department of Commerce
Highlands, N. J.
Technical Series Report No. 16
June 1978

1 1 1 1 1 1 1 1 1 1 1 1 1 1 1 1 1 1 1 1 1 1 1 1 1 1 1 1 1 1 1 1 1 1 1 1 1 1 1 1 1 1 1 1 1 1 1

CONTENTS
PAGE
1. INTRODUCTION
1.1 Impact of the New York Bight Ceratiurn tripos Bloom............ 1
1. 2 Goal of Present Review........................................ 1
2. CERATIUM BACKGROUND INFORMATION
2.1 Characterization of Dinoflagellates........................... 1
2.2 Cerati urn Profile.. . . . . • • . • • • . • • • •• • • • . • • • •• . • • • • . . • • • • • • • • • • . . 3
3. OCCURRENCE IN THE OCEANS
3.1 Horizontal Distribution....................................... 5
3.2 Vertical Distribution......................................... 5
3.3 Ceratiurn Abundance..... ••••••. •••.• .••• ••.•••••.• ••.• •.• .•• •.• 5
3.4 Season and Duration of·Cer~ti~.tripo$ Maxima................. 6
4. INFLUENCE OF VARIOUS FAcroRS ON CERATIUM ABUNDANCE
4.1 Salinity ••.•.•.•..•....••••••..•..••.••••••••••.....••••.•..•.
4.2 Temperature •••••.•......•..........••••••••.••..•••••..••.••••
4.3 Light ..•••.....••...•....••....•.....•..•.••••.•.••••.....•..•
4.4 Nutrition .•••..••.•....••.•.•.••...••••••.•••.•••••••••.••••••
4.5 Grazing Effects .••..•••••..•.••••••••••••••..••••••.•••.•.••.•
5. ANNUAL PHYTOPLANKTON CYCLE IN ATLANTIC COAST LOCALES
5.1 Chesapeake Bay •.•.•••••••.•.•••••••••.••••..••••...•••.•.•••.•
5.2 Shelf Waters off Chesapeake Bay .............................. .
5. 3 New York Bight •.•....•..•..•••••.•.•..•.••.•••••.•.••••...•..•
5.4 Lcng Island Sound ••••.•..•••..•••.•.••.••.••••.....•.••••..•.•
iii
6
6
11
11
13
13
13
14
14

PAGE
5.5 Narragansett Bay •••••••••••••••••••••••••••••••••••••••••••••• 14
5.6 Gulf of Maine ••.•••• -••••••••••.••..•..••••••••.••••••••.••••.• 16
5.7 Basic Cycle and Exceptions ...•.•...•. e-a." • ••••••••••••••••••••• 16
5.8 1976 Ceratium Bloom in New York Bight ••••••••••••••••••••••••• 16
6. DISCUSSION
6.1 Bloom Development and Ceratium tripos Physiology •••••••••••••• 17
6.2 Speculation Regarding the Development of the 1976 New York Bight Ce~atium tripos Bloom •••••••••••••••••••••••••••••• 18
ACmO'WI"EDGMEN'rS. • • • • • • • • • • • • • • • • • • • • • • • • • • • • • • • • • • • • • • • • • • • • • • • • • • • 22
REFERENCES.. •• ••••• ••••• •••••• ••• ••••••••••• ••• ••• • • •••••••• •••• ••• 23
iv

FIGURES
Figure 1. Approximate maximum distribution of bottom water oxygen depletion in the New York Bight in September, 1976 ••••••••••••• 2
Figure 2. Ceratium tripos in bloom aggregate ••••••••••••••••••••••••••••• 4
Figure 3. Ceratium spp. division rates at various salinities ••••••••••••. 8
Figure 4. Ceratium spp. division rates at various temperatures ••••••••••• 9
Figure 5. Ceratium spp. division rates at various light intensities •••••• 10
v
TABLES PAGE
Table 1. Season and approximate duration of Ceratium tripos maxima in various locales............................................. 7
Table 2. C. tripos seasonal·abundance in coastal waters off Otesapeake Bay ••••••••••••••••••••••••••••••••••••••••••••••••• 15
vi

1. INTRODUCTION
1.1 Impact of New York Bight Ceratium tripos Bloom
Bottom water oxygen deficiency was apparently responsible for a catastrophic kill of marine animals off the New Jersey coast during the summer of 1976. Although the exact causes of this phenomenon are not certain, investigation has indicated that the decline and decomposition of an immense bloom of the dinoflagellate Ceratium tripos contributed to the oxygen depletion (Malone, 1977a). An estimated area of over 14,000 km2 was affected by the oxygen depletion (Figure 1); lethal levels of hydrogen sulfide were produced in part of the area (Steimle, 1976). Mortalities occurred among finfish and invertebrates; of especial economic significance was the mortality of the surf clam, Spisula solidissima.
1.2 Goal of Present Review
If the Cerati.um bloom in fact had a major role in the oxygen depletion, this i~ the first documented instance of a mass mortality of marine animals associated with a bloom of £. tripos, an apparently nontoxic species. Although mass mortalities in the sea are more frequently caused by blooms of poisonous dinoflagellates, catastrophes due to a lack of oxygen, brought about by the decay of phytoplankton populations, also occasionally occur in coastal waters (Brongersma-Sanders, 1957). The unusual nature and ecological importance of the 1976 event warrants the examination of available information on the biOlOgy of £. tripos, particularly on this species' seasonal maxima or blooms.
2. CERATIUM BACKGROUND INFORMATION
2.1 Characterization of Dinoflagellates
The dinoflagellates are a type of microscopic unicellular (acellular) motile algae. Dinoflagellates are next in importance to the diatoms as a constituent of the phytoplankton of the oceans. They are frequently present in a localized superabundance known as a phytoplankton bloom or "red tide". Collectively, with some other flagellated groups such as Chrysophytes, Cryptophytes and Euglenophytes, they are termed phytoflagellates. That is, they are flagellated in at least some stage of their life cycle and the majority possess chromatophores containing chlorophyll. The usual method of reproduction is by binary fission. Dinoflagellates characteristically have as structural features a "girdle" and a "sulcus".
-1-

NEW JERSEY
.... ", .....
73°
KILOMETERS
o 20 40
I I . I - - -- --I I
o 10 20
NAUTICAL MILES
72°
Figure 1. Approximate maximum distribution of bottom water oxygen depletion in the New York Bight in September, 1976.
-2-
4
39°

The girdle is a groove encircling the cell. The sulcus is another groove usually more or less perpendicular to the girdle. The two flagella, which provide motility, originate from the sulcus. The girdle by convention delimits anterior and posterior regions of the cell, designated by the prefixes epi- and hypo-, respectively. The cells are either naked (unarmored) or, as in Ceratium, possess a cellulose plate armor or theca. In £. tripos (Figure 2) the epitheca is drawn out into a long, slightly tilted, apical horn; the hypothec a has two antapical horns which curve to more or less parallel the apical horn. A more thorough description of the Ceratium is available in Wood (1965).
2.2 Ceratium Profile
The genus Ceratium consists of a large number of species, many of which are very common and widespread; they constitute a characteristic and often dominant part of the plankton (Graham and Bronikovsky, 1944). On the basis of their distribution, Graham (1941) classified Ceratium species as either tropical, subpolar or cosmopolitan. Most Ceratium spp. are tropical in distribution (Steemann Nielsen, 1934; Graham, 1941; Nordli, 1957). £. tripos is a cosmopolitan species found from the equator to temperate and cold regions. Graham and Bronikovsky (1944) divided C. tripos, which they regarded the most complex and variable Ceratium species, into two subspecies: atlanticum and semipulchellum; these, in turn, they considered to be composed of a large number of varieties or races. Whether £. tripos variants are physiological races or phenotypes is undetermined (Smayda, 1976).
£. tripos is a large dinoflagellate. In volume it ranges from 100,000 to 1,000,000 cubic microns (u3) (Malone, 1977a). For comparison, the volumes of two dinoflagellates which bloom in Lower New York Bay average 2,500 u 3 for Prorocentrum minimum and 190 u3 for Massartia rotundata (=Katodinium rotundatum) (Campbell, 1973). £. tripos is a slow growing species (0.33 divisions/day maximum; Nordli, 1957), slower than Prorocentrum micans (0.4 divisions/day; Kain and Fogg, 1960) which occasionally blooms along the New Jersey shore, and much slower than Skeletonema costatum (1.8 divisions/day; Parsons et al., 1961), the most important diatom in Lower New York Bay.
-3-

Figure 20 Ceratiurn tripos in bloom aggregate o

3. OCCURRENCE IN THE OCEANS
3.1 Horizontal Distribution
Graham and Bronikovsky (1944) found .the ~. tripos subspecies to have different distributions. In the Atlantic and Pacific oceans, subspecies atlanticurn is primarily found in colder waters although it is sometimes found in the tropics. It was observed in a great range of environmental conditions: temperature,6.1 to 28.2°C; salinity, 31.7 to 36.4 0/00; pH, 7.80 to 8.37; phosphate, 2.0 to 181.0 mg P04/m3 • Subspecies semipulchellurn is a slightly tolerant tropical formprimaril-y--limited to tropical waters in the Atlantic and Pacific. The range of environmental conditions it was found in are: tempperature, 11.4 to 29.4°C; salinity, 31.6 to 36.6 0/00; pH, 7.76 to 8.47; phosphate, 2.0 to 198.0 mg P04/m3. Steemann Nielsen (1934) classes~. tripos atlanticurn along with C. fusus as neritic species since he found them more numerous Tn neritic regions of the pacific Ocean than in the open ocean. However, Bigelow (1926) found that in the Gulf of Maine, the central region was the chief area of multiplication of ~. tripos rather than immediately along the coast.
3.2 Vertical Distribution
Various collections have found certain species of Ceratium most abundant at depth, e.g. 100 m (Graham and Bronikovsky, 1944). These have been termed "shade species ll
• These authors characterize both C. tripos subspecies as surface forms. Although both were present throughout the upper 100 m, atlanticum was found most abundant at 50 m.
3.3 Ceratiurn Abundance
Ceratium spp. are generally less numerous than other dinoflagellates and the diatoms (Nordli, 1957). Although species of Ceratium may at times be a dominant component of the Gulf of Maine phytoplankton, Bigelow et al. (1940) found that the major fluctuations in phytoplankton abundaJnce are due chiefly to seasonal changes in the abundance of diatoms, with dinoflagellates and other groups playing only a secondary role. In terms of relative biomass, Bigelow (1926) regarded 50 cc per plankton net tow as an abundant catch of Ceratium whereas he regularly found ten times this volume of diatoms during their blooms. There have been instances, however, when ceratium spp. were numerous enough to produce red water. In June-September 1966, a bloom chiefly of C. macroceros, and C. tripos (Mandelli et al., 1970; Mahoney, unpublished data)
-5-
occurred in the New York Bight apex. This bloom was dwarfed by the 1976 New York Bight episode. Bigelow (1926) found a bloom patch of Ceratium several miles wide in the Gulf of Maine. Nordli (1953) reported that Ceratium spp., including £. tripos, occasionally cause red water in Norwegian waters. Ceratium spp., including C. furca and C. dens, have dominated blooms off southern california (Eppley and Harrison, 1975).
3.4 Season and Duration of Ceratium tripos Maxima
Instances of C. tripos seasonal maxima are compiled in Table 1. Clearly, this species blooms frequently in the summer and fall. However, there are instances of late winter/spring maxima. It is also noteworthy that the time span of many of the maxima extends over several months.
4. INFLUENCE OF VARIOUS FACTORS ON CERATIUM ABUNDANCE
4.1 Salinity
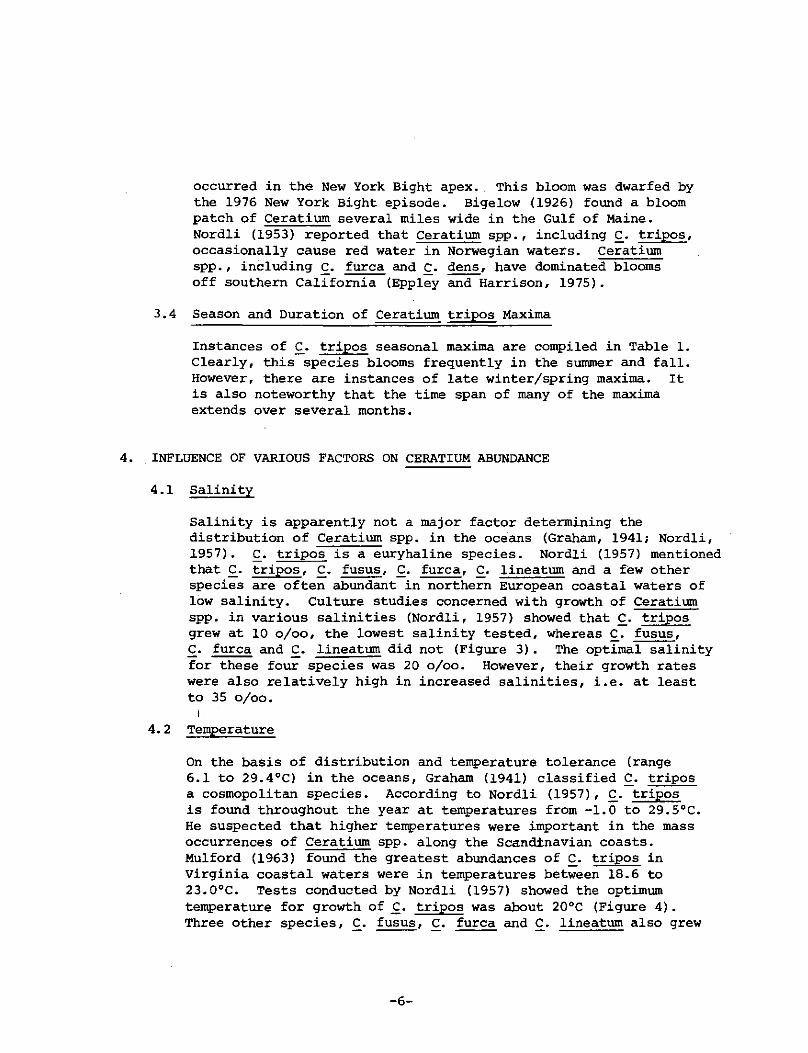
Salinity is apparently not a major factor determining the distribution of Ceratium spp. in the oceans (Graham, 1941; Nordli, 1957). £. tripos is a euryhaline species. Nordli (1957) mentioned that £. tripos, £. fusus, £. furca, £. lineatum and a few other species are often abundant in northern European coastal waters of low salinity. Culture studies concerned with growth of Ceratium spp. in various salinities (Nordli, 1957) showed that £. tripos grew at 10 0/00, the lowest salinity tested, whereas £. fusus, £. furca and £. lineatum did not (Figure 3). The optimal salinity for these four species was 20 0/00. However, their growth rates were also relatiVely high in increased salinities, i.e. at least to 35 0/00.
I
4.2 Temperature
On the basis of distribution and temperature tolerance (range 6.1 to 29.4°C) in the oceans, Graham (1941) classified £. tripos a cosmopolitan species. According to Nordli (1957), £. tripos is found throughout the year at temperatures from -1.0 to 29.S o C. He suspected that higher temperatures were important in the mass occurrences of Ceratium spp. along the Scandinavian coasts. Mulford (1963) found the greatest abundances of £. tripos in Virginia coastal waters were in temperatures between 18.6 to 23.0o C. Tests conducted by Nordli (1957) showed the optimum temperature for growth of £. tripos was about 20°C (Figure 4). Three other species, £. fusus, C. furca and £. lineatum also grew
-6-

TABLE 1. Season and approximate duration of -Ce'ratium tripos maxima in various locales 0
Year
1912
1912
1914 to
1921
1922
1923
1954
1960
1963
1966
Month
March-June
June
October to
March
October-November
September
March
Late May Early June
November
June-August
Location
Skagerrak
Scottish coast to near Norway
Gulf of Maine
Woods Hole, Massachusetts
Woods Hole, Massachusetts
Florida west coast
Lower Chesapeake Bay
Off Chesapeake Bay to III km.
ooastal waters south of Long Island, New York
1966 September Coastal waters south of Long Island, New York
N.A. Autllllln Kieler Bucht
N.A. Late summer-autumn Danish waters
N.A. June-August Irish Sea
N. A. July-August Bay of Fundy
N.A. Summer Oslo Fjord
N.A. August-December North Sea & Baltic
N.A. Late summer-autumn Danish waters
N.A. - Not available * - In Nordli (1957)
** - In Rayment (1963)
-7-
Reference
Gran
Gran
Bigelow
Fish
Fish
Curl
Mulford
Mulford &
Norcross
Mandelli et al.
Mahoney
APstein
Ostenfield
Johnston, Scott & Chadwick
Gran & Braarud
Nordli
NOrdli
Nordli
1915*
1915*
1926
1925
1925
1959
1963
1971
1970
unpublished
1910*
1913*
1924**
1935
1953
1957
1957
0.5
0.4
0.3
0.2
0.1
10 15 20 25 30
/). ce.Ju:tU.um bUpo.6 & c e.Ju:tU.um ft U.6 U.6 o Ce.Ju:tU.um ftWtc.a • Ce.Ju:tU.um Ul1eiUum
35 40 0/00 S
Figure 3 g Ceratium sppo division rates at various salinities (from Nord1i, 1957)0
-8-

0.4
0.3
0.2
0.1
!::.. CVta-ti.um :.tJUpO~ • • CVta-ti.um nu.6u.6
A~ • o CVta-ti.um nUllea • CVta-ti.um Uneatum
II II
0
5 10 15 20 25 ·C
Figure 40 Ceratium sppo division rates at vario.us temperatures (from Nord1i, 1957).
-9-

0.5
0.4
0.3
0.2
0.1
• ----A
o
625 1250 2500 5000 10000 Lux
Figure 50 Ceratium sppo division rates at various light intensities (from Nord1i, 1957)0
-10-

best in the range lS.0-20.0°C. However, judging from Nordli's graphs, the £. tripos growth rate increase from the level at S.ooC to that at 20.0°C was small (roughly from 0.23 to 0.28 divisions/day) whereas the other species showed a strong growth/temperature dependence. The optimum temperature for growth of the freshwater species, Ceratium hirundinella, was 2l.0oC but 25.0°C was also favorable; cell division was sharply decreased at l5.0°C and was absent at or below 10.OoC (Bruno and McLaughlin, 1977).
4.3 Light
The pattern of £. tripos growth at various light intensities (Nordli, 1957) shows growth was minimal (approximately 0.03 divisions/day) at the lowest light intensity employed (SOO lux); growth was best at 5,000 lux and slightly less at 10,000 lux (Figure 5). Estimating from Nordli's curve, it appears that growth more than tripled (increasing from 0.02 to 0.11 divisions/ day) with a light intensity increase from 500 to 1,000 lux whereas growth only doubled (increasing from 0.11 to 0.22 divisions/day) with an increase from 1,000 to 5,000 lux. Growth of £. lineatum was also best at 5,000 lux but 2,500 lux was optimal for C. furca and C. fusus. Nordli (19S7) found a discrepancy -between his findings and the situation in the environment. In the laboratory, £. furca would not grow at 10,000 lux but in the sea it is sometimes found abundant in the surface waters where intensitites may exceed 50,000 lux. He attributed the discrepancy to the use of continuous illumination in his tests which is less favorable than a diurnal regime. Therefore, the optimum light.-level, or at least the upper tolerance level may be higher in the environment. Grown in culture in a 18:6 light: dark cycle, Ceratium hirundirtella had an optimum light intensity of about 8,800 lux (Bruno and McLaughlin, 1977).
4.4 Nutrition
The studies of Graham and Bronikovsky (1944) indicated that phosphorus concentration has no direct effect on the horizontal distribution of Ceratium species. They did find that the relative phosphorus values in a given region bear some relation to the Ceratium flora but suggested that some factor associated with an increase in phosphorus was significant rather than the phosphorus itself. The Ceratium spp. apparently de not make a major demand on available phosphorus even during their seasonal maxima. Several studies (cited in Nordli, 1957) demonstrated that the phosphate content of the North Sea and Baltic increases during
-11-
the period when Ceratium spp. form a substantial part of the phytoplankton. Peters (1934) suggested that high concentrations of phosphorus might inhibit Ceratium spp. Nordli (1957) could not support this because various North Sea and Baltic studies showed that the typical complement of Ceratium species in these waters varies very little and seems to be independent of phosphorus concentration.
There is a lack of published information on the nutrition of £. tripes which is probably due to the difficulty of culturing this genus. Nordli (1957) carried out nutrient tests just on Ceratium furca. This species alone, of the several ceratium spp. he cultured, grew well enough in his oceanic water basal medium (relatively nutrient-sparse) to provide reliable results. Nordli routinely used inshore (Drobak Sound) water in his Miquel and Erdschreiber culture media. Supplements of Nand P did not affect the division rate of C. furca. Soil extract or a substitute was necessary to make ocean water suitable for culturing this species; fjord water and coastal water, to a lesser degree, contained substances which partially permitted the omission of soil extract. £. tripes, £. fusus and £. lineatum grew erratically but at time well in the ocean water/soil extract media.
Toriumi (1968) tested the effects on culture growth of three Ceratium species, £. bucephalum, £. massiliense and £. gibberum, of varied additions of chelator (ethylenedinitrilo tetracetic acid disodium salt, EDTA), vitamin B12, soil extract, Tris (2-amino-2-hydroxymethyl-l, 3 propanediol) buffer and a growth factor mix containing thiamine, nicotinic acid, P-aminobenzoic acid and inositol, in natural sea water with Nand P added. The best growth medium contained all ingredients save soil extract. Toriumi believed that additions of vitamin B12 plus EDTA promoted better growth than soil extract. Bruno and McLaughlin (1977) studied the nutrition of the fresh water species, C. hirundinella. This species utilized both inorganic and o;ganic Nand P compounds.' Nitrate was the best N source; urea was next best, then ammonium. Although to a lesser extent, 10 of a group of 11 amino acids were also used. Unless the P concentration exceeded ca. 0.032 ug-at/l, growth was poor. Organic P compounds were more stimulatory than the inorganic. Best growth with a mixture of Fe, Zn, B, Mn, and Co was achieved with concentrations of these metals higher than normally present in the environment but common in phytoplankton media. Increased additions of Fe and Me further improved growth. Vitamin B12, but not thiamine or biotin was required.
Some evidence, reviewed by Smayda (1976), suggests that Ceratium spp. may be capable of phagotrophy. Phagotrophy' does not' appear to have been a major factor in the early development of the 1976 New York Bight C. tripos bloom, but it possibly had a role in the nutrition of cell concentrations below the euphotic zone (Malone, 1977a).
-12-

4.5 Grazing Effects
Most of the pertinent available information suggests that Ceratium spp. are not heavily grazed upon. According to Marshall and Orr (1955) Ceratium spp. are rarely found in the gut of Calanus although they are often common in the plankton. Since other large and irregularly shaped organisms can be broken up and ingested these investigators concluded that Cal anus must avoid this genus. The marine cladoceran, Evadne nordmanni, grazes on Ceratium furca but not on other Ceratium species (Bainbridge, 1958). The copepods Arcartia tonsa and~. clausi both utilize Ceratium lineatum, but A. tonsa to a greater degree than ~. clausi (Conover, R.,-1956). Elbrachter (1973) has observed a ciliate protozoan feeding on several Ceratium spp. and a copepod species feeding on £. tripes, by utilizing the cytoplasm but leaving the theca intact. In addition, he observed an isopod species feeding on recently divided Ceratium spp. and calculated that up to 30 percent of these cells can be grazed in a night.
5. ANNUAL PHYTOPLANKTON CYCLE IN ATLANTIC COAST LOCALES
5.1 Chesapeake Bay
In Chesapeake Bay, Patten et al. (1963) found the phytoplankton in December, but:' especially in January and February, dominated by diatoms. The population was predominantly of Skeletonema costatum and Chaetbceros affinis (cbmpreSsus). Diversity went from a moderate level during this period to highest levels during the spring period, March through May. There was a changeover during the spring from a predominantly diatomaceous to a predominantly flagellate plankton. Flagellates continued more important than diatoms during June and July. There was a shift to diatoms in August and September. Flagellates then dominated for the rest of the year. According to Mulford (1963), in the estuary during 1960, £. tripes was most abundant from late May to early June and had sporadic occurrence for the rest of the year.
5.2 Shelf waters bff Chesapeake Bay
Mulford (1963) found £. tripes year-round in waters off Chesapeake Bay between March 1961 and March 1962. At the start of their 1963/1964 study off Chesapeake Bay, Uulford and Nbrcross (1971) found the June-August phytoplankton dominated by Ceratium spp.; there were minor seasonal changes in diatoms during this period. In August, general phytoplankton abundance was low, Ceratium numbers were drastically reduced. The major change in September was a pulse of diatoms close to shore. General phytoplankton abundance was lowest in October. A diatom pulse occurred in November. Data
-13-

were not available for the next three months. The March-May period was the most productive season of 1964 with a dinoflagellate maximum dominated by Ceratium sPp.; the usual spring diatom flowering was diminished. The C. tripos counts obtained in this study are provided in Table 2.
5.3 New York Bight
Mandelli et al. (1970) found diatoms dominant in February and March 1966, in waters off Long Beach and Jones Beach, Long Island, New York. Dinoflagellates dominated the phytoplankton from April through August and C. tripos was the most abundant dinoflagellate during June; July and August. Diatoms and' dinoflagellates alternated in abundance during early fall. Malone (1977b) reported that C. longipes was the dominant net phytoplankter at a station approxi;ately in the middle of the New York Bight apex in May 1974. Malone (1977b) characterizes the phytoplankton cycle in the Bight apex as being dominated by the chlorophyte Nannochloris atomus in summer and by the diatom Skeletonema costatum in late spring and summer. Further offshore, there are winter maxima of diatoms, primarily ~. costatum, Thalassionema nitzschoides and Asterionella japonica; chlorophytes are rarely abundant.
5.4 Long Island Sound
COnover, S. (1956) followed the seasonal cycle of phytoplankton in Long Island Sound for two years. In the winter, the phytoplankton, chiefly centric diatoms, began an increase in midDecember or early January. After three weeks of rapid increase, the annual flowerings climaxed, in early March 1953 and midFebruary 1954, after which decline was rapid. Small oscillations in abundance, primarily of dinoflagellates, occurred during the warmer months. A fall flowering occurred in one of the years. The annual minimum occurred sometime in the fall. Conover noted differences between the phytoplankton of the spring and summer of the two years ,of the study. centric diatoms were much more abundant in the spring and early summer of 1952 than in 1953; the phytoplankton population peaks were due to diatoms. In 1953, the dinoflagellates were much more important in the spring and summer compared to tite previous year.
5.5 Narragansett Bay
According to Pratt (1959) and Smayda (1957), in Narragansett Bay, a diatom flowering persists from about January to May; flagellate numbers reach their lowest in January or February then slowly increase. In late spring, diatoms decline rapidly while flagellates are increasing to their early summer maximum and dominance. usually, at the end of the summer, diatoms regain dominance in one or more brief, intense blooms. The diatom abundance falls to a minimum in late autumn.
-14-

TABLE 2. c. tripos seasonal abundance in coastal waters off Chesapeake Bay (cell/I) • Stations normal to shore at distances of 37, 74 and III km, respectively (from Mulford and Norcross, 1971).
Season June 1973 July 1963 August 1963
Sta. II IV VI II IV VI II IV VI Depth(m)
5 0 2 405 3 16 27 0 0 0
8 89 2 59 131 77 5 0 0
15 119 5 1842 168 453 20 15 0 0
30 1881 2366 431 958 45 205
45 359 0
Season September 1963 October 1963 November 1963
Sta. II IV VI II IV VI II IV VI Depth(m)
5 0 1 0 0 0 0 24 229 10
8 2 0 5 0 0 56 16 39 65
15 2 14 0 0 0 0 28 65 63
30 0 8 0 0 76 67
45 0 0 19
Season March 1964 April 1964 May 1964
Sta. II IV VI II IV VI II IV VI Depth(m)
5 2 19 37 7· 5 49 3 5 210
8 12 16 80 50 92 35 158 140
15 2 27 82 5 113 264 45 30 210
30 0 27 5 28 98
45 25 27 0
-15-

5.6 Gulf of Maine
Seasonal variation in abundance of ~. tripos was extensively studied in the Gulf of Maine where this species is a prominant member of the phytoplankton. According to Bigelow (1926), the phytoplankton falls to its lowest abundance in late February or the first few days of March. Starting soon thereafter, diatoms flourish until an abrupt decline in May. Dinoflagellates are present in low abundance during the spring diatom blooms. As the diatoms decline, dinoflagellates, especially Ceratium SPPOI increase o
C. longipes is dominant through June as dinoflagellates become increasingly important. During July, C. tripos multiplies in . the central regions; during the summer-the population expands coastwise until it finally reaches dominance throughout the Gulf in October; it retains this dominance throughout the winter. Gran and Braarud (1935) confirmed Bigelow's scheme of Ceratiumseasonal variation. These authors also stated that the Ceratium minimum in spring, followed by a gradual increase toward a maximum in late summer or autumn was similar to that found in north European waters.
5.7 Basic Cycle and Exceptions
In summary, phytoplankton studies in locales between Chesapeake Bay and the Gulf of Maine reveal a regular pattern of phytoplankton succession and abundance. The basic cycle may be described as a winter scarcity followed by intense spring diatom blooms which die off in late spring to be succeeded, in turn, by usually less intense flagellate maxima in late spring. and summer. Diatoms may also be important during this season, however, Diatoms or dinOflagellates may alternately dominate the autumn phytoplankton which tends to become increasingly less abundant as the season progresses. There have been instances when early spring dinofl~gellate blooms occurred in conjunction with decreased diatom maxima (Mulford and Norcross, 1971) or, apparently, along with the usual diatom blooms (i.e. the 1976 spring Ceratium bloom, Malone, 1977a) •
5.8 1976 Ceratium Bloom in New York Bight
Malone (1977a) has compiled the available information on the history of the 1976 New York Bight ~. tripos bloom. The exact temporal origin of the bloom has not been determined. In January I a Hardy Continuous Plankton Recorder collection, made at 10 rn depth across the Bight from the apex to the continental slope, contained a widespread representation of c. tripos, in values,
-16-
mostly ranging between approximately 1,000 and 3,000 cells per liter (Smith and Marrero, in Malone, 1977a). In the Bight apex, an abundant~. tripos population was present in early February but did not increase much during this month. The mean cell density in the apex in early March was 5,800 cells per liter. A conservative estimate of the bloom's areal distribution in the Bight in March is 9,900 km2• Growth at a mean rate of 0.05-0.06 divisions/day began in March and probably continued through May. In the outer Bight, cell densities increased from a mean level of 10,000 cells per liter at the end of March to a mean level of 240,000 cells per liter in mid-June. The bloom apparently peaked in Mayor June, depending on the locale, and subsequently declined.
According to Malone (1977a), during the early phase of bloom, i.e. in March, verticill dis.tributiorr was near uniform in the upper 30-40 m; maximum cell densities were off-shore, mid-shelf to shelf-break, although the bloom was present throughout the Bight. During the next three months, forces of stratification and possibly onshore movement of water served to concentrate the population in a thin (1-3 m) layer below the thermocline and shift the area of maximum intensity to inshore. By May and June the~. tripos layer was found at depths of 20 to 35 m and was associated with 10-13°C isotherms and 0.1 to 10% light depths. Malone '(1977a) did not believe~. tripos had replaced any of the· usual diatom and nanoplankton populations since distribution and abundance of these was similar to that observed -in previous years.
6. DISCUSSION
6.1 Bloom Development and Ceratium tripos Physiology
~. tripos is sufficiently euryhaline to preclude significant change in growth due to salinity fluctuations in the usual ocean range. Since~. tripos growth is·apparently not greatly changed between 5.0 and 20.0 oC (Nordli, 1957), it is probable, as Smayda (1976) has suggested, that water temperature was not a major factor in the development of the 1976 New York Bight bloom. In Nordli's study, light intensities between 500 and 1,000 lux stimulated the greatest growth of ~. tripos per unit of light. Potential growth at these intensities might have been greater than the level observed because the continuous illumination used in the experiments was not as favorable as diurnal illumination. This suggests that this species is well adapted for efficient utilization of low light intensities. In fact, during the 1976 New York Bight bloom, Malone (1977a)
-17-
reported a growth rate of 0.02 divisions/day at the 1% light depth. Therefore, light probably was not a limiting factor in the development of the bloom.
Superabundance of nutrients was not likely a prerequisite for bloom initiation. As already mentioned, Graham and Bronikovsky (1944) found no dependence of Ceratium distribution on phosphorus supply. Mulford and Norcross (1971) suspected that the Ceratium blooms they observed in offshore Virginia waters were related to low nutrient levels resulting from decreased land runoff. Mandel Ii et al. (1970) suggested that a May-August dominance by Ceratium spp., including C. eripos, observed in their study, was due to the ability of these species to grow when nitrogen is scarce (ca. 0.1 ug-at/l). Malone (1977a) reported an inverse relationship between ~. tripos abundance and local nutrient enrichment in the 1976 New York Bight bloom. The widespread distribution of the bloom also contraindicates a role for local (e.g. estuarine) nutrient enrichment in its development (Malone, 1977a). The latter argument seems to also dismiss a major bloom ,initiation role for local growth factor enrichment. HOwever, Nordli (1957) found that~. furca requires some growth factor or factors, sparse or absent in oceanic water off Norway, but present in soil extract and., to a lesser degree, in- inshore waters. The studies of Toriumi (1968) and Bruno and McLaughlin (1977) suggest that vitamin B12 and trace metals are critical .in the nutrition of certain ceratium spp. If ~ tripos has similar requirements, and this is probable judging from the known fair uniformity of such requirements among dinoflagellates, then in the 1976 episode, the factor or factors had to be distributed in ample supply throughout the bloom area. In summary, it appears that the major nutritional and physiological parameters knowh to strongly influence the development of many phytopldnkton blooms (e.g. nutrient supply, light, temperature) were not limiting in the 1976 New York BightCeratium bloom. It is likely that either trace factor concentrations in the New York Bight are normally adequate to support a large £. tripos population or their increase was a prerequisite ,to the 1976 bloom.
6.2 Speculation Regarding the Development of the 1976 New York Bight Ceratium tripes Bloom
In the inner Oslofjord, where Cera,tium spp. are in far greater abundance than in other Norwegian waters, the largest total Ceratium population including £. furca, £. fusus and £. tripos, observed by Hasle and Nordli (1951), was 135,000 cells per liter. The usual total Ceratium population in Norwegian coa~tal waters was about 1,000 cells per liter (Gran, 1915; Ringdal Gaarder, 1938, cited in Nordli, 1957). Nordli (1957) reported
-18-
levels of £. tripes in the Oslofjord exceeding 33,000 cells per liter and also mentioned a level of 13,860 cells per liter determined in an earlier investigation (Gran, 1915, cited in Nordli, 1957). The maximum number of £. tripos in Norwegian coastal waters was 300 per liter (Braarud, Ringdal Gaarder and Nordli, 1958) and in the Bay of Fundy, the maximum number of £.tripos found by Gran and Braarud (1·935) was 580 cells per liter. In coastal waters off Chesapeake Bay, Mulford and Norcross (1971) found a £. tripos maximum of 2,366 cells per liter. In the recent New York Bight bloom, however, the mean £. tripos cell density observed in the Bight apex in early March was 5,800 cells per liter; the mean water column cell density was estimated at 240,000 cells per liter by May (Malone, 1977a). When compared to the Ceratium cell density maxima in the other locales, the New York Bight £.tripos bloom seems to have had an extraordinary intensity.
Other aspects of this bloom do not seem unique, however, The instances of ~. tripos spring maxima listed in Table 1 are sufficiently numerous to suggest that such events are not unusual. The durations of the cited maxima suggest that the persistence of C. tripos blooms for several months is not rare, although not a characteristic feature. Even the impressively large areal distribution of the New York Bight bloom is rivaled by the extent of ~. tripos maxima in other locales, for example, the Gulf of Maine. The Chesapeake area, New York Bight and Bay of Fundy.£. tripos blooms have as a common feature, initial, most intense, development in the offshore waters followed by spread to, or development in, nearshore waters. Yet another similarity between the bloom in the New York Bight and those elsewhere is in their mid-depth residence in the warmer months. In Danish waters, relatively high numbers of £. tripos were found in the deep layers during the summer (Nordli, 1957). In Virginia coastal waters in the summer, the surface phytoplankton was dominated by diatoms but Ceratium spp. including ~. tripos dominated in deeper waters (e.g. 15 m) (Mulford and Norcross, 1971). In both the Chesapeake area (Mulford and Norcross, 1971) and New York Bight (Malone, 1977a) episodes, it is hypothesized that the bloom was transported toward shore by the movement of bottom waters. The common features and frequent occurrence of these blooms suggest the possibility of future £. tripos blooms in the New York Bight.
The already high February ~. tripos cell density and the slow growth rate of this species raised suspicion that the bloom initiated prior to this month. Averaging the Mulford and Norcross (1971) counts of ~. tripos, except during its maxima,
-19-

at the furthest offshore station (where it was most abundant) provides a level of 46 cells per liter. By treating this as a "normal" level we have a basis for speculation regarding the temporal origin of the 1976 New York Bight bloom. In the colder months, Nuzzi and Perzan (1974) found the lowest phytoplankton abundances in the New York Bight during November and December. Conover, S. (1956) found a December-January phytoplankton mimimum in Long Island Sound and the lowest abundance of phytoplankton in the Gulf of Maine occurs in late February or the first few days of March (Bigelow, 1926). In the 1976 New York Bight ~. tripos bloom, there was little growth during February. Judging from the other observed winter minima, it seems likely that January was also an unamenable period for ~. tripos growth. By assuming a growth rate of 0.03 divisions/ day during January (the rate in the Bight apex during February was about 0.02 divisions/day) and then assigning the MarchApril mean rate of 0.06 divisions/day to the time prior to January, extrapolation back to the 45 cells per liter level suggests a hypothetical bloom origin around September 1975. This seems plausible in the light of the frequent summer-fall maxima of this species. Still allowing for a growth rate of 0.03 divisions/day in January and using for previous bloom development, the maNimum growth rate observed by Nordli (1957) (0.33 divisions/day) would place the origin of the bloom in December.
Quantitative data on ~. tripos abundance in the New York Bight outside the apex are not available for the autumn of 1975. However, although only very qualitative estimates of phytoplankton were possible since a 0.505 mm mesh net was used in the sampling, examination of zooplankton collection? made in the Bight during November 1975 revealed a sparse to moderate abundance of C. tripos. The significance of the presence of this populati;;-n in exp"laining subsequent bloom development is questionable since~. tripos is a normal component "of the plankton and the source of the seed population for the bloom has not been established. Nevertheless, at least we know a C. tripos population was present in late 1975 in the Bight which could have constituted the seed stock for the bloom. In the Bight apex, however, there were not sufficient numbers of ~. tripos present in November 1975 to develop to the population level observed in February 1976 and, therefore, the bloom must have migrated into this area (Malone, personal communication) .
The fact that f. tripes can, under favorable conditions, grow at rates relatively high compared to the level in the Bight in March and April 1976 and the lack of information on where
-20-

and when the bloom originated should not obscure the possibility that the bloom's temporal origin might have been in late 1975. If the bloom did begin at this time, the possible time span increases in significance as a feature of the bloom. It follows that such a long development period would have to be permitted by the meterological and hydrographic conditions prevailing over the time span.
~. tripos, being slow-growing and motile (the latter attribute presumably enhances foraging ability), would not require as high a nutrient level for growth as would many of the relatively fast-growing, non-motile phytoplankters common in the Bight, e.g. S. costatum. However, nutrient requirements may have become critical in the later stages. Although our direct knowledge of the nutrient preferences of ~. tripos is limited to the observations that it can grow in nutrient-sparse waters but, as reported by Hasle and Nordli (1957), can survive and flourish in eutrophic waters, we may assume that this species requires the usual phytoplankton nutrients. Also, since ~. -tripos can flourish in eutrophic waters, the inverse relationship Malone (1977a) observed between cell numbers and the intrusion of nutrient-rich estuarine waters into the Bight was probably not due to the increased nutrient levels. Based on analyses of available nutrients during the course of the bloom, Malone (1977a) hypothesized that the collapse of the bloom in June and July was caused by nutrient exhaustion. If this were the situation, then the characteristic high fertility of New York Bight waters possibly influenced the intensity and duration of the bloom. That is, in a stratified or relatively non-mixing water layer, an initially high nutrient level would permit phytoplankton growth to proceed at a higher rate and for a longer period than would a lower initial nutrient level.
-21-
ACKNOWLEDGMENTS
Mrs. Myra Cohn and Ms. Mabel Trafford contributed to this review by assisting in the literature search. Ms. Michele Cox redrew the figures on the physiology of Ceratium spp. and prepared the map figure. Ms. Maureen Montone typed the manuscript.
-22-
REFERENCES
BAINBRIDGE, V. 1958. Some observations on Evadne nordmanni Loven. J. Mar. BioI.
Ass. U. K. 37: 349-370.
BIGELOW, H. B. 1926. Plankton of the offshore waters of the Gulf of Maine.
Bull. U. S. Bur. Fish. 40. 509 pp.
BIGELOW, H. B., L. C. LILLICK, and M. SEARS. 1940. Phytoplankton and planktonic protozoa of the offshore waters
of the Gulf of Maine. Part 1. Numerical Distribution. Trans. Amer. Phil. Soc. New Series. 31(Part 3): 149-191.
BRAARUD, T., K. RINGDAL GAARDER, and E. NOROLI. 1958. Seasonal changes in the phytoplankton at various points off
the Norwegian West Coast. Fiskeridir. Skr. Havundersok. 12. 77 pp.
BRONGERSMA-SANDERS, M. 1957. Mass mortality in the sea. Pages 941-1010 in Treatise on
marine ecology and paleoecology. Vol. 1, Ecology. J. W. Hedgepath, ed. Waverly Press, Baltimore.
BRUNO, S. F., and J. J. A. McLAUGHLIN. 1977. The nutrition of the freshwater dinoflagellate Ceratium
hirundinella. J. Protozool. 24: 548-553.
CAMPBELL, P. H. ~973. Studies on brackish water phytoplankton.
Carolina Sea Grant Publication UNC-SG-73-07.
CONOVER, R. J.
Univ. NOrth 406 pp.
1956. Oceanography of Long Island Sound, 1952-1954. VI. The biology of Arcartia clausi and A. tonsa. Bull. Bingham. Oceanogr. ColI. 15: 156-223.
CONOVER, S. A. M. 1956. Oceanography of Long Island Sound, 1952-1954. IV.
Phytoplankton. Bull. Bing. Oceanogr. ColI. 15: 62-112.
CURL, H., JR. 1959. The phytoplankton of Apalachee Bay and the northeastern
Gulf of Mexico. Publ. Inst. Mar. Sci. Univ. Texas 6: 277-320.
-23-
ELBRACHTER, M. 1973. Population dynamics of Ceratium in coastal waters of the
Kiel Bay. Oikos, suppl. 15: 43-48.
EPPLEY, R. W., and W. G. HARRISON. 1975. Physiological ecology of Gonyaulax polyedra, a red water
dinoflagellate. Pages 11-22 in V. R. LoCicero, ed. Proceedings of the first international conference on toxic dinoflagellate blooms. Massachusetts Science and ~chnology Foundation, Wakefield, Mass.
FISH, C. J. 1925. Seasonal distribution of the plankton of the Woods Hole
region. Bull. u. S. Bur. Fish. 41. 179 pp.
GRAHAM, S. W. 1941. An oceanographic consideration of the 'dinoflagellate genus
Ceratium. Ecological MOnographs 11: 99-116.
GRAHAM, H. W., and N. BRONIKOVSKY. 1944. The genus Ceratium in the Pacific and North Atlantic Oceans.
Carnegie Inst. Wash. Publ. 565. 209 pp.
GRAN, H. H., and T. BRAARUD. 1935. A quantitative study of the phytoplankton in the Bay of
Fundy and the Gulf of Maine (including observations on hydrography, chemistry and turbidity). J. BioI. Bd. Can. 1: 279-467.
HASLE, G. R., and E. NORDLI. 1951. Form variation in
cultures and from·the Naturv. Klasse No.4.
KAIN, J. M., and G. E. FOGG.
ceratium fusus and tripos populations in sea. Det Norske vid.-Akad. i Oslo. Mat.
25 pp.
1960. Studies on the growth of marine phytoplankton. III. Prorocentrum micans Ehrenberg. J. Mar. BioI. Ass. U. K. 39: 33-50.
MALONE, T. C. 1977a. Plankton workshop summary report. Pages 167-232 in Oxygen
depletion and associated environmental disturbances in~e Middle Atlantic Bight in 1976. Technical Series Report No.3, Northeast Fisheries Center, Sandy Hook, N. J.
-24-

MALONE, T. C. 1977b. Plankton systematics and distribution. MESA New York Bight
Atlas Monograph 13, N. Y. Sea Grant Institute, Albany. 45 pp.
MANDELL I , E. F., P. R. BURKHOLDER, T. E. DOHENY, and R. B. BRODY. 1970. Studies of primary productivity in coastal waters of
southern Long Island, New York. Mar. BioI. 7: 153-160.
MARSHALL, S. M., and A. P. ORR. 1955. The biology of a marine copepod, Calanus finmarchicus (Gunnerus).
Oliver and Boyd, Edinburgh and London. 180 fP.
MULFORD, R. A. 1963. Distribution of the dinoflagellate
tidal and offshore waters of Virginia. genus Ceratium in the
Ches. Sci. 4: 84-89.
MULFORD, R. A., and J. J. NORCROSS. 1971. Species composition and abundance of net phytoplankton in
Virginian coastal waters, 1963-1964. Ches. Sci. 12: 142-155.
NORDLI, E. 1953. Salinity and temperature as controlling factors for
distribution and mass occurrence of ceratia. Saertrykk Av. Slyttia 11: 16-18.
NORDLI, E. 1957.
8: Experimental studies on the ecology of ceratia.
200-265.
NUZZI, R., ·and U. P. PERZAN.
oikos
1974. Phytoplankton and suspended particles. Pages 69-93 in An interdisciplinary study of the estuarine and coastal oceanography of Block Island Sound and adjacent New York coastal waters. Technical Report No. 0027, New York Ocean Science Laboratory, Montauk, New York.
PARSONS, T. R., K. STEPHENS, and J. D. H. STRICKLAND. 1961. On the chemical composition of eleven species of marine
phytoplankters. J. Fish. Res. Sd. Can. 18: 1001-1016.
PATTEN, B. C., R. A. MULFORD, and J. E. WARINNER. 1963. An annual phytoplankton cycle in the lower Chesapeake Bay.
Ches. Sci. 4: 1-20.
PETERS, No 1934. Die 8evolkerung des Sudatlantischen Ozeans mit Ceratien.
Wissensch. Ergebn. Deut. Atlantische Exped. Meteor., 1925-1927. 11: 1-69.
-25-

PRATT, D. M.
1959. The phytoplankton of Narragansett Bay. Limnol. Oceanogr. 4: 425-440.
RAYMONT, J. E. 1963. Plankton and productivity in the oceans. Pergamon Press.
Oxford. 660 pp.
SMAYDA, T. J. 1957. Phytoplankton studies in lower Narragansett Bay. Limnol.
Oceanogr. 2: 342-359.
SMAYDA, T. J. 1976. Ceratium tripos (0. F. Muller) Nitzsch: A brief overview
of its biology relative to its 1976 bloom dynamics in northeastern U. S. coastal waters. Pages 103-109 in J. H. Sharp, ed. Anoxia on the Middle Atlantic shelf dur~ the summer of 1976. Workshop report (Oct. 15-16, 1976). I.D.O.E./N.S.F. Washington, D. C.
STEEMAN NIELSEN, E. 1934. Untersuchungen uber die Verbreitung,
der Ceratien in Sudlichen Stillen Ozean.
STEIMLE, F.
Biologie and Variation Dana Rep. No.4. 67 pp.
1976. A summary of the fish kill-anoxic phenomenon off New Jersey and its impact on resource species. Pages 5-11 in J. H. Sharp, ed. Anoxia on the Middle Atlantic shelf during the summer of 1976. Workshop report (Oct. 15-16, 1976).· I.D.O.E./N.S.F. Washington, D. C.
TORIUMI, S. 1968. Cultivation ·of marine ceratia using natural sea water
culture media. 1. Bull. Plank. Soc. Japan 15: 1-6.
WOOD, E. J. F. 1965. ·Marine microbial ecology.·· Chapman and Hall Ltd. London.
243 pp'.
-26-

NUMBER
1
2
3
4
5
6
7
8
9
10
11
NORTHEAST FISHERIES CENTER SANDY HOOK LABORATORY
TECHNICAL SERIES REPORTS
TITLE AND AUTHOR
Proceedings of a workshop on egg, larval and juvenile stages of fish in Atlantic coast estuaries, by Anthony L. Pacheco (editor).
Diagnosis and control of mariculture diseases in the United States, by Carl J. Sinderrnann (editor).
Oxygen depletion and associated environmental disturbances in the Middle Atlantic Bight in 1976 (composite authorship) •
Biological and fisheries data on striped bass, Morone saxati1is (Wa1baum), by W. G. Smith and A. Wells.
Biological and fisheries data on ti1efish, Lopho1atilus chamae1eonticeps Goode and Bean, by Bruce L. Freeman and Stephen C. Turner.
Biological and fisheries data on butterfish, Peprilus triacanthus (Peck), by Steven A. Murawski, Donald G. Frank, and Sukwoo Chang.
Biological and fisheries data on black sea bass, Centropristis striata (Linnaeus), by Arthur W. Kendall.
Biological and fisheries data on king mackerel, Scomberomorus caval1a (Cuvier), by Peter Berrien and Doris Finan.
Biological and fisheries data on Spanish mackerel, Scomberomorus maculatus (Mitchi11), by Peter Berrien and Doris Finan.
Biological and fisheries data on Atlantic sturgeon, Acipenser oxyrhynchus (Mitchi11), by Steven A. Murawski and Anthony L. Pacheco.
Biological and fisheries data on bluefish, Pomatomus sa1tatrix (Linnaeus), by Stuart J. Wilk
DATE
August 1973
December 1974 (out of print)
February 1977 (out of print)
May 1977 (out of print)
May 1977
March 1978
May 1977
November 1977
November 1977
August 1977
August 1977 (out of print)

NUMBER
12
13
14
15
16
TITLE AND AUTHOR
Biological and fisheries data on scup, Stenotomus chrysops (Linnaeus), by Wallace W. Morse.
Biological and fisheries data on northern searobin, Prionotus carolinus (Linnaeus), by Susan C. Roberts.
A guide for the recognition of some disease conditions and abnormalities in marine fish, by Carl J. Sinderrnann, John J. Ziskowski, and Valentine T. Anderson.
Ichthyoplankton from the RV Dolphin survey of continental shelf waters between Martha's Vineyard, Massachusetts and Cape Lookout, North Carolina, 1965-66, by P. L. Berrien, M. P. Fahay, A. W. Kendall, Jr., and W. G. Smith.
The seasonal maxima of Ceratium tripos with particular reference to a major New York Bight bloom, by John B. Mahoney.
DATE
January 1978
June 1978
March 1978
March 1978
June 1978