Embed Size (px)
Citation preview
The Science of Social Media
Kristina Lerman
USC Information Sciences Institute
ML meetup, July 2011

USC Information Sciences Institute
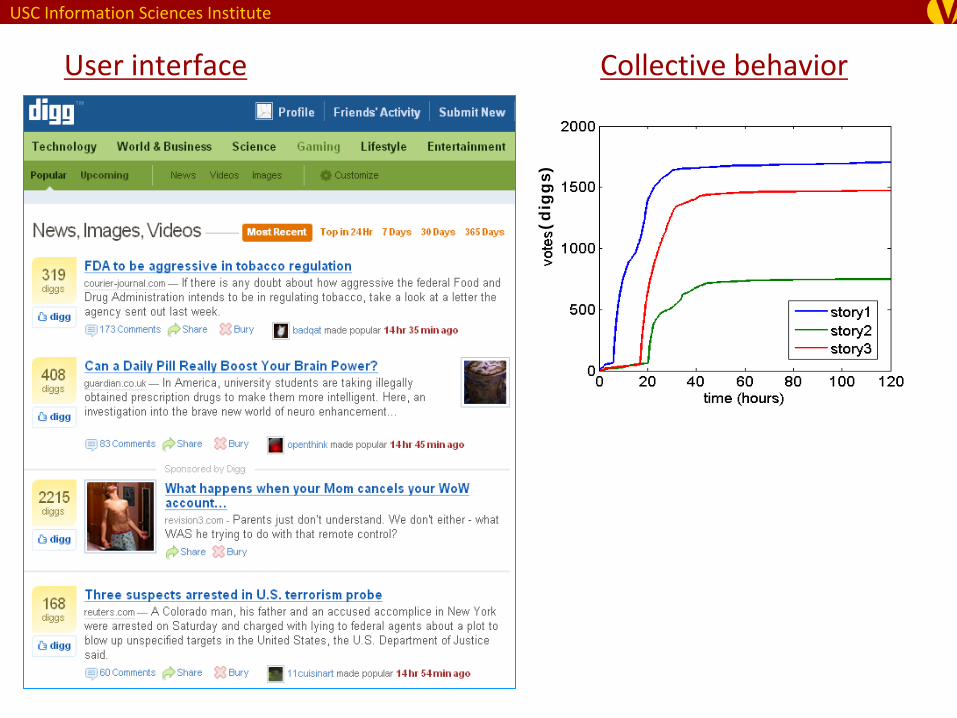
User interface Collective behavior
Design cycle
design
predict
What is a science?•
Explain observed phenomena
•
Make verifiable predictions
•
Help engineer systems with desired behavior

USC Information Sciences Institute
Why now? Data‐driven network science
Availability of largelarge‐‐scalescale, timetime‐‐resolvedresolved
data from social media sites allows us to ask new questions about social behavior
•
How does social behavior arise from individual interactions?•
How far and how fast does information/behavior spread on
networks?•
How do we measure network structure, find communities and
influential people?
•
How does the network structure affect information flow?
•
What does the flow of information tell us about its quality?

USC Information Sciences Institute
•
Data mining (CS) approach•
Apply statistical regression to identify correlated sets of features in large
data sets
•
Predict outcomes for new cases based on features
•
Cannot identify causal mechanisms
•
Experimental approach•
Controlled experiments to uncover causal mechanisms
•
Not practical for researchers – need access to large pool of study
participants
•
Empirical (physics‐based) approach•
Empirically grounded framework for discovering mechanistic models
•
Leverage statistical physics methodology to study social behavior
Alternative approaches to the science of social media

USC Information Sciences Institute
Roadmap
Use physics‐based approach to study social media1.
Mathematical analysis of social dynamics•
How do user actions (e.g., specified by the UI) give rise to collective
behavior?
•
Mathematical models relate microscopic actions to collective dynamics•
Explain and predict collective behavior
2.
Dynamics of social contagion•
How far does information spread on a network?
•
Empirical analysis and simulations to study how the microscopic
mechanism affects macroscopic properties of spread
•
Fundamental differences between disease and information spread
3.
Beyond PageRank•
How to find important nodes in a network?
•
The role of diffusion in network analysis

USC Information Sciences Institute
Social News: Digg
Users submitsubmit
or votevote
for (digg)
news storiesOnline social networks
•
Users follow ‘friends’
to see•
Stories friends submit•
Stories friends vote for
•
Shown in Friends Activity
Trending stories•
Digg
promotes most popular
stories to its Popular page
Data set*•
Votes on ~3K popular stories
•
Follower graph w. ~280K users
*http://www.isi.edu/~lerman/downloads/digg2009.html

USC Information Sciences Institute
Microblogging: Twitter
Users tweet short text posts•
Retweet
posts of others•
Tweets may contain URLs
Online social networks•
Users follow ‘friends’
to see•
Tweets by friends•
Retweets
by friends
Trending topics•
Twitter analyzes activity to
identify popular trends
Data set•
Tweets mention ~70K URLs
•
Follower graph w. ~700K
users

USC Information Sciences Institute
Mathematics of social dynamics: Modeling collective behavior in social media
USC Information Sciences Institute
(dig
gs)
User interface Collective behavior
USC Information Sciences Institute
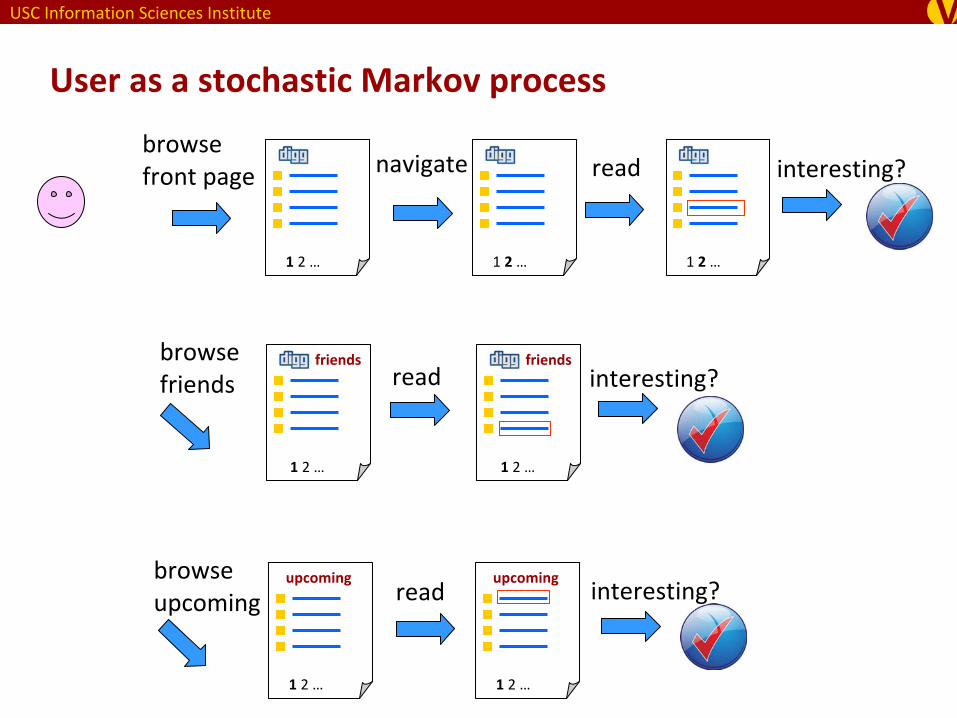
User as a stochastic Markov process
1 2
…
navigate
1 2
…
read interesting?
friends
1
2 …
read interesting?
1
2 …
upcomingread interesting?
1
2 …
browse
front page
friends
1
2 …
browse
friends
1
2 …
upcomingbrowse
upcoming

USC Information Sciences Institute
User as a stochastic Markov process
1 2
…
navigate
1 2
…
read interesting?
friends
1
2 …
read interesting?
1
2 …
upcomingread interesting?
1
2 …
browse
front page
friends
1
2 …
browse
friends
1
2 …
upcomingbrowse
upcoming
nonfans
submitter
fans
other
fans

USC Information Sciences Institute
individualbehavior
Øup
Øup
ØØØ
n2
n4
n3
n1Ø
<n2 >
<n4 >
<n3 >
<n1 >
collectivebehavior
dtnd
nbnadtnd
2
121
mathematical model
time
<n k>
model solutions
stochastic modeling
in one slide

USC Information Sciences Institute
•
Model solutions give dynamics of collective behavior•
Fully calibrated model •
Interestingness (rS , rF , rN ) the only adjustable parameters.
•
Max likelihood estimate (MLE) to find best r values that fit
observed collective behavior
Submitter’s fans
time (hours)
votes
Other fans
Non‐fans
Story 1

USC Information Sciences Institute
Popular submitter advantage
promoted
not promoted
promotion threshold
Less interesting (lower r) stories submitted by popular users
(many followers) will be promoted to the front pages
[2006 data]
USC Information Sciences Institute
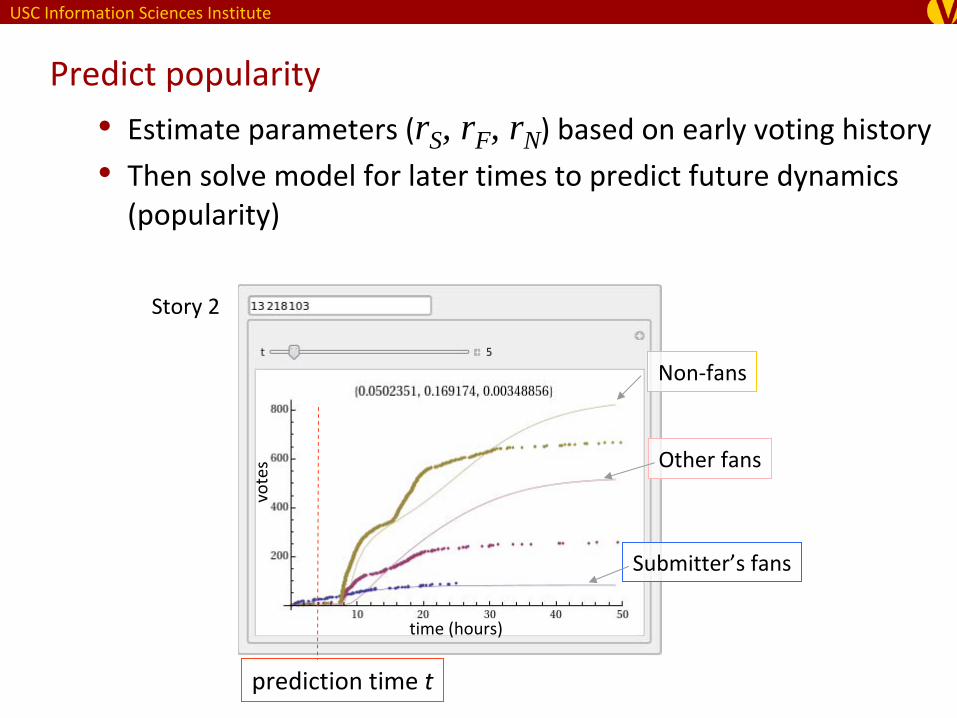
Predict popularity
•
Estimate parameters (rS , rF , rN) based on early voting history
•
Then solve model for later times to predict future dynamics
(popularity)
Story 2
Submitter’s fans
time (hours)
votes Other fans
Non‐fans
prediction time t

USC Information Sciences Institute
Confidence of prediction•
Likelihood surface indicates how well data constrains r‐values
•
Compute 95% confidence bounds on model predictions

USC Information Sciences Institute
Confidence correlated with prediction error•
Predict at promotion time for ~90 stories
•
Compute error 24hrs after promotion•
Error=predicted votes - actual votes

USC Information Sciences Institute
Dynamics of social contagion: What stops social epidemics?

USC Information Sciences Institute
Information spread on network
A cascade is a sequence of activations generated by a contagion
process, in which nodes cause their neighbors to be activated
with some probability (transmissibility)
*Nodes are labeled in the temporal order of activation
1 2
34
56
7
Underlying network Two cascades spreading
on the network*

USC Information Sciences Institute
Cf
Spread of disease
Fraction of
nodes
infected
1
Transmissibility, λ
Epidemic thresholdpredicted for manycascade models 0
An epidemic is a contagion process that spreads to a fraction of
all
the nodes

USC Information Sciences Institute
Size of cascades on social media
cascade size cascade size
numbe
r of cascade
s
numbe
r of cascade
s
Most cascades reach fewer than 1% of all users!
Digg
(~280K users) Twitter (~700K users)

USC Information Sciences Institute
Why are these cascades so small?
Standard model
of epidemic
growth
(Heterogenous
mean field theory,
SIR model, same
degree distribution
as Digg)
Transmissibility of almost all Digg
stories fall within width of this line?!
λ*, Transmissibility
Most cascades fall in this range

USC Information Sciences Institute
Maybe graph structure is responsible?
clustering reduces epidemic threshold and cascade size, but not enough!
transmissibility
epidemic
threshold
←
Mean field prediction
(same degree dist.)
←
Simulated cascades on
a random graph with
same degree dist.
Simulated cascades on
the observed Digg
graph

USC Information Sciences Institute
What about the spreading mechanism?
Independent Cascade Model implicit in many epidemic models:
a node with n
infected friends has n
chances to be infected
Infected
Not infected
?

USC Information Sciences Institute
How important are repeat exposures?
More than half
exposed to a
story more
than once!

USC Information Sciences Institute
How do people respond to repeated exposure?
Not much.
We have similar
results forTwitter ‐‐‐‐‐‐‐
Also noted by
Romero, et al,
WWW 2011
repeated exposure has little effect on probability to become
infected

USC Information Sciences Institute
Big consequences for epidemic growth
1.
Most people are exposed to a story more than once
2.
Repeated exposures have little effect
Growth of epidemics is severely curtailed (especially compared to Ind. Cascade Model)

USC Information Sciences Institute
Weak response to repeated exposure
Take effect of
repeat exposure
into account:
Actual Digg
cascades
Result of
simulations
λ*
Epidemic
threshold
unchanged
λ*, Transmissibility
[Ver Steeg, Ghosh & Lerman, What stops social epidemics? in ICWSM 11]

USC Information Sciences Institute
Beyond PageRank: Dynamics and network structure

USC Information Sciences Institute
What are the important nodes in a network?
Centrality metrics examine structure of the network to determine relative importance of nodes
• Degree Centrality Measures number of node’s neighbors
• Betweenness
centrality [Freeman, 1979] Fraction of all shortest paths passing through a given node
• PageRank
[Brin
et al., 1998]
Probability random surfer ends up at a node
• Alpha‐centrality [Bonacich, 1987], Katz score [Katz, 1953]Number of paths of any length, exponentially attenuated by their
length, from a given node to all nodes
• …

USC Information Sciences Institute
The Billion Dollar Algorithm: PageRank
(Brin
et al 98)
)(
),1(1)1(),(ifollowerj
outj
PRPR
djtr
nitr
1
2 3
4 5
After many iterations, converges to PageRank
scores of nodes.

USC Information Sciences Institute
PageRank
and the Random Surfer
1
2 3
4 5
1
2 3
4 5
Node size = probability~ importance
Consider a web surfer who clicks on links on web pages at random
with no regard to content•With probability , the Surfer follows a hyperlink from a given web page•With probability (1‐), the Surfer jumps to a random web page
After a long time … the probability the Random Surfer visits a
web page is given by that page's PageRank.

USC Information Sciences Institute
Random walk and conservative diffusion•
Random surfer executes a random walk (with restarts)
on a web graph – a stochastic process obeying the following rules
•
With probability , walker jumps from a node to one of its
neighbors
•
With probability (1‐), walker jumps to any node
•
Random walk and diffusion•
Random walk is a prototypical example of conservative
diffusion process•
Other examples are money transfer, used goods circulation,
etc. where some quantity ($, goods, probability) is conserved

USC Information Sciences Institute
Matrix formulation
1
2 3
4 50 1 0 0 0
0 0 1 1 0
0 0 0 1 1
0 0 0 0 1
0 1 0 0 0
1 0 0 0 0
0 2 0 0 0
0 0 2 0 0
0 0 0 1 0
0 0 0 0 1
A =
D =
Adjacency matrix
of the network
Outdegree
matrix

USC Information Sciences Institute
Matrix formulation of conservative diffusion
where starting vector s specifies where a random jump ends up
Steady state solution: as t
Ct
Ct AwDsw 1
1)1(
)()1(...)1()1( 1
1
ADIsAsDswC
Weight vector gives the probability of finding the walker
anywhere on the graph at time t. It is changed by diffusion:
… same as PageRank
when s=1/n

USC Information Sciences Institute
Social phenomena are non‐conservative
1
2 3
4 5
Random walk is not a good model of social phenomena, such as
epidemics, adoption of innovation, or information spread in social
media –
broadcast‐based diffusion
1
2 3
4 5
Node size ~ importance
Broadcast‐based diffusion is non‐conservative; i.e., amount of the
diffusing quantity (disease, information) changes over time.

USC Information Sciences Institute
Matrix formulation of non‐conservative diffusion
wtNC sAwt1
NCwith starting vector s
Weight vector is not
conserved: wt
NC wt1NC
wNC k
k0
Akss(IA)1t Steady state solution: as
Holds for < 1/1
Weight gives the amount of quantity on the graph at time t.
Weight evolves according to rules of non‐conservative diffusion

USC Information Sciences Institute
rtAlpha eA eA 2 ... teAt1
Alpha‐Centrality [Bonacich, 87]
1
4
2
5
3
Number of paths of any length, attenuated by their length with

USC Information Sciences Institute
rtAlpha eA eA 2 ... teAt1
Alpha‐Centrality [Bonacich, 87]
1
4
2
5
3
Number of paths of any length, attenuated by their length with

USC Information Sciences Institute
rAlpha
eA(I A)
Alpha‐Centrality [Bonacich, 87]
1
4
2
5
3
Number of paths of any length, attenuated by their length with
t
Holds for < 1/1

USC Information Sciences Institute
rAlpha
eA(I A)
Alpha‐Centrality [Bonacich, 87]
1
4
2
5
3
Number of paths of any length, attenuated by their length with
t
Holds for < 1/1
wNC
s(I A)
non-conserva- tive diffusion

USC Information Sciences Institute
Conservative diffusion
Two classes of dynamic processes on networksNon‐conservative diffusion
•
Mathematical formulation of two types of diffusion•
Equivalence of steady state solutions and centrality metrics
•
Unifies social network analysissocial network analysis
and epidemic modelsepidemic models
•
Implications•
Location of the epidemic threshold
•
Social Network Analysis should consider not only the network
topology, but type of dynamics also•
I.e., which centrality metric?
[Ghosh
and Lerman, Predicting Influential Users in Online Social Networks. SNAKDD10]
1
2 3
4 5
1
2 3
4 5

USC Information Sciences Institute
Implications: epidemic threshold
c=0.006
c=0.009
transmissibility
Non‐conservative diffusion has a threshold, given by 1/1
, (largest
eigenvalue
of A) [Wang et al., 2003]
•For <1/1
, process (epidemic) dies out
•For >1/1 , process (epidemic) reaches many nodes

USC Information Sciences Institute
Implications: Social Network Analysis
PageRank Alpha‐Centrality
89
7
6
5
1 2 3
4
89
7
6
5
1 2 3
4
1010
Which centrality metric best predicts important nodes?

USC Information Sciences Institute
Implications: Social Network Analysis
PageRank Alpha‐Centrality
89
7
6
5
1 2 3
4
89
7
6
5
1 2 3
4
1010
Which centrality metric best predicts important nodes?
1/3
1/3 1/2 1/2
1 1
11 1
1

USC Information Sciences Institute
Which metric is right?
How can we evaluate centrality metrics?
•
User activity in social media provides an independent measure of importance/influence
• Serves as ground truth for evaluating centrality metrics
Evaluation methodology• Define an empirical measure of influence (ground truth)
•
Compare centrality metrics with the ground truth
USC Information Sciences Institute
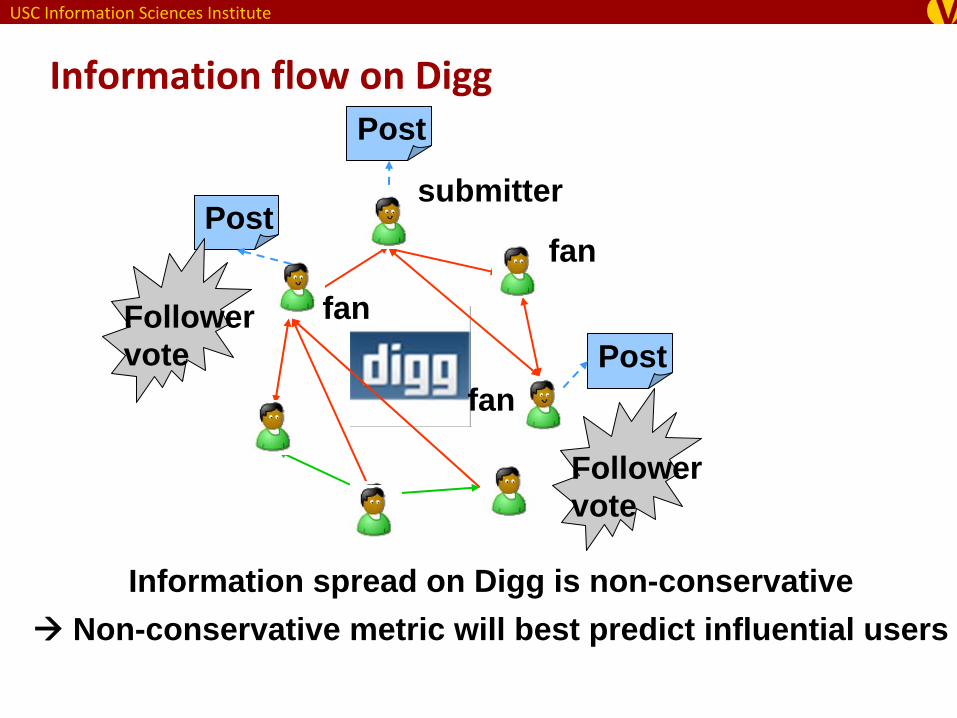
submitter
Post
Post
Post
Information spread on Digg is non-conservative Non-conservative metric will best predict influential users
Information flow on Digg
Follower vote
Follower vote
fan
fan
fan

USC Information Sciences Institute
Empirical estimate of influence
1.
Average follower votes•
Likelihood a follower votes for the story
•
Influence of submitter
•
Quality of the story
•
Story quality•
Random variable•
Average out by aggregating fan votes over all stories submitted
by
the same submitter−
289 users submitting at least 2 stories
2.
Average Cascade size• How far does the story spread into the network
Ground truth(s): Rank users according to each estimate

USC Information Sciences Institute
Evaluation of importance prediction
(1) Avg. # of follower votes (2) Avg. cascade size
Correlation between the rankings produced by the empirical measures of influence and those predicted by Alpha-Centrality and PageRank
Non‐conservative Alpha‐Centrality best predicts influence rankings

USC Information Sciences Institute
Conclusion
Physics‐inspired analysis of large‐scale, time‐resolved data about
social behavior online leads to new understanding of social
dynamics and social networks•
Mathematical modeling links details of individual actions with collective
social behavior•
Explain phenomenology of Digg
•
Predict future popularity of new content
•
Design better social systems
•
Dynamics of information spread on networks•
What limits the size of information cascades?
•
Fundamental differences between social and disease contagion
•
Understanding network structure•
Topology alone does not explain structure, e.g., important nodes. Also need
to consider the type of diffusion process
•
Centrality metric based on epidemic models better predicts influential users
of Digg.

USC Information Sciences Institute
Readings•
Mathematical modeling•
Using a Model of Social Dynamics to Predict Popularity of News.
Lerman, K., and Hogg, T.
2010. In Proceedings of 19th International World Wide Web Conference (WWW).
http://www.isi.edu/~lerman/papers/wfp0788‐lerman.pdf
•
Using Stochastic Models to Describe and Predict Social Dynamics of Web Users.
Lerman, K.,
and Hogg", T.
2010. submitted to ACM Transactions on Intelligent Systems and Technology.
http://www.isi.edu/~lerman/papers/prediction.pdf
•
Dynamics of information spread•
What stops social epidemics?.
Steeg, G. V.; Ghosh, R.; and Lerman, K.
2011. In Proceedings
of 5th International Conference on Weblogs and Social Media.
http://arxiv.org/abs/1102.1985
•
Information Contagion: an Empirical Study of Spread of News on Digg
and Twitter Social
Networks.
Lerman, K., and Ghosh, R.
2010. In Proceedings of 4th International Conference on
Weblogs and Social Media (ICWSM). http://arxiv.org/abs/1003.2664
•
Diffusion and network structure•
Non‐Conservative Diffusion and its Application to Social Network Analysis.
Ghosh, R.;
Lerman, K.; Surachawala, T.; Voevodski, K.; and Teng, S.
2011.
http://arxiv.org/abs/1102.4639
•
Predicting Influential Users in Online Social Networks.
Ghosh, R., and Lerman, K.
2010. In
Proceedings of KDD workshop on Social Network Analysis (SNA‐KDD), July.
•
A Parameterized Centrality Metric for Network Analysis.
Ghosh, R., and Lerman, K.
2011.
Physical Review, E 83(6):066118 . http://arxiv.org/abs/1010.4247

USC Information Sciences Institute
Thanks
Collaborators• Rumi
Ghosh
(USC)
• Greg Ver
Steeg
(USC)
• Tad Hogg (IMM)
• Rob Zinkov
(USC)
• Tawan
Surachawala
(USC)
Funding agencies• NSF• AFOSR• AFRL


![arXiv:1608.08517v4 [cs.SI] 25 May 2017 · arXiv:1608.08517v4 [cs.SI] 25 May 2017 Noname manuscript No. (will be inserted by the editor) Empirically Grounded Agent-Based Models of](https://img.dokumen.tips/doc/110x75/5dd13fddd6be591ccb64f034/arxiv160808517v4-cssi-25-may-2017-arxiv160808517v4-cssi-25-may-2017-noname.jpg)