Embed Size (px)
Citation preview

CHAPTER 5The Science Curriculum
The first part of Chapter 5 presents information about
the curricular goals in the timss 1999 countries,
referred to as the intended curriculum. Data are
provided about how the curriculum is supported and
monitored within each country and the relationship
between national testing and the curriculum. The
second part of the chapter contains teachers’ reports
about the science topics actually studied in their
classrooms, also known as the implemented curriculum.
5

5

157The Science Curriculum
In comparing achievement across countries, it is important to considerdifferences in students’ curricular experiences and how they may affectthe science they have studied. At the most fundamental level, students’opportunity to learn the content, skills, and processes tested in thetimss 1999 assessment depends to a great extent on the curricular goalsand intentions inherent in each country’s policies for science education.Just as important as what students are expected to learn, however, iswhat their teachers choose to teach them. The lessons provided by theteacher ultimately determine what science students are taught.
Chapter 5 presents information about the curricular goals in the timss1999 countries and teachers’ reports about the science content studied.Teacher’s instructional programs for their classes are usually guided byan “official curriculum” that describes the science education that shouldbe provided. The official curriculum can be communicated by means ofdocuments or statements of various sorts (often called guides, guide-lines, or frameworks) prepared by the education ministry or by nationalor regional education departments. These documents or statements,together with supporting material such as instructional guides or man-dated textbooks, are referred to as the intended curriculum.
To collect information about the intended science curriculum at theeighth grade in each of the timss 1999 countries, the NationalResearch Coordinators responsible for implementing the study com-pleted questionnaires and participated in interviews. As part of theprocess, information was gathered about factors related to supportingand monitoring the implementation of the official curriculum, includ-ing the availability of teacher training, instructional materials, assess-ments, and audits aligned with the curriculum.
In many cases, teachers need to interpret and modify the intended cur-riculum according to their perceptions of the needs and abilities oftheir classes, and this evolves into the implemented curriculum.Research has shown that the implemented curriculum, even in highlyregulated educational systems, is not identical to the intended curricu-lum. To collect data about the implemented curriculum, the scienceteachers of the students tested in timss 1999 completed questionnairesabout whether students had been taught the various science topics cov-ered in the test.

2 3 4 5 6 7158 Chapter 1
Science Subjects Offered Up To and Including Eighth Grade
The most striking difference among science curricula of the timss 1999countries in eighth and earlier grades is that the sciences are taught asseparate subjects in some countries and integrated to form a general sci-ence course in others. Exhibit 5.1 shows how science instruction isorganized in these grades in the timss 1999 countries. By the eighthgrade, Chinese Taipei, Indonesia, and most of the European countrieswere teaching some or all of earth science, biology, physics and chem-istry as separate subjects, not necessarily contemporaneously. Elsewhere,the common practice was to integrate the sciences into a general science curriculum.
At lower grade levels, science topics in some countries were incorporatedin broader curriculum areas, such as “knowledge about nature and socie-ty” in Slovenia. Additional areas of study are included in grade 8 in somecountries. For instance, Belgium (Flemish) included “technological education,” “scientific work,” and “applied science” in grades 7 and 8science programs.
5.1

Background data provided by National Research Coordinators.
1 Australia: Yes in 4 of 8 states/territories.
2 Canada: Results shown are for the majority of provinces.
3 Geography is considered to be an integrated social studies and natural science course at grade 8;geography teachers were not sampled in the TIMSS studies.
Separate ScienceCourses Offered Science Subjects and Grades Taught
1 No General/integrated science course
Yes
Yes General/integrated science (3-5); biology (6-8); chemistry (7-8); physics (7-8); earth science (6-8)
2 No General sciences organized by strands (grades K-8)
No General integrated science (4-8) with some earth science taught in history/geography/social studies
Yes
No
Yes
No
Yes
No General studies (1-6); science (7-8)
Yes Environment (5); biology, physics, geography (6-8); chemistry (7-8)
Yes
No
No General/integrated science course
No General/integrated science course
No General/integrated science course
No General/integrated science course
No Intelligent life (combined with social studies) (1-2); science (3-8)
Yes Biology (5-8); chemistry (8); physics (8)
3 Yes
Yes Nature and some earth science (1-4); biology (5-8); geography (5-8); chemistry (7-8); physics (7-8)
No General/integrated science course
Yes Separate science subjects are taught in grade 8: biology, chemistry, physics, and geography
Yes Biology and physics (7); physics/chemistry and biology/geology (8)
Yes
No General/integrated science course
No General/integrated science course (1-7)
Yes General/integrated science (3-4); biology (5-8); geography (5-8); physics (6-8); chemistry (7-8)
Yes
No General/integrated science course
Yes
3 Yes
No General/integrated science and geography
No General/integrated science course
No General/integrated science course
No General/integrated science course (grades 4-8)
No General/integrated science course
Natural science (1-6); biology (7); integrated physics/chemistry (8); integrated physics/chemistry continues tobe taught at grade 9 in addition to earth science
General/integrated science course, though some schools (especially independent ones) may offer physicschemistry, and biology, separately,
General/integrated science course (includes life sciences, physical sciences, earth sciences, andenvironmental and resource issues)
Biology, physics, and earth science taught separately, but one composite grade is given; chemistry is nottaught until high school
World orientation (3-6); biology and earth science (7-8); scientific work (7-8); technological education (7-8);physics (8); applied science (8); natural science (8)
General/integrated science course taught at grade 8. This course may be taught by separate subject areateachers in some schools. General science includes a combination of physics, chemistry and biology topics
Elementary science (1-3), General/integrated science (4-5); physics (6-8); chemistry (8); life science/biology (6-8); earth science (6-8)
Knowledge about nature and society (1-3); knowledge about nature (4-5); geography (6-8); biology (6-8);chemistry (7-8); physics (7-8)
General/integrated science (primary school up to grade 6); physics/chemistry, biology, geography whichincludes earth science (7-8)
General/integrated science (1-4); physics, chemistry, geography/geology, and biology taught as separatesubjects (5-8)
Integrated course of biology, geography and environmental studies (1-6); physics (7-8); chemistry (7-8)biology (7-8); natural geography (7-8); physics, chemistry, biology and natural geography are also taught at grade 9.
Integrated science course 'cognition of the world' (1-4); integrated science course 'man and nature' (5)integrated science course 'man and nature'/geography (6); biology/geography (7); biology, physics, chemistryand geography (8); subjects taught at grade 8 continue through grade 10
Science integrated with social studies (2-4); integrated science (5); geography (6-8); physics (7-8); biology (6-8); chemistry (8)
AustraliaBelgium (Flemish)
Bulgaria
Canada
Chile
Chinese Taipei
Czech Republic
Finland
Hong Kong, SAR
Hungary
Israel
Italy
Japan
Jordan
Korea, Rep. of
Latvia (LSS)
Macedonia, Rep. of
MalaysiaMoldova
Morocco
New Zealand
Philippines
Romania
Singapore
Slovak Republic
South Africa
Thailand
Tunisia
Turkey
United States
Cyprus
England
Indonesia
Russian Federation
Slovenia
Netherlands
Lithuania
Iran, Islamic Rep.
159The Science Curriculum
SOU
RCE:
IEA
Thi
rd In
tern
atio
nal M
athe
mat
ics
and
Scie
nce
Stud
y (T
IMSS
), 19
98-1
999.
5.1
Exhibit 5.1 Science Subjects Offered Up to and Including Eighth Grade

2 3 4 5 6 7160 Chapter 1
Does Decision Making About the Intended Curriculum Take Placeat the National or Local Level?
Depending on the educational system, students’ learning goals are com-monly set at three levels: the national or regional level, the school level,and the classroom level. Some countries are highly centralized, with theministry of education (or highest authority in the system) being exclusive-ly responsible for the major decisions governing the direction of educa-tion. In others, such decisions are made regionally or locally. Eachapproach has its strengths and weaknesses. Centralized decision makingcan add coherence and uniformity in curriculum coverage, but may con-strain a school or teacher’s flexibility in tailoring instruction to the needsof students.
Exhibit 5.2 presents information for each timss 1999 country about thehighest level of authority responsible for making decisions about the cur-riculum and gives the curriculum’s current status. The data reveal that 35of the 38 countries reported that the specifications for students’ curricu-lar goals were developed as national curricula. Australia determined cur-ricula at the state level, with local input; the United States did so at boththe state and local levels, with variability across states; and Canada deter-mined what students are expected to learn at the provincial level.
In recent decades, it has become common for intended curricula to beupdated regularly. At the time of the timss 1999 testing, the official sci-ence curriculum in 31 countries had been in place for less than a decade,and more than three-quarters of them were in revision. Of the sevencountries with a science curriculum of more than 10 years’ standing, fourwere being revised. In Australia, Canada, and the United States, curricu-lum change is made at the state or provincial level, and some science cur-ricula were in revision at the time of testing. The science curricula inthese three countries were relatively recent, having been developed withinten years prior to the study.
5.2

Background data provided by National Research Coordinators.
1 Belgium (Flemish): Curricula were introduced as follows: 1997-98 (biology); 1997 (technologicaleducation), early 1990 (physics); 1997 (earth science); 1997-99 (applied sciences); 1989 (scientificwork); 1989-97 (natural science).
A dash (–) indicates data are not available.
National orRegional Curriculum Year Curriculum Introduced Status of Curriculum
Belgium (Flemish) 1
Chile
Chinese Taipei
Cyprus
Czech Republic
Finland
Hong Kong, SAR
Hungary
Indonesia
Iran, Islamic Rep.
Israel
Italy
Japan
Jordan
Korea, Rep. of
Latvia (LSS)
Lithuania
Macedonia, Rep. of
Malaysia
Moldova
Morocco
Netherlands
New Zealand
Philippines
Romania
Russian Federation
Singapore
Slovak Republic
Slovenia
South Africa
Thailand
Tunisia
Turkey
Canada
England
United States
Bulgaria
Australia
As introduced
In revision
In revision
As introduced
In revision
As introduced
In revision
As introduced
In revision
In revision
In revision
As introduced
As introduced
Slight revisions annually
As introduced
In revision
In revision
As introduced
In revision
In revisionIn revision
As introduced
As introduced
In revision
In revision
In revision
In revision
–In revision
In revision
In revision
In revision
In revision
In revision (5 provinces);As introduced (5 provinces)
In revision, same structure withminor revisions (to be implemented2000/01)
As of 1999, 47 out of 50 states havecompleted content standards
In revision (in 4 states/territories);As introduced (in 4 states/territories)
In revision
1989-1999
1980
1997
1978
1996
1994
1986
1995
1994
1996
1997-1998
1979
1993
1993
1995
1992-1994
1997
1979 (adaptations in 1995)
1990
19911991
1993 (slight adaptations in 1998)
1995
1998
1993
1998
1993
–1983
1984
1990
1997
1992
1987-1998
1995
1990-1999
1984-1999
1989 (biology and chemistry);1996 (physics); 1995 (earth science)
National
National
National
National
National
National
National
National
National
National
National
National
National
National
National
National
National
National
National
NationalNational
National
National
National
National
National
National
NationalNational
National
National
National
National
National
Regional
National
Regional & Local
Regional & Local
161The Science Curriculum
SOU
RCE:
IEA
Thi
rd In
tern
atio
nal M
athe
mat
ics
and
Scie
nce
Stud
y (T
IMSS
), 19
98-1
999.
5.2
Exhibit 5.2 Science Curriculum

2 3 4 5 6 7162 Chapter 1
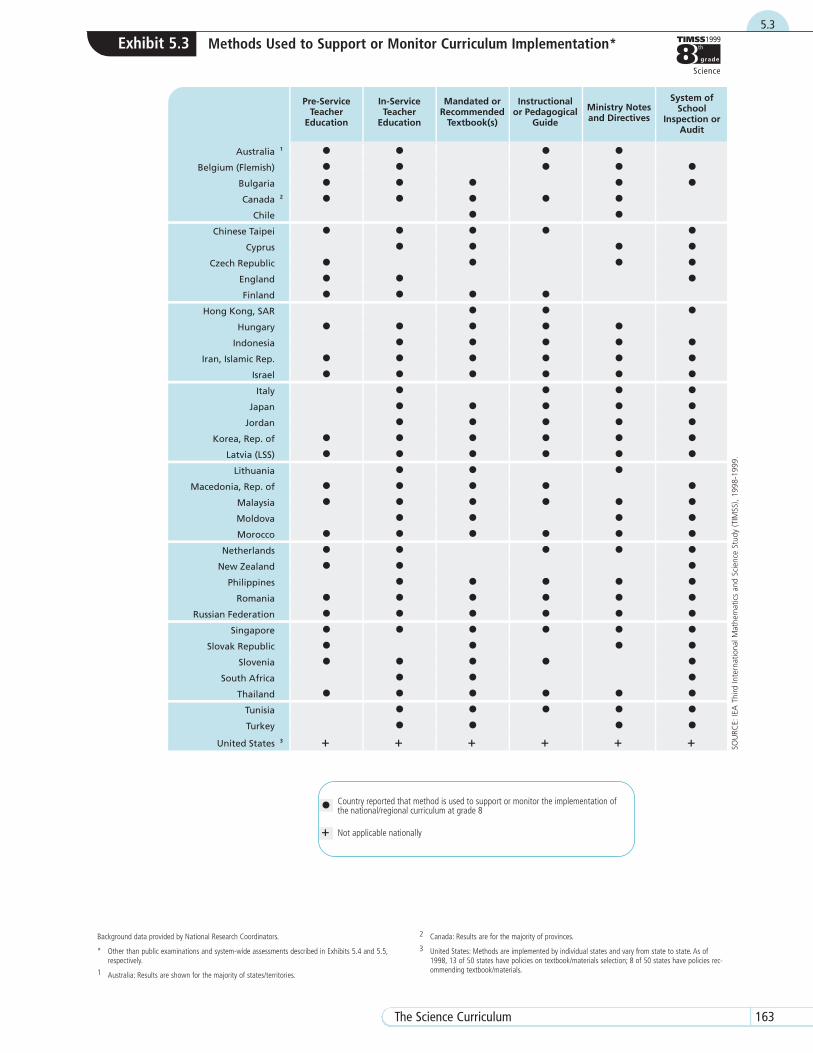
How Do Countries Support and Monitor Curriculum Implementation?
Education systems use different ways to achieve the best match betweenthe intended and the implemented curriculum. For example, teacherscan be trained in the content and pedagogical approaches specified inthe curriculum guides. Another way to help ensure alignment is to devel-op instructional materials, including textbooks, instructional guides, andministry notes, that are tailored to the curriculum. Systems can also moni-tor implementation by means of school inspection or audit. The differentmethods used by the timss 1999 countries are shown in Exhibit 5.3. It isassumed that monitoring implementation encourages teachers to use theofficial curriculum in planning their teaching programs. Testing andassessment of the intended curriculum are also widely used to supportand monitor curriculum implementation; these are addressed in Exhibits5.4 and 5.5
Of the methods for supporting and monitoring curriculum implementa-tion shown in Exhibit 5.3, 10 countries reported using all six, and a fur-ther 13 countries used five. Support for the national/regional sciencecurriculum as part of pre-service education was noted by 24 of the 38 coun-tries, and nearly all reported using in-service teacher education for thispurpose. A system of school inspection or audit was used by 31 countries.
5.3
Background data provided by National Research Coordinators.
* Other than public examinations and system-wide assessments described in Exhibits 5.4 and 5.5,respectively.
1 Australia: Results are shown for the majority of states/territories.
2 Canada: Results are for the majority of provinces.
3 United States: Methods are implemented by individual states and vary from state to state. As of1998, 13 of 50 states have policies on textbook/materials selection; 8 of 50 states have policies rec-ommending textbook/materials.
Pre-ServiceTeacher
Education
In-ServiceTeacher
Education
Mandated orRecommended
Textbook(s)
Instructionalor Pedagogical
Guide
Ministry Notesand Directives
System ofSchool
Inspection orAudit
Australia 1
Belgium (Flemish)
Bulgaria
Canada 2
Chile
Chinese Taipei
Cyprus
Czech Republic
England
Finland
Hong Kong, SAR
Hungary
Indonesia
Iran, Islamic Rep.
Israel
Italy
Japan
Jordan
Korea, Rep. of
Latvia (LSS)
Lithuania
Macedonia, Rep. of
Malaysia
Moldova
Morocco
Netherlands
New Zealand
Philippines
Romania
Russian Federation
Singapore
Slovak Republic
Slovenia
South Africa
Thailand
Tunisia
Turkey
United States 3
••
••••
•
••••••••
••••••••••••••••+
•••••
••
••••••••••
••••
•••••
•••+
••
•
•
•••••••••••
••
••
••••
•
••
+
••••••
••••••
•••••••••
••••••••••+
••••
••
••
••••••••••••••••••••
•••••+
••••
•
•••
•
••
••
••
•••
•••••
•
+
Country reported that method is used to support or monitor the implementation ofthe national/regional curriculum at grade 8
Not applicable nationally
•+
163The Science Curriculum
SOU
RCE:
IEA
Thi
rd In
tern
atio
nal M
athe
mat
ics
and
Scie
nce
Stud
y (T
IMSS
), 19
98-1
999.
5.3
Exhibit 5.3 Methods Used to Support or Monitor Curriculum Implementation*
2 3 4 5 6 7164 Chapter 1
What Countries Have Public Examinations in Science?
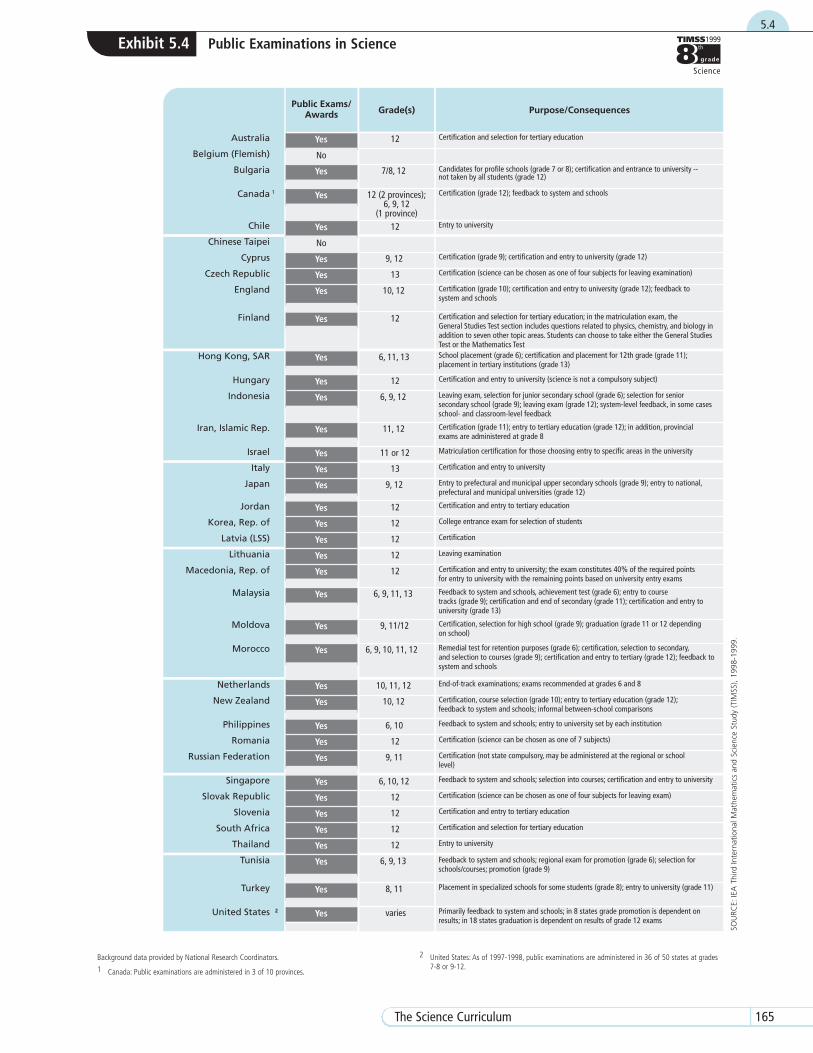
Using public examinations as a way to select students for university or aca-demic tracks in secondary school can be an important motivating factorfor student achievement. Exhibit 5.4 shows information on public exami-nations and their purpose. Thirty-six countries reported having publicexaminations or awards, at one or more grades, that include testingachievement in science. Most countries held their examinations in thefinal year of schooling for certification and selection to higher education(often, university education). Certification also provides students notgoing on to full-time post-secondary education with evidence of educa-tional attainment for prospective employers. In about one-third of thecountries, public examinations were also reported to be used to select stu-dents for entry to different types of secondary school, or to assign them todifferent tracks or courses within secondary schools. Providing feedbackto policy makers in the educational system, schools, or both was also animportant use of assessments in some countries.
Two countries reported having no public examinations in science.Belgium (Flemish) and Chinese Taipei were the only countries wheredecisions about promotion from one grade to the next, certification, andqualification for entrance to university were made at the school level with-out reliance on system-wide public examinations.
5.4
Background data provided by National Research Coordinators.
1 Canada: Public examinations are administered in 3 of 10 provinces.
2 United States: As of 1997-1998, public examinations are administered in 36 of 50 states at grades7-8 or 9-12.
Grade(s) Purpose/Consequences
Australia Certification and selection for tertiary education
1
Entry to university
Certification (grade 9); certification and entry to university (grade 12)
Certification (science can be chosen as one of four subjects for leaving examination)
Certification and entry to university (science is not a compulsory subject)
Matriculation certification for those choosing entry to specific areas in the university
Certification and entry to university
Certification and entry to tertiary education
College entrance exam for selection of students
Certification
Leaving examination
End-of-track examinations; exams recommended at grades 6 and 8
Feedback to system and schools; entry to university set by each institution
Certification (science can be chosen as one of 7 subjects)
Feedback to system and schools; selection into courses; certification and entry to university
Certification (science can be chosen as one of four subjects for leaving exam)
Certification and entry to tertiary education
Certification and selection for tertiary education
Entry to university
2
Candidates for profile schools (grade 7 or 8); certification and entrance to university --not taken by all students (grade 12)
School placement (grade 6); certification and placement for 12th grade (grade 11);placement in tertiary institutions (grade 13)
Primarily feedback to system and schools; in 8 states grade promotion is dependent onresults; in 18 states graduation is dependent on results of grade 12 exams
Certification (grade 11); entry to tertiary education (grade 12); in addition, provincialexams are administered at grade 8
Certification, course selection (grade 10); entry to tertiary education (grade 12);feedback to system and schools; informal between-school comparisons
Placement in specialized schools for some students (grade 8); entry to university (grade 11)
Remedial test for retention purposes (grade 6); certification, selection to secondary,and selection to courses (grade 9); certification and entry to tertiary (grade 12); feedback tosystem and schools
Certification (not state compulsory, may be administered at the regional or schoollevel)
Feedback to system and schools; regional exam for promotion (grade 6); selection forschools/courses; promotion (grade 9)
Leaving exam, selection for junior secondary school (grade 6); selection for seniorsecondary school (grade 9); leaving exam (grade 12); system-level feedback, in some casesschool- and classroom-level feedback
Certification (grade 12); feedback to system and schools
Certification and entry to university; the exam constitutes 40% of the required pointsfor entry to university with the remaining points based on university entry exams
Certification and selection for tertiary education; in the matriculation exam, theGeneral Studies Test section includes questions related to physics, chemistry, and biology inaddition to seven other topic areas. Students can choose to take either the General StudiesTest or the Mathematics Test
Entry to prefectural and municipal upper secondary schools (grade 9); entry to national,prefectural and municipal universities (grade 12)
Certification, selection for high school (grade 9); graduation (grade 11 or 12 dependingon school)
Feedback to system and schools, achievement test (grade 6); entry to coursetracks (grade 9); certification and end of secondary (grade 11); certification and entry touniversity (grade 13)
Certification (grade 10); certification and entry to university (grade 12); feedback tosystem and schools
Yes
No
Yes
Yes
Yes
No
Yes
Yes
Yes
Yes
Yes
Yes
Yes
Yes
Yes
Yes
Yes
Yes
Yes
Yes
Yes
Yes
Yes
Yes
Yes
Yes
Yes
Yes
Yes
Yes
Yes
Yes
Yes
Yes
Yes
Yes
Yes
Yes
12
12
9, 12
13
10, 12
12
12
11 or 12
13
9, 12
12
12
12
12
6, 9, 10, 11, 12
10, 11, 12
6, 10
12
9, 11
6, 10, 12
12
12
12
12
6, 9, 13
8, 11
6, 11, 13
varies
11, 12
6, 9, 12
12 (2 provinces);6, 9, 12
(1 province)
9, 11/12
10, 12
12
7/8, 12
6, 9, 11, 13
Belgium (Flemish)
Chile
Chinese Taipei
Cyprus
Czech Republic
England
Finland
Hungary
Indonesia
Israel
Italy
Japan
Jordan
Korea, Rep. of
Latvia (LSS)
Lithuania
Macedonia, Rep. of
Morocco
Netherlands
Philippines
Romania
Russian Federation
Singapore
Slovak Republic
Slovenia
South Africa
Thailand
Tunisia
Turkey
United States
Canada
Iran, Islamic Rep.
Hong Kong, SAR
New Zealand
Malaysia
Bulgaria
Moldova
Public Exams/Awards
165The Science Curriculum
SOU
RCE:
IEA
Thi
rd In
tern
atio
nal M
athe
mat
ics
and
Scie
nce
Stud
y (T
IMSS
), 19
98-1
999.
5.4
Exhibit 5.4 Public Examinations in Science

2 3 4 5 6 7166 Chapter 1
What Countries Have System-Wide Assessments in Science?
Although national public examinations can provide information of inter-est to national and regional policy makers, their main purpose is to makedecisions about individual students. In comparison, system-wide assess-ments are designed primarily to inform policy makers about matters suchas national standards of achievement of the intended curriculum objectives,strengths and weaknesses in the curriculum or how it is being implement-ed, and whether educational achievement is improving or deteriorating.
Exhibit 5.5 summarizes information about national assessments in sci-ence. Such assessments were conducted in 23 of the participating coun-tries. Seven of these – Malaysia, Morocco, the Netherlands, thePhilippines, Singapore, Tunisia, and Turkey – reported using publicexaminations as system-wide assessments, and therefore the same exami-nation is featured in Exhibits 5.4 and 5.5. Of the 23 countries thatreported conducting system-wide assessments, nine reported testing allstudents in the grade and 11 reported testing a sample from the grade.One of these countries, the Netherlands, reported testing both the entiregrade level and a sample. Australia and Canada reported state- andprovincial-level testing both for the entire grade and for a sample. Inaddition, two countries, Indonesia and the Russian Federation, reportedadministering periodic sample-based assessments at various grades forsystem-level feedback and research purposes, respectively. Most countriestested from two to four grades; Korea tested at six grades.
Generally, the purpose of the system-wide assessments was to provide feed-back to government policy makers and the public. Several countries thatreported assessing all students in a grade used these results in a variety ofways, including providing feedback to individual schools. England andHungary also used information about individual students for course place-ment or guidance.
In addition to collecting information about examinations and assess-ments, questionnaires and interviews were used to determine whether,and to what extent, explicit achievement standards were a feature ofintended curricula (see Exhibit R2.1 in the reference section). About two-thirds of the countries reported that such standards were incorporated intheir curricula or related documents. However, the term “achievementstandards” means different things in different countries and was unfamil-iar to some. Some countries regard them as learning objectives, and oth-ers include in this category performance indicators that describe levels ofrequired or desired performance. Exhibit R2.1 includes countries thatreported learning objectives or performance objectives as a component oftheir curriculum documents.
5.5
R2.1

Background data provided by National Research Coordinators.
1 Public examinations are also used for system-wide assessment purposes in these countries: Malaysia,Morocco, Netherlands, Philippines, Singapore, Tunisia, and Turkey.
2 Australia: System-wide assessments are administered in 3 of 8 states/territories.
3 Canada: System-wide assessments are administered in 5 of 10 provinces.
Entire GradeLevel
Sample fromGrade Level
Australia 2
Belgium (Flemish)
Bulgaria
Canada 3
Chile
Chinese Taipei
Cyprus
Czech Republic
England
Finland
Hong Kong, SAR
Hungary
Iran, Islamic Rep.
Israel
Italy
Japan
Korea, Rep. of
Latvia (LSS)
Lithuania
Macedonia, Rep. of
Malaysia
Moldova
Morocco
Netherlands
New Zealand
Philippines
Romania
Russian Federation
Singapore
Slovak Republic
Slovenia
South Africa
Thailand
Tunisia
Turkey
United States
Jordan
Indonesia
System-WideAssessments1 Purpose/Consequences
Grades
4, 8, 9
4, 6, 8, 10, 12
6
6, 8, 10, 13
5, 6, 7, 8, 9
5, 6, 7, 8
6
3, 7
various grades
5, 8, 11
4, 8, 12
ages 13 and 16nationally
(most provinces)
4, 5, 8, 10
3, 7, 10 (1 state)10 (1 state)
various grades
4, 8, 10
5, 8
4, 5, 6, 7, 8, 10
6, 9, 11, 13
6, 9, 10, 11, 12
10, 11, 12
6, 10
6, 10, 12
4, 6, 9, 13
10 (1 state)
4, 7, 10(1 province)
Yes
No
No
Yes
Yes
No
No
No
Yes
Yes
No
Yes
Yes
No
Yes
Yes
Yes
Yes
Yes
No
No
Yes
Yes
No
Yes
Yes
Yes
Yes
No
Yes
Yes
No
No
No
No
Yes
Yes
Yes
System- and school-level feedback, usually one grade level assessed each year
System-, school- and student-level feedback
System-level feedback
System-level, school-level, and individual-level feedback
System-level feedback
System-level feedback
System-level feedback
System-level feedback and research purposes (projects and curriculum development)
System- and school-level feedback; "good schools" publicized
System- and school-level feedback
System-level feedback
System-level feedback
System- and school-level feedback (the assessment was sample-based up until 1999)
Irregularly for research purposes
System- and school- level feedback
National and state-level feedback
System- and school-level feedback
System-level feedback; monitoring reform impact; curricular revisions
System-level feedback, assessments given irregularly at different primary grades
System-level feedback
System-level feedback; first administered in 1999 with a grade 4 assessmentinstituted in 2000.
System- and school-level feedback; may lead to redistribution of teachers in theregions; assessments at grades 4 and 6 developed regionally
System- and school-level feedback; selection into courses, certification and entryto university
167The Science Curriculum
SOU
RCE:
IEA
Thi
rd In
tern
atio
nal M
athe
mat
ics
and
Scie
nce
Stud
y (T
IMSS
), 19
98-1
999.
5.5
Exhibit 5.5 System-Wide Assessments in Science

2 3 4 5 6 7168 Chapter 1
How Much Instructional Time Is Recommended for Science?
The different percentages of time devoted to mathematics instruction atdifferent grades highlight one of the difficulties in investigating the rela-tionship between achievement and instructional time across countries. Ifinstructional time is measured only for the eighth grade, the total time forwhich students in a country have been exposed to instruction in scienceduring their schooling may be under- or over-estimated. These data forgrades 4, 6, and 8 provide a better estimate of students’ intended instruc-tional time for science across the school years.
Percentages of instructional time designated for the sciences specified inthe intended curricula for grades 4, 6, and 8 are shown in Exhibit 5.6. Thepattern across countries shows that the percentage of time intended forscience instruction stays relatively the same or increases from grade 4 tograde 6, and increases from grade 6 to grade 8. Interestingly, the reversepattern holds for mathematics.1 Average percentages of time for scienceinstruction across all countries were 11, 13, and 16 percent for grades 4,6, and 8, respectively. Percentages of total instructional time for the sci-ences ranged from five to 30 percent at grade 4 and from six to 30 per-cent at grade 6. At the eighth grade, the percentage of instructional timespecified for science ranged from five to 10 percent in Italy to 32 percentin Moldova, which also reported the largest percentages at grades 4 and6. The percentage of instructional time for science exceeded 15 percentin two countries at grade 4, five countries at grade 6, and 12 countries atgrade 8; of the latter, eight countries reported that 25 percent or more ofinstructional time was intended for science. Schools’ and teachers’ reportsof the percentage of instructional time actually devoted to the sciences atgrade 8, shown in Exhibit 6.4 in the next chapter, generally correspondwith the intended percentages reported in Exhibit 5.6.
1 Mullis, I.V.S., Martin, M.O., Gonzalez, E.J., Gregory, K.D., Garden, R.A., O’Connor, K.M., Chrostowski, S.J., and Smith, T.A. (2000), TIMSS1999 International Mathematics Report: Findings from IEA’s Repeat of the Third International Mathematics and Science Study at theEighth Grade, Chestnut Hill, MA: Boston College.
5.6

169The Science Curriculum
Exhibit 5.6 Overleaf

Grade 4 Grade 6 Grade 8
1
2
Comments
Instructional Time Specified for Science
Australia
Canada
Chinese Taipei
Cyprus
Czech Republic
Finland
Hong Kong, SAR
Indonesia
Iran, Islamic Rep.
Israel
Italy
Japan
Jordan
Korea, Rep. of
Latvia (LSS)
Malaysia
Moldova
Morocco
Macedonia, Rep. of
Lithuania
Hungary
Chile
England
Bulgaria
Belgium (Flemish)
8%
9-12%
12%
6%
13%
11%
6-8%
14%
11%
7-10%
N/S
10%
12%
11%
5%
N/S
30%
6%
8%
9%
17%
N/S
N/S
N/S
12-15%
20%
12-15%
11%
6%
22%
11%
6-8%
14%
13%
10-13%
5-10%
10%
12%
13%
6%
10%
30%
6%
8%
14%
20%
N/S
N/S
N/S
12-15%
26%
12-15%
11%
14%
27%
14%
8-13%
14%
11%
14-16%
5-10%
10%
15%
12%
19%
25%
32%
12%
11%
23%
25%
N/S
N/S
N/S
12-15%
At grade 6, separate science subjects are introduced.
A newly proposed plan for primary level suggests greater emphasis on science.
There is no change in instructional time in elementary and lower secondary school.
Some science is taught in Life and Society in grades 1-4, biology in grades 5-8, and chemistry and physicsin grades 7-8. In addition, geography includes science topics in grade 5.
The instructional time from grade 4 through secondary school remains about the same.
The relative emphasis on the sciences compared to other subjects increases as students progress throughschool due to the teaching of the sciences as separate subjects. On average, the instructional time for scienceis 15% at grades 9-10 and 20% at grade 12.
At grade 4, students receive 2 classes per week of integrated science. At grade 6, students take 2 classesper week of both integrated science and geography. At grade 8, students take 1-2 classes per week in bothbiology and geography and 2 classes per week in both chemistry and physics.
There is a minor emphasis on science at primary school level. Science instruction is mandatory forthe first 3 or 4 years of secondary education with time allocation similar to that of other subjects. Up tograde 10, general science is usually taught. In the final 2 years of secondary school, science subjects areno longer mandatory but strands of biology, chemistry, physics are taught.
Science is a core subject in grades K-6 and time allotment depends on the teacher. General science is amandatory subject in junior high school. Separate science courses by discipline (e.g., chemistry, physics,biology, earth science) are electives at the senior high school level.
During the last years of secondary education, students choose between scientific (≈ 23%) andnon-scientific (≈ 19%) programs.
The curriculum framework indicates the minimum amount of instructional time on average forgrade spans 1-6 and 7-9. Schools decide on instructional time for specific grades.
The curriculum indicates 20% instructional time be devoted to mathematics and science as one subject. The exact distribution of time for each of these subjects is decided by the teacher.
Instructional time increases in junior high school (grades 7-9) and receives greater emphasis at thehigh school level for students specializing in the sciences.
At grade 3, science receives only 2% of instructional time. From grades 6-10, the time varies from 20-30%. After grade 10, science receives less than 5% of instructional time.
Although the national curriculum does not specify the amount of instructional time to be devoted to thesciences, schools usually assign 3 hours of instruction per week from 5th grade on.
The national curriculum does not specify the amount of time to be spent. The proposed curriculumassumes 2 hours per week at grade 4 (year 5), and 2-5 hours per week for grades 6 and 8 (years 7 and 9).In practice, teaching time for grade 8 (year 9) is slightly greater than this.
Biology and physics are first taught as separate subjects at grade 6. Chemistry is first taught as aseparate subject at grade 7.
SOU
RCE:
IEA
Thi
rd In
tern
atio
nal M
athe
mat
ics
and
Scie
nce
Stud
y (T
IMSS
), 19
98-1
999.
Exhibit 5.65.6
Instructional Time for Science
2 3 4 5 6 7170 Chapter 1
Background data provided by National Research Coordinators.
All data rounded to the nearest whole number.
1 Canada: Results shown are for the majority of provinces.
2 Lithuania: The instructional time specified for science includes geography. At grade 6, 7% of the totalinstructional time is for geography; at grade 8, 3-7% of the total instructional time is for geogra-phy.
N/S indicates instructional time not specified in the national/regional curriculum.
A dash (–) indicates data are not available.

At grade 8, students take the following sciences: earth science is included in geography 6%;physics/chemistry 6%; biology 6%.
Grade 4 Grade 6 Grade 8
As students progress through school, there is an increased focus on project-based curricula.
States do not generally specify; it is largely a local decision.
As students progress through school, there is more curriculum time allocated for science with moreinvestigative, hands-on, and project-based activities.
In secondary school, instructional time in sciences is doubled. In addition, science-based materialsare used in the English courses.
Instructional Time Specifiedfor Science
Comments
All schools are required to teach science as part of a "balanced curriculum". Schools decide oninstructional time. Usually in primary school, language (which includes reading) and mathematics areallocated considerably more time than science. Time for science, mathematics, and English are about thesame in secondary school.
The emphasis on science is relatively equal to other subjects up to grade 7. In grades 7-8, threeseparate science courses are introduced with a greater percentage of instructional time. Science is taughtas an integrated course focusing on life and society in grades 1-3. Subject knowledge about nature isintroduced as an integrated course in grades 4-5. Specialist courses are introduced in grades 6-8. In grade6, earth science is integrated in "geography." In grade 7, biology, chemistry, and physics are introduced.Geography does not include any science topics after grade 6.
As students progress through school, there is an increased focus on problem-solving, science projects, andthinking processes.
Netherlands
Russian Federation
Singapore
Slovak Republic
Slovenia
South Africa
Thailand
Tunisia
Turkey
United States
New Zealand
Philippines
Romania
5%
–
14%
N/S
6%
5%
10%
N/S
N/S
N/S
12%
7%
8%
14%
–
15%
N/S
6%
5%
10%
N/S
N/S
N/S
11%
21%
10%
18%
25%
–
27%
N/S
9%
8%
10%
N/S
15%
20%
N/S
25%
At grade 8, students take the following sciences: earth science is included in geography 6%; physics/chemistry6%; biology 6%.
171The Science Curriculum
SOU
RCE:
IEA
Thi
rd In
tern
atio
nal M
athe
mat
ics
and
Scie
nce
Stud
y (T
IMSS
), 19
98-1
999.
Exhibit 5.6: Instructional Time for Science (Continued)

2 3 4 5 6 7172 Chapter 1
How Do Countries Deal with Individual Differences?
The challenge of maximizing opportunity to learn for students with wide-ly differing abilities and interests is met differently in different countries.Exhibit 5.7 summarizes questionnaire and interview data on how coun-tries dealt with this issue in organizing the intended curricula.
Some countries indicated using more than one method of dealing withindividual differences among students, and in these cases the categorydescribing the main method was reported. The most common approach,found in 25 countries, was to have the same intended curriculum for allstudents, but to recommend that teachers adapt the level and scope oftheir teaching to the abilities and needs of their students. Adaptations forindividuals and classes were also recommended in the intended curriculaof some countries with different levels of curricula or different curriculafor different groups.
In the Czech Republic and England, science topics were taught at differ-ent levels with different groups. The Czech Republic had two levels andEngland nine. In England’s curriculum, the levels were defined in termsof progressively more complex performance to be demonstrated. Amongthe countries with different curricula for different groups of students,Belgium (Flemish) provided two different levels, Singapore three, and theNetherlands four.
National Research Coordinators from nine countries reported that theirofficial science curricula did not address the issue of differentiatinginstruction for grade 8 students with different abilities or interests, butthis does not necessarily mean that schools and teachers in those coun-tries did not make allowance for individual differences. Schools’ reportson how they organize to accommodate students with different abilities orinterests are shown in Exhibit R2.2 in the reference section. Substantialpercentages of students in many countries were in schools that offeredremedial and enrichment sciences, including several of the countrieswithout specific curricular statements about differentiation.
5.7
R2.2

Background data provided by National Research Coordinators.
1 Czech Republic: There is the same curriculum with different levels for different groups in physics andchemistry (2 levels); there is one curriculum for all students, and teachers adapt to students' needs,in life science and earth science.
2 England: While there is one “programme of study” for grades 6-8, the document identifies nine per-formance-levels describing the types and range of performance that pupils working at a particularlevel should demonstrate.
3 United States: Most state standards are designed for all students.
Same Curriculum forAll Students, andTeachers Adapt toStudents' Needs
Same Curriculumwith Different Levels for
Different Groups
Different Curricula forDifferent Groups
Number ofCurriculum Levels
1
2
3
CurriculumAddresses
Differentiation
Approaches to Addressing Students withDifferent Abilities or Interests at Grade 8
Australia
Belgium (Flemish)
Bulgaria
Canada
Chile
Chinese Taipei
Cyprus
Czech Republic
England
Finland
Hong Kong, SAR
Hungary
Indonesia
Iran, Islamic Rep.
Israel
Italy
Japan
Jordan
Korea, Rep. of
Latvia (LSS)
Lithuania
Macedonia, Rep. of
Malaysia
Moldova
Morocco
Netherlands
New Zealand
Philippines
Romania
Russian Federation
Singapore
Slovak Republic
Slovenia
South Africa
Thailand
Tunisia
Turkey
United States
Yes
Yes
Yes
Yes
No
Yes
Yes
Yes
Yes
Yes
Yes
Yes
No
Yes
Yes
No
No
Yes
No
No
No
Yes
Yes
No
Yes
Yes
Yes
Yes
Yes
Yes
Yes
Yes
Yes
No
Yes
Yes
Yes
Yes
Yes
No
Yes
Yes
Yes
Yes
Yes
No
Yes
Yes
Yes
Yes
Yes
Yes
Yes
Yes
Yes
No
Yes
Yes
Yes
Yes
No
Yes
Yes
Yes
Yes
Yes
Yes
No
No
No
No
No
No
Yes
Yes
No
No
No
No
No
No
No
No
No
No
No
No
No
No
No
No
No
No
No
No
No
No
Yes
No
No
No
No
No
No
No
No
No
No
No
No
No
No
No
Yes
No
No
No
No
Yes
No
No
No
No
No
No
1
2
1
1
1
1
2
9
1
1
1
1
1
1
1
1
1
4
1
1
1
1
3
1
1
1
1
1
1
173The Science Curriculum
SOU
RCE:
IEA
Thi
rd In
tern
atio
nal M
athe
mat
ics
and
Scie
nce
Stud
y (T
IMSS
), 19
98-1
999.
5.7
Exhibit 5.7 Differentiation of Instruction for Students with Different Abilities or Interests

2 3 4 5 6 7174 Chapter 1
What Are the Major Characteristics of the Intended Curriculum?
Exhibit 5.8 indicates the relative emphasis given to various aspects of science instruction in the intended curriculum. Knowing basic sciencefacts and understanding science concepts received major emphasis in thecurriculum of most participating countries, and at least moderate emphasiswas placed on application of science concepts in almost all national curricula. Few countries gave major emphasis to using laboratory equipmentand performing science experiments, but there were some notable excep-tions. Top-performing Singapore, Korea, and Japan were among the 10countries that reported major emphasis for both. The Czech Republic’sintended curriculum had minor or no emphasis on any aspect of practicalwork, and several other countries’ curricula had minor or no emphasis onperforming experiments.
The increasing importance of technology in school curricula is reflectedin the major emphasis given by 12 countries and the moderate emphasisgiven by 14 to “science, technology, and society.” Thematic approacheswere more common in science than in mathematics and received majoremphasis in 13 countries. Multicultural approaches and integration of sci-ence with school subjects other than mathematics were the approachesleast likely to be given major or moderate emphasis.
It is possible that in some countries some of the approaches and processesreported as having minor or no emphasis in the intended curriculum mayreceive more emphasis in the implemented curriculum. For example,although assessing student learning in science was reported to receiveminor or no emphasis in the intended curriculum of five countries –Chile, Indonesia, Malaysia, Romania, and South Africa – teachers therenevertheless regularly assess their students’ learning in science. In thesefive countries, the teachers of 60 percent or more of the students report-ed giving quite a lot or a great deal of weight to either teacher-made testsrequiring explanations or teacher-made objective tests (see Exhibit R3.18in the reference section).
5.8

Background data provided by National Research Coordinators.
1 Australia: Results shown are for the majority of states/territories.
2 Belgium (Flemish) and Russian Federation: The single codes are derived from a combination of codesfor individual sciences.
3 Canada: Results shown are for the majority of provinces.
1
2
3
–
– –
2
– – – – – – – – – – – – –
Kno
win
g Ba
sic
Scie
nce
Fact
s
Und
erst
andi
ng S
cien
ce C
once
pts
App
lyin
g Sc
ienc
e C
once
pts
to S
olve
Prob
lem
s an
d D
evel
op E
xpla
natio
ns
Usi
ng L
abor
ator
y Eq
uipm
ent
Perf
orm
ing
Scie
nce
Expe
rimen
ts
Des
igni
ng a
nd C
ondu
ctin
g Sc
ient
ific
Inve
stig
atio
ns
Com
mun
icat
ing
Scie
ntifi
cPr
oced
ures
and
Exp
lana
tions
inW
ritte
n an
d O
ral F
orm
Inte
grat
ion
of S
cien
ce w
ithM
athe
mat
ics
Scie
nce,
Tec
hnol
ogy
and
Soci
ety
Cro
ss-D
isci
plin
ary
App
roac
h(In
tegr
atio
n of
the
Sci
ence
san
d O
ther
Sch
ool S
ubje
cts)
Them
atic
App
roac
h
Mul
ticul
tura
l App
roac
h
Ass
essi
ng S
tude
nt L
earn
ing
Australia
Belgium (Flemish)
Bulgaria
Canada
Chile
Chinese Taipei
Cyprus
Czech Republic
England
Finland
Hong Kong, SAR
Hungary
Indonesia
Iran, Islamic Rep.
Israel
Italy
Japan
Jordan
Korea, Rep. of
Latvia (LSS)
Lithuania
Macedonia, Rep. of
Malaysia
Moldova
Morocco
Netherlands
New Zealand
Philippines
Romania
Russian Federation
Singapore
Slovak Republic
Slovenia
South Africa
Thailand
Tunisia
Turkey
United States
ModerateEmphasis
Minor/NoEmphasis
NotAvailable–
MajorEmphasis
175The Science Curriculum
SOU
RCE:
IEA
Thi
rd In
tern
atio
nal M
athe
mat
ics
and
Scie
nce
Stud
y (T
IMSS
), 19
98-1
999.
5.8
Exhibit 5.8 Emphasis on Approaches and Processes

2 3 4 5 6 7176 Chapter 1
What Science Content Do Teachers Emphasize at the Eighth Grade?
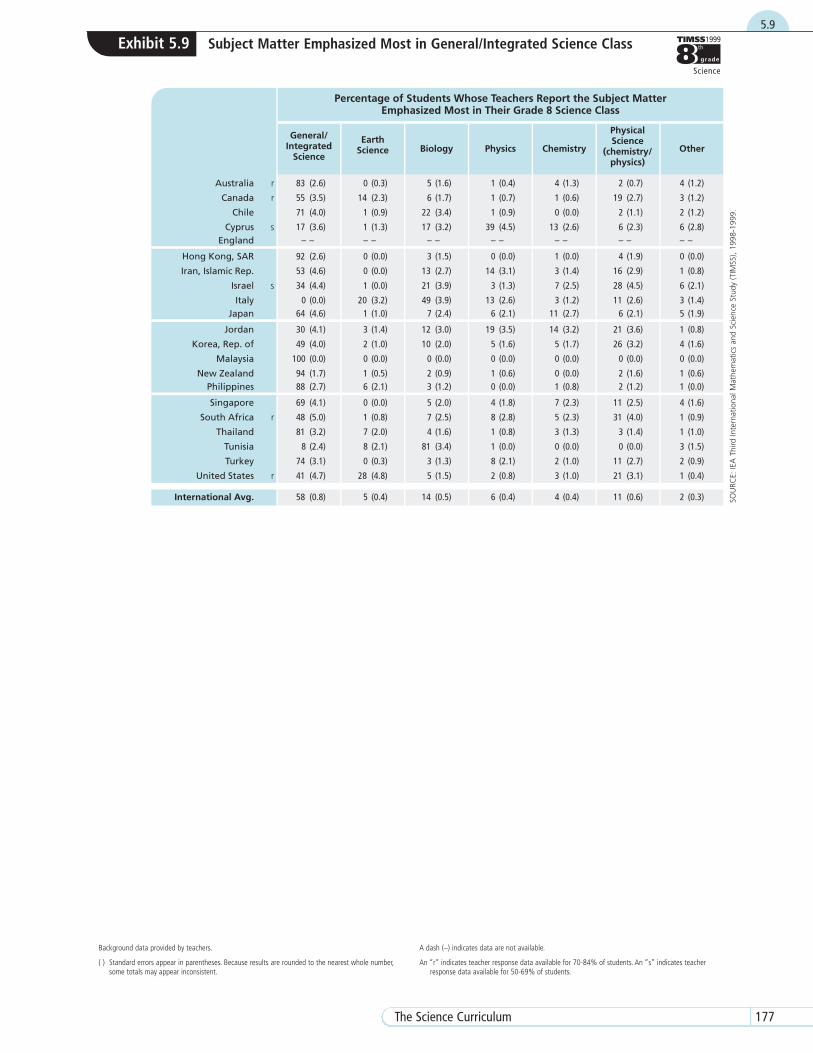
Teachers from countries in which eighth-grade science was taught as a gen-eral or integrated course were asked what subject matter they had empha-sized with their classes. Their responses are shown in Exhibit 5.9. In six ofthe 21 countries, at least 80 percent of students were in classes thatemphasized science as a general/integrated subject. In Canada, Italy, andthe United States, earth science was emphasized in considerably moreclassrooms than in other countries. Biology was more likely than the othersciences to be emphasized in Italy and Tunisia. Countries where relativelyhigh proportions of students had seen emphasis on physics, chemistry, orboth were Cyprus, Iran, Israel, Jordan, Korea, and South Africa.
5.9
Background data provided by teachers.
( ) Standard errors appear in parentheses. Because results are rounded to the nearest whole number,some totals may appear inconsistent.
A dash (–) indicates data are not available.
An “r” indicates teacher response data available for 70-84% of students. An “s” indicates teacherresponse data available for 50-69% of students.
r
r
s
s
r
r
Percentage of Students Whose Teachers Report the Subject MatterEmphasized Most in Their Grade 8 Science Class
General/Integrated
Science
EarthScience Biology Physics Chemistry
PhysicalScience
(chemistry/physics)
Other
83 (2.6)
55 (3.5)
71 (4.0)
17 (3.6)– –
92 (2.6)
53 (4.6)
34 (4.4)
0 (0.0)64 (4.6)
30 (4.1)
49 (4.0)
100 (0.0)
94 (1.7)88 (2.7)
69 (4.1)
48 (5.0)
81 (3.2)
8 (2.4)
74 (3.1)
41 (4.7)
58 (0.8)
0 (0.3)
14 (2.3)
1 (0.9)
1 (1.3)– –
0 (0.0)
0 (0.0)
1 (0.0)
20 (3.2)1 (1.0)
3 (1.4)
2 (1.0)
0 (0.0)
1 (0.5)6 (2.1)
0 (0.0)
1 (0.8)
7 (2.0)
8 (2.1)
0 (0.3)
28 (4.8)
5 (0.4)
5 (1.6)
6 (1.7)
22 (3.4)
17 (3.2)– –
3 (1.5)
13 (2.7)
21 (3.9)
49 (3.9)7 (2.4)
12 (3.0)
10 (2.0)
0 (0.0)
2 (0.9)3 (1.2)
5 (2.0)
7 (2.5)
4 (1.6)
81 (3.4)
3 (1.3)
5 (1.5)
14 (0.5)
1 (0.4)
1 (0.7)
1 (0.9)
39 (4.5)– –
0 (0.0)
14 (3.1)
3 (1.3)
13 (2.6)6 (2.1)
19 (3.5)
5 (1.6)
0 (0.0)
1 (0.6)0 (0.0)
4 (1.8)
8 (2.8)
1 (0.8)
1 (0.0)
8 (2.1)
2 (0.8)
6 (0.4)
4 (1.3)
1 (0.6)
0 (0.0)
13 (2.6)– –
1 (0.0)
3 (1.4)
7 (2.5)
3 (1.2)11 (2.7)
14 (3.2)
5 (1.7)
0 (0.0)
0 (0.0)1 (0.8)
7 (2.3)
5 (2.3)
3 (1.3)
0 (0.0)
2 (1.0)
3 (1.0)
4 (0.4)
Australia
Canada
Chile
CyprusEngland
Hong Kong, SAR
Iran, Islamic Rep.
Israel
ItalyJapan
Jordan
Korea, Rep. of
Malaysia
New ZealandPhilippines
Singapore
South Africa
Thailand
Tunisia
Turkey
United States
International Avg.
2 (0.7)
19 (2.7)
2 (1.1)
6 (2.3)– –
4 (1.9)
16 (2.9)
28 (4.5)
11 (2.6)6 (2.1)
21 (3.6)
26 (3.2)
0 (0.0)
2 (1.6)2 (1.2)
11 (2.5)
31 (4.0)
3 (1.4)
0 (0.0)
11 (2.7)
21 (3.1)
11 (0.6)
4 (1.2)
3 (1.2)
2 (1.2)
6 (2.8)– –
0 (0.0)
1 (0.8)
6 (2.1)
3 (1.4)5 (1.9)
1 (0.8)
4 (1.6)
0 (0.0)
1 (0.6)1 (0.0)
4 (1.6)
1 (0.9)
1 (1.0)
3 (1.5)
2 (0.9)
1 (0.4)
2 (0.3)
177The Science Curriculum
SOU
RCE:
IEA
Thi
rd In
tern
atio
nal M
athe
mat
ics
and
Scie
nce
Stud
y (T
IMSS
), 19
98-1
999.
5.9
Exhibit 5.9 Subject Matter Emphasized Most in General/Integrated Science Class

2 3 4 5 6 7178 Chapter 1
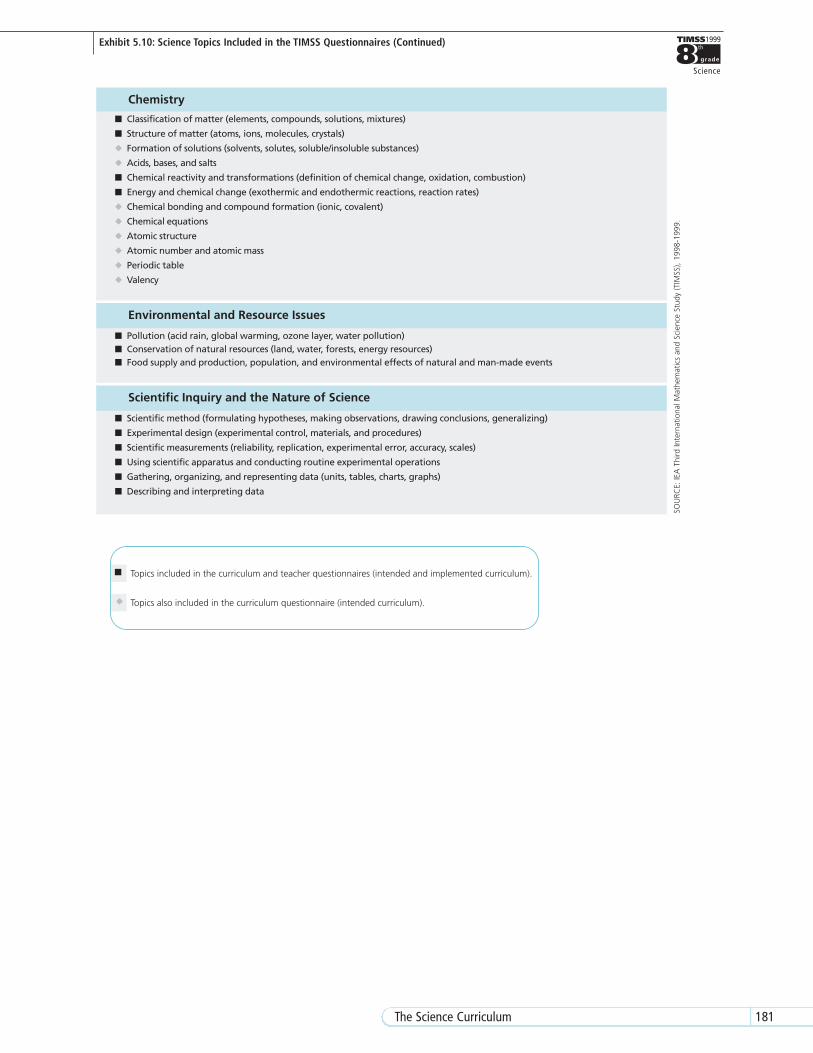
What Science Topics Are Included in the Intended Curriculum?
In the course of their meetings on planning and implementation of timss1999, the National Research Coordinators developed a list of science top-ics that they agreed covered most of the content in the intended sciencecurriculum in their respective countries. This list of topics, presented inExhibit 5.10, built on the topics covered in the timss 1995 science testand included in the teacher questionnaire. It represents a comprehensivelist of the topics likely to have been included in the curricula of the par-ticipating countries up to and including eighth grade. From the followingchoices, the National Research Coordinators indicated the percentage ofstudents in their own countries expected to have been taught each topic:
• All or almost all students (at least 90 percent)
• About half of the students
• Only the more able students (top track – about 25 percent)
• Only the most advanced students (10 percent or less)
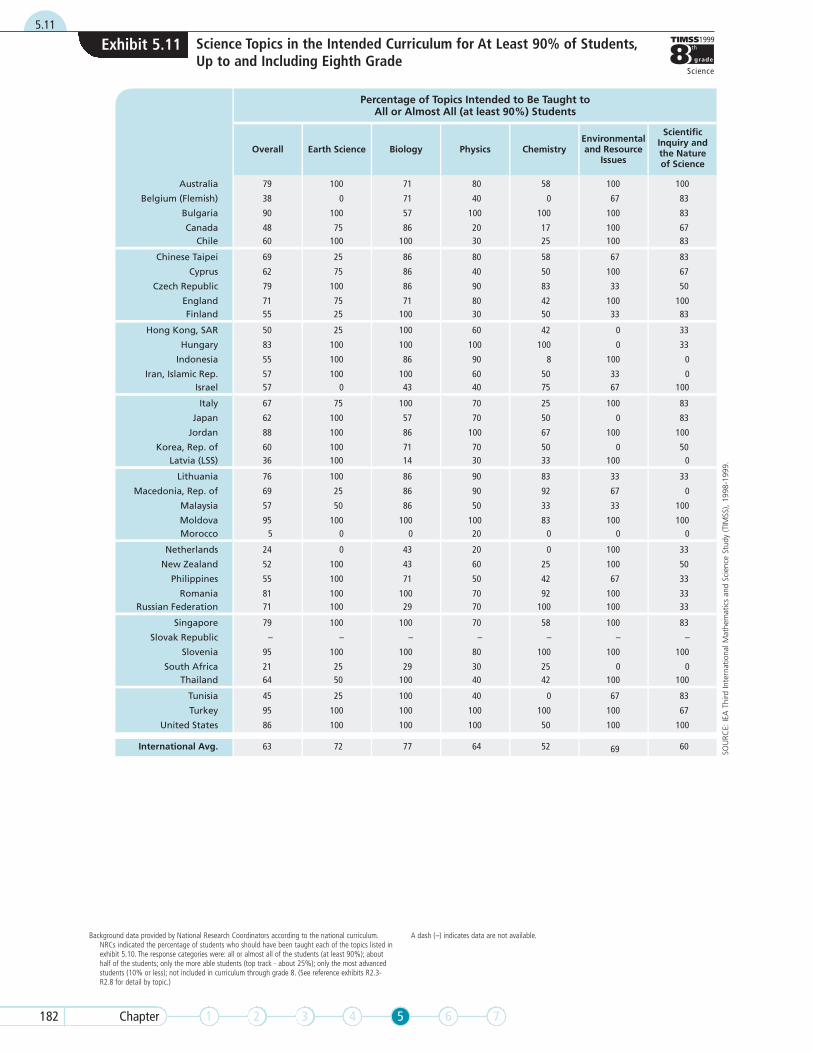
Exhibit 5.11 summarizes the data according to the percentage of topicsintended to be taught to all or almost all students (at least 90 percent) ineach country, across the entire list of topics and for each content area.There was marked variation between content areas and between coun-tries. In 21 countries it was intended that all, or nearly all, students betaught all of the earth science topics. All environmental and resourceissues topics were intended to be taught to practically all students in 20countries, while in six countries none of these topics were intended for allor almost all students. On average, biology topics were most likely, andchemistry topics least likely, to have been included in the intended curric-ula up to and including eighth grade.
In four countries – Moldova, Slovenia, Turkey, and the United States – itwas intended that all of the topics in five content areas and some in thesixth be taught to all students. On the other hand, intended curricula inBelgium (Flemish), Chinese Taipei, Macedonia, Morocco, and SouthAfrica included no content area in which all topics were to be taught to allstudents. Information on specific topics in the intended curricula for eachcontent area is presented in Exhibits R2.3 through R2.8 in the referencesection of this report.
It should be noted that some countries reported having different curricu-la or different levels of curriculum for different groups of students, asdetailed in Exhibit 5.7. Not surprisingly, then, these countries oftenreported that about half, only the more able (25 percent), or the top 10
5.10
R2.3-R2.8
5.11

179The Science Curriculum
percent of students were expected to have been taught substantial per-centages of the topics. In addition, if content within a topic arearequired different responses, National Research Coordinators chosethe response that best represented the entire topic area and noted thediscrepancy (see Exhibit A.11 in the appendix for details).

�
�
�
�
Biology
�
�
�
�
�
�
�
�
�
�
�
�
�
�
�
�
�
Earth processes and history (weather and climate, physical cycles, plate tectonics, fossils)
Physical properties and physical changes of matter (weight, mass, states of matter, boiling, freezing)
Subatomic particles (protons, electrons, neutrons)
Energy types, sources, and conversions (chemical, kinetic, electric, light energy; work and efficiency)
Buoyancy
Physics
Earth in the solar system and the universe (interactions between Earth, sun, and moon;relationship to planets and stars)
Photosynthesis
Light (reflection, refraction, light and color)
Electricity and magnetism (circuits, conductivity, magnets)
Gas laws (relationship between temperature/pressure/volume)
Earth's physical features (layers, landforms, bodies of water, rocks, soil)
Earth Science
Earth's atmosphere (layers, composition, temperature, pressure)
Human body - structure and function of organs and systems
Human bodily processes (metabolism, respiration, digestion)
Reproduction, genetics, evolution, and speciation
Human nutrition, health, and disease
Biology of plant and animal life (diversity, structure, life processes, life cycles)
Interactions of living things (biomes and ecosystems, interdependence)
Forces and motion (types of forces, balanced/unbalanced forces, fluid behavior, speed, acceleration)
Heat and temperature
Wave phenomena, sound, and vibration
�
� Topics also included in the curriculum questionnaire (intended curriculum).
Topics included in the curriculum and teacher questionnaires (intended and implemented curriculum).
SOU
RCE:
IEA
Thi
rd In
tern
atio
nal M
athe
mat
ics
and
Scie
nce
Stud
y (T
IMSS
), 19
98-1
999.
Exhibit 5.105.10
Science Topics Included in the TIMSS Questionnaires
2 3 4 5 6 7180 Chapter 1
�
� Topics also included in the curriculum questionnaire (intended curriculum).
Topics included in the curriculum and teacher questionnaires (intended and implemented curriculum).
Chemistry
�
�
�
�
�
�
�
�
�
�
�
�
�
�
�
�
�
�
�
�
�
Valency
Gathering, organizing, and representing data (units, tables, charts, graphs)
Describing and interpreting data
Experimental design (experimental control, materials, and procedures)
Scientific measurements (reliability, replication, experimental error, accuracy, scales)
Using scientific apparatus and conducting routine experimental operations
Food supply and production, population, and environmental effects of natural and man-made events
Formation of solutions (solvents, solutes, soluble/insoluble substances)
Acids, bases, and salts
Periodic table
Chemical bonding and compound formation (ionic, covalent)
Chemical equations
Atomic structure
Atomic number and atomic mass
Environmental and Resource Issues
Pollution (acid rain, global warming, ozone layer, water pollution)
Classification of matter (elements, compounds, solutions, mixtures)
Structure of matter (atoms, ions, molecules, crystals)
Chemical reactivity and transformations (definition of chemical change, oxidation, combustion)
Energy and chemical change (exothermic and endothermic reactions, reaction rates)
Scientific Inquiry and the Nature of Science
Scientific method (formulating hypotheses, making observations, drawing conclusions, generalizing)
Conservation of natural resources (land, water, forests, energy resources)
181The Science Curriculum
SOU
RCE:
IEA
Thi
rd In
tern
atio
nal M
athe
mat
ics
and
Scie
nce
Stud
y (T
IMSS
), 19
98-1
999.
Exhibit 5.10: Science Topics Included in the TIMSS Questionnaires (Continued)
Background data provided by National Research Coordinators according to the national curriculum.NRCs indicated the percentage of students who should have been taught each of the topics listed inexhibit 5.10. The response categories were: all or almost all of the students (at least 90%); abouthalf of the students; only the more able students (top track - about 25%); only the most advancedstudents (10% or less); not included in curriculum through grade 8. (See reference exhibits R2.3-R2.8 for detail by topic.)
A dash (–) indicates data are not available.
Overall Earth Science Biology Physics ChemistryEnvironmentaland Resource
Issues
ScientificInquiry andthe Natureof Science
Australia
Belgium (Flemish)
Bulgaria
CanadaChile
Chinese Taipei
Cyprus
Czech Republic
EnglandFinland
Hong Kong, SAR
Hungary
Indonesia
Iran, Islamic Rep.Israel
Italy
Japan
Jordan
Korea, Rep. ofLatvia (LSS)
Lithuania
Macedonia, Rep. of
Malaysia
MoldovaMorocco
Netherlands
New Zealand
Philippines
RomaniaRussian Federation
Singapore
Slovak Republic
Slovenia
South AfricaThailand
Tunisia
Turkey
United States
International Avg.
Percentage of Topics Intended to Be Taught toAll or Almost All (at least 90%) Students
79
38
90
4860
69
62
79
7155
50
83
55
5757
67
62
88
6036
76
69
57
955
24
52
55
8171
79
–
95
2164
45
95
86
63
100
0
100
75100
25
75
100
7525
25
100
100
1000
75
100
100
100100
100
25
50
1000
0
100
100
100100
100
–
100
2550
25
100
100
72
71
71
57
86100
86
86
86
71100
100
100
86
10043
100
57
86
7114
86
86
86
1000
43
43
71
10029
100
–
100
29100
100
100
100
77
80
40
100
2030
80
40
90
8030
60
100
90
6040
70
70
100
7030
90
90
50
10020
20
60
50
7070
70
–
80
3040
40
100
100
64
58
0
100
1725
58
50
83
4250
42
100
8
5075
25
50
67
5033
83
92
33
830
0
25
42
92100
58
–
100
2542
0
100
50
52
100
67
100
100100
67
100
33
10033
0
0
100
3367
100
0
100
0100
33
67
33
1000
100
100
67
100100
100
–
100
0100
67
100
100
69
100
83
83
6783
83
67
50
10083
33
33
0
0100
83
83
100
500
33
0
100
1000
33
50
33
3333
83
–
100
0100
83
67
100
60
SOU
RCE:
IEA
Thi
rd In
tern
atio
nal M
athe
mat
ics
and
Scie
nce
Stud
y (T
IMSS
), 19
98-1
999.
Exhibit 5.115.11
Science Topics in the Intended Curriculum for At Least 90% of Students,Up to and Including Eighth Grade
2 3 4 5 6 7182 Chapter 1
183The Science Curriculum
Have Students Been Taught the Topics Tested by TIMSS?
In interpreting the achievement results, it is important to consider howextensively the topics tested are taught in the participating countries.As shown in Exhibits 5.12 through 5.17, the six major science contentareas assessed in timss 1999 were represented by 31 topic areas. Foreach area, teachers indicated whether their students had been taughtthe topics before this year, one to five periods this year, more than fiveperiods this year; whether the topics had not yet been taught; orwhether the teacher did not know. Exhibits 5.12 through 5.17 show thepercentages of students in each country reported to have been taughteach topic before or during the year of the testing.
Although the international average percentage of students whose teach-ers reported that earth science topics (see Exhibit 5.12) were taughtbefore or during the year of testing was greater than 70 percent for eachtopic, countries varied greatly in topic coverage. For example, in 19countries at least 80 percent of students had been taught about “earth’sphysical features,” but in two countries (Hong Kong and Japan) fewerthan 20 percent of the students were reported to have been taught thistopic. Topics from this content area may be taught in subjects other thanscience in some countries, so the percentage of students having beentaught these topics may be underestimated for a few countries.
With the exception of “reproduction, genetics, evolution, and specia-tion,” biology topics (see Exhibit 5.13) had been taught to the greatmajority of students in most countries. Teachers in nine countriesreported that 80 percent or more of their students were taught all ofthe biology topics. In comparison, teachers in four countries – Canada,Finland, South Africa and Tunisia – reported that less than 55 percentof their students were taught four of the six topics.
Of the physics topics (see Exhibit 5.14), “physical properties and thephysical changes of matter” had the greatest coverage, with 91 percentof students, on average internationally, having been taught this topic.Lowest was “wave phenomena, sound, and vibration,” with an interna-tional average of 52 percent. At the extremes were the Netherlands,where all students were reported to have been taught all of the physicstopics, and Tunisia, where very small percentages of students had beentaught any of them.
Instructional coverage was high for three of the four chemistry topics(see Exhibit 5.15), but only 58 percent of students, internationally onaverage, were taught “energy and chemical change.” Teachers in 12countries, including high-performing Chinese Taipei, Hungary, Korea,
5.12
5.13
5.14
5.15

2 3 4 5 6 7184 Chapter 1
and the Netherlands, reported having taught “classification of matter”and “structure of matter” to 97 percent or more of their students. Most ofthese countries reported that over 90 percent of their students weretaught “chemical reactivity and transformations” as well. Furthermore, inboth Hungary and the Netherlands, 97 percent or more of the studentswere reported to have been taught all the topic areas. In contrast, inBelgium (Flemish) and Tunisia, teachers reported that fewer than 15 per-cent of their students were taught each of the chemistry topic areas.
Most students in most countries were taught environmental and resourceissues topics (see Exhibit 5.16), especially “pollution” and “conservation,”with 21 countries teaching these topics to 75 percent or more of their stu-dents. One country, Japan, reported teaching fewer than 30 percent oftheir students each of the topics in this area.
Each of the scientific inquiry and the nature of science topics (seeExhibit 5.17) was taught to 75 percent or more of the students, on aver-age internationally. Ninety percent or more of the students in four coun-tries – England, the Netherlands, Romania, and Singapore – were taughtall six topic areas. Teachers in all countries taught each topic to morethan 60 percent of their students except in seven countries: Belgium(Flemish), Iran, Israel, Jordan, South Africa, Tunisia, and Turkey.
5.16
5.17

r r r r
r r r r
r r r
s s s sr
1
s s s s
s s s sr r
s r s s
Italy
s r s r‡
r
r
r
s s s
r r
r r r r
Earth's physicalfeatures (layers,
landforms, bodies ofwater, rocks, soil)
Earth processesand history (weatherand climate, physicalcycle, plate tectonics,
fossils)
Earth in the solarsystem and the
universe (interactionsbetween earth, sun,
and moon; relationshipto planets and stars)
Earth's atmosphere(layers, composition,
temperature,pressure)
Australia
Belgium (Flemish)
Bulgaria
CanadaChile
Chinese Taipei
Cyprus
Czech Republic
EnglandFinland
Hong Kong, SAR
Hungary
Indonesia
Iran, Islamic Rep.Israel
Japan
Jordan
Korea, Rep. ofLatvia (LSS)
Lithuania
Macedonia, Rep. of
Malaysia
MoldovaMorocco
Netherlands
New Zealand
Philippines
RomaniaRussian Federation
Singapore
South Africa
Thailand
Tunisia
Turkey
United States
International Avg.
73 (3.4)
93 (3.0)
99 (0.6)
91 (1.9)95 (1.5)
– –
45 (6.6)
99 (0.4)
86 (4.0)65 (4.0)
17 (3.2)
83 (3.1)
98 (1.2)
95 (2.4)x x
82 (2.9)
6 (2.2)
98 (1.1)
91 (2.4)92 (3.1)
– –
88 (2.9)
32 (4.1)
– –– –
76 (5.6)
40 (3.9)
99 (0.6)
100 (0.0)– –
x x
72 (5.2)
99 (0.7)
82 (3.5)
42 (3.7)
87 (2.5)
77 (0.6)
65 (3.5)
45 (4.3)
99 (0.6)
83 (2.1)95 (1.8)
– –
38 (6.0)
98 (1.2)
64 (3.9)38 (4.0)
61 (5.0)
72 (3.9)
97 (1.5)
72 (4.4)x x
95 (1.5)
74 (3.7)
84 (3.4)
98 (1.2)83 (4.0)
– –
88 (2.2)
32 (3.9)
– –– –
91 (2.7)
45 (3.9)
98 (1.1)
100 (0.0)– –
x x
68 (5.9)
63 (3.8)
12 (3.0)
60 (4.0)
84 (2.7)
73 (0.6)
67 (3.4)
64 (5.2)
99 (0.6)
86 (2.3)81 (2.9)
– –
39 (5.6)
97 (1.7)
71 (3.5)62 (3.5)
17 (4.0)
88 (2.8)
88 (3.1)
69 (3.7)x x
81 (3.2)
39 (4.1)
88 (3.1)
95 (1.5)78 (4.6)
– –
86 (2.6)
14 (3.0)
– –– –
92 (4.1)
40 (3.9)
98 (1.0)
99 (1.0)– –
x x
x x
95 (1.8)
16 (3.4)
37 (4.2)
92 (2.0)
71 (0.6)
80 (3.3)
16 (3.4)
99 (0.8)
80 (3.1)94 (1.9)
– –
88 (3.6)
98 (1.2)
90 (3.6)45 (4.1)
15 (3.8)
79 (3.8)
97 (1.5)
68 (3.9)x x
70 (3.6)
99 (0.7)
82 (3.7)
52 (4.0)86 (3.4)
– –
85 (2.4)
16 (3.2)
– –– –
82 (4.8)
63 (3.5)
74 (3.8)
99 (0.8)– –
x x
62 (6.0)
88 (2.6)
4 (1.9)
73 (3.4)
84 (2.3)
71 (0.6)
185The Science Curriculum
SOU
RCE:
IEA
Thi
rd In
tern
atio
nal M
athe
mat
ics
and
Scie
nce
Stud
y (T
IMSS
), 19
98-1
999.
5.12
Exhibit 5.12 Percentages of Students Taught Earth Science Topics*
Background data provided by teachers.
* Taught before or during this school year.
‡ Lithuania tested the same cohort of students as other countries, but later in 1999, at the beginningof the next school year.
1 Data for grade 9 earth science teachers not available.
Science teacher background data for Slovak Republic and Slovenia are unavailable.
( ) Standard errors appear in parentheses. Because results are rounded to the nearest whole number,some totals may appear inconsistent.
A dash (–) indicates data are not available.
An “r” indicates teacher response data available for 70-84% of students. An “s” indicates teacherresponse data available for 50-69% of students. An “x” indicates teacher response data available for<50% of students.

r r r r r r
r r
r r r
s s s s s s
1
r 100 r r s r r
s s s s s s
r r r r
100
r r r r r r
r
‡
r 100 r r r r r
r r
r s s r r r
r r r r r r
Human body -structure andfunction oforgans and
systems
Interactions ofliving things
(biomes,ecosystems, andinterdependence)
Reproduction,genetics,
evolution, andspeciation
Human bodilyprocesses
(metabolism,respiration,digestion)
Humannutrition, health,
and disease
Biology ofplant and animal
life (diversity,structure, life
processes,life cycles)
Australia
Belgium (Flemish)
Bulgaria
CanadaChile
Chinese Taipei
Cyprus
Czech Republic
EnglandFinland
Hong Kong, SAR
Hungary
Indonesia
Iran, Islamic Rep.Israel
Italy
JapanJordan
Korea, Rep. ofLatvia (LSS)
Lithuania
Macedonia, Rep. of
Malaysia
MoldovaMorocco
Netherlands
New Zealand
Philippines
RomaniaRussian Federation
Singapore
South Africa
Thailand
Tunisia
Turkey
United States
International Avg.
80 (3.3)
98 (1.0)
94 (3.4)
54 (3.0)95 (1.8)
– –
(0.0)
99 (0.4)
96 (1.9)30 (4.0)
79 (3.8)
93 (2.2)
(0.0)
99 (0.7)77 (3.6)
99 (0.9)
97 (1.7)96 (2.0)
91 (2.2)49 (4.4)
– –
99 (0.8)
96 (1.8)
– –– –
(0.0)
58 (4.1)
46 (4.0)
99 (0.6)– –
97 (1.5)
43 (5.4)
93 (2.3)
53 (4.1)
93 (2.9)
90 (2.6)
84 (0.5)
75 (3.1)
100 (0.0)
94 (3.4)
49 (3.6)93 (2.1)
– –
100 (0.0)
99 (0.5)
99 (0.8)28 (3.5)
76 (3.6)
94 (2.1)
99 (1.1)
99 (0.8)57 (3.9)
99 (0.9)
96 (1.8)98 (1.1)
92 (2.2)46 (4.3)
– –
99 (1.0)
93 (2.1)
– –– –
100 (0.0)
55 (4.4)
61 (4.1)
99 (0.6)– –
97 (1.6)
44 (5.6)
94 (2.0)
49 (4.6)
93 (2.6)
90 (2.1)
83 (0.5)
75 (3.3)
100 (0.0)
95 (3.3)
54 (3.8)94 (1.7)
– –
100 (0.0)
98 (1.1)
95 (2.5)28 (3.5)
30 (4.7)
90 (2.6)
58 (4.5)
98 (1.0)36 (4.4)
97 (0.9)
82 (3.3)90 (2.9)
87 (2.8)67 (4.2)
– –
98 (1.1)
96 (1.7)
– –– –
100 (0.0)
55 (4.2)
65 (4.4)
98 (1.3)– –
97 (1.8)
49 (5.3)
87 (2.7)
51 (4.3)
86 (3.4)
91 (2.2)
79 (0.6)
84 (2.7)
91 (2.6)
96 (2.2)
70 (3.2)96 (1.2)
– –
82 (4.1)
96 (2.1)
91 (3.2)90 (2.6)
69 (4.6)
99 (1.0)
100 (0.3)
91 (2.5)66 (3.9)
100 (0.0)
86 (3.0)87 (3.3)
76 (3.7)98 (1.3)
– –
96 (1.6)
75 (4.0)
– –– –
100 (0.0)
85 (3.0)
63 (3.9)
99 (1.2)– –
86 (3.8)
80 (4.1)
79 (3.2)
92 (2.4)
92 (2.0)
92 (1.9)
87 (0.5)
67 (3.9)
85 (3.7)
65 (6.8)
77 (2.7)99 (1.0)
– –
40 (4.5)
73 (4.4)
84 (4.2)92 (2.4)
57 (4.9)
89 (2.3)
98 (1.2)
78 (3.5)40 (4.3)
89 (2.4)
15 (3.2)82 (3.8)
57 (4.3)90 (2.9)
– –
90 (2.7)
88 (2.8)
– –– –
100 (0.0)
65 (4.2)
83 (2.7)
96 (1.9)– –
69 (4.4)
85 (3.0)
83 (3.5)
58 (4.1)
96 (1.4)
90 (2.0)
77 (0.6)
39 (3.8)
94 (2.2)
36 (5.2)
45 (3.7)92 (2.2)
– –
30 (4.1)
57 (5.4)
80 (3.6)21 (3.4)
61 (4.6)
87 (2.8)
50 (4.4)
95 (1.8)76 (3.3)
87 (2.9)
8 (2.5)61 (5.1)
54 (4.3)49 (4.8)
– –
90 (2.7)
15 (2.9)
– –– –
99 (0.9)
28 (3.3)
44 (4.4)
96 (1.6)– –
92 (2.7)
49 (5.6)
91 (2.8)
24 (3.4)
63 (3.9)
83 (2.8)
61 (0.7)SO
URC
E: IE
A T
hird
Inte
rnat
iona
l Mat
hem
atic
s an
d Sc
ienc
e St
udy
(TIM
SS),
1998
-199
9.
Exhibit 5.135.13
Percentages of Students Taught Biology Topics*
2 3 4 5 6 7186 Chapter 1
Background data provided by teachers.
* Taught before or during this school year.
‡ Lithuania tested the same cohort of students as other countries, but later in 1999, at the beginningof the next school year.
1 Data for grade 7 biology teachers not available.
Science teacher background data for Slovak Republic and Slovenia are unavailable.
( ) Standard errors appear in parentheses. Because results are rounded to the nearest whole number,some totals may appear inconsistent.
A dash (–) indicates data are not available.
An “r” indicates teacher response data available for 70-84% of students. An “s” indicates teacherresponse data available for 50-69% of students.

r r r r r r r r
s s s s s s s s
r r r r r r r r
r s r r s s s sr r r
r r r r s s s s
s s s s s s s s
r r r r r
rr r r r r r
‡
r r r r
r
s r
r r r r r
r r r r r r r r
s s s s s s s sr
r r r r r r r r
Wavephenomena,sound, andvibration
Heat andtemperature
Energy types,sources, andconversions(chemical,
kinetic, electric,light energy;
work andefficiency)
Subatomicparticles(protons,electrons,neutrons)
Physicalproperties and
physical changesof matter
(weight, mass,states of matter,
boiling,freezing)
Forces andmotion (types
of forces,balanced/unbal
anced forces,fluid behavior,
speed,acceleration)
Electricity andmagnetismLight
45 (4.0)
33 (4.5)
96 (1.9)
56 (3.1)52 (3.7)
29 (3.5)
12 (3.9)
100 (0.2)
98 (1.1)51 (3.6)
41 (4.9)
98 (1.2)
85 (3.6)
69 (3.8)19 (3.8)
85 (2.9)
20 (3.1)
99 (0.8)
87 (2.6)71 (4.5)
– –
97 (0.9)
76 (3.5)
– –– –
100 (0.0)
51 (4.2)
85 (2.8)
98 (1.1)– –
82 (4.2)
39 (5.2)
26 (4.4)
13 (3.4)99 (0.6)
75 (3.4)
65 (0.6)
72 (3.2)
38 (4.3)
97 (1.4)
48 (3.3)57 (4.1)
20 (3.2)
20 (4.5)
71 (4.8)
97 (1.8)35 (4.1)
83 (3.5)
97 (1.5)
60 (4.5)
97 (1.2)76 (4.1)
55 (3.9)
90 (2.6)
88 (2.9)
96 (1.7)8 (2.5)
– –
98 (1.1)
36 (4.3)
– –– –
100 (0.0)
34 (4.0)
63 (4.6)
98 (1.5)– –
92 (2.6)
89 (2.5)
49 (5.0)
12 (3.6)96 (1.8)
70 (3.2)
67 (0.6)
48 (4.4)
31 (4.0)
84 (6.9)
50 (4.0)61 (4.8)
89 (2.6)
88 (3.4)
81 (4.1)
98 (1.1)17 (3.2)
50 (5.2)
58 (4.0)
90 (2.4)
97 (1.5)11 (3.2)
38 (4.0)
99 (1.3)
98 (1.1)
41 (4.0)90 (2.2)
– –
92 (2.3)
89 (2.6)
– –– –
100 (0.0)
69 (4.0)
70 (4.4)
98 (1.2)– –
99 (0.8)
35 (4.4)
27 (4.4)
9 (3.1)93 (2.4)
67 (3.3)
68 (0.6)
39 (4.1)
5 (2.1)
87 (3.3)
35 (3.8)52 (4.3)
79 (3.1)
11 (3.9)
10 (3.1)
82 (3.6)44 (3.7)
58 (4.6)
87 (3.1)
90 (2.4)
48 (4.8)7 (2.6)
44 (4.0)
99 (1.3)
97 (1.4)
33 (3.9)83 (3.4)
– –
19 (3.8)
87 (2.6)
– –– –
100 (0.0)
24 (3.3)
58 (4.7)
16 (3.5)– –
85 (3.4)
27 (4.3)
34 (4.2)
6 (2.5)46 (4.5)
65 (3.8)
52 (0.6)
76 (3.3)
54 (5.4)
97 (1.3)
91 (2.1)96 (1.4)
93 (2.3)
100 (0.0)
98 (1.3)
92 (2.8)49 (4.0)
84 (3.2)
97 (1.5)
91 (2.5)
96 (1.2)35 (4.0)
95 (1.5)
99 (0.9)
94 (2.4)
85 (3.1)77 (3.9)
– –
97 (1.5)
80 (3.4)
– –– –
100 (0.0)
78 (3.3)
89 (2.6)
99 (0.7)– –
99 (0.9)
56 (4.9)
60 (4.6)
15 (4.0)100 (0.0)
82 (3.0)
83 (0.5)
71 (3.2)
35 (4.7)
98 (1.0)
82 (2.6)92 (2.2)
47 (4.3)
96 (2.5)
94 (2.4)
96 (1.7)14 (2.8)
87 (3.4)
100 (0.2)
85 (3.4)
100 (0.0)40 (4.7)
77 (3.1)
15 (3.5)
92 (2.2)
63 (4.3)71 (4.1)
– –
98 (1.3)
81 (3.6)
– –– –
100 (0.0)
78 (3.4)
94 (2.0)
96 (1.8)– –
97 (1.6)
75 (3.7)
53 (4.9)
7 (2.6)98 (1.4)
76 (3.4)
75 (0.5)
80 (3.2)
8 (2.9)
89 (2.9)
44 (3.4)85 (3.0)
98 (1.0)
28 (5.4)
96 (2.0)
66 (4.1)83 (3.0)
34 (4.9)
92 (2.3)
79 (3.7)
99 (0.9)89 (2.6)
89 (2.6)
43 (4.1)
99 (0.8)
66 (4.1)55 (4.4)
– –
95 (2.1)
29 (4.1)
– –– –
100 (0.0)
74 (3.6)
77 (3.5)
91 (2.5)– –
80 (4.5)
48 (4.5)
76 (4.1)
3 (1.8)96 (1.9)
86 (2.6)
71 (0.6)
91 (2.4)
58 (5.3)
97 (1.7)
97 (1.3)96 (1.7)
98 (1.0)
100 (0.0)
96 (2.1)
97 (1.4)80 (3.4)
87 (3.4)
98 (1.2)
93 (2.2)
100 (0.0)94 (1.9)
98 (1.2)
100 (0.0)
99 (0.8)
95 (1.9)98 (1.2)
– –
98 (1.2)
83 (3.4)
– –– –
100 (0.0)
94 (1.9)
95 (1.8)
100 (0.0)– –
96 (1.8)
88 (2.8)
76 (4.2)
9 (3.1)99 (0.5)
93 (1.7)
91 (0.4)
Australia
Belgium (Flemish)
Bulgaria
CanadaChile
Chinese Taipei
Cyprus
Czech Republic
EnglandFinland
Hong Kong, SAR
Hungary
Indonesia
Iran, Islamic Rep.Israel
Italy
Japan
Jordan
Korea, Rep. ofLatvia (LSS)
Lithuania
Macedonia, Rep. of
Malaysia
MoldovaMorocco
Netherlands
New Zealand
Philippines
RomaniaRussian Federation
Singapore
South Africa
Thailand
TunisiaTurkey
United States
International Avg.
187The Science Curriculum
SOU
RCE:
IEA
Thi
rd In
tern
atio
nal M
athe
mat
ics
and
Scie
nce
Stud
y (T
IMSS
), 19
98-1
999.
5.14
Exhibit 5.14 Percentages of Students Taught Physics Topics*
Background data provided by teachers.
* Taught before or during this school year.
‡ Lithuania tested the same cohort of students as other countries, but later in 1999, at the beginningof the next school year.
Science teacher background data for Slovak Republic and Slovenia are unavailable.
( ) Standard errors appear in parentheses. Because results are rounded to the nearest whole number,some totals may appear inconsistent.
A dash (–) indicates data are not available.
An “r” indicates teacher response data available for 70-84% of students. An “s” indicates teacherresponse data available for 50-69% of students.

r r r
s s s s
r
r s s sr
r r r r
s s s s
r r r
r
‡
r r r r
r
r
r r
s s s s
r r r r
Classification ofmatter (elements,
compounds,solutions, mixtures)
Energy andchemical change(exothermic and
endothermicreactions, reaction
rates)
Chemical reactivityand transformations
(definition ofchemical change,
oxidation,combustion)
Structure of matter(atoms, ions,
molecules, crystals)
Australia
Belgium (Flemish)
Bulgaria
CanadaChile
Chinese Taipei
Cyprus
Czech Republic
EnglandFinland
Hong Kong, SAR
Hungary
Indonesia
Iran, Islamic Rep.Israel
Italy
Japan
Jordan
Korea, Rep. ofLatvia (LSS)
Lithuania
Macedonia, Rep. of
Malaysia
MoldovaMorocco
Netherlands
New Zealand
Philippines
RomaniaRussian Federation
Singapore
South Africa
Thailand
Tunisia
Turkey
United States
International Avg.
42 (3.8)
4 (1.9)
87 (2.8)
36 (3.6)83 (3.2)
84 (2.9)
53 (4.9)
53 (5.3)
73 (4.7)51 (3.6)
71 (4.8)
99 (1.0)
x x
66 (4.8)29 (4.0)
58 (4.0)
46 (4.2)
62 (4.5)
51 (3.8)54 (4.8)
– –
87 (3.0)
39 (4.3)
– –– –
99 (0.8)
35 (3.6)
72 (3.8)
36 (4.9)– –
x x
43 (4.5)
52 (4.3)
1 (1.1)
95 (1.8)
66 (3.9)
58 (0.7)
65 (4.1)
8 (3.0)
99 (0.5)
54 (4.2)86 (3.0)
100 (0.0)
68 (4.4)
92 (3.0)
94 (2.1)79 (2.7)
57 (5.0)
97 (1.4)
x x
97 (1.1)62 (4.1)
78 (3.6)
96 (1.7)
98 (1.1)
91 (2.3)89 (2.6)
– –
99 (0.7)
57 (4.4)
– –– –
99 (0.9)
61 (4.1)
83 (3.2)
84 (4.0)– –
89 (2.9)
65 (4.0)
51 (4.8)
3 (1.8)
94 (2.1)
76 (3.4)
76 (0.6)
89 (2.6)
8 (2.6)
99 (1.1)
63 (3.1)90 (2.1)
97 (1.4)
80 (4.2)
100 (0.0)
84 (4.1)89 (2.6)
66 (4.6)
100 (0.0)
x x
97 (1.6)94 (2.2)
91 (2.0)
75 (3.6)
99 (0.9)
97 (1.4)99 (0.9)
– –
99 (0.9)
71 (3.7)
– –– –
99 (0.9)
89 (2.6)
87 (2.7)
99 (0.7)– –
93 (2.5)
72 (3.5)
86 (3.5)
1 (0.9)
96 (1.9)
88 (2.6)
84 (0.4)
98 (1.1)
13 (2.9)
99 (0.8)
80 (2.3)95 (1.8)
100 (0.0)
95 (1.7)
100 (0.0)
98 (1.7)95 (1.7)
90 (2.7)
100 (0.0)
x x
100 (0.0)95 (2.1)
95 (1.8)
99 (1.2)
99 (0.6)
99 (0.8)99 (0.9)
– –
98 (1.0)
82 (3.2)
– –– –
99 (1.0)
96 (1.5)
92 (2.2)
100 (0.0)– –
98 (1.3)
96 (1.8)
86 (3.6)
9 (3.1)
97 (1.5)
88 (2.2)
90 (0.3) SOU
RCE:
IEA
Thi
rd In
tern
atio
nal M
athe
mat
ics
and
Scie
nce
Stud
y (T
IMSS
), 19
98-1
999.
Exhibit 5.155.15
Percentages of Students Taught Chemistry Topics*
2 3 4 5 6 7188 Chapter 1
Background data provided by teachers.
* Taught before or during this school year.
‡ Lithuania tested the same cohort of students as other countries, but later in 1999, at the beginningof the next school year.
Science teacher background data for Slovak Republic and Slovenia are unavailable.
( ) Standard errors appear in parentheses. Because results are rounded to the nearest whole number,some totals may appear inconsistent.
A dash (–) indicates data are not available.
An “r” indicates teacher response data available for 70-84% of students. An “s” indicates teacherresponse data available for 50-69% of students. An “x” indicates teacher response data available for<50% of students.

r r r
r r r
s s s
s s s
r r r
s s s
s s s
r r
r s r
r
r r r‡
r r r
r
r
r s
s s s
r r r
r r s
Pollution (acid rain,global warming, ozonelayer, water pollution)
Food supply andproduction, population,
and environmentaleffects of natural and
man-made events
Conservation of naturalresources (land, water
forests, energy sources)
Australia
Belgium (Flemish)
Bulgaria
CanadaChile
Chinese Taipei
Cyprus
Czech Republic
EnglandFinland
Hong Kong, SAR
Hungary
Indonesia
Iran, Islamic Rep.Israel
Italy
Japan
Jordan
Korea, Rep. ofLatvia (LSS)
Lithuania
Macedonia, Rep. of
Malaysia
MoldovaMorocco
Netherlands
New Zealand
Philippines
RomaniaRussian Federation
Singapore
South Africa
Thailand
Tunisia
Turkey
United States
International Avg.
40 (3.6)
63 (4.3)
84 (4.0)
83 (2.9)90 (2.3)
41 (4.7)
50 (5.0)
82 (4.1)
71 (4.6)55 (4.2)
30 (4.7)
89 (2.8)
79 (3.8)
69 (3.8)35 (4.4)
70 (3.4)
7 (2.4)
72 (4.4)
49 (4.4)75 (4.4)
– –
84 (3.5)
77 (3.9)
– –– –
98 (1.1)
40 (4.1)
90 (2.3)
96 (2.2)– –
64 (5.0)
59 (4.9)
89 (2.3)
42 (4.8)
74 (3.5)
81 (2.9)
66 (0.7)
45 (3.9)
82 (3.7)
89 (3.3)
90 (2.2)97 (1.3)
48 (4.4)
89 (3.7)
92 (2.5)
71 (5.1)77 (4.0)
54 (5.3)
99 (1.0)
85 (3.0)
88 (2.9)37 (4.5)
80 (2.8)
7 (2.4)
81 (3.6)
58 (4.5)87 (3.3)
– –
89 (2.7)
75 (3.7)
– –– –
98 (1.0)
61 (4.0)
97 (1.4)
94 (2.3)– –
86 (3.5)
66 (4.6)
92 (2.3)
52 (4.7)
84 (3.4)
79 (2.5)
76 (0.6)
62 (3.6)
89 (3.3)
92 (2.9)
92 (1.4)97 (1.3)
73 (3.5)
93 (3.2)
92 (2.6)
79 (4.5)78 (3.2)
74 (4.3)
99 (1.0)
79 (4.0)
39 (4.3)44 (4.8)
84 (2.6)
26 (3.4)
87 (2.9)
75 (3.8)88 (3.4)
– –
86 (3.1)
82 (3.5)
– –– –
99 (1.0)
60 (3.9)
95 (1.9)
94 (2.5)– –
93 (2.4)
60 (4.2)
83 (3.4)
37 (4.2)
87 (3.3)
83 (2.4)
78 (0.6)
189The Science Curriculum
SOU
RCE:
IEA
Thi
rd In
tern
atio
nal M
athe
mat
ics
and
Scie
nce
Stud
y (T
IMSS
), 19
98-1
999.
5.16
Exhibit 5.16 Percentages of Students Taught Environmental and Resource Issues Topics*
Background data provided by teachers.
* Taught before or during this school year.
‡ Lithuania tested the same cohort of students as other countries, but later in 1999, at the beginningof the next school year.
Science teacher background data for Slovak Republic and Slovenia are unavailable.
( ) Standard errors appear in parentheses. Because results are rounded to the nearest whole number,some totals may appear inconsistent.
A dash (–) indicates data are not available.
An “r” indicates teacher response data available for 70-84% of students. An “s” indicates teacherresponse data available for 50-69% of students.
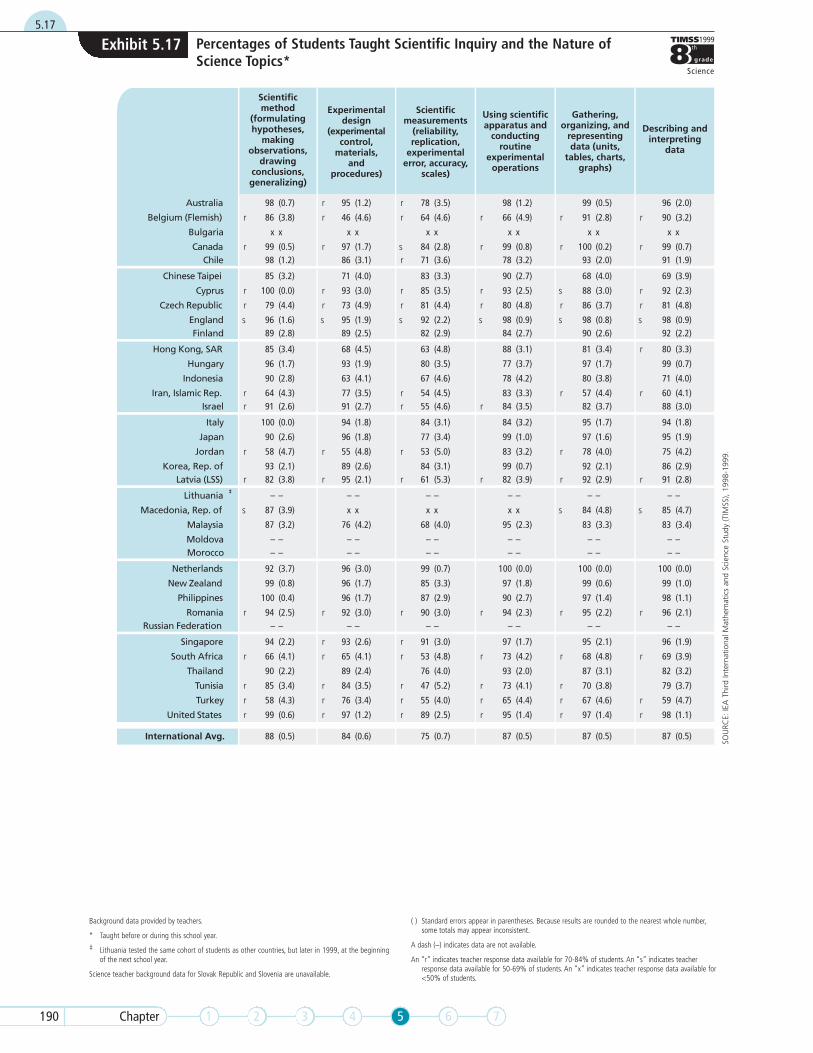
r r
r r r r r r
r r s r r rr
r r r r s r
r r r r r r
s s s s s s
r
r r r rr r r
r r r r
r r r r r r‡
s s s
r r r r r r
r r
r r r r r r
r r r r r
r r r r r r
r r r r r r
Scientificmethod
(formulatinghypotheses,
makingobservations,
drawingconclusions,generalizing)
Describing andinterpreting
data
Gathering,organizing, and
representingdata (units,
tables, charts,graphs)
Using scientificapparatus and
conductingroutine
experimentaloperations
Scientificmeasurements
(reliability,replication,
experimentalerror, accuracy,
scales)
Experimentaldesign
(experimentalcontrol,
materials,and
procedures)
Australia
Belgium (Flemish)
Bulgaria
CanadaChile
Chinese Taipei
Cyprus
Czech Republic
EnglandFinland
Hong Kong, SAR
Hungary
Indonesia
Iran, Islamic Rep.Israel
Italy
Japan
Jordan
Korea, Rep. ofLatvia (LSS)
Lithuania
Macedonia, Rep. of
Malaysia
MoldovaMorocco
Netherlands
New Zealand
Philippines
RomaniaRussian Federation
Singapore
South Africa
Thailand
Tunisia
Turkey
United States
International Avg.
98 (0.7)
86 (3.8)
x x
99 (0.5)98 (1.2)
85 (3.2)
100 (0.0)
79 (4.4)
96 (1.6)89 (2.8)
85 (3.4)
96 (1.7)
90 (2.8)
64 (4.3)91 (2.6)
100 (0.0)
90 (2.6)
58 (4.7)
93 (2.1)82 (3.8)
– –
87 (3.9)
87 (3.2)
– –– –
92 (3.7)
99 (0.8)
100 (0.4)
94 (2.5)– –
94 (2.2)
66 (4.1)
90 (2.2)
85 (3.4)
58 (4.3)
99 (0.6)
88 (0.5)
95 (1.2)
46 (4.6)
x x
97 (1.7)86 (3.1)
71 (4.0)
93 (3.0)
73 (4.9)
95 (1.9)89 (2.5)
68 (4.5)
93 (1.9)
63 (4.1)
77 (3.5)91 (2.7)
94 (1.8)
96 (1.8)
55 (4.8)
89 (2.6)95 (2.1)
– –
x x
76 (4.2)
– –– –
96 (3.0)
96 (1.7)
96 (1.7)
92 (3.0)– –
93 (2.6)
65 (4.1)
89 (2.4)
84 (3.5)
76 (3.4)
97 (1.2)
84 (0.6)
78 (3.5)
64 (4.6)
x x
84 (2.8)71 (3.6)
83 (3.3)
85 (3.5)
81 (4.4)
92 (2.2)82 (2.9)
63 (4.8)
80 (3.5)
67 (4.6)
54 (4.5)55 (4.6)
84 (3.1)
77 (3.4)
53 (5.0)
84 (3.1)61 (5.3)
– –
x x
68 (4.0)
– –– –
99 (0.7)
85 (3.3)
87 (2.9)
90 (3.0)– –
91 (3.0)
53 (4.8)
76 (4.0)
47 (5.2)
55 (4.0)
89 (2.5)
75 (0.7)
98 (1.2)
66 (4.9)
x x
99 (0.8)78 (3.2)
90 (2.7)
93 (2.5)
80 (4.8)
98 (0.9)84 (2.7)
88 (3.1)
77 (3.7)
78 (4.2)
83 (3.3)84 (3.5)
84 (3.2)
99 (1.0)
83 (3.2)
99 (0.7)82 (3.9)
– –
x x
95 (2.3)
– –– –
100 (0.0)
97 (1.8)
90 (2.7)
94 (2.3)– –
97 (1.7)
73 (4.2)
93 (2.0)
73 (4.1)
65 (4.4)
95 (1.4)
87 (0.5)
99 (0.5)
91 (2.8)
x x
100 (0.2)93 (2.0)
68 (4.0)
88 (3.0)
86 (3.7)
98 (0.8)90 (2.6)
81 (3.4)
97 (1.7)
80 (3.8)
57 (4.4)82 (3.7)
95 (1.7)
97 (1.6)
78 (4.0)
92 (2.1)92 (2.9)
– –
84 (4.8)
83 (3.3)
– –– –
100 (0.0)
99 (0.6)
97 (1.4)
95 (2.2)– –
95 (2.1)
68 (4.8)
87 (3.1)
70 (3.8)
67 (4.6)
97 (1.4)
87 (0.5)
96 (2.0)
90 (3.2)
x x
99 (0.7)91 (1.9)
69 (3.9)
92 (2.3)
81 (4.8)
98 (0.9)92 (2.2)
80 (3.3)
99 (0.7)
71 (4.0)
60 (4.1)88 (3.0)
94 (1.8)
95 (1.9)
75 (4.2)
86 (2.9)91 (2.8)
– –
85 (4.7)
83 (3.4)
– –– –
100 (0.0)
99 (1.0)
98 (1.1)
96 (2.1)– –
96 (1.9)
69 (3.9)
82 (3.2)
79 (3.7)
59 (4.7)
98 (1.1)
87 (0.5)SO
URC
E: IE
A T
hird
Inte
rnat
iona
l Mat
hem
atic
s an
d Sc
ienc
e St
udy
(TIM
SS),
1998
-199
9.
Exhibit 5.175.17
Percentages of Students Taught Scientific Inquiry and the Nature ofScience Topics*
2 3 4 5 6 7190 Chapter 1
Background data provided by teachers.
* Taught before or during this school year.
‡ Lithuania tested the same cohort of students as other countries, but later in 1999, at the beginningof the next school year.
Science teacher background data for Slovak Republic and Slovenia are unavailable.
( ) Standard errors appear in parentheses. Because results are rounded to the nearest whole number,some totals may appear inconsistent.
A dash (–) indicates data are not available.
An “r” indicates teacher response data available for 70-84% of students. An “s” indicates teacherresponse data available for 50-69% of students. An “x” indicates teacher response data available for<50% of students.

191The Science Curriculum
Can Meaningful Comparisons Between Intended andImplemented Curricula Be Made?
The timss 1999 results indicate some discrepancies in a number ofcountries between the intended curriculum in science and the imple-mented curriculum as reported by teachers. There are many cases oftopics intended to be taught to all, or almost all, students in a countryfor which teachers reported lower coverage. Interestingly, there areeven more cases for which teachers reported greater topic coveragethan would be expected from the intended curriculum. Such discrep-ancies are consistent with previous iea studies.2 However, consideringthe broad nature of the topic areas, care should be taken in interpretingthe results. Further analysis will need to be done within each country tostrengthen the match between the intended and implemented curricula.
2 Livingstone, I.D., (1986), Second International Mathematics Study: Perceptions of the Intended and Implemented MathematicsCurriculum, Washington, D.C., Center for Statistics, U.S. Department of Education.

7192