Embed Size (px)
Citation preview

The S
avola G
roup
Annual R
epo
rt 2003

This is the annual report for the fiscal year that ended December 31, 2003.
These results were submitted to the Savola Group Shareholders
at the Annual General Assembly held on
March, 24 2004 (corresponding to Safar 3, 1425H).
In The Name Of ALLAH, The Most Merciful, The Most Beneficent

A Word from the Chairman The Savola Group Board of Directors Our Destination Key 2003 Financial Highlights The Savola Group Milestones and History The Savola Group Business Division Retail Division Edible Oils & Fat Division
Savola Edible Oils Co.-Saudi Arabia Savola Sime Egypt Co.
Savola Jordan Co. Savola Morocco Co. Savola Sudan Co.
Sugar Division Packaging Division
Plastics Factory
Savola Group Investment Division Al-Marai Company Herfy Food Company Saudi Arabian Glass Company (SAGCO)
Auditors Report and Financial results: Consolidated Balance Sheets Consolidated Statements of Income Consolidated Statements of Changes
in Shareholders’ Equity Consolidated Statements of Cash Flow Notes to Consolidated Financial Statements
The Savola Group and its Subsidiaries
Contact Information
4681011
12
20
24
48
Savola began as an edible
oil refinery with 50
employees in 1979. Today
it has grown to 5,334
employees across a
portfolio of some of the
most successful consumer
brands in the Kingdom.
2 3

As part of The Group’s communications programs, The Group continues to publish The Savola Quarterly News Bulletin. This Bulletin covers the latest business progress and updates for each Business Division, with consolidated financial results and analyses for each quarter. The Group also provides copies of its quarterly bulletins, annual reports and other booklets prepared by The Group to its shareholders, government authorities, and key institutes and individuals.
On behalf of myself and my colleagues, I would like to thank The Savola Group’s esteemed shareholders for their contin-ued trust and support. I also extend my sincere thanks and appreciation to The Group’s Business Division management and employees for their dedication and unlimited efforts to achieve The Group goals.
Adel M. Fakeih Chairman & Managing Director
The Savola Group A Word from The Chairman
Dear Shareholders,
I have the pleasure to report that The Savola Group net profit for 2003 increased 45% over 2002. With the help of Allah, net profit amounted to SR 301 million and sales reached SR 4.128 billion, compared to SR 3.641 billion last year. The Savola share profit for 2003 also increased to SR 18.81 per share compared to SR 16.50 for the year 2002.
During 2003 The Group successfully increased its capital share from SR 628.5 million to SR 800 million by granting free shares (one free share to each 3.667 shares owned) and by distributing SR 2.57 as dividends for all granted and owned shares. Also, The Group successfully distributed SR 7.00 per share as interim dividends for the first half of 2003.
All of The Group’s Business Divisions enjoyed outstanding achievements and success in 2003.
The Group’s management, and myself and my colleagues on the Board of Directors can confirm that The Group continues toward its “Triple Five Goal”, with the help of Allah. We expect to achieve SR 5 billion sales turnover and SR 500 million profit by the year 2005 as we benefit more from The Group’s maturity, accumulated experience and the scientific management approaches being adopted throughout. This ambitious strategic goal will be realized with the help of Allah, the dedication of all Savola Group employees and the support and trust of our shareholders.
In addition to the scientific planning that The Group is adopting in business performance, The Group is committed to a strong ethical approach in all its business aspects—in a balance that satisfies the requirements of all its stakeholders, employees and community.
For “Corporate Governance” The Group successfully established an accurate and efficient managerial system to strengthen transparency, as well as to monitor and enhance the relationship with all stakeholders.
In 2003 AFIA corn oil was honored as the “Brand of the Decade” in the fast-moving consumer goods category.
The prestigious award was one of 10 presented out of a field of over 500 brands considered. Other winners included Saudi Aramco, Aramex, Saudi American Bank, Emirates Airlines and Dubai Media City. This outstanding award reflects the 20-year growth of AFIA into the leading edible oil brand in the Middle East Region.
Today Savola Edible Oils competes on the world stage with more than 15 different type of oils and fats products—corn oils, palm oils, sunflower oils, blended oils, ghee, and shortening.
4 5

The Savola Group Board of Directors
Abdulah Kamel
Abdulaziz Alfadl
Amar Al Khdary
Amro Al Dabbagh
Ghassan Al-Sulaiman
Ibraim Alissa
Majid Al Qusiby
Pr-Naif Bin Sultan
Saleh Al Khalawi
Sultan Abu-Milha
In addition, the Board would like to thank The Group’s esteemed Shareholders for their trust and support. Many thanks also go to The Group and Business Unit management and employees who made possible another successful year. Many thanks to them all for their dedication and unwavering efforts during 2003.
The Board is looking forward to more achievements and excellence to achieve The Group’s strategic goal “The Triple Five”.
May the peace, mercy and blessings of Allah be upon you.
The Savola Group Board of Directors
To our Shareholders,
The Savola Board of Directors has the pleasure of submitting The Savola Group Annual Report for the fiscal year ended December 31, 2003.
Despite tough competition during the year, The Group con-tinued its excellent business performance in sales, cash flow, shareholders equity and profitability, with the help of Allah.
The Group companies continue to strengthen their market leadership in both local and regional markets. The Board would like to thank all of The Group’s customers for the trust and loyalty they place in The Savola Group and its products.
The Board also extends its thanks and appreciation to the Government of the Custodian of the Two Holy Mosques for its continuous support and encouragement.
6 7

The Savola Group Our Strengths
8 9
Our Plan:
Build the most successful publicly listed diversified investment group in the Middle East, focused on food industries.
Clear Vision:
Give consumers a fair price, while ensuring returns to our investors and all stakeholders.
Create a satisfying work experience for all Savolans. Inspire personal responsibility and enthusiasm for opportunity.
Marketing Skills:
Excel competitively by always looking for ways to create superior offers for our customers—what we call “offer advantage.” Remain responsive and agile in growing market share through our market research, in-depth analyses and 25 years of experience.
Ethics and Values:
The Savola culture is defined by The Balanced Way—a commitment to corporate ethics and delivering value to all our stakeholders. Ensure world-class transparency in our corporate governance.
Allah’s Help:
We firmly believe that Allah’s help and blessings will always be there, supporting those who maintain good and sincere intentions.
Our Financial Goal: 555
5 hundred million Riyal in profit
5 billion Riyal in revenues
By the year 2005
Synergistic Investments:
Strive to make full use of our core competencies. Enhance our advantages in basic food industries by maintaining an active investment portfolio and operating in relevant support industries. The result is a deliberate portfolio of complementary brands and production abilities.
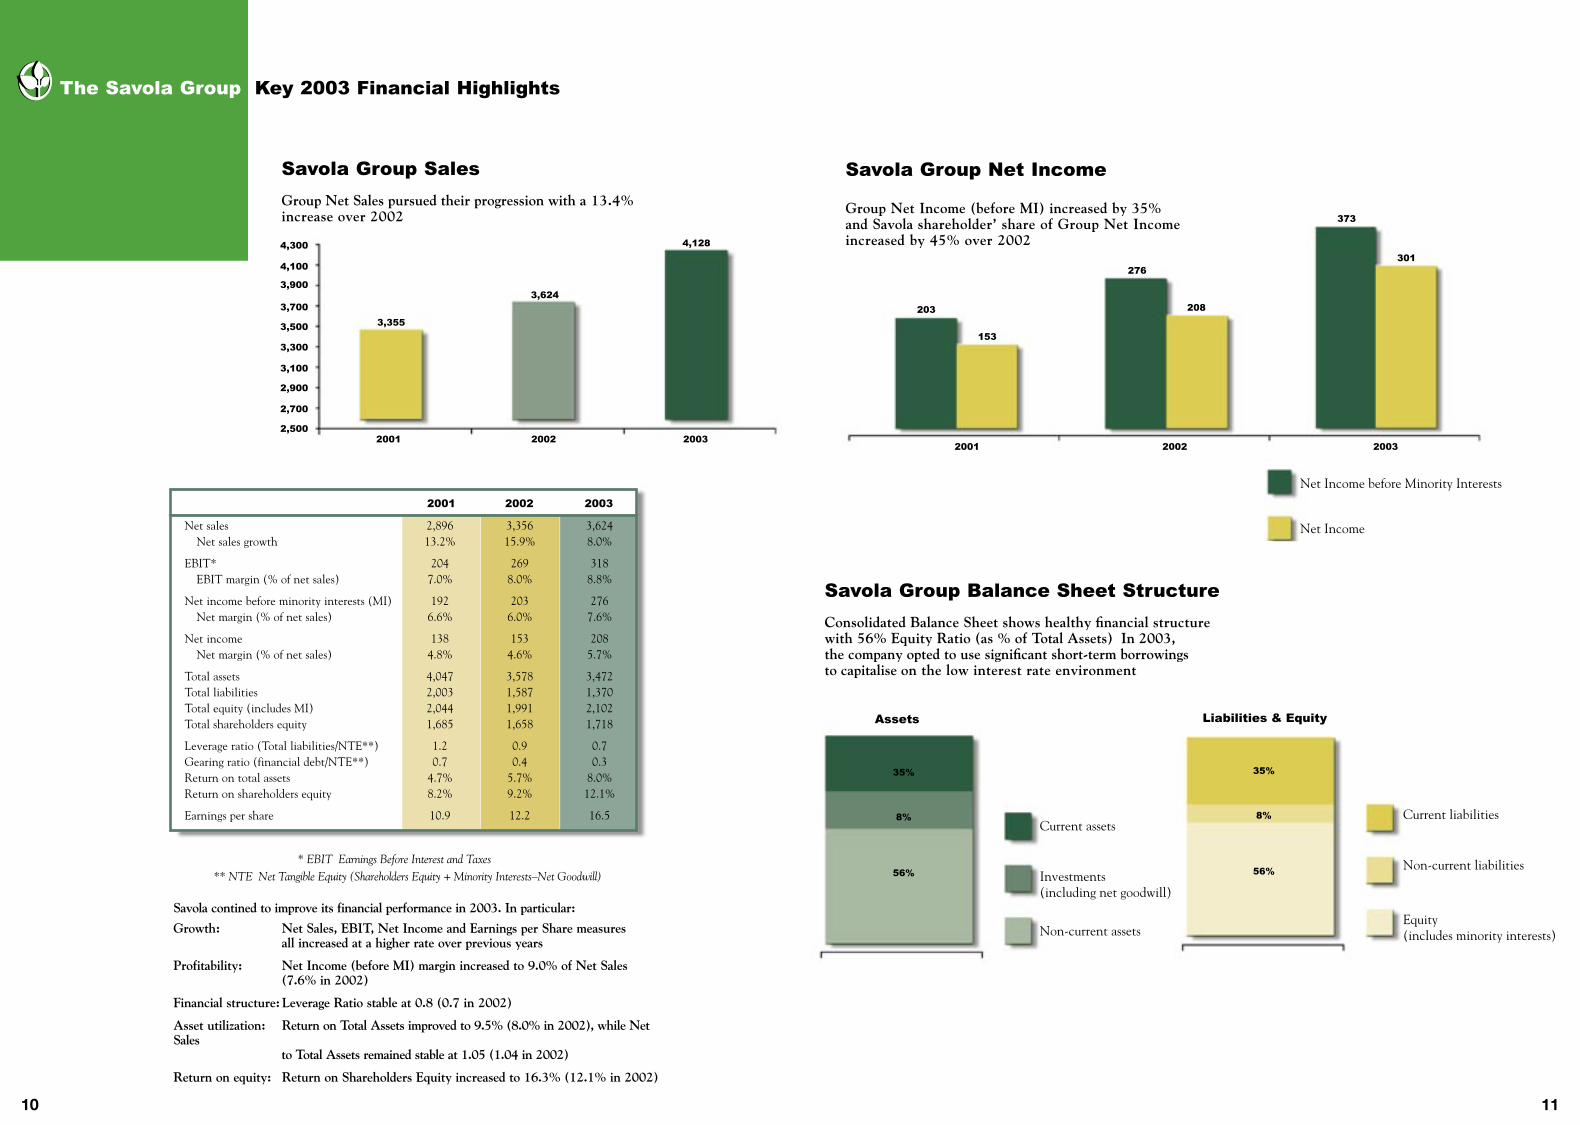
The Savola Group Key 2003 Financial Highlights
Net sales 2,896 3,356 3,624 Net sales growth 13.2% 15.9% 8.0%
EBIT* 204 269 318 EBIT margin (% of net sales) 7.0% 8.0% 8.8%
Net income before minority interests (MI) 192 203 276 Net margin (% of net sales) 6.6% 6.0% 7.6%
Net income 138 153 208 Net margin (% of net sales) 4.8% 4.6% 5.7%
Total assets 4,047 3,578 3,472Total liabilities 2,003 1,587 1,370Total equity (includes MI) 2,044 1,991 2,102Total shareholders equity 1,685 1,658 1,718
Leverage ratio (Total liabilities/NTE**) 1.2 0.9 0.7Gearing ratio (financial debt/NTE**) 0.7 0.4 0.3Return on total assets 4.7% 5.7% 8.0%Return on shareholders equity 8.2% 9.2% 12.1%
Earnings per share 10.9 12.2 16.5
2001 2002 2003
* EBIT Earnings Before Interest and Taxes ** NTE Net Tangible Equity (Shareholders Equity + Minority Interests–Net Goodwill) Savola contined to improve its financial performance in 2003. In particular:
Growth: Net Sales, EBIT, Net Income and Earnings per Share measures all increased at a higher rate over previous years
Profitability: Net Income (before MI) margin increased to 9.0% of Net Sales (7.6% in 2002)
Financial structure: Leverage Ratio stable at 0.8 (0.7 in 2002)
Asset utilization: Return on Total Assets improved to 9.5% (8.0% in 2002), while Net Sales to Total Assets remained stable at 1.05 (1.04 in 2002)
Return on equity: Return on Shareholders Equity increased to 16.3% (12.1% in 2002)
4,300
4,100
3,900
3,700
3,500
3,300
3,100
2,900
2,700
2,5002001 2002 2003
3,355
3,624
4,128
Savola Group Sales
Group Net Sales pursued their progression with a 13.4% increase over 2002
Current assets
Investments (including net goodwill)
Non-current assets
29%
20%
52%
35%
8%
56%
Assets
Current liabilities
Non-current liabilities
Equity (includes minority interests)
35%
8%
56%
Savola Group Balance Sheet Structure
Consolidated Balance Sheet shows healthy financial structure with 56% Equity Ratio (as % of Total Assets) In 2003, the company opted to use significant short-term borrowings to capitalise on the low interest rate environment
2001 2002 2003
203
153
276
208
373
301
Savola Group Net Income
Group Net Income (before MI) increased by 35% and Savola shareholder’ share of Group Net Income increased by 45% over 2002
Net Income before Minority Interests
Net Income
Liabilities & Equity
10 11

The Savola Group Holdings
Core activities of The Savola Group
Edible OilsSavola Edible Oils KSA
Savola Sime Foods EgyptSavola Jordan
Savola MoroccoSavola Sudan
Retail Division Azizia PandaHypermarket
Real Estate
Sugar DivisionSIIC / United Sugar
InvestmentsAl-Marai (Dairy)
Herfy Food (Restaurants)SAGCO (Glass)
Plastics Factory (Packaging)ACI (Investments Portfolio)
The Savola Group Milestones and History
2003 • Savola Edible Oils becomes the market leader in all markets where it operates.
2003 • Azizia-Panda one of the first retail chains in Middle East to apply the concept of Category Management in stores.
2003 • Start of Savola Edible Oil commercial operations of Moroccan (JV) project and Sudan (greenfield) project.
2002 • Azizia-Panda annual sales exceed SR 1.5 billion for first time; 46 stores in the Kingdom.
2001 • Azizia-Panda customer count grows from 1.8 million to 2.4 million during the year — an increase of 33%.
1998 • Merger of Savola Company with Azizia-Panda United (APU). Savola inherits a multitude of ancillary investments (Al Mawashi — sold in 2000, Deemah — sold in 2001, Herfy Food Services, and Azizia Commercial Investment (ACI).
1997 • Sugar refinery starts commercial operations, the Kingdom’s first.
1994 • United Sugar Company incorporates — a joint venture between Savola, Tate & Lyle and local KSA sugar wholesalers and distributors.
1993 • Acquisition of 41% of Saudi Glass Company (SAGCO); another 19% purchased in 1994.
1993 • Private placement of 11% shareholding in Savola Edible Oils to wholesalers and distributors.
1991 • Acquisition of 40% of Al-Marai Company.
1989 • Packaging division starts with in-house plastic bottle and closures manufacturing facility developed by Saudi Edible Oils.
1982 • Launch of premium corn oil brand AFIA, becomes the category leader.
1981 • Start of edible oil refinery operations, the first in KSA. Launch of Al-Arabi and Nakheel palm oil brands.
1979 • Incorporation of the Savola Company with 50 employees; by 1980 this grew to 195 employees and in 2003 to 5,334 Savolans.
Support ActivitiesSavola Group HQ Savola Academy
Royah
The Executive Members
12 13
Dr. Ibrahim H. Al Madhoon, Executive Vice President —Investments
Dr. Sami M. Baroum, Executive Vice President —Retail
Dr. Abdulraouf M. Mannaa, Sr. Executive Vice President —Edible Oils & Fats
Dr. Mohammad A. Kashgari, Executive Vice President —Sugar & Packaging

The Savola Group Business Divisions
RetailThe Retail Division, owned 100% by Savola, continues to be the largest retail food chain in the Middle East.
In a highly competitive marketplace, the Retail Division enjoyed strong business performance during 2003. Sales grew by 8%, reaching SR 1,650 million compared to SR 1,525 million for 2002.
The Division achieved sound profitability, with a healthy year-to-year net profit growth. Operational costs were rationalized and sourcing became more efficient, improv-ing on-going profitability.
The management team created improvement programs in the fresh food departments. The results have paid off. Independent research again confirmed Panda’s reputation for offering the “best freshness” fruits and vegetables in the supermarket sector.
Panda opened its first
store in Riyadh in 1978.
Now there are 46 stores
throughout the Kingdom.
More than 10% of all
groceries in the Kingdom
are purchased in Panda
and Azizia stores.
In 2004 the Division will continue its ambitious expansion strategy to deliver new supermarkets at premium loca-tions in major cities of the Kingdom. The first hypermar-ket—and the first hypermarket in the Kingdom—will be launched in Riyadh during the second quarter 2004.
The focus on training and human resources development remains a priority. Panda Training Academies in Jeddah and Riyadh will expand further. These efforts and invest-ments help bring on-stream qualified young Saudis, newly equipped with the professional skills necessary for the retail business.
14 15

1010 10
The Savola Group Business Divisions
Edible OilsSavola Group owns 90% of Savola Edible Oils Company. In 2004 the company will change name to Afia International Company—reflecting the market leadership of this well-recognized premium brand.
The Savola Edible Oils Company (SEO) continued to out-perform its past achievements in an impressive man-ner. The combined turnover of SEO in 2003 reached SR 1,267 million, compared to SR 1,064 million last year—an increase of 20%. SEO set new records of profitability in 2003 while also maintaining its product leadership position in all the markets in which it operates.
Savola Edible Oils Company entirely operates and manages the following factories and subsidiaries and owns control-ling interests of varying percentages.
Note that the name change to Afia International Company from Savola Edible Oils Company will take effect in 2004 and legal formalities are being completed.
a) Savola Edible Oils – KSA OperationsSavola Edible Oils is 100% owned by The Savola Group.
The year 2003 once again proved the strengths of KSA Operations as the Company faced challenges and delivered impressive results year-on-year. For 2003, Company sales of edible oil products increased to SR 737 million compared to SR 642 million in 2002, a substantial increase of 15%.
Despite increases in raw material cost and competition from imported cheap brands, the Company managed to maintain its overall market share leadership position of 70% of the domestic market. Its flagship brands, AFIA in the corn segment and Al Arabi in the palm olein segment, both sustained their market leadership positions.
The innovative re-launch of AFIA last year successfully warded off competitors and proved that market leaders are uniquely capable of satisfying consumer needs. Al Arabi this year followed suit by changing its packaging to an elegant new PET bottle. This re-launch helped Al Arabi maintain its dominant position in the palm olein segment.
O’lite, a premium sunflower oil brand, was successfully launched in 2003. This brand boosted the Company’s share in the sunflower oil category from 12% to 28%. Management expects that the impressive innovative PET bottle with its eye-catching label will make the brand anoth-er AFIA success in the sunflower oil category.
b) Savola Sime Egypt (SSE) : Savola Sime Egypt is 50% owned by The Savola Group and its subsidiary Savola Edible Oils Company. In 2003 Savola Sime Egypt continued to out-perform its competitors in Egypt in terms of market share, profits and innovation. The overall market share of SSE reached 25% in 2003, an increase from 23.8% in 2002, while still maintaining a reasonable level of prof-itability.
while in Lebanon it captured 28% of the market. Savola Jordan expanded its export operations into neighboring Syria where the initial launch of AFIA captured a very successful 48% market share in very short time.
Iraq remained an important focus for Savola Jordan dur-ing 2003. The Company managed to secure and execute numerous ‘United Nations Oil for Food Program’ con-tracts that exceeded 22,000 metric tons. This ability to fulfill its delivery obligations under very restrictive envi-ronments established Savola Jordan’s reliable reputation.d) Savola Morocco Company:A joint venture between Savola Edible Oils with 51% ownership, with the balance owned by a local Moroccan investor. The share capital of this company reached MD 54 million (SR 18.7 million) in 2003.
Savola Morocco acquired the idle refinery and filling lines of Savola Bahrain Company, which ceased its operations in 2000 and is now under liquidation, pending regulatory approvals.
The erection of this plant is well ahead of schedule, with almost all the equipment on site. It is expected that, Inshallah, commercial operations will begin in April 2004—two months ahead of schedule.
e) Savola Sudan Company:Savola Sudan is 60% owned by Savola Edible Oils, with the remaining 40% owned by other investors. Its share capital reached SD 1.5 billion (SR 21.5 million).
The strategy of establishing Savola Sudan was re-exam-ined by the SEO Board of Directors, leading to the deci-sion to accelerate entry into Sudan. As a result, SEO increased the capital of Savola Sudan to $5.5 million.
Two major obstacles faced by SSE during 2003 were the continued devaluation of Egyptian currency and increases in raw material prices. In both areas, SSE emerged with market successes.
SSE launched the Golden Sun brand in innovative sachet packs for the local market. A launch of Rawaby mini-packs put that brand back in the driver’s seat in both the ghee and oils categories of the Egyptian market.
The AFIA brand continued to challenge the Egyptian market leader and SSE management believe that very soon it will become the market leader in the corn oil segment.
During 2003 the merger of Savola Sime Egypt and Savola Sime Suez was completed. When all legal formalities are completed, this merger will enable SSE to focus and consolidate its manufacturing and sales operations, improving performance in years to come.
c) Savola Jordan Company:Savola Jordan is 75% owned by Savola Edible Oils, up from 51% last year. Its capital reached JD 4.25 million (SR 22.5 million).
Savola Jordan Company is another success story, breaking its own records over past years. Although it is the newest unit of the Division it increased its sales from SR 73.4 mil-lion in 2002 to an impressive SR 129.8 million in 2003, a growth rate of 77%.
Savola Jordan, despite its lean structure, managed to maintain its market leadership position in Jordan and also became the market leader in the premium corn oil segment in both Lebanon and Syria.
AFIA continued its strong 41% market share in Jordan,
The Savola Sudan company formation was completed in 2003 and 250,000 sq.m. of land was secured in Khartoum industrial city. Necessary equipment has been ordered. It is expected that the Company will begin commercial opera-tions in first quarter of 2005.
f) Expansion ProjectsTo contribute to the “Triple Five Goal” of The Savola Group, numerous opportunities for expansion of Savola Edible Oils were evaluated during 2003.
One new venture was the establishment of Savola Kazakhstan, underway following Board approval in November 2003. This Savola Kazakhstan operation was created through the acquisition of an established edible oils factory in the Aktobe region of Kazakhstan. Ownership will be divided with 90% held by Savola and the remaining 10% with a local Kazakhstan company. The existing plant is capable of refining 22,500 metric tons of soft oil from new crushing facilities that are under construction. The plant has already begun commercial operations and it is expected that legal formalities will be completed in early 2004.
SEO is considering investments in oil palm plantations to secure its palm oil supply and stabilize margins that are heavily affected by volatile palm oil prices. Specific propos-als are being evaluated and will be submitted to the Board of Directors for approval in near future.
The Division expects to become a dominant player in manufacturing and sale of edible oils and fats products in the Middle East, Asia and Africa. SEO is also exploring invest-ment opportunities in the Far East, in addition to the size-able investments directed to Middle East expansion. All these specific opportunities were presented to the Board of Directors and approved for further exploration. Inshallah, final recommendations will be made in the near future.
Sales increased 20% over
2002, setting new records
of profitability and market
share.
16 17
The company expects
to be a dominant player
in manufacturing and sale
of edible oil brands in the
Middle East, Asia and Africa.

The Savola Group Business Divisions
Sugar
The Savola Group has a 41% effective ownership of the United Sugar Company (USC). USC owns and operates the Kingdom’s only sugar refinery, located in Jeddah Islamic Port.
USC had a very successful year in 2003, with help and guid-ance of Allah the Almighty. This year marked a major shift in strategic direction from the past as a production-led sugar refinery. USC is now a marketing-focused sugar company engaged in branding and marketing quality consumer sugar to the Saudi market. As a result, total USC sales volume grew by 31% from 630 kilo metric tons in 2002 to 829 kMT in 2003.
In the domestic market, sales grew by 12% from 630 kMT in 2002 to 706 kMT in 2003. This gives USC a domestic market share of 96% compared to 90% in 2002.
Al-Osra packs in fine and coarse are the first branded retail sugars produced by USC. Sales of Al Osra sugar grew by 170% from 53 kMT in 2002 to 144 kMT in 2003. Al Osra market share averaged 54% of the domestic retail market in 2003, a substantial increase from 34% in 2002.
Al-Osra continues to re-enforce its leadership position in the Saudi sugar market. Sound marketing strategies and creative advertisement campaigns have positioned Al-Osra as the leading sugar brand in KSA. In advertising, the Al-Osra management team launched the first sugar TV and radio commercials across Gulf Countries, with a message of “Peak of Purity.” The brand has been certified as an ISO 9001:2000 compliant—signifying superior quality to con-sumers.
Total USC sales volume grew by 31% in 2003, to 829 kilo metric tons from 630 kMT in 2002. Nearly 15% of this was in new export sales, up from no exports in 2002.
The company’s domestic market share grew to 96% compared to 90% in 2002.
USC has the highest level
of Saudization within The
Savola Group subsidiaries,
reaching 46% Saudis in
2003, up from 41% of the
workforce in 2002.
Exports of sugar increased dramatically in 2003, from no exports in 2002. Jordan, Yemen, Sudan and other countries in the GCC took USC exports of 123 kMT in 2003.
In July 2003 the refinery expansion project was completed, bringing the design capacity to 805 kMT. White sugar produc-tion in 2003 surpassed design capacity and reached a record 871 kMT for the year, a 33% growth over 2002.
USC has made excellent progress in Saudization, increasing from 41% of the workforce in 2002 to 46% Saudis in 2003.
During the year, the USC Board approved two major initiatives:• Expansion Phase II—Increase refinery production capacity
to over 1,000 kMT per annum. This will make the USC refinery one of the world’s larger plants.
• Retail packaging plant—Build and operate a state-of-art packaging plant to enable USC’s retail campaign achieve its targets.
18 19

The Savola Group Business Divisions
Plastics Factory
The Savola Group operates its packaging business through its subsidiary the Savola Packaging System Company (SPS), which is completely owned by The Group and one of its subsidiaries. SPS wholly owns the Plastics Factories in Jeddah and Riyadh.
The year 2003 has been another successful year for the Packaging Division. Despite the tough competition and significant increase in raw material prices during 2003, the Division increased its net sales by 8% over 2002 and was able to maintain its net profit at the level of 2002. Even with this 8% increase in sales, operating expenses have been reduced by 2% through tight control of expenditures and continuous efficiency improvement.
Market share increased in key segments like carbonated drinks, water, dairy and juices. Also, sales of new products increased by 124% over 2002. Plastics Factory objective in 2003 was on boosting export sales, developing new products and improving capacity uti-lization. With the grace of Allah, the division did well in all areas. Export sales jumped from 4% of total sales in 2002 to 11% in 2003.
In 2003 there was more focus on key customer accounts to increase Plastics’ share of business and to improve col-lections. This improved the account receivables, DSO and reduced the number of past due accounts.
Saudization is still a challenge for the Plastics Division because of the relatively high turnover among Saudis in 2003. This turnover limited our current Saudization to 32%. However plans are in place to increase it to 40% by the end of 2004.
In 2003 Plastics Factory
market share increased
in the key segments
of carbonated drinks,
water and dairy & juice
containers.
20 21

The Savola Group Investments
Almarai Company
The Savola Group owns 40% of Almarai Company share capital.
Almarai has become one of the leading food companies in the Middle East with more than 150 different products such as fresh milk, yoghurts, cheese and juices, plus other prod-ucts in test market. The Almarai brands control more than 40% of the diary market and are household names in Saudi Arabia and the GCC countries.
The Company has an excellent reputation for quality and was the first dairy cow farm in the world to be awarded ISO 9002 Quality Certification. There are now 50,000 milking cows across six diary farms, all of them well established and equipped to international standards.
This long-term success came as a result of the outstand-ing efforts exerted by the Company’s management and the dedication of its employees, who work hard to achieve the Company’s objectives and strategies.
Almarai has built a very efficient and highly advanced chilled distribution network. More than 600 refrigerated trucks deliver to 23,000 sales outlets in Saudi Arabia and the GCC countries. This chilled distribution ensures that consumers receive the safest and freshest Almarai products.
Almarai announced its strategic Expansion Plan-III for the next five years (2003 – 2007). The company has allocated SR 1,750 million to strengthen its market position and enhance productivity. Of this amount: SR 375 million for farms development, SR 625 million for manufacturing and transportation, SR 100 million for investment in sales center and distribution network, SR 75 million for IT and informa-tion networks, and SR 575 million for renewal and renova-tion.
As part its expansion plans, the Company will establish a new factory for cheese production and a special factory for juice production. With this expansion, the company intends to create 1,000 posts for young Saudis and also provide train-ing for Saudis at management levels.
Almarai is one of the
leading brand names
in the Arabian sub-
continent, supplying
consumers with milk,
laban, yoghurt, juice,
butter, cheese, cream
and dairy desserts.
22 23
Over 60% of all Almarai
milk is fermented into
laban, the traditional
Middle Eastern drink
similar to natural yoghurt.
Approximately 25% is
processed as fresh milk
and the remainder is used
to create branded dairy
products.

The Savola Group Investments
Herfy Food Services Company
The Savola Group Investments
Saudi Arabian Glass Company (SAGCO)
Herfy Food Services enjoyed outstanding success in 2003, confirming Herfy’s position as one of the leading Saudi fast food companies. Sales in 2003 grew by 8% and profitability by 11%, compared to 2002.
During 2003, Herfy successfully opened a number of new restaurants in Riyadh and the Gassim region. Plans are in place to open 10 new domestic restaurants during 2004.
The Company will continue its franchise expansion strategy into neighboring countries that began with Bahrain in 2002. In 2003, franchising agreements were signed to operate Herfy and Al-Mahatah restau-rants in the GCC countries UAE and Kuwait. Many other franchising requests are being currently studied.
Saudi Arabian Glass Company reached the highest sales of its history during 2003—hitting SR 206.1 million, com-pared with SR 187.4 million during 2002. This is a growth of 10%.
This 2003 success was achieved following losses the compa-ny experienced in previous years. SAGCO’s achievement came by reducing cost of sales and through an effective cost control program.
SAGCO glass production is entirely to custom order so all capacity is always fully sold. The company enjoys a high proportion of repeat, on-going orders from domestic as well as export customers. The company has continued making glass container exports to the US, Canada, Europe, Australia, New Zealand, South Africa and other African and Middle East countries.
Herfy is 70% owned by The Savola Group. SAGCO is 51% owned by The Savola Group.
The new Herfy-owned factory for production of maamoul and rusk came on-stream in the second half of 2003.
Construction also began in 2003 for a major beef and chicken meat processing plant to supply Herfy’s res-taurants with its needs. This Herfy processing plant is expected to start its commercial production during the first quarter of 2005.
Glass is mostly sand,
mixed with several other
ingredients and heated
to about 1,500°C until
molten. Then it is poured
into molds to become
our bottles and containers.
Glassmaking began more
than 4,000 years ago
in ancient Egypt. Glass
items were considered
luxuries found only in
the tombs of priests and
royalty.
Herfy has grown to 92
Herfy and Al-Mahatah
restaurants throughout
the Kingdom. Home
delivery services are
provided by 40. And 10
new restaurants will open
during 2004
24 25
LOGO TO COME
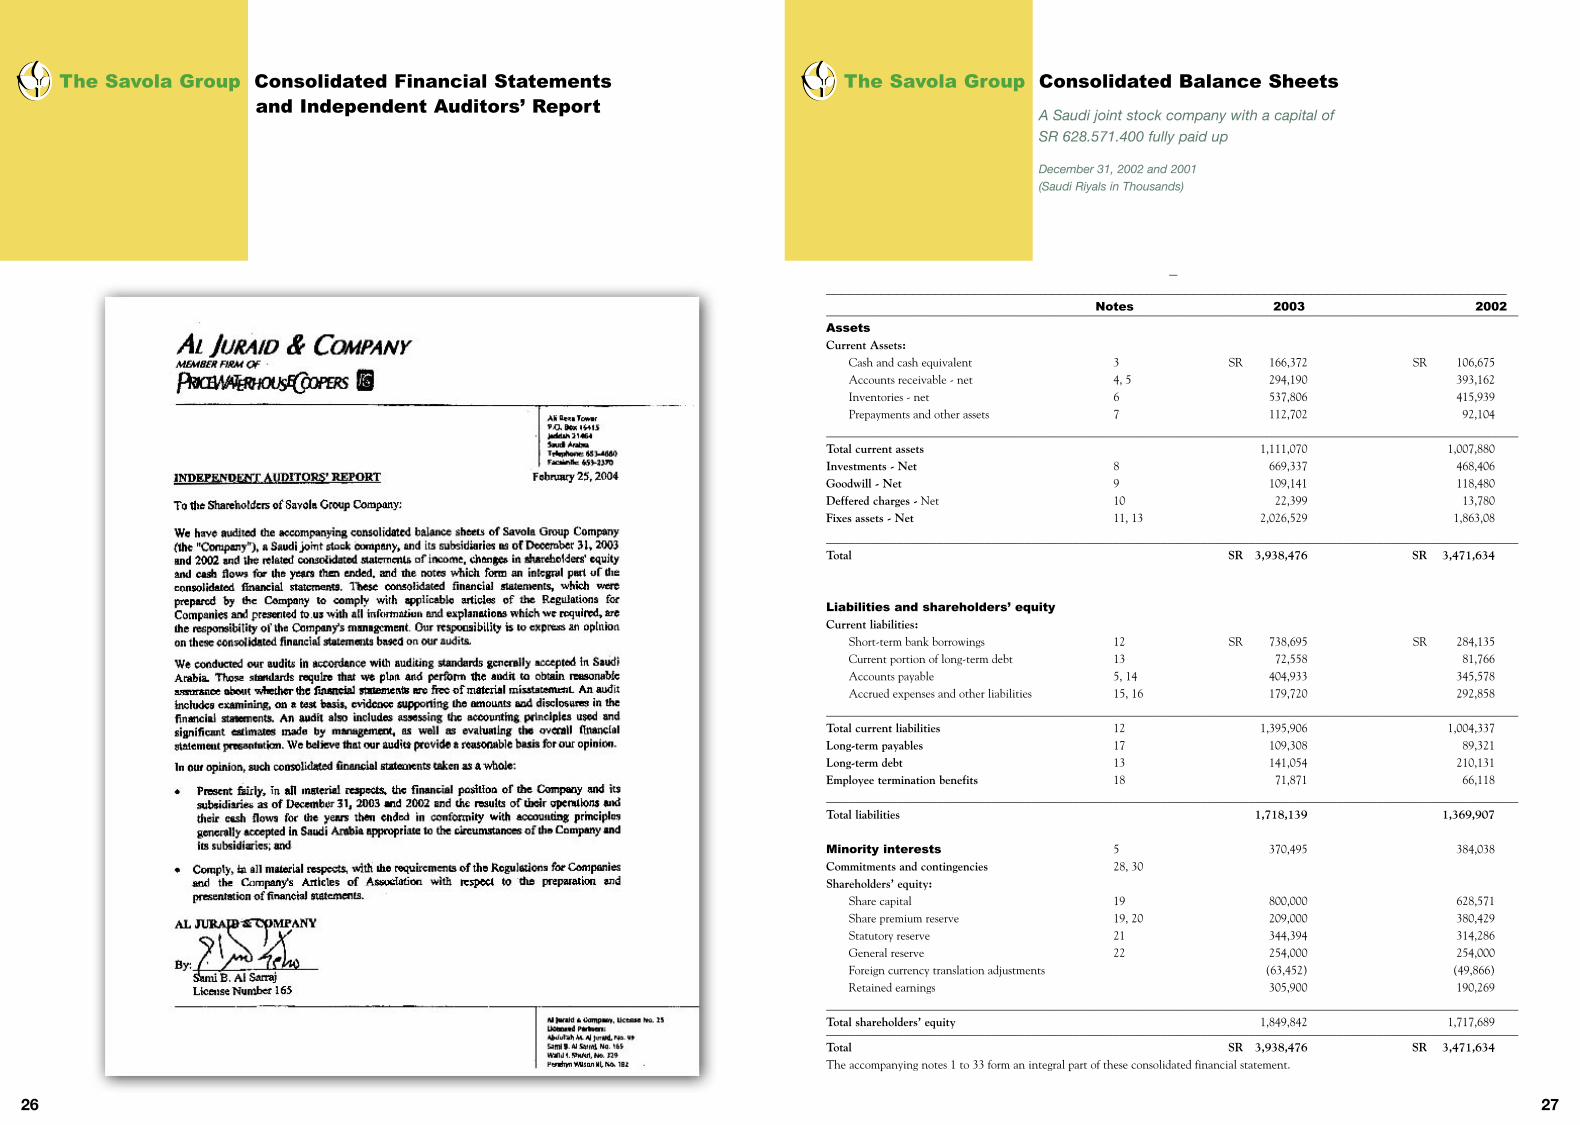
The Savola Group Consolidated Financial Statements and Independent Auditors’ Report
The Savola Group Consolidated Balance Sheets
A Saudi joint stock company with a capital of SR 628.571.400 fully paid up
December 31, 2002 and 2001(Saudi Riyals in Thousands)
26 27
________________________________________________________________________________________ Notes 2003 2002______________________________________________________________________________________________________________________Assets
Current Assets: Cash and cash equivalent 3 SR 166,372 SR 106,675 Accounts receivable - net 4, 5 294,190 393,162 Inventories - net 6 537,806 415,939 Prepayments and other assets 7 112,702 92,104______________________________________________________________________________________________________________________Total current assets 1,111,070 1,007,880Investments - Net 8 669,337 468,406Goodwill - Net 9 109,141 118,480Deffered charges - Net 10 22,399 13,780Fixes assets - Net 11, 13 2,026,529 1,863,08
______________________________________________________________________________________________________________________Total SR 3,938,476 SR 3,471,634
Liabilities and shareholders’ equity
Current liabilities: Short-term bank borrowings 12 SR 738,695 SR 284,135 Current portion of long-term debt 13 72,558 81,766 Accounts payable 5, 14 404,933 345,578 Accrued expenses and other liabilities 15, 16 179,720 292,858______________________________________________________________________________________________________________________ Total current liabilities 12 1,395,906 1,004,337Long-term payables 17 109,308 89,321Long-term debt 13 141,054 210,131Employee termination benefits 18 71,871 66,118______________________________________________________________________________________________________________________Total liabilities 1,718,139 1,369,907 Minority interests 5 370,495 384,038Commitments and contingencies 28, 30Shareholders’ equity: Share capital 19 800,000 628,571 Share premium reserve 19, 20 209,000 380,429 Statutory reserve 21 344,394 314,286 General reserve 22 254,000 254,000 Foreign currency translation adjustments (63,452) (49,866) Retained earnings 305,900 190,269______________________________________________________________________________________________________________________Total shareholders’ equity 1,849,842 1,717,689______________________________________________________________________________________________________________________Total SR 3,938,476 SR 3,471,634The accompanying notes 1 to 33 form an integral part of these consolidated financial statement.

The Savola Group Consolidated Statements
of Income The Savola Group Consolidated Statements of Changes in Shareholders’ Equity
(A Saudi Joint Stock Company)
For the years ended December 31, 2002 and 2001(Saudi Riyals in Thousands)
(A Saudi Joint Stock Company)
For the years ended December 31, 2002 and 2001(Saudi Riyals in Thousands)
28 29
___________________________________________________________________________________________________________________ Notes 2003 2002___________________________________________________________________________________________________________________Sales - Net 5 SR 4,127,801 SR 3,641,258
Cost of sales (3,324,614) (2,846,213)
Gross profit 803,187 795,045
Expenses: Selling and marketing 23 (376,278) (364,523) General and administrative 5, 24 (196,346) (213,995)
Operating income 230,563 216,527
Other income (expenses): Investments income - net 25 174,985 94,266 Amortization of goodwill 9 (14,925) (11,441) Financing cost 12, 13 (30,379) (32,296) Other income 19,591 18,213
Income before zakat and minority interests 379,835 285,269
Zakat and foreign income tax 16 (7,005) (9,042)
Income before minority interests 372,830 276,227
Minority interests (71,749) (68,665)______________________________________________________________________________________________________________________Net income SR 301,081 SR 207,562
The accompanying notes 1 to 33 form an integral part of these consolidated financial statements.
________________________________________________________________________________________________________________ Notes 2003 2002___________________________________________________________________________________________________________________Share capital: Balance at January 1 SR 628,571 SR 628,571 Bonus shares issued during the year 19 171,429 – Balance at December 31 800,000 628,571
Share premium reserve: Balance at January 1 380,429 380,429 Bonus shares issued during the year 19 (171,429) Balance at December 31 209,000 380,429
Statutory reserve: Balance at January 1 314,286 314,286 Transfer from retained earnings 21 30,108 – Balance at December 31 344,394 314,286
General reserve: Balance at January 1 and December 31 254,000 254,000
Foreign currency translationAdjustments: Balance at January 1 (49,866) (45,891) Adjustments during the year (13,586) (3,975) Balance at December 31 (63,452) (49,866)
Retained earnings: Balance at January 1 190,269 135,864 Net income 301,0812 07,562 Transfer to statutory reserve 21 (30,108) – Dividends (2002 - proposed) 31 (153,142) (150,857) Directors’ remunerations 26 (2,200) (2,300) Balance at December 31 305,900 190,269___________________________________________________________________________________________________________________Total shareholders equity SR 1,849,842 SR 1,717,689
The accompanying notes 1 to 33 form an integral part of these consolidated financial statements.

The Savola Group Consolidated Statements
of Cash Flows The Savola Group Consolidated Statements
of Cash Flows (Continued)
(A Saudi Joint Stock Company)
For the years ended December 31, 2002 and 2001(Saudi Riyals in Thousands)
(A Saudi Joint Stock Company)
For the years ended December 31, 2002 and 2001(Saudi Riyals in Thousands)
30 31
___________________________________________________________________________________________________________________ 2003 2002___________________________________________________________________________________________________________________Cash flow from operating activities:
Net income SR 301,081 SR 207,562Adjustments to reconcile net income to net cash provided by operating activities: Investment income - net (174,985) (94,266) Amortization 25,395 27,594 Depreciation 131,345 140,029 (Gain) loss on sale of fixed assets (1,014) 8,097 Share of minority interests in the net income of the consolidated subsidiaries 71,749 68,665 Change in operating assets and liabilities: Accounts receivable (13,952) 17,291 Inventories (121,867) 60,135 Prepayments and other current assets (20,598) (4,958) Accounts payable 12,979 (12,662) Accrued expenses and other current liabilities 35,519 (19,345) Employees’ termination benefits 5,753 4,602___________________________________________________________________________________________________________________ Net cash provided by operating activities 251,405 402,744
Cash flow from investing activities:
Dividend received from an associated company 112,924 100,825 Proceeds from sale of investments 394 32,413 Additions to investments (10,780) – Additions to investments in marketable securities (141,471) – Proceeds from sale of marketable securities 172,287 – Adjustments to goodwill - net of additions (5,586) 2,494 Additions to deferred charge (19,089) (8,034) Additions to fixed assets - net (307,358) (172,478)___________________________________________________________________________________________________________________ Net cash used by investing activities (198,679) (44,780)
Cash flow from financing activities:
Net change in short-term bank borrowings 454,560 33,756 Repayment of long-term debt (81,765) (303,743) Additions to long-term debt 3,480 61,713 Dividends paid (284,012) (134,324) Changes in minority interests (85,292) (17,261)___________________________________________________________________________________________________________________ Net cash provided (used) by financing activities 6,971 (359,859)
____________________________________________________________________________________________________________________ 2003 2002___________________________________________________________________________________________________________________Net change in cash and cash equivalents 59,697 (1,895)
Cash and cash equivalents at beginning of year 106,675 108,570
Cash and cash equivalents at end of year 166,372 106,675
Supplemental schedule of non-cash information: Dividend from an associated company charged to other accounts receivable – 112,924 Directors’ remunerations 2,200 2,300 Proposed dividends – 150,857 Changes in long-term payables 19,987 3,962 Unrealized loss on investments recognized in the – 8,910 consolidated statement of income Foreign currency translation adjustments 13,586 3,975 Investment in a subsidiary unconsolidated in the current year - net 46,376 –
The accompanying notes 1 to 33 form an integral part of these consolidated financial statements.

The Savola Group Notes to Consolidated Financial Statements
For the years ended December 31, 2002 and 2001
32 33
1. THE COMPANY, ITS SUBSIDIARIES AND NATURE OF BUSINESS
Savola Group Company (the “Company”), a Saudi joint stock company, was formed under the Regulations for Companies in the Kingdom of Saudi Arabia per Royal Decree number M/21 dated Rabiul-Awal 29, 1398H (March 9, 1978). The Company’s commercial registration number 4030019708 was issued in Jeddah on Rajab 21, 1399H (June 16, 1979). The purpose of the Company includes the manufacturing and market-ing of vegetable oils and to set up related industries, retail outlets, dairy products, snack foods, packing materials, exports and imports, commer-cial contracting, trade agencies and development of agricultural products.
The Company’s head office is located at the following address: Saudi Business Center Madinah Road P.O. Box 14455 Jeddah 21424 Kingdom of Saudi Arabia
The Company has investments in the following consolidated subsidiaries collectively the (“Group”), which operate under separate commercial registrations and are principally engaged in the manufacturing and marketing of food products, retailing, packaging materials and fast food operations:
Effective ownership
Name Country of incorporation interest (%) at December 31,
___________________________________________________________________________________________________________________ 2003 2002___________________________________________________________________________________________________________________Savola Packaging Systems Limited Saudi Arabia 100 100
Utur Packaging Materials Company Limited Saudi Arabia 100 100
Royah Company for the Development Saudi Arabia 100 100of Information Systems & Computer Services
Savola Snack Foods Company Ltd. Saudi Arabia 100 100(“SSFC”) - under liquidation
Savola Trading International Limited Virgin Islands 100 100
Tayseer FZCO UAE 100 100
Azizia Panda Trading Company (“APTC”) Saudi Arabia 100 –
Al Azizia - Panda Al Qassim Company Saudi Arabia 100 90
Savola Edible Oils Company Limited (“SEO”) Saudi Arabia 90.43 90.25
Herfy Food Services Company Ltd. Saudi Arabia 70 70
Savola Industrial Investments Co. (“SIIC”) Saudi Arabia 63.5 63.5
Saudi Paper Cups & Containers Co. Saudi Arabia – 100
SEO also has the following consolidated subsidiaries: Effective ownership
Name Country of incorporation interest (%) at December 31,
___________________________________________________________________________________________________________________ 2003 2002___________________________________________________________________________________________________________________Malintra Holdings Luxembourg 100 100
Savola Bahrain Company (see Note 8 - b) Bahrain – 90
Savola Jordan Company (“SJC”) Jordan 75 51
Savola Morocco Company Morocco 51 –
Savola Sime Foods Limited (“SSFL”) Virgin Islands 50 50
SIIC has a 64.79% ownership interest in United Sugar Company Ltd. (“USC”), a limited liability company registered in Saudi Arabia, which was consolidated in SIIC’s financial statements before the preparation of these consolidated financial statements.
Tayseer FZCO was set up during 2002 as a limited liability company in the United Arab Emirates for the purpose of trading in food products. It has not started operations as of December 31, 2003.
During 2003, the Company set up APTC as a limited liability company in Saudi Arabia. APTC has not started operations as of December 31, 2003.
During 2002, the Company resolved to liquidate SSFC. However, the legal liquidation process has not started as of December 31, 2003.
During 2003, SEO increased its ownership interest in SJC from 51% to 75% by acquiring additional shares from the Jordanian shareholder. Such change in ownership was approved by the regulatory authorities in Jordan.
During 2003, the Group increased its ownership interest in Al Azizia - Panda Al Qassim Company from 90% to 100% by acquiring the minor-ity shareholders’ interest in that company.
The Group also has an effective ownership interest of 49.9% in Savola Sime Egypt (“SSE”), a limited liability company registered in the Arab Republic of Egypt, which was also consolidated in SSFL’s financial statements (having 75% ownership interest in SSE) before the preparation of these consolidated financial statements. The Group has significant control over SSE.
2.SUMMARY OF SIGNIFICANT ACCOUNTING POLICIES
The accompanying consolidated financial statements have been prepared under the historical cost convention on the accrual basis of accounting, and in compliance with the accounting standards promulgated by the Saudi Organization for Certified Public Accountants (SOCPA). Significant accounting policies are summarized as follows:
Basis of consolidation — The consolidated financial statements include the financial statements of the Company and its subsidiaries set forth in Note 1 above. All significant intercompany transactions and balances have been eliminated in consolidation.
Use of estimates — The preparation of consolidated financial statements in conformity with generally accepted accounting principles requires the use of estimates and assumptions that affect the reported amounts of assets and liabilities and disclosure of contingent assets and liabilities at the date of the consolidated financial statements and the reported amounts of revenues and expenses during the reporting period. Although these estimates are based on management’s best knowledge of current events and actions, actual results ultimately may differ from those estimates.
Cash and cash equivalents — Time deposits purchased with original maturities of less than three months are included in cash and cash equivalents.

34 35
Accounts receivable — Accounts receivable are carried at original amount less provision made for doubtful accounts. A provision for doubtful accounts is established when there is significant doubt that the Group will not be able to collect all amounts due according to the original terms of accounts receivable.
Inventories — Inventories are valued at the lower of cost or market. Cost is determined on the moving-average method. Cost of finished goods and work-in-process includes the cost of raw materials, direct labor and production overheads.
Investments in unconsolidated subsidiaries — Investments in unconsolidated subsidiaries, which are either under formation or liquidation, or where the control does not rest with the Group, are not consolidated in these financial statements but are accounted for using the equity method.
Investments in associated companies — Investments in associated companies, in which the Group has an effective ownership interest of less than 50%, are accounted for using the equity method. According to this method, investments are originally recorded at cost and then adjusted to reflect the Group’s share in the profits or losses of the investee companies and their distribution of profits. The Group’s share of profits or losses of the investee companies is credited or charged to the consolidated statement of income.
Other equity investments— Other equity investments, which are not held for trading purposes, principally consist of less than 20% equity investments in various limited liability companies, and are recorded at cost when acquired. The carrying values are adjusted based on the fair values of these companies as of the consolidated balance sheet date, unless it is determined that the fair values cannot be estimated, in which case such investments are reflected at cost. Unrealized gains or losses resulting from changes in fair values are reported as a separate component of shareholders’ equity. Such changes in fair values were not material as of December 31, 2003 and 2002. Permanent diminution, if any, in the value of such investments is charged to income currently. Consequently, any related unrealized losses that had been previously recognized directly in shareholders’ equity are charged to the consolidated statement of income.
Goodwill — Goodwill represents the excess cost of investments over the fair value of the net assets acquired, and is being amortized using the straight-line method over a period not exceeding 20 years.
Deferred charges — Deferred charges consist of expenses incurred by the Group on setting up new retail outlets and other projects, which are expected to have future benefits. Such expenses are being amortized using the straight-line method over the related estimated economic lives not exceeding five years. Deferred charges also include SIDF loan approval fees and related costs, which are deferred and are being amortized using the straight-line method over the period of the respective loans.
Fixed assets — Fixed assets are stated at cost and are depreciated using the straight-line method over their estimated useful lives as follows:___________________________________________________________________________________________________________________ Years ___________________________________________________________________________________________________________________ Land – Buildings 20 - 33 Machinery and equipment 3 - 20 Furniture and office equipment 4 - 10 Motor vehicles 3 - 4 Leasehold improvements 15 - 25
Interest costs on borrowings to finance the construction of fixed assets are capitalized during the period of time that is required to complete and prepare the asset for its intended use. Other borrowing costs are expensed.
Expenditures for maintenance and repairs that do not materially extend the asset’s life are included in expenses.
Impairment of long-lived assets — Fixed assets and other non-current assets, including goodwill, are reviewed for impairment losses whenever events or changes in circumstances indicate that the carrying amount may not be recoverable. An impairment loss, if any, is recognized for the amount by which the carrying amount of the asset exceeds its recoverable amount. For the purpose of assessing impairment, assets are grouped at the lowest possible level for which there are separately identifiable cash flows.
Borrowings — Borrowings are recognized at the proceeds received, net of transaction costs incurred.
Other provisions — Other provisions are recognized when the Group has a present legal or constructive obligation as result of past events, it is probable that an outflow of resources will be required to settle the obligation, and a reliable estimate of the amount can be made.
Employees’ termination benefits — Employees’ termination benefits are payable as a lump sum to all employees employed under the terms and conditions of the Saudi Labor and Workman Law on termination of their employment contracts. The liability is calculated as the current value of the vested benefits to which the employee is entitled, should the employee leave at the consolidated balance sheet date. Termination pay-ments are based on the employees’ final salaries and allowances and their cumulative years of service, as defined by the conditions stated in the laws of the Kingdom of Saudi Arabia.
Revenue recognition — Sales are recognized upon delivery of products or providing services to the customers, and are recorded net of discounts. Rental income is recognized over the lease terms. Revenues are principally derived from manufacturing, wholesale and retail business in food and related products.
Operating leases — Rentals in respect of operating leases are charged to the consolidated statement of income over the terms of the leases.
Selling, marketing, general and administrative expenses — Selling, marketing, general and administrative expenses include direct and indirect costs not specifically part of cost of sales as required under generally accepted accounting principles. Allocations between cost of sales and sell-ing, marketing, general and administrative expenses, when required, are made on a consistent basis.
Zakat and income tax — The Company and its Saudi Arabian subsidiaries are subject to zakat in accordance with the regulations of the Department of Zakat and Income Tax (“DZIT”). The foreign subsidiaries are subject to tax regulations in their countries of incorporation. Zakat and income tax related to foreign subsidiaries are charged to income on annual basis.
Foreign currency translation — The Company’s books of account are maintained in Saudi riyals. Foreign currency transactions are translated into Saudi riyals at the market rates prevailing at the dates of the transactions. Assets and liabilities denominated in foreign currencies are adjusted to reflect their Saudi riyal equivalents as of the consolidated balance sheet date. Exchange adjustments, which were not significant for 2003 and 2002, are charged or credited to the consolidated statement of income currently.
Assets and liabilities of foreign subsidiaries are translated at the exchange rates in effect at the date of the consolidated financial statements. The components of foreign subsidiaries’ equity accounts, except retained earnings, are translated at the exchange rates in effect at the dates the related items originated. The elements of foreign subsidiaries’ income statements are translated using the weighted-average exchange rate for the year. Adjustments resulting from the translation of foreign subsidiaries’ financial statements into Saudi riyals are reported as a separate component of shareholders’ equity in the accompanying consolidated financial statements.
Reclassifications — Certain amounts in the 2002 consolidated financial statements have been reclassified to conform with the 2003 presentation.
3. CASH AND CASH EQUIVALENTS
Cash and cash equivalents at December 31 are comprised of the following (000’s):___________________________________________________________________________________________________________________ 2003 2002___________________________________________________________________________________________________________________Cash at banks - current accounts SR 101,894 SR 49,035Time deposits 56,043 52,765Cash in hand 8,435 4,875___________________________________________________________________________________________________________________Total SR 166,372 SR 106,675
Time deposits at December 31, 2002 include restricted deposits of approximately SR 47 million (2003 - Nil), which were blocked against bank facilities granted to SSE by a foreign bank.4. ACCOUNTS RECEIVABLE

36 37
Accounts receivable at December 31 are comprised of the following (000’s):___________________________________________________________________________________________________________________ 2003 2002___________________________________________________________________________________________________________________Trade accounts receivable SR 203,739 SR 210,743Other accounts receivable 76,991 172,642Due from related parties (Note 5) 34,429 36,815___________________________________________________________________________________________________________________Total 315,159 420,200
Less: Allowance for doubtful accounts (20,969) (27,038)___________________________________________________________________________________________________________________Accounts receivable - net SR 294,190 SR 393,162
5. RELATED PARTY MATTERS
During the course of its operations, the Group had the following significant transactions with related parties during the years ended December 31 (000’s):___________________________________________________________________________________________________________________ 2003 2002___________________________________________________________________________________________________________________Sales - net SR 509,883 SR 478,698Technical services 13,276 10,525Other 2,916 –
Pricing and terms of payment for these transactions are approved by the management of the Group and the related parties.
Certain Group companies make wholesale purchases of goods and commodities for resale in the retail operations, from entities affiliated to the Company or to certain shareholders. Such purchases are made in the course of the routine retail supermarket operations. The terms of such transactions are determined by the management with reference to the wholesale market prices of such goods and commodities.
The balances at December 31, principally resulting from the aforementioned transactions, are as follows (000’s):___________________________________________________________________________________________________________________ 2003 2002___________________________________________________________________________________________________________________Due from related parties:Certain shareholders of USC SR 30,418 SR 36,815Savola Morocco Company 1,101 – Other 2,910 – ___________________________________________________________________________________________________________________Total SR 34,429 SR 36,815
Due to related parties:Savola Bahrain Company (see Note 8 (b)) 46,376 – Tate and Lyle Investments (Gulf States) Ltd. 6,715 6,192Other 331 – ___________________________________________________________________________________________________________________Total SR 53,422 SR 6,192
Included in minority interests account is an advance payment of SR 69.8 million as of December 31, 2003 and 2002, which was made by Al-Muhaidib Holding Company for Trade and Industry (“MHC”), a minority shareholder in USC, to SIIC for the purpose of increasing MHC’s effective share in the capital of USC. This amount does not bear any finance charges and is expected to be used only for the increase of USC’s capital.
6. INVENTORIES
Inventories at December 31 are comprised of the following (000’s):___________________________________________________________________________________________________________________ 2003 2002___________________________________________________________________________________________________________________Finished goods SR 250,264 SR 233,789Raw materials 164,644 96,405Spare parts not held for sale 68,994 66,569Materials in transit 53,910 21,342Work-in-process 13,598 11,583___________________________________________________________________________________________________________________Total 551,410 429,688Less: Provision for slow moving items (13,604) (13,749)___________________________________________________________________________________________________________________Inventories - net SR 537,806 SR 415,939
7. PREPAYMENTS AND OTHER CURRENT ASSETS
Prepayments and other current assets at December 31 are comprised of the following (000’s):___________________________________________________________________________________________________________________ 2003 2002___________________________________________________________________________________________________________________Prepaid rental charges SR 27,971 SR 23,809Other prepayments 32,799 21,930Advances to vendors and other 51,932 46,365___________________________________________________________________________________________________________________Total SR 112,702 SR 92,104
8. INVESTMENTS
Investments at December 31 are comprised of the following (000’s):___________________________________________________________________________________________________________________ 2003 2002___________________________________________________________________________________________________________________Investments in associated companies - net SR 590,321 SR 447,906Investments in unconsolidated subsidiaries 59,016 – Other equity investments - net 20,000 20,500___________________________________________________________________________________________________________________Investments - net SR 669,337 SR 468,406
The movements in the investments account for the years ended December 31 are as follows (000’s):___________________________________________________________________________________________________________________ 2003 2002___________________________________________________________________________________________________________________Balance at January 1 SR 468,406 SR 489,827Additions to investments in marketable securities 141,471 – Disposals of marketable securities (141,471) – Share of profit from an associated company 144,059 138,914Additions to investments 10,780 – Investments disposed off (500) (17,093)Dividend received from an associated company – (121,875)Investment in SBC, net of profit share 44,730 – Movement in provisions related to investments 1,862 (21,367)___________________________________________________________________________________________________________________Balance at December 31 SR 669,337 SR 468,406

38 39
a) Investments in associated companies at December 31 are comprised of the Group’s effective ownership interests in the following limited liability companies (000’s):___________________________________________________________________________________________________________________ Effective ownership
interest (%) 2003 2002___________________________________________________________________________________________________________________Al Marai Company Ltd. - Saudi Arabia 40.33 SR 590,321 SR 449,668
Saudi Arabian Glass Company (“SAGCO”) - Saudi Arabia 51 71,171 71,171
Wazir Ali Industries Ltd. - Pakistan 40 2,446 2,446
Arabian Saline Water TechnologyCo. Ltd. (Behar) - Saudi Arabia 30 209 209___________________________________________________________________________________________________________________ 664,147 523,494
Less: Provision for decline in the valueof investments in associated companies (73,826) (75,588)___________________________________________________________________________________________________________________Investments in associated companies - net SR 590,321 SR 447,906
SAGCO was not consolidated in 2003 and 2002 because the control of SAGCO does not rest with the Group. At December 31, 2000, man-agement decided to write off in full the goodwill that related to its investment in SAGCO and to fully provide for this investment because management believed that there was a permanent decline in its value. Subsequently, SAGCO has reported net income for 2003 and 2002, which was not significant. However, management of the Group still believes that the circumstances surrounding their conclusion on the per-manent decline in the value of such investment have not significantly changed. Accordingly, the Group has not accounted for its share in SAGCO’s net income for 2003 and 2002.
The investment in Behar was also fully provided for by the Group as of December 31, 2003 and 2002 because management believes there is a permanent decline in its value. The Group has not accounted for its share in the results of Behar for 2003 and 2002 as the net carrying value of such investment is nil at December 31, 2003 and 2002, and management believes that no additional losses will be incurred by the Group.
The Group has provided corporate guarantees to local commercial banks in relation to loans amounting to SR 143 million (2002 - SR 151 million) obtained by SAGCO and Behar from those banks.
During 2003, the Group provided for its investment in Wazir Ali Industries Ltd. due to permanent decline in its value.
b) Investments in unconsolidated subsidiaries at December 31 are comprised of the following (000’s): ___________________________________________________________________________________________________________________ 2003 2002___________________________________________________________________________________________________________________Savola Bahrain Company (“SBC”) SR 48,236 SR – Savola Morocco Company (“SMC”) 10,780 – ___________________________________________________________________________________________________________________Total SR 59,016 SR –
Following is a summary of the combined financial information for the unconsolidated subsidiaries (000’s):
For the year ended December 31, 2003Net income SR 2,739As of December 31, 2003Total assets 59,686Total liabilities 670
The Group’s effective ownership interest in SBC is 100% (90% through SEO and 10% through the Company). SBC did not have any opera-tions during 2003 and 2002. On September 17, 2003, the shareholders of SBC convened a meeting and resolved to liquidate SBC and appoint-ed a liquidator. Currently, the subsidiary is under the liquidation process. Accordingly, the subsidiary’s financial statements for 2003 were not consolidated in the accompanying consolidated financial statements.
Upon the completion of liquidation process of SBC, the recorded investment in SBC of SR 48.2 million will be offset against the recorded bal-ance payable to SBC of SR 46.4 million (see Note 5).
SMC was set up as a limited liability company in Morocco for the purpose of manufacturing and trading in edible oil products. As of December 31, 2003, SMC was under development. Management expects that SMC will become operational in 2004.
c) Other equity investments at December 31 are comprised of the Group’s effective ownership interests in the following limited liability companies (000’s):___________________________________________________________________________________________________________________ Ownership
interest (%) 2003 2002___________________________________________________________________________________________________________________Al-Azizia CommercialInvestment Co. (“ACI”)Saudi Arabia 10 SR 41,091 SR 41,091Other Below 1% each – 600___________________________________________________________________________________________________________________Total 41,091 41,691
Less: Provision for permanent declinein the value of other equity investments (21,091) (21,191)___________________________________________________________________________________________________________________Other equity investments - net SR 20,000 SR 20,500
During 2002, the Group provided for its investment in ACI due to permanent decline in its value.
40 41
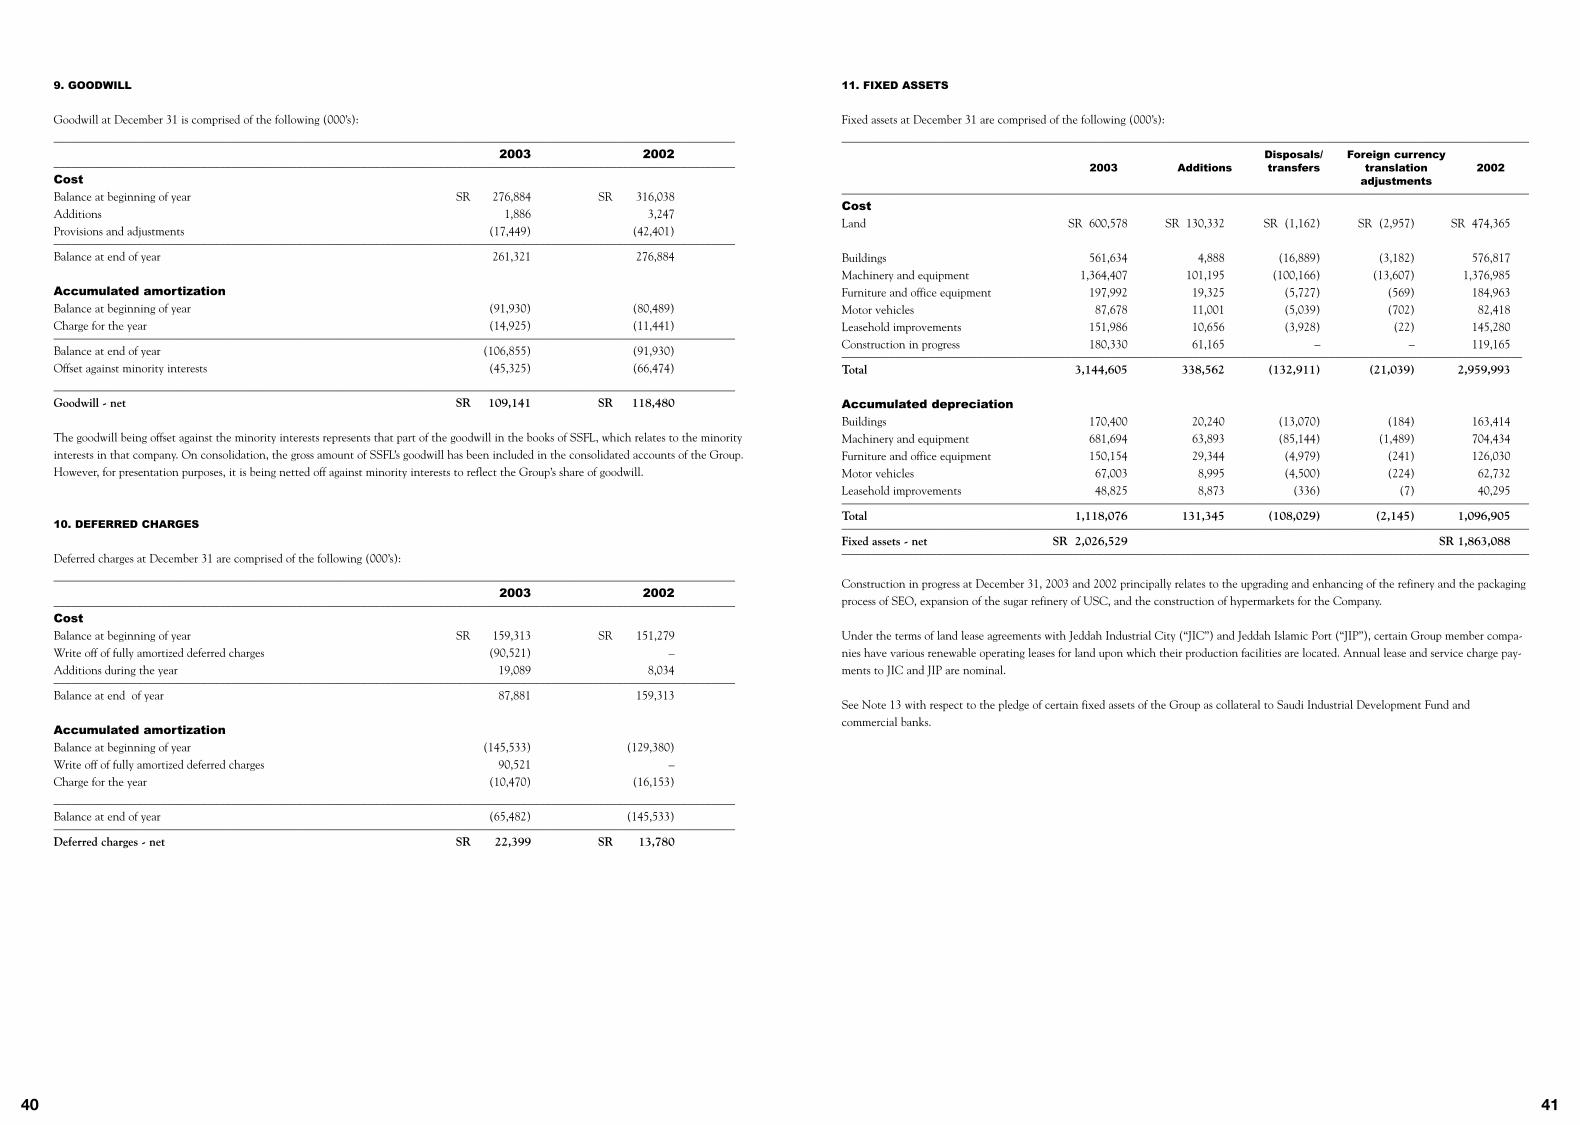
9. GOODWILL
Goodwill at December 31 is comprised of the following (000’s):___________________________________________________________________________________________________________________ 2003 2002___________________________________________________________________________________________________________________Cost
Balance at beginning of year SR 276,884 SR 316,038Additions 1,886 3,247Provisions and adjustments (17,449) (42,401)___________________________________________________________________________________________________________________Balance at end of year 261,321 276,884
Accumulated amortization
Balance at beginning of year (91,930) (80,489)Charge for the year (14,925) (11,441)___________________________________________________________________________________________________________________Balance at end of year (106,855) (91,930)Offset against minority interests (45,325) (66,474)___________________________________________________________________________________________________________________Goodwill - net SR 109,141 SR 118,480
The goodwill being offset against the minority interests represents that part of the goodwill in the books of SSFL, which relates to the minority interests in that company. On consolidation, the gross amount of SSFL’s goodwill has been included in the consolidated accounts of the Group. However, for presentation purposes, it is being netted off against minority interests to reflect the Group’s share of goodwill.
10. DEFERRED CHARGES
Deferred charges at December 31 are comprised of the following (000’s):___________________________________________________________________________________________________________________ 2003 2002___________________________________________________________________________________________________________________Cost
Balance at beginning of year SR 159,313 SR 151,279Write off of fully amortized deferred charges (90,521) – Additions during the year 19,089 8,034___________________________________________________________________________________________________________________Balance at end of year 87,881 159,313
Accumulated amortization
Balance at beginning of year (145,533) (129,380)Write off of fully amortized deferred charges 90,521 – Charge for the year (10,470) (16,153)___________________________________________________________________________________________________________________Balance at end of year (65,482) (145,533)___________________________________________________________________________________________________________________Deferred charges - net SR 22,399 SR 13,780
11. FIXED ASSETS
Fixed assets at December 31 are comprised of the following (000’s):____________________________________________________________________________________________________________________ Disposals/ Foreign currency 2003 Additions transfers translation 2002 adjustments____________________________________________________________________________________________________________________Cost
Land SR 600,578 SR 130,332 SR (1,162) SR (2,957) SR 474,365
Buildings 561,634 4,888 (16,889) (3,182) 576,817Machinery and equipment 1,364,407 101,195 (100,166) (13,607) 1,376,985Furniture and office equipment 197,992 19,325 (5,727) (569) 184,963Motor vehicles 87,678 11,001 (5,039) (702) 82,418Leasehold improvements 151,986 10,656 (3,928) (22) 145,280Construction in progress 180,330 61,165 – – 119,165____________________________________________________________________________________________________________________Total 3,144,605 338,562 (132,911) (21,039) 2,959,993
Accumulated depreciation
Buildings 170,400 20,240 (13,070) (184) 163,414Machinery and equipment 681,694 63,893 (85,144) (1,489) 704,434Furniture and office equipment 150,154 29,344 (4,979) (241) 126,030Motor vehicles 67,003 8,995 (4,500) (224) 62,732Leasehold improvements 48,825 8,873 (336) (7) 40,295____________________________________________________________________________________________________________________Total 1,118,076 131,345 (108,029) (2,145) 1,096,905____________________________________________________________________________________________________________________Fixed assets - net SR 2,026,529 SR 1,863,088____________________________________________________________________________________________________________________
Construction in progress at December 31, 2003 and 2002 principally relates to the upgrading and enhancing of the refinery and the packaging process of SEO, expansion of the sugar refinery of USC, and the construction of hypermarkets for the Company.
Under the terms of land lease agreements with Jeddah Industrial City (“JIC”) and Jeddah Islamic Port (“JIP”), certain Group member compa-nies have various renewable operating leases for land upon which their production facilities are located. Annual lease and service charge pay-ments to JIC and JIP are nominal.
See Note 13 with respect to the pledge of certain fixed assets of the Group as collateral to Saudi Industrial Development Fund and commercial banks.

42 43
12. SHORT-TERM BANK BORROWINGS
Short-term bank borrowings consist of bank overdrafts, short-term loans and a Murabaha financing arrangement, and bear financing charges at the prevailing market rates. Some of these short-term loans are secured by corporate guarantees of the Company and other Group member companies. The Group has unused bank borrowings facilities of SR 287 million as of December 31, 2003. At December 31, 2003, the Group’s consolidated total current liabilities exceeded its total current assets by SR 285 million. Management believes that these unused facilities will be utilized to meet the Group’s financial obligations as they become due.
13. LONG-TERM DEBT
Long-term debt at December 31 is comprised of the following (000’s):____________________________________________________________________________________________________________________ 2003 2002____________________________________________________________________________________________________________________Saudi Industrial Development Fund (“SIDF”) SR 185,437 SR 234,664Commercial banks 28,175 57,233____________________________________________________________________________________________________________________Total 213,612 291,897
Less current portion:SIDF (61,500) (52,708)Commercial banks (11,058) (29,058)____________________________________________________________________________________________________________________Total (72,558) (81,766)____________________________________________________________________________________________________________________Long-term debt SR 141,054 SR 210,131
The loans from SIDF, which have been provided to certain subsidiaries of the Company, bear annual service fees, which amounted to SR 2.8 million during 2003 (2002 - SR 2.7 million). The cumulative SIDF loan approval fees of SR 8.3 million at December 31, 2003 (2002 - SR 8.3 million) have been deferred by the subsidiaries and are being amortized over the period of the related loans.
The SIDF loan agreements include certain covenants that provide, among other things, restrictions relating to the payment of dividends, capi-tal expenditures and rental charges, and the maintenance of certain financial ratios. As of December 31, 2003, a loan covenant, namely the payment of dividends, was not met by a subsidiary. The subsidiary’s management has informed the SIDF about this matter, and believes that the SIDF will not take any action as a result of this. Accordingly, the loan amount has been classified in accordance with its repayment terms.
All of the related subsidiaries’ fixed assets, which have a net book value of SR 620 million at December 31, 2003 (2002 - SR 619 million) are pledged as collateral under the SIDF loan agreements. The SIDF loans are also secured by corporate guarantees of the Company.
The commercial bank loans bear finance charges at the prevailing market rates and are partly secured by corporate guarantees of the Company.
In addition, certain fixed assets of the Group member companies, with a net carrying value of SR 24 million as of December 31, 2003 (2002 - SR 24 million), are pledged as collateral under the commercial bank loan agreements. The aggregate repayment schedule of the long-term debt outstanding at December 31, 2003 is summarized as follows (000’s):
Year ending December 31:2004 SR 72,5582005 72,1172006 68,937____________________________________________________________________________________________________________________Total SR 213,612
14. ACCOUNTS PAYABLE
Accounts payable at December 31 are comprised of the following (000’s):___________________________________________________________________________________________________________________ 2003 2002___________________________________________________________________________________________________________________Trade accounts payable SR 303,054 SR 239,748Non-trade accounts payable 48,457 99,638Due to related parties (Note 5) 53,422 6,192____________________________________________________________________________________________________________________Total SR 404,933 SR 345,578
15. ACCRUED EXPENSES AND OTHER CURRENT LIABILITIES
Accrued expenses and other current liabilities at December 31 are comprised of the following (000’s):___________________________________________________________________________________________________________________ 2003 2002___________________________________________________________________________________________________________________Accrued charges SR 98,478 SR 90,495Other provisions 48,750 37,417Advertising 29,280 10,716Directors’ remunerations (Note 26) 2,200 2,300Zakat provision (Note 16) 1,012 1,073Proposed dividends (Notes 31 and 33) – 150,857____________________________________________________________________________________________________________________Total SR 179,720 SR 292,858
16. ZAKAT AND FOREIGN INCOME TAX
Zakat and foreign income taxes are charged to the consolidated statements of income. The Company and its subsidiaries file separate zakat and income tax declarations, which are filed on unconsolidated basis. Significant components of zakat base of each company are comprised of share-holders’ equity, provisions at the beginning of the year and adjusted net income, less deductions for the net book value of fixed assets, invest-ments and certain other items. Zakat and foreign income tax included in the consolidated statements of income for the years ended December 31 are as follows (000’s):___________________________________________________________________________________________________________________ 2003 2002___________________________________________________________________________________________________________________Zakat for the Company SR – SR – Zakat and foreign income tax of consolidated subsidiaries 7,005 9,042____________________________________________________________________________________________________________________Total SR 7,005 SR 9,042
Provision for Zakat
The following is a summary of movements in the Company’s provision for zakat account for the years ended December 31 (000’s):___________________________________________________________________________________________________________________ 2003 2002___________________________________________________________________________________________________________________Balance at January 1 SR 1,073 SR 1,535Adjustments during the year (61) (462)___________________________________________________________________________________________________________________Balance at December 31 SR 1,012 SR 1,073
There were no additional zakat charges for 2003 and 2002 due to the negative zakat base.

44 45
Zakat Status
The Company has obtained the final zakat certificates through the year ended December 31, 1997.
The Company received queries from the DZIT concerning the Company’s declarations for the years 1999 to 2001. Management is in the process of preparing the responses to the DZIT queries. The Company is also in the process of filing its 2002 final zakat return.
The DZIT also assessed an additional zakat liability of SR 4.9 million concerning the years 1999 and 2000, against which the Company filed an objection letter. Management believes that the DZIT will revise its assessment. Accordingly, such amount was not provided for in the accom-panying consolidated financial statements.
The subsidiaries received final zakat certificates for certain years and provisional zakat certificates for other years. They have also received queries from the DZIT for the open years, for which replies have been or will be filed by the respective companies.
During 2002, a Group member company received assessments from the DZIT concerning its zakat declarations for the years 1996 to 2001, in which the DZIT assessed an additional zakat liability of approximately SR 8.6 million. The management of the subsidiary had appealed such assessment and subsequently received a revised assessment from the DZIT for a revised zakat liability of SR 3.6 million. However, management has again appealed such assessment and believes that only SR 2.3 million may be ultimately payable to the DZIT and, accordingly, no liability for the remaining balance of SR 1.3 million has been recorded in the accompanying consolidated financial statements.
During 2003, a former Group member company, namely Saudi Paper Cups and Containers Co. Ltd., received final zakat assessments for the years 1995 to 2001 in which the DZIT claimed additional zakat liability of SR 2.1 million from the Company, being the former majority share-holder. Also, during 2003, a Group member company received an assessment from the DZIT concerning its zakat declaration for 2000, in which the DZIT assessed an additional zakat liability of approximately SR 0.6 million. The Company objected against such assessments and filed these cases with the Appeal Committee. Management believes that no additional zakat liability will be ultimately payable and, accord-ingly, no liability has been recorded in the accompanying consolidated financial statements for such amounts.
Any additional zakat liability that may be assessed by the DZIT upon the finalization of the Group companies’ zakat returns up to 2002 will be recorded by the Group member companies when finalized with the DZIT.
17. LONG-TERM PAYABLES
Long-term payables represent dividends declared in prior years and share fractions, which resulted from split of shares in prior years. Such amount has not yet been claimed by the respective shareholders for several years. In the opinion of management, such amount is unlikely to be paid during 2004 and, accordingly, it is classified under non-current liabilities.
18. EMPLOYEES’ TERMINATION BENEFITS
The movements in employees’ termination benefits for the years ended December 31 are as follows (000’s):___________________________________________________________________________________________________________________ 2003 2002___________________________________________________________________________________________________________________Balance at January 1 SR 66,118 SR 61,516Additions during the year 7,606 8,325Payments during the year (1,853) (3,723)___________________________________________________________________________________________________________________Balance of December 31 SR 71,871 SR 66,118
19. SHARE CAPITAL
The Company’s share capital of SR 800,000,000 at December 31, 2003 consists of 16,000,000 fully paid and issued shares of SR 50 each (2002 - Share capital SR 628,571,400 consisting of 12,571,428 fully paid and issued shares).
The shareholders of the Company, in their extra-ordinary general assembly meeting held on July 5, 2003, resolved to increase the Company’s share capital by issuing 3 bonus shares for every 11 shares outstanding at that date. As a result, the share capital increased to SR 800 million and the number of shares to 16 million shares. Such increase in share capital was affected by a transfer of SR 171.4 million from share premium reserve account. The legal formalities for such increase in share capital are in process.
20. SHARE PREMIUM RESERVE
Share premium reserve at December 31, 2003 and 2002 represents the difference between the par value and the fair value of the shares issued in prior years, less transfers to share capital (see Note 19). This reserve is not currently available for distribution to the shareholders.
21. STATUTORY RESERVE
In accordance with its Articles of Association and the Regulations for Companies in the Kingdom of Saudi Arabia, the Company is required each year to transfer 10% of its net income to a statutory reserve until such reserve equals 50% of its share capital. Such reserve is not currently available for distribution to the shareholders.
22. GENERAL RESERVE
In previous years, the shareholders resolved to set aside a general reserve by appropriation from retained earnings to meet future expansion in the Company’s business. Such reserve can be increased or decreased by a resolution from the shareholders.
23. SELLING AND MARKETING EXPENSES
Selling and marketing expenses for the years ended December 31 are comprised of the following (000’s):___________________________________________________________________________________________________________________ 2003 2002___________________________________________________________________________________________________________________Staff cost SR 146,546 SR 136,370Advertising 84,358 85,555Depreciation 42,804 46,091Utilities 29,877 29,306Rent (see Note 30) 23,748 24,589Repairs, maintenance and consumables 7,382 6,475Fuel and oil 4,950 8,464Travel 2,616 2,880Insurance 1,756 1,595Telecommunication 1,273 1,823Bad debts – 9,697Other 30,968 11,678___________________________________________________________________________________________________________________Total SR 376,278 SR 364,523

46 47
24. GENERAL AND ADMINISTRATIVE EXPENSES
General and administrative expenses for the years ended December 31 are comprised of the following (000’s):___________________________________________________________________________________________________________________ 2003 2002___________________________________________________________________________________________________________________Staff cost SR 110,103 SR 105,661Professional fees 10,753 20,226Amortization of deferred charges 10,470 16,153Depreciation 9,464 11,454Utilities, telephone and communication 7,087 7,296Travel 5,347 3,991Training 3,351 6,644Computer-related 3,091 2,253Repairs and maintenance 2,643 2,177Insurance 1,899 2,357Rent 1,602 2,025Other 30,536 33,758___________________________________________________________________________________________________________________Total SR 196,346 SR 213,995
Entitlements paid to the Company’s Managing Director in the form of monthly salaries and housing and transportation allowance amounted to SR 1,590,000 for the year ended December 31, 2003 (2002 - SR 1,590,000). His annual bonus, which represents 1% of the Company’s net income, amounted to SR 3,010,567 for the year ended December 31, 2003 (2002 - SR 2,075,617). His accrued end of service benefits amount-ed to SR 125,000 for the year ended December 31, 2003 (2002 - SR 125,000). Such expenses are included in staff cost above. In addition, the Company provides the Managing Director with a private driver, medical insurance and life insurance under Cooperative Takaful Program.
25. INVESTMENTS INCOME
Investments income for the years ended December 31 is comprised of the following (000’s):___________________________________________________________________________________________________________________ 2003 2002___________________________________________________________________________________________________________________Share of profit from associated companies - net SR 144,059 SR 138,914Gain on disposal of investments 30,926 3,629Provision for impairment of goodwill – (18,000)Loss on investment in ACI, previously recorded as unrealized loss under equity – (8,910)Provision for permanent decline in the value of investments – (21,367)___________________________________________________________________________________________________________________Investments income - net SR 174,985 SR 94,266
26. DIRECTORS’ REMUNERATIONS
The remunerations due to the Board of Directors for the year ended December 31, 2003 amounted to SR 2.2 million (2002 - SR 2.3 million). Attendance allowances amounted to SR 0.4 million for 2003 (2002 - SR 0.3 million) for attending Board meetings held during the year.
27. EARNINGS PER SHARE
Earnings per share for the year ended December 31, 2003 amounted to SR 18.82 (2002 - SR 12.97 as restated for the increase in capital and shares).
28. COMMITMENTS AND CONTINGENCIES
The Group had outstanding bank guarantees and letters of credit amounting to SR 98.8 million at December 31, 2003 (2002 - SR 36.4 mil-lion), which were issued in the normal course of business. Also see Note 16 with respect to zakat contingencies. At December 31, 2003, USC had commitments to purchase approximately 747,600 tons (2002 - 995,000 tons) of raw sugar at prices which will approximate market prices prevailing on shipment dates, with deliveries spread between January 2004 and June 2005. Also, at December 31, 2003, USC had commitments to sell in 2004 refined sugar of approximately 181,000 tons (2002 - 150,000 tons to sell in 2003) at prices which would approximate the prevail-ing market prices at the contract date.
29. SEGMENT REPORTING
The Group’s consolidated assets, liabilities, sales and net income as of December 31 and for the years then ended by segment are as follows (000’s):____________________________________________________________________________________________________________________ Manufacturing
/wholesale Retail Other Total____________________________________________________________________________________________________________________2003
Assets SR 1,669,441 SR 1,517,340 SR 751,695 SR 3,938,476Liabilities 861,058 852,413 4,668 1,718,139Sales - net 2,254,294 1,864,745 8,762 4,127,801Net income 173,288 44,192 83,601 301,081
2002
Assets 1,496,811 1,332,979 641,844 3,471,634Liabilities 670,337 689,922 9,648 1,369,907Sales - net 1,924,078 1,717,180 – 3,641,258Net income 149,069 32,854 25,639 207,562
The Group’s business is principally conducted in the following geographical areas as of December 31 and for the years then ended (000’s):____________________________________________________________________________________________________________________ Saudi Arabia Egypt Other countries Total___________________________________________________________________________________________________________________2003
Asset SR 3,557,443 SR 290,916 SR 90,117 SR 3,938,476Liabilities 1,580,958 123,105 14,076 1,718,139Sales - net 3,596,850 388,637 142,314 4,127,801Net income (loss) 293,587 (178) 7,672 301,081
2002
Assets 3,092,365 312,760 66,509 3,471,634Liabilities 1,251,902 82,013 35,992 1,369,907Sales - net 3,218,952 348,945 73,361 3,641,258Net income 214,359 4,949 (11,746) 207,562
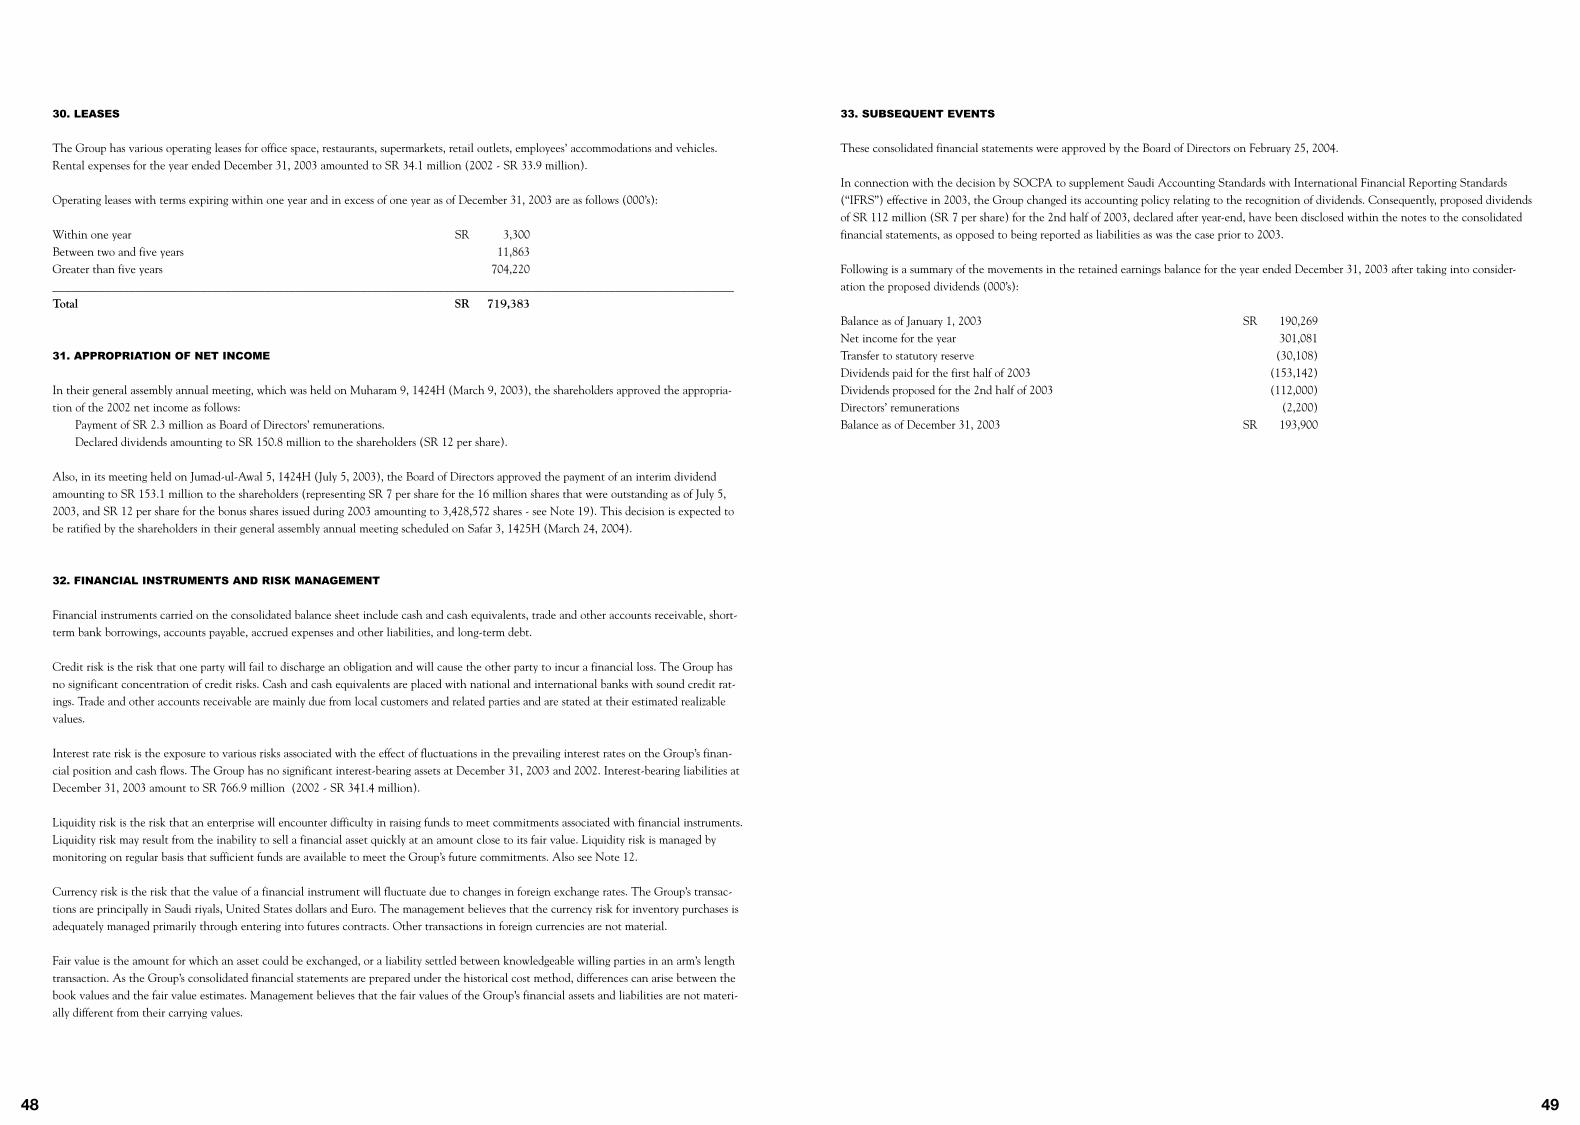
48 49
30. LEASES
The Group has various operating leases for office space, restaurants, supermarkets, retail outlets, employees’ accommodations and vehicles. Rental expenses for the year ended December 31, 2003 amounted to SR 34.1 million (2002 - SR 33.9 million).
Operating leases with terms expiring within one year and in excess of one year as of December 31, 2003 are as follows (000’s):
Within one year SR 3,300Between two and five years 11,863Greater than five years 704,220___________________________________________________________________________________________________________________Total SR 719,383
31. APPROPRIATION OF NET INCOME
In their general assembly annual meeting, which was held on Muharam 9, 1424H (March 9, 2003), the shareholders approved the appropria-tion of the 2002 net income as follows: Payment of SR 2.3 million as Board of Directors’ remunerations. Declared dividends amounting to SR 150.8 million to the shareholders (SR 12 per share).
Also, in its meeting held on Jumad-ul-Awal 5, 1424H (July 5, 2003), the Board of Directors approved the payment of an interim dividend amounting to SR 153.1 million to the shareholders (representing SR 7 per share for the 16 million shares that were outstanding as of July 5, 2003, and SR 12 per share for the bonus shares issued during 2003 amounting to 3,428,572 shares - see Note 19). This decision is expected to be ratified by the shareholders in their general assembly annual meeting scheduled on Safar 3, 1425H (March 24, 2004).
32. FINANCIAL INSTRUMENTS AND RISK MANAGEMENT
Financial instruments carried on the consolidated balance sheet include cash and cash equivalents, trade and other accounts receivable, short-term bank borrowings, accounts payable, accrued expenses and other liabilities, and long-term debt.
Credit risk is the risk that one party will fail to discharge an obligation and will cause the other party to incur a financial loss. The Group has no significant concentration of credit risks. Cash and cash equivalents are placed with national and international banks with sound credit rat-ings. Trade and other accounts receivable are mainly due from local customers and related parties and are stated at their estimated realizable values.
Interest rate risk is the exposure to various risks associated with the effect of fluctuations in the prevailing interest rates on the Group’s finan-cial position and cash flows. The Group has no significant interest-bearing assets at December 31, 2003 and 2002. Interest-bearing liabilities at December 31, 2003 amount to SR 766.9 million (2002 - SR 341.4 million).
Liquidity risk is the risk that an enterprise will encounter difficulty in raising funds to meet commitments associated with financial instruments. Liquidity risk may result from the inability to sell a financial asset quickly at an amount close to its fair value. Liquidity risk is managed by monitoring on regular basis that sufficient funds are available to meet the Group’s future commitments. Also see Note 12.
Currency risk is the risk that the value of a financial instrument will fluctuate due to changes in foreign exchange rates. The Group’s transac-tions are principally in Saudi riyals, United States dollars and Euro. The management believes that the currency risk for inventory purchases is adequately managed primarily through entering into futures contracts. Other transactions in foreign currencies are not material.
Fair value is the amount for which an asset could be exchanged, or a liability settled between knowledgeable willing parties in an arm’s length transaction. As the Group’s consolidated financial statements are prepared under the historical cost method, differences can arise between the book values and the fair value estimates. Management believes that the fair values of the Group’s financial assets and liabilities are not materi-ally different from their carrying values.
33. SUBSEQUENT EVENTS
These consolidated financial statements were approved by the Board of Directors on February 25, 2004.
In connection with the decision by SOCPA to supplement Saudi Accounting Standards with International Financial Reporting Standards (“IFRS”) effective in 2003, the Group changed its accounting policy relating to the recognition of dividends. Consequently, proposed dividends of SR 112 million (SR 7 per share) for the 2nd half of 2003, declared after year-end, have been disclosed within the notes to the consolidated financial statements, as opposed to being reported as liabilities as was the case prior to 2003.
Following is a summary of the movements in the retained earnings balance for the year ended December 31, 2003 after taking into consider-ation the proposed dividends (000’s):
Balance as of January 1, 2003 SR 190,269Net income for the year 301,081Transfer to statutory reserve (30,108)Dividends paid for the first half of 2003 (153,142)Dividends proposed for the 2nd half of 2003 (112,000)Directors’ remunerations (2,200)Balance as of December 31, 2003 SR 193,900

The Savola Group and its Subsidiaries
The Savola Group welcomes your constructive suggestions that might enhance the quality of services provided to our valued shareholders and customers. Our toll-free number is 800-244-0204. Or write to The Savola Group, Attention: Investor Relations Dept.
Headquarters8th Floor, Saudi Business CenterMadinah Road. – JeddahP.O. Box # 14455 Jeddah 21424 Tel: 657-3333Fax: 648-4119
Edible Oils DivisionSavola Edible Oils Co.Industrial Area Phase IIIP.O. Box # 30439Jeddah 21477Tel: 635-0000Fax: 637-3015
United Sugar Company (USC)Jeddah Islamic PortP.O. Box # 23023Jeddah 21426Tel: 649-2222Fax: 649-0088
Savola Packaging System (Plastic)Industrial Area Phase IVP.O. Box # 34490Jeddah 21468Tel: 638-0660Fax: 638-0711
Retail DivisionAl-Azizia Panda8th Floor, Saudi Business CenterMadinah Road. – JeddahP.O. Box # 14455, Jeddah 21424 Tel: 657-3333Fax: 648-4119
Chamber of Commerce membership No. 3012 C.R. 4030019708 Jeddah.
A Saudi joint stock company with a capital of SR 800,000,000 fully paid up.
Please visit our website: www.savola.com
The Group has its headquarters in Jeddah,
a city of 2.5 million people, and
the second largest city in Saudi Arabia,
after the capital Riyadh.
Jeddah is the hometown to
about 25% of non-oil Saudi industries,
75% of Saudi commerce,
and is the main gateway for pilgrims
visiting the two Holy cities
of Makkah and Madinah.
Jeddah is the primary shopping and
leisure destination in the Kingdom, with
more than 25% of Saudi hotel capacity.
50 51
Peace and prayers be upon our Prophet Mohammed,
to his Honest Companions, and to those who follow them
with favor up to the day of judgement