Embed Size (px)
Citation preview

The Safe Learner: the impact of individual differences and workplace
environment on attitudes to health and safety training
Linda Miller and Nick Jagger
REPORT 484

The Safe Learner: the impact of individual differences and workplace environment on attitudes to health and safety training
Linda Miller
Nick Jagger

ISCBU
TEW
C
I
nstitute for Employment Studiesovereign House hurch Street righton BN1 1UJ K
elephone: +44 (0)1273 763400 mail: askies@employment‐studies.co.uk ebsite: www.employment‐studies.co.uk
opyright © 2011 Institute for Employment Studies
SBN: 978 185184 439 5
Institute for Employment Studies
IES is an independent, apolitical, international centre of research and consultancy in HR issues. It works closely with employers in all sectors, government departments, agencies, professional bodies and associations. IES is a focus of knowledge and practical experience in employment and training policy, the operation of labour markets, and HR planning and development. IES is a not‐for‐profit organisation.
Acknowledgements
We are indebted to Chrissy Falck and John Atkinson at the Skills Funding Agency (SFA) (formerly the LSC) for their continuing enthusiasm and support for this work; we are also extremely grateful to Jill Joyce (now at IOSH) and Marilyn MacFarlane (now working outside the UK) for commissioning the work that led into this, and to Marilyn for her support in the early days when we were first designing this project.
In undertaking this work we have drawn on a wide range of measures reported elsewhere in the literature. In particular we would like to thank Professor Dave Hofmann at the University of North Carolina for permission to use the Frequency of Unsafe Behaviors Scale and Professor J. Craig Wallace of Oklahoma State University for permission to use the Cognitive Failures Scale and for supplying the full versions of these.
At IES we would like to thank our colleagues Gill Brown for her assistance in producing the survey questionnaires and this report; Denise Hassany, for the long days spent entering data into SPSS on our behalf; and Jim Hillage, for helpful discussions on data analysis.
Most of all, our thanks go to the individuals at the three participating institutions who willingly gave so much of their time to distributing, collecting in and returning the questionnaires. To ensure the anonymity of the three sites we are unable to name you, but our grateful thanks go to each of you: without you, none of this research would have been possible.

Contents
Executive Summary v
1 Introduction 1
1.1 Health and safety at work in the UK 1 1.2 Factors influencing safety behaviours 3 1.3 Objectives 5 1.4 Structure of this report 6
2 Method 7
2.1 Overview of method 7 2.2 Design 7
3 Profile of the participating learner populations 13
3.2 Summary 17 3.3 Implications for analyses 18
4 Health and safety induction and instruction for new work‐based learners 19
4.1 Raising awareness of H&S before work 19 4.2 Health and safety induction at work 19 4.3 Health and safety instruction at work 21 4.4 The Safe Learner – learner views of content 25 4.5 Summary 33
5 Supervision at work 34
5.1 Are apprentices left unsupervised? 34 5.2 Summary of findings on supervisory absence 36 5.3 Does supervisory absence matter? 37 5.4 Discussing health and safety issues at work 38
iii

6The impact of organisational influences and individual differences on learner behaviours a
6.1 Outcome measures 42 6.2 Measures of organisational safety attitudes 42 6.3 Individual differences 49
7 Unrealistic optimism 58
7.1 How likely are you to have an accident at work? 59 7.2 How likely are injuries at work? 61 7.3 Occupational illnesses 64 7.4 Summary of findings for unrealistic optimism 67
8 Modelling the interactions 69
8.1 Structural Equation Modelling 69 8.2 The models 70 8.3 The underlying data and constructs 70 8.4 First years’ model 71 8.5 Longitudinal model 75
9 Discussion and recommendations 78
9.1 From the modelling process 78 9.2 From the repeated measures analyses 79 9.3 Comparing year one and year two surveys 80 9.4 Conclusions and recommendations 81
References 85
Appendix 1: H&S issues explored 88
Appendix 2: Proportion of learners being left unsupervised 97
iv
Executive Summary
Training is important but it is only one of the factors which play a part in keeping learners safe. The research attempted to find out what other factors influence the behaviour of learners in work.
The Safe Learner blueprint sets out the health and safety information that should be covered by training providers and employers of individuals in work‐based learning. The intention of the Safe Learner blueprint is to influence learners’ safety behaviours in work as well as in the learning situation, by increasing their health and safety knowledge and awareness of the actions they should take.
However, many factors other than quality of health and safety training influence health and safety at work: the learner’s own attitudes, workplace safety culture, role overload and individual differences can reinforce or moderate the impact of health and safety training. For this reason the LSC commissioned this longitudinal study in 2007, in order to gain more information on the factors that influence learners’ behaviours and to help them understand the way in which funded provision in this area can be reinforced or undermined by the work setting and individual learner attributes. One interim report was published in 2008 and this is the final report arising from the work1.
In 2007/08 the research surveyed 234 learners and 135 of those learners were tracked into the current year. A further 190 new learners were recruited to the research cohort in 2008/09.
Three providers recruited learners to the survey and distributed a paper‐based questionnaire to participants on behalf of IES in 2007/08 and 2008/09. The questionnaire asked learners about their attitudes to health and safety training, the behaviours of supervisors and colleagues at their place of work, and asked them to
1 Note that in April 2010 the LSC became the Skills Funding Agency.
v

assess themselves on a range of personality and behavioural measures that previous research have indicated are linked to safe (or unsafe) behaviours at work.
In 2007/08 the research surveyed 234 learners. In 2008/09, some 135 of those original participants were tracked into their second or third year of study and, in addition, a further 190 new learners who had commenced the first year of their apprenticeship in autumn 2008 were recruited to the research cohort.
In total in 2008/09 333 completed survey questionnaires were returned, of which 325 were useable. Figure 1 provides an illustration of the study design.
Figure 1: The research design
First years Second years Third years
2007/08
First round of survey
2008/09
Second round of survey
New intake Existing learners Existing learners
New intake
Continuing learners: subset of 2007/08 First year
learners
Continuing learners: subset
of 2007/08 Second year learners
New intake
Continuing learners: subset of 2007/08 First year
learners
Continuing learners: subset
of 2007/08 Second year learners
Source: IES
Many young learners leave school without having received any health and safety instruction...
The data this year show that slightly more (61.4 per cent) of the new learner intake said that they had been told about health and safety issues by their school or work placement organisation before starting work than last year, when 57.3 per cent said they had received health and safety instruction at school. While the increase is welcome, nonetheless this means that many learners still do not receive any health and safety instruction prior to leaving school and starting work.
…but health and safety induction for young workers appears to be improving
Just over one‐fifth of the first year learners surveyed last year (22.1 per cent) said they had received no health and safety induction when they started work. In 2008/09, the proportion of first year learners reporting that they had received no health and safety induction fell to just 11.3 per cent, approximately one in ten. The proportion of new apprentices reporting they had not received a health and safety induction appears therefore to have nearly halved since 2007/08. Coverage of all but one of the Safe Learner Blueprint topic areas had increased, and where there
vi

was a decline (in ‘Any personal protective equipment or clothing you should use?’) the decline was only slight, from 94.6 to 92.6 per cent coverage. This may reflect the changed composition of the first year group in this second year of the survey.
A significant proportion of young workers report being left to work unsupervised….
Last year, across all the learners surveyed, under half (44.9 per cent) of all learners said that their supervisor gave them instructions about health and safety. Looking solely at the first year learner cohort within that year, 47 per cent said they received health and safety instructions from their supervisor.
This year, more than half of all learners said that their supervisor gave them instructions about health and safety (52.9 per cent), with 53.3 per cent of first year learners saying this. In both cases there has been a slight increase in good practice amongst supervisors compared to the previous year, although equally the data indicate that many supervisors still fail to talk to their young workers about health and safety.
Are learners being adequately supervised?
In 2007/08 the survey findings revealed that a large proportion of learners – and of most concern, younger learners – were left unsupervised. Over half (59.1 per cent) of all learners reported being left unsupervised. While for older learners this might be expected, even amongst the 16 year olds, a significant proportion (49.3 per cent) reported being left unsupervised. A sizeable proportion of young learners were being left unsupervised for periods of over an hour and, in some cases, up to a day.
However, concerns were raised by the providers regarding the way in which these questions had been interpreted by the participants. They suggested it was possible that the learners merely meant that they were not watched constantly by their supervisors, rather than the supervisor being in a different part of the premises, or on a different site. For this reason, in the 2008/09 survey the wording of these questions was modified to avoid the potential for ambiguity and was phrased as follows: ‘Are you ever left to work unsupervised (this means that your supervisor is not in the same work area as you)?’
Looking first at the new learner intake for 2008/09, the survey again showed that a considerable proportion of the youngest and most inexperienced learners report being left unsupervised. Because we changed the wording to the question, we can be confident that this really does mean that these young learners are being left
vii

without a supervisor within the area, rather than simply not under close scrutiny. This clearly remains a cause for concern.
Looking at all first year learners, and grouping them into ‘high risk’ and ‘lower risk’ occupations (eg construction, gas, carpentry and joinery versus childcare, administration and hairdressing) some 62.3 per cent of all first year learners in high risk occupations report being left to work unsupervised, compared to 50 per cent of learners in lower‐risk occupations.
Looking next at how long 16‐19 year old are left unsupervised for, the majority of 16‐19 year olds who report being left alone say this happens only for short periods – largely up to half an hour at a time. Of the remainder, though, around one in eight were left for up to an hour and one in ten left for a couple of hours, while seven per cent, or around one in 14 of learners in this age range, were left unsupervised for up to a day. In total, some 17.5 per cent of learners in the age range 16‐19 were left unsupervised for over an hour at a time.
Looking at how frequently young novice apprentices are left unsupervised, while most are left unsupervised only occasionally and only for fairly short periods of time, some are frequently left alone for extended periods of time. However, learners being left unsupervised for extended periods of time is happening less frequently amongst the current group of novices, compared to 2007/08.
How does this compare with last year? Last year, 12.7 per cent of first year learners reported being left unsupervised for between a couple of hours and up to a day either once or twice a week or nearly every day; this year, the proportion reporting this fell to just 7.3 per cent of all first year apprentices.
It is not possible to ascertain the reasons for this improvement without further exploration of the employers themselves, which is outside the remit of the research. This shift may simply reflect a different subset of employers in this year’s sample compared to last years or a general improvement in management practices amongst employers in general.
In general, though, this year’s data confirmed the findings from the first year of the research. Many learners are being left unsupervised, and some young and inexperienced learners are being left unsupervised for what are sometimes extended periods of time.
…and supervisors who leave learners unsupervised are also less likely to discuss health and safety issues with them. Unsupervised learners are more likely to do unsafe things at work.
Fewer of the learners who were left unsupervised said that their supervisor often discussed health and safety with them. While one‐third of the learners who were
viii
not left unsupervised said their supervisor often did so, fewer than one in five of those who were left unsupervised said their manager often discussed workplace health and safety issues with them. These findings were statistically significant.
However, while fewer of the ‘unsupervised’ learners said their supervisor discussed risky activities at work than did the ‘supervised’ learners, the difference was not statistically significant this year. Similarly there was no significant link between their reports of lack of supervision and either reports of their own involvement in risky activities at work or colleagues’ involvement in risky actions.
Learners who were left unsupervised were significantly more likely to report engaging in unsafe behaviours (eg not using PPE) than were those who were not left unsupervised.
Weaker evidence overall this year of a link between lack of supervision and likelihood of an accident but emerging evidence of a trend over time
In 2007/08 just over 20 per cent of learners had been involved in some sort of health and safety incident. In 2008/09 the proportion reporting this had fallen to just over 15 per cent (13.6 per cent amongst first years). Most of the incidents occurred amongst first year, level 2, learners. Next we consider the extent to which these are associated with lack of supervision.
Last year’s data (2007/08) revealed that nearly three times as many learners who reported being left unsupervised experienced some type of accident or incident, compared to those who did not report being left unsupervised (30.3 per cent compared to 11.1 per cent). In addition, while just 13.3 per cent of those who were never left unsupervised had witnessed colleagues have accidents, more than a third – 36.1 per cent – of those who were left unsupervised at work had witnessed colleagues have accidents. We therefore concluded that supervisory presence may be a central indicator of workplace safety practice or climate.
The data for this year do not show these dramatic differences. Overall, there is only a slight difference in incident rates amongst those who are left unsupervised or are supervised appropriately: 15.5 per cent of those left unsupervised have been involved in an incident compared to 15.2 per cent of those who are supervised.
Looking at first year and continuing learners separately indicates that a trend may be emerging. Counter‐intuitively, more of the first years who are continuously supervised had been involved in incidents at the time of the 2008/09 survey (15.3 per cent) compared to those who were sometimes left unsupervised (13.3 per cent). Looking at the continuing learners, 18.1 per cent of those left
ix

unsupervised had been involved in an accident or incident compared to 15.2 per cent of those who did not report being left unsupervised.
Looking at whether the learners had seen a colleague involved in an accident, a similar pattern of results is seen. While far less pronounced than in the previous year, more of those who report being left unsupervised also say that a colleague has had an accident. Amongst first year learners this year 22.3 per cent of those left unsupervised reported this, compared to 20.5 per cent of those not left unsupervised; amongst continuing learners 31.9 per cent of those left unsupervised reported having seen a colleague have an accident, compared to 18.2 per cent of those who were not left unsupervised.
While less clear‐cut than last year we would argue that these data still support our contention that learners are, through their reports of being left unsupervised, accurately reporting fairly substantial neglect of supervisory duty in some cases. The higher rates of accidents in these workplaces, although only slight in comparison with last year, indicate that inadequate supervision remains an issue; in conjunction with the far greater rates of accidents amongst colleagues in these workplaces, this suggests that supervisory neglect is part of a wider cultural disregard for health and safety.
Those learners who work in organisations with a poor safety climate are more likely to be subject to pressure at work, engage in unsafe behaviours and have accidents.
Safety climate is a psychological phenomenon, usually defined as the ‘perceptions of the state of safety at a particular time’ and offers a ’snapshot’ of safety culture. Learners gave an assessment of the safety climate of their employing organisation on a standard measure of safety climate. A narrower spread of scores was obtained on this measure than last year, with the lower bound increasing. This means that, overall, the learners were employed in companies with better (or at least less poor) safety climates. In 2007/08 the spread of scores ranged from 30 (lowest) to 90; in 2008/09 the scores ranged from 39 to 90.
Learners in workplaces with lower safety climate scores were significantly more likely to have been involved in an accident or incident. However, this year, although those who had witnessed a colleague accident did give lower ratings of safety climate, the analysis did not achieve statistical significance (p = .066, above the normal cut‐off point for confirming significant results).
Learners who worked in a company with lower safety climate scores were significantly more likely to admit to engaging in unsafe workplace behaviours.A poor safety climate was also found to be associated with increased levels of role overload. Learners who reported higher levels of role overload were significantly
x
more likely to report that they often or occasionally did dangerous or risky things at work. Learners who engaged more regularly in unsafe behaviours were significantly more likely to have been involved in an incident at work.
What affects how relevant learners see the health and safety training as being?
Usefulness and relevance of the Safe Learner training. Learners were asked to rate each of the topic areas within the Safe Learner Blueprint for relevance and usefulness. Both first year and continuing learners rated the health and safety training they received as useful and relevant, but first years rated the training as significantly more relevant and useful than did the continuing learners. This mirrors findings with other groups of learners, such as nurses, of the decline of positive views towards health and safety issues over time. This was one of the reasons for including this in the current research.
Learners whose supervisors discussed health and safety issues and risky activities with them viewed the health and safety training they received at college/training provider as being significantly more useful and more relevant than did those learners whose supervisors did not discuss health and safety with them. They also maintained more positive views of the relevance of the safe learner training over the space of a year than did those who supervisors did not discuss health and safety with them.
If learners believed they would be able to apply the Safe Learner training they were more likely to see it as relevant and useful. Learners think that the health and safety training is more relevant when they believe they will be able to apply the information they are learning, and they also think that the training is more useful when they believe they will be able to apply it. This relationship was not found for the question which asked learners how important it would be to remember the Safe Learner training.
But continuing learners believe it less likely they can apply the learning than first years. First year learners gave significantly higher responses than continuing learners on the questions which asked them if they believed they would be able to apply the information in work; this was also the case for the question on how much of the safe learner information it would be important to remember. This implies that where there is a poor safety climate in a work group, the influence of the training that apprentices receive in health and safety starts to wane.
Personality may influence the extent to which safety training is perceived as relevant. The personality variables ‘conscientiousness’ and ‘task focus’ correlated with the extent to which learners saw the training as relevant, but in line with the previous findings, did not impact on perceived usefulness.
xi

Safety climate also impacts on relevance and use of the Safe Learner training. Safety climate scores were also significantly and positively associated with learners’ perceptions of relevance and utility of the health and safety training. In general, the better the safety climate of the company in which the learner works, the more relevant and useful they perceived the health and safety training to be. Learners in companies where there is a poor safety climate see less opportunities to apply the Safe Learner information than do those in companies with a stronger safety climate.
Personality – conscientiousness, staying ‘on-task’ and cognitive failure
Conscientiousness is a personality variable that other researchers have found to be related to safe behaviours. Similarly, the ability to remain task‐focused has been suggested as a factor that contributes to a worker’s ability to avoid accidents. Conversely, cognitive failure (lapses in attention or memory) serve to make workers more likely to have accidents. In the previous year we had tested the impact of cognitive failure, but not on‐task behaviours. A measure of on‐task behaviour was therefore added to this year’s survey.
Conscientiousness was found to be significantly correlated with a range of other variables: with on‐task behaviours, with perceived relevance (but not usefulness) of the health and safety training, with safe workplace habits and with wider safety climate. It also correlated inversely with cognitive failure, which means that more conscientious individuals are less likely to suffer from cognitive lapses. Unlike last year, though, the measure was not correlated with learner age.
The significant relationship between role overload and cognitive failure was confirmed in this year’s data, with increasing levels of role overload leading to increasing numbers of cognitive slips.
Learners who reported higher levels of cognitive failure were significantly more likely to engage in unsafe work behaviours. They were also significantly more likely to have had an accident or incident.
On‐task behaviours and cognitive failure are inversely correlated.
Young learners who score more highly on the on‐task measure view the health and safety training as significantly more relevant and more useful. They are also significantly less likely to engage in unsafe behaviours at work. However, despite this, young learners who score highly on this measure are not significantly less likely to have an accident or incident than are young learners with a lower score. This suggests that task focus acts via other factors, rather than being directly related to probability of an accident.
xii
Unrealistic optimism at work
Unrealistic optimism is the belief that we are less likely to suffer misfortunes than our peers. This has received wide attention in the public health arena as it can hinder attempts to encourage people to take more exercise, to stop or reduce dangerous behaviours (eg smoking, eating fatty foods, etc.). Last year we examined the concept of unrealistic optimism amongst the young learners and found, first, that in common with reports in many other areas, young learners tend to believe that accidents and occupational illnesses are less likely to happen to themselves than to other young people. We also found that young learners who had been involved in an accident or incident gave more cautious (more realistic) assessments of their likelihood of future injury or illness; we also found the same effect for those who had witnessed a colleague have an accident. This year, each of the analyses for likelihood of being involved in an accident, sustaining an injury and suffering from an occupational disease again showed the same shift towards more realistic assessments for those who had had, or seen a colleague have an accident.
Modelling the data
Some of the findings from last year’s data appear to have declined or disappeared this year. We believe this is due in large part to the change in employer profile and consequent reduced range of variance in the scores, in particular the raising of the lower end of the range of scores for safety climate. However, other relationships have been shown to be robust, and with the emergence of these strengthened links a model is beginning to emerge of the ways in which these different factors come together to impact on learner safety and increase or reduce young people’s likelihood of having an accident at work.
The data have been used in developing a model that was tested to establish the factors and paths that drive the probability that accidents will occur. Tests of the model through successive rounds to achieve the best ‘fit’ revealed that there are two main groupings of factors that influence accident probability: one is a group of factors to do with the learner’s work environment and the other is to do with the learner’s own attributes. Of the two, the work environment is the stronger determinant of incidents.
Conclusions and recommendations
Overall, the health and safety messages learners receive from their tutors are well‐received and seen on the whole as relevant and useful, but this is mediated by the safety climate in the employing organisation and in particular by the apprentice’s supervisors.
xiii

Providers appear to be getting better at delivering the Safe Learner message year on year. The more qualitative elements of the work suggest that some learners still receive little or no safety training at work. For these learners, the Safe Learner training is almost literally a lifeline.
This work has confirmed one of the factors identified in the early days when the basis for the Safe Learner framework was being explored. Supervisory behaviour was identified early on as a key challenge: this work suggests the same is true today.
This suggests that future policy initiatives should focus on workplaces and in particular on the role of supervisors. Our recommendation is that the Government should consider making it a requirement for supervisors of apprentices that they attain qualifications in supervision and health and safety. Sector Skill Councils could play a role in leading such a development, particularly those who represent workers in the higher risk sectors. Overall, the policy and practice recommendations arising from this work are:
Learners are more likely to apply information they see as relevant. Ideally health and safety training should be designed to be maximally relevant to the learners’ own job – the more tailored and occupation‐ or sector‐specific a provider can make the information, the better. In particular the links between specific tasks and the control measures need to be made more relevant for an individual’s situation. Increased relevance is likely to increase the apprentice’s understanding. As the FE sector moves towards self regulation this may be something to consider as part of a continuous improvement strategy.
At learner review sessions, tutors should regularly discuss supervisory arrangements and pressure of work. We know that providers are often trying to reinforce good health and safety practice against a backdrop of poor organisational safety culture. Advice on how to cope with workplace pressures could be incorporated into the Safe Learner training input.
Over time, organisational culture can make young workers less responsive to health and safety issues. Providers might want to consider using a safety climate measure in class as a basis for group discussions or to identify any learners in their group who are likely to need extra support (this would also enable providers to identify the employers who need targeting too). There are links also to the safeguarding agenda. It should be noted that all Skills Funding Agency‐funded organisations are required to undertake an assessment to identify if they have any vulnerable learners and to use controls where deemed to have them.
Providers are well‐placed to emphasise to employers the importance of supervisory support for learners. Providers could advise employers on the link between supervisory absence and increased risk of accidents (to all workers, not
xiv

just apprentices) and emphasise the fact that taking steps to improve supervisory practices could save them money, as well as potentially improve success rates of learners and the quality of the learning being delivered.
There may be some commercial benefits for providers arising out of this, too. Providers of apprenticeship programmes may wish to consider offering supervisory training programmes to their client companies. Providers could also advise employers on the link between supervisory absence and increased risk of accidents (to all workers, not just apprentices) and emphasise the fact that taking steps to improve supervisory practices could save them money1.
There is some evidence that witnessing colleagues have accidents leads learners to be more cautious in work. Discussions with learner groups of accidents occurring in the learners’ workplaces would provide learners with vicarious experience of accidents in situations that are likely to be familiar (and realistic) to them.
There are two main recommendations to the Skills Funding Agency arising from this work. The first is that the Skills Funding Agency makes a review of supervisory arrangements a component of learner progress reviews, alongside a requirement for those arrangements to be logged.
The second is that the Skills Funding Agency recommends that supervisory awards become a requirement for supervisors of apprentices, in much the same way that workplace assessors of NVQs are required to hold assessor awards. While the Skills Funding Agency is moving away from giving mandatory instructions to providers, this could become an aspect of quality requirements.
For employers, forewarned is forearmed. The work strongly suggests that supervisory attitudes directly impact on the safety of workers. Employers will save money if they improve supervisory arrangements. Better selection and training of supervisors of apprentices would be money well spent.
While a good safety culture and good training input will help apprentices stay safe, some young people are more likely to have accidents than others. Employers may wish to review their selection procedures to take on board the emerging findings about personality variables linked to risky behaviour – or provide closer supervision/buddying for young workers identified as possibly constituting a higher risk.
1 For instance, research by the HSE gives factual information on the real costs of accidents; breaking down the costs to the individual, the employer, and to society (Source: The costs to employers in Britain of workplace injuries and work related ill health in 2005/06)
xv

xvi
Institute for Employment Studies 1
1 Introduction
1.1 Health and safety at work in the UK
Provisional figures released in 2008 by the Health and Safety Executive (HSE) revealed that 241 people were killed in work during 2005/ 06. A further 29,450 individuals (97 in every 100,000 workers) received major injuries and 114,222 (nearly 368 individuals in every 100,000) received injuries necessitating more than three days off work. It is not just personal injury (or death) that is at stake: the HSE suggests that the costs of accidents and injuries per year are an estimated £3.3 to £6.5 billion (HSE, 2005).
In the UK, employers are required by the provisions of the Reporting of Injuries, Diseases and Dangerous Occurrences Regulations 1995, (RIDDOR) to report all major injuries and injuries necessitating more than three days off work. However, the HSE believes that the numbers of accident reports they receive are likely to constitute significant underestimates of the actual numbers of incidents in the workplace: they have estimated that fewer than half (between 43 and 48 per cent) of incidents leading to three days’ absence from work are actually reported by employers. Their main reason for suspecting this is that data from the Labour Force Survey (LFS), a quarterly, sample‐based survey of the British population weighted to provide representative statistics for the UK population as a whole, reveals that far more employees report having been involved in accidents at work (and having taken more than three days sick leave as a result) than would be predicted based on reports received by the HSE from employers.
1.1.1 Health and safety of young workers
Apprentices and trainees (as well as other young workers) can be particularly at risk of accident due to their inexperience and emotional lability. Turning again to the LFS data, one of the questions asks respondents if they are ‘currently registered on a recognised trade apprenticeship’, while another asks respondents

2 Safe Learner Final Report
if they have been involved in an accident resulting in injury at work in the last twelve months. Using these questions it is possible to compare the injury rates for those in apprenticeships compared with other workers. The LFS also allows these data to be compared across industrial sectors and for different age groups. Analyses undertaken using the LFS data by Miller et al. (2005) showed, firstly, that across all apprentices, 6.1 per cent reported that they had been involved in some type of accident at work in the last year. The apprentice group as a whole includes a sub‐set that has completed their apprenticeship in the last year. Apprentices who had completed their apprenticeship were less likely to have had an accident than were continuing apprentices. The accident rate at work for employees who had completed their apprenticeship was 5.7 per cent, compared to 6.4 per cent for the less‐experienced group. This confirms the suggestion that young workers who are still undergoing training are more likely to be involved in accidents than those who are fully trained. However, the analyses also revealed that young workers on apprenticeships were 7 per cent less likely to be involved in an accident at work than young workers who were not on formal training programmes. This suggests that, while those in training may be more vulnerable than fully‐trained adults, nonetheless approved training programmes can play a significant role in helping young workers to work safely and avoid accidents.
1.1.2 The Safe Learner Blueprint
During 2004/05 the Learning and Skills Council (LSC) had introduced and piloted a framework for health and safety training (the ‘Safe Learner Framework’). The framework was evaluated during 2005, with the evaluation indicating that the programmes based around the Safe Learner framework led to slight, but significant, gains in learner knowledge about the correct actions to take in hazardous situations (Miller and Hunt, 2006). Following that evaluation the LSC rolled out the ‘Safe Learner Blueprint’ based upon a framework which sets out the elements that require planning and implementation (known as inputs) in order for the learner to develop a safe set of behaviours (called outputs) so that they are ‘risk aware’ at work (rather than risk averse) and ensure that occupational health and safety is intrinsic in the workplace, with sound working methods (rather than a ‘bolt‐on’ afterthought) as well as ensuring that learners understand the importance of proportional occupational health and safety practice. The Safe Learner Blueprint was devised following extensive research into key elements that training providers and employers need to consider in order that learners become more risk aware when in work based learning (WBL) and in the workplace. The outputs that learners develop are intended to assist them in understanding the role they play in making the workplace a safer and healthier environment.

Institute for Employment Studies 3
While the evaluation provided some evidence of ‘learning’ (ie, level 2 in Kirkpatrick’s evaluation model; Kirkpatrick, 1994) it was unable to provide any evidence of the programme’s impact on behaviour and attitudes at work; that is, the issue of transfer to the workplace. Attitudes and behaviours are central to the transfer of good practice to the workplace, and, therefore, arguably of far greater importance in terms of improving health and safety of young learners. Behavioural assessment constitutes ‘level 3’ in the Kirkpatrick model.
IES therefore proposed undertaking a longer‐term evaluation of the impact on behaviour of the safe learner programme on learner behaviour. Kirkpatrick’s fourth level of evaluation focuses on impact at the level of the organisation. For health and safety training, that would imply fewer accidents, incidents and days’ work lost, as appropriate measures of impact. However, for health and safety training, there is a complication in attempting to relate training in health and safety to organisational performance in a straightforward fashion. Many factors apart from quality of health and safety training and the actions of individuals have been demonstrated to influence health and safety at the level of work unit and organisation. One particular complication, for any evaluation attempting to look at organisational safety performance, is that existing safety performance is likely to be related to the safety climate prevailing within the organisation, which will serve to reinforce (or weaken) any learning gained at college/training provider. In addition, there is evidence that individual differences can serve to reinforce or moderate the impact of the SL training.
The decision was taken to examine the impact of the Safe Learner input in combination with an assessment of the impact of workplace safety culture, role overload and individual differences. The background to selection of the measures used is set out next.
1.2 Factors influencing safety behaviours
1.2.1 Role of the supervisor
Training in health and safety is clearly an important first step in ensuring the safety of learners. However, training on its own is not sufficient. A range of other factors impact on workplace safety. Previous research by IES (Kerrin et al., 2002) had pointed to the importance of the workplace supervisor in encouraging learners to transfer safe behaviour learnt in training into the workplace. It was a requirement of employers signing up to the Safe Learner Framework that their apprentices should be supervised at all times. In relation to supervisory behaviours, the evaluation (Miller and Hunt, 2006) revealed two important findings: first, while the learners in the Safe Learner group were less likely than those in a control group (a group of learners not enrolled in the Safe Learner pilot)
4 Safe Learner Final Report
to be left unsupervised, nonetheless a sizeable proportion did report being left alone; and second, that those apprentices whose supervisors spoke to them about health and safety issues scored higher on the health and safety test. For this reason we included supervisor actions within the research.
1.2.2 Workplace safety climate
Furthermore, a range of workers have noted the importance of workplace safety culture in encouraging safe behaviour: these include Pidgeon (1991) and Cox and Cox (1991). There have been as many, if not more, attempts to develop instruments to assess workplace safety culture and climate or to determine factors that impact on safety culture (as examples, see Cox and Cheyne, 2000; Lee and Harrison, 2000; Lingard, 2002; O’Toole, 2002). In this work, the Salminen and Seppala (2005) measure of safety climate and the Zohar (2000) Group Safety Climate scale were both used in year one; in year two, only the Salminen and Seppala scale was used.
There is likely to be a range of related safety‐critical factors at play within organisations with poor safety climate. It seems likely that people will be more likely to be put under time pressures in such organisations, and people tend to have more accidents when under pressure. Role overload has been associated both with lapses in concentration and with subsequent accidents and incidents (Hofmann et al., 1995). It was therefore decided to include a measure of role overload within the overall package of assessment measures to be utilised in the research.
1.2.3 Individual differences
In addition to training and organisational safety culture, individual factors play a part too. This is one area in which there has been much research attention in recent years. Individual factors may include attitudes and beliefs but there are also differences between individuals in factors such as conscientiousness and propensity to cognitive failure (Broadbent, Cooper, Fitzgerald and Parkes, 1982). In recent years, Wallace and Vodanovich have been leading researchers examining the impact of such variables on occupational safety (Wallace and Vodanovich, 2003a and b; Wallace, 2004; Wallace, Vodanovich and Restino, 2003), with Wallace and Chen most recently having focussed on the development of a measure of cognitive failure (Wallace and Chen, 2005). This measure was used in the current work. In the second year of the work (2008/09) a measure of on‐task behaviours was added (Kanfer et al., 1994). The eight items from the conscientiousness subscale of the Saucier Mini Markers scale (Saucier, 1994) were used to assess conscientiousness in both years of the work.

Institute for Employment Studies 5
The frequency with which individuals engage in unsafe behaviours at work has been found (perhaps unsurprisingly) to be related to their likelihood of subsequently having an accident. Therefore the Hofmann and Stetzer (1996) measure of frequency of unsafe workplace behaviours was included within the questionnaire designed for the work.
A further variable of interest is the phenomenon that has been labelled ‘unrealistic optimism’ (Robertson, 1977; Weinstein, 1980). This has been defined as the tendency to perceive negative events as being less likely to happen to oneself than to others, and, conversely, for positive events to be more likely to happen to oneself. It is easy to see how a tendency to believe that one is relatively immune to accidents could impede the adoption of safe behaviour at work (and elsewhere) and thereby undermine the effectiveness of the safe learning training input. If learners view accidents at work as being more likely to happen to other people than to themselves then learners may see little reason to alter their own behaviour. Measures of unrealistic optimism were therefore included within the questionnaire in both years of the work.
Age
It is noteworthy that, while there are many accounts in the literature of training initiatives aimed at improving safe behaviours in the workplace and preventing work‐related injuries and ill‐health, few, if any, to date have focussed specifically on apprentices, trainees and other young work‐based learners as a group of interest. The absence of any significant literature relating to this group is of concern, because, as the above figures reveal, the situation of young work‐based learners is one of particular vulnerability: they are by definition lacking in experience; unlike older workers, they are working in situations in which almost everything is novel, and many will be learning to work in situations that involve the use of dangerous equipment, procedures or chemicals. Under such circumstances, it is perhaps unsurprising that the cognitive demand on these young people will lead a proportion to suffer ‘cognitive failure’, with this leading, in some cases, to accidents and injuries. What is surprising, however, is that little research has focused specifically on the factors influencing safe working (and the adoption of safe working practices) amongst young work‐based learners. This was the subject of the current project.
1.3 Objectives
1.3.1 Aims and objectives of the research
The aims of the research were to:

6 Safe Learner Final Report
■ explore learners’ attitudes and beliefs towards the health and safety knowledge they receive at their college/training provider and any additional knowledge they believe is required
■ examine the organisational and individual difference factors that impact on learner health and safety at work
■ explore whether attitudes to safety change over time as a result of greater maturity, workplace safety culture, or further training.
The intention, therefore, is to explore the impact of the safe learner training model on learner behaviour in the workplace in the longer‐term (over two years), while taking into account the role of supervisory attitudes, organisational safety culture, role overload and individual differences as moderating variables mediating the exhibition of safe or unsafe behaviours.
1.4 Structure of this report
The report is structured in the following way:
Chapter 2 gives an account of the design, the method and the procedure. The chapter also includes an account of the rationale for the various measures included in the survey questionnaire.
Chapter 3 provides an analysis of the profiles of the learner participants across the two years of the project, and the implications of these for the later analyses.
Chapter 4 reports on the induction received by new apprentices and their views of the health and safety instruction they receive.
Chapter 5 considers issues to do with supervision of apprentices at work.
Chapter 6 explores the organisational factors and individual differences that contribute towards risk of having an accident.
Chapter 7 reports on the analyses examining unrealistic optimism amongst apprentices.
Chapter 8 reports on modelling of the data to derive the critical factors and the paths that are instrumental in contributing to accidents.
Chapter 9 presents a discussion of the work as a whole and the policy implications.
Institute for Employment Studies 7
2 Method
2.1 Overview of method
The intention was to follow a group of apprentices over two years to determine the extent to which each of the following impacts on safety attitudes:
■ the training they receive
■ organisational safety climate
■ supervisor influence
■ time pressure
■ individual differences
■ individual attitudes (that is, the extent to which outcome attitudes remain in line with, or change from, attitudes at start‐out).
The method adopted was a paper‐based survey, distributed at three LSC‐funded providers of apprenticeship training. Details of the design, materials and procedure are given next.
2.2 Design
A longitudinal repeated measures design was adopted. In the first year of the project (2007/08) learners were surveyed during their first term, as close as possible to induction week as the organisations could manage. Learners across first, second and third years of apprenticeships were invited to participate. Two different versions of the questionnaire were developed, one for first year learners, one for second and third years (see section 2.2.1).
In the second year, (2008/09) a new cohort of incoming first year apprentices was surveyed and, in addition, the continuing first and second year students from

8 Safe Learner Final Report
2007/08 were re‐surveyed. Again, two slightly different versions of the same basic questionnaire were used.
The design of the research is shown in Figure 2.1:
Figure 2.1: The research design
First years Second years Third years
2007/08
First round of survey
2008/09
Second round of survey
New intake Existing learners Existing learners
New intake
Continuing learners: subset of 2007/08 First year
learners
Continuing learners: subset
of 2007/08 Second year learners
New intake
Continuing learners: subset of 2007/08 First year
learners
Continuing learners: subset
of 2007/08 Second year learners
Source: IES
2.2.1 Materials
In section 1.2 above we set out the reasoning behind selection of the measures to be used in the work. In both years of the research there were two versions of the questionnaire (for new intake learners and second/third year learners). However, each questionnaire followed the same basic structure, contained the same sections and addressed the same topics, with only minor changes to take into account the different lengths of experience of the two groups. The questionnaire had a cover sheet which asked the learner to give their details (to preserve anonymity this sheet was subsequently removed from the questionnaire, following allocation of an individual code number and prior to entering the data into the SPSS data set). The focus of each section, the reason for its inclusion, and an indication of the types of questions asked or scales used are set out below:
■ Perceptions of personal relevance and utility of the content areas of the Safe Learner blueprint. The first section of the questionnaire opened by asking the learners their views about the content of the Safe Learner Blueprint. Learners were asked to indicate on a five point scale how relevant to their work situation each content area was (second/third years), or was likely to be (first years), and how useful they felt the information was (second/third years) or would be (first years). Work within the Health sector in the UK has indicated that students’ perceptions of the importance of hand hygiene decline following their exposure to colleagues’ behaviours during work placements (Jenner, 2005) and therefore it was of interest to determine whether learners’ views of the relevance and utility of health and safety instruction similarly declined.

Institute for Employment Studies 9
■ Application and importance of health and safety information. Following on from the questions about content of health and safety training, learners were asked if they believed they would be able to apply the health and safety information they learnt in training within their everyday work environment, how important they felt it was to remember the information, and if there were any areas of particular importance to their work situation for which they would like to receive more training.
■ Employer’s health and safety induction. The Safe Learner Blueprint requires employers to give apprentices a health and safety induction1. The second section of the questionnaire asked apprentices whether they had received an induction at work and, if so, what topics it had covered.
■ Health and safety instruction at work. The earlier Safe Learner evaluation (Miller and Hunt, 2006) had indicated that if an apprentice’s supervisor discussed health and safety issues with them, they were likely to achieve a higher score on the test of health and safety knowledge. For this reason learners were asked whether they had received any type of health and safety instruction from their workplace supervisor. Because it is possible that people in other roles may also play a part in instructing apprentices in work, the questionnaire also asked the learners if they had received any type of health and safety instruction from their health and safety officer/manager or from their trade union health and safety representative. Learners were also asked whether their supervisor or trade union representative ever discussed health and safety issues with them or told them about activities that were risky or dangerous.
■ Risky behaviours at work. The next section focused on risks taken at work. Learners were asked whether their colleagues ever engaged in any risky or dangerous activities and if they themselves ever engaged in activities they believed to be risky or dangerous; it also asked about the actions they were able to take to minimise risks and dangers and whether they did subsequently take such actions.
■ Supervision and accidents at work. Because of concerns raised by the earlier evaluation of the Safe Learner pilot, learners were asked if they were ever left unsupervised and, if so, for how long and how frequently. The last question in this section asked if they had ever had an accident or incident at work.
■ Frequency of unsafe workplace behaviours. In the first year of the work, the 29‐item scale developed by Hofmann and Stetzer (1996) was used to calculate
1 In fact, all employees should receive a health and safety induction from their employer; however, this is emphasised in the contract for employers with apprentices registered on programmes built around the safe learner blueprint.

10 Safe Learner Final Report
frequency of unsafe workplace behaviours. The scale consists of six general items and a further 23 items specific to more manual occupations such as construction. Because not all of the items would be relevant to all apprentices (for example, if they were engaged mainly in office work) they could indicate where they felt that these items were not relevant to them. A five point scale, used by Hofmann and Stetzer, (‘never’, ‘two or three times a year’, ‘about once a month’, ‘once a week’ and ‘more than once a week’) was used to assess frequency. Because very new employees would not have been in work for sufficiently long to form an estimate of how frequently they did such things, learner who had been employed for less than three months were asked to indicate if they had ever done these things since starting work.
■ Role overload. Because perceived work pressure has been shown to impact on safety behaviours a three‐item measure of role overload (Cammann, Fichman, Jenkins and Klesh, 1983) was included.
■ Safety climate. A measure of safety climate was developed based on the Safety Climate subscale of the Workers’ Assessment of Safety Action and Work Habits scale developed by Salminen and Seppala (2005). The original Salminen and Seppala items were modified to make the language more accessible to an English audience. This involved rewording some items1, removing one item2 and adding two new items to clarify one ambiguous item3. One new item ‘I always make sure I work safely’ replaced two others: ‘I emphasise safety in my work habits’ and ‘I am interested in working safely’. Learners answered on a five point scale from ‘completely disagree’ through ‘don’t know’ to ‘completely agree’.
■ Work habits. The five items from the Work Habits subscale of the Workers’ Assessment of Safety Action and Work Habits scale (Salminen and Seppala, ibid.) were modified for purposes of clarity and included within the safety climate section of the questionnaire. These related to the use of safety switches, knowledge of fire extinguishers, easy access to first aid, availability of personal protective equipment and guidelines on health and safety. The original item relating to PPE in this scale asked about the availability of PPE; this was re‐
1 Changes were as follows: ‘I am interested in working safely’ became ‘I always try to work safely’; ‘Haste at work influences risk taking’ became ‘pressure at work influences risk‐taking’; ‘foremen take care of workplace safety’ became ‘supervisors look after workplace safety’; ‘co‐workers comment about risk‐taking’ became ‘Co‐workers disapprove of people taking risks at work’; and ‘I emphasise safety in my work habits’ became ‘I always make sure I work safely’.
2 ‘My work group values safety’
3 ‘Co‐workers comment about risk‐taking’ became ‘co‐workers encourage me to take risks’ and ‘co‐workers disapprove of people taking risks at work’.

Institute for Employment Studies 11
worded to become ‘Where PPE is required, it is always provided’ and added a further item relating to enforcement of its use: ‘If PPE is required, supervisors always make sure we use it’. Learners answered on a five point scale from ‘completely disagree’ through ‘don’t know’ to ‘completely agree’.
■ Group Safety Climate. Six of the ten items from the Zohar (2000) Group Safety Climate scale were reworded slightly to improve clarity and included in the next section of the questionnaire, with a five point scale from ‘completely disagree’ to ‘completely agree’.
■ Unrealistic optimism. Six items were designed to assess the extent to which the individual was unrealistically optimistic. These asked ‘how likely are you to have an accident at work?’ (and the average apprentice to do so); ‘how likely are you to suffer an injury at work?’ (and the average apprentice to do so); and ’how likely are you to suffer from an occupational illness such as dermatitis or respiratory problem?’ (and the average apprentice to do so).
■ Conscientiousness. Eight items contribute to the Conscientiousness factor of Saucier’s Mini‐markers scale (Saucier, 1994). In keeping with Saucier’s methodology, individuals were asked to assess themselves on a nine‐point scale from ‘extremely inaccurate (not at all like me)’ to ‘extremely accurate (exactly like me)’. The eight items were: efficient, organised, systematic, practical, disorganised, sloppy, inefficient and careless. To serve as foils, a further eight items were included: talkative, bold, energetic, shy, quiet, cooperative, creative and extroverted.
■ Cognitive failure. Lastly, individuals were asked to assess themselves on the Workplace Cognitive Failure Scale (Wallace and Chen, 2005). This fifteen item scale asks individuals how often they find that they have forgotten work‐related items or failed to attend to a matter (eg turn off equipment; listen to what a colleague was saying). The items are assessed on a five point scale from ‘never’ to ‘constantly’.
Copies of the questionnaires may be obtained on request from the authors1.
2.2.2 Procedure
During 2007, three of the organisations which had participated in the Safe Learner pilot were contacted and agreement to participate in the extension research was gained.
1 Contact either linda.miller@employment‐studies.co.uk or nick.jagger@employment‐studies.co.uk

12 Safe Learner Final Report
In 2007/08 (year one) two sets of questionnaires, one for first year learners and one for subsequent years (second and third years) were printed and sent to each of the providers, along with a batch of £10 Love2Shop vouchers for providers to give to the learners as a reward for their participation. The questionnaires for first year learners were distributed early in the autumn term 2007, before they had received any health and safety training; questionnaires for second and third year learners were distributed later on, between September and November 2007, as and when tutors met with them. Following receipt of the completed questionnaires, the tutors gave learners the reward voucher and each learner signed a receipt confirming that they had received their reward. Providers returned the completed questionnaires and receipt forms to IES.
In year 2008/09 (year two of the project) a new trânche of first year apprentices was recruited at each of the three sites and questionnaires were distributed to them as per the procedure in 2007/08. Amongst the second and third year cohorts questionnaires were distributed only to those learners who had participated as first or second year learners in 2007/08 and had continued into the next year of the course (ie, into the second or third year of the programme). These questionnaires were printed with the individual learner’s details on the front page and the code number they had been assigned in 2007/08. This arrangement allowed providers to give the questionnaires only to the individuals who had participated in the first year of the project; allowed learners to confirm that we had recorded the correct details for them in the previous year and to provide an update if they had changed employment in the interim year (they were asked to provide demographic details of the new employer but, in keeping with the earlier questionnaires, did not request any information that could allow the employer to be identified). Providing individually‐named questionnaire packs (which also had their 2007/08 identification number printed on it) meant that their first and second year datasets could be matched up upon data entry, and because personal details were again contained on a separate cover page for the questionnaire this meant that this information could be removed from each questionnaire for purposes of anonymisation before data entry proceeded.
The questionnaire data were analysed using the SPSS version 16 software package.

Institute for Employment Studies 13
3 Profile of the participating learner populations
The design involved recruiting one group during the 2007/08 college year and tracking the first and second years from this group into 2008/09. During 2008/09 a further cohort of first year learners was recruited. In this chapter we consider the ways in which these two groups compare and the implications of this for the later analyses.
3.1.1 How do the two years’ groups compare?
It is important to understand how the composition of the groups compares across the two years of the research. As we are unable to control the profile of learners who participate in the research it is possible that the groups might differ across the two years and these differences, rather than the variables that we are examining, might account for any observed outcomes. Examination of the composition of the participant groups enables us to determine the extent to which the sample groups are comparable across the two years and consider the impact which any changes in the make‐up of the groups might have on the findings.
The numbers of completed questionnaires returned from the three sites are shown in Table 3.1.
Table 3.1: Questionnaires distributed and returned
2007/08 2008/09
Site 1 105 125
Site 2 96 140
Site 3 33 60
Total 234 325
Source: IES survey of apprentices, 2007/08
14 Safe Learner Final Report
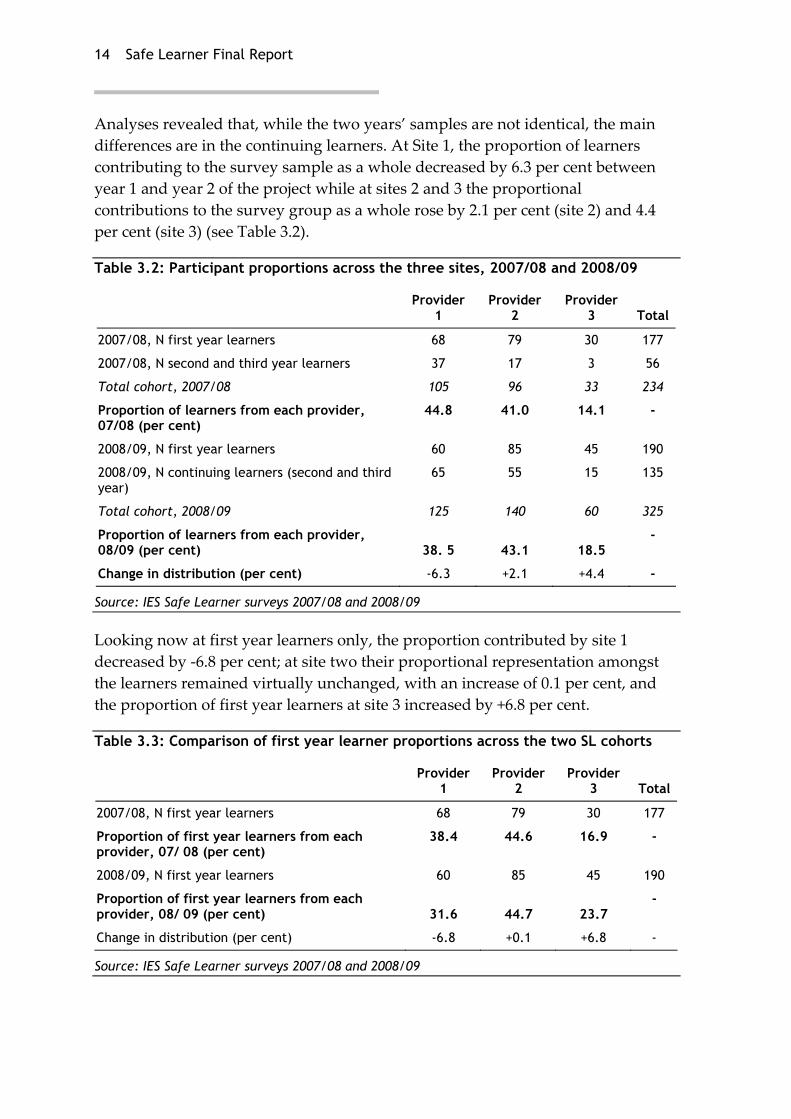
Analyses revealed that, while the two years’ samples are not identical, the main differences are in the continuing learners. At Site 1, the proportion of learners contributing to the survey sample as a whole decreased by 6.3 per cent between year 1 and year 2 of the project while at sites 2 and 3 the proportional contributions to the survey group as a whole rose by 2.1 per cent (site 2) and 4.4 per cent (site 3) (see Table 3.2).
Table 3.2: Participant proportions across the three sites, 2007/08 and 2008/09
Provider
1 Provider
2 Provider
3 Total
2007/08, N first year learners 68 79 30 177
2007/08, N second and third year learners 37 17 3 56
Total cohort, 2007/08 105 96 33 234
Proportion of learners from each provider, 07/08 (per cent)
44.8 41.0 14.1 -
2008/09, N first year learners 60 85 45 190
2008/09, N continuing learners (second and third year)
65 55 15 135
Total cohort, 2008/09 125 140 60 325
Proportion of learners from each provider, 08/09 (per cent) 38. 5 43.1 18.5
-
Change in distribution (per cent) -6.3 +2.1 +4.4 -
Source: IES Safe Learner surveys 2007/08 and 2008/09
Looking now at first year learners only, the proportion contributed by site 1 decreased by ‐6.8 per cent; at site two their proportional representation amongst the learners remained virtually unchanged, with an increase of 0.1 per cent, and the proportion of first year learners at site 3 increased by +6.8 per cent.
Table 3.3: Comparison of first year learner proportions across the two SL cohorts
Provider
1 Provider
2 Provider
3 Total
2007/08, N first year learners 68 79 30 177
Proportion of first year learners from each provider, 07/ 08 (per cent)
38.4 44.6 16.9 -
2008/09, N first year learners 60 85 45 190
Proportion of first year learners from each provider, 08/ 09 (per cent) 31.6 44.7 23.7
-
Change in distribution (per cent) -6.8 +0.1 +6.8 -
Source: IES Safe Learner surveys 2007/08 and 2008/09
Institute for Employment Studies 15
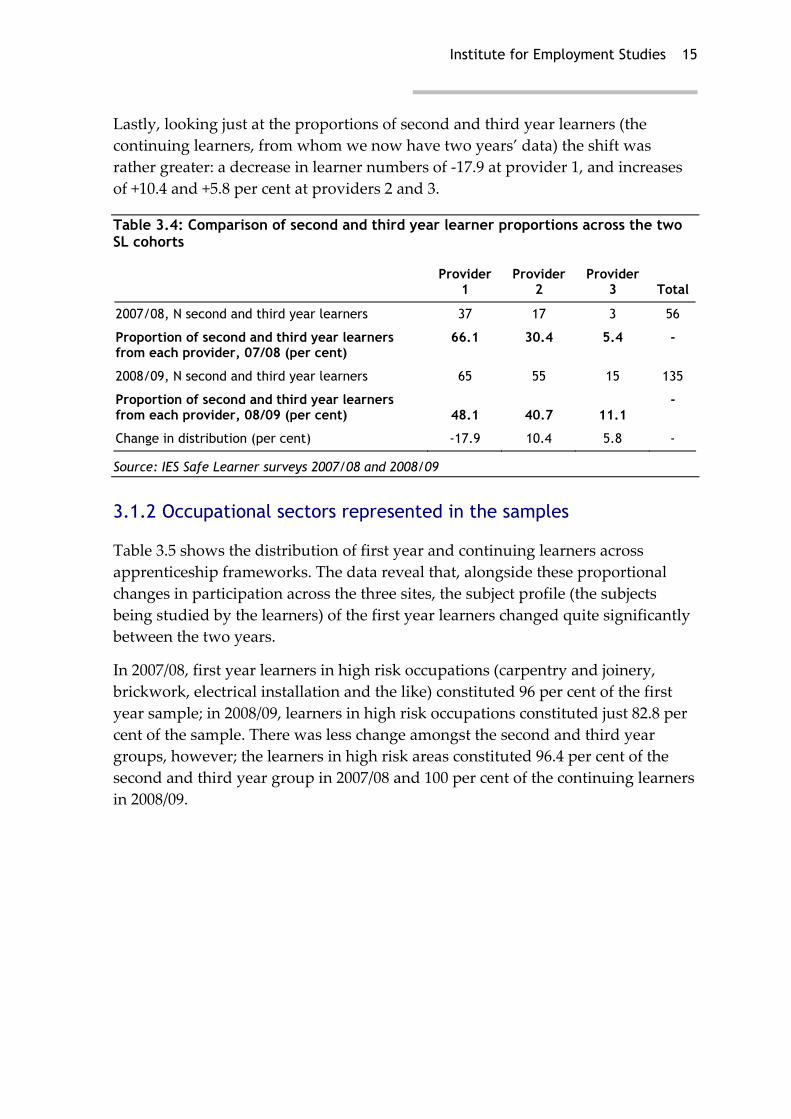
Lastly, looking just at the proportions of second and third year learners (the continuing learners, from whom we now have two years’ data) the shift was rather greater: a decrease in learner numbers of ‐17.9 at provider 1, and increases of +10.4 and +5.8 per cent at providers 2 and 3.
Table 3.4: Comparison of second and third year learner proportions across the two SL cohorts
Provider
1 Provider
2 Provider
3 Total
2007/08, N second and third year learners 37 17 3 56
Proportion of second and third year learners from each provider, 07/08 (per cent)
66.1 30.4 5.4 -
2008/09, N second and third year learners 65 55 15 135
Proportion of second and third year learners from each provider, 08/09 (per cent) 48.1 40.7 11.1
-
Change in distribution (per cent) -17.9 10.4 5.8 -
Source: IES Safe Learner surveys 2007/08 and 2008/09
3.1.2 Occupational sectors represented in the samples
Table 3.5 shows the distribution of first year and continuing learners across apprenticeship frameworks. The data reveal that, alongside these proportional changes in participation across the three sites, the subject profile (the subjects being studied by the learners) of the first year learners changed quite significantly between the two years.
In 2007/08, first year learners in high risk occupations (carpentry and joinery, brickwork, electrical installation and the like) constituted 96 per cent of the first year sample; in 2008/09, learners in high risk occupations constituted just 82.8 per cent of the sample. There was less change amongst the second and third year groups, however; the learners in high risk areas constituted 96.4 per cent of the second and third year group in 2007/08 and 100 per cent of the continuing learners in 2008/09.

16 Safe Learner Final Report
Table 3.5: Distribution of learners across apprenticeship frameworks, 2007/08 and 2008/09
2007/08 1st years
2008/09 1st years
2007/08 2nd and 3rd
years
2008/09 2nd and 3rd
years
N % N % N % N %
Carpentry and joinery 62 35.0 50 26.3 36 63.2 61 45.2
Shopfitting 6 3.4 10 5.3 0 - 4 3.0
Electrical installation 60 33.9 68 35.8 17 29.8 44 32.6
Plumbing and gas 30 16.9 17 8.9 1 1.8 20 14.8
Brickwork, construction, plastering and tiling
10 5.6 - - 1 1.8 5 3.7
Horticulture and groundwork 2 1.1 5 2.6 0 - 0 -
Childcare and business administration
3 1.7 18 9.5 1 1.8 0 -
Engineering 0 - 6 3.2 0 - 0 -
Hairdressing and beauty therapy
0 - 16 8.4 0 - 0 -
Missing 4 2.3 0 - 1 1.8 0 -
Total learners in year group 177 - 190 - 57 - 135 -
Source: IES Safe Learner surveys 2007/08 and 2008/09
Age and experience within the two groups
There were more older individuals amongst the new learners who started their apprenticeships and joined the survey in 2008/09 than in 2007/08: 15.3 per cent were aged 21 or over this year, compared to 11.8 per cent last year.
Table 3.6: Age range of learners
Age in years
Number of learners, 2007/08
Number of new learners, 2008/09
Number of continuing learners, 2008/09
16 80 75 7
17 64 39 49
18 39 34 32
19 19 9 19
20 13 5 12
21 8 7 10
22 4 5 3
23 + 7 12 3
Total 225 186 135
Source: IES Safe Learner surveys 2007/08 and 2008/09

Institute for Employment Studies 17
Table 3.7 shows the age distribution of first year learners in the two years of the project broken down by level of apprenticeship.
Table 3.7: Age distribution of new apprentices, 2007/08 and 2008/09
Age in years
Starts, Level 2
apprentice-ship
2007/08
Starts, Level 2
apprentice-ship
2008/09
Starts, Level 3 Advanced apprentice-
ship 2007/08
Starts, Level 3
Advanced apprentice-
ship 2008/09
Total number of first year
learners at level 2 and 3
2007/08
Total number of first year
learners at level 2 and 3
2008/09
16 24 44 35 29 59 73
17 19 21 22 17 41 38
18 8 23 9 11 17 34
19 6 4 4 5 10 9
20 6 2 2 2 8 4
21 2 4 2 4 4 8
22 0 2 2 3 2 5
23 + 0 11 3 1 3 12
Total 65 111 79 72 144 71
Source: IES Safe Learner surveys 2007/08 and 2008/09
Because of the larger number of older first year learners, the average length of time for which the new learners had been employed prior to taking part in the survey was longer than in the previous year: an average of three years, compared to two years five months in 2007/08.
3.2 Summary
In general, the 2008/09 cohort was characterised as having a larger proportion of new (first year) learners from low‐risk occupations than in the first year’s survey. A larger proportion of the new learners were older, and the average length of work experience was (most likely as a consequence of this) longer, also.
There are several implications for the research. First, learners in low risk occupations are less likely to have or witness accidents, which may mean there is less chance of detecting impact on the outcome measure most of interest: the likelihood of having had or witnessed an accident.
Secondly, the greater number of older learners may impact on the patterns of responses observed in the analyses. Those who have been in work for longer not only are likely to be more mature but will have had more opportunities in which to learn vicariously and hence, potentially, revise their opinions about the value or otherwise of health and safety training. As will become evident as we progress through the analyses undertaken on the two years of data arising from the work,
18 Safe Learner Final Report
this could be an important potential confound to take into account in exploring and explaining the emerging outcomes.
3.3 Implications for analyses
The different sub‐groups of learners have implications for the analyses that are conducted and reported in the later chapters of this report. The analyses will draw on data from different sub‐groups of learners depending on the questions underlying the analyses: in other words, the rationale for each analysis dictates the sub‐set of data used in that analysis. In general:
■ Where we are looking for relationships between an individual’s personal attributes and their attitudes, we look either at data from first year learners (to determine the factors influencing their views at the start of the programme) or across the whole group (to look at the influence of these factors more widely).
■ Where we are looking at the influence of time and experience on learner views, or the influence of workplace supervisors on attitudes/behaviours, we use the repeated measures data set that was obtained by tracking the 2007/08 first year apprentices into the second year and for whom we have two matched data sets. In addition, with the first year learners we have information relating to the earliest days of their employment; for the learners who came into the study as second years in 2007/08 we do not have data from the start of their employment, and for this reason we have excluded them from these analyses.
■ Where there are wider issues to do with organisational culture, we use the combined continuing learner data set which includes first, second and third years.

Institute for Employment Studies 19
4 Health and safety induction and instruction for new work-based learners
In this section we describe the proportions of learners who received instruction in health and safety prior to leaving school and upon commencing work and training.
4.1 Raising awareness of H&S before work
Given the increasing focus on work experience for pupils it was of interest to explore the proportion of learners who receive any instruction on health and safety issues while at school. The data revealed that, across all learners surveyed in 2007/08, 57.3 per cent said that they had been told about health and safety issues by their school or work placement organisation before starting work. Looking just at the first year apprentices, this figure increased to 61.1 per cent. In 2008/09 this had increased just slightly, to 62.5 per cent of the new learner intake1.
4.2 Health and safety induction at work
It is a statutory requirement that all employees should receive a health and safety induction, or information about health and safety as part of their general induction to work. In addition, the Safe Learner blueprint requires employers to sign up to provide a full health and safety induction for apprentices. In 2007/08 over one‐fifth of the learners surveyed (22.0 per cent) said they had received no health and safety induction (see Table 4.1). Most of those who said they had received no health and safety induction were in their first year, so it is possible that employers were
1 Note that while health and safety forms part of the national curriculum it is currently optional rather than mandatory: the Head of the school makes the decision whether to include it within their curriculum. At the time the report was finalised the HSE was working with the Department of Education and the SFA to make it mandatory within all curricula.

20 Safe Learner Final Report
merely slow in arranging this aspect of induction, although in principle this should be provided as early as possible.
In 2008/09, the proportion of first year learners reporting that they had received no health and safety induction fell to just 11.6 per cent, approximately one in ten. The proportion of new apprentices reporting they had not received a health and safety induction therefore appears to have nearly halved since 2007/08.
Table 4.1: Proportion of learners who reported receiving health and safety induction from employer, by year of apprenticeship, 2007/08 (%)
Year of apprenticeship, 2007/08 2008/09
First year
Second year
Third year Total
First years
Received H&S induction from employer
77.9 72.5 93.3 78.0 88.4
Did not receive H&S induction from employer
22.1 27.5 6.7 22.0 11.6
Base N 172 40 15 227 184
Source: IES Safe Learner surveys 2007/08 and 2008/09
Those who had received a health and safety induction were asked what topics it had covered. Table 4.2 shows the responses. The proportions shown are for those who had reported receiving a health and safety induction.
For all but two of the health and safety topic areas a higher proportion of this year’s learners reported having received instruction. The single area in which a lower proportion reported receiving instruction was personal protective equipment or clothing; however, this was only a small decrease and despite this over ninety per cent of learners reporting receiving instruction in PPE. Virtually the same proportion of apprentices said they had received instructed in control measures, as last year.
The data suggest that while most employers are covering most areas of health and safety, there are some odd omissions. While we did give learners the opportunity to say where they felt that any issues were not relevant to their situation, it is difficult to see in quite what circumstances emergency arrangements (first aid, fire and accidents) would not be relevant, but five people indicated that this was apparently the case. Without the ability to check against the actual induction programmes, though, it remains possible that these reports of gaps in coverage are attributable more to learners’ inattention to some parts of the induction, or poor recall, than to gaps in coverage per se.
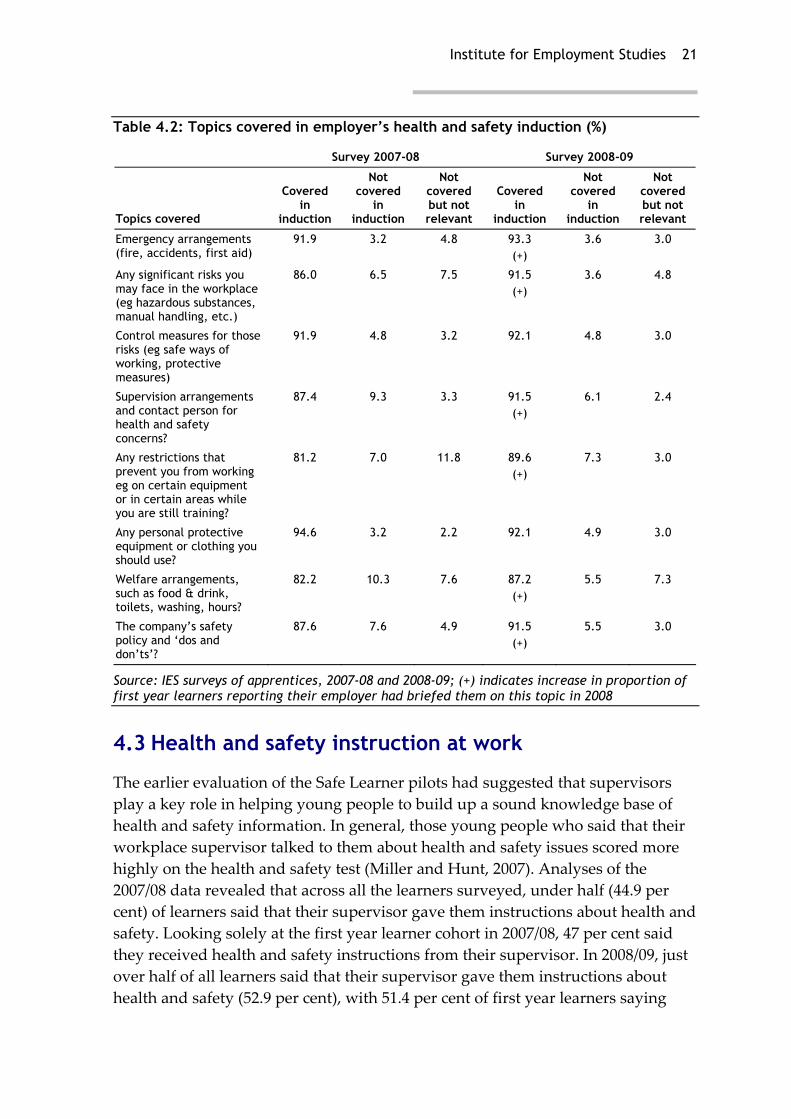
Institute for Employment Studies 21
Table 4.2: Topics covered in employer’s health and safety induction (%)
Survey 2007-08 Survey 2008-09
Topics covered
Covered in
induction
Not covered
in induction
Not covered but not relevant
Covered in
induction
Not covered
in induction
Not covered but not relevant
Emergency arrangements (fire, accidents, first aid)
91.9 3.2 4.8 93.3 (+)
3.6 3.0
Any significant risks you may face in the workplace (eg hazardous substances, manual handling, etc.)
86.0
6.5
7.5
91.5 (+)
3.6 4.8
Control measures for those risks (eg safe ways of working, protective measures)
91.9
4.8
3.2
92.1 4.8 3.0
Supervision arrangements and contact person for health and safety concerns?
87.4
9.3
3.3
91.5 (+)
6.1 2.4
Any restrictions that prevent you from working eg on certain equipment or in certain areas while you are still training?
81.2
7.0
11.8
89.6 (+)
7.3 3.0
Any personal protective equipment or clothing you should use?
94.6 3.2 2.2 92.1 4.9 3.0
Welfare arrangements, such as food & drink, toilets, washing, hours?
82.2 10.3 7.6 87.2 (+)
5.5 7.3
The company’s safety policy and ‘dos and don’ts’?
87.6 7.6 4.9 91.5 (+)
5.5 3.0
Source: IES surveys of apprentices, 2007-08 and 2008-09; (+) indicates increase in proportion of first year learners reporting their employer had briefed them on this topic in 2008
4.3 Health and safety instruction at work
The earlier evaluation of the Safe Learner pilots had suggested that supervisors play a key role in helping young people to build up a sound knowledge base of health and safety information. In general, those young people who said that their workplace supervisor talked to them about health and safety issues scored more highly on the health and safety test (Miller and Hunt, 2007). Analyses of the 2007/08 data revealed that across all the learners surveyed, under half (44.9 per cent) of learners said that their supervisor gave them instructions about health and safety. Looking solely at the first year learner cohort in 2007/08, 47 per cent said they received health and safety instructions from their supervisor. In 2008/09, just over half of all learners said that their supervisor gave them instructions about health and safety (52.9 per cent), with 51.4 per cent of first year learners saying

22 Safe Learner Final Report
this, a slight increase on the proportion in the previous year. Therefore, across the learner cohort as a whole, and within the first year learner intake sub‐ group, there has been a slight increase in reports of good practice amongst supervisors compared to the previous year. However, it should be noted that the data also indicate that many supervisors still fail to talk to their young workers about health and safety issues.
Looking just at the apprentices in years 2 and 3 of their apprenticeship, in 2007/08 35.1 per cent said their work supervisor never discussed with them what they were learning at college about health and safety issues; in 2008/09 far fewer, just 13.6 per cent, said this.
There are, of course, other people in the workplace who may be instrumental in focusing young learners’ attention on health and safety issues. Learners were therefore also asked if they had received any health and safety instruction from their health and safety manager, their trade union health and safety representative, from a trainer, advisor or consultant or from any other individual. Table 4.3 shows the proportions of apprentices within the 2007/08 group of participants as a whole, the proportion of 2007/08 first year learners and the proportion of 2008/09 first years who reported receiving health and safety instruction from these various sources.
Table 4.3: Proportions of apprentices who reported receiving health and safety instruction from people in work and/or external to the organisation
Work role
% of apprentices saying individual gave
instruction about health and safety,
2007/08
% of first year apprentices saying
individual gave instruction about health
and safety, 2007/08
% of first year apprentices saying
individual gave instruction about health
and safety, 2008/09
Workplace supervisor 44.9 47.0 51.7
Health and safety manager
18.8 18.0 27.8
Trade union health and safety representative
10.3 11.2 5.9
Other workplace individual
23.9 26.7 23.8
People external to the workplace: trainers, advisors, consultants
17.1 15.7 14.0
Source: IES surveys of apprentices, 2007/08, 2008/09
In 2007/08 less than one‐fifth of apprentices said that their health and safety manager gave them instructions and only one in ten said that their trade union health and safety representative gave them any health and safety instruction (although given that some of the employing companies are quite small this might

Institute for Employment Studies 23
be more related to lack of trade union representation than to lack of activity). In the second year of the survey, slightly lower proportions of first year apprentices reported receiving health and safety instruction from trade union representatives, other people in work and external individuals such as trainers and consultants. One possibility is that it is primarily those in small companies who report not receiving instructions from individuals such as health and safety managers and trade union representatives (as these people are only likely to be present in larger organisations). However, comparison of the proportions of apprentices at micro (up to nine employees; N = 62) and larger companies (N = 112) reporting that they did (or did not) receive any health and safety instructions from such individuals showed only minor and non‐significant differences in the proportions.
Appendix 1, Tables 1 to 5 present the details of the types of instruction that were given by supervisors and other staff members to apprentices. In the 2007/08 survey the largest groups of responses referred to general points (‘do’s and don’ts’ ‘general health and safety’ ‘just telling what to do and what not to do’), safe use of equipment (‘how to use tools safely’ ‘power tool safety’ ‘toolbox talks’) and ensuring safe work practices and use of PPE (‘told to wear safety equipment’, ‘gave brief details at work about the risks of injury you can have’, ‘gives me PPE and tells me how to use it’). In 2008/09 the most frequent areas that supervisors were likely to have told apprentices about were: use of personal protective equipment and the reasons for this (‘what protective equipment to wear’, ‘Check your PPE’, ‘Ensure hard hat is worn at all times’), safe use of equipment (‘How to correctly use machinery’, ‘Safe use of ladders and scaffolds’) and ensuring safe work practices and alerting apprentices to potential dangers (‘Told not to stand on top of the steps’, ‘About what can and canʹt do’, ‘showed us around and shown the dangers in workshop’, ‘closing gates and doors so people canʹt just walk in’). Some reported that their supervisors gave them advice relating to their specific job or the site on which they were working:
‘Safe ways of working, protective clothing that must be worn, hours, wages, supervision arrangements, significant risks’. Survey response, 2007/08
‘Dangers of certain tools and how to prevent accidents’. Survey response, 2008/09
‘Showed us around and showed us the dangers in the workshop’. Survey response, 2008/09
‘On a job my supervisor warns me of dangerous places/things’. Survey response, 2008/09
‘Wear goggles, this is dangerous to your eyes’. Survey response, 2008/09
‘Where to go if accidents occur, and how to lift properly and protective equipment’. Survey response, 2008/09

24 Safe Learner Final Report
‘What to do when using blow torch in loft’. Survey response, 2008/09
However, some workplaces still fail to take health and safety seriously. In the 2008/09 survey, in response to the question asking learners if they had learned anything about health and safety from anybody in work, one apprentice wrote:
‘Only from myself. Did a H&S course at my previous job’. Survey response, 2008/09
Therefore it can be seen that although the proportion of supervisors who do take the safety of their apprentices seriously is increasing, some apprentices are clearly still receiving little or no support from their employer to help them to work safely. In some cases of course good supervisors may struggle against a poor overall safety culture which may limit the actions an individual supervisor may take and impact they may have.
4.3.1 Need for additional health and safety instruction
The second and third year learners were also asked if they could think of a specific work situation for which they would have liked more health and safety knowledge to help them to deal with it. In 2007/08 just six said they would; in 2008/09 24 apprentices said they would have liked more health and safety knowledge (5.7 per cent of learners). In 2008/09 only a few apprentices gave any details: two mentioned issues to do with working with asbestos. Details are given in Appendix 1, Table 6.
One said they would have liked more knowledge to help them deal with the situation when a workmate had an accident. One report received in the 2007/08 survey raises particular concerns, given that there are regulations requiring the use of ear protectors in noisy environments:
‘When working in workshop with loud machinery as it has damaged my hearing.’
Learners were also asked if they would have liked more input on any of the areas the Safe Learner training had covered. In both years quite a few of the learners said they would like more coverage on all of the safe learner areas. In 2007/08 just a few identified specific issues, such as safety at heights storing materials for short periods of time. In 2008/09 the most areas that continuing learners thought there should be more coverage of was electrical shocks, electrical hazards and, related to this, CPR:
‘CPR as overall this can save somebody’s life’
After this, the other main areas identified by learners in 2008/09 were working at heights, PPE and safety equipment, and manual handling. Appendix 1 Tables 6 and 7 show the responses given by apprentices across the two years of the survey

Institute for Employment Studies 25
regarding the additional information they would have liked and the areas of health and safety that they believed should have more coverage. Providers may wish to consider this information in planning future training content for apprentices or additional top‐up programmes.
Second and third year learners were asked whether they could recall any occasions when the health and safety training that they had received had helped them to avoid an accident or incident or assist some who was involved in an accident or incident. In the 2007/08 group just eight of the second and third year learners (14.2 per cent) said that it had; in the 2008/09 group, 35 learners, 25.9 per cent, said that it had helped them either avoid an accident or incident or deal with an incident, with 17 citing an illustration of how the information had helped. Mainly the comments reflected the learners’ increased ability to respond to and deal with injuries, or to take action to avoid incidents arising. In both years of the survey learners were able to give specific examples of their changed behaviour or incidents they had been able to respond to. The full list of responses is given in Appendix 1, Table 8. Examples included:
‘More aware of dangers, more cautious’. Survey 2007/08
‘Tripping over bits of re‐bar at work, I pick them up’. Survey 2007/08
‘Dealing with injuries such as cuts properly and safely using first aid kit’. Survey, 2008/09
‘Moved cable out of walkways preventing fall’. Survey 2008/09
‘Moving trip hazards’. Survey 2008/09
‘Not leaving trailing wires when using tools to prevent trips’. Survey 2008/09
‘A stone fell on a [man’s] leg, I kept the man calm and still and kept him company while we informed the hospital and first aider. Wrote it up in the accident book.’ Survey 2007/08
‘When a lad fell off the scaffolding I knew who to tell’ Survey 2007/08
‘Helped a colleague that was being bullied. Helped colleague who fell from ladders’ Survey 2008/09
4.4 The Safe Learner – learner views of content
The Safe Learner blueprint requires LSC‐funded training providers to cover an agreed set of content areas or topics in the health and safety training they provide for learners. Learners were asked to rate the relevance and utility of these areas of training input. They were also asked how likely it was they would be able to apply
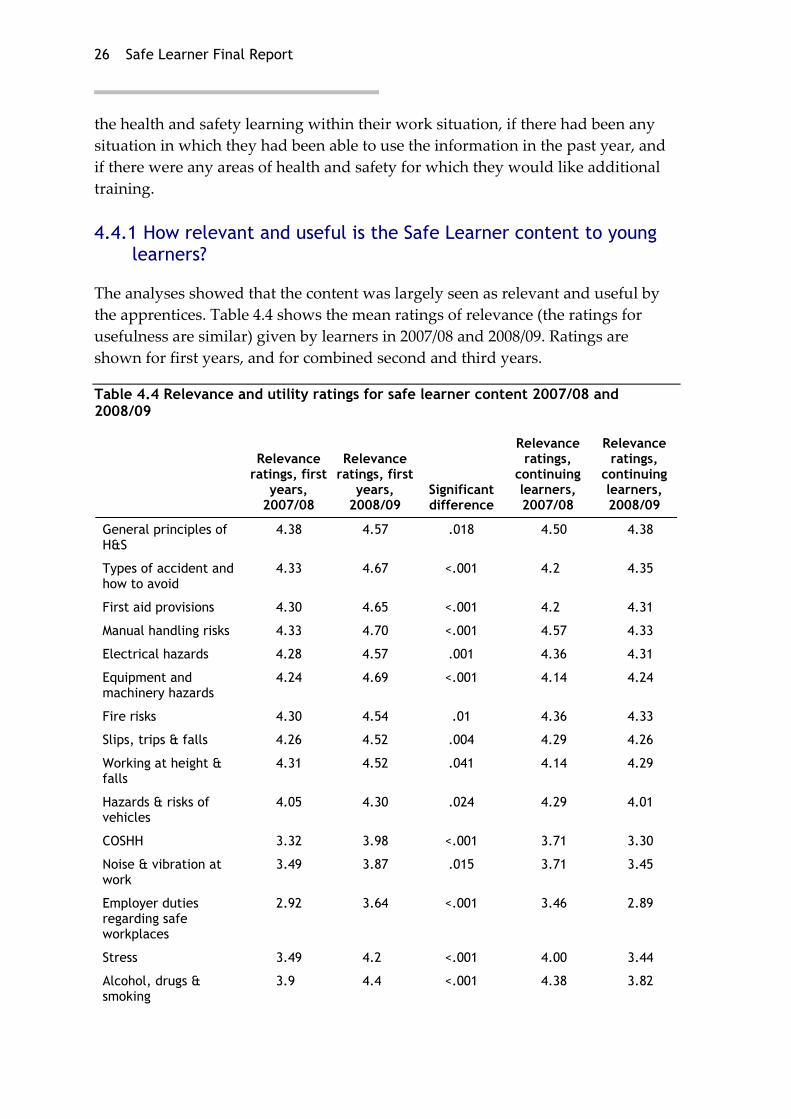
26 Safe Learner Final Report
the health and safety learning within their work situation, if there had been any situation in which they had been able to use the information in the past year, and if there were any areas of health and safety for which they would like additional training.
4.4.1 How relevant and useful is the Safe Learner content to young learners?
The analyses showed that the content was largely seen as relevant and useful by the apprentices. Table 4.4 shows the mean ratings of relevance (the ratings for usefulness are similar) given by learners in 2007/08 and 2008/09. Ratings are shown for first years, and for combined second and third years.
Table 4.4 Relevance and utility ratings for safe learner content 2007/08 and 2008/09
Relevance ratings, first
years, 2007/08
Relevance ratings, first
years, 2008/09
Significant difference
Relevance ratings,
continuing learners, 2007/08
Relevance ratings,
continuing learners, 2008/09
General principles of H&S
4.38 4.57 .018 4.50 4.38
Types of accident and how to avoid
4.33 4.67 <.001 4.2 4.35
First aid provisions 4.30 4.65 <.001 4.2 4.31
Manual handling risks 4.33 4.70 <.001 4.57 4.33
Electrical hazards 4.28 4.57 .001 4.36 4.31
Equipment and machinery hazards
4.24 4.69 <.001 4.14 4.24
Fire risks 4.30 4.54 .01 4.36 4.33
Slips, trips & falls 4.26 4.52 .004 4.29 4.26
Working at height & falls
4.31 4.52 .041 4.14 4.29
Hazards & risks of vehicles
4.05 4.30 .024 4.29 4.01
COSHH 3.32 3.98 <.001 3.71 3.30
Noise & vibration at work
3.49 3.87 .015 3.71 3.45
Employer duties regarding safe workplaces
2.92 3.64 <.001 3.46 2.89
Stress 3.49 4.2 <.001 4.00 3.44
Alcohol, drugs & smoking
3.9 4.4 <.001 4.38 3.82
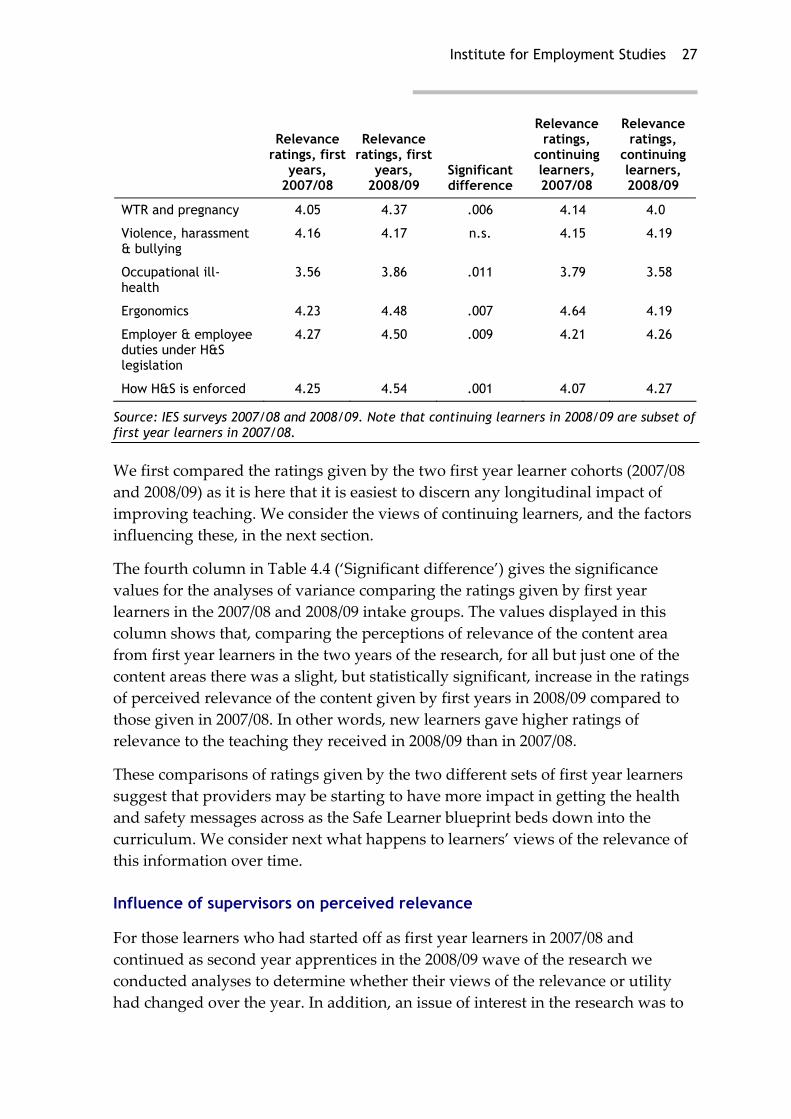
Institute for Employment Studies 27
Relevance ratings, first
years, 2007/08
Relevance ratings, first
years, 2008/09
Significant difference
Relevance ratings,
continuing learners, 2007/08
Relevance ratings,
continuing learners, 2008/09
WTR and pregnancy 4.05 4.37 .006 4.14 4.0
Violence, harassment & bullying
4.16 4.17 n.s. 4.15 4.19
Occupational ill-health
3.56 3.86 .011 3.79 3.58
Ergonomics 4.23 4.48 .007 4.64 4.19
Employer & employee duties under H&S legislation
4.27 4.50 .009 4.21 4.26
How H&S is enforced 4.25 4.54 .001 4.07 4.27
Source: IES surveys 2007/08 and 2008/09. Note that continuing learners in 2008/09 are subset of first year learners in 2007/08.
We first compared the ratings given by the two first year learner cohorts (2007/08 and 2008/09) as it is here that it is easiest to discern any longitudinal impact of improving teaching. We consider the views of continuing learners, and the factors influencing these, in the next section.
The fourth column in Table 4.4 (‘Significant difference’) gives the significance values for the analyses of variance comparing the ratings given by first year learners in the 2007/08 and 2008/09 intake groups. The values displayed in this column shows that, comparing the perceptions of relevance of the content area from first year learners in the two years of the research, for all but just one of the content areas there was a slight, but statistically significant, increase in the ratings of perceived relevance of the content given by first years in 2008/09 compared to those given in 2007/08. In other words, new learners gave higher ratings of relevance to the teaching they received in 2008/09 than in 2007/08.
These comparisons of ratings given by the two different sets of first year learners suggest that providers may be starting to have more impact in getting the health and safety messages across as the Safe Learner blueprint beds down into the curriculum. We consider next what happens to learners’ views of the relevance of this information over time.
Influence of supervisors on perceived relevance
For those learners who had started off as first year learners in 2007/08 and continued as second year apprentices in the 2008/09 wave of the research we conducted analyses to determine whether their views of the relevance or utility had changed over the year. In addition, an issue of interest in the research was to

28 Safe Learner Final Report
determine whether supervisors have an impact on apprentices’ views of health and safety issues, and if so, how the supervisor influences the apprentice. Therefore, for each of the health and safety topic areas specified within the Safe Learner Blueprint a repeated measures analysis of variance was conducted on data from the dataset for continuing apprentices (those who had been first year apprentices in the 2007/08 and continued into the second year in 2008/09).
The analyses allow us to determine whether apprentices’ views of the relevance and the usefulness (utility) of the components of the health and safety content had stayed constant, increased, or decreased across the year. To allow the impact of the supervisor on attitudes, apprentices were grouped using their second year reports of whether their supervisor discussed health and safety issues with them at work. The response options on this question were: ‘yes, often’, ‘yes, occasionally’ and ‘no’. The apprentices were, therefore, grouped into three groups using their response on this question, and their ratings of the perceived relevance and usefulness of the Safe Learner content areas were compared across the three groups over time. The outcomes of these comparisons are shown in Table 4.5, below.
Table 4.5: Repeated measure analyses of change in relevance and utility perceptions over time and influence of supervisor
Relevance Utility
Safe learner topic area
Main effect, time
Main effect,
supervisor discussion
Interaction, supervisor discusses x
time
Main effect, time
Main effect,
supervisor discussion
Interaction, supervisor discusses x
General principles of H&S ns .001 ns ns ns .019
Types of accident and how to avoid
ns <.001 ns ns .025 ns
First aid provisions .005 .001 ns ns .016 ns
Manual handling risks .008 .006 ns ns ns ns
Electrical hazards .002 .025 ns ns ns ns
Equipment and machinery hazards
.024 .008 ns ns .009 ns
Fire risks .046 [.062] [.061] ns ns ns
Slips, trips & falls <.001 [0.07] <.001 ns ns ns
Working at height & falls <.001 [0.07] <.001 ns ns .011
Hazards & risks of vehicles
ns [.068] .036 ns .049 ns
COSHH ns .019 ns ns ns ns
Noise & vibration at work ns ns ns .051 ns ns
Employer duties regarding safe workplaces
ns ns ns .055 ns ns
Stress ns ns ns ns ns ns
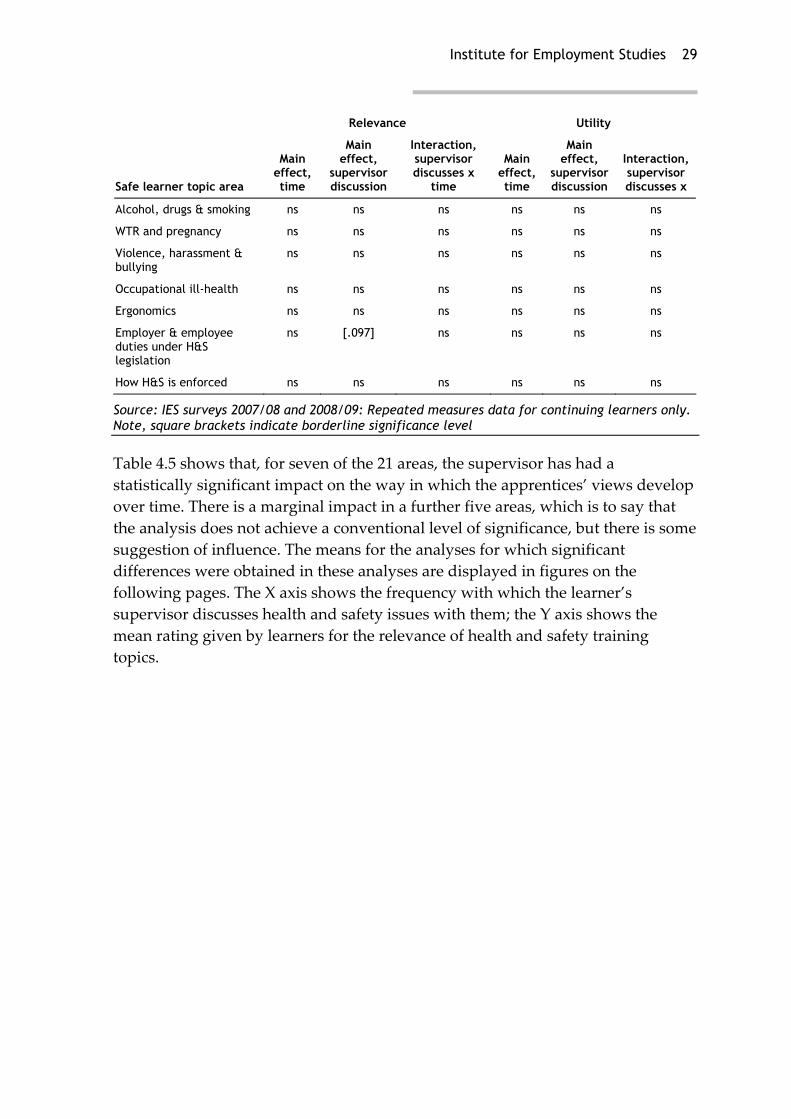
Institute for Employment Studies 29
Relevance Utility
Safe learner topic area
Main effect, time
Main effect,
supervisor discussion
Interaction, supervisor discusses x
time
Main effect, time
Main effect,
supervisor discussion
Interaction, supervisor discusses x
Alcohol, drugs & smoking ns ns ns ns ns ns
WTR and pregnancy ns ns ns ns ns ns
Violence, harassment & bullying
ns ns ns ns ns ns
Occupational ill-health ns ns ns ns ns ns
Ergonomics ns ns ns ns ns ns
Employer & employee duties under H&S legislation
ns [.097] ns ns ns ns
How H&S is enforced ns ns ns ns ns ns
Source: IES surveys 2007/08 and 2008/09: Repeated measures data for continuing learners only. Note, square brackets indicate borderline significance level
Table 4.5 shows that, for seven of the 21 areas, the supervisor has had a statistically significant impact on the way in which the apprentices’ views develop over time. There is a marginal impact in a further five areas, which is to say that the analysis does not achieve a conventional level of significance, but there is some suggestion of influence. The means for the analyses for which significant differences were obtained in these analyses are displayed in figures on the following pages. The X axis shows the frequency with which the learner’s supervisor discusses health and safety issues with them; the Y axis shows the mean rating given by learners for the relevance of health and safety training topics.

30 Safe Learner Final Report
General principles of H&S Types of accident and how to avoid First aid provision
1.0
1.5
2.0
2.5
3.0
3.5
4.0
4.5
5.0
Yes often Yesoccasionally
No never
2007/08 2008/09
1.0
1.5
2.0
2.5
3.0
3.5
4.0
4.5
5.0
Yes often Yesoccasionally
No never
2007/08 2008/09
1.0
1.5
2.0
2.5
3.0
3.5
4.0
4.5
5.0
Yes often Yesoccasionally
No never
2007/08 2008/09
Fire risks Manual handling risks Electrical hazards
1.0
1.5
2.0
2.5
3.0
3.5
4.0
4.5
5.0
Yes often Yesoccasionally
No never
2007/08 2008/09
1.0
1.5
2.0
2.5
3.0
3.5
4.0
4.5
5.0
Yes often Yesoccasionally
No never
2007/08 2008/09
1.0
1.5
2.0
2.5
3.0
3.5
4.0
4.5
5.0
Yes often Yesoccasionally
No never
2007/08 2008/09

Institute for Employment Studies 31
Equipment and machinery hazards Slips, trips and falls Working at height and falls
1.0
1.5
2.0
2.5
3.0
3.5
4.0
4.5
5.0
Yes often Yesoccasionally
No never
2007/08 2008/09
1.0
1.5
2.0
2.5
3.0
3.5
4.0
4.5
5.0
Yes often Yesoccasionally
No never
2007/08 2008/09
1.0
1.5
2.0
2.5
3.0
3.5
4.0
4.5
5.0
Yes often Yesoccasionally
No never
2007/08 2008/09
Hazards and risks of vehicles COSHH
1.0
1.5
2.0
2.5
3.0
3.5
4.0
4.5
5.0
Yes often Yesoccasionally
No never
2007/08 2008/09
1.0
1.5
2.0
2.5
3.0
3.5
4.0
4.5
5.0
Yes often Yesoccasionally
No never
2007/08 2008/09

32 Safe Learner Final Report
In general, those apprentices who say that their supervisor often discusses health and safety issues with them are more likely to maintain or increase their assessment of the relevance of these health and safety items than are those who say their supervisor does not discuss these issues with them. Apprentices whose supervisors do not discuss health and safety issues with them tended to give lower ratings of relevance in the second year for these health and safety ratings. In other words, where the supervisor does not discuss health and safety issues with the apprentice, the apprentice starts to see these issues as less relevant to them. The extent to which a supervisor discusses health and safety issues with the apprentice also appears to have an impact – the means for those whose supervisors discuss health and safety issues occasionally tend to fall midway between the means for the ‘often’ and ‘no’ groups.
It should be noted that the sub‐group of apprentices for which this repeated measures analysis was conducted consisted mainly of learners in five male‐dominated and primarily manual occupations: carpentry and joinery; shopfitting; electrical installation; plumbing and gas; and brickwork, construction, plastering and tiling. This should be borne in mind when examining the perceptions of the relevance of these various areas.
For seven of these content areas, there is in an additional effect arising from the passage of time – in other words, the learners views changed over time, outside of any impact that the supervisor may have had. This suggests that, as might be expected, the apprentices are learning and changing their views independently, as well as by learning from their supervisors.
4.4.2 Do perceptions of relevance matter?
A key question is whether learner perceptions of the relevance and utility of health and safety training matters. If it transpired that there was no difference between the behaviours of those learners who believed the information was relevant or irrelevant then there would be little point in considering learner views – and it should be noted that much social psychological research in the past has pointed to the lack of relationship between attitudes and behaviours.
To test the association of perceived relevance and utility with safe behaviours we undertook two statistical analyses: first, we explored whether learners who believe the health and safety training to be more relevant and useful were less likely to engage in unsafe behaviours; and second we examined whether those learners who believe the material to be more relevant and/or useful are less likely to have an accident or incident.
Using the 2008/09 data set, overall relevance of the health and safety training content (that is, the score computed across all the 21 areas) was found to correlate
Institute for Employment Studies 33
inversely and significantly with frequency of unsafe behaviours (r = ‐.139, N = 301, p = .016). In other words, those learners who believe the health and safety training to be more relevant are less likely to engage in unsafe behaviours. The correlation between utility and frequency of unsafe behaviours is slightly less, r = ‐.113, N = 300, p = .051.
An analysis of variance conducted on the 2008/09 data for relevance with the learners grouped according to whether they had or had not had an accident or incident revealed that those learners who thought the health and safety training was more relevant were less likely to have had an accident (F = 4.166, df 1, 299, p = .042). The same analysis conducted using the ratings of utility was not significant. Note that these relationships are explored in more detail in Chapter 6.
4.5 Summary
The proportion of young people receiving health and safety induction at work is gradually increasing. The great majority of apprentices – but not all – report that this statutory requirement does take place. A smaller proportion report that their work supervisor gives them health and safety instructions, but more apprentices said this in 2008/09 than in 2007/08. Nonetheless this still amounted to only just over half of apprentices saying that their supervisor gave them health and safety instructions. This is an important point, for analyses revealed that supervisors can be instrumental in supporting the development of positive attitudes towards health and safety issues. Providers may wish to consider talking to employers about the need for work supervisors to reinforce health and safety messages to apprentices; there may be some market for training for supervisors using the Safe Learner blueprint as a basis for the input.
Most learners believed the health and safety training provided by their college or training centre was relevant and useful. Learners who believe the health and safety training they receive to be relevant are less likely to engage in unsafe behaviours and less likely to have accidents. Whether this is cause or correlation is difficult to unpick here: it could be that those learners who believe the health and safety input to be more relevant are more likely to apply it and as a consequence have fewer accidents; on the other hand it could be that learners who believe the health and safety training to be relevant are also pre‐disposed to be more careful at work.
A sizeable proportion of the learners said that they would appreciate more health and safety input in certain areas, and providers might wish to bear this in mind when planning future provision.

34 Safe Learner Final Report
5 Supervision at work
The evaluation of the pilot Safe Learner programmes had indicated that a sizeable proportion of young people in the Safe Learner group were left to work unsupervised. This was an unexpected finding and the learners had not been asked for any additional information on this point. It was therefore of interest to follow up this issue in the next stage of the work. The questionnaire used in the 2007/08 survey therefore included a question asking learners whether they were ever left to work unsupervised and, if so, for how long and how frequently.
5.1 Are apprentices left unsupervised?
In 2007/08 a large proportion of learners reported being left unsupervised: some 59.1 per cent of learners in total across years. While it might be acceptable for older apprentices, particularly those at level 3 who may already have a level 2 qualification, to be left to work unsupervised, the data revealed that sizeable proportions of very young, unqualified learners were also being left unsupervised. However, this might be for just short periods of time, or just on occasions when a supervisor cannot avoid being away from where the learner is working. For this reason we asked apprentices how long they were usually left unsupervised. Analysis of learner responses in 2007/08 revealed that a sizeable proportion of the learners, even the very young ones, were being left unsupervised (see Interim Report for further details).
However, at a meeting to present the interim findings at the end of the first year of the research, providers queried the way in which these questions had been interpreted by the participants. They suggested that, in reporting that they were left unsupervised, it was possible that the learners meant only that they were not watched constantly by their supervisors, rather than the supervisor being in a different part of the premises, or on a different site. For this reason, in the 2008/09 survey the wording of these questions was modified to avoid the potential for ambiguity. In the 2008/09 survey questionnaire the question was phrased as
Institute for Employment Studies 35
follows: ‘Are you ever left to work unsupervised (this means that your supervisor is not in the same work area as you)?’
Analyses of the 2008/09 survey data again showed that many of the learners, including first years, were being left unsupervised (see Appendix 2, Table 1 for the numbers of first year learners left to work unsupervised, broken down by age and qualification level). The analyses revealed that even very young apprentices could be left unsupervised for up to a day at a time (see Appendix 2, Table 2, for a breakdown of the data on length of time unsupervised, for learners aged 16‐19).
Amongst those who reported being left unsupervised, nearly a fifth of those aged 16 (18.6 per cent) were being left unsupervised for periods of over an hour. By the time they have reached the age of 20 or over, more than four‐fifths of learners were being left to work unsupervised. While there might initially be less concern regarding these older apprentices, given their relative maturity, it should not be assumed that they are necessarily more experienced: less than a third of this older group (31.3 per cent) were registered on level 3 awards.
Appendix 2, Tables 3 and 4 allow comparisons to be made between the data on lack of supervision collected in 2007/08 and 2008/09. Table 3 shows data from the 2007/08 survey on the frequency with which learners are left unsupervised and the length of time they are left unsupervised, just for those learners aged 16‐19 who reported being left unsupervised. Appendix 2, Table 4 shows the same analysis for the 2008/09 data. Of the 99 apprentices aged 16‐19 who answered this question in 2008/09, fifteen (15.2 per cent) reported that they were frequently left unsupervised for between a few hours to up to a day, once or twice a week or most days. In the 2008/09 survey the number reporting being left for so long had reduced: seven apprentices out of the 70 apprentices (10 per cent) aged 16‐19 who reported being left to work unsupervised were left for this length of time.
The analyses of the 2008/09 data therefore showed that, as in the previous year’s data, a considerable proportion of the youngest and most inexperienced learners reported being left unsupervised. The majority of those left unsupervised are left alone only for short periods – largely just for around half an hour at a time. Of the remainder, around one in eight reported being left for up to an hour and one in ten for a couple of hours. However, around 1 in 14 learners in this age range (7 per cent), reported being left unsupervised for up to a day at a time. Taken together, some 18.6 per cent of learners in the age range 16‐19 had been left to work unsupervised for over an hour at a time. Because of the change in wording of the question, we can be more confident that this really does mean that these young learners are being left without a supervisor within the area, rather than simply working without close scrutiny.

36 Safe Learner Final Report
This might of course happen only occasionally. Having confirmed that apprentices were being left to work unsupervised we next examined the frequency with which young (16‐19 years old), novice learners were left unsupervised while at work. While the majority of novice apprentices report being left unsupervised only occasionally and only for fairly short periods of time, seven of the 70 who answered both of these questions (10 per cent) reported that they were frequently left unsupervised once a week or more frequently for extended periods of time – between several hours and up to a day at a time (Appendix 2, Table 4 for details).
5.1.1 Comparing supervisor absence in high risk and lower risk occupations
Therefore, further analyses were conducted with the first year learners grouped into ‘high risk’ and ‘lower risk’ occupations (eg construction, gas, carpentry and joinery versus childcare, administration and hairdressing). This comparison showed that some 62.3 per cent of all first year learners in the higher risk occupations reported being left to work unsupervised, compared to 50 per cent of learners in lower‐risk occupations. Perversely, it appears that novice learners in higher risk occupations are more likely to report being unsupervised than those in lower‐risk occupations.
5.2 Summary of findings on supervisory absence
In summary, then the second wave findings confirmed those from the first wave: most apprentices are left unsupervised, but for most this is only occasionally and only for fairly short periods of time. However, the data do confirm that some are frequently left alone for extended periods of time. The good news though is that there are fewer reports of learners being left unsupervised for extended periods of time from amongst the 2008/09 group of novice apprentices, compared to those recruited in 2007/08: 7 per cent compared to 15.2 per cent.
It is not possible to ascertain the reasons for this improvement without further exploration of the employers themselves, which is outside the remit of the research. This shift may simply reflect a different subset of employers in this year’s sample compared to last years or a general improvement in management practices amongst employers in general.
Even given this improvement, it nonetheless again shows that a proportion of the youngest and most inexperienced learners are still being left unsupervised, and this is more often the case in higher risk sectors. Because the wording to the question was changed, we can be confident now that this really does mean that these young learners are being left without a supervisor within the area, rather than simply not under close scrutiny. This clearly is a cause for concern.

Institute for Employment Studies 37
In general, though, this year’s data confirmed the findings from the first year of the research. Many learners are being left unsupervised, and some young and inexperienced learners are being left unsupervised for what sometimes are extended lengths of time.
5.3 Does supervisory absence matter?
In 2007/08 the rates of incidents occurring to learners left unsupervised or not were compared; the same comparison was undertaken for reports of incidents they had witnessed involving colleagues at work. The analyses showed that higher proportions of the learners who were left unsupervised had had an accident or incident and were more likely to have a colleague who had been involved in an accident or incident (see Miller and Jagger 2008 for details).
These analyses were repeated with the 2008/09 dataset. This year, the findings were not so pronounced. The accident rates for supervised and unsupervised1 learners and for their colleagues are shown in Table 5.1.
Table 5.1: Lack of supervision and apprentice and colleague incidents
Supervised
% involvement in incidents Unsupervised
% involvement in incidents
First year learners 15.3 13.3
Continuing learners 15.2 18.1
1st yrs’ colleagues 20.5 22.3
Cont. yrs’ colleagues 18.2 31.9
Source: IES survey of apprentices, 2008/09
It can be seen that amongst the first year learners those who are supervised are slightly more likely to have had some sort of incident at work. This is opposite to what was seen in the previous year’s research. Amongst the continuing apprentices those who are left unsupervised have a slightly higher propensity to have accidents, but again this is nowhere near as strong as that observed in the first wave of the work.
For accidents involving colleagues a pattern closer to that seen in the previous wave of the research was observed. Those who work in workplaces where the supervisor is absent on occasions are more likely to have seen a colleague involved in an accident or incident. The difference is particularly noteworthy for the continuing years apprentices.
1 Note, ‘unsupervised’ is used to indicate apprentices who report being left unsupervised on occasions

38 Safe Learner Final Report
The data are nowhere near as clear as in the previous year. However, we would say that, taken together, the fact that the differences are larger in the continuing years, and in the direction observed in 2007/08, together suggest that supervisory absence should still be considered a factor involved in increasing the likelihood of accidents. Clearly more research is needed on this point though.
5.3.1 Supervisory absence and risky behaviours
A measure of the extent to which apprentices engage in risky behaviours was used in both waves of the survey (see Chapter 6 for more details regarding this measure). An analysis of variance comparing the extent to which apprentices who are left unsupervised engage in risky behaviours was conducted. The analysis revealed that apprentices whose supervisors leave them unsupervised are more likely to engage in risky behaviours (x̄ = 7.08, unsupervised, x̄ supervised = 8.0, F = 6.206, df 1,303, p = .013). These relationships are explored in more detail later in the report.
5.4 Discussing health and safety issues at work
5.4.1 Discussions with workplace supervisors
All apprentices were asked two questions about the extent to which their supervisor discussed health and safety with them. These asked whether their supervisor discussed workplace health and safety issues with them and whether their supervisor ever told them about, or discussed with them, any particular workplace activities that they felt were risky or dangerous.
In addition, second and third years were also asked whether their supervisor ever discussed with them what they were being taught about health and safety by their college or training organisation. First year learners were not asked this question because the survey was timed for before their first health and safety induction and hence their supervisor could not realistically have been expected to have discussed this with them yet.
To ascertain the extent to which the issue of lack of supervision is a key indicator of poor health and safety culture in general, we explored In wave 1 of the research we found that fewer of the apprentices who were left unsupervised said that their supervisor often discussed health and safety issues with them, and more of them said their supervisor never discussed health and safety issues with them. A similar pattern was seen in the second wave (see Table 5.2). Nearly one‐third of the fully supervised learners said their supervisor often discussed health and safety issues with them while less than 1 in 5 of the neglected learners said their supervisor did so.
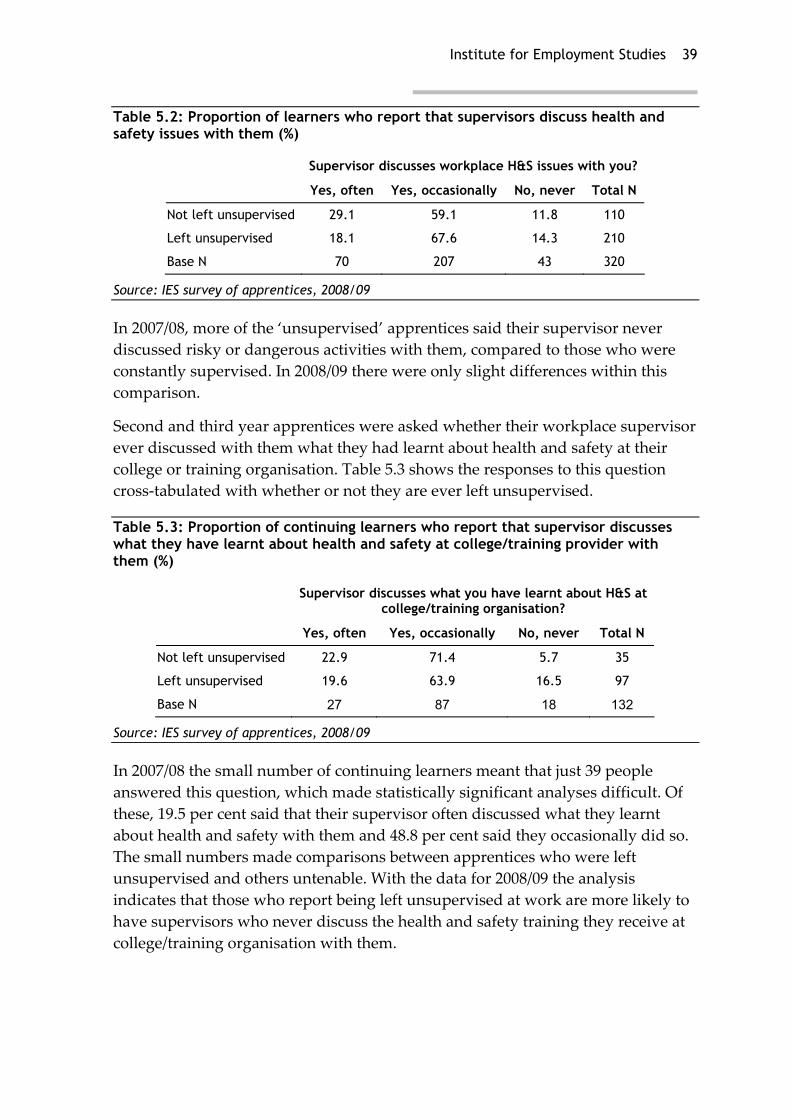
Institute for Employment Studies 39
Table 5.2: Proportion of learners who report that supervisors discuss health and safety issues with them (%)
Supervisor discusses workplace H&S issues with you?
Yes, often Yes, occasionally No, never Total N
Not left unsupervised 29.1 59.1 11.8 110
Left unsupervised 18.1 67.6 14.3 210
Base N 70 207 43 320
Source: IES survey of apprentices, 2008/09
In 2007/08, more of the ‘unsupervised’ apprentices said their supervisor never discussed risky or dangerous activities with them, compared to those who were constantly supervised. In 2008/09 there were only slight differences within this comparison.
Second and third year apprentices were asked whether their workplace supervisor ever discussed with them what they had learnt about health and safety at their college or training organisation. Table 5.3 shows the responses to this question cross‐tabulated with whether or not they are ever left unsupervised.
Table 5.3: Proportion of continuing learners who report that supervisor discusses what they have learnt about health and safety at college/training provider with them (%)
Supervisor discusses what you have learnt about H&S at college/training organisation?
Yes, often Yes, occasionally No, never Total N
Not left unsupervised 22.9 71.4 5.7 35
Left unsupervised 19.6 63.9 16.5 97
Base N 27 87 18 132
Source: IES survey of apprentices, 2008/09
In 2007/08 the small number of continuing learners meant that just 39 people answered this question, which made statistically significant analyses difficult. Of these, 19.5 per cent said that their supervisor often discussed what they learnt about health and safety with them and 48.8 per cent said they occasionally did so. The small numbers made comparisons between apprentices who were left unsupervised and others untenable. With the data for 2008/09 the analysis indicates that those who report being left unsupervised at work are more likely to have supervisors who never discuss the health and safety training they receive at college/training organisation with them.

40 Safe Learner Final Report
5.4.2 Sector and size of employer
The data were examined to determine whether there are any differences in patterns of supervision and accidents arising from size of employer or sector in which the young person is employed. In the second wave of the research, as in the first wave, the findings indicated that there was no significant difference in the proportion of apprentices in micro companies who say their supervisor instructs them about health and safety, compared to those in larger companies (Χ2 = 0.13, df 1, p = n.s.) nor in learner accident rates (Χ2 = .045, df 1, p = n.s.) or likelihood of being left unsupervised (Χ2 = 0.163, p = n.s.). Although a larger proportion of apprentices in micro‐companies had seen colleagues have an accident (27.3 per cent compared to 18.8 per cent), again this was not statistically significant.
As might be expected, workers in certain occupations are more at risk than others. The learners were grouped into three groups for this next analysis: carpentry and joinery, shopfitting, brickwork/construction and horticulture/groundwork in one group; plumbing and gas, electrical installation and engineering in a second; and childcare, business administration, hairdressing and beauty therapy in a third.
More of the learners in construction/groundwork etc. trades reported being involved in accidents and incidents than other sectors (Χ2 = 8.82, df = 2, p = 0.012) and also were more likely to have seen a colleague have an accident (Χ2 = 20.423, df 2, p < 0.001). The incident rates for learners themselves and for their colleagues (reported in the 2008/09 survey) are shown in Table 5.4:
Table 5.4: Sectoral breakdown of incidents at work
Not had an incident at
work Had an incident Total
Carpentry & Joinery, brickwork, horticulture and groundwork
109 79.6%
28 20.4%
137
Plumbing & gas, electrical installation, engineering
121 85.8%
20 14.2%
141
Childcare, business administration, hairdressing & beauty therapy
33 100%
0 0%
33
Have not seen colleague have accident at work
Have seen colleague have accident at work
Total
Carpentry & joinery, brickwork, horticulture and groundwork
87 64.4%
48 35.6%
135
Plumbing & gas, electrical installation, engineering
117 81.8%
26 18.2%
143
Childcare, business administration, hairdressing & beauty therapy
32 97.0%
1 3.0%
33
Source: IES survey of apprentices, 2008/09

Institute for Employment Studies 41
It should be noted that although more learners in the first category (carpentry etc.) reported working unsupervised than in the second two groups (71.4 per cent for carpentry etc. compared to 63.2 and 52.9 per cent for plumbing etc. and childcare etc., groupings respectively) this difference is not statistically significant (Χ2 = 4.926, df 2, p = n.s).
We move next to consider organisational and individual factors in health and safety.

42 Safe Learner Final Report
6 The impact of organisational influences and individual differences on learner behaviours at work
A range of measures were used to gauge the variables at play within the organisation and within individuals.
6.1 Outcome measures
In the preceding analyses, learners’ accounts of whether or not they had had, or witnessed, an accident were used as outcome or dependent measures. These are relatively objective measures of safety outcomes. In addition, learners’ self‐assessments on the Frequency of Unsafe Workplace Behaviours scale (Hofmann and Stetzer, 1996) was used. This operates both as an outcome measure, in that we examine the factors that influence the extent to which learners engage in unsafe workplace behaviours; but also, it also serves as an individual difference which in turn (potentially) feeds into the ultimate variable of interest, incidents and accidents at work. It therefore sits within the following group of measures which assess the various factors feeding into the likelihood of having an accident.
6.2 Measures of organisational safety attitudes
The research was designed to explore the impact of organisational and training factors on the development of safe practice. Here we describe the various measures that were used to assess the factors that were hypothesised to contribute towards the development of safety behaviours and outcomes.
Four measures of organisational safety attitudes were included within the study: the Salminen and Seppala (2005) safety climate questionnaire; the Zohar (2000) Group Safety Climate scale; and the Salminen and Seppala measure of safe work habits. In addition, three items to measure role overload were included.

Institute for Employment Studies 43
6.2.1 Safety climate
The Salminen and Seppala (2005) safety climate scale asks learners about attitudes to safety amongst managers, supervisors and colleagues. An aggregate score was calculated by summing across the items, with scores for three reverse‐scored items first transposed, so that a higher score equates to a safer climate at work.
In 2007/2008 the safety climate scores ranged from 30 to 90. In 2008/09, the range was 39 to 90. Therefore it can be seen that the range has contracted, with the lower end of the score distribution not being quite as low as before. In other words, the worst organisations this year did not have such bad scores as last year.
The relationship between safety climate and incidents
In 2007/08 an analysis of variance was conducted with all learners recruited that year, grouped according to whether or not they had had an accident. Significantly poorer assessments of their work safety climate, measured via the Salminen and Seppala scale were made by learners who had had an accident compared to those who had not (x̄ accident = 64.6, x̄ no accident = 69.8, df 1,219, F = 8.81, p = .003).
Across new and continuing learners in 2008/09 the same comparison was made. Overall, learners who had had an accident worked in environments that they assessed as having a significantly poorer safety climate, however, the difference was less this year (x̄ no accident = 71.3; x̄ accident = 68.1, df 1,289, F = 4.997, p = .026). In part this was because some of the learners who had given poorest safety climate scores in the first year had now completed their apprenticeships and left. Drawing on the pairs of assessments made by learners who had participated in both last year’s and this year’s survey allows us to gain more of an understanding of the complex of factors at play here.
Undertaking the same analysis with just the subset of learners for whom we have data for 2007/08 and 2008/09 we discover that, in the first year of the survey, these learners gave assessments of safety climate that were in line with the assessments given by the overall 2007/08 survey cohort as a whole (x̄ no accident = 71.7, x̄ accident = 65.9, df = 1,174, F = 11.57, p + .001). In the second year, although there is still some difference in the ratings of safety climate made by learners within these groups, it is much less and it does not achieve statistical significance (x̄ no accident 69.7, x̄ accident, 67.2, df 1, 110, F = 1.47, p = n.s.). What appears to have happened is that the assessments made of safety climate over time have moved closer together. Those who started off believing their employer had a good safety climate have lowered their assessments, while those in companies assessed initially as poor have improved their assessments somewhat. Looking further at the data there appear to be two factors contributing to this.
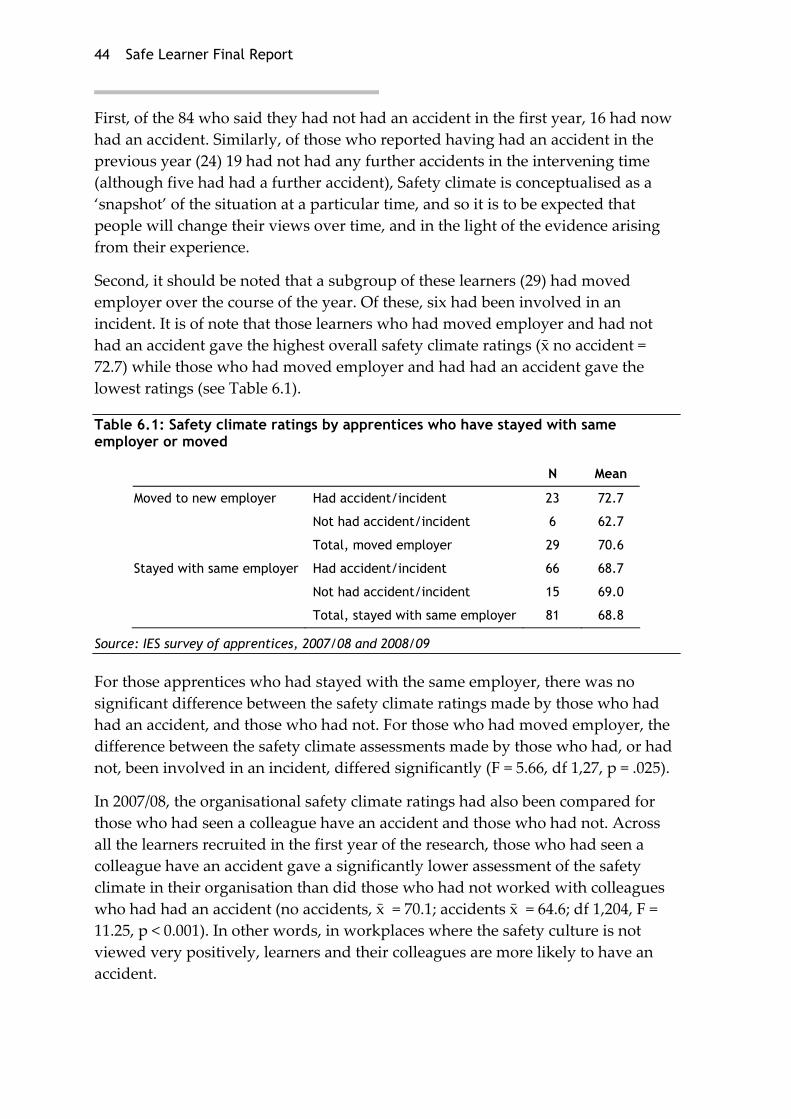
44 Safe Learner Final Report
First, of the 84 who said they had not had an accident in the first year, 16 had now had an accident. Similarly, of those who reported having had an accident in the previous year (24) 19 had not had any further accidents in the intervening time (although five had had a further accident), Safety climate is conceptualised as a ‘snapshot’ of the situation at a particular time, and so it is to be expected that people will change their views over time, and in the light of the evidence arising from their experience.
Second, it should be noted that a subgroup of these learners (29) had moved employer over the course of the year. Of these, six had been involved in an incident. It is of note that those learners who had moved employer and had not had an accident gave the highest overall safety climate ratings (x̄ no accident = 72.7) while those who had moved employer and had had an accident gave the lowest ratings (see Table 6.1).
Table 6.1: Safety climate ratings by apprentices who have stayed with same employer or moved
N Mean
Moved to new employer Had accident/incident 23 72.7
Not had accident/incident 6 62.7
Total, moved employer 29 70.6
Stayed with same employer Had accident/incident 66 68.7
Not had accident/incident 15 69.0
Total, stayed with same employer 81 68.8
Source: IES survey of apprentices, 2007/08 and 2008/09
For those apprentices who had stayed with the same employer, there was no significant difference between the safety climate ratings made by those who had had an accident, and those who had not. For those who had moved employer, the difference between the safety climate assessments made by those who had, or had not, been involved in an incident, differed significantly (F = 5.66, df 1,27, p = .025).
In 2007/08, the organisational safety climate ratings had also been compared for those who had seen a colleague have an accident and those who had not. Across all the learners recruited in the first year of the research, those who had seen a colleague have an accident gave a significantly lower assessment of the safety climate in their organisation than did those who had not worked with colleagues who had had an accident (no accidents, x̄ = 70.1; accidents x̄ = 64.6; df 1,204, F = 11.25, p < 0.001). In other words, in workplaces where the safety culture is not viewed very positively, learners and their colleagues are more likely to have an accident.

Institute for Employment Studies 45
In 2008/09 this difference between the continuing learners was no longer significant. Looking first at the data for the whole learner group, those learners whose colleagues had not had an accident rated the safety climate in their organisation higher than did those with colleagues who had had an accident (no accidents, x̄ = 71.4; accidents x̄ = 69.2) but this difference did not reach a level of statistical significance (F = 3.5, df 1,289, p = .062). When the safety climate scores for learners who had changed employers were compared with those who had not, while those who had changed employers and seen a colleague have an accident gave the lowest safety climate scores, and those who had moved employer and not seen any colleagues have an accident gave the highest, this difference was not statistically significant.
The relationship between safety climate and unsafe workplace behaviours
In the first year of the survey those learners who worked in workplaces with lower safety climate ratings were more likely to admit to engaging in unsafe workplace behaviours. Pearson product‐moment correlation of all learners’ scores of their own frequency of unsafe workplace behaviours on the Hofmann and Stetzer (1996) scale with their assessment of the workplace safety climate in their place of employment revealed a significant inverse correlation between the two measures (N = 166, r = ‐.305, p = 0.001). In other words, young people who work in environments that have a weaker safety culture are more likely to engage in unsafe workplace behaviours. It should be noted that the small number of second and third year learners precluded any further analysis in the first year of the project.
In 2008/09 we again examined the correlation between frequency of the individual’s unsafe behaviours and workplace safety climate, this time separately for first years and continuing learners (second and third years). A change in the correlation would indicate that the association grows stronger or, alternatively, weakens, with time. The correlation for the first years as a whole was lower, and did not achieve significance (N = 158, r = ‐.103, p = ns). However, it should be remembered that the analysis of profile of the learner groups indicated that there were proportionally more learners from lower‐risk occupations in the first year learners in this data set, and a measure of unsafe workplace behaviours is likely to be one are in which they differ. Therefore, learners from the low‐risk occupations were removed and the analysis was re‐run. With this subgroup, the association between safety climate and the likelihood of engaging in unsafe behaviours increased, but remained just outside the conventional level of significance, which is a probability level of 0.05 (N = 125, r = ‐.172, p = .055). We then repeated the analysis with the group of second and third year continuing learners. Here, the relationship was stronger and significant (N = 143, r = ‐.378, p < .001). Comparison of these two correlation coefficients using z scores reveals that the two correlations

46 Safe Learner Final Report
differ significantly (u = 1.81, p = .05). This suggests that the correlation between safety climate and propensity of learners to engage in unsafe behaviours increases over time. It also suggests that this relationship is more pronounced in occupations that are higher risk.
Unsafe behaviours and accidents
In organisations with poor safety climate learners tend to engage in more unsafe behaviours over time. Increasing frequency of unsafe behaviours leads to increased risk of incidents at work. Those who had reported an incident at work also reported engaging more frequently in unsafe behaviours (F = .611, df 1,221, p = .013).
Safety action and work habits
The Salminen and Seppala (2005) work habits scale asks five questions that assess safe work habits within an organisation: whether employees are given safety guidance; accessibility of PPE; whether employees are given information regarding the location of safety switches; a similar question regarding the location of fire extinguishers; and information on access to first aid.
Analysis of variance conducted on the 2007/08 dataset revealed that learners who have had accidents or incidents were significantly more likely to assess their workplace as having a lower score on the safety action and work habits scale (x̄ no accidents = 19.85; x̄ accidents = 18.12; df1,219, F = 7.15, p = .008). There was a similar, but stronger, effect when learners are grouped into those who have witnessed, or not witnessed, a colleague have an accident. In other words, learners whose colleagues have had accidents assess their workplaces as being significantly poorer on safety actions and work habits (x̄ no accidents = 20.02; x̄ accidents = 18.02; df 1,220, F = 10.75, p = .001).
In 2008/09 we undertook the same analyses for the first year learners and continuing apprentices. While for first year apprentices there was no significant difference in the safety action scores given by learners who had had (N = 19) or not had (N = 142 ) an accident, amongst the second and third years there was a significant difference in the assessments made of safety actions and work habits at work by those learners who had (N = 26 ) and not had (N = 114) an accident (F = 4.34, df 1,138, p = .039).
The relationship between safe work habits and cognitive failure
It is also worth reporting that young people working in workplaces that pay less attention to safe work habits admit to more cognitive failures than those young people in work environments that pay more attention to safe work habits.

Institute for Employment Studies 47
Correlation of the work habits scale and the cognitive failures scale shows a moderate, but statistically significant, inverse relationship between the two constructs (N = 224, r = ‐.221, p = 0.001). In other words, young people in work environments which pay more attention to safe work habits are less likely to lose concentration and work focus. In 2007/08 it was not possible to determine whether this is because safer workplaces tend to select more diligent young workers, or because safer workplaces encourage their employees to stay focused on the task in hand.
In 2008/09 the same correlation was calculated for first years and continuing learners separately; for first years, the correlation was significant and very similar to that found across the 2007/08 learner cohort as a whole (N = 169, r = ‐.222, p = .004); for the continuing learner group the correlation was slightly stronger (N = 147, r = ‐.297, p < .001) but the correlations for the two groups did not differ significantly. It therefore remains difficult to determine conclusively whether this is a selection effect or attributable to workplace supervision.
6.2.2 Group safety climate
The Zohar group‐level scale of safety climate contains items that measure safety actions and safety expectations. Learners who had not been involved in accidents or incidents at work gave higher scores on this measure, than did those who had been involved in an accident or incident (X no accident = 24.4; X accident = 22.7; df 1,221. F = 4.78, p = .03).
With the 2008/09 data set we conducted the same analyses for the first year apprentices and the continuing years apprentices. In the first year learner group there was no significant difference in the group safety climate assessments made by the learners who had , or had not had, an accident; with the continuing learner group the difference in means did not reach the level of statistical significance (x̄ no accident = 5.66, x̄ accident = 5.13; F = 3.37, df, 1,134, p = .069,). The analyses suggest that, as would be expected, learners’ perceptions of group safety climate become more polarised over time and with exposure to accidents.
A similar analysis was conducted for the group safety climate measure and whether learners had seen incidents involving colleagues. Across the 2007/08 learner group as a whole those learners who had seen an accident or incident involving a colleague gave lower assessments of group safety climate than did those who had not seen an accident or incident involving a colleague (x̄ no accident = 24.5; x̄ accident =22.6; df = 1,222, F = 7.21, p = .008). In 2008/09 this analysis was conducted separately for first year apprentices and continuing learners: (First years: x̄ no accident = 5.66, x̄ accident = 5.2 1, F = 3.89, df 1, 161, p = .05; continuing learners: x̄ no accident = 5.77, x̄ accident = 5.11; F = 7.16, df 1,134, , p = .008). Again, learner perceptions of safe climate within their own workgroup
48 Safe Learner Final Report
become more polarised over time, presumably as a result of seeing more evidence of good or poor practice.
6.2.3 Role overload
Role overload and accidents
Role overload is the extent to which a member of staff feels pressurised in their job. It has been hypothesised to be positively related to workplace cognitive failure (Wallace and Chen, 2005). The three‐item role overload scale of Cammann, Fichman, Jenkins and Klesh (1983) was used to assess this construct. For each learner a role overload score was computed by summing across the three scale items. Those learners that had been involved in an accident or incident gave slightly higher role overload scores than did those who had not been involved in accidents. Although slight, the difference was statistically significant (x̄ no accident = 7.1; x̄ accident = 7.9; df 1, 217, F = 5.35, p =.027). There was no difference in the role overload scores of those who had witnessed a colleague have an accident or not (F = 1.58, p = n.s.).
In 2008/09 we analysed role overload separately for the first year and continuing learners. For the first years, there was a significant difference in the reports of role overload between those learners who had, or had not had, an accident or incident: x̄ no accident = 6.32; x̄ accident = 7.52, df 1, 163, F = 7.22, p = .008. Surprisingly, for the continuing learners, role overload was not significantly related to their likelihood of having had an accident or incident; the mean role overload ratings given by continuing learners who had, or had not had, an accident or incident were almost identical (6.9 and 6.8, respectively; no significant difference). This suggests that role overload mainly affects very new learners; by the time they move into the later years of their apprenticeship they may have learnt to cope with (or perhaps ignore) pressure at work.
Role overload and unsafe behaviours
In 2007/08 there was a significant positive correlation between reported role overload levels and frequency of unsafe behaviours (N =163, ‐.278 p < .001), that is, those who reported feeling pressurised also reported engaging in more unsafe behaviours. In 2008/09 the data analysis showed that this relationship held across both the first year apprentices and the continuing learners (first year apprentices: N = 160, r = .235, p = .003; continuing apprentices: N = 144, r = .301, p = .001).
This suggests that role overload leads to increasing levels of unsafe behaviour which, in a proportion of cases, can result in accidents. The previous analysis suggests that the accidents in which role overload plays a large part tend to be those involving novice workers.

Institute for Employment Studies 49
6.3 Individual differences
Two types of individual differences were assessed during the research: attitudes and traits. Learners’ attitudes to the health and safety training were assessed by asking for their views on the relevance and utility of the training in health and safety they received. In the first year survey two trait measures were explored in the work: cognitive failure and conscientiousness. In the second survey the ability to remain focussed on‐task was added to the survey measures.
In the following analyses we consider the impact that attitudes, cognitive failure, conscientiousness and on‐task focus have upon the outcome measures of whether or not the learner has had an accident or incident and the learner’s own self‐assessment of frequency with which they engage in unsafe behaviours.
6.3.1 Attitudes
Analyses of learner beliefs about the relevance and utility of the individual content areas of the Safe Learner training was covered in section 4.4.1. Here, we consider learners’ overall perceptions of the relevance and usefulness of the health and safety input. To do this a composite score for learners’ overall assessment of the relevance and usefulness of the training was computed by summing across the relevance and usefulness scores given for all of the items.
Attitudes and accidents
The relevance and usefulness scores that were given by learners in 2007/08 who had been involved in an accident at work were compared with the scores given by those who had not. Analysis of variance reveals that learners who had not been involved in an accident or incident at work rated the Safe Learner training as more relevant than did those who had been involved in an accident or incident (x̄ no accidents = 43.0, x̄ accidents = 40.0, df 1,219, F = 6.14, p = 0.014). In other words, the more relevant the learner believed the health and safety training to be, the less likely they were to have had an accident.
The analyses also revealed that learners who had not been involved in an accident or incident also rated the Safe Learner training as more useful than did those who had been involved in an accident or incident (x̄ no accidents = 42.4, x̄ accidents = 38.5, df 1,213, F = 5.58, p = 0.019). The 2007/08 analyses therefore suggested that the more useful a learner thought the Safe Learner training to have been, the less likely they were to have had an accident.
In 2008/09 we again repeated these analyses for the learner group as a whole; this analysis showed that the relevance ratings given by those who had not had an accident were again significantly higher than those given by apprentices who have

50 Safe Learner Final Report
had an accident. However, the difference was less than in the previous year (x̄ no accidents = 44.2, x̄ accidents = 41.9, F = 4.17, df 1,299, p = 0.042 ). Inspection of the means revealed that the second years had given lower ratings overall; when compared using an analysis of variance it emerged that the continuing learners had given significantly lower ratings overall for relevance of the items than had the first year learners (x̄ no accidents = 45.3, x̄ accidents = 42.0, F = 17.9, df 1,318, p < 0.001).
In order to determine whether this difference between first years and continuing learners reflects a change in attitudes over time or differences between the learners in the two groups a comparison analysis was undertaken using the repeated measures dataset (the dataset for the apprentices for whom we have two years’ data). The mean rating of relevance made by this group of learners in 2007/08 was 43.3 and in 2008/09 it was 41.9; in other words, the ratings made by these individuals had fallen over time. The difference between these two means just borders on statistical significance: F = 3.8, df 1,114, p = .053. This therefore suggests that some of the difference in ratings of relevance derives from changes in the beliefs of the learners over time (and section 4.4.1 provided details of the part which supervisors may play in this) while some of the difference derives from differences between the two learner groups.
Attitudes and reports of unsafe behaviour
Learner scores on the relevance and usefulness were correlated with their self‐reported frequency of unsafe behaviours. Although there was a slight negative association in both cases, neither was statistically significant.
In the second wave of the survey we can see why this was the case. Correlating perceived relevance of the health and safety training with learner reports of frequency of unsafe behaviour, amongst the first year apprentices there is no significant correlation between these two measures (r = .026, p = n.s). For the continuing learners, there is a significant, inverse correlation – in other words, those learners who believe the health and safety training is relevant are more likely to not engage in unsafe behaviours (N = 143, r = ‐.218, p = .009). A correlation run with data from across the whole learner group shows a lower correlation: r = .016, N = 301, p = .016. Given the small numbers of second and third year learners in the first wave of the survey it is not surprising that no relationship emerged in the first wave analyses.
6.3.2 Cognitive failure
The Wallace and Chen (2005) Workplace Cognitive Failure Scale assesses the extent to which an individual loses focus or concentration or suffers memory lapses at work. Learners self‐assessed themselves on this scale and analyses were

Institute for Employment Studies 51
conducted to determine the extent to which cognitive failure at work was related to unsafe behaviours and accidents.
Cognitive failure and frequency of unsafe workplace behaviours
For each learner, composite scores for cognitive failure and for frequency of unsafe workplace behaviours were computed. In the first wave of the survey, correlation of these scores across all learners revealed a significant positive relationship between the two measures (N = 162, r = .292, p < 0.001). In other words, those learners who were prone to more cognitive lapses were also more likely to say that they rushed jobs, used incorrect tools, did not use appropriate protective equipment and so on.
With the 2008/09 dataset we re‐ran this correlation for the first year apprentices and the continuing learner group. The correlation for the first year learners was r = .226 (N = 160, p = .004) and for continuing learners was .409 (N = 145, p < .001). Across the 2008/09 cohort as a whole the correlation is .330 (N = 305, p < .001).
The correlation statistics for the first years and the continuing learners differ significantly (u = 1.77, p < .05). In this case, this difference does seem to arise from differences between the individuals in the two year groupings: when the repeated measures data set was used to compare the ratings which individuals made of themselves in 2007/08 and in 2008/09 on the cognitive failure and unsafe behaviours scales there was no significant difference in the ratings individuals made on either of these two scales across the two years.
Cognitive failure and accidents
Learners were grouped according to whether or not they had had an accident or incident at work and the two groups’ scores for cognitive failures were compared. Those who had been involved in an accident or incident had significantly higher scores on the measure of cognitive failure (x̄ no accident = 27.2; x̄ accident = 31.7, df 1, 216, F = 10.14, p = .002). In other words, those learners who had reported having had an accident or incident were more likely to be those who were more prone to cognitive lapses.
Across the whole learner group in 2008/09 the same finding held: those who had scored more highly on the cognitive failure measure were more likely to have had an accident (x̄ no accident = 26.58, x̄ accident = 29.18, df 1, 300, F = 4.07, p = .045). However, analyses conducted separately for the first year and continuing year learner groups failed to achieve a level of statistical significance, although the means for those who had or had not had accidents showed the same pattern: those who had had accidents scored themselves higher on the cognitive failure measure

52 Safe Learner Final Report
than those who had not: first years x̄ no accident = 25.8 x̄ accident = 27.6; continuing learners x̄ no accident = 27.6, x̄ accident = 30.3).
Cognitive failure and role overload
In the first wave of the survey a statistically significant positive correlation between role overload and cognitive failure (r = 0.21, N = 223, p = .002). In other words, the more overloaded a young learner is at work the more likely he or she is to suffer some form of cognitive failure.
In the second wave of the survey the same relationship was observed with the 2008/09 data for the group as a whole: r = .254, N = 317, p = <.001. When the data were analysed separately for the first year and continuing learners, the correlation was found to be significant for both groups: for first years, the correlation statistic was .15, N = 173, p = .049; for continuing learners the correlation statistic was .337, N = 144, p < .001. The correlations for the two learner groups differed significantly (u = 1.75, p < .05). The continuing learners reported higher levels of cognitive failure than the first years (x̄ first year apprentices = 26.2, x̄ continuing apprentices = 28.7, df 1,319, F = 5.25, p = 0.023).
6.3.3 Conscientiousness
Conscientiousness and perceived relevance of the Safe Learner training
In both years the learners’ scores on the eight items of the conscientiousness sub‐scale from the Saucier Mini‐markers scale were summed to give an aggregate conscientiousness score. Analyses conducted in 2007/08 revealed that conscientiousness was positively correlated with perceived relevance of the safe learner training (N = 228, r = .339, p < .001) and with perceived usefulness of the safe learner training (N = 221, r = .285, p < .001).
In the 2008/09 wave of the survey there was a slightly lower but nonetheless significant correlation between learner conscientiousness and perceived relevance of the safe learner training (N = 317, r = .143, p = .011). The reason for the lower correlation becomes clear when the data from the first year learners and continuing learners are inspected separately. Amongst the first years, the correlation coefficient is .210 (N= 173, p = .006); for the continuing learners the correlation coefficient is .108, which is non‐significant. A similar pattern is seen for usefulness of the training: across the 2008/09 respondents as a whole, perceived utility and conscientiousness were weakly but significantly correlated r = 1.29, N = 291, p = .027; for first year apprentices the correlation was .343, N = 160, p < .001, for continuing learners there was no correlation (r = .001, N = 131, p = n.s).

Institute for Employment Studies 53
It should be remembered that, in the first wave of the survey, continuing learners constituted just a very small proportion of the overall cohort, which precluded further comparisons between years. The increased numbers in the second year of the study allowed us to examine the way in which some relationships continue to hold over time while others decrease. In this instance, it appears that while conscientiousness influences initial views of the relevance and use of the safe learner training, differences between learners who are high or low on conscientiousness decline over time.
Conscientiousness and cognitive failure
Analysis of the first wave of the survey revealed that conscientiousness was inversely correlated with learners’ tendency towards cognitive failure (N = 226, r = ‐.290, p < .001) but not to frequency of unsafe workplace behaviours (N = 166, r = ‐ .05, p = n.s.). In other words, learners who were more conscientious tended to have fewer cognitive lapses, but this was not related to the number of unsafe workplace behaviours they reported engaging in.
With the 2008/09 data we computed both these correlations separately for first year apprentices and continuing learners. For both first year and continuing learners there was a significant inverse correlation between conscientiousness and cognitive failure (first years: N = 174, r = ‐.273, p = .006; continuing apprentices: N = 146, r = ‐.242, p = .003). A comparison of the 2007/08 correlation with the first year and continuing correlations computed with the 2008/09 data reveals that there is no significant difference between the groups. In other words, the relationship identified for both first years and continuing years in the second wave is in line with that obtained in the first wave of the work, and the constancy across years suggests that this is a stable relationship that is maintained at around the same level over time.
The correlation between conscientiousness and unsafe workplace behaviours was not significant in the first wave of the survey. Analysis of the second wave data reveals that this is a relationship that emerges with time. For the first year group in 2008/09 we again obtained a non‐significant correlation statistic (N = 160, r = ‐.112, p = ns). For the continuing learners, however, there was a significant inverse relationship between conscientiousness and unsafe workplace behaviours (N = 146, r = ‐.227, p = .006).
In 2007/08, although those who had not had an accident had slightly higher conscientiousness scores than did those who had (54.6 cf 52.5) the difference was not statistically significant (df 1, 218, F = 1.445, p = n.s.). The same was found with the 2008/09 data: across learners as a whole, and separately for both first year apprentices and continuing apprentices, those who had had accidents had lower
54 Safe Learner Final Report
conscientiousness scores than those who had not, but in no case was this difference statistically significant.
With the 2007/08 survey data the learner assessments of workplace and group safety climate, frequency of unsafe behaviours, cognitive failure and role overload were entered into a series of analyses of variance in which the following items were used as pseudo‐independent grouping1 variables:
■ extent to which their workplace supervisor discusses health and safety issues with them
■ extent to which workplace supervisor discusses risky activities
■ extent to which TU representative discusses health and safety issues with them
■ extent to which TU representative discusses risky activities
■ extent to which colleagues engage in risky behaviours at work
■ extent to which the learner engages in risky behaviours at work.
In 2008/09 the analyses were repeated, first for the learner group as a whole and then with the learners grouped into first years and continuing learners. The detailed outcomes of this series of analyses are summarised in Table 6.2 at the end of this chapter. The table shows that across both waves of the survey:
■ those who gave higher scores on the measures of organisational and group safety climate are more likely to say their supervisor discusses health and safety and risky actions with them, and less likely to say that they and their colleagues engage in risky behaviours
■ those who say their supervisor discusses health and safety issues and risky activities with them see the health and safety training they receive at college or training provider as being more relevant and useful
■ learners who report higher levels of role overload are more likely to engage in unsafe behaviours and have colleagues engage in risky actions
1 This means that subjects’ scores on these factors were used as a basis for grouping individuals for analysis, but are not manipulable as a genuinely independent variable would be.

Institute for Employment Studies 55
■ those who said that their colleagues engaged in risky activities at work were more likely to admit to engaging in unsafe behaviours at work.
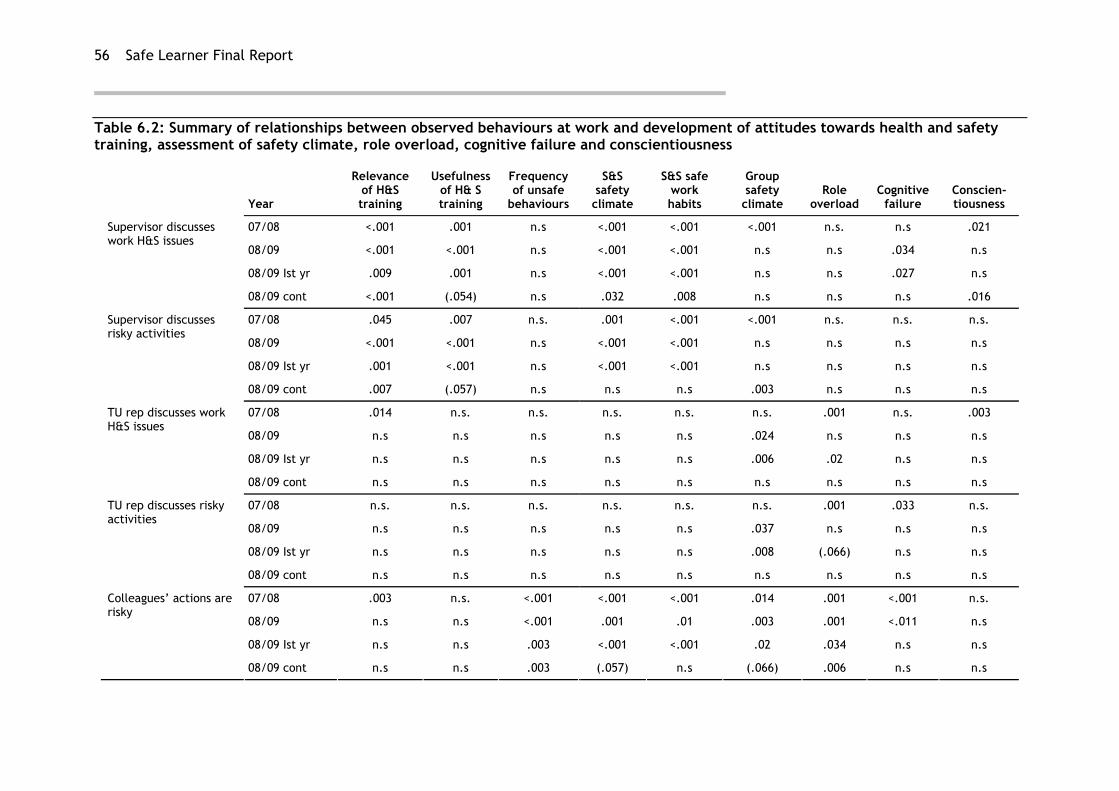
56 Safe Learner Final Report
Table 6.2: Summary of relationships between observed behaviours at work and development of attitudes towards health and safety training, assessment of safety climate, role overload, cognitive failure and conscientiousness
Year
Relevance of H&S training
Usefulness of H& S training
Frequency of unsafe
behaviours
S&S safety
climate
S&S safe work habits
Group safety
climate Role
overload Cognitive
failure Conscien-tiousness
07/08 <.001 .001 n.s <.001 <.001 <.001 n.s. n.s .021
08/09
<.001 <.001 n.s <.001 <.001 n.s n.s .034 n.s
08/09 Ist yr .009 .001 n.s <.001 <.001 n.s n.s .027 n.s
Supervisor discusses work H&S issues
08/09 cont <.001 (.054) n.s .032 .008 n.s n.s n.s .016
07/08 .045 .007 n.s. .001 <.001 <.001 n.s. n.s. n.s.
08/09
<.001 <.001 n.s <.001 <.001 n.s n.s n.s n.s
08/09 Ist yr .001 <.001 n.s <.001 <.001 n.s n.s n.s n.s
Supervisor discusses risky activities
08/09 cont .007 (.057) n.s n.s n.s .003 n.s n.s n.s
07/08 .014 n.s. n.s. n.s. n.s. n.s. .001 n.s. .003
08/09
n.s n.s n.s n.s n.s .024 n.s n.s n.s
08/09 Ist yr n.s n.s n.s n.s n.s .006 .02 n.s n.s
TU rep discusses work H&S issues
08/09 cont n.s n.s n.s n.s n.s n.s n.s n.s n.s
07/08 n.s. n.s. n.s. n.s. n.s. n.s. .001 .033 n.s.
08/09
n.s n.s n.s n.s n.s .037 n.s n.s n.s
08/09 Ist yr n.s n.s n.s n.s n.s .008 (.066) n.s n.s
TU rep discusses risky activities
08/09 cont n.s n.s n.s n.s n.s n.s n.s n.s n.s
07/08 .003 n.s. <.001 <.001 <.001 .014 .001 <.001 n.s.
08/09
n.s n.s <.001 .001 .01 .003 .001 <.011 n.s
08/09 Ist yr n.s n.s .003 <.001 <.001 .02 .034 n.s n.s
Colleagues’ actions are risky
08/09 cont n.s n.s .003 (.057) n.s (.066) .006 n.s n.s
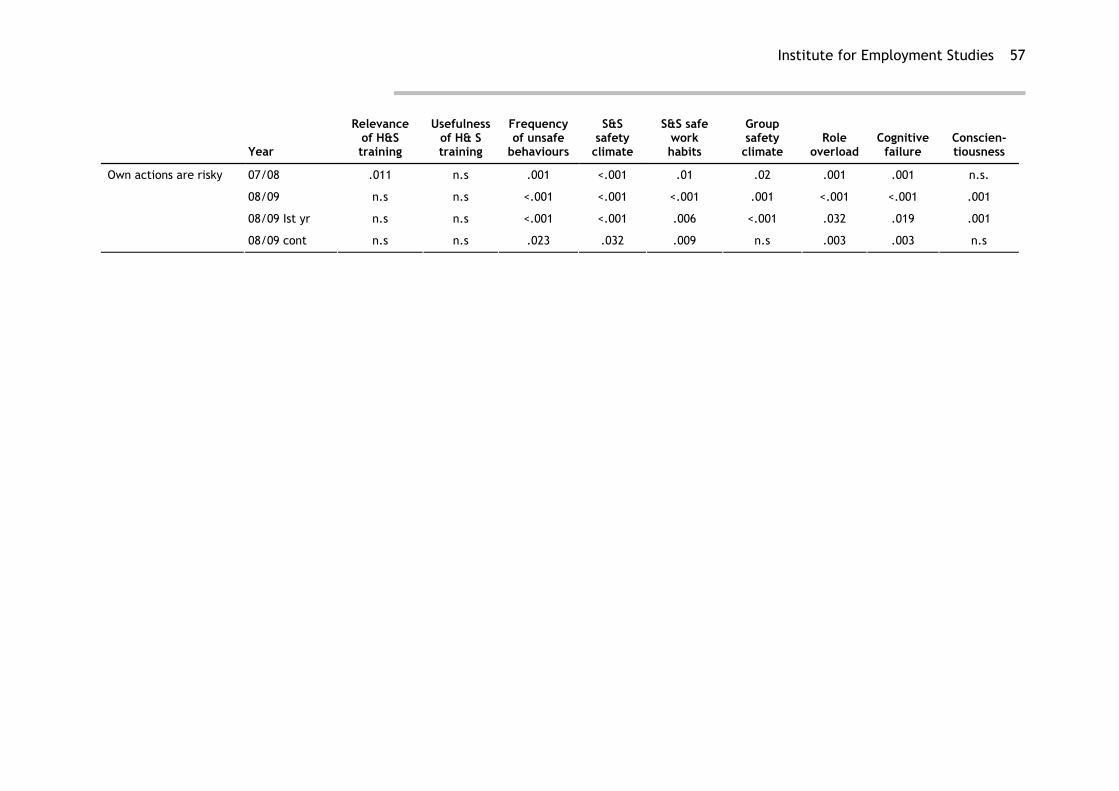
Institute for Employment Studies 57
Year
Relevance of H&S training
Usefulness of H& S training
Frequency of unsafe
behaviours
S&S safety
climate
S&S safe work habits
Group safety
climate Role
overload Cognitive
failure Conscien-tiousness
07/08 .011 n.s .001 <.001 .01 .02 .001 .001 n.s.
08/09
n.s n.s <.001 <.001 <.001 .001 <.001 <.001 .001
08/09 Ist yr n.s n.s <.001 <.001 .006 <.001 .032 .019 .001
Own actions are risky
08/09 cont n.s n.s .023 .032 .009 n.s .003 .003 n.s

58 Safe Learner Final Report
7 Unrealistic optimism
Unrealistic optimism is the tendency to perceive negative events as being less likely to happen to oneself than to others, and, conversely, for positive events to be more likely to happen to oneself. Measures of unrealistic optimism were included within the questionnaire because a tendency to believe that one is relatively immune to accidents could well serve to impede the adoption of safe behaviour at work (and elsewhere) and thereby undermine the effectiveness of the safe learning training input. Learners who think accidents at work are more likely to happen to other people than to themselves may see little reason to alter their own behaviour.
The analyses were rerun for the 2008/09 cohort data. In general, the distributions in the second wave survey were similar to those seen in the previous year. The analyses follow the same sequence as last year: we start by comparing apprentices’ estimates of their own likelihood of having an accident or injury at work or suffering an occupational illness with their estimates of the likelihood of an ‘average’ apprentice of their own sex and age having an accident or injury or suffering from an occupational illness.
For each of the three pairs of questions (those relating to having an accident or incident; sustaining an injury; or suffering from an occupational illness) we then compare the probability estimates that were given by apprentices who had reported that they had had an accident or incident since starting work with those given by apprentices who had not been involved in an incident. Lastly we compare the ratings made by those whose colleagues have been involved in an incident with those made by apprentices whose colleagues have not had an incident or accident.
For the sake of brevity, in this section where we refer to responses to the questions in which apprentices were asked how likely it was that something would happen to ‘an average apprentice of your age and sex’ we simply say ‘the average apprentice’.

Institute for Employment Studies 59
Note that, where we use the Chi‐square statistic to test for statistically significant differences in distribution of responses, these tests have been undertaken using raw scores rather than percentages, but percentages are reported in the tables to enable easier comparison of groups of different sizes.
7.1 How likely are you to have an accident at work?
Apprentices were asked to rate the likelihood that they would have an accident at work, and how likely it was that an average apprentice of their age and sex would have an accident at work. They gave their estimates on a seven point scale, from ‘extremely unlikely’ to ‘extremely likely’, with ‘don’t know’ as the mid‐point. In 2007/08 we found that, in keeping with the theory of unrealistic optimism, apprentices believed that they were less likely than an average apprentice to have an accident or incident at work, sustain an injury or succumb to an occupational illness or disease.
The percentage distribution of the estimates of likelihoods of having an accident or incident at work obtained in the 2008/09 survey are shown in Table 7.1, below.
Table 7.1: Comparison of apprentices’ estimates of likelihood of themselves, or an average apprentice, having an accident or incident at work (%)
Extremely unlikely
Very unlikely Unlikely
Don’t know Likely
Very likely
Extremely likely
Total N
You 11.5 23.5 31.3 14.2 9.7 1.2 0.7 323
An average apprentice of your age and sex
6.2 12.4 19.3 32.3 21.4 6.8 1.6 323
Source: IES survey of apprentices, 2008/09
The data reveal that, in keeping with theory and with the findings in 2007/08, apprentices estimated their chance of having an accident at work as being significantly lower than those of an ‘average apprentice’ (χ2 = 55.7, df 6, p <0.001). In other words, they are unrealistically optimistic about their chances of remaining accident‐free compared to their fellow apprentices.
7.1.1 Impact of having already had an accident
If we examine these data by whether or not the apprentice has had an accident themselves, we can see that the assessments made by the apprentices who have had accidents have shifted in the direction of becoming more ‘realistic’ than those who had not already had an accident. In other words, on average these apprentices now see accidents as somewhat more likely to happen to themselves than do those apprentices who have not had an accident previously (Table 7.2).
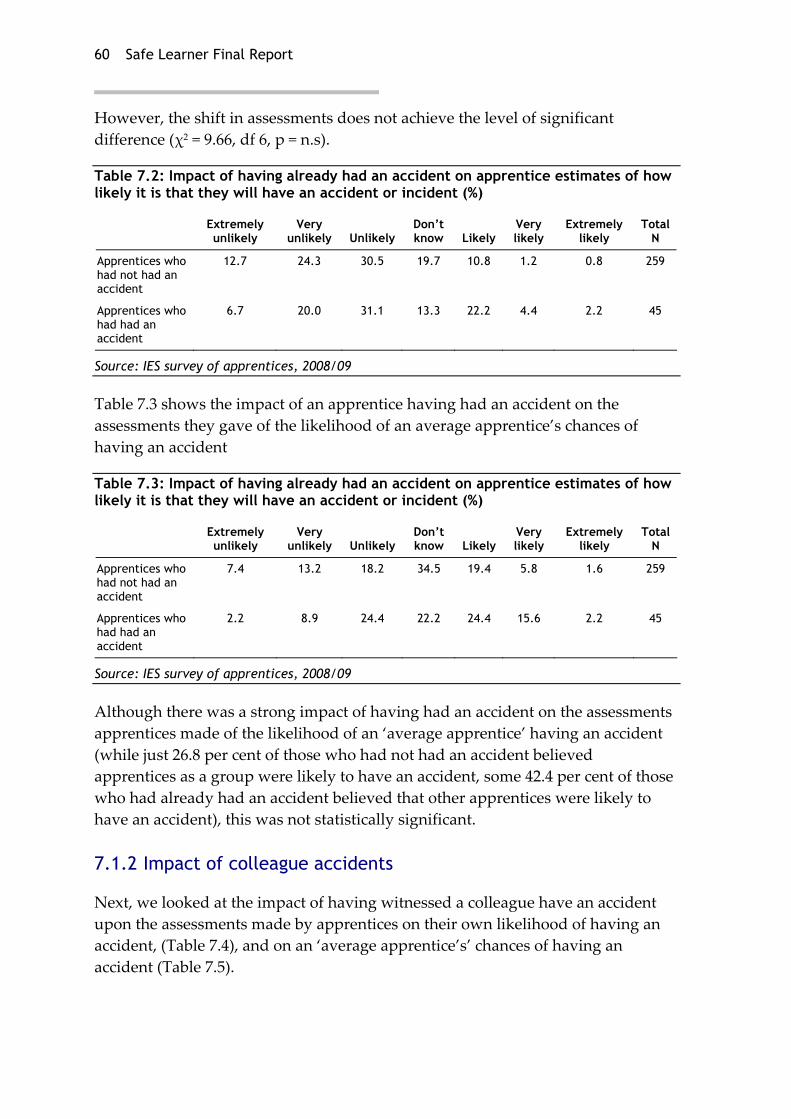
60 Safe Learner Final Report
However, the shift in assessments does not achieve the level of significant difference (χ2 = 9.66, df 6, p = n.s).
Table 7.2: Impact of having already had an accident on apprentice estimates of how likely it is that they will have an accident or incident (%)
Extremely unlikely
Very unlikely Unlikely
Don’t know Likely
Very likely
Extremely likely
Total N
Apprentices who had not had an accident
12.7 24.3 30.5 19.7 10.8 1.2 0.8 259
Apprentices who had had an accident
6.7 20.0 31.1 13.3 22.2 4.4 2.2 45
Source: IES survey of apprentices, 2008/09
Table 7.3 shows the impact of an apprentice having had an accident on the assessments they gave of the likelihood of an average apprentice’s chances of having an accident
Table 7.3: Impact of having already had an accident on apprentice estimates of how likely it is that they will have an accident or incident (%)
Extremely unlikely
Very unlikely Unlikely
Don’t know Likely
Very likely
Extremely likely
Total N
Apprentices who had not had an accident
7.4 13.2 18.2 34.5 19.4 5.8 1.6 259
Apprentices who had had an accident
2.2 8.9 24.4 22.2 24.4 15.6 2.2 45
Source: IES survey of apprentices, 2008/09
Although there was a strong impact of having had an accident on the assessments apprentices made of the likelihood of an ‘average apprentice’ having an accident (while just 26.8 per cent of those who had not had an accident believed apprentices as a group were likely to have an accident, some 42.4 per cent of those who had already had an accident believed that other apprentices were likely to have an accident), this was not statistically significant.
7.1.2 Impact of colleague accidents
Next, we looked at the impact of having witnessed a colleague have an accident upon the assessments made by apprentices on their own likelihood of having an accident, (Table 7.4), and on an ‘average apprentice’s’ chances of having an accident (Table 7.5).

Institute for Employment Studies 61
Table 7.4: Impact of having witnessed a colleague having an accident upon the assessments made by apprentices on their own likelihood of having an accident (%)
Extremely unlikely
Very unlikely Unlikely
Don’t know Likely
Very likely
Extremely likely
Total N
Apprentices who had not seen an accident
13.4 25.1 31.6 17.7 10.0 1.3 0.9 231
Apprentices who had seen an accident
6.8 20.5 28.8 21.9 19.2 2.7 6.8 73
Source: IES survey of apprentices, 2008/09
The data reveal that witnessing a colleague have an accident also has some impact on apprentices’ estimates of how likely they are to have an accident. More of the apprentices who had witnessed an accident at work thought it was likely that they themselves would have an accident or incident at work. However, again this shift is not statistically significant overall (χ2 = 8.37, df 6, p = n.s).
The data in Table 7.5 indicate that proportionally more of the apprentices who had witnessed an accident at work thought it was likely that an average apprentice would have an accident (and, conversely, fewer of them thought this was very unlikely), but again, comparison of the two distributions did not reach a level of statistical significance (χ2 = 5.344, df 6, p = n.s).
Table 7.5: Impact of having witnessed a colleague having an accident upon the assessments made by apprentices on the average apprentice’s likelihood of having an accident (%)
Extremely unlikely
Very unlikely Unlikely
Don’t know Likely
Very likely
Extremely likely
Total N
Apprentices who had not seen an accident
7.4 13.5 19.1 33.5 18.7 6.1 1.7 230
Apprentices who had seen an accident
4.1 9.6 19.2 31.5 26.0 9.6 0.0 73
Source: IES survey of apprentices, 2008/09
7.2 How likely are injuries at work?
In this section we look at unrealistic optimism amongst apprentices in relation to their perceived likelihood of sustaining an injury at work. As before, we start by comparing the ratings the apprentices make for themselves and for an average apprentice, and then go on to examine the impact of having already been involved in some sort of accident or incident and of witnessing a colleague have an accident or incident, on these assessments.
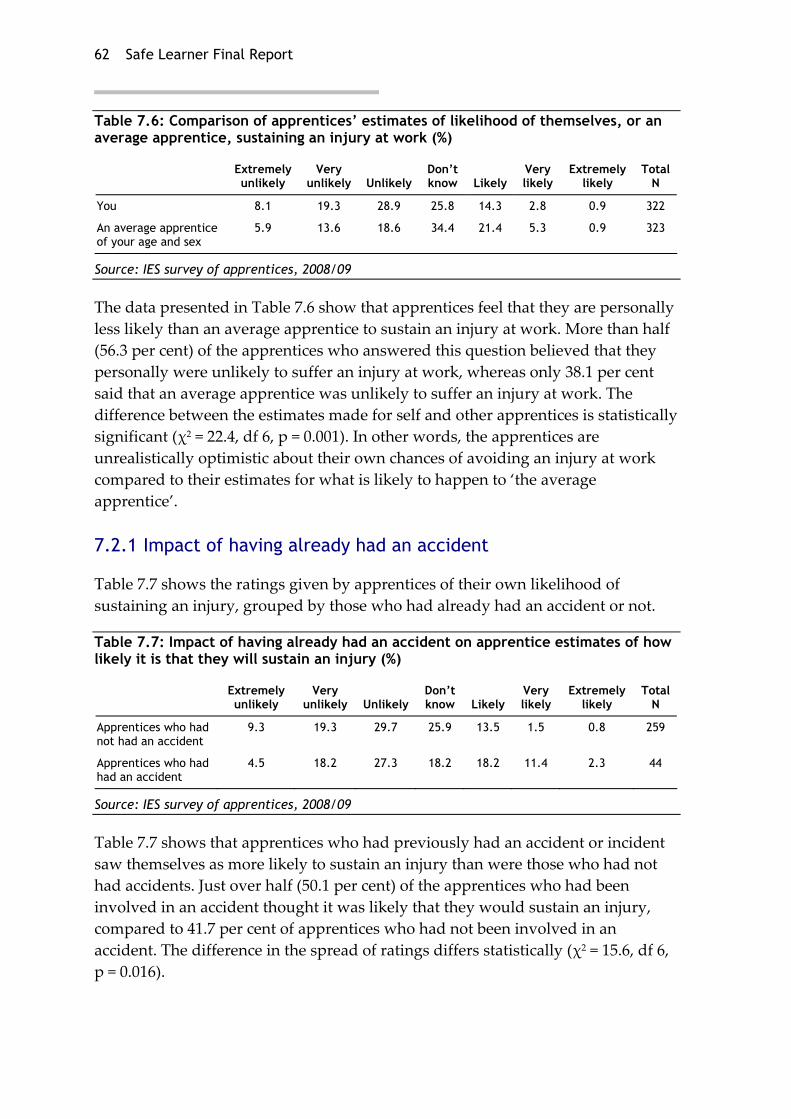
62 Safe Learner Final Report
Table 7.6: Comparison of apprentices’ estimates of likelihood of themselves, or an average apprentice, sustaining an injury at work (%)
Extremely unlikely
Very unlikely Unlikely
Don’t know Likely
Very likely
Extremely likely
Total N
You 8.1 19.3 28.9 25.8 14.3 2.8 0.9 322
An average apprentice of your age and sex
5.9 13.6 18.6 34.4 21.4 5.3 0.9 323
Source: IES survey of apprentices, 2008/09
The data presented in Table 7.6 show that apprentices feel that they are personally less likely than an average apprentice to sustain an injury at work. More than half (56.3 per cent) of the apprentices who answered this question believed that they personally were unlikely to suffer an injury at work, whereas only 38.1 per cent said that an average apprentice was unlikely to suffer an injury at work. The difference between the estimates made for self and other apprentices is statistically significant (χ2 = 22.4, df 6, p = 0.001). In other words, the apprentices are unrealistically optimistic about their own chances of avoiding an injury at work compared to their estimates for what is likely to happen to ‘the average apprentice’.
7.2.1 Impact of having already had an accident
Table 7.7 shows the ratings given by apprentices of their own likelihood of sustaining an injury, grouped by those who had already had an accident or not.
Table 7.7: Impact of having already had an accident on apprentice estimates of how likely it is that they will sustain an injury (%)
Extremely unlikely
Very unlikely Unlikely
Don’t know Likely
Very likely
Extremely likely
Total N
Apprentices who had not had an accident
9.3 19.3 29.7 25.9 13.5 1.5 0.8 259
Apprentices who had had an accident
4.5 18.2 27.3 18.2 18.2 11.4 2.3 44
Source: IES survey of apprentices, 2008/09
Table 7.7 shows that apprentices who had previously had an accident or incident saw themselves as more likely to sustain an injury than were those who had not had accidents. Just over half (50.1 per cent) of the apprentices who had been involved in an accident thought it was likely that they would sustain an injury, compared to 41.7 per cent of apprentices who had not been involved in an accident. The difference in the spread of ratings differs statistically (χ2 = 15.6, df 6, p = 0.016).

Institute for Employment Studies 63
Table 7.8 shows the impact of having had an accident on apprentices’ estimates of how likely an average apprentice is to sustain an injury.
Table 7.8: Impact of having already had an accident on apprentice estimates of how likely it is that an average apprentice will sustain an injury (%)
Extremely unlikely
Very unlikely Unlikely
Don’t know Likely
Very likely
Extremely likely
Total N
Apprentices who had not had an accident
6.6 14.7 18.1 36.3 19.7 3.9 0.8 259
Apprentices who had had an accident
4.4 8.9 20.0 22.2 26.7 15.6 2.2 45
Source: IES survey of apprentices, 2008/09
Only 24.4 per cent of apprentices who had not been involved in an accident or incident at work believed that an average apprentice would be likely to sustain an injury at work compared to 44.5 per cent of those who had been involved in an accident or incident. The difference between the two distributions of assessments is statistically significant (χ2 = 14.587, df 6, p = .024).
7.2.2 Impact of colleague accidents
Next we examined the impact of having a colleague who had had an accident or incident on the apprentices’ ratings of the likelihood of themselves, and of an average apprentice, sustaining an injury at work. Tables 7.9 and 7.10 set out these data.
Table 7.9: Impact of having witnessed a colleague having an accident upon the assessments made by apprentices on their own likelihood of sustaining an injury (%)
Extremely unlikely
Very unlikely Unlikely
Don’t know Likely
Very likely
Extremely likely
Total N
Apprentices who had not seen an accident 9.5 19.9 32.0 24.7 11.3 1.7 .9 231
Apprentices who had seen an accident 5.6 16.7 22.2 26.4 23.6 5.6 .0 72
Source: IES survey of apprentices, 2008/09
The data displayed in Table 7.9 indicate that having a colleague who has had an accident has an impact on apprentices’ estimates of their likelihood of suffering an injury at work. Over half (55.6 per cent) of those whose colleagues had had an accident thought it was likely that they would suffer an injury, while just over a third (37.7 per cent) of those who had not witnessed an accident thought this was likely. The two distributions differ significantly from each other (χ2 = 12.72, , df 6, p = .048).
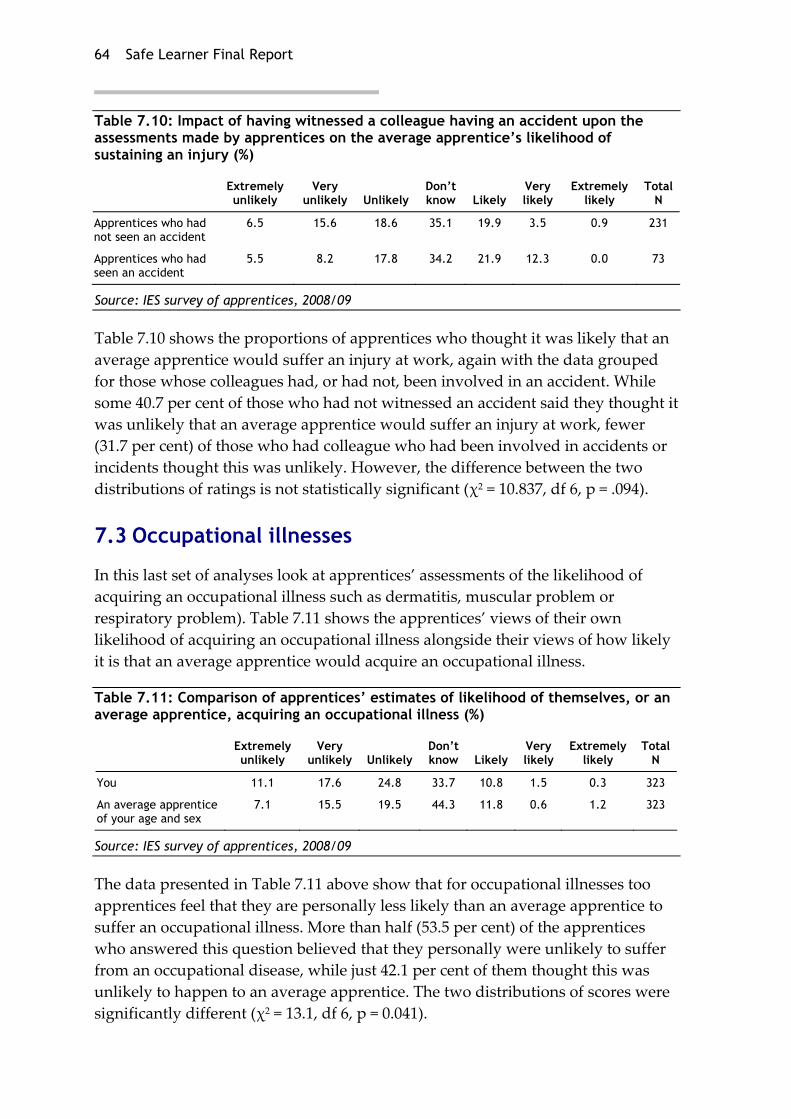
64 Safe Learner Final Report
Table 7.10: Impact of having witnessed a colleague having an accident upon the assessments made by apprentices on the average apprentice’s likelihood of sustaining an injury (%)
Extremely unlikely
Very unlikely Unlikely
Don’t know Likely
Very likely
Extremely likely
Total N
Apprentices who had not seen an accident
6.5 15.6 18.6 35.1 19.9 3.5 0.9 231
Apprentices who had seen an accident
5.5 8.2 17.8 34.2 21.9 12.3 0.0 73
Source: IES survey of apprentices, 2008/09
Table 7.10 shows the proportions of apprentices who thought it was likely that an average apprentice would suffer an injury at work, again with the data grouped for those whose colleagues had, or had not, been involved in an accident. While some 40.7 per cent of those who had not witnessed an accident said they thought it was unlikely that an average apprentice would suffer an injury at work, fewer (31.7 per cent) of those who had colleague who had been involved in accidents or incidents thought this was unlikely. However, the difference between the two distributions of ratings is not statistically significant (χ2 = 10.837, df 6, p = .094).
7.3 Occupational illnesses
In this last set of analyses look at apprentices’ assessments of the likelihood of acquiring an occupational illness such as dermatitis, muscular problem or respiratory problem). Table 7.11 shows the apprentices’ views of their own likelihood of acquiring an occupational illness alongside their views of how likely it is that an average apprentice would acquire an occupational illness.
Table 7.11: Comparison of apprentices’ estimates of likelihood of themselves, or an average apprentice, acquiring an occupational illness (%)
Extremely unlikely
Very unlikely Unlikely
Don’t know Likely
Very likely
Extremely likely
Total N
You 11.1 17.6 24.8 33.7 10.8 1.5 0.3 323
An average apprentice of your age and sex
7.1 15.5 19.5 44.3 11.8 0.6 1.2 323
Source: IES survey of apprentices, 2008/09
The data presented in Table 7.11 above show that for occupational illnesses too apprentices feel that they are personally less likely than an average apprentice to suffer an occupational illness. More than half (53.5 per cent) of the apprentices who answered this question believed that they personally were unlikely to suffer from an occupational disease, while just 42.1 per cent of them thought this was unlikely to happen to an average apprentice. The two distributions of scores were significantly different (χ2 = 13.1, df 6, p = 0.041).

Institute for Employment Studies 65
7.3.1 Impact of having already had an accident
Table 7.12 shows the ratings for likelihood that they themselves would suffer from an occupational illness with the apprentices grouped according to whether or not they have had an accident or incident at work.
Table 7.12: Impact of having already had an accident on apprentice estimates of how likely it is that they will acquire an occupational illness (%)
Extremely unlikely
Very unlikely Unlikely
Don’t know Likely
Very likely
Extremely likely
Total N
Apprentices who had not had an accident
12.0 17.4 22.4 35.9 10.8 1.2 0.4 258
Apprentices who had had an accident
8.9 17.8 37.8 20.0 11.1 4.4 0.0 45
Source: IES survey of apprentices, 2008/09
The data in Table 7.12 reveal that, even for this measure, there appears to be some impact of previous exposure to some sort of incident or accident at work. While 64.5 per cent of those apprentices who had previously not had an accident or incident said it was unlikely that they themselves would suffer from an occupational injury, this reduced to 51.8 per cent amongst those who previously had been involved in an accident or incident. However, the difference between the two groups was not statistically significant (χ2 = 9.58, df 6, p = n.s).
Table 7.13 shows the impact of having had an accident or incident on apprentices’ estimates of how likely an average apprentice is to suffer from an occupational illness.
Table 7.13: Impact of having already had an accident on apprentice estimates of how likely it is that an average apprentice will suffer an occupational illness (%)
Extremely unlikely
Very unlikely Unlikely
Don’t know Likely
Very likely
Extremely likely
Total N
Apprentices who had not had an accident
8.1 15.4 17.8 46.3 11.6 .4 .4 259
Apprentices who had had an accident
4.4 11.1 33.3 31.1 11.1 2.2 6.7 45
Source: IES survey of apprentices, 2008/09
While 12.4 per cent of apprentices who had not been involved in an accident or incident at work believed that an average apprentice would be likely to suffer from an occupational illness this rose to 20.0 per cent of those who had previously been involved in an accident or incident. The distribution of estimates made by the two groups differ significantly from each other (χ2 = 21.281, df 1.6, p = .002).
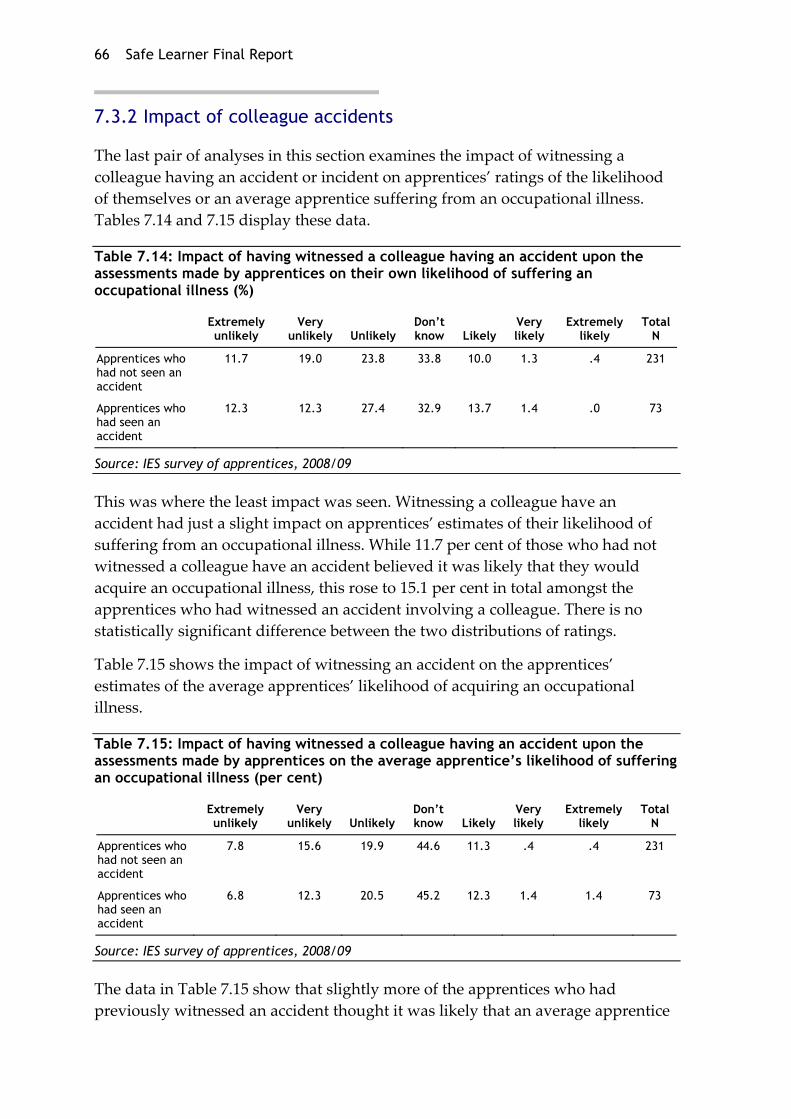
66 Safe Learner Final Report
7.3.2 Impact of colleague accidents
The last pair of analyses in this section examines the impact of witnessing a colleague having an accident or incident on apprentices’ ratings of the likelihood of themselves or an average apprentice suffering from an occupational illness. Tables 7.14 and 7.15 display these data.
Table 7.14: Impact of having witnessed a colleague having an accident upon the assessments made by apprentices on their own likelihood of suffering an occupational illness (%)
Extremely unlikely
Very unlikely Unlikely
Don’t know Likely
Very likely
Extremely likely
Total N
Apprentices who had not seen an accident
11.7 19.0 23.8 33.8 10.0 1.3 .4 231
Apprentices who had seen an accident
12.3 12.3 27.4 32.9 13.7 1.4 .0 73
Source: IES survey of apprentices, 2008/09
This was where the least impact was seen. Witnessing a colleague have an accident had just a slight impact on apprentices’ estimates of their likelihood of suffering from an occupational illness. While 11.7 per cent of those who had not witnessed a colleague have an accident believed it was likely that they would acquire an occupational illness, this rose to 15.1 per cent in total amongst the apprentices who had witnessed an accident involving a colleague. There is no statistically significant difference between the two distributions of ratings.
Table 7.15 shows the impact of witnessing an accident on the apprentices’ estimates of the average apprentices’ likelihood of acquiring an occupational illness.
Table 7.15: Impact of having witnessed a colleague having an accident upon the assessments made by apprentices on the average apprentice’s likelihood of suffering an occupational illness (per cent)
Extremely unlikely
Very unlikely Unlikely
Don’t know Likely
Very likely
Extremely likely
Total N
Apprentices who had not seen an accident
7.8 15.6 19.9 44.6 11.3 .4 .4 231
Apprentices who had seen an accident
6.8 12.3 20.5 45.2 12.3 1.4 1.4 73
Source: IES survey of apprentices, 2008/09
The data in Table 7.15 show that slightly more of the apprentices who had previously witnessed an accident thought it was likely that an average apprentice
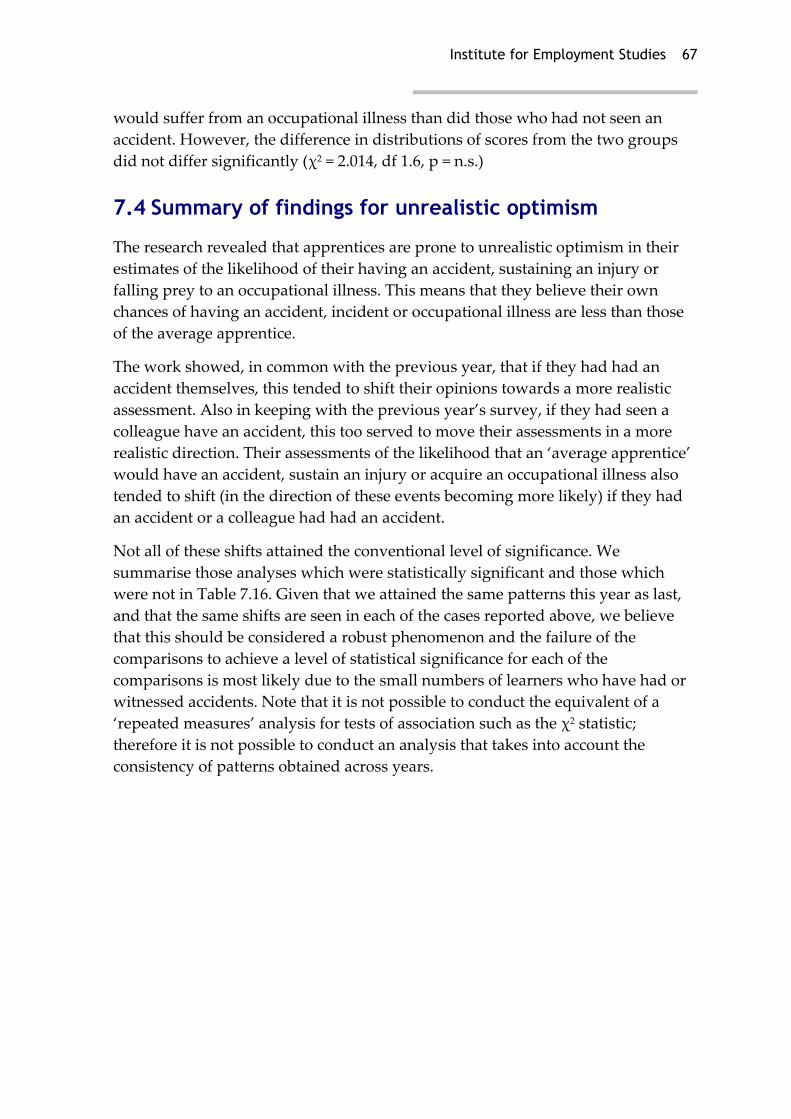
Institute for Employment Studies 67
would suffer from an occupational illness than did those who had not seen an accident. However, the difference in distributions of scores from the two groups did not differ significantly (χ2 = 2.014, df 1.6, p = n.s.)
7.4 Summary of findings for unrealistic optimism
The research revealed that apprentices are prone to unrealistic optimism in their estimates of the likelihood of their having an accident, sustaining an injury or falling prey to an occupational illness. This means that they believe their own chances of having an accident, incident or occupational illness are less than those of the average apprentice.
The work showed, in common with the previous year, that if they had had an accident themselves, this tended to shift their opinions towards a more realistic assessment. Also in keeping with the previous year’s survey, if they had seen a colleague have an accident, this too served to move their assessments in a more realistic direction. Their assessments of the likelihood that an ‘average apprentice’ would have an accident, sustain an injury or acquire an occupational illness also tended to shift (in the direction of these events becoming more likely) if they had an accident or a colleague had had an accident.
Not all of these shifts attained the conventional level of significance. We summarise those analyses which were statistically significant and those which were not in Table 7.16. Given that we attained the same patterns this year as last, and that the same shifts are seen in each of the cases reported above, we believe that this should be considered a robust phenomenon and the failure of the comparisons to achieve a level of statistical significance for each of the comparisons is most likely due to the small numbers of learners who have had or witnessed accidents. Note that it is not possible to conduct the equivalent of a ‘repeated measures’ analysis for tests of association such as the χ2 statistic; therefore it is not possible to conduct an analysis that takes into account the consistency of patterns obtained across years.

68 Safe Learner Final Report
Table 7.16: Summary of analyses for 2008/09 data, impact on unrealistic optimism
Comparison of: Statistically significant?
Own with average apprentice’s chances of having an accident yes
Own with average apprentice’s chances of sustaining an injury yes
Own with average apprentice’s chances of succumbing to occupational illness
yes
Own chances of having an accident, for apprentices who had/had not had an accident
no
Own chances of sustaining an injury, for apprentices who had/had not had an accident
yes
Own chances of succumbing to occupational illness, for apprentices who had/had not had an accident
no
Own chances of having an accident, for apprentices who had/had not seen colleague have an accident
no
Own chances of sustaining an injury, for apprentices who had/had not seen colleague have an accident
yes
Own chances of succumbing to occupational illness, for apprentices who had/had not seen colleague have an accident
no
‘Average apprentice’s’ chances of having an accident, for apprentices who had/had not had an accident
no
‘Average apprentice’s’ chances of sustaining an injury, for apprentices who had/had not had an accident
yes
‘Average apprentice’s’ chances of succumbing to occupational illness, for apprentices who had/had not had an accident
yes
‘Average apprentice’s’ chances of having an accident, for apprentices who had/had not seen colleague have an accident
no
‘Average apprentice’s’ chances of sustaining an injury, for apprentices who had/had not seen colleague have an accident
no
‘Average apprentice’s’ chances of succumbing to occupational illness, for apprentices who had/had not seen colleague have an accident
no
Source: IES survey of apprentices, 2008/09

Institute for Employment Studies 69
8 Modelling the interactions
The previous chapters of this report have shown that there are important statistical relationships between a wide range of personal and institutional factors and the likelihood of accidents. However, in order to generate effective policies it would be helpful to get an overall picture of the significant drivers and linkages between the various variables available. To enable us to do this, we used Structural Equation Modelling.
8.1 Structural Equation Modelling
Structural Equation Modelling (SEM) is one of the few statistical techniques, apart from longitudinal analysis, that can demonstrate causal relationships. Structural Equation Modelling is a very generalised modelling technique. Although the mathematics involved are very complex, basically the approach compares the variances and co‐variances of the data with that which would be predicted if the model with its inter‐relationships were correct. Therefore, technically SEM can only be used to confirm a hypothesised model and in theory more than one model could equally well explain the data. Therefore, some people argue that if the data does not initially fit the model then the process should be abandoned. However, it is increasingly recognised that SEM can be used in an exploratory manner. Indeed this was the case here: two hypothetical models were developed and tested.
It should be noted that, although the number of participants (‘cases’) was large by normal research standards, in the context of what is required for this modelling process, the number of cases available for analysis was small. For the first of the models tested, the number of cases was 431; for the second model the number of cases was even smaller, just 114. With these small numbers of cases this meant that the modelling processes were at the limits of what is possible with SEM.

70 Safe Learner Final Report
8.2 The models
Two hypothetical models were constructed using two different datasets. The first model described is based on 431 responses by first year learners, compiled from responses given by first year learners in 2007/08 and 2008/09. This model, largely due to the greater number of cases, produced the more statistically significant results and a better overall ‘fit’. The second model was based on just 114 cases; these came from the dataset for learners who had responded to both waves of the survey (2007/08 and 2008/09), were new learners in 2007/08 and had not changed employer between the survey years. Although this model did not achieve such statistically significant outcomes as the first year learner model it allowed some elaboration of the first model. The bulk of the description that follows is based on the data model for first year learners.
8.3 The underlying data and constructs
The modelling used the following variables and two constructs:
■ Individual safety climate perception – this is a measure of the learners’ safety climate and is based on Salminen and Seppala (2005).
■ Role overload – this is a measure of the extent to which the learners felt that they were under excessive pressure and suffering from role overload. This was found to co‐vary with Individual safety climate and to and extent the two variables are measuring the same underlying factor.
■ Group safety climate – this is a measure based on Zohar (2000) which measures the general safety climate.
■ Supervisor discusses H&S issues – the extent to which the supervisor discusses health and safety issues with the learner.
■ Supervisor absent – the extent to which the supervisor was absent from the learner environment as this was also linked to discussion of H&S issues by the supervisor we co‐varied these two variables. Essentially, a good supervisor was likely to discuss issues and remain with the learner more often.
■ Conscientiousness – this is a measure of the attention the learner pays and is based on the Saucier (1994) mini‐markers scale.
■ Cognitive failure – this is a measure of the extent to which the learner reports not concentrating on the task at hand (Wallace and Chen, 2005).
■ Work habits – this is a sub‐scale of the Hofmann and Stetzer (1996) scale. It measures poor work habits, such as not returning tools to their correct locations.
Institute for Employment Studies 71
■ Age – this variable was only used in the second model, however, it was found to have a significant influence on the behaviour of the learners and their work habits.
■ How much SL information relevant – this measured the extent to which the learners felt that the safe learner information that they had received was relevant to their workplace.
■ Feel able to apply SL information – the extent to which the learners felt able to apply the safe learner information they had received in their particular work environment.
■ Colleague incidents – whether the learner had witnessed a colleague having an accident or other health and safety incident.
■ Learner environment – this is a construct which allows many of the factors within the learners’ environment to be collected together into one variable.
■ Learner behaviour – this is another construct which allows factors more individual to the learner and their behaviour to be collected together. Using the two constructs allows the relative influence of the individual and their environment, as measured by the linked variables, to be teased out.
8.4 First years’ model
The First Years’ model is based on individuals who were in their first year either in the first or second survey. This gives us a sample of 431 new entrants to the training system. Each linkage in the model is significant at above the five per cent level and with the majority at above the one per cent level.
This model is illustrated graphically in Figure 8.2. Double headed curved links represent a covariance while single headed arrows, with associated values, represent linkages between the variables. Rectangular boxes represent input data and the ellipsoid boxes represent constructs.

72 Safe Learner Final Report
Figure 8.1: The first years’ model
Able to apply SL information
How much SL info. relevant Cognitive failure Work habits
Supervisor discusses
Group safety climate
Supervisor absence
Conscientious-ness
Organisational safety climate
Role overload
Safety incidents
Learner environment
Learner behaviour
Colleague incidents
0.62
0.70
0.220.000.18
-0.19
0.31
-0.18
0.49
-0.34
-0.25
0.02
0.31
-0.06
Source: Model produced using AMOS software package and first year data from IES survey data 2007/08 and 2007/09
8.4.1 First years model fit
Each linkage in the model was significant at the five per cent level with the majority of the linkages significant at the one per cent level. However, in addition to the significance of each linkage it is also necessary to measure how the data fits to overall model. The standard test of how well a structural equation model fits the data is the Chi Squared test. The model does not have a good level of fit by conventional standards (χ2= 167.5 df 1,52 p = <0.001; a significant outcome indicates poor goodness of fit). However, as the model was unidentified1 and had relatively few cases for the number of variables within the model alternative measures of goodness of fit should also be examined.
The two main alternative measures that are often used are:
■ the comparative fit index (CFI) where values close to one indicate a very good fit, and
■ the root mean square error of approximation (RMSEA) where values of about 0.06 of less indicate a close fit (Hu and Bentler, 1999).
1 This is a technical term relating to SEM and means that there were fewer constraints than variables and has implications for achieving goodness of fit

Institute for Employment Studies 73
The model produces a CFI of 0.672 and a RMSEA of 0.072. Technically these both indicate a poor fit. However, given the small numbers of cases these figures may be considered acceptable. Importantly, all the component interactions were significant and the overall the central constructs of ‘learner environment’ and ‘learner behaviour’ are shown to be strong drivers of whether or not an incident occurs. We describe the emerging pattern of drivers identified by this model next.
8.4.2 Drivers of safety incidents in first year model
Table 8.1 provides standardised estimates of the extent to which each of the variables in the model interact.
Table 8.1: Relative impact of various measures on learner health and safety incidents
Driven by Standardised
estimate
Had a H&S incident Learner environment 0.701
Learner environment Witnessed a colleague having an accident or other H&S incident
0.621
Learner behaviour Supervisor absence 0.491
Had a H&S incident Learner behaviour 0.318
Group safety climate Individual safety climate 0.311
Learner environment How much safe learner information it was possible to apply
0.219
Learner behaviour Cognitive failure 0.021
Learner environment Group safety climate 0.000
Learner behaviour Work habits -0.061
How much SL information can be applied
Supervisor absence -0.175
Learner environment How easy it was to apply the SL information
-0.176
How easy it was to apply the SL information
Supervisor discusses H&S issues with the learner
-0.189
Cognitive failure Conscientiousness -0.246
Conscientiousness Role overload -0.335
Source: First year structural equation model
This indicated that a standardised increase in learner environmental pressures led to a 0.7 (or 70 per cent) increase in the likelihood of the learner having an accident or other health and safety incident. Similarly a standardised increase in negative learner behaviour led to a 0.3 (or 30 per cent) increase in the likelihood of a health and safety incident. This suggests that the environment is twice as likely to drive incidents as individual behaviour. This in turn suggests that the learners’

74 Safe Learner Final Report
environment is a more fruitful area to make interventions if the aim is to reduce the exposure of learners to health and safety incidents. The fact that the influence of Learner environment and Learner behaviour sums to more than one, indicates that between them these two factors more than explain whether or not the learner experiences an accident. The fact that it is slightly over one reflects the fact that one variable (supervisor absence) drives both the Learner’s environment and the Learner’s behaviour.
This makes the relative drivers of a negative learner environment of greater interest in policy terms. Here whether or not the learner has witnessed a colleague having an accident stands out as the most important driver of a poor learner environment. Witnessing a colleagues incident causes a 0.6 (or 60 per cent) change in the ‘learner environment’ construct which in turn drives an increase in likelihood of the learner being involved in an incident. This is perhaps to be expected: a colleague having an accident is likely to indicate an unsafe work environment, and in an unsafe work environment apprentices are more likely to have an incident. Given the importance of colleagues having an incident in predicting subsequent apprentice incidents, this suggests that group discussions following an incident might assist with driving home health and safety messages.
The other drivers of a poor learner environment were:
■ The perceived ability to apply safe‐learner information – which had a negative influence on poor Learner environment, ie the more information that could be applied the better the learner environment. In this case a standardised increase in the ability to apply the information led to a 0.18 (or 18 per cent) improvement in the Learner environment. This was also driven by individual safety climate which in turn via Role overload, Conscientiousness and Cognitive failure also drove poor Learner behaviour.
■ The amount of Safe‐learner information that was relevant – had a positive impact on poor Learner environment, ie the more information it was possible to apply the worse the Learner environment. This is essentially a measure of how dangerous the environment was as the more relevant information the worse the environment. This was also driven supervisor absence which in turn also drove poor learner behaviour.
■ Group safety climate had a very small but positive impact on the learner environment. The group safety environment was also driven by individual safety climate.
The main driver of poor learner behaviour was supervisor absence. The more the supervisor was absent from the working environment the worse the behaviour. One standardised increase in absence created a 0.49 (or 49 per cent) increase in poor behaviour.

Institute for Employment Studies 75
The other drivers of poor learner behaviour were:
■ Cognitive failure was weakly, but significantly, linked to poor Learner behaviour – a standardised increase in cognitive failure led to a 0.02 (or a 2 per cent) increase in poor Learner behaviour. Cognitive failure was in turn driven by poor Conscientiousness, with a standardised increase in poor Conscientiousness leading to worsening Cognitive failure by 0.246 (or 25 per cent). Conscientiousness was in turn driven by Role overload, with a 0.335 (or a 33 per cent) rise in poor conscientiousness driven by a standardised increase in Role overload.
■ Work habits had a minor, but significant, influence on Learner behaviour with a standardised increase in poor work habits contributing to a 0.061 (or 6 per cent) increase in poor Learner behaviour.
8.5 Longitudinal model
The longitudinal model is based on only those individuals who were recorded in both surveys and who had not changed employers. As such this is intellectually a purer model. However the significant reduction in the number of cases, down to 114 cases, means that this model is much less robust. Despite this, each linkage in the model remains significant at above the 5 per cent level and with the majority at above the one per cent level. As before this model is illustrated graphically in Figure 8.2.
Figure 8.2: The longitudinal model
Safetyincidents
Colleague incidents
Able to apply SL information
How much SL info. relevant Cognitive failure Age Work habits
Supervisor discusses
Group safety climate
Supervisor absence
Conscientious-ness
Role overloadOrganisational safety climate
Learner environment
Learner behaviour
0.71 -0.30
-0.20
-0.37
-0.25
-0.17
0.220.08
0.05 -0.22
0.73
0.14
-0.32
-0.21
-0.21
0.70
-0.25
Source: Model produced using AMOS software package and repeated measures subset of IES survey data 2007/08 and 2008/09
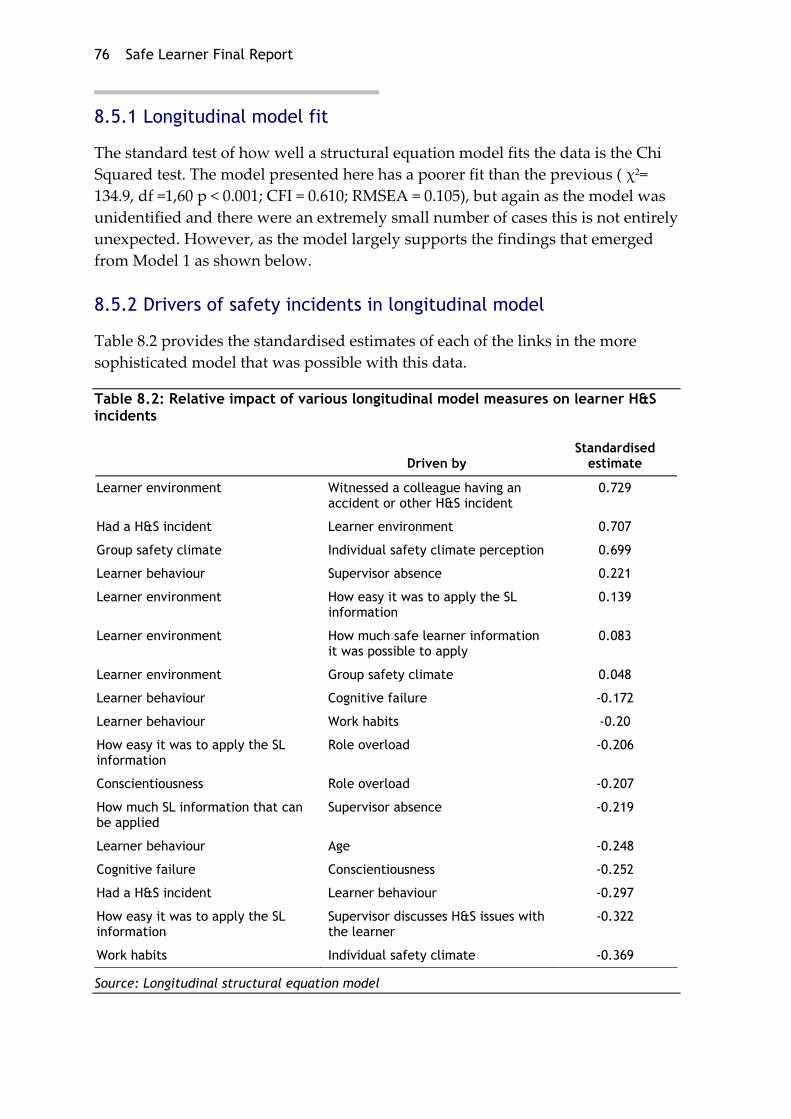
76 Safe Learner Final Report
8.5.1 Longitudinal model fit
The standard test of how well a structural equation model fits the data is the Chi Squared test. The model presented here has a poorer fit than the previous ( χ2= 134.9, df =1,60 p < 0.001; CFI = 0.610; RMSEA = 0.105), but again as the model was unidentified and there were an extremely small number of cases this is not entirely unexpected. However, as the model largely supports the findings that emerged from Model 1 as shown below.
8.5.2 Drivers of safety incidents in longitudinal model
Table 8.2 provides the standardised estimates of each of the links in the more sophisticated model that was possible with this data.
Table 8.2: Relative impact of various longitudinal model measures on learner H&S incidents
Driven by Standardised
estimate
Learner environment Witnessed a colleague having an accident or other H&S incident
0.729
Had a H&S incident Learner environment 0.707
Group safety climate Individual safety climate perception 0.699
Learner behaviour Supervisor absence 0.221
Learner environment How easy it was to apply the SL information
0.139
Learner environment How much safe learner information it was possible to apply
0.083
Learner environment Group safety climate 0.048
Learner behaviour Cognitive failure -0.172
Learner behaviour Work habits -0.20
How easy it was to apply the SL information
Role overload -0.206
Conscientiousness Role overload -0.207
How much SL information that can be applied
Supervisor absence -0.219
Learner behaviour Age -0.248
Cognitive failure Conscientiousness -0.252
Had a H&S incident Learner behaviour -0.297
How easy it was to apply the SL information
Supervisor discusses H&S issues with the learner
-0.322
Work habits Individual safety climate -0.369
Source: Longitudinal structural equation model

Institute for Employment Studies 77
This table shows that a very similar model to that previously described was achieved with this reduced number of cases. Therefore, although the goodness‐of‐fit of this model is less than in the Model 1, the outcomes from modelling across two years of survey data are consistent with, and lend support to, the hypothesised links emerging from Model 1. In addition, within this model it was possible to demonstrate (increasing) age as a driver of good learner behaviour and a link between individual safety climate perception, (rather than organisational safety climate) and work habits.
78 Safe Learner Final Report
9 Discussion and recommendations
Here we consider the findings that have emerged from the different components of the work and the overall recommendations for providers, the LSC and employers.
9.1 From the modelling process
The modelling across two years’ of data revealed that the environment in which the learner works plays a larger part in learner safety than does the learner’s own behaviour and mediates the extent to which learners believe they can apply the health and safety knowledge they acquire. The factor which most strongly predicts whether or not an apprentice will have an accident is whether their colleagues have had an accident. This is one of the factors which define the workplace environment in which the apprentice works. Together, workplace environment accounts for around 70 per cent of the variance in predicting whether an accident will take place or not while individual differences between learners accounts for around 30 per cent of the variance.
Learners believed that the information they received through the Safe Learner Blueprint was broadly relevant, and those who had not had an accident rated the health and safety knowledge as more relevant than those who had had an accident. Whether this is because they believed the knowledge had helped them avoid an accident is unknown. What emerges from the modelling is that the extent to which they believe it is possible to apply that information in the workplace affects their likelihood of having an accident. This suggests that perceptions of relevance may be mediated by the extent to which learners feel able to apply the information. The extent to which learners feel pressurised at work also affects the extent to which they feel able to apply health and safety knowledge, again driving the likelihood of an incident occurring in the workplace.
In other words, where learners are prevented by the safety culture of a workplace from putting their health and safety knowledge into practice, they are more likely
Institute for Employment Studies 79
to have an accident. Those who work in places with a poorer safety culture are more likely to have had a colleague involved in an incident at work. It is unsurprising then that these two factors, along with safety climate at the level of organisation as a whole and work group level, are the main factors contributing overall to workplace environment and contributing to the likelihood of accidents.
Some personality factors within the individual learners appear also to predispose learners to have accidents. Conscientiousness – or a lack of it – was one such factor. The work also allowed us to demonstrate that a single personality factor such as conscientiousness may vary in the way it relates to or predicts other factors within learners which predispose them to accidents.
The analyses revealed that there is:
■ a decline in the initially positive link between conscientiousness and perceived value of the Safe Learner training over time
■ maintenance of the inverse relationship between conscientiousness and cognitive failure over time, and
■ an increase over time in the inverse relationship between conscientiousness and unsafe workplace behaviours.
As might be expected, conscientiousness is inversely related to likelihood of cognitive failure, and the more likely a learner is to suffer from cognitive lapses, the more likely they are to have an accident. There is an increasing likelihood that those who are less conscientious will engage in unsafe behaviours at work, and those who admit to engaging in unsafe behaviours too are also more likely to end up having an accident.
9.2 From the repeated measures analyses
In general, for much of the health and safety information the learners received, the learners’ views of its relevance to their job remained about the same over time; however, for much of the content the views of learners were influenced by their supervisors. Those whose supervisors often discussed health and safety issues with them were more likely to have maintained their initial assessments of the relevance of the health and safety knowledge areas over the year, or increased them, than were those whose supervisors did not discuss these issues with them. The assessments of apprentices whose supervisors did not discuss health and safety issues with them fell significantly. While it must be acknowledged that this was not observed for all of the content areas – significant results were found with a third (seven out of 21) of the Safe Learner content areas – nonetheless we feel that this is an important finding that implicates the role of the workplace
80 Safe Learner Final Report
supervisor in driving the attitudes developed by learners towards health and safety.
9.3 Comparing year one and year two surveys
In general, there do appear to have been slight improvements both in employers’ behaviours – a larger proportion of them appear to give health and safety inductions now than previously – and in the delivery of the Safe Learner content – first year learners in the 2008/09 survey gave higher ratings of its perceived relevance than did the 2007/09 first year cohort.
However, we are cautious in interpreting these findings, for it is possible that the differences in the reports by the two different first year intakes may derive either from the fact that the first year groups had rather different profiles in the two years or from the fact that they are employed by a different set of employers. With this caveat duly noted, the fact that the data indicated higher ratings of the safe learner training from the more recent learner group suggests that the providers may be becoming more effective in delivering the health and safety message year on year. More research would be needed to form more certain conclusions. Similarly, we would hope that the fact that more learners reported receiving a health and safety induction means that more employers are adhering to the law, but again, more research would be required to confirm these tentative findings.
Some of the findings that appeared strongly conclusive in the first year of the research were not supported by the second year analyses. In the first year, the analyses showed a very definite link between supervisory absence and likelihood of having an accident. This was not borne out by the analyses of the 2008/09 data.
We believe there are two main reasons for why the strong link was seen in the first year’s survey but not later on. First, because there were few second and third year apprentices in the first year of the survey, the data for the whole group was analysed together. Although we knew that the first year learners had been recruited since roll‐out of the Safe Learner Blueprint, we did not know whether the apprentices in the second and third years had been through the Safe Learner pilot programme, or, if they had, at what point in their training they had been taught this component. Looking again at the 2007/08 dataset, it is clear that a disproportionate number of the learners who reported having had accidents had been second and third years and were primarily from higher risk occupations. Most of these learners left at the end of 2007/08 and did not participate in the second round of the survey. In the analyses of data from the 2008/09 survey the link between absent supervisors and likelihood of having an accident failed to emerge. There was some indication that this pattern was starting to emerge over time (indicated by analysing the data for first year and continuing learners
Institute for Employment Studies 81
separately), but it was nowhere near as strongly evident as in the previous year’s analyses.
We are forced to conclude that the association between supervisory absence and accidents is currently unproven. However, we believe that this is something that needs to be followed up over a longer time period than was available in this project. It is also possible that provision of good health and safety information early on in their careers may serve to protect the apprentices when their supervisors are absent. We would certainly wish to believe this is the case. It was clear from some of the free response answers the apprentices gave that in some cases apprentices still do not receive any significant health and safety training in work and, were it not for the Safe Learner content, would have very little idea of how to protect themselves. Across both years of the survey their comments revealed that the Safe Learner input had helped them deal with some difficult situations.
Much in line with the finding that the link between absent supervisors and accidents had declined with the departure of a particular group of high‐incident apprentices from a higher‐risk occupation, the range of safety climate ratings contracted, and with this contraction the relationship of safety climate with learner accidents weakened in the second round, while the relationship with colleague incidents fell below the level of statistical significance. We attribute this decline mainly to the fact that a narrower range of assessments of safety climate was obtained in 2008/09, again indicating that a better sub‐group of employers were represented in the second round of the work.
Continuing the research into the second year allowed us to examine the impact of safety climate on learner behaviours, and we found that, particularly in the higher risk occupations, learners in organisations with poorer safety climates develop a stronger propensity to engage in unsafe behaviours over time. In addition, those learners who believe that the health and safety training is more relevant are less likely to engage in unsafe behaviours over time. Therefore this is further evidence of how good workplaces serve to reinforce the health and safety messages coming out from the colleges and training providers while poor workplaces undermine those messages.
9.4 Conclusions and recommendations
Overall, the health and safety messages learners receive from their tutors are well‐received and seen on the whole as relevant and useful, but this is mediated by the safety climate in the employing organisation and in particular by the apprentice’s supervisors. Apprentices whose supervisors do not discuss health and safety
82 Safe Learner Final Report
issues with them are more likely than others to see the training as less relevant over time.
Although it is difficult to form strong conclusions, it appears that the providers are becoming better at delivering the Safe Learner message year on year. This seems an intuitively plausible reason for the significantly increased ratings of relevance this year compared to last. Given that the more qualitative elements of the work suggest that some learners still receive little or no safety training at work, for these learners the Safe Learner training is almost literally a lifeline. It is noteworthy that there appears to be significant demand from learners for further health and safety input in specific work‐relevant areas. In the second year of the survey 72 apprentices identified areas of work for which they would like more information: often‐mentioned topics included asbestos, working at heights and electrical and power tool safety.
The modelling component of this work in particular supported one of the factors identified by LSC research which formed the basis for the Safe Learner framework. Kerrin et al.’s (2002) work identified supervisory behaviour as a key challenge: the current work suggest the same remains true today.
This suggests that future policy initiatives should focus on workplaces and in particular the role of supervisors. We cannot see why it should not be a requirement for supervisors of apprentices to attain qualifications in supervision and health and safety. Where supervisors are involved in assessing staff for NVQs at work they are required to obtain the appropriate assessor units to qualify them for this role; we can see no reason why a similar argument should not be made for supervisors involved in supervising apprentices. Sector Skill Councils could play a role in leading such a development, particularly those representing workers in the higher risk sectors.
The work leads us to make the following recommendations:
Learners are more likely to apply information they see as relevant – the more tailored and occupation‐ or sector‐specific a provider can make the information, the better. There appears to be significant demand from learners for further health and safety input in specific work‐relevant areas. Providers might wish to consider top‐up or extension training on specific health and safety topics.
At learner review sessions, tutors should regularly discuss supervisory arrangements and pressure of work. We know that providers are often trying to reinforce good health and safety practice against a backdrop of poor organisational safety culture. Advice on how to cope with workplace pressures could be incorporated into the Safe Learner application input. There are links also to the safeguarding agenda. It should be noted that all Skills Funding Agency‐

Institute for Employment Studies 83
funded organisations are required to undertake an assessment to identify if they have any vulnerable learners and to use controls where deemed to have them.
Over time, organisational culture can make young workers less responsive to health and safety issues. Providers might want to consider using a safety climate measure in class as a basis for group discussions or to identify any learners in their group who are likely to need extra support (this would also enable providers to identify the employers who need targeting too). There can be a tendency for complacency to set in over time so providers may wish to ensure that these issues are revisited in an ongoing fashion in order to ensure that learners’ attitudes towards safety culture remain positive.
Providers are well‐placed to emphasise to employers the importance of supervisory support for learners. Providers could advise employers on the link between supervisory absence and increased risk of accidents (to all workers, not just apprentices) and emphasise the fact that taking steps to improve supervisory practices could save them money1.
There may be some commercial benefits for providers arising out of this, too. Providers of apprenticeship programmes may wish to consider offering supervisory training programmes to their client companies.
There is some evidence that witnessing colleagues have accidents leads learners to be more cautious in work. Discussions with learner groups of accidents occurring in the learners’ workplaces would provide learners with vivid, vicarious experience of accidents in situations that are likely to be familiar (and realistic) to them.
There are two main recommendations to the Skills Funding Agency arising from this work. The first is that the Skills Funding Agency makes a review of supervisory arrangements a component of learner progress reviews, alongside a requirement for those arrangements to be logged.
The second is that the Skills Funding Agency recommends that supervisory awards become a requirement for supervisors of apprentices, in much the same way that workplace assessors of NVQs are required to hold assessor awards. While the Skills Funding Agency is moving away from giving mandatory instructions to providers, this could become an aspect of quality requirements.
For employers, forewarned is forearmed. The work strongly suggests that supervisory attitudes directly impact on the safety of workers. Employers will
1 For instance, research by the HSE gives factual information on the real costs of accidents; breaking down the costs to the individual, the employer, and to society (Source: The costs to employers in Britain of workplace injuries and work related ill health in 2005/06)
84 Safe Learner Final Report
save money if they improve supervisory arrangements. Better selection and training of supervisors of apprentices would be money well spent.
While a good safety culture and good training input will help apprentices stay safe, some young people are more likely to have accidents than others. Employers may wish to review their selection procedures to take on board the emerging findings about personality variables linked to risky behaviour – in particular conscientiousness appears to be a useful indicator of predispositions to cognitive failure and engaging in unsafe workplace behaviours. Alternatively, employers may wish to consider providing closer supervision/buddying for young workers identified as possibly constituting a higher risk.

Institute for Employment Studies 85
References
Broadbent, D.E., Cooper, P.F., FitzGerald, P., & Parkes, K.R. (1982). The Cognitive Failures Questionnaire (CFQ) and its correlates. British Journal of Clinical Psychology, 21, 1‐16.
Burke, M.J., Sarpy, S.A., Smith‐Crowe, K., Chan‐Serafin, S., Salvador, R.O., Islam, G. (2005), The Relative Effectiveness of Worker Safety and Health Training Methods, American Journal of Public Health, Vol. 96, No. 2, pp. 315‐324
Cammann, C., Fichman, M., Jenkins, G.D., Klesh, J. (1983), ‘Michigan Organization Assessment Questionnaire’. In Seashore, S.E., Lawler, E.E., Mirvis, P.H. and Cammann, C. (Eds) Assessing organisational change: a guide to methods, measures and practices (pp 71‐138)
Cox, S., Cheyne, A. (2000), ‘Assessing safety culture in offshore environments’, Safety Science, Vol. 34, pp. 111‐129
Cox, S., Cox, T. (1991), ‘The structure of employee attitudes to safety: an European example’, Work and Stress, Vol. 5, No. 2, pp. 189‐201
Hofmann, D. A., Jacobs, R., & Landy, F. (1995). High reliability process industries: Individual, micro and macro organizational influences on safety performance. Journal of Safety Research, 26, pp. 131‐149.
Hofmann, D.A., Stetzer, A. (1996), ‘A cross‐level investigation of factors influencing unsafe behaviors and accidents’. Personnel Psychology 49, pp. 307–39.
HSE (2005) HSE ‘Ready Reckoner’ http://www.hse.gov.uk/costs/costs_overview/costs_overview.asp
Hu L, Bentler P.M. (1999), Cutoff criteria for fit indexes in covariance structure analysis: Conventional criteria versus new alternatives, Structural Equation Modelling, Vol. 6, No. 1, pp. 1‐55

86 Safe Learner Final Report
Hubert, D.J., Ullrich, D.R., Murphy, T.H., Lindner, J.R. (2001), ‘Texas Entry‐year Agricultural Teachers’ Perceptions, Practices, and Preparation Regarding Safety and Health in Agricultural Education’, Journal of Agricultural Safety and Health, Vol. 7, No. 3, pp. 143‐154
Jenner, E. A. (2005) ‘Healthcare professionals’ hand hygiene: predicting and improving practice’. Unpublished PhD thesis, University of Hertfordshire.
Kanfer, R., Ackerman, P.L., Murtha, T.C., Dugdale, B., Nelson, L. (1994), ‘Goal setting, conditions of practice and task performance: a resource allocation perspective’, Journal of Applied Psychology, Vol. 79, pp. 826‐835
Kerrin, M., Silverman, M. and Thomson L. (2002) The ʹSafe Learnerʹ: Exploring the Concept. Report to the LSC
Kirkpatrick, D. (1994) Evaluating Training Programs. San Francisco: Berrett‐Koehler Publishers Inc
Lee, T., Harrison, K. (2000), ‘Assessing safety culture in nuclear power stations’, Safety Science, 34, 61‐97
Lingard, H. (2002), ‘The effect of first aid training on Australian construction workers’ occupational health and safety motivation and risk control behaviour’, Journal of Safety Research, Vol. 33, pp. 209‐230
Miller L, Ballard J, Suff P, Bates P, Hurstfield J, Akroyd K (2005). Review of the Reporting of Accidents and Incidents Involving Learners. Report 426, Institute for Employment Studies
Miller, L. and Hunt, W (2006) Evaluation of the Safe Learner Pilot. IES Report 432. http://www.employment‐studies.co.uk/pdflibrary/432.pdf
Miller, L. and Jagger, N. (2008) The Safe Learner: The impact of individual differences and workplace environment on attitudes to health and safety training, an Interim Report to the LSC. Report 456, Brighton: Institute for Employment Studies.
O’Toole, M. (2002), ‘The relationship between employees’ perceptions of safety and organizational culture’. Journal of Safety Research, Vol. 33, pp. 231‐243
Pidgeon, N. (1991), ‘Safety culture and risk management in organisations’, Journal of Cross‐cultural Psychology, Vol. 22 No. 1, pp. 129‐140
Robertson, L.S. (1977), Car crashes: perceived vulnerability and willingness to pay for crash protection. J Community Health. 3(2), pp 136‐141
Saucier, G. (1994), ‘Mini‐markers: a brief version of Goldberg’s unipolar big‐five markers’, Journal of Personality Assessment , Vol. 63, pp. 506‐516
Institute for Employment Studies 87
Salminen, S. and Seppala, A. (2005) ‘Safety climate in Finnish‐ and Swedish‐speaking companies’ International Journal of Occupational Safety and Ergonomics, Vol. 11, No. 4, PP. 389–397
Wallace, J.C. (2004), A multilevel examination of occupational safety: regulatory focus as an explanatory link between climate, conscientiousness and performance. Unpublished PhD thesis: Georgia Institute of Technology
Wallace, J.C., Chen, G. (2005), ‘Development and validation of a work‐specific measure of cognitive failure: Implications for occupational safety’, Journal of Occupational and Organizational Psychology, Vol. 78, No. 4, pp. 615‐632
Wallace, J.C., Vodanovich, S.J. (2003a), ‘Workplace safety performance: Conscientiousness, cognitive failure, and their interaction’. Journal of Occupational Health Psychology, 8, 316‐327
Wallace, J.C., Vodanovich, S.J. (2003b), ‘Can accidents and industrial mishaps be predicted? Further investigation into the relationship between cognitive failure and reports of accidents’. Journal of Business and Psychology, Vol. 17, 503‐514
Wallace, J. C., Vodanovich, S. J., Restino, R. (2003), ‘Predicting cognitive failures from boredom proneness and daytime sleepiness scores: An investigation within military and undergraduate samples’. Personality and Individual Differences, 34, 635‐644
Weinstein, N. (1980), ‘Unrealistic optimism about future events’. Journal of Personality and Social Psychology, 39, pp 806‐820
Williams, T.C., Zahed, H. (1996), ‘Computer‐based training versus traditional lecture: Effect on learning and retention’, Journal of Business and Psychology, Vol. 11, No. 2, pp. 297‐310
Zohar, D. (2000). ‘A group‐level model of safety climate: Testing the effect of group climate on microaccidents in manufacturing jobs’. Journal of Applied Psychology, 85, 587‐596
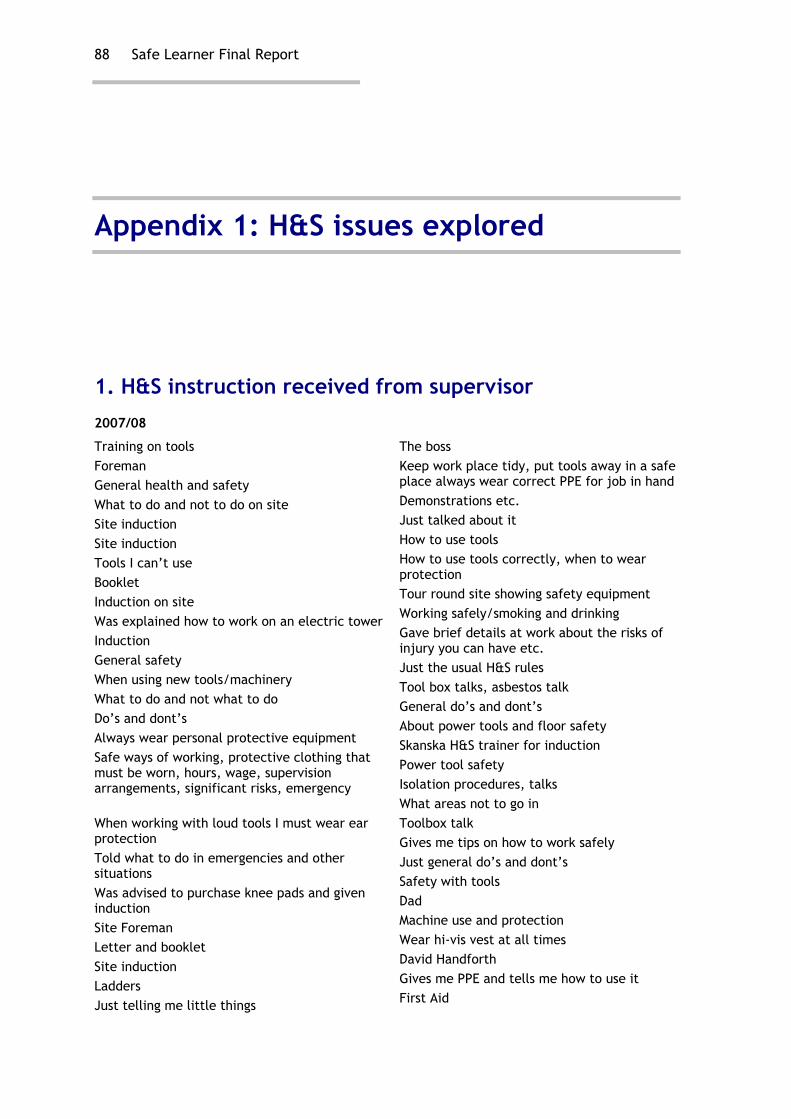
88 Safe Learner Final Report
Appendix 1: H&S issues explored
1. H&S instruction received from supervisor
2007/08
Training on tools Foreman General health and safety What to do and not to do on site Site induction Site induction Tools I can’t use Booklet Induction on site Was explained how to work on an electric tower Induction General safety When using new tools/machinery What to do and not what to do Do’s and dont’s Always wear personal protective equipment Safe ways of working, protective clothing that must be worn, hours, wage, supervision arrangements, significant risks, emergency When working with loud tools I must wear ear protection Told what to do in emergencies and other situations Was advised to purchase knee pads and given induction Site Foreman Letter and booklet Site induction Ladders Just telling me little things
The boss Keep work place tidy, put tools away in a safe place always wear correct PPE for job in hand Demonstrations etc. Just talked about it How to use tools How to use tools correctly, when to wear protection Tour round site showing safety equipment Working safely/smoking and drinking Gave brief details at work about the risks of injury you can have etc. Just the usual H&S rules Tool box talks, asbestos talk General do’s and dont’s About power tools and floor safety Skanska H&S trainer for induction Power tool safety Isolation procedures, talks What areas not to go in Toolbox talk Gives me tips on how to work safely Just general do’s and dont’s Safety with tools Dad Machine use and protection Wear hi-vis vest at all times David Handforth Gives me PPE and tells me how to use it First Aid
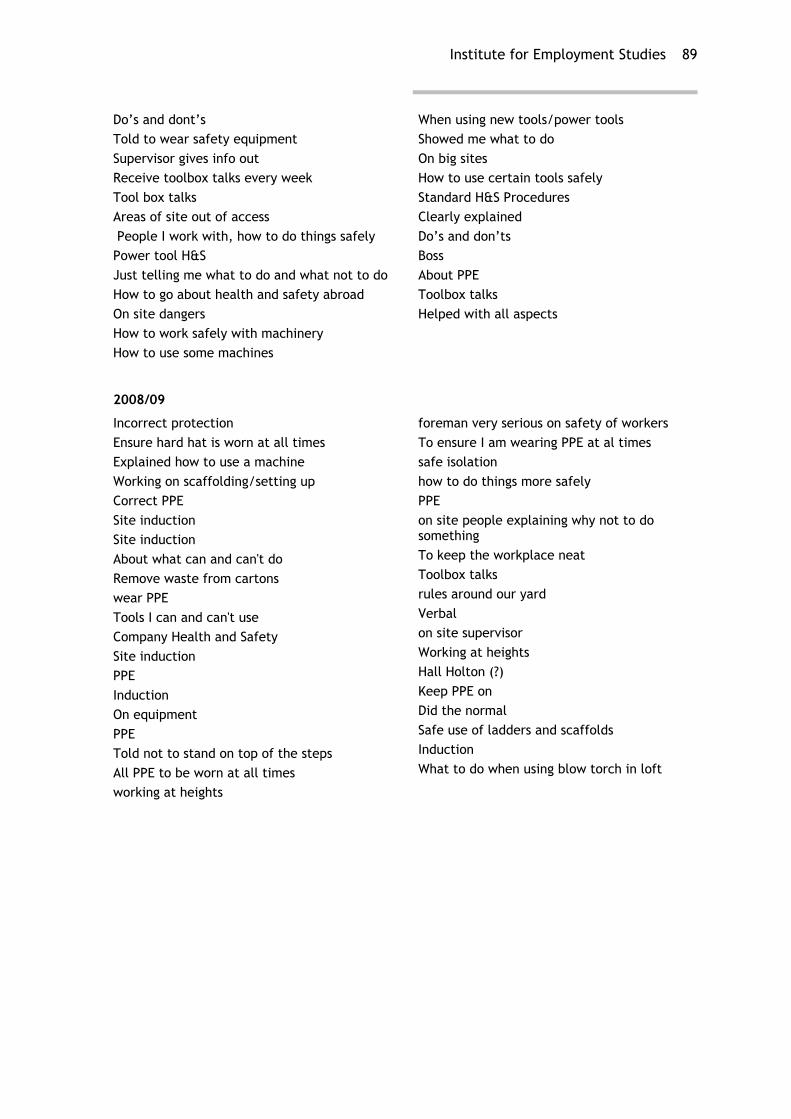
Institute for Employment Studies 89
Do’s and dont’s Told to wear safety equipment Supervisor gives info out Receive toolbox talks every week Tool box talks Areas of site out of access People I work with, how to do things safely Power tool H&S Just telling me what to do and what not to do How to go about health and safety abroad On site dangers How to work safely with machinery How to use some machines
When using new tools/power tools Showed me what to do On big sites How to use certain tools safely Standard H&S Procedures Clearly explained Do’s and don’ts Boss About PPE Toolbox talks Helped with all aspects
2008/09
Incorrect protection Ensure hard hat is worn at all times Explained how to use a machine Working on scaffolding/setting up Correct PPE Site induction Site induction About what can and can't do Remove waste from cartons wear PPE Tools I can and can't use Company Health and Safety Site induction PPE Induction On equipment PPE Told not to stand on top of the steps All PPE to be worn at all times working at heights
foreman very serious on safety of workers To ensure I am wearing PPE at al times safe isolation how to do things more safely PPE on site people explaining why not to do something To keep the workplace neat Toolbox talks rules around our yard Verbal on site supervisor Working at heights Hall Holton (?) Keep PPE on Did the normal Safe use of ladders and scaffolds Induction What to do when using blow torch in loft
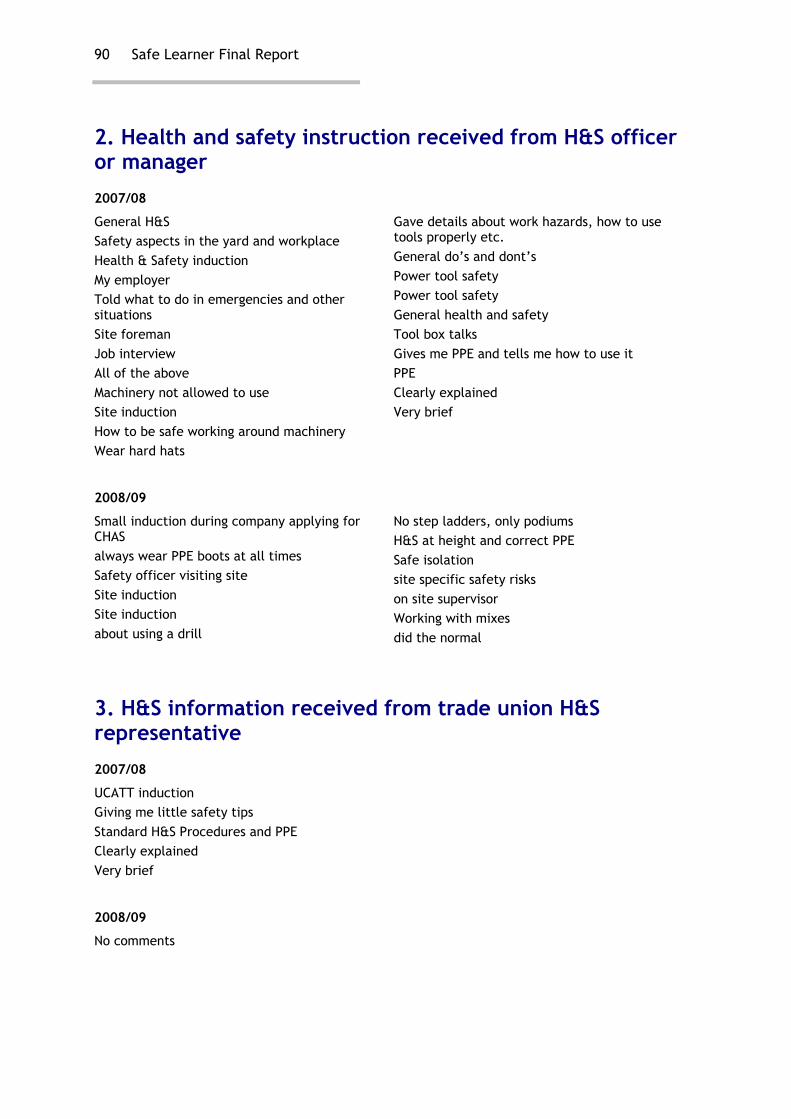
90 Safe Learner Final Report
2. Health and safety instruction received from H&S officer or manager
2007/08
General H&S Safety aspects in the yard and workplace Health & Safety induction My employer Told what to do in emergencies and other situations Site foreman Job interview All of the above Machinery not allowed to use Site induction How to be safe working around machinery Wear hard hats
Gave details about work hazards, how to use tools properly etc. General do’s and dont’s Power tool safety Power tool safety General health and safety Tool box talks Gives me PPE and tells me how to use it PPE Clearly explained Very brief
2008/09
Small induction during company applying for CHAS always wear PPE boots at all times Safety officer visiting site Site induction Site induction about using a drill
No step ladders, only podiums H&S at height and correct PPE Safe isolation site specific safety risks on site supervisor Working with mixes did the normal
3. H&S information received from trade union H&S representative
2007/08
UCATT induction Giving me little safety tips Standard H&S Procedures and PPE Clearly explained Very brief
2008/09
No comments

Institute for Employment Studies 91
4. H&S information received from some other person in the employing organisation
2007/08
Tells me what to do if not safe How to use sharp and dangerous tools properly JTL I get told by engineers that I work with about the health and safety need in different environments Use of signs put up by workmen College H&S about scaffolding and ladders Clean up after your mess (good housekeeping) Told what to do in emergencies and other situations Internet site from company Information and important points College On a building site I had about an hour lesson on it before I could go in General ways to do things safely How to keep somebody calm in an accident
Working at heights Gave sheets to read through How to use tools correctly and when to wear protection Other workmen Joinery Erecting room scaffold (tower) Be aware of dumper trucks etc First Aid General rules like ladder safety and PPE How to use power tools College Workmate tells me how to do things safely Other joiners about using equipment JTL person discussed some issues Foreman - road safety Clearly explained Other employees Very brief
2008/09
Working from heights Work colleagues General safety Told to wear PPE
JTL rep. working at heights work colleagues advice
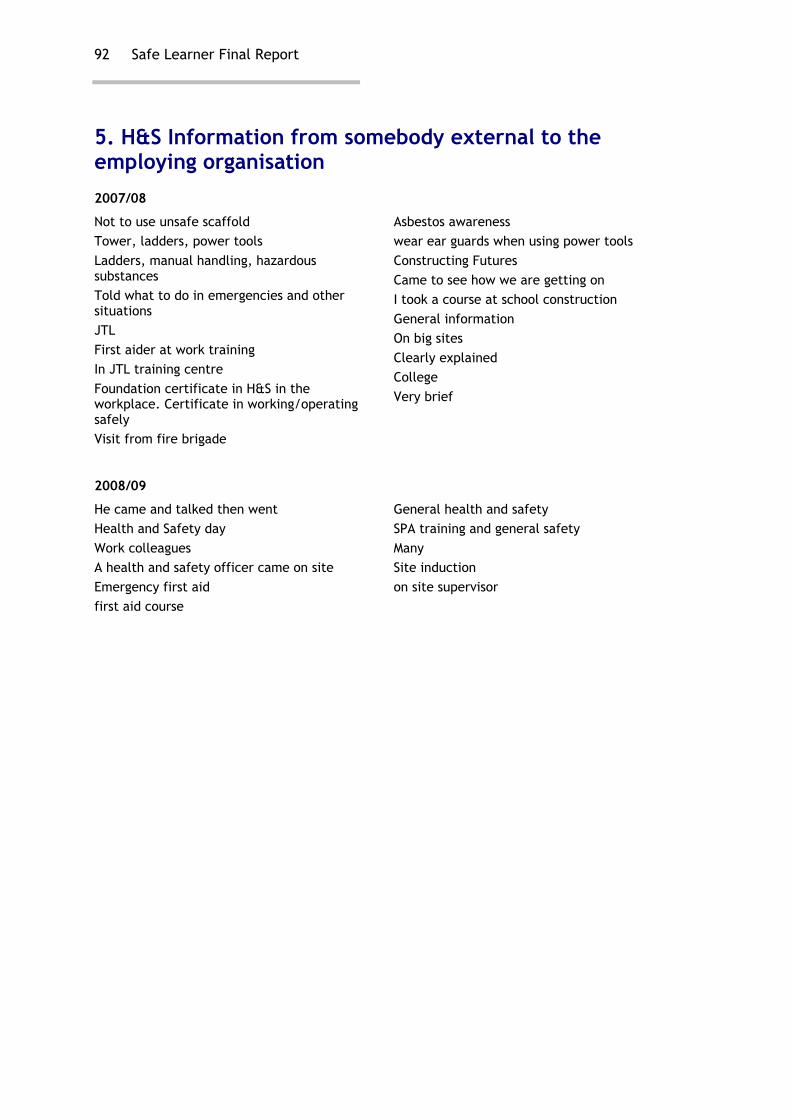
92 Safe Learner Final Report
5. H&S Information from somebody external to the employing organisation
2007/08
Not to use unsafe scaffold Tower, ladders, power tools Ladders, manual handling, hazardous substances Told what to do in emergencies and other situations JTL First aider at work training In JTL training centre Foundation certificate in H&S in the workplace. Certificate in working/operating safely Visit from fire brigade
Asbestos awareness wear ear guards when using power tools Constructing Futures Came to see how we are getting on I took a course at school construction General information On big sites Clearly explained College Very brief
2008/09
He came and talked then went Health and Safety day Work colleagues A health and safety officer came on site Emergency first aid first aid course
General health and safety SPA training and general safety Many Site induction on site supervisor

Institute for Employment Studies 93
6. Any situations at work for which you would have liked more H&S knowledge?
2007/08
When working in workshop with loud machinery as it has damaged my hearing Storing materials for short periods of time Everything When a workmate had an accident Working at heights Safety at height
2008/09
Managers and supervisors Your rights around asbestos Working on frame Vibration timer Dealing with asbestos
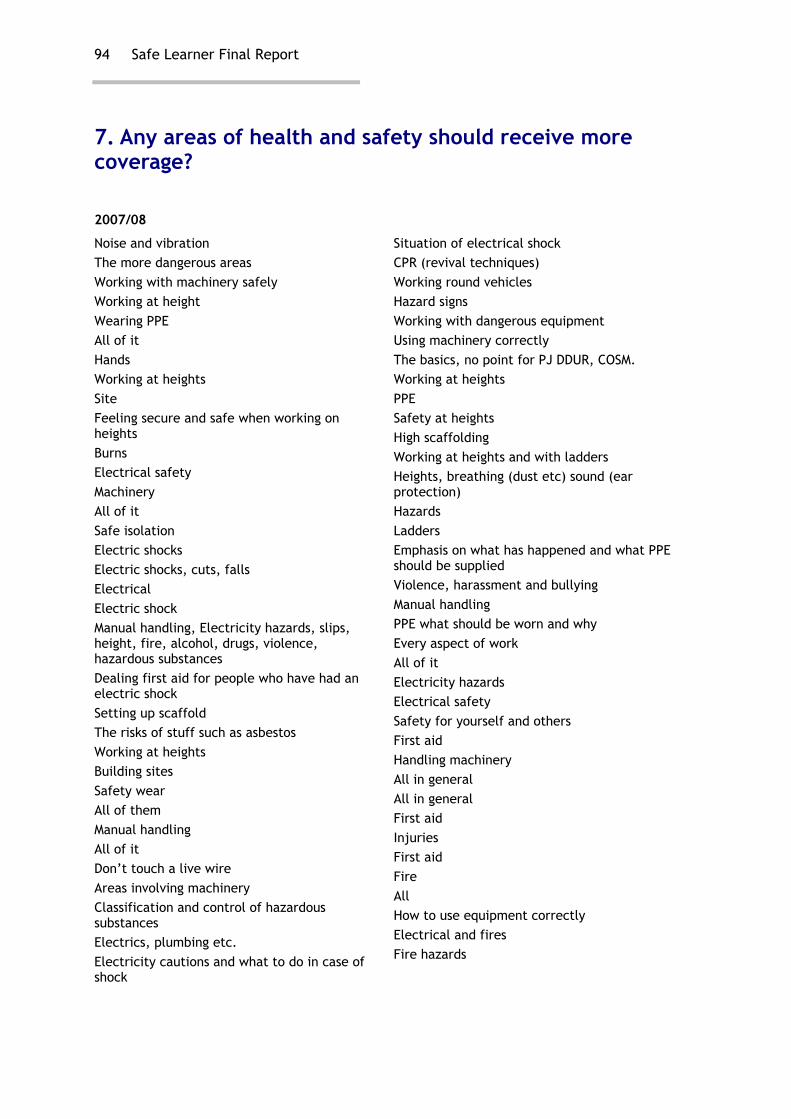
94 Safe Learner Final Report
7. Any areas of health and safety should receive more coverage?
2007/08
Noise and vibration The more dangerous areas Working with machinery safely Working at height Wearing PPE All of it Hands Working at heights Site Feeling secure and safe when working on heights Burns Electrical safety Machinery All of it Safe isolation Electric shocks Electric shocks, cuts, falls Electrical Electric shock Manual handling, Electricity hazards, slips, height, fire, alcohol, drugs, violence, hazardous substances Dealing first aid for people who have had an electric shock Setting up scaffold The risks of stuff such as asbestos Working at heights Building sites Safety wear All of them Manual handling All of it Don’t touch a live wire Areas involving machinery Classification and control of hazardous substances Electrics, plumbing etc. Electricity cautions and what to do in case of shock
Situation of electrical shock CPR (revival techniques) Working round vehicles Hazard signs Working with dangerous equipment Using machinery correctly The basics, no point for PJ DDUR, COSM. Working at heights PPE Safety at heights High scaffolding Working at heights and with ladders Heights, breathing (dust etc) sound (ear protection) Hazards Ladders Emphasis on what has happened and what PPE should be supplied Violence, harassment and bullying Manual handling PPE what should be worn and why Every aspect of work All of it Electricity hazards Electrical safety Safety for yourself and others First aid Handling machinery All in general All in general First aid Injuries First aid Fire All How to use equipment correctly Electrical and fires Fire hazards
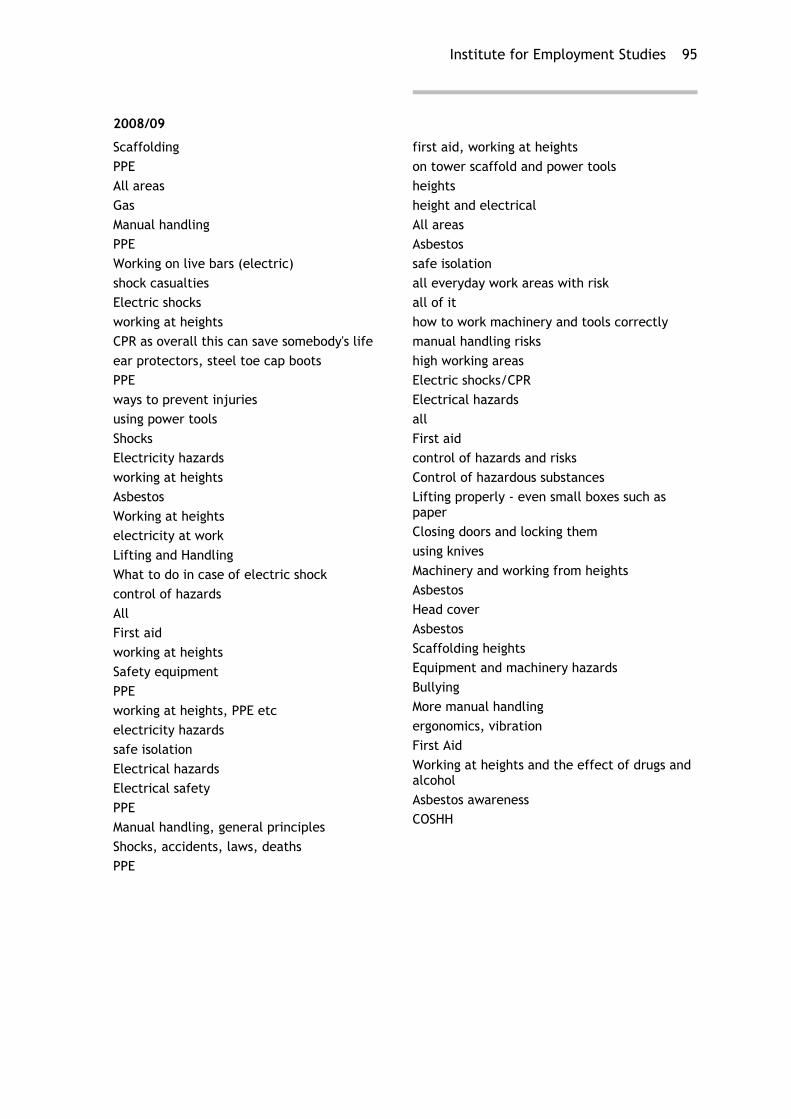
Institute for Employment Studies 95
2008/09
Scaffolding PPE All areas Gas Manual handling PPE Working on live bars (electric) shock casualties Electric shocks working at heights CPR as overall this can save somebody's life ear protectors, steel toe cap boots PPE ways to prevent injuries using power tools Shocks Electricity hazards working at heights Asbestos Working at heights electricity at work Lifting and Handling What to do in case of electric shock control of hazards All First aid working at heights Safety equipment PPE working at heights, PPE etc electricity hazards safe isolation Electrical hazards Electrical safety PPE Manual handling, general principles Shocks, accidents, laws, deaths PPE
first aid, working at heights on tower scaffold and power tools heights height and electrical All areas Asbestos safe isolation all everyday work areas with risk all of it how to work machinery and tools correctly manual handling risks high working areas Electric shocks/CPR Electrical hazards all First aid control of hazards and risks Control of hazardous substances Lifting properly - even small boxes such as paper Closing doors and locking them using knives Machinery and working from heights Asbestos Head cover Asbestos Scaffolding heights Equipment and machinery hazards Bullying More manual handling ergonomics, vibration First Aid Working at heights and the effect of drugs and alcohol Asbestos awareness COSHH
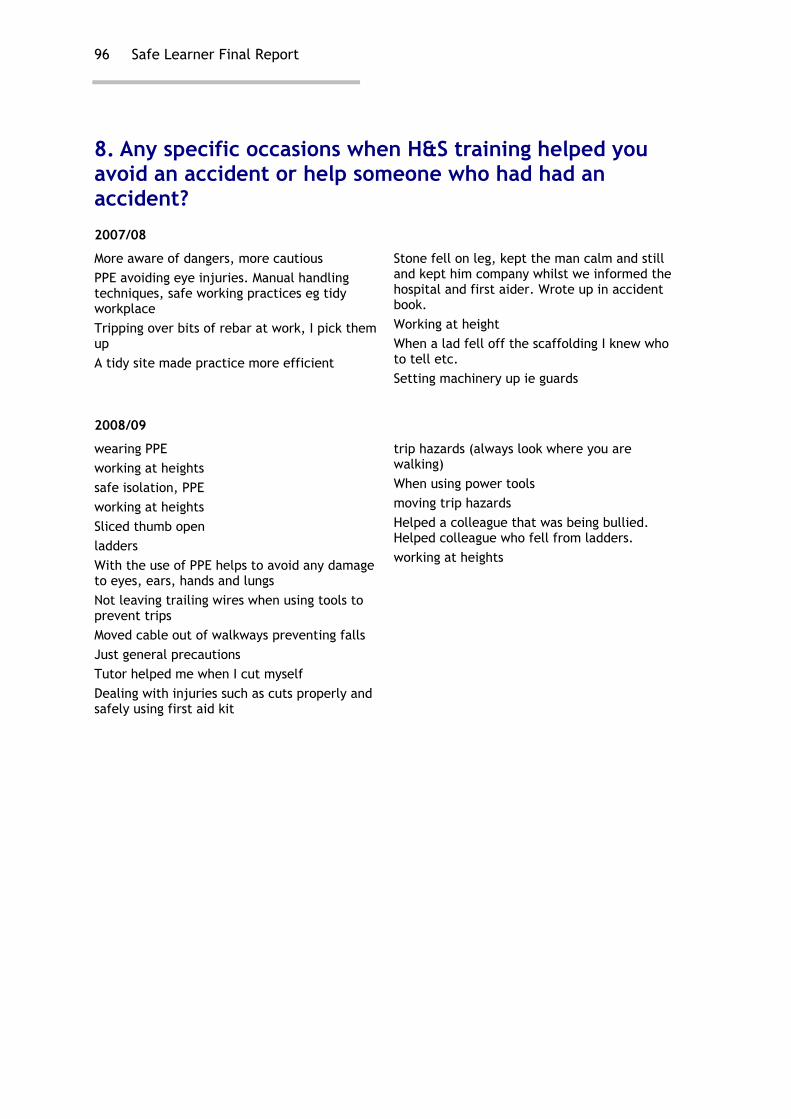
96 Safe Learner Final Report
8. Any specific occasions when H&S training helped you avoid an accident or help someone who had had an accident?
2007/08
More aware of dangers, more cautious PPE avoiding eye injuries. Manual handling techniques, safe working practices eg tidy workplace Tripping over bits of rebar at work, I pick them up A tidy site made practice more efficient
Stone fell on leg, kept the man calm and still and kept him company whilst we informed the hospital and first aider. Wrote up in accident book. Working at height When a lad fell off the scaffolding I knew who to tell etc. Setting machinery up ie guards
2008/09
wearing PPE working at heights safe isolation, PPE working at heights Sliced thumb open ladders With the use of PPE helps to avoid any damage to eyes, ears, hands and lungs Not leaving trailing wires when using tools to prevent trips Moved cable out of walkways preventing falls Just general precautions Tutor helped me when I cut myself Dealing with injuries such as cuts properly and safely using first aid kit
trip hazards (always look where you are walking) When using power tools moving trip hazards Helped a colleague that was being bullied. Helped colleague who fell from ladders. working at heights

Institute for Employment Studies 97
Appendix 2: Proportion of learners being left unsupervised
1. Numbers of first year apprentices left to work unsupervised, by age and level of qualification, 2008/09
Learner age
Supervision Level of
apprenticeship 16 17 18 19 20 + All %
2 18 9 12 2 2 43 38.4 Number never left unsupervised 3 15 5 6 2 3 31 37.8
Total not left unsupervised 33 14 18 4 5 74
% not left unsupervised 46.5 13 51.4 44.4 15.6
2 25 10 12 2 20 69 61.6 Number left unsupervised 3 13 23 5 3 7 51 62.6
Total left unsupervised on occasions 38 23 17 5 27 110
% left unsupervised on occasions 53.5 62.2 48.6 55.6 84.4 -
Base 71 37 35 9 32 194* -
Source: IES survey of apprentices, 2008/09 * Total N = 197; 7 learners did not answer this question

98 Safe Learner Final Report
2. Length of time for which apprentices aged 16-19 are typically left to work unsupervised, by level of qualification, 2008/09
Level of apprenticeship Total
Level 2 Level 3 Level 2 and 3
16 17 18 19 % 16 17 18 19 % N
16-19 %
A few minutes 11 5 - - 29.6 5 1 1 - 21.9 23 26.7
Up to half hour 7 4 4 - 27.7 3 4 2 1 31.3 25 29.1
Up to an hour 5 3 4 2 25.9 2 3 2 2 28.1 15 17.4
Up to a couple of hrs 2 1 2 - 9.3 2 1 - 1 12.5 9 10.5
Up to a day 1 1 2 - 9.3 1 1 - - 6.3 6 7.0
Total 26 14 12 2 54 13 10 5 4 32 86 140
Source: IES survey of apprentices, 2008/09; N first years = 158 (note some learners did not answer all questions)
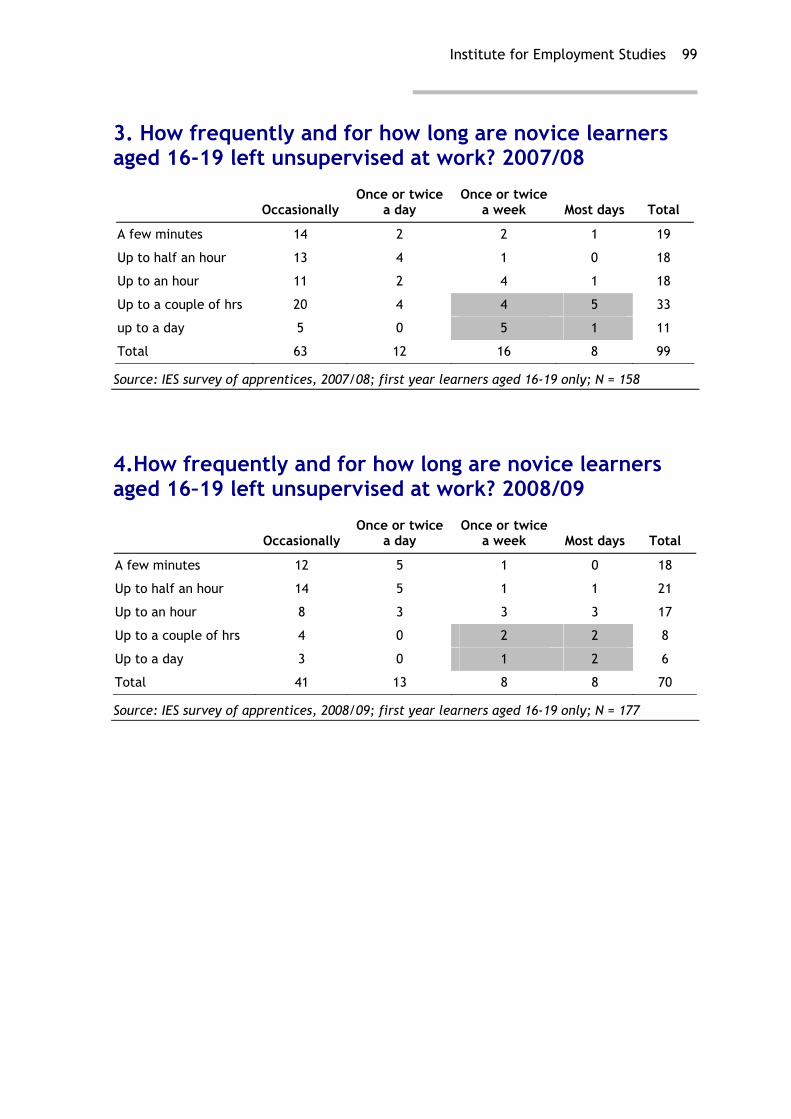
Institute for Employment Studies 99
3. How frequently and for how long are novice learners aged 16-19 left unsupervised at work? 2007/08
Occasionally Once or twice
a day Once or twice
a week Most days Total
A few minutes 14 2 2 1 19
Up to half an hour 13 4 1 0 18
Up to an hour 11 2 4 1 18
Up to a couple of hrs 20 4 4 5 33
up to a day 5 0 5 1 11
Total 63 12 16 8 99
Source: IES survey of apprentices, 2007/08; first year learners aged 16-19 only; N = 158
4.How frequently and for how long are novice learners aged 16–19 left unsupervised at work? 2008/09
Occasionally Once or twice
a day Once or twice
a week Most days Total
A few minutes 12 5 1 0 18
Up to half an hour 14 5 1 1 21
Up to an hour 8 3 3 3 17
Up to a couple of hrs 4 0 2 2 8
Up to a day 3 0 1 2 6
Total 41 13 8 8 70
Source: IES survey of apprentices, 2008/09; first year learners aged 16-19 only; N = 177