Embed Size (px)
Citation preview

The Royal Borough of Kensington and Chelsea Statement of Accounts
2010-11 Financial Year End: 31 March 2011


Statement of Accounts
Contents
Foreword 1 Statement of Responsibilities for the Statement of Accounts 7 Annual Governance Statement 9 Glossary of Terms 19 Core Financial Statements
Auditors‟ Report 27
Movement in Reserves Statement 30
Comprehensive Income and Expenditure Statement 31 Balance Sheet 32 Cash Flow Statement 33 Notes to the Core Financial Statements 34 Supplementary Financial Statements The Housing Revenue Income and Expenditure Statement 111 Collection Fund Revenue Account Income and Expenditure Account 120 Pension Fund Accounts 123 London Residuary Body Accounts 132 Other useful Information 134


1
FOREWORD
INTRODUCTION The Statement of Accounts sets out details of the Council‟s income and expenditure for the financial year 2010-11 and Balance Sheet at 31 March 2011. This covers the General Fund, Housing Revenue Account, Pension Fund and all the other accounts for which the Council is responsible. The Statement of Accounts comprise „key‟ financial statements, explanatory notes and supplementary financial statements:
The Movement in Reserves Statement (MiRS) is a summary of the changes to the Council‟s reserves during the course of the financial year. The reserves represent the Council‟s net worth and are analogous to the equity of a private company. Reserves are divided into „usable‟ and „unusable‟ reserves. Usable reserves can be used to fund expenditure or reduce the council tax; unusable reserves cannot.
The Comprehensive Income and Expenditure Statement (CIES) reports all the gains and losses experienced by the Council during the financial year. The CIES is prepared in accordance with International Financial Reporting Standards and the detail will therefore differ from the Council‟s management accounts and revenue budgets. However, the Council‟s financial position i.e. the working balance and reserves, will be the same.
The Balance Sheet is a „snapshot‟ of the Council‟s assets, liabilities and reserves on the 31 March 2011. The reserves are always equal to the Council‟s assets less the Council‟s liabilities. Assets represent everything owned by the Council and money owed to it. Liabilities are the sums that the Council owes to others.
The Cash Flow Statement shows the changes to the Council‟s cash and „cash equivalents‟ during the financial year. Cash equivalents are assets that can be readily converted into cash and have a low likelihood of a change in value. The statement shows cash flows from: „operating‟ activities, which are the cash flows from the Council‟s services; „investing‟ activities, which are the cash flows from the Council‟s capital investment, investments and asset sales; and „financing‟ activities, which are primarily the cash flows relating to the Council‟s borrowings.
The Notes provide more detail about the items contained in the key financial statements, the Council‟s accounting policies and other information that helps interpretation and understanding of the key financial statements and accounts.
The Supplementary Financial Statements provide details of the Housing Revenue Account, Collection Fund, London Residuary Body and Pension Fund. These are provided to aid interpretation and understanding of the key financial statements and

2
notes, to provide additional statutory information and to disclose information of use to other parties.
The outturn for 2010-11 includes:
A General Fund under-spend of £11.6 million with the working balance confirmed at £10 million – the Council‟s agreed minimum;
Usable reserves at 31 March 2011 are £206 million (compared to £202 million at 31 March 2010); and
A stable balance sheet (total net assets have increased, but due substantially to the annually updated and volatile net pension liability).
2010-11 BUDGET Annually, the Cabinet has set out its financial and service plans in its Cabinet Business Plan. For the 2011-12 year this has been replaced by the Budget Proposals 2011-12. Full details are set out in the relevant financial year‟s Revenue Budget and Capital Programme. In brief summary, the 2010-11 budget included:
a Council Tax freeze;
savings of over £9 million offsetting pay and price inflation;
in-year savings intended at least to match in-year grant reductions by the then new Government (as reported to and agreed by Cabinet in July 2010) which produced;
a revenue budget requirement of £184 million funded from Council Tax and Formula Grant from government; and
a final capital budget of over £60 million. REVENUE SPENDING
The draft Statement of Accounts sets out the Council‟s spending and funding in line with accounting requirements. The position overleaf explains the same information in the form of the Council‟s management accounts. The Council‟s financial position (for example, total usable reserves and final working balance) is the same in both formats. The net under-spend on the General Fund was £11.6 million, comprising three per cent under-spending by the Business Groups1, agreed in-year budget reductions that exceeded the loss of grant and the absence of calls on the Council‟s contingency budget.
1 After grant changes, the 2010-11 under-spend as a proportion of gross spending excluding benefits is 1.5 per
cent.

3
After agreed budget carry forwards of £3.2 million, the balance of the under-spend has been transferred to the Capital Expenditure Reserve and Severance Reserve as agreed by Cabinet in May 2011. The General Fund working balance is confirmed at £10 million.
The summary outturn position is as set out below:
Housing Revenue Account (HRA) The Statement of Accounts also includes the ring-fenced Housing Revenue Account for the provision of social housing. The Housing Revenue Account made a surplus of £1.2 million and increased its working balance by the same amount. Full details are set out in the draft Statement of Accounts.
London Residuary Body (LRB) The accounts also include statements related to functions that transferred to the Council from the former London Residuary Body (residual matters relating to the abolition of the Inner
£m
Working balance 1 April 2010 10.0
Add 2010/11 General Fund underspend 11.6
Less 2010/11 underspend carried forward to 2011/12 -3.2
Balance transferred to Capital Expenditure Reserve -4.2
Balance transferred to Severance Reserve -4.2
Working balance 31 March 2011 10.0
Budget Actual Variance Variance
DESCRIPTION 2010/11 2010/11 2010/11 2010/11
Service Budgets £'000 £'000 £'000 %
Family and Children's Services 60,372 59,836 (536) -1%
Housing, Health and Adult Social Care 84,488 81,536 (2,952) -3%
Planning and Borough Development 5,710 5,241 (469) -8%
Transport, Environment and Leisure Services 25,523 24,977 (546) -2%
Corporate Services 22,746 20,940 (1,806) -8%
Business Group Total 198,839 192,532 (6,307) -3%
Area Based Grant (18,868) (18,868) (0) 0%
Contingency and Central Budgets 4,069 (446) (4,515) -111%
Net Cost of Services 184,040 173,218 (10,822) -6%
External Interest 1,755 1,964 209 12%
Pension Fund Liabilities (126) (1,068) (942) 748%
Interest and Investment Income (1,200) (968) 232 -19%
Capital Adjustment Account (8,520) (8,890) (370) 4%
Transfer to/from reserves (revenue) 3,840 3,976 136 4%
Direct Revenue Financing of Capital 715 711 (4) -1%
Levies 3,677 3,677 (0) 0%
Net Spending 184,181 172,621 (11,560) -6%
Transfer to Budget Carry Forward Reserve 0 3,246 3,246
Transfer to Capital Expenditure Reserve 0 4,157 4,157
Transfer to Severence Reserve 0 4,157 4,157
TOTAL ROYAL BOROUGH EXPENDITURE 184,181 184,181 (0) 0%

4
London Education Authority in 1999, which the Council manages on behalf of the rest of the inner-London boroughs). 31 MARCH 2011 BALANCE SHEET
The balance sheet as at 31 March is summarised below. Aside from pension liabilities that are re-estimated each year and volatile, the overall position is stable.
31-Mar-11 31-Mar-10
£m £m
Long term assets 1,508 1,442
Current assets 207 253
Current liabilities -89 -89
Net pension liabilities -154 -322
Other long term liabilities -187 -191
Net Assets 1,285 1,093
Represented by
Usable reserves -206 -202
Unusable reserves -1,079 -891
Total Reserves -1,285 -1,093
The breakdown of usable reserves is set out below:
CAPITAL SPENDING AND FUNDING The Council invests in its property assets and makes capital investments in services. The Council spent £52 million on capital projects in 2010-11:
£m
General Fund 179
Schools Reserves 8
Housing Revenue Account 15
London Residuary Body 4
Total 206
Budget Actual Variance Variance
£’000 £’000 £’000 %
Family and Children's Services 27,855 21,203 -6,652 -24%
Housing, Health and Adult Social Care 14,726 11,594 -3,132 -21%
Planning and Borough Development 193 128 -65 -34%
Transport, Environmental and Leisure Services 21,009 17,291 -3,718 -18%
Corporate Services 3,284 2,225 -1,059 -32%
Service Total 67,067 52,441 -14,626 -22%
Business Group

5
A summary explanation of the £14.6 million under-spend on capital schemes is set out below:
Capital expenditure in 2010-11 was funded as follows, with just over £22 million funded externally (grants and contributions) and £30 million funded from the Council‟s own resources:
Underspend
2010/11
£'000
Chelsea Academy budget not required and final sponsorship payment slippage -2,009
Marlborough Primary School expansion delayed -2,000
Schools condition projects delayed -1,628
Other (variety of schemes with small variances) -1,015
Family and Children's Services -6,652
Capital slippage (e.g. Ellesmere and Social Care IT system) -1,091
Housing Revenue Account capital programme slippage -2,041
Housing, Health and Adult Social Care -3,132
Public art and local enhancement schemes slippage -65
Planning and Borough Development -65
Talbot Road and Bevington Road public conveniences slippage -457
Portobello Road Market electricity supply slippage -382
Parks Strategy slippage -354
The rest (range of variances on rolling programmes and individual projects) -2,525
Transport, Environment and Leisure Services -3,718
Civic Offices major works and office accommodation projects -656
Corporate Services other projects -403
Corporate Services -1,059
Total -14,626
Funding Source £'000
Capital Grants and Contributions 22,443
Capital Expenditure Reserve 8,675
Capital Receipts 8,565
Internal borrowing 6,466
Other Reserves 5,531
Direct Revenue Financing 761
Total Funding 52,441

6
FUTURE OUTLOOK The Council again delivered a Council Tax freeze for 2011-12. Funding reductions and cost pressures were matched by £23 million in budget reductions. It is also planning to fund an ambitious capital programme - £155 million over three years (£59 million net of grants and contributions from other parties) - without additional external borrowing. The national economic outlook remains grim. The Government has announced substantial cuts to local government funding for 2012-13 and beyond. Although the Council is well positioned to weather economic difficulties, it is also planning for substantial budget reductions for 2012-13 and future years, both as an individual authority and as part of tri-borough working - the delivery of shared services with the neighbouring boroughs of the City of Westminster and London Borough of Hammersmith and Fulham.
ACCOUNTING POLICIES The 2010-11 accounts are, as required, compliant with International Financial Reporting Standards (IFRS) with restated prior year comparables. They comply with the Chartered Institute of Public Finance and Accountancy (CIPFA) / Local Authority (Scotland) Accounts Advisory Committee (LASAAC) Code of Practice on Local Authority Accounting in the United Kingdom 2010 (the Code) which is based on IFRS.
The accounting policies adopted by the Council comply with the Code and are set out on pages 31 to 49. KEY DIFFERENCES BETWEEN SORP BASED AND IFRS BASED ACCOUNTS The transition to IFRS based accounts means that some items in the restated Comprehensive Income and Expenditure Statement and items on the Balance Sheet for 2009-10 have changed materially compared to their SORP based equivalents. A summary of key items that have changed in the IFRS based 1 April 2009 Balance Sheet, the 31 March 2010 Balance Sheet and the 2009-10 Comprehensive Income and Expenditure Statement can be found in Note 45 to the core financial statements. Overall the changes are financially neutral as reflected in the fact the General Fund balance is unchanged and earmarked reserves are stable.
Nicholas Holgate
Executive Director for Finance, Information Systems and Property

7
STATEMENT OF RESPONSIBILITIES FOR THE STATEMENT OF ACCOUNTS
The Council’s Responsibilities The Council is required to:
Make arrangements for the proper administration of its financial affairs and to secure that one of its officers has the responsibility for the administration of those affairs, who is often referred to as the „Chief Finance Officer‟. The Council‟s Chief Finance Officer is the Executive Director for Finance, Information Systems and Property.
Manage its affairs to secure economic, efficient and effective use of resources and safeguard its assets.
Approve the Statement of Accounts. The Executive Director for Finance, Information Systems and Property’s Responsibilities The Executive Director for Finance, Information Systems and Property is responsible for the preparation of the Council‟s Statement of Accounts in accordance with proper practices as set out in the Code. In preparing this Statement of Accounts, the Executive Director for Finance, Information Systems and Property has:
selected suitable accounting policies and then applied them consistently;
made judgments and estimates that were reasonable and prudent; and
complied with the local authority Code. The Executive Director for Finance, Information Systems and Property has also:
kept proper accounting records that are up to date; and
taken reasonable steps for the prevention and detection of fraud and other irregularities.

8
I certify that the Statement of Accounts 2010-11 gives a true and fair view of the financial position of the Council at 31 March 2011 and its income and expenditure for the year ended 31 March 2011.
Nicholas Holgate Executive Director for Finance, Information Services and Property 23 June 2011
Recertified 21 September 2011 I certify on behalf of the Council that the Statement of Accounts 2010-11 was reviewed in draft by Audit Committee on 21 June 2011 and has been considered and approved in final form by the Audit Committee on 21 September 2011.
Councillor Paul Warrick Chairman of the Audit Committee

9
THE ROYAL BOROUGH OF KENSINGTON AND CHELSEA
ANNUAL GOVERNANCE STATEMENT 2010/11 (i) Scope of responsibility The Royal Borough of Kensington and Chelsea (the Council) is responsible for ensuring that its business is conducted in accordance with the law and proper standards; that public money is safeguarded and properly accounted for; and that it is used economically, efficiently and effectively. The Council also has a duty under the Local Government Act 1999 to make arrangements to secure continuous improvement in the way in which its functions are
exercised, having regard to a combination of economy, efficiency and effectiveness. In discharging this overall responsibility, the Council is responsible for putting in place proper arrangements for the governance of its affairs and facilitating the effective exercise of its functions, which includes arrangements for the management of risk. The Council has approved and adopted a Local Code of Corporate Governance, which is
consistent with the principles of the CIPFA / Society of Local Authority Chief Executives (SOLACE) framework Delivering Good Governance in Local Government. A copy of the
code is on the Council‟s website under: Council and Democracy>The Constitution>Constitution Table of Contents>Part5 D
Or it can be obtained from Governance Services, Kensington Town Hall, Hornton Street, London W8 7NX. This statement explains how the Council complies with the Code and also meets the requirements of regulation 4(3) of the Accounts and Audit (England) Regulations 2011 in relation to the publication of an annual governance statement. (ii) The purpose of the governance framework
The governance framework comprises: the systems and processes, culture and values by which the Council is directed and controlled; and its activities, through which it accounts to, engages with and leads the community. It enables the Council to monitor the achievement of its strategic objectives and to consider whether those objectives have led to the delivery of appropriate, cost-effective services. The system of internal control is a significant part of that framework and is designed to manage risk to a reasonable level. It cannot eliminate all risk of failure to achieve policies, aims and objectives and can therefore only provide reasonable and not absolute assurance of effectiveness. The system of internal control is based on an ongoing process designed to identify and prioritise: the risks to the achievement of the Council‟s policies, aims and objectives; to evaluate the likelihood of those risks being realised; the impact should they be realised; and to manage the risks efficiently, effectively and economically.

10
The governance framework has been in place at the Council for the year ended 31 March 2011 and up to the date of approval of the Statement of Accounts. (iii) The governance framework The governance framework is set out in the Annex to this statement. It sets out the key documents and processes that determine the way the Council is directed and controlled to meet the six core principles of the CIPFA / SOLACE framework. The key elements of the processes and systems that comprise the Council‟s governance arrangements are set out in the following sections. a) Identifying, communicating and reviewing the Council’s vision of its purpose and
outcomes for citizens and service users. Through its leadership of the Kensington and Chelsea Partnership (KCP), the Council comes together with voluntary and community groups, the Metropolitan Police Service, the Primary Care Trust, the Kensington and Chelsea Chamber of Commerce and others with a common goal: to improve the quality of life in the Royal Borough. The Partnership has published the Community Strategy, The Future of our Community 2008-2018, which sets out the long-term priorities and the challenges for the whole of the Royal Borough and identified eight shared goals that the Council and its partners will all work to achieve. Delivery of the Council‟s objectives is through an annual business and financial planning process, which results in a budget plan, departmental service delivery plans and personal targets for individuals. The revenue budget and capital programme are subject to full consultation and review by the Scrutiny Committees before recommendation by Cabinet and formal adoption by full Council.
b) Measuring the quality of services for users to ensure that they are delivered in accordance with the Council’s objectives and represent best use of resources.
The quality of services is assessed through the Council‟s performance management system. This includes the setting of targets, the reporting of key performance indicators and a programme of service reviews. The Cabinet Member for Civil Society has responsibility for ensuring that performance of the Council is reported transparently and accurately both within the Council and externally. Five Scrutiny Committees and a number of specialist working groups consider relevant issues of interest and importance.
Monitoring of delivery of the Council‟s objectives included the following documents and processes:

11
Item / Content
Aimed at Frequency
The Report To Taxpayers - a report on the past year‟s performance and a summary Statement of Accounts.
People who live and work in the Royal Borough
Annual
Budget Monitoring Reports - revenue and capital monitoring plus key non-financial indicators with Cabinet approval for any corrective action.
Management Board, Cabinet and Scrutiny Committee members
Quarterly
Vital Improvements - reporting progress on key programmes and projects.
Management Board and Cabinet
Bi-annual
Vital Signs - key national and local performance indicators compared to targets.
Management Board and Cabinet
Bi-annual
Vital Messages - an information database containing details of all public and staff consultations carried out.
Officers, Councillors and the public
Continuous via the Internet and intranet
Vital Finances - a digest of historical and current financial information covering key areas of activity.
Officers, Councillors and the public
Updated annually
Credit Rating - an independent assessment of the Council‟s financial management, financial standing and creditworthiness.
Officers, Councillors and people who live, work and invest in the Royal Borough
Annual
Gateway Reviews - peer reviews of major programmes
Management Board Ad Hoc
c) Defining and documenting the roles and responsibilities of the executive, non
executive, scrutiny and officer functions with clear delegation arrangements and protocols for effective communication.
The Council has a formal Constitution in place, which sets out the detailed roles and responsibilities of the Councillors, Cabinet Members and officers, including specific delegations. The Constitution is regularly reviewed and updated to take account of functional and organisational changes within the Council.
d) Developing, communicating and embedding codes of conduct, defining the
standards of behaviour for Councillors and employees.

12
Councillors‟ (Members‟) and officer „Codes of Conduct‟ are communicated as part of the induction process and made available to all via the intranet. The Members’ Code of Conduct was amended in December 2010, following a recommendation from the Standards Committee, by the introduction of a requirement to comply with the Code of Conduct on Councillors’ Use of Information Technology. The Standards Committee reports annually to full Council on its activities. The membership of this Committee comprises three Council members and three independent voting members. One of the independent members is appointed Chairman of the Committee and another the Vice-chairman.
e) Ensuring the Council’s financial management arrangements conform to the governance requirements of CIPFA’s Statement on the Role of the Chief Financial Officer in Local Government (2010).
The Executive Director for Finance, Information Systems and Property is a member of the Management Board and reports directly to the Town Clerk and Chief Executive. The role of the Executive Director for Finance, Information Systems and Property and the financial responsibilities of Councillors and officers are set out in the Constitution. Key Decision reports always include detailed financial implications. The Council‟s financial statements are completed within statutory timescales and are published on the Council‟s website. The Cabinet Business Plan sets out the Cabinet‟s policy priorities and budget proposals for the next three years. The Plan is up-dated annually. (For 2011-12, it has been re-focussed and is now called Budget Proposals).
f) Reviewing and updating Standing Orders, the Financial Procedure Rules, Scheme
of Delegation and supporting procedure notes/manuals, which clearly define how decisions are taken and the processes and controls required to manage risks.
The Council‟s Monitoring Officer reviews and updates the constitutional framework including the Standing Orders and Scheme of Delegation on a regular basis. The Section 151 officer similarly undertakes regular reviews of the Financial Procedure Rules, Procurement Procedure Rules and Contract Regulations, which are incorporated into the Constitution. Apart from the changes that may be made by the Monitoring Officer in accordance with Article 14.03 of the Constitution, all changes to the Constitution are made by full Council following consideration by the Administration Committee. The Executive Directors, directors and heads of service are ultimately responsible for the management of the risks within their areas of responsibility. The Council has a robust risk management process to identify, assess and manage the significant business risks to the Council‟s objectives, including those of its key strategic partnerships. The risk management process includes the Risk Management Strategy, corporate and departmental risk registers, a Risk Management Group and appropriate staff training.

13
The Council‟s Risk Management Strategy is overseen by the Risk Management Group that meets quarterly, is chaired by an Executive Director and comprises senior officer representatives from each Business Group. A database of key Business Group and Council-wide risks is maintained. Each Business Group has a senior officer nominated as a „Risk Champion‟ who is responsible for ensuring that risks are adequately reviewed, monitored and that appropriate action is being taken by the risk owner.
g) Undertaking the core functions of an Audit Committee.
The Audit Committee comprises both Councillors and three independent members who bring a wide range of commercial and governance experience, knowledge and challenge to the Council. It reviews internal and external audit reports, risk management arrangements and is responsible for providing independent assurance on the Council‟s corporate governance arrangements.
h) Ensuring compliance with relevant laws, regulations, policies and procedures and that expenditure is lawful.
Internal Audit is responsible for conducting audits, using a risk-based approach, which highlights key areas of risk throughout the organisation for both financial and non-financial systems. This work provides assurance on compliance with the Council‟s policies, procedures and regulations. Individual internal audit reports are provided to relevant senior managers and Cabinet Members, as well as being reported to the Audit Committee. The Council has an Anti-fraud and Corruption Strategy to ensure the proper use and protection of public assets. Key Decision reports include comments on legality and compliance with relevant policies. Monitoring of compliance is also undertaken by key officers:
Statutory Officer
Responsible Person Responsible For
Section 151 Officer
Executive Director for Finance, Information Systems and Property
Ensuring that there are arrangements in place for the proper administration of financial affairs throughout the Council. Maintains the complaints system.
Monitoring Officer
Chief Solicitor Reporting any contraventions of the law or maladministration to full Council or Cabinet; supporting the Standards Committee in promoting ethical standards and dealing with complaints about breaches of the Members‟ Code of Conduct; and maintaining the Constitution.
Head of the Paid Service
Town Clerk and Chief Executive
Determining the staffing structure of the Council and the deployment of officers.

14
Many of the Council‟s services are delivered in partnership with commercial and other organisations. The Council ensures that proper governance is maintained by closely following procurement processes when letting contracts and then robustly monitoring them.
i) Whistle-blowing and receiving and investigating complaints from the public. The Council operates a Reporting Concerns at Work Policy (whistle blowing scheme) with various channels of communication including an anonymous phone hotline, a reporting form on the Council internet site and via an independent organisation to whom any concerns can be expressed. The scheme is regularly publicised among employees, key contractors and is publicised on the Council‟s web site.
Most complaints are dealt with at the point of service, but in addition there is a formal system in operation which can escalate complaints to more senior management and ultimately the Town Clerk and Chief Executive, if necessary, to resolve any issues arising. Complaints are reported annually to a meeting of the Cabinet, the report is published on the Council‟s website and includes details of the number of complaints from each business group, any area of concern, action taken and lessons learned.
j) Identifying the development needs of Members and senior officers in relation to
their strategic roles, supported by appropriate training.
There is a programme of regular training for all new managers and a strong corporate induction process for Councillors and officers joining the Council. New Councillors are provided with formal induction sessions and receive a copy of The Councillor’s Handbook. The majority of officers and Councillors have a personal development plan and there is a training programme for all staff and managers to bring skills up to the required level for the job. The effectiveness of all training undertaken is monitored and reviewed. The Council has developed a comprehensive intranet site, providing ready access to a wide range of information and guidance for all staff including an intranet based Financial Management Guidance Manual.
k) Establishing clear channels of communication with all sections of the community
and other stakeholders, ensuring accountability and encouraging open consultation.
Consultation principles and activities are publicised on the Council‟s website. The primary aim of the Council‟s consultation activities is to help the Council to ensure that its services and policies meet the needs of its users. The Council engages and communicates with the local community in various ways including the Residents‟ Panel, which enables residents to participate in service design. Partnerships give communities a say in how local services are delivered and the Council provides a wide range of support to help communities to get involved. The Council has developed a Communications Strategy, Communication Standards and adopted a Statement of Consultation Principles. A Communications Strategy Board chaired by the Leader of the Council oversees delivery of the Strategy, which contains a number of communication projects intended to improve communications with a range of audiences, including hard to reach groups.

15
The Council has communicated every two months through the Council‟s newspaper, delivered to all homes, as well as via the Council‟s website and publications such as the annual Report to Taxpayers. Committee agendas and reports and the Forward Plan of
Key Decisions are made available in public libraries and online on the Council‟s website.
l) Incorporating good governance arrangements in respect of partnerships and other group working as identified by the Audit Commission’s report on the governance of partnerships, and reflecting these in the Council’s overall governance arrangements.
All significant partnerships have partnership frameworks that have aims and objectives and seek measurable outcomes.
Procurement Procedure Rules and Contract Regulations detail the partnership aspects of procurement and require an appropriate partnership structure and a clear definition of roles and responsibilities. Corporate guidance on the establishment, management and review of partnerships is available on the Council‟s intranet. This is flagged-up for staff who manage the Council‟s partnerships.
(iv) Review of effectiveness
The Council has responsibility for conducting, at least annually, a review of the effectiveness of its governance framework, including the system of internal control. The review of effectiveness is informed by: the statements of assurance and annual governance reports of the Executive Directors, who have responsibility for the development and maintenance of the governance environment; the Head of Audit and Risk Management‟s annual report; and by comments made by the Council‟s external auditors, other review agencies and inspectorates.
The Audit Committee approves the annual Audit Plan; receives quarterly reports on audits; reviews the Risk Register and annual Risk Management Report; intervenes to
request further action where necessary; and reviews the above reports to support the Annual Governance Statement. The Committee undertakes an annual assessment of its
effectiveness. The Chairman reports annually to full Council on the activity of the Audit
Committee.
The functions and areas of responsibility of the Executive Directors, directors and heads of service are summarised in the Constitution. The Chief Solicitor discharges the Monitoring Officer role.
The role of the Executive Director for Finance, Information Systems and Property (the Section 151 Officer) is compliant with the principles of CIPFA‟s Statement on the Role of the Chief Financial Officer in Local Government (2010).
The effectiveness of Internal Audit is determined by feedback from managers on individual audit reports, the opinion of the external auditor and an annual peer review by an independent London borough audit team.
The Risk Management Group reviews the effectiveness of the Council‟s risk management arrangements and monitors risk action plans.

16
The Council‟s external auditors are not required to form an opinion on the effectiveness of the Council‟s risk and control systems. However, the Council does take into account the external auditor‟s work when assessing its controls; work which complements the work of Internal Audit. The external auditors have met on a quarterly basis with the Town Clerk and Chief Executive and the Section 151 officer, attend the Audit Committee to present the Audit Plan, report on the Statement of Accounts and provide an Annual Report to those Charged with Governance.
The Standards Committee is responsible for promoting and maintaining high standards of conduct by Councillors, monitoring the operation of the Code of Conduct and assisting Councillors to observe the Code of Conduct. The Standards Committee reports annually to Council on the discharge of its functions and this report is presented to full Council by the independent Chairman of the Committee. In 2010-11, four complaints were made to the Standards Committee. One complaint was withdrawn by the complainant following the resignation of the Councillor concerned in advance of the Initial Assessment Sub-Committee considering the matter. Two of the complaints concerned matters that the Initial Assessment Sub-Committee concluded could not be considered breaches of the Members‟ Code of Conduct, although in one case the Sub-Committee felt that the Councillor had acted unwisely. One of the complainants requested a review of the Sub-Committee‟s decision to take no action on the complaint, but the Review Sub-Committee came to the same conclusion. The fourth complaint was considered by the Initial Assessment Sub-Committee in April 2011.
(v) Summary and conclusion
a) The Head of Internal Audit and Risk Management has issued an opinion, based on the work of Internal Audit and other sources of assurance that:
the Council has a robust system of internal control; strong corporate governance arrangements are in place; and risk management arrangements are satisfactory and compliant with best practice.
b) In the 2009-10 Annual Governance Statement three significant control issues were
reported:
The checking and control of payments made in respect of the corporate agency staff contract with Comensura. An action plan was agreed to address all weaknesses identified. Follow up audits in 2010-11 established that good progress has been made to implement the recommendations and to improve system controls and procedures. The assurance rating in these areas has been revised to satisfactory.
The contract award and project management arrangements in respect of the
construction contract at St Quintin Children‟s Centre. An action plan has been agreed to address all weaknesses identified.
Kensington and Chelsea Tenant Management Organisation (TMO) was served with

17
a „Breach Notice‟ in May 2009, under the terms of the Modular Management Agreement, for failure to implement the terms of its Improvement Plan. The TMO has responded to the Breach Notice, fully addressing all the points raised to the Council’s satisfaction.
c) No significant control issues were identified by Internal Audit during 2010-11.
d) Two main issues were identified by the Audit Commission in relation to the audit of the 2009-10 Financial Statements. These relate to:
A required adjustment to account for a deferred capital receipt as a reserve rather than a long-term creditor in accordance with revised CIPFA guidance.
A required adjustment to: account for a value of a leaseback, offset by an adjustment to discount the deferred capital receipt to its present value, which would reduce the value of the debtor as at 31 March 2010; and to revise associated disclosures including the related accounting policies and the valuation and risks associated with the deferred capital receipt.
e) Two further issues were reviewed and reported on by the Audit Commission in 2010-11 as a result of matters raised by residents:
A review of the arrangements for Councillors‟ expenses identified certain expenses that had not been reimbursed in accordance with the terms of the Councillors‟ allowances scheme. The review made a number of recommendations, which have all been agreed for implementation.
The Audit Commission reported on objections to the Council's 2008-09 financial statements in September 2009, with regard to the alleged collection of commercial waste without charge and the alleged overcharge of street traders for waste management. The results of the review were issued in July 2010 and included a number of recommendations for improvements in the Council's systems and processes for collecting commercial waste and levying market waste collection charges. All of the recommendations have been agreed for implementation.
We propose over the coming year to take steps to review the above matters and if appropriate, make changes to enhance the Council‟s governance arrangements. We are satisfied that these steps will address the need for improvements that were identified in our review of effectiveness and will monitor their implementation and operation as part of our next annual review.
There are no significant governance issues that need to be addressed urgently.
Signed:
……..................…………………… ………………………………………………
Leader of the Council Town Clerk and Chief Executive
On behalf of the Royal Borough of Kensington and Chelsea

18
ANNEX Corporate Governance Framework
Corporate Governance comprises the systems and processes, cultures and values, by which the council is directed and controlled, and through which we account to, engage with and where appropriate, lead the community
1. Focus on purpose of the Council, vision for local area and outcomes for the community
2. Members and officers working together to achieve a common purpose
3. Promoting values and upholding high standards of conduct and behaviour
4. Taking informed and transparent decisions, scrutinised and risk managed
5. Developing capacity of Members and Officers to be effective
6. Engaging with local people to ensure public accountability
[A] Key Documents: Regular/Annual Review or Production
• Community Strategy
• Medium Term Financial Strategy
• Budget Plan
• Service Delivery Plans
• Statement of Accounts
• Internal/External Audit Protocol
• Report to Taxpayers
• Vital Signs (performance indicators)
• Vital Improvements (programmes and projects)
• Vital Finances (statistics)
• Vital messages (consultation)
• Corporate Risk Register
• Budget Leaflet
• Borough Newsletter
• External Audit Report to those charged with Governance
• External Audit and Inspection Letter
• Budget Monitoring Reports
• Management Assurance Statements
• Annual Reports on Scrutiny, Standards and Internal Audit
[B] Key Documents: Ad hoc Review or Production
• Constitution including Standing
Orders
• Communications Strategy
• Consultation Guidelines
• Customer Service Strategy and Standards
• Equal Opportunities Policy
• Scheme of Delegation
• Financial Procedure Rules
• Procurement Policy and Strategy
• Procurement Procedure Rules
• Freedom of Information Publication Scheme
• Workforce Strategy
• Health Safety, Welfare and Employment Policies
• Environmental Strategy
• Data Quality Framework
• Data Security Policy
• IS/IT Strategy
• Protocol – Member/Officer Relations
• Members Code of Conduct
• Officers Code of Conduct
• Reporting Your Concerns at Work Policy
• Partnership Working Guidelines
• Risk Management Policy Statement
• Published Agendas, Reports and Minutes of Committees
[c] Contributory Processes / Regulatory Monitoring • Audit Committee
• Standards Committee
• Administration Committee
• Scrutiny Committees and Scrutiny Managers
• Independent Remuneration Panel for Members Allowances
• Corporate Risk Management Group
• Management Board
• Monitoring Officer appointed
• S.151 Officer Appointed
• Head of Paid Service appointed
• Customer Complaints / Feedback Process
• Procurement Programme Board
• Community Safety
Programme Board
• Resident‟s Panel – consultation
• Budget Consultation
• Kensington and Chelsea Partnership Steering Group
• Gateway Reviews
• Job Descriptions and
Person Specifications
• Job Evaluation Process
• Employee Induction
• Employee Surveys
• Learning and Development Programme – Employees/Members
• Employee Personal Development Framework
• Personal Development Plans
• Criminal Conviction Checks
• Inspectorate Reports
• Health and Safety Officers
• Website Publication
• Internal Audit and Corporate Investigations Group
• External Audit
• Gift and Hospitality Registers for Employees
• Members Register of Interests
• Annual Review of Internal Audit, Risk Management and Governance Arrangements
• Peer reviews
• Credit Rating

19
GLOSSARY OF TERMS
Balance Sheet A statement showing the position of the Council‟s assets and liabilities as at 31 March each year.
Budget A forecast of the Council‟s planned expenditure. The level of the council tax is set by reference to detailed revenue budgets. Budgets are reviewed during the course of the financial year to take account of pay and price changes and other factors affecting the level or cost of services.
BVACOP CIPFA‟s Best Value Accounting Code of Practice, which provides guidance on financial reporting to stakeholders and establishes „proper practice‟ with regard to consistent financial reporting.
Cabinet The Cabinet is the executive body responsible for undertaking
all of the Council‟s functions except those functions that are reserved to the full Council or delegated to committees or officers. When the executive meets collectively, it is known as the „Cabinet‟. Individual councillors that are members of the Executive are known as „Cabinet Members‟ or „Members‟.
Capital Adjustment Account
An account recording financing transactions relating to capital expenditure. This account is not available for general use to fund capital expenditure.
Capital Expenditure
Spending on the acquisition or enhancement of fixed (non-current) assets or advances and loans to other individuals or organisations.
Capital Receipts Income received from the sale of fixed assets or repayment of capital advances.
CIPFA Chartered Institute of Public Finance and Accountancy.
Collection Fund A statutory account into which Council Tax and National Non-Domestic Rates are paid and from which amounts are paid to the Council and precepting body, the Greater London Authority.
Community Assets
A class of fixed (non-current) assets that are expected to be held by the Council in perpetuity to deliver services. Examples include parks.
Depreciation A measure of the consumption or wearing out of a fixed (non-current) asset over its useful economic life.

20
Fixed or ‘Non-current’ Assets
Assets that provide benefit to the Council and its services for a period in excess of one year.
Formula Grant Government subsidy to local authorities comprising two elements – Revenue Support Grant and Redistributed Non-Domestic Rates.
IAS19 (Formerly FRS17)
This International Accounting Standard is based on the principle that an organisation should account for retirement benefits when it is committed to give them, even if the actual giving will be many years into the future.
General Fund The primary revenue account which records the cost of providing the majority of the Council‟s services.
Housing Revenue Account (HRA)
A statutory account recording the income and expenditure relating to the Council‟s provision of social housing.
Infrastructure A class of fixed (non-current) assets that includes bridges, roads and highway works. Infrastructure assets are not normally saleable.
Intangible Assets A class of non-financial fixed (non-current) assets that do not have any physical substance, but are identifiable and are controlled by the Council, for example purchased software licences.
LASAAC Local Authority (Scotland) Accounts Advisory Committee.
London Residuary Body (LRB)
The authority to which functions were transferred from the Greater London Council and the Inner London Education Authority. Residual functions for inner-London, including education awards, were subsequently transferred to the Council on behalf of London‟s local authorities.
LPFA London Pensions Fund Authority.
Major Repairs Allowance (MRA)
The Major Repairs Allowance is an element of Government subsidy payable to the Housing Revenue Account. It represents the capital cost of keeping the housing stock in its current condition. Unused Majors Repairs Allowance is held in the Major Repairs Reserve (MRR) until required.
Management Board
The Council‟s senior officer management team.

21
Minimum Revenue Provision (MRP)
The amount defined by government regulation that must be charged to the revenue account to provide for the redemption of debt.
Monitoring Officer A role, carried out by the Chief Solicitor, to report to the Council on any potential illegality, misadministration or injustice that may come to his/her attention.
National Non Domestic Rates (NNDR)
The form of local taxation charged on non-residential premises at a level set by the Government. Rates are collected and paid into a central pool administered by the Government. The total collected is then redistributed to local authorities on the basis of population.
Precept The charge made by another public authority on the Council to finance its net expenditure. The Council currently has one precepting authority - the Greater London Authority (GLA).
Public Works Loan Board (PWLB)
Agency of the Government responsible for the funding of a large proportion of local authority borrowing.
Related Parties
Related parties are those individuals and entities that the Council either has the ability to influence, or to be influenced by. Related parties include the Government, subsidiary and associated companies, the Pension Fund, Councillors and senior officers.
Reserves (Unusable)
Unusable reserves are reserves that in simple terms balance the Council‟s Balance Sheet and cannot be released to spend on services. For example, the Revaluation Reserve records the effect of revaluing fixed assets and is not available for general use in the financing of capital expenditure. Full details are set out in Note 21.
Reserves (Usable)
Usable reserves are those reserves that can be released to spend on services or added to for future spending on services. Details of these are set out in Note 8. The Council has a detailed reserves policy as set out in its published revenue budget book which can be found at: http://www.rbkc.gov.uk/councilanddemocracy/howthecouncilmanagesmoney.aspx The Council holds material earmarked reserves for the following purposes: General Fund Earmarked Reserves

22
Better City Life - Provides resources for new policy priorities. Budget Carry Forward - Earmarks funds for budgets carried forward from previous years‟ revenue under-spends to meet the cost of specific projects. Building Alterations – Provides finance for special repairs and maintenance works. Capital Expenditure – Provides a source of funding for capital investment and revenue costs in support of capital investment. Car Parking – Holds the surpluses from on-street parking places and contraventions and is controlled by the provisions of Section 55 of the Road Traffic Regulation Act 1984 (as amended) including the application of any surplus income held in such an account. Chelsea Academy Co-sponsorship – Provides funds to meet the Council‟s financial commitment to co-sponsor the Chelsea Academy school. Corporate Information Systems (IS) Initiatives – Provides funds for the financing of corporate information systems. Cost Reduction (Transformation Fund) – Resources for „invest to save‟ opportunities identified as part of the business and financial planning process. Demand Growth – Resources to meet the effects of volatile demand on budgets (to improve budget resilience). Excellence All Round – Funds initiatives to improve services. General Services Building Maintenance – Holds a fixed annual contribution that provides for variable annual maintenance costs. Insurance – Earmarked insurance fund to cover future insurance liabilities. Licensing and Planning Costs – Provides funds to meet costs from unexpected planning and licensing legal cases. Local Elections – Holds funds set aside to cushion the financial impact of local elections.

23
Local Initiative (Transformation Fund) – Provides resources to support the introduction of transformative projects. Property Strategy – Meets the cost of feasibility studies and condition surveys to assist in asset management and capital budget planning. Repairs and Renewals – Provides for the replacement of vehicles and plant, office machinery and special items. It is funded from annual revenue contributions. Risk Management – Provides pump-priming for risk management initiatives. Service Risks – Provides for unexpected service requirements and funds the cost of reducing risks. Severance (Transformation Fund) – Provides resources to meet the costs of potential job losses. Specific Grant Loss – Provides resources to help cushion against adverse changes in specific grant regimes where there are unavoidable financial commitments. Strategic Regeneration – Provides resources to support regeneration activities funded from the (now ended) Local Authority Business Growth Incentive scheme (LABGI). Supporting People - Provides resources to cushion the impact of reduced grant allocation for this service. Value Added Tax (VAT) – Provides resources to mitigate the impact of a breach in the VAT partial exemption ratio. The Council can only recover VAT on exempt activities up to five per cent of its VAT bill. The Council is currently below this limit, but may in the future exceed it. Housing Revenue Account Earmarked Reserves Controlled Repairs – Provides resources to TMO repair projects that are managed at a local level. Lancaster West Estate Management Board – Holds unspent grant that is earmarked for the Lancaster West Estate Management Board under the terms of tits management agreement with the Council.
Revenue Expenditure
Day to day expenditure incurred in the provision of services including salaries, goods and services.

24
REFCUS Revenue Expenditure Funded from Capital Under Statute.
Section 151 Officer
A term used to describe the chief financial officer, whose responsibilities are set out in the Statement of Responsibilities for the Statement of Accounts. The Council‟s chief financial officer is the Executive Director for Finance, Information Systems and Property.
SOLACE Society of Local Authority Chief Executives.
Tenant Management Organisation (TMO)
The Kensington and Chelsea Tenant Management Organisation Limited manages the Council‟s Housing Revenue Account dwelling stock on behalf of the Council.

25
Core Financial Statements
2010-11

26

27
INDEPENDENT AUDITOR’S REPORT TO THE MEMBERS OF THE ROYAL BOROUGH OF KENSINGTON AND CHELSEA
Opinion on the Authority accounting statements
I have audited the accounting statements of the Royal Borough of Kensington and Chelsea for the year ended 31 March 2011 under the Audit Commission Act 1998. The accounting statements comprise the Movement in Reserves Statement, the Comprehensive Income and Expenditure Statement, the Balance Sheet, the Cash Flow Statement, the Housing Revenue Account Income and Expenditure Statement, the Movement on the HRA Statement and Collection Fund Revenue Account Income and Expenditure Statement and the related notes. These accounting statements have been prepared under the accounting policies set out the Statement of Accounting Policies „note 1 to the Core Financial Statements (Accounting Policies)‟. This report is made solely to the members of the Royal Borough of Kensington and Chelsea in accordance with Part II of the Audit Commission Act 1998 and for no other purpose, as set out in paragraph 48 of the Statement of Responsibilities of Auditors and Audited Bodies published by the Audit Commission in March 2010.
Respective responsibilities of the Executive Director for Finance, Information Systems and Property and auditor As explained more fully in the Statement of Responsibilities for the Statement of Accounts, the Executive Director for Finance, Information Systems and Property is responsible for the preparation of the Authority‟s Statement of Accounts in accordance with proper practices as set out in the CIPFA/LASAAC Code of Practice on Local Authority Accounting in the United Kingdom. My responsibility is to audit the accounting statements in accordance with applicable law and International Standards on Auditing (UK and Ireland). Those standards require me to comply with the Auditing Practices Board‟s Ethical Standards for Auditors.
Scope of the audit of the financial statements An audit involves obtaining evidence about the amounts and disclosures in the accounting statements sufficient to give reasonable assurance that the accounting statements are free from material misstatement, whether caused by fraud or error. This includes an assessment of: whether the accounting policies are appropriate to the Authority‟s circumstances and have been consistently applied and adequately disclosed; the reasonableness of significant accounting estimates made by the Authority; and the overall presentation of the accounting statements. I read all the information in the Foreword and the Report to Taxpayers 2011 to identify material inconsistencies with the audited financial statements. If I become aware of any apparent material misstatements or inconsistencies I consider the implications for my report.
Opinion on accounting statements In my opinion the accounting statements: ■ give a true and fair view of the state of the Royal Borough of Kensington and Chelsea‟s affairs
as at 31 March 2011 and of its income and expenditure for the year then ended; and ■ have been properly prepared in accordance with the CIPFA/LASAAC Code of Practice on Local Authority Accounting in the United Kingdom.
Opinion on other matters In my opinion, the information given in the Foreword and the content of the Report to Taxpayers 2011 for the financial year for which the accounting statements are prepared is consistent with the accounting statements.

28
Matters on which I report by exception I have nothing to report in respect of the governance statement on which I report to you if, in my opinion, the governance statement does not reflect compliance with „Delivering Good Governance in Local Government: a Framework‟ published by CIPFA/SOLACE in June 2007.
Opinion on the pension fund accounting statements
I have audited the pension fund accounting statements for the year ended 31 March 2011 under the Audit Commission Act 1998. The pension fund accounting statements comprise the Income and Expenditure Statement, the Net Assets Statement and the related notes. These accounting statements have been prepared under the accounting policies set out in the Statement of Accounting Policies. This report is made solely to the members of the Royal Borough of Kensington and Chelsea in accordance with Part II of the Audit Commission Act 1998 and for no other purpose, as set out in paragraph 48 of the Statement of Responsibilities of Auditors and Audited Bodies published by the Audit Commission in March 2010.
Respective responsibilities of the Executive Director for Finance, Information Systems and Property and auditor As explained more fully in the Statement of Responsibilities for the Statement of Accounts, the Executive Director for Finance, Information Systems and Property is responsible for the preparation of the pension fund‟s Statement of Accounts in accordance with proper practices as set out in the CIPFA/LASAAC Code of Practice on Local Authority Accounting in the United Kingdom. My responsibility is to audit the accounting statements in accordance with applicable law and International Standards on Auditing (UK and Ireland). Those standards require me to comply with the Auditing Practices Board‟s Ethical Standards for Auditors.
Scope of the audit of the financial statements An audit involves obtaining evidence about the amounts and disclosures in the accounting statements sufficient to give reasonable assurance that the accounting statements are free from material misstatement, whether caused by fraud or error. This includes an assessment of: whether the accounting policies are appropriate to the fund‟s circumstances and have been consistently applied and adequately disclosed; the reasonableness of significant accounting estimates made by the fund; and the overall presentation of the accounting statements. I read all the information in the Foreword and the Report to Taxpayers 2011 to identify material inconsistencies with the audited accounting statements. If I become aware of any apparent material misstatements or inconsistencies I consider the implications for my report.
Opinion on accounting statements In my opinion the pension fund‟s accounting statements: ■ give a true and fair view of the financial transactions of the pension fund during the year
ended 31 March 2011 and the amount and disposition of the fund‟s assets and liabilities as at 31 March 2011; and
■ have been properly prepared in accordance with the CIPFA/LASAAC Code of Practice on Local Authority Accounting in the United Kingdom.
Opinion on other matters In my opinion, the information given in the Foreword and the content of the Report to Taxpayers 2011 for the financial year for which the accounting statements are prepared is consistent with the accounting statements.

29
Conclusion on the Authority’s arrangements for securing economy, efficiency and effectiveness in the use of resources
Authority’s responsibilities The Authority is responsible for putting in place proper arrangements to secure economy, efficiency and effectiveness in its use of resources, to ensure proper stewardship and governance, and to review regularly the adequacy and effectiveness of these arrangements.
Auditor’s responsibilities
I am required under Section 5 of the Audit Commission Act 1998 to satisfy myself that the Authority has made proper arrangements for securing economy, efficiency and effectiveness in its use of resources. The Code of Audit Practice issued by the Audit Commission requires me to report to you my conclusion relating to proper arrangements, having regard to relevant criteria specified by the Audit Commission. I report if significant matters have come to my attention which prevent me from concluding that the Authority has put in place proper arrangements for securing economy, efficiency and effectiveness in its use of resources. I am not required to consider, nor have I considered, whether all aspects of the Authority‟s arrangements for securing economy, efficiency and effectiveness in its use of resources are operating effectively.
Basis of conclusion I have undertaken my audit in accordance with the Code of Audit Practice, having regard to the
guidance on the specified criteria, published by the Audit Commission in October 2010, as to whether the Authority has proper arrangements for:
■ securing financial resilience; and
■ challenging how it secures economy, efficiency and effectiveness.
The Audit Commission has determined these two criteria as those necessary for me to consider under the Code of Audit Practice in satisfying myself whether the Authority put in place proper arrangements for securing economy, efficiency and effectiveness in its use of resources for the year ended 31 March 2011. I planned my work in accordance with the Code of Audit Practice. Based on my risk assessment, I undertook such work as I considered necessary to form a view on whether, in all significant respects, the Authority had put in place proper arrangements to secure economy, efficiency and effectiveness in its use of resources.
Conclusion On the basis of my work, having regard to the guidance on the specified criteria published by the Audit Commission in October 2010, I am satisfied that, in all significant respects, the Royal Borough of Kensington and Chelsea put in place proper arrangements to secure economy, efficiency and effectiveness in its use of resources for the year ended 31 March 2011.
Certificate I certify that I have completed the audit of the accounts of the Royal Borough of Kensington and Chelsea in accordance with the requirements of the Audit Commission Act 1998 and the Code of Audit Practice issued by the Audit Commission. Michael Haworth-Maden District Auditor
Audit Commission, 1st floor, Millbank Tower, Millbank, London, SW1P 4HQ 26 September 2011

30
General Fund
Earmarked Reserves
Housing Revenue Account
Major Repairs Reserve
Capital Receipts Reserve
Capital Grants
Unapplied
Other Usable
Reserves
Total Usable
Reserves
Total Unusable Reserves
Total Council
Reserves
£’000 £’000 £’000 £’000 £’000 £’000 £’000 £’000 £’000 £’000
Balance at 31 March 2009 (16,510) (165,227) (9,372) (6,242) (2,757) 0 (9,440) (209,548) (840,395) (1,049,943) Movement in reserves during 2009-10 (Surplus) / deficit on provision of services (97,602) 0 12,916 0 0 0 213 (84,473) 0 (84,473) Other Comprehensive Expenditure and Income 0 0 0 0 0 0 0 0 41,026 41,026
Total Comprehensive Expenditure and Income (97,602) 0 12,916 0 0 0 213 (84,473) 41,026 (43,447) Adjustments between accounting basis and funding basis under regulations
109,108
0
(13,628)
4,076
(8,055)
0
0
91,501
(91,501) 0
Net Increase / Decrease before Transfers to Earmarked Reserves
11,506
0
(712)
4,076
(8,055)
0
213
7,028
(50,475) (43,447)
Transfers to / from Earmarked Reserves (4,996) 5,635 (511) 0 0 0 (66) 62 (62) 0
(Increase) / Decrease in 2009-10 6,510 5,635 (1,223) 4,076 (8,055) 0 147 7,090 (50,537) (43,447)
Balance at 31 March 2010 (10,000) (159,592) (10,595) (2,166) (10,812) 0 (9,293) (202,458) (890,932) (1,093,390) Movement in reserves during 2010-11 (Surplus) / deficit on provision of services (62,002) 0 33,583 0 0 0 7 (28,412) 0 (28,412) Other Comprehensive Expenditure and Income 0 0 0 0 0 0 0 0 (162,936) (162,936)
Total Comprehensive Expenditure and Income (62,002) 0 33,583 0 0 0 7 (28,412) (162,936) (191,348) Adjustments between accounting basis and funding basis under regulations
54,986
0
(35,602)
(295)
6,626
(1,118)
0
24,597
(24,597) 0
Net Increase / Decrease before Transfers to Earmarked Reserves
(7,016)
0
(2,019)
(295)
6,626
(1,118)
7
(3,815)
(187,533) (191,348)
Transfers to/from Earmarked Reserves 7,016 (3,830) 793 (833) 0 0 (2,901) 245 (245) 0
(Increase) / Decrease in 2010-11 0 (3,830) (1,226) (1,128) 6,626 (1,118) (2,894) (3,570) (187,778) (191,348)
Balance at 31 March 2011 Carried Forward (10,000) (163,422) (11,821) (3,294) (4,186) (1,118) (12,187) (206,028) (1,078,710) (1,284,738)
Movement in Reserves Statement nces

31
2010-11 2009-10 (Restated)
Gross Expenditure
Gross Income
Net Expenditure
Gross Expenditure
Gross Income
Net Expenditure
Notes
£’000 £’000 £’000 £’000 £’000 £’000
Central services to the public 6,476 (2,505) 3,971 10,056 (2,109) 7,947
Cultural, environmental, regulatory and planning services 74,798 (18,235) 56,563 75,839 (17,625) 58,214
Education and children‟s services 171,904 (117,715) 54,189 161,739 (108,906) 52,833
Highways and transport services 42,222 (40,136) 2,086 39,886 (40,147) (261)
Local authority housing (Housing Revenue Account) 73,015 (49,372) 23,643 52,212 (51,027) 1,185
Other housing services 203,186 (183,674) 19,512 192,119 (181,765) 10,354
Adult social care 70,398 (17,959) 52,439 69,479 (17,053) 52,426
Corporate and democratic core 10,529 (459) 10,070 10,850 (3,606) 7,244
Non distributed costs – Past Service Pension Costs (61,188) - (61,188) - - - 5
Non distributed costs – other 1,600 (477) 1,123 5,708 (63) 5,645
Cost of Services 592,940 (430,532) 162,408 617,888 (422,301) 195,587 25
Other Operating Expenditure 8,654 - 8,654 4,468 (75,427) (70,959) 5/9
Financing and Investment Income and Expenditure 53,899 (33,403) 20,496 48,596 (50,106) (1,510) 10
Taxation and Non-Specific Grant Income - (219,977) (219,977) - (207,803) (207,803) 11
Net (Surplus) / Deficit on Provision of Services (28,419) (84,685)
Surplus or deficit on revaluation of non-current assets (42,571) (127,270) 21b
Surplus or deficit on revaluation of available for sale financial assets
84
516
Actuarial (gains) / losses on pension assets/liabilities (120,409) 167,631 38
Other Comprehensive Income and Expenditure (33) 362
Total Comprehensive Income and Expenditure (191,348) (43,446)
Comprehensive Income and Expenditure Statement nces

32
31 March ‘11 31 March ‘10 1 April ‘09 Notes
£'000 Restated
£'000 Restated
£'000
Long-term Assets
Property, Plant and Equipment 1,232,521 1,208,786 1,097,998 12a
Investment Property 145,281 145,220 122,892 13
Intangible Assets 2,439 2,070 1,968 14
Assets Held for Sale (>1yr) 0 0 0 Long Term Investments 39,711 173 173 15a
Long Term Debtors 88,396 85,891 414 16b
Total Long-term Assets 1,508,348 1,442,140 1,223,445 Current Assets Short Term Investments 133,918 165,510 223,522 15a
Assets Held for Sale (<1yr) 0 0 0 Inventories 199 308 397 Short Term Debtors 43,756 52,756 48,246 16a
Cash and Cash Equivalents 29,347 34,583 0 17
Total Current Assets 207,220 253,157 272,165 Current Liabilities Bank Accounts in Overdraft (5,783) (5,391) (5,553) 17
Short Term Borrowing (14,604) (12,654) (10,207) 15a
Short Term Creditors (66,804) (69,675) (70,921) 18
Provisions (<1yr) (2,351) (1,215) (1,038) 19
Total Current Liabilities (89,542) (88,935) (87,719) Long-term Liabilities Long Term Creditors 0 0 0 Provisions (3,230) (3,316) (2,443) 19
Long Term Borrowing (170,196) (182,345) (194,998) 15a
Other Long Term Liabilities (154,503) (322,824) (154,496) 44
Donated Assets Account 0 0 0 Capital Grants Receipts in Advance (13,359) (4,487) (6,011) 32c
Total Long-term Liabilities (341,288) (512,972) (357,948) Net Assets 1,284,738 1,093,390 1,049,943
RESERVES Usable Reserves (206,028) (202,458) (209,548) 7/8
Unusable Reserves (1,078,710) (890,932) (840,395) 7/21
Total Reserves (1,284,738) (1,093,390) (1,049,943)
Balance Sheet nces

33
2011 2010 Notes
£'000 Restated
£'000
Net (Surplus) / deficit on the provision of services (28,419) (84,685)
London Residuary Body 6 213
Net (Surplus) / deficit (28,413) (84,472)
Adjustments to net surplus or deficit on the provision of services for non-cash movements (24,907) 158,923
Adjustments for items included in the net surplus or deficit on the provision of services that are investing and financing activities 16,996
15,177
Net cash flows from Operating Activities (36,324) 89,628 22
Investing Activities 31,651 (134,700) 23
Financing Activities 10,301 10,327 24
Net (increase) / decrease in cash and cash equivalents 5,628 (34,745)
Net Cash and cash equivalents at the beginning of the reporting period 29,192 (5,553)
Increase / (decrease) in cash and cash equivalents (5,628) 34,745
Net Cash and cash equivalents at the end of the reporting period 23,564 29,192 17
The cash flow statement has been prepared using the indirect method in accordance with proper practice. It therefore contains significant adjustments for non-cash items. The 2009-10 cash flow figures include significant adjustments in respect of the sale of land near Holland Park School.
Cash Flow Statement nces

34
Notes to the Core Financial Statements
i. General Principles
The Statement of Accounts summarises the Council‟s financial transactions for the 2010-11 financial year and its financial position its year-end of 31 March 2011. The Council is required to prepare an annual Statement of Accounts by the Accounts and Audit Regulations 2003 in accordance with proper accounting practices. Proper practices primarily comprise the Code of Practice on Local Authority Accounting in the United Kingdom 2010/11 (Code) and the Best Value Accounting Code of Practice 2010/11 (BVACOP), supported by International Financial Reporting Standards (IFRS).
The accounting convention adopted in the Statement of Accounts is principally historical cost, modified by the revaluation of certain categories of non-current assets and financial instruments. The Statement of Accounts has been prepared on a „going concern‟ basis. ii. Accruals of Income and Expenditure Activity is accounted for in the year that it takes place, not simply when cash payments are made or received. In particular:
Revenue from the sale of goods is recognised when the Council transfers the significant risks and rewards of ownership to the purchaser and it is probable that the economic benefits or service potential associated with the transaction will flow to the Council.
Revenue from the provision of services is recognised when the Council can measure reliably the percentage of completion of the transaction and it is probable that economic benefits or service potential associated with the transaction will flow to the Council.
Supplies are recorded as expenditure when they are consumed. Where there is a gap between the date supplies are received and their consumption, they are carried as inventories on the Balance Sheet.
Expenses in relation to services received (including services provided by employees) are recorded as expenditure when the services are received rather than when payments are made.
Interest receivable on investments and payable on borrowings is accounted for as income and expenditure respectively, based on the effective interest rate for the relevant financial instrument rather than the cash flows fixed or determined by the contract.
Where revenue and expenditure have been recognised, but cash has not been received or paid, a debtor or creditor for the relevant amount is recorded in the Balance Sheet. Where debts may not be settled, the balance of debtors is written down and a charge made to revenue for the income that might not be collected.
1. Accounting Policies nces

35
iii. Cash and Cash Equivalents Cash is represented by cash in hand and deposits with financial institutions repayable without penalty on notice of not more than 24 hours, having originally been invested for a period no longer than three months. Cash equivalents are investments that, having originally been invested for no longer than three months, are repayable on demand or readily convertible to known amounts of cash with an insignificant risk of change in value. Fixed Deposits are not considered to be readily convertible since they are only repayable at the point of maturity and cannot be traded or redeemed without penalty. Cash and Cash Equivalents are held to meet the daily cash flow needs of the Council. These are distinct from investments that are held for the purposes of capital protection or appreciation and/or earning a return. Cash and cash equivalents are shown separately to bank overdrafts. iv. Exceptional Items When items of income and expense are material, their nature and amount is disclosed separately, either on the face of the Comprehensive Income and Expenditure Statement or in the notes to the accounts, depending on how significant the items are to understanding the Council‟s financial performance. v. Prior Period Adjustments, Changes in Accounting Policies and Estimates and Errors Prior period adjustments may arise as a result of a change in accounting policies or to correct a material error. Changes in accounting estimates are accounted for prospectively i.e. in the current and future years affected by the changes, and do not give rise to a prior period adjustment. Changes in accounting policies are only made when required by proper accounting practices or the change provides more reliable or relevant information about the effect of transactions, other events and conditions on the Council‟s financial position or financial performance. Where a change is made, it is applied retrospectively (unless stated otherwise) by adjusting opening balances and comparative amounts for the prior period as if the new policy had always been applied. Material errors discovered in prior period figures are corrected retrospectively by amending opening balances and comparative amounts for the prior period. vi. Charges to Revenue for Non-Current Assets Services, support services and trading accounts are debited with the following amounts to record the cost of holding fixed assets during the year:
depreciation attributable to the assets used by the relevant service;

36
revaluation and impairment losses on assets used by the service where there are no accumulated gains in the Revaluation Reserve against which the losses can be written off; and
amortisation of intangible fixed assets attributable to the service. The Council is not required to raise council tax to fund depreciation, revaluation losses, impairments and amortisations. However, it is required to make an annual contribution from revenue towards the reduction in its overall borrowing requirement that is equal to an amount calculated on a prudent basis by the Council in accordance with statutory guidance. This provision is known as the Minimum Revenue Provision (MRP). Depreciation, revaluation losses, impairments and amortisation are therefore replaced by the MRP in the General Fund Balance, by way of an adjusting transaction with the Capital Adjustment Account in the Movement in Reserves Statement for the difference between the two. vii. Employee Benefits Benefits Payable During Employment Short-term employee benefits are those due to be settled within the 12 months following year-end. They include benefits such as salaries, paid annual leave, paid sick leave, bonuses and non-monetary benefits e.g. cars, for current employees and are recognised as an expense for services in the year in which an employee renders service to the Council. An accrual is made for the cost of holiday entitlements (or any form of leave e.g. time off in lieu) earned by employees, but not taken before the year-end and which employees can carry forward into the next financial year. The accrual is made at the wage and salary rates applicable in the following accounting year, being the period in which the employee takes the benefit. The accrual is charged to the Surplus or Deficit on the Provision of Services, but then reversed out through the Movement in Reserves Statement so that holiday benefits are charged to revenue in the financial year in which the holiday absence occurs. Termination Benefits Termination benefits are amounts payable to an employee as a result of a decision by the Council to terminate his or her employment before the normal retirement date, or an employee‟s decision to accept voluntary redundancy. The benefits are charged on an accruals basis to the Comprehensive Income and Expenditure Statement when „redundancy advice‟ has been given. Where termination benefits involve the enhancement of pensions, statutory provisions require the General Fund Balance to be charged with the amount payable by the Council to the Pension Fund or pensioner in the year, not the amount calculated according to the relevant accounting standard. In the Movement in Reserves Statement, appropriations are required to and from the Pensions Reserve to remove the notional debits and credits for enhanced pension benefits and to replace them with debits for the cash paid to either the Pension Fund or pensioners and any such amounts payable, but unpaid at the year-end. Post Employment Benefits Employees of the Council are members of two separate pension schemes:
The Teachers‟ Pension Scheme, administered by Capita Teachers‟ Pensions on behalf of the Department for Education (DfE).

37
For the majority of participants in the Local Government Pensions Scheme (LGPS), the arrangements are administered by the Council and for a relatively small number, by the London Pension Fund Authority.
Both schemes provided defined benefits to members (retirement lump sums and pensions), earned as employees worked for the Council. However, the arrangements for the Teachers‟ Pension Scheme mean that liabilities for these benefits cannot ordinarily be identified and specifically allocated to the Council. The scheme is therefore accounted for as if it were a defined contribution scheme and no liability for future payments of benefits is recognised in the Balance Sheet. The Children‟s and Education Services line in the Comprehensive Income and Expenditure Statement is charged with the employer‟s contributions payable to the Teachers‟ Pension Scheme for the year.
The Local Government Pension Scheme
The Local Government Scheme is accounted for as a defined benefits scheme.
The liabilities of the Pension Fund attributable to the Council are included in the Balance Sheet on an actuarial basis using the projected unit method i.e. an assessment of the future payments that will be made in relation to retirement benefits earned to date by employees, based on actuarial assumptions about mortality rates, employee turnover rates, projected earnings of current employees and etc.
Liabilities are discounted to their value at current prices, using a discount rate determined by the actuary that is based on the indicative rate of return on high quality corporate bonds: the iBoxx AA-rated, over 15 year corporate bond index.
The assets of the Pension Fund attributable to the Council are included in the Balance Sheet at their fair value:
Quoted securities: current bid price.
Unquoted securities: professional estimate.
Unitised securities: current bid price.
Property: market value.
The change in the net pensions liability is analysed into seven components:
Current service cost: the increase in liabilities as a result of years earned in the financial year, allocated in the Comprehensive Income and Expenditure Statement to the services for which the employees worked.
Past service cost: the increase in liabilities arising from fund performance relating to years of service earned in earlier years – debited to the Surplus or Deficit on the Provision of Services in the Comprehensive Income and Expenditure Statement as part of Non-Distributed Costs.
Interest cost: the expected increase in the present value of liabilities during the year as they move one year closer to being paid – debited to the Financing and Investment Income and Expenditure line in the Comprehensive Income and Expenditure Statement.
Expected return on assets: the annual investment return on the fund assets attributable to the Council, based on an average of the expected long-term return – credited to the

38
Financing and Investment Income and Expenditure line in the Comprehensive Income and Expenditure Statement.
Gains or losses on settlements and curtailments: the result of actions to relieve the Council of liabilities or events that reduce the expected future service or accrual of benefits of employees – debited or credited to the Surplus or Deficit on the Provision of Services in the Comprehensive Income and Expenditure Statement as part of Non Distributed Costs.
Actuarial gains and losses: changes in the net pensions liability that arise because events have not coincided with assumptions made at the last actuarial valuation or because the actuaries have updated their assumptions – debited to the Pensions Reserve.
Contributions paid to the Kensington and Chelsea Pension Fund: cash paid as employer‟s contributions to the pension fund in settlement of liabilities; not accounted for as an expense.
In relation to retirement benefits, statutory provisions require the General Fund Balance to be charged with the amount payable by the Council to the Pension Fund or directly to pensioners in the year, not the amount calculated according to the relevant accounting standards. In the Movement in Reserves Statement, this means that there are appropriations to and from the Pensions Reserve to remove the notional debits and credits for retirement benefits and replace them with debits for the cash paid to the pension fund and pensioners and any such amounts payable, but unpaid at the year-end. The negative balance that arises on the Pensions Reserve thereby measures the beneficial impact to the General Fund of being required to account for retirement benefits on the basis of cash flows rather than as benefits are earned by employees. Discretionary Benefits The Council has restricted powers to make discretionary awards of retirement benefits in the event of early retirements. Any liabilities estimated to arise as a result of an award to any member of staff (including teachers) are accrued in the year the decision is taken and accounted for using the same policies as are applied to the Local Government Pension Scheme. viii. Events After the Balance Sheet Date Events after the Balance Sheet date are those material events, both favourable and unfavourable, that occur between the end of the reporting period and the date when the Statement of Accounts is authorised for issue. Two types of events can be identified:
Adjusting Events: those that provide evidence of conditions that existed at the end of the reporting period – the Statement of Accounts is adjusted to reflect such events.
Non-adjusting Events: those that are indicative of conditions that arose after the reporting period – the Statement of Accounts is not adjusted to reflect such events, but where a category of events would have a material effect, disclosure is made in the notes of the nature of the events and their estimated financial effect.
Events taking place after the date of authorisation for issue are not reflected in the Statement of Accounts.

39
ix. Financial Instruments Financial Liabilities Financial liabilities are recognised on the Balance Sheet when the Council becomes a party to the contractual provisions of a financial instrument. They are initially measured at fair value and are carried at their amortised cost. Annual charges to the Financing and Investment Income and Expenditure line in the Comprehensive Income and Expenditure Statement for interest payable are based on the carrying amount of the liability, multiplied by the effective rate of interest for the instrument. The effective interest rate is the rate that exactly discounts estimated future cash payments over the life of the instrument to the amount at which it was originally recognised. For most of the borrowings that the Council has, this means that the amount presented in the Balance Sheet is the outstanding principal repayable (plus accrued interest) and interest charged to the Comprehensive Income and Expenditure Statement is the amount payable for the year according to the loan agreement. Gains and losses on the repurchase or early settlement of borrowing are credited and debited to the Financing and Investment Income and Expenditure line in the Comprehensive Income and Expenditure Statement in the year of repurchase/settlement. However, where repurchase has taken place as part of a restructuring of the loan portfolio that involves the modification or exchange of existing instruments, the premium or discount is deducted from or added to the amortised cost of the new or modified loan as appropriate and the write-down to the Comprehensive Income and Expenditure Statement is spread over the life of the loan by an adjustment to the effective interest rate. Where premiums and discounts have been charged to the Comprehensive Income and Expenditure Statement, regulations allow the impact on the General Fund Balance to be spread over future years. The Council spreads the gain or loss over the term that was remaining on the loan when it was repaid. The reconciliation of amounts charged to the Comprehensive Income and Expenditure Statement to the net charge required against the General Fund Balance is managed by a transfer to or from the Financial Instruments Adjustment Account in the Movement in Reserves Statement. Financial Assets Financial assets are classified into two types:
Loans and receivables: assets that have fixed or determinable payments, but are not quoted in an active market.
Available-for-sale assets: assets that have a quoted market price and/or do not have fixed or determinable payments.
Loans and Receivables Loans and receivables are recognised on the Balance Sheet when the Council becomes a party to the contractual provisions of a financial instrument classified as such. They are initially measured at fair value and are subsequently measured at amortised cost. Annual credits to the Financing and Investment Income and Expenditure line in the Comprehensive Income and

40
Expenditure Statement for interest receivable are based on the carrying amount of the asset multiplied by the effective rate of interest for the instrument. For most of the loans that the Council has made, this means that the amount presented in the Balance Sheet is the outstanding principal receivable (plus accrued interest) and interest credited to the Comprehensive Income and Expenditure Statement is the amount receivable for the year in the loan agreement. However, the Council has made a number of loans to voluntary organisations at less than market rates (soft loans). When soft loans are made, a loss is recorded in the Comprehensive Income and Expenditure Statement (debited to the appropriate service) for the present value of the interest that will be foregone over the life of the instrument, resulting in a lower amortised cost than the outstanding principal. Interest is credited to the Financing and Investment Income and Expenditure line in the Comprehensive Income and Expenditure Statement at a marginally higher effective rate of interest than the rate receivable from the voluntary organisations, with the difference serving to increase the amortised cost of the loan in the Balance Sheet. Statutory provisions require that the impact of soft loans on the General Fund Balance is the interest receivable for the financial year. The reconciliation of amounts debited and credited to the Comprehensive Income and Expenditure Statement to the net gain required against the General Fund Balance is managed by a transfer to or from the Financial Instruments Adjustment Account in the Movement in Reserves Statement. Where assets are identified as impaired because it is likely that due to a past event that payments due under the contract will not be made, the asset is written down and a charge made to the relevant service (for receivables specific to a service) or the Financing and Investment Income and Expenditure line in the Comprehensive Income and Expenditure Statement. The impairment loss is the difference between the carrying amount and the present value of the revised future cash flows discounted at the asset‟s original effective interest rate. Any gains and losses that arise on the derecognition of an asset are credited or debited to the Financing and Investment Income and Expenditure line in the Comprehensive Income and Expenditure Statement. Available-for-Sale Assets Available-for-sale assets are recognised on the Balance Sheet when the Council becomes a party to the contractual provisions of a financial instrument classified as such. They are initially measured and subsequently carried at fair value. Where the asset has fixed or determinable payments, annual credits to the Financing and Investment Income and Expenditure line in the Comprehensive Income and Expenditure Statement for interest receivable are based on the amortised cost of the asset multiplied by the effective rate of interest for the instrument. Where there are no fixed or determinable payments, income e.g. dividends, is credited to the Comprehensive Income and Expenditure Statement when it becomes receivable by the Council. Assets are maintained in the Balance Sheet at fair value. Values are based on the following principles:
Instruments with quoted market prices: the market price.
Other instruments with fixed and determinable payments: discounted cash flow analysis.
Equity shares with no quoted market prices: independent appraisal of company valuations.

41
Changes in fair value are balanced by an entry in the Available-for-Sale Reserve and the gain/loss is recognised in the Surplus or Deficit on Revaluation of Available-for-Sale Financial Assets. The exception is where impairment losses have been incurred: these are debited to the Financing and Investment Income and Expenditure line in the Comprehensive Income and Expenditure Statement, along with any net gain or loss for the asset accumulated in the Available-for-Sale Reserve. Where assets are identified as impaired because either it is likely that due to a past event that payments due under the contract will not be made (fixed or determinable payments) or fair value falls below cost, the asset is written down and a charge made to the Financing and Investment Income and Expenditure line in the Comprehensive Income and Expenditure Statement. If the asset has fixed or determinable payments, the impairment loss is measured as the difference between the carrying amount and the present value of the revised future cash flows discounted at the asset‟s original effective interest rate. Otherwise, the impairment loss is measured as any shortfall of fair value against the acquisition cost of the instrument net of any principal repayment and amortisation. Any gains and losses that arise on the derecognition of the asset are credited or debited to the Financing and Investment Income and Expenditure line in the Comprehensive Income and Expenditure Statement, along with any accumulated gains or losses previously recognised in the Available-for-Sale Reserve. Where fair value cannot be measured reliably, the instrument is carried at cost less any impairment losses. x. Government Grants and Contributions Whether paid on account, by instalments or in arrears, government grants and third party contributions and donations are recognised as due to the Council when there is reasonable assurance that:
the Council will comply with the conditions attached to the payments, and
the grants or contributions will be received. Amounts recognised as due to the Council are not credited to the Comprehensive Income and Expenditure Statement until conditions attached to the grant or contribution have been satisfied. Conditions are stipulations that must be met by the recipient as specified, or the grant must be repaid. Monies advanced as grants and contributions for which conditions have not been satisfied are carried in the Balance Sheet as creditors. When conditions are satisfied, the grant or contribution is credited to the relevant service line (attributable revenue grants and contributions) or Taxation and Non-Specific Grant Income (non-ringfenced revenue grants and all capital grants) in the Comprehensive Income and Expenditure Statement. Where capital grants are credited to the Comprehensive Income and Expenditure Statement, they are reversed out of the General Fund Balance in the Movement in Reserves Statement. Where a grant has yet to be used to finance capital expenditure, it is posted to the Capital Grants Unapplied Reserve. Where a grant is received and applied in-year, it is posted to the Capital Adjustment Account. Amounts in the Capital Grants Unapplied reserve are transferred to the Capital Adjustment Account once they have been applied to fund capital expenditure.

42
Area Based Grant Area Based Grant (ABG) is a general grant allocated by the Government directly to local authorities as additional revenue funding. ABG is non-ringfenced and is credited to Taxation and Non-Specific Grant Income in the Comprehensive Income and Expenditure Statement. This grant ends in 2010-11. xi. Intangible Assets Expenditure on non-monetary assets that do not have physical substance, but are controlled by the Council as a result of past events e.g. software licences, is capitalised when it is expected that future economic benefits or service potential will flow from the intangible asset to the Council for a period greater than one year. Internally generated assets consist of software, which is capitalised when the Council will be able to generate future economic benefits or deliver service potential by using the software. The expenditure capitalised is that which can be measured reliably and has been spent on development. Expenditure on the development of websites is not capitalised if the website is solely or primarily intended to promote or advertise the Council‟s goods or services. Intangible assets are measured initially at cost. Amounts are only revalued where the fair value of the assets held by the Council can be determined by reference to an active market. In practice, no intangible asset held by the Council meets this criterion and they are therefore carried at amortised cost. Intangible assets are amortised over their useful life to the relevant service line(s) in the Comprehensive Income and Expenditure Statement. An asset is tested for impairment whenever there is an indication that the asset might be impaired and any losses recognised are posted to the relevant service line(s) in the Comprehensive Income and Expenditure Statement. Any gain or loss arising on the disposal or abandonment of an intangible asset is posted to the Other Operating Expenditure line in the Comprehensive Income and Expenditure Statement. Amortisation, impairment losses and disposal gains and losses are not permitted to have an impact on the General Fund Balance. Such gains and losses are therefore reversed out of the General Fund Balance in the Movement in Reserves Statement and posted to the Capital Adjustment Account and (for any sale proceeds greater than £10,000) the Capital Receipts Reserve. xii. Inventories and Long Term Contracts Inventories are included in the Balance Sheet at the lower of cost and net realisable value. The cost of inventories is assigned using the „first-in first-out‟ (FIFO) costing formula. Long term contracts are accounted for on the basis of charging the Surplus or Deficit on the Provision of Services with the value of works and services received under the contract during the financial year.

43
xiii. Investment Property Investment properties are those that are used solely to earn rentals and/or for capital appreciation. The definition is not met if the property is used in any way to facilitate the delivery of services, the production of goods or is held for sale. Investment properties are measured initially at cost and subsequently at fair value, based on the amount at which the asset could be exchanged between knowledgeable parties at arm‟s-length. Properties are not depreciated, but are revalued annually according to market conditions at the year-end. Gains and losses on revaluation are posted to the Financing and Investment Income and Expenditure line in the Comprehensive Income and Expenditure Statement. The same treatment is applied to gains and losses on disposal. Rentals received in relation to investment properties are credited to the Financing and Investment Income line and result in a gain for the General Fund Balance. However, revaluation and disposal gains and losses are not permitted by statutory arrangements to have an impact on the General Fund Balance. The gains and losses are therefore reversed out of the General Fund Balance in the Movement in Reserves Statement and posted to the Capital Adjustment Account and (for any sale proceeds greater than £10,000) the Capital Receipts Reserve. xiv. Leases Leases are classified as finance leases where the terms of the lease transfers substantially all the risks and rewards incidental to ownership of the property, plant or equipment from the lessor to the lessee. All other leases are classified as operating leases. Where a lease covers both land and buildings, the land and buildings elements are considered separately for classification. Arrangements that do not have the legal status of a lease but convey a right to use an asset in return for payment are accounted for under this policy where fulfilment of the arrangement is dependent on the use of specific assets.
The Council as Lessee
Finance Leases
Property, plant and equipment held under finance leases is recognised on the Balance Sheet at the commencement of the lease either at its fair value measured at the lease‟s inception or if lower, the present value of the minimum lease payments. The asset recognised is matched by a liability for the obligation to pay the lessor. Initial direct costs of the Council are added to the carrying amount of the asset. Premiums paid on entry into a lease are applied to writing down the lease liability. Contingent rents are charged as expenses in the periods in which they are incurred.
Lease payments are apportioned between:
a charge for the acquisition of the interest in the property, plant or equipment – applied to write down the lease liability, and

44
a finance charge (debited to the Financing and Investment Income and Expenditure line in the Comprehensive Income and Expenditure Statement).
Property, Plant and Equipment recognised under finance leases is accounted for using the policies applied generally to such assets, subject to depreciation being charged over the lease term if this is shorter than the asset‟s estimated useful life (where ownership of the asset does not transfer to the Council at the end of the lease period). The Council is not required to raise council tax to cover depreciation, revaluation losses and impairments arising from leased assets. Instead, a prudent annual contribution is made from revenue funds towards the deemed capital investment in accordance with statutory requirements. Depreciation, revaluation losses and impairments are therefore substituted by a revenue contribution in the General Fund Balance, by way of an adjusting transaction with the Capital Adjustment Account in the Movement in Reserves Statement for the difference between the two. Operating Leases
Rentals paid under operating leases are charged to the Comprehensive Income and Expenditure Statement as an expense of the services benefitting from use of the leased property, plant or equipment. Charges are made on a straight-line basis over the life of the lease even if this does not match the pattern of payments e.g. there is a rent-free period at the commencement of the lease.
The Council as Lessor
Finance Leases
Where the Council grants a finance lease over a property or an item of plant or equipment, the relevant asset is written out of the Balance Sheet as a disposal. At the commencement of the lease, the carrying amount of the asset in the Balance Sheet (whether Property, Plant and Equipment or Assets Held for Sale) is written off to the Other Operating Expenditure line in the Comprehensive Income and Expenditure Statement as part of the gain or loss on disposal. A gain, representing the Council‟s net investment in the lease, is also credited to the same line in the Comprehensive Income and Expenditure Statement as part of the gain or loss on disposal i.e. netted off against the carrying value of the asset at the time of disposal, matched by a lease asset, a long-term debtor, in the Balance Sheet.
Lease rentals receivable are apportioned between:
a charge for the acquisition of the interest in the property: applied to write down the lease debtor together with any premiums received; and
finance income: credited to the Financing and Investment Income and Expenditure line in the Comprehensive Income and Expenditure Statement.
The gain credited to the Comprehensive Income and Expenditure Statement on disposal is not permitted by statute to increase the General Fund Balance and is required to be treated as a capital receipt. Where a premium has been received, this is posted out of the General Fund Balance to the Capital Receipts Reserve in the Movement in Reserves Statement. Where the amount due in relation to the lease asset is to be settled by the payment of rentals in future financial years, this is posted out of the General Fund Balance to the Deferred Capital Receipts Reserve in the Movement in Reserves Statement. When the future rentals are received, the element for the capital receipt relate to the disposal of the asset is used to write down the lease

45
debtor. At this point, the deferred capital receipts are transferred to the Capital Receipts Reserve. The written-off value of disposals is not a charge against council tax, as the cost of fixed assets is fully provided for under separate arrangements for capital financing. Amounts are therefore appropriated to the Capital Adjustment Account from the General Fund Balance in the Movement in Reserves Statement. Operating Leases Where the Council grants an operating lease over a property or an item of plant or equipment, the asset is retained in the Balance Sheet. Rental income is credited to the Other Operating Expenditure line in the Comprehensive Income and Expenditure Statement. Credits are made on a straight-line basis over the life of the lease, even if this does not match the pattern of payments e.g. there is a premium paid at the commencement of the lease. Initial direct costs incurred in negotiating and arranging the lease are added to the carrying amount of the relevant asset and charged as an expense over the lease term on the same basis as rental income. xv. Overheads and Support Services The costs of overheads and support services are charged to those that benefit from the supply or service in accordance with the costing principles of the BVACOP. The total absorption costing principle is used: the full cost of overheads and support services are shared between users in proportion to the benefits received, with the exception of:
Corporate and Democratic Core: costs relating to the Council‟s status as a multi-functional, democratic organisation.
Non Distributed Costs: the cost of discretionary benefits awarded to employees retiring early and impairment losses chargeable on Assets Held for Sale.
These two cost categories are defined in the BVACOP and accounted for as separate headings in the Comprehensive Income and Expenditure Statement, as part of Net Expenditure on Continuing Services. xvi. Property, Plant and Equipment Non-current assets that have physical substance and are held for use in the production or supply of goods or services, or for administrative purposes and that are expected to be used for more than one financial year are classified as Property, Plant and Equipment. Recognition Expenditure on the acquisition, creation or enhancement of Property, Plant and Equipment is capitalised on an accruals basis, provided that it is probable that the future economic benefits or service potential associated with the item will flow to the Council and that the cost of the item can be measured reliably. Expenditure that maintains but does not add to an asset‟s potential to deliver future economic benefits or service potential i.e. repairs and maintenance, is charged as an expense when it is incurred.

46
Measurement Assets are initially measured at cost, comprising:
the purchase price; and
any costs attributable to bringing the asset to the location and condition necessary for it to be capable of operating in the manner intended.
The Council capitalises borrowing costs incurred whilst assets are under construction. The Council does not capitalise aggregate expenditure of less than £10,000 in any given year for a given asset unless expenditure is expected to exceed £10,000 during the life of a project. The cost of assets acquired other than by purchase is deemed to be its fair value, unless the acquisition does not have commercial substance. Where an asset is acquired via an exchange, the cost of the acquisition is the carrying amount of the asset given up by the Council. Assets are then carried in the Balance Sheet using the following measurement bases:
Community assets and assets under construction: historic cost.
Infrastructure: depreciated historical cost.
Dwellings: fair value, determined using the basis of existing use value for social housing (EUV-SH).
All other assets: fair value, determined as the amount that would be paid for the asset in its existing use („Existing Use Value‟ or EUV) except where: the asset is specialised or no market exists for an asset when Depreciated Replacement Cost (DRC) is used as an estimate of fair value; or a non property asset has a short useful life, low value, or both, when depreciated historical cost is used as a proxy for fair value.
Assets included in the Balance Sheet at fair value are revalued sufficiently regularly to ensure that their carrying amount is not materially different from their fair value at the year-end, but as a minimum every five years. Increases in valuations are matched by credits to the Revaluation Reserve to recognise unrealised gains. Exceptionally, gains might be credited to the Comprehensive Income and Expenditure Statement where they arise from the reversal of a loss previously charged to a service.
Revaluation losses for an asset are initially charged to the Revaluation Reserve up to the balance held in the reserve for that asset. Once the balance on the reserve is exhausted or where no balance existed, the revaluation loss is charged to the appropriate service line in the Comprehensive Income and Expenditure Statement.
The Revaluation Reserve contains revaluation gains recognised since 1 April 2007 only, the date of its formal implementation. Gains arising before that date have been consolidated into the Capital Adjustment Account. Where a revaluation loss previously recognised in the Comprehensive Income and Expenditure Statement is reversed, the reversal is credited to the relevant service line(s) in the Comprehensive Income and Expenditure Statement, up to the amount of the original loss, adjusted for depreciation that would have been charged if the loss had not been recognised.

47
Impairment Where there are indications that an asset may have been impaired and the potential value of an asset reduced, the recoverable amount of the asset is estimated and where this is less than the carrying amount of the asset, an impairment loss is recognised for the shortfall. Impairments are initially charged to the Revaluation Reserve up to the balance held in the reserve for that asset. Once the balance on the reserve is exhausted or where no balance existed, the impairment is charged to the appropriate service line in the Comprehensive Income and Expenditure Statement. Where an impairment previously recognised in the Comprehensive Income and Expenditure Statement is reversed, the reversal is credited to the relevant service line(s) in the Comprehensive Income and Expenditure Statement, up to the amount of the original loss, adjusted for depreciation that would have been charged if the loss had not been recognised. Depreciation Depreciation is charged on: dwellings; other buildings; vehicles, equipment, plant and furniture; and infrastructure assets. Assets without a determinable finite useful life e.g. freehold land and Community Assets, and assets that are not yet available for use i.e. assets under construction, are not depreciated. Depreciation is calculated on the following bases:
Dwellings: in line with Government guidance, the Major Repairs Allowance is used as a proxy for depreciation and componentisation.
Other land and buildings: buildings are depreciated on a straight-line basis over the estimated useful life of the property.
Vehicles, plant, furniture and equipment: straight-line over the anticipated useful life of the asset.
Infrastructure: straight-line allocation over the anticipated useful life of the asset.
For all assets re-valued from 1 April 2010, subject to a de minimis threshold of £1 million for the total value of the whole asset, the Council will hold and separately depreciate components, up to a maximum number of five per asset, that meet the following criteria:
are worth at least 10 per cent of the total value of the asset (a de minimis threshold of £0.5 million for any individual component); and
have a significantly shorter life, defined as less than two thirds of the current life of the whole asset.
Revaluation gains are also depreciated by an amount equal to the difference between the current depreciation charged and the depreciation that would have been chargeable based on the historic cost of the assets. The difference is transferred each year from the Revaluation Reserve to the Capital Adjustment Account. Disposals and Non-current Assets Held for Sale When it becomes probable that the carrying amount of an asset will be recovered principally through its sale transaction rather than through its continuing use, it is reclassified as an Asset

48
Held for Sale if the criteria set out in the Code are met. The asset is revalued immediately prior to reclassification and then carried at the lower of this amount and fair value less costs to sell. Where there is a subsequent decrease to fair value less costs to sell, the loss is posted to the Other Operating Expenditure line in the Comprehensive Income and Expenditure Statement. Gains in fair value are recognised only up to the amount of any previously losses recognised in the Surplus or Deficit on Provision of Services. Depreciation is not charged on Assets Held for Sale. If assets no longer meet the criteria to be classified as Assets Held for Sale, they are reclassified back to non-current assets and valued at the lower of their carrying amount before they were classified as held for sale, adjusted for depreciation, amortisation or revaluations that would have been recognised had they not been classified as Held for Sale, and their recoverable amount at the date of the decision not to sell. Assets that are to be abandoned or scrapped are not reclassified as Assets Held for Sale. When an asset is disposed of or decommissioned, the carrying amount of the asset in the Balance Sheet (whether Property, Plant and Equipment or Assets Held for Sale) is written off to the Other Operating Expenditure line in the Comprehensive Income and Expenditure Statement as part of the gain or loss on disposal. Receipts from disposals (if any) are also credited to the same line in the Comprehensive Income and Expenditure Statement as part of the gain or loss on disposal i.e. netted off against the carrying value of the asset at the time of disposal. Any revaluation gains accumulated for the asset in the Revaluation Reserve are transferred to the Capital Adjustment Account. Amounts received for a disposal in excess of £10,000 are categorised as capital receipts. A proportion of receipts relating to housing disposals (75 per cent for dwellings, 50 per cent for land and other assets, net of statutory deductions and allowances) is payable to the Government. The balance of receipts is required to be credited to the Capital Receipts Reserve and can then only be used for new capital investment or set aside to reduce the Council‟s underlying need to borrow (the „Capital Financing Requirement‟). Receipts are appropriated to the reserve from the General Fund Balance in the Movement in Reserves Statement. The written-off value of disposals is not a charge against council tax, as the cost of fixed assets is fully provided for under separate arrangements for capital financing. Amounts are appropriated to the Capital Adjustment Account from the General Fund Balance in the Movement in Reserves Statement. xvii. Provisions, Contingent Liabilities and Contingent Assets Provisions Provisions are made where an event has taken place that gives the Council a legal or constructive obligation that probably requires settlement by a transfer of economic benefits or service potential, and a reliable estimate of the amount of the obligation can be made. For instance, the Council may be involved in a court case that could eventually result in settlement or the payment of compensation. Provisions are charged as an expense to the appropriate service line in the Comprehensive Income and Expenditure Statement in the year that the Council becomes aware of the obligation at the Balance Sheet date. They are measured at the best estimate of the

49
expenditure required to settle the obligation, taking into account the relevant risks and uncertainties. When payments are eventually made, they are charged to the provision carried in the Balance Sheet. Estimated settlements are reviewed at the end of each financial year. Where it becomes less than probable that a transfer of economic benefits will be required or a lower settlement than anticipated is made, the provision is reversed and credited back to the relevant service. Where some or all of the payment required to settle a provision is expected to be recovered from another party e.g. from an insurance claim, this is only recognised as income for the relevant service if it is virtually certain that reimbursement will be received if the Council settles the obligation. Contingent Liabilities A contingent liability arises where an event has taken place that gives the Council a possible obligation whose existence will only be confirmed by the occurrence or otherwise of uncertain future events not wholly within the control of the Council. Contingent liabilities also arise in circumstances where a provision would otherwise be made, but either it is not probable that an outflow of resources will be required or the amount of the obligation cannot be measured reliably. Contingent liabilities are not recognised in the Balance Sheet, but disclosed in a note to the accounts. Contingent Assets A contingent asset arises where an event has taken place that gives the Council a possible asset whose existence will only be confirmed by the occurrence or otherwise of uncertain future events not wholly within the control of the Council. Contingent assets are not recognised in the Balance Sheet, but disclosed in a note to the accounts where it is probable that there will be an inflow of economic benefits or service potential. xviii. Reserves The Council sets aside specific amounts as reserves for future policy purposes or to cover contingencies. Reserves are created by appropriating amounts out of the General Fund Balance in the Movement in Reserves Statement. When expenditure to be financed from a reserve is incurred, it is charged to the appropriate service in that year against the Surplus or Deficit on the Provision of Services in the Comprehensive Income and Expenditure Statement. The reserve is then appropriated back into the General Fund Balance in the Movement in Reserves Statement so that there is no net charge against council tax for the expenditure. Certain reserves are kept to manage the accounting processes for non-current assets, financial instruments, retirement and employee benefits, these do not represent usable resources for the Council. These reserves are explained in the relevant policies and notes.

50
xix. Revenue Expenditure Funded from Capital under Statute Expenditure incurred during the year that may be capitalised under statutory provisions, but does not result in the creation of a non-current asset is charged as expenditure to the relevant service in the Comprehensive Income and Expenditure Statement. Where the Council has determined to meet the cost of this expenditure from existing capital resources or by borrowing, a transfer in the Movement in Reserves Statement from the General Fund Balance to the Capital Adjustment Account then transfer out the amounts charged so that there is no impact on the level of council tax. xx. VAT VAT payable is included as an expense only to the extent that it is not recoverable from Her Majesty‟s Revenue and Customs. VAT receivable is excluded from income. xxi. Collection Fund The accounting framework recognises an agent/principal relationship with regard to the Collection Fund. The Council is recognised as an agent, collecting NNDR on behalf of the Government. In addition, relevant shares of the assets and liabilities of the Collection Fund have been devolved to precepting bodies; in the Council‟s case, the Greater London Authority. Heritage Assets: The Code of Practice on Local Authority Accounting (the Code) mandates that from 2011-12 „Heritage Assets‟ will be recognised as a separate class of non-current asset. International Financial Reporting Standards contain no provision, standard or guidance relating to heritage assets and therefore the requirements of Financial Reporting Standard 30 (FRS 30) must be adhered to. FRS 30 is issued as part of UK Generally Accepted Accounting Principles. FRS 30 and the Code state that a heritage asset is an asset:
“...with historical, artistic, scientific, technological, geophysical or environmental qualities that is held and maintained principally for its contribution to knowledge and culture.” Heritage assets can be both tangible and intangible. It is implicit that a heritage asset is intended to be preserved in trust for future generations. Whereas the Council holds its parks and cemeteries in trust for future generations and manages these assets accordingly, the Code precludes such community assets being classified as heritage assets because these are deemed by the Code to be primarily for “current use” irrespective of the Council's intent. Heritage assets therefore comprise assets such as historic buildings, civic regalia, works of art and museum collections. The Council has three historic buildings that could potentially be classified heritage assets pending further guidance. These are:
Holland House
2. Accounting Standards Issued not Adopted nces

51
Leighton House
Linley Samborne House Paragraph 4.10.2.7 of the 2011-12 Code states:
“Operational heritage assets (i.e. those that, in addition to being held for their heritage characteristics, are also used by the authority for other activities or to provide other services) shall be accounted for as operational assets and shall be valued in the same way as other assets of that general type (buildings, for example).” Therefore, these assets should not be classified as heritage assets because Leighton House and Linley Samborne House are museums and Holland House is used to deliver Opera Holland Park. However, Leighton House and Linley Samborne House are museums due to their historical importance. Further guidance may clarify the meaning of “other use”. FRS 30 permits any “reasonable” valuation method to be adopted for heritage assets. Were these assets to be classified as heritage assets, the Council would use the same valuation methodology as for operational buildings i.e. existing use valuation, because this method is robust. Leighton House and Linley Samborne House are currently valued on this basis and are on the Balance Sheet within the Property, Plant and Equipment section of Non-current Assets. Thus reclassification would have no material impact on the Council‟s financial statements. Were the classification of Holland House to change, it is not possible to quantify or estimate the effect on depreciation and the Revaluation Reserve of this, but such a change would not be material. The Council owns civic regalia, some artworks, collections of printed works and the contents of both Leighton House and Linley Samborne House. The Council currently has seven artworks on its balance sheet, which will be classified as heritage assets. Reclassification will have no impact other than the £534,000 book value of these assets will move between Community Assets and Heritage Assets. The artworks have indeterminate lives and high residual values, therefore no depreciation will occur due to reclassification. All other regalia, artworks, collections and museum contents will not be brought onto the balance sheet as heritage assets:
The assets are held in trust either in form or substance and cannot be sold. Therefore, they have no realisable value.
They mostly have indeterminate lives and therefore no material depreciation charge would result from the assets being brought onto the balance sheet.
In light of the above and strained public finances, the Council believes that the cost of obtaining valuations would be disproportionate and provide information that is of no practical use either to the Council or potential user of the accounts. Such an exemption is permitted by the Code.
Community Assets: The adoption of FRS 30 by the Code permits the Council the option to extend the requirements of FRS 30, as set out above, to Community Assets. The Council is not minded to take up this option because it believes that there are no benefits from doing so.

52
In applying the accounting policies set out on Note 1, the Council has had to make certain judgements about future events. The critical judgements made in the accounts are:
There is a high degree of uncertainty concerning future funding for local government. The Council believes that this uncertainty is neither sufficient nor significant enough in its likely impact to warrant impairment of assets due to reduced levels of service provision or a need to close facilities. Furthermore, property prices in the Royal Borough are such that any asset the Council deems surplus is unlikely to be disposed of for less than its current fair value.
The Council is entering into joint working arrangements with neighbouring local authorities, the City of Westminster and the London Borough of Hammersmith and Fulham. These arrangements are currently referred to as „tri-borough working‟. Current proposals will not reduce the level of service provided by the Council and plans to align systems are not yet fully developed. Therefore, the Council believes that it is not necessary to impair any non-current asset in light of tri-borough working.
The Council has reduced the size of its workforce. The level of local government funding and further tri-borough working may require further reductions in the size of the workforce. The Council funds redundancies initially through any under-spending and thereafter from the Severance Reserve. The Council does not believe that measures beyond those taken thus far, for example a contribution to the Severance Reserve shown in this Statement of Accounts, are necessary because adequate provision has been made to fund likely workforce reductions and reductions beyond these are sufficiently uncertain that no further provision is warranted at this time.
3. Critical Judgements in Applying Accounting Policies
nces

53
The Statement of Accounts contains estimated figures that are based on assumptions made by the Council about the future or that are otherwise uncertain. Estimates are made taking into account historical experience, current trends and other relevant factors. However, because balances cannot be determined with certainty, actual results could be materially different from the assumptions and estimates. The items in the Council‟s Balance Sheet at 31 March 2011 for which there is a significant risk of material adjustment in the forthcoming financial year are as follows:
Item Uncertainties Effect if Actual Results Differ from Assumptions
Non-current Assets / Investment Properties
Asset valuations are based on market prices and are periodically reviewed to ensure that the Council does not materially misstate its non-current assets and investment properties. During the past financial year, the property market in the Royal Borough appeared to grow slowly, but the number and relevance of asset sales against which the Council could judge the fair value of its property assets was low. Therefore, the Council judged that no alteration to the estimates that underpin the valuation of its properties and dwellings was required at year end. Should evidence emerge in 2011-12 that causes the Council to amend these estimates, the estimated fair value of its property and dwellings could change.
A reduction in estimated valuations would result in reductions to the Revaluation Reserve and / or a loss recorded as appropriate in the Comprehensive Income and Expenditure Statement. For example, a 10 per cent reduction in the value of the Council's investment properties would result in a £14.5 million charge to the Comprehensive Income and Expenditure Statement. Conversely, an increase in value would result in increases to the Revaluation Reserve and / or reversals of previous negative revaluations to the Comprehensive Income and Expenditure Statement and / or gains being recorded as appropriate in the Comprehensive Income and Expenditure Statement. Depreciation charges for operational buildings will change in direct proportion to the change in estimated fair value. The net book value of non-current assets subject to potential revaluation is £1.3 billion.
4. Assumptions Made about the Future and Other Major Sources of Estimation Uncertainty
nces

54
Item Uncertainties Effect if Actual Results Differ from Assumptions
Pensions Liability
Estimation of the net liability to pay pensions depends on a number of complex estimates relating to, amongst others, the discount rate used, the rate at which salaries are projected to increase, changes in retirement age, mortality rates and expected returns on pension fund assets. Consulting actuaries provide advice concerning these estimates.
The effect of changes in these estimates on the net pension liability of the Council can be measured, but are complex and interact in a complex manner. The Council is reliant on the advice of its actuaries regarding estimates and the calculations of their effects. For example, changes in estimates, such as the measure of inflation and rate of inflation, could either reduce or increase the net pensions liability. The Council‟s gross pensions liability is £604 million and therefore a 10 per cent change would be £60 million. However, unless all other factors held constant, a change in the gross pensions liability does not affect the Comprehensive Income and Expenditure Statement on a pound for pound basis. The Council‟s net pensions liability is £154 million and thus a 10 per cent change in the net liability is £15.4 million.
In 2010-11 the Government announced that it plans to increase future pensions in line with the Consumer Prices Index (CPI) rather than the Retail Prices Index (RPI). This change has resulted in a reduction of past service pension costs of £61.19 million. This has been recognised within non-distributed costs in the Comprehensive Income and Expenditure Statement in accordance with BVACOP. In 2009-10, the Council sold a parcel of land near Holland Park School to fund the rebuilding of the school. This resulted in a gain of £83.93 million.
The Council‟s wholly owned trading company, Chelsea Care Limited, was placed in voluntary liquidation in May 2011. The Council has invested £300,000 which will be written off to the Comprehensive Income and Expenditure Statement during 2011-12.
The following tables detail the adjustments that are made to the total comprehensive income and expenditure recognised by the Council in the year in accordance with proper accounting practice to the resources that are specified by statutory provisions as being available to the Council to meet future capital and revenue expenditure.
5. Material Items of Income and Expense
nces
6. Events After the Balance Sheet Date
nces
7. Adjustments between Accounting Basis and Funding Basis under Regulations
nces

55
Movement on Usable Reserves 2009-10 General
Fund
Balance
Earmarked
Reserves
Housing
Revenue
Account
Major
Repairs
Reserve
Capital
Receipts
Reserves
Capital
Grants
Unapplied
Schools
Reserves
London
Residuary
Body
Total
Usable
Reserves
£'000 £'000 £'000 £'000 £'000 £'000 £'000 £'000 £'000
Balance at 31 March 2009 (16,510) (165,227) (9,372) (6,242) (2,757) 0 (4,921) (4,519) (209,548)
Surplus or (deficit) on provision of services (97,601) - 12,916 - - - - 213 (84,472)
Other Comprehensive Expenditure and Income - - - - - - - - -
Total Comprehensive Expenditure and Income (97,601) - 12,916 - - - - 213 (84,472)
Adjustments between accounting basis & funding basis under regulations
Reversal of items debited or credited to CIES
Depreciation of Tangible Fixed Assets (7,670) - - - - - - - (7,670)
Amortisation of Intangible Fixed Assets (248) - - - - - - - (248)
HRA Depreciation/amortisation - - (136) - - - - - (136)
Impairment/revaluation losses (charged to I&E) (2,572) - (13,542) - - - - - (16,114)
Capital grant and contributions applied 14,079 - 1,098 - - - - - 15,177
Revenue Expenditure Funded from Capital under Statute (11,252) - (1,098) - - - - - (12,350)
Movement in market value of investment property 22,659 - - - - - - - 22,659
Non current assets written out on disposal to the CIES (20,919) - - - - - - - (20,919)
Transfer of sale proceeds credited as part of the gain/loss on disposal to the CIES 96,832 - - - (12,842) - - - 83,990
Use of capital receipts reserve to finance capital expenditure - - - - 3,732 - - - 3,732
Reversal of items relating to retirement benefits (IAS19) (20,468) - - - - - - - (20,468)
Employer's Pension Contributions 20,822 - - - - - - - 20,822
Amount by which council tax income adjustment included in the CIES is different from
the amount taken to the General Fund in accordance with regulation (90) - - - - - - - (90)
Amount by which officer remuneration charged to the CIES on an accruals basis is
different from remuneration chargeable in accordance with statutory requirements (378) - - - - - - - (378)
Insertion of items not debited or credited to CIES
Statutory Provision for the repayment of debt - (Minimum revenue provision) 1,278 - - - - - - - 1,278
Statutory Repayment of Debt (Finance Lease Liabilities) 101 - - - - - - - 101
Voluntary provision above MRP 619 - - - - - - - 619
Contribution to disposal costs of capital sales (224) - - - 224 - - - 0
HRA capital receipts to housing central pool (830) - - - 830 - - - 0
Revenue contribution to finance capital 17,371 - 50 - - - - - 17,421
Reversal of Major Repairs Allowance credited to the HRA - - - (6,623) - - - - (6,623)
Use of the Major Repairs Reserve to finance new capital expenditure - - - 10,699 - - - - 10,699
TOTAL Adj between accounting basis & funding basis under regulations 109,108 - (13,628) 4,076 (8,055) - - - 91,501
Net Increase/Decrease before Transfers to Earmarked Reserves 11,507 - (712) 4,076 (8,055) - - 213 7,029
Transfers to/from earmarked reserves (See Note 8) (4,996) 5,635 (511) - - - (66) - 61
Increase/Decrease (movement) in Year 6,510 5,635 (1,223) 4,076 (8,055) - (66) 213 7,090
Balance at 31 March 2010 carried forward (10,000) (159,592) (10,595) (2,166) (10,812) - (4,987) (4,306) (202,458)

56
Movement on Usable Reserves 2010-11 General
Fund
Balance
Earmarked
Reserves
Housing
Revenue
Account
Major
Repairs
Reserve
Capital
Receipts
Reserves
Capital
Grants
Unapplied
Schools
Reserves
London
Residuary
Body
Total
Usable
Reserves
£'000 £'000 £'000 £'000 £'000 £'000 £'000 £'000 £'000
Balance at 01 April 2010 (10,000) (159,592) (10,595) (2,166) (10,812) - (4,987) (4,306) (202,458)
Surplus or (deficit) on provision of services (62,002) - 33,583 - - - - 7 (28,413)
Other Comprehensive Expenditure and Income: - - - - - - - - -
Total Comprehensive Expenditure and Income (62,002) - 33,583 - - - - 7 (28,413)
Adjustments between accounting basis & funding basis under regulations
Reversal of items debited or credited to CIES
Depreciation of Tangible Fixed Assets (excl HRA depn) (9,064) - - - - - - - (9,064)
Amortisation of Intangible Fixed Assets (excl HRA depn) (393) - - - - - - - (393)
HRA Depreciation/amortisation - - (179) - - - - - (179)
Impairment/revaluation losses (charged to I&E) (1,683) - (37,427) - - - - - (39,110)
Capital grant and contributions applied 13,923 - 1,954 - - - - - 15,877
Revenue Expenditure Funded from Capital under Statute (England and Wales) (7,351) - - - - - - - (7,351)
Non current assets written out on disposal to the CIES (6,951) - - - - - - - (6,951)
Capital grant and contributions unapplied credited to I&E 1,118 - - - - (1,118) - - 0
Transfer of sale proceeds credited as part of the gain/loss on disposal to the CIES 3,638 - - - (3,638) - - - 0
Use of capital receipts reserve to finance capital expenditure - - - - 8,600 - - - 8,600
Reversal of items relating to retirement benefits (IAS19) 26,775 - - - - - - - 26,775
Employer's Pension Contributions 20,789 20,789
Amount by which council tax income and residual community charge adjustment
included in the Comprehensive Income and Expenditure Statement is different from the
amount taken to the General Fund in accordance with regulation (69) - - - - - - - (69)
Amount by which officer remuneration charged to the CIES on an accruals basis is
different from remuneration chargeable in the year in accordance with statutory
requirements 160 - - - - - - - 160
Insertion of items not debited or credited to CIES
Statutory Provision for the repayment of debt - (Minimum revenue provision) 1,222 - - - - - - - 1,222
Statutory Repayment of Debt (Finance Lease Liabilities) 122 - - - - - - - 122
Voluntary provision above MRP 284 - - - - - - - 284
Contribution to disposal costs of capital sales (215) - - - 215 - - - 0
HRA capital receipts to housing central pool (1,449) - - - 1,449 - - - 0
Revenue contribution to finance capital 14,130 - 50 - - - - - 14,180
Reversal of Major Repairs Allowance credited to the HRA - - - (6,834) - - - - (6,834)
Use of the Major Repairs Reserve to finance new capital expenditure - - - 6,539 - - - - 6,539
TOTAL Adj between accounting basis & funding basis under regulations 54,986 - (35,602) (295) 6,626 (1,118) - - 24,597
Net Increase/Decrease before Transfers to Earmarked Reserves (7,016) - (2,019) (295) 6,626 (1,118) - 7 (3,815)
Transfers to/from earmarked reserves (See Note 8) 7,016 (3,830) 793 833- - - (2,901) - 245
Increase/Decrease (movement) in Year 0 (3,830) (1,226) (1,128) 6,626 (1,118) (2,901) 7 (3,570)
Balance at 31 March 2011 carried forward (10,000) (163,422) (11,821) (3,293) (4,186) (1,118) (7,888) (4,299) (206,028)
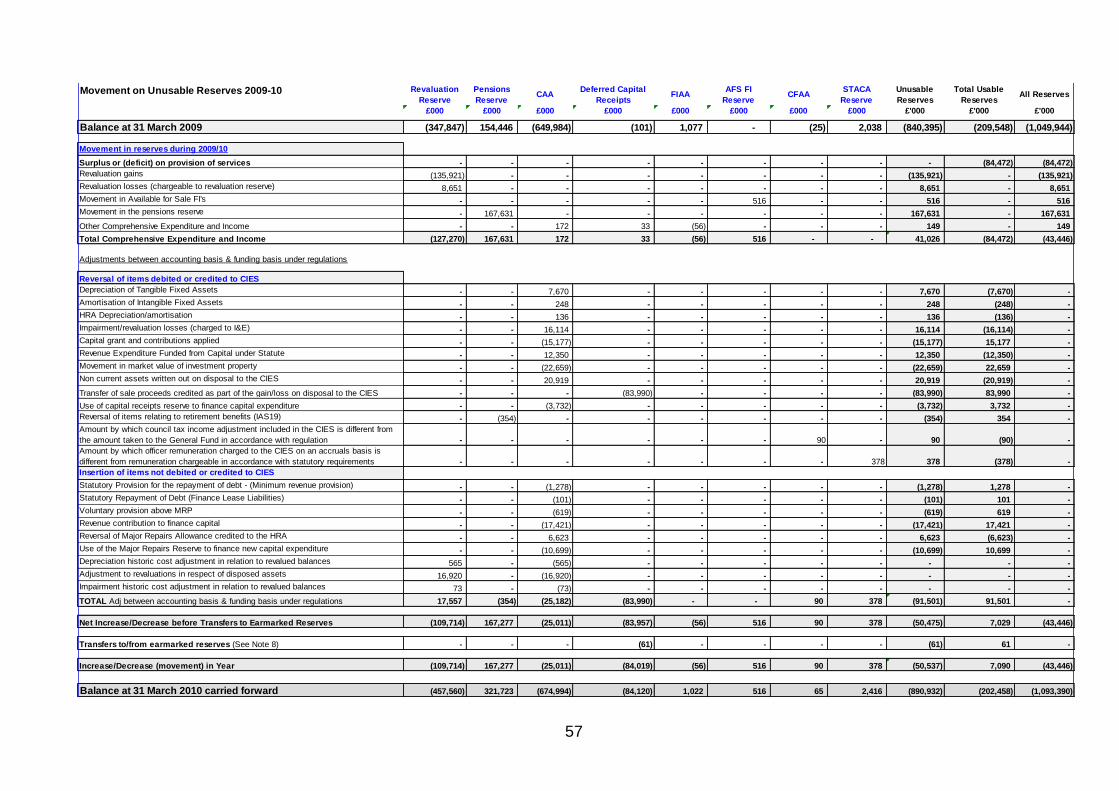
57
Movement on Unusable Reserves 2009-10 Revaluation
Reserve
Pensions
ReserveCAA
Deferred Capital
ReceiptsFIAA
AFS FI
ReserveCFAA
STACA
Reserve
Unusable
Reserves
Total Usable
ReservesAll Reserves
£000 £000 £000 £000 £000 £000 £000 £000 £'000 £'000 £'000
Balance at 31 March 2009 (347,847) 154,446 (649,984) (101) 1,077 - (25) 2,038 (840,395) (209,548) (1,049,944)
Movement in reserves during 2009/10
Surplus or (deficit) on provision of services - - - - - - - - - (84,472) (84,472)
Revaluation gains (135,921) - - - - - - - (135,921) - (135,921)
Revaluation losses (chargeable to revaluation reserve) 8,651 - - - - - - - 8,651 - 8,651
Movement in Available for Sale FI's - - - - - 516 - - 516 - 516
Movement in the pensions reserve - 167,631 - - - - - - 167,631 - 167,631
Other Comprehensive Expenditure and Income - - 172 33 (56) - - - 149 - 149
Total Comprehensive Expenditure and Income (127,270) 167,631 172 33 (56) 516 - - 41,026 (84,472) (43,446)
Adjustments between accounting basis & funding basis under regulations
Reversal of items debited or credited to CIES
Depreciation of Tangible Fixed Assets - - 7,670 - - - - - 7,670 (7,670) -
Amortisation of Intangible Fixed Assets - - 248 - - - - - 248 (248) -
HRA Depreciation/amortisation - - 136 - - - - - 136 (136) -
Impairment/revaluation losses (charged to I&E) - - 16,114 - - - - - 16,114 (16,114) -
Capital grant and contributions applied - - (15,177) - - - - - (15,177) 15,177 -
Revenue Expenditure Funded from Capital under Statute - - 12,350 - - - - - 12,350 (12,350) -
Movement in market value of investment property - - (22,659) - - - - - (22,659) 22,659 -
Non current assets written out on disposal to the CIES - - 20,919 - - - - - 20,919 (20,919) -
Transfer of sale proceeds credited as part of the gain/loss on disposal to the CIES - - - (83,990) - - - - (83,990) 83,990 -
Use of capital receipts reserve to finance capital expenditure - - (3,732) - - - - - (3,732) 3,732 -
Reversal of items relating to retirement benefits (IAS19) - (354) - - - - - - (354) 354 -
Amount by which council tax income adjustment included in the CIES is different from
the amount taken to the General Fund in accordance with regulation - - - - - - 90 - 90 (90) -
Amount by which officer remuneration charged to the CIES on an accruals basis is
different from remuneration chargeable in accordance with statutory requirements - - - - - - - 378 378 (378) -
Insertion of items not debited or credited to CIES
Statutory Provision for the repayment of debt - (Minimum revenue provision) - - (1,278) - - - - - (1,278) 1,278 -
Statutory Repayment of Debt (Finance Lease Liabilities) - - (101) - - - - - (101) 101 -
Voluntary provision above MRP - - (619) - - - - - (619) 619 -
Revenue contribution to finance capital - - (17,421) - - - - - (17,421) 17,421 -
Reversal of Major Repairs Allowance credited to the HRA - - 6,623 - - - - - 6,623 (6,623) -
Use of the Major Repairs Reserve to finance new capital expenditure - - (10,699) - - - - - (10,699) 10,699 -
Depreciation historic cost adjustment in relation to revalued balances 565 - (565) - - - - - - - -
Adjustment to revaluations in respect of disposed assets 16,920 - (16,920) - - - - - - - -
Impairment historic cost adjustment in relation to revalued balances 73 - (73) - - - - - - - -
TOTAL Adj between accounting basis & funding basis under regulations 17,557 (354) (25,182) (83,990) - - 90 378 (91,501) 91,501 -
Net Increase/Decrease before Transfers to Earmarked Reserves (109,714) 167,277 (25,011) (83,957) (56) 516 90 378 (50,475) 7,029 (43,446)
Transfers to/from earmarked reserves (See Note 8) - - - (61) - - - - (61) 61 -
Increase/Decrease (movement) in Year (109,714) 167,277 (25,011) (84,019) (56) 516 90 378 (50,537) 7,090 (43,446)
Balance at 31 March 2010 carried forward (457,560) 321,723 (674,994) (84,120) 1,022 516 65 2,416 (890,932) (202,458) (1,093,390)

58
Movement on Unusable Reserves 2010-11 Revaluation
Reserve
Pensions
ReserveCAA
Deferred Capital
ReceiptsFIAA
AFS FI
ReserveCFAA
STACA
Reserve
Unusable
Reserves
Total Usable
ReservesAll Reserves
£000 £000 £000 £000 £000 £000 £000 £000 £'000 £'000 £'000
Balance at 01 April 2010 (457,560) 321,723 (674,994) (84,120) 1,022 516 65 2,416 (890,932) (202,458) (1,093,390)
Movement in reserves during 2010/11
Surplus or (deficit) on provision of services - - - - - - - - - (28,413) (28,413)
Revaluation gains (73,800) - - - - - - - (73,800) - (73,800)
Revaluation losses (chargeable to revaluation reserve) 31,229 - - - - - - - 31,229 - 31,229
Movement in Available for Sale FI's - - - - - 84 - - 84 - 84
Movement in the pensions reserve - (120,409) - - - - - - (120,409) - (120,409)
Other Comprehensive Expenditure and Income: - - - 16 (56) - - - (40) - (40)
Total Comprehensive Expenditure and Income (42,571) (120,409) - 16 (56) 84 - - (162,935) (28,413) (191,348)
Adjustments between accounting basis & funding basis under regulations
Reversal of items debited or credited to CIES
Depreciation of Tangible Fixed Assets - - 9,064 - - - - - 9,064 (9,064) -
Amortisation of Intangible Fixed Assets - - 393 - - - - - 393 (393) -
HRA Depreciation/amortisation - - 179 - - - - - 179 (179) -
Impairment/revaluation losses (charged to I&E) - - 39,110 - - - - - 39,110 (39,110) -
Capital grant and contributions applied - - (15,877) - - - - - (15,877) 15,877 -
Revenue Expenditure Funded from Capital under Statute - - 7,351 - - - - - 7,351 (7,351) -
Non current assets written out on disposal to the CIES - - 6,951 - - - - - 6,951 (6,951) -
Use of capital receipts reserve to finance capital expenditure - - (8,600) - - - - - (8,600) 8,600 -
Reversal of items relating to retirement benefits - (47,564) - - - - - - (47,564) 47,564 -
Amount by which council tax income adjustment included in the CIES is different from
the amount taken to the General Fund in accordance with regulation - - - - - - 69 - 69 (69) -
Amount by which officer remuneration charged to the CIES on an accruals basis is
different from remuneration chargeable in accordance with statutory requirements - - - - - - - (160) (160) 160 -
Insertion of items not debited or credited to CIES
Statutory Provision for the repayment of debt - (Minimum revenue provision) - - (1,222) - - - - - (1,222) 1,222 -
Statutory Repayment of Debt (Finance Lease Liabilities) - - (122) - - - - - (122) 122 -
Voluntary provision above MRP - - (284) - - - - - (284) 284 -
Revenue contribution to finance capital - - (14,180) - - - - - (14,180) 14,180 -
Reversal of Major Repairs Allowance credited to the HRA - - 6,834 - - - - - 6,834 (6,834) -
Use of the Major Repairs Reserve to finance new capital expenditure - - (6,539) - - - - - (6,539) 6,539 -
Depreciation historic cost adjustment in relation to revalued balances 498 - (498) - - - - - - - -
Adjustment to revaluations in respect of disposed assets 800 - (800) - - - - - - - -
TOTAL Adj between accounting basis & funding basis under regulations 1,298 (47,564) 21,761 - - - 69 (160) (24,597) 24,597 -
Net Increase/Decrease before Transfers to Earmarked Reserves (41,273) (167,973) 21,761 16 (56) 84 69 (160) (187,532) (3,815) (191,348)
Transfers to/from earmarked reserves (See Note 8) - - - (245) - - - - (245) 245 -
Increase/Decrease (movement) in Year (41,273) (167,973) 21,761 (229) (56) 84 69 (160) (187,778) (3,570) (191,348)
Balance at 31 March 2011 carried forward (498,834) 153,750 (653,234) (84,349) 966 601 133 2,257 (1,078,710) (206,028) (1,284,738)

59
This note summarises the Council‟s usable reserves. It sets out the amounts set aside from the General Fund and HRA balances in earmarked reserves to provide financing for future expenditure plans and the amounts posted back from earmarked reserves to meet General Fund and HRA expenditure. A description of the purpose of the earmarked reserves has been provided in the glossary. The Council has two capital reserves: the Usable Capital Receipts Reserve and the Capital Grants Unapplied Account. These two reserves totalled £5.3 million at 31 March 2011. All other reserves are revenue reserves. Capital grants may be applied to certain items of revenue where regulations and statute permit (REFCUS).
8a. Summary of Usable Reserves
1 April ‘09 Transfers
Out 2009-10 Transfers In 2009-10 31 March ’10
Transfers Out 2010-11
Transfers In 2010-11
31 March ‘11
£'000 £'000 £'000 £'000 £'000 £'000 £'000
General Fund 16,510 (6,510) - 10,000 - - 10,000
Earmarked reserves (General Fund) [see 8c] 164,445 (47,225) 42,101 159,322 (38,782) 42,651 163,191
Schools' reserves 4,921 (1,145) 1,211 4,987 (414) 3,315 7,888
London Residuary Body Balance 4,519 (213) - 4,306 (7) - 4,299
Housing Revenue Account 9,372 - 1,223 10,595 - 1,226 11,821
Major Repairs Reserve 6,242 (10,699) 6,623 2,166 (6,539) 7,666 3,293
Earmarked Reserves (HRA) [see 8b] 781 (512) 0 271 (117) 78 230
Usable Capital Receipts Reserve 2,757 (4,786) 12,842 10,812 (10,049) 3,423 4,186
Capital Grants Unapplied 0 0 0 0 0 1,118 1,118
Total Usable Reserves 209,548 -71,090 64,000 202,458 -55,908 59,477 206,028
8b. Transfer to and from HRA Earmarked Reserves
1 April ‘09 Transfers Out
2009-10 Transfers In 2009-10 31 March ‘10
Transfers Out 2010-11
Transfers In 2010-11
31 March ‘11
£'000 £'000 £'000 £'000 £'000 £'000 £'000
HRA Controlled Repairs 258 (156) - 103 - 38 140
HRA Lancaster West Estate Management Board 523 (356) - 168 (117) 40 90
Total HRA Earmarked Reserves 781 (512) 0 271 (117) 78 230
8. Transfers to and from Earmarked Reserves and Usable Reserves
nces

60
8c. Transfer to and from General Fund Earmarked Reserves
1 April ‘09 Transfers Out
2009-10 Transfers In
2009-10 31 March ‘10 Transfers Out
2010-11 Transfers In
2010-11 31 March ‘11 £'000 £'000 £'000 £'000 £'000 £'000 £'000
Adult Social Care Equal Pay 470 (470) - - - - -
Adult Social Care Severance 242 (242) - - - - -
Better City Life 2,224 (61) 300 2,463 (106) 300 2,657
Budget Carry Forward 1,923 (722) 1,656 2,858 (1,964) 3,246 4,140
Building Alterations 290 (290) - - - - -
Capital Expenditure 63,716 (11,281) 11,323 63,758 (10,103) 12,464 66,119
Car Parking 37,687 (27,086) 21,223 31,824 (21,912) 20,206 30,118
Chelsea Academy Co-Sponsorship 1,500 (1,000) - 500 (500) - -
Corporate Information Systems (IS) Initiatives 520 (341) 165 344 (204) 238 378
Cost Reduction (Transformation Fund) 2,942 (941) - 2,001 (714) - 1,287
Demand Growth 5,297 - - 5,297 - - 5,297
Excellence All Round - (133) 3,264 3,131 (412) 553 3,272
General Services Building Maintenance 437 (137) - 300 (294) 246 252
Insurance 6,116 (1,280) - 4,836 (523) - 4,313
Licensing and Planning Costs 250 - - 250 - - 250
Local Elections 200 - 75 275 (222) 75 128
Local Initiatives (Transformation Fund) 4,942 - - 4,942 (290) - 4,652
Property Strategy 1,811 (178) - 1,633 (37) - 1,597
Repairs and Renewals 3,599 (144) 398 3,853 (746) 417 3,525
Risk Management 339 (110) - 229 (58) - 171
Service Risks 4,279 (631) 1,065 4,713 (10) - 4,703
Severance (Transformation Fund) 2,388 (429) 1,126 3,085 - 4,882 7,967
Specific Grant Loss 2,738 (172) - 2,566 - - 2,566
Strategic Regeneration 13,922 (473) 254 13,703 (598) - 13,105
Supporting People 4,597 (1,000) 1,108 4,706 - - 4,706
Value Added Tax (VAT) Liability 1,070 - - 1,070 - - 1,070
Other Earmarked Reserves (<£200k balance) 945 (106) 145 984 (88) 24 920
Total General Fund Earmarked Reserves 164,445 (47,225) 42,101 159,322 (38,782) 42,651 163,191

61
2010-11 2009-10 £’000 £’000
Levies 3,677 3,638 Payments to the Government Housing Capital Receipts Pool 1,450 830 (Gains)/losses on the disposal of non-current assets 3,527 (75,427)
Total 8,654 (70,959)
2010-11 2009-10 £’000 £’000
Interest payable and similar charges 13,954 14,972 Interest Payable on Finance Leases 21 17 Premium on early repayment of debt 56 56 Pensions interest cost 38,328 32,010 Expected return on pensions assets (25,269) (20,181) Interest receivable and similar income (3,848) (1,938) Income and expenditure in relation to investment properties and changes in their fair value
(2,716) (26,428)
Other investment income – (Surplus)/Deficit on Trading Accounts (30) (18)
Total 20,496 (1,510)
2010-11 2009-10 £’000 £’000
Council tax income (78,155) (77,776) Non domestic rates (92,523) (84,824) Non-ring fenced government grants (32,303) (30,027) Capital grants and contributions (16,996) (15,176)
Total (219,977) (207,803)
11. Taxation and Non-Specific Grant Income nces
9. Other Operating Expenditure nces
10. Financing and Investment Income and Expenditure nces

62
12a. Movement on Balances Movements in 2010-11
Council
Dwellings
Other Land and Buildings
Vehicles, Equipment Plant and, Furniture
Infrastructure Assets
Community Assets
Surplus Assets
Assets Under Construction
Total
£’000 £’000 £’000 £’000 £’000 £’000 £’000 £’000
Cost or Valuation
At 1 April 2010 572,236 575,999 14,093 43,600 6,383 0 11,181 1,223,493
Additions 8,742 5,415 1,257 13,224 820 0 13,841 43,298
Revaluation increases / (decreases) and impairments recognised in the Revaluation Reserve
42,571
0
0
0
0
0
0
42,571
Revaluation increases / (decreases) and impairments recognised in the CIES
(28,763) 0 0 0 0 0 0 (28,763)
Transfers in 0 0 0 0 0 0 0 0
Transfers out 0 0 0 0 0 0 0 0
Derecognition - disposals (131) (905) (75) 0 0 0 (5,869) (6,980)
At 31 March 2011 594,656 580,509 15,274 56,824 7,203 0 19,152 1,273,619
Accumulated Depreciation and Impairment
At 1 April 2010
0 0 3,632 11,075 0 0 0 14,707
Depreciation charge 6,834 5,860 1,231 2,148 0 0 0 16,073
Revaluations 0 0 0 0 0 0 0 0
Impairments 8,664 1,683 0 0 0 0 0 10,347
Transfers in 0 0 0 0 0 0 0 0
Transfers out 0 0 0 0 0 0 0 0
Derecognition - disposals 0 0 (29) 0 0 0 0 (29)
At 31 March 2011 15,498 7,543 4,834 13,223 0 0 0 41,097
Net Book value
At 31 March 2011 579,158 572,966 10,441 43,601 7,203 0 19,152 1,232,521
At 31 March 2010 572,236 575,999 10,461 32,525 6,383 0 11,181 1,208,786
12. Property, Plant and Equipment nces

63
Comparative Movements in 2009-10 Council
Dwellings Other
Land and Buildings
Vehicles, Equipment Plant and, Furniture
Infrastructure Assets
Community Assets
Surplus Assets
Assets Under Construction
Total
£’000 £’000 £’000 £’000 £’000 £’000 £’000 £’000
Cost or Valuation
At 1 April 2009 470,153 610,228 11,712 34,295 5,563 0 8,087 1,140,037
Additions 11,350 7,609 2,125 9,355 821 0 3,266 34,526
Revaluation increases / (decreases) and impairments recognised in the Revaluation Reserve
104,424
(18,451)
0
0
0
0
0
85,974
Revaluation increases / (decreases) and impairments recognised in the CIES
(13,691)
(2,837)
0
(50)
0
0
(172)
(16,750)
Transfers in 0 0 304 0 0 0 0 304
Transfers out 0 0 0 0 0 0 0 0
Derecognition - disposals 0 (20,550) (49) 0 0 0 0 (20,599)
Derecognition - other 0 0 0 0 0 0 0 0
At 31 March 2010 572,236 575,999 14,093 43,600 6,383 0 11,181 1,223,492
Accumulated Depreciation and Impairment
At 1 April 2009
24,801 5,205 2,580 9,452 0 0 0 42,039
Depreciation charge 6,623 4,595 1,062 1,648 0 0 0 13,928
Revaluations (31,424) (9,799) 0 0 0 0 0 (41,223)
Impairments 0 0 0 (25) 0 0 0 (25)
Transfers in 0 0 0 0 0 0 0 0
Transfers out 0 0 0 0 0 0 0 0
Derecognition - disposals 0 0 (11) 0 0 0 0 (11)
At 31 March 2010 0 0 3,632 11,075 0 0 0 14,707
Net Book value
At 31 March 2010 572,236 575,999 10,461 32,525 6,383 0 11,181 1,208,786
At 31 March 2009 445,351 605,023 9,132 24,842 5,563 0 8,087 1,097,998

64
12b. Depreciation rates
Council Dwellings: The Major Repairs Allowance, calculated by the Government, has been used as a proxy for depreciation in line with Government guidance. The most recent valuation of the housing stock estimated the remaining useful lives of individual dwellings at between 50 and 100 years. Use of the Major Repairs Allowance in lieu of a calculation based on the estimated useful lives of the dwellings has no material impact on the accounts. Land is not depreciated because it has an indefinite useful life. Other Land and Buildings: With the exception of Holland Park School, which is being rebuilt and is therefore being depreciated over 3.5 years, and the basements at Elm Park Gardens that are not yet available for use and thus are not being depreciated, buildings are depreciated on a straight line basis over their estimated useful lives, generally between 25 and 50 years. Land is not depreciated because it has an indefinite useful life Vehicles, Plant, Furniture & Equipment: Depreciation is calculated on a straight line basis over the anticipated useful life of the asset. Vehicles are normally depreciated over 7 years, furniture: 7 years, plant: between 9 and 30 years and equipment: 3 to 10 years. Infrastructure: Infrastructure is normally on a straight line basis over the anticipated useful life of the asset between 15 and 50 years, normally 21 years. 12c. Capital Commitments
Outstanding capital commitments: 31 March 2011 31 March 2010 General*
Fund Housing Revenue
Account**
General Fund
Housing Revenue Account
£m £m £m £m
Schemes contracted for 71.6 2.9 28.6 2.3 Schemes not contracted for 60.6 6.2 137.4 6.0
Total 132.2 9.1 166.0 8.3
The ability to carry out schemes planned, but not contracted for, will depend on the availability of capital resources at the appropriate time. * Figures for the General Fund are estimates based in the Capital Budget 2011-12 to 2013-14. An assumption is made that specific named schemes having spent more than 10 per cent of the budget are contracted. ** For the Housing revenue Account, schemes are not treated as capital commitments until firm funding has been allocated.
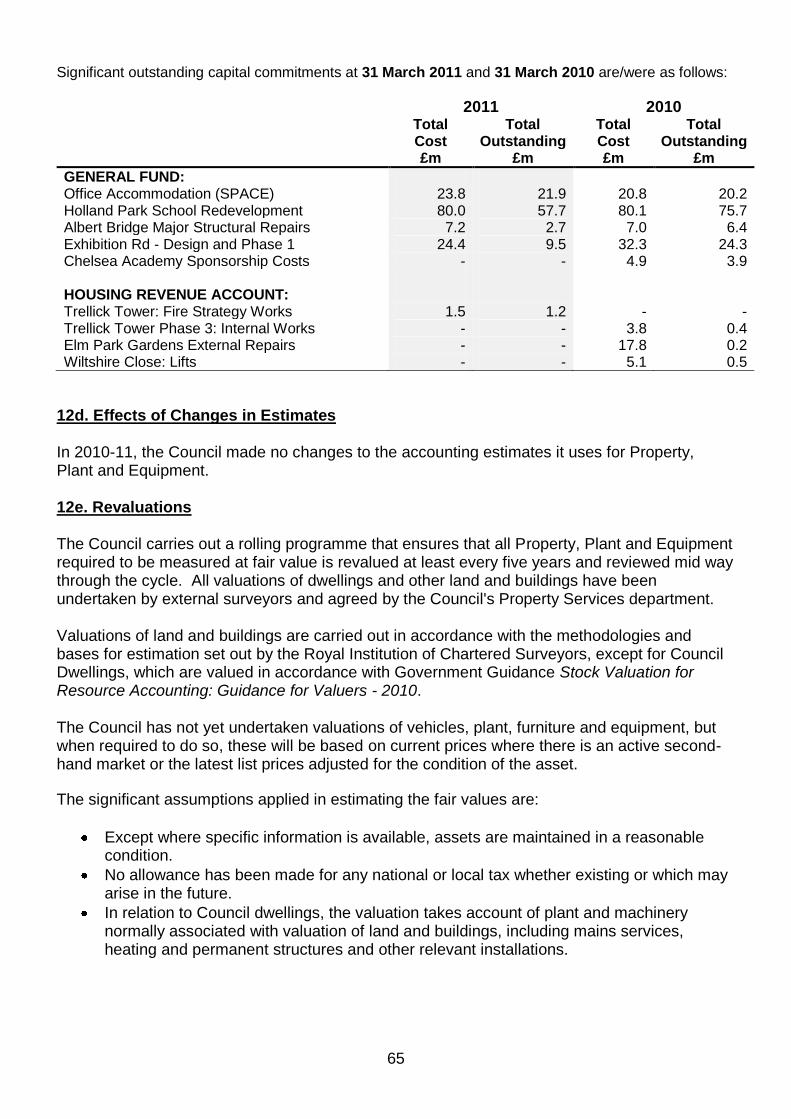
65
Significant outstanding capital commitments at 31 March 2011 and 31 March 2010 are/were as follows: 2011 2010 Total
Cost Total
Outstanding Total Cost
Total Outstanding
£m £m £m £m
GENERAL FUND: Office Accommodation (SPACE) 23.8 21.9 20.8 20.2 Holland Park School Redevelopment 80.0 57.7 80.1 75.7 Albert Bridge Major Structural Repairs 7.2 2.7 7.0 6.4 Exhibition Rd - Design and Phase 1 24.4 9.5 32.3 24.3 Chelsea Academy Sponsorship Costs - - 4.9 3.9 HOUSING REVENUE ACCOUNT: Trellick Tower: Fire Strategy Works 1.5 1.2 - - Trellick Tower Phase 3: Internal Works - - 3.8 0.4 Elm Park Gardens External Repairs - - 17.8 0.2 Wiltshire Close: Lifts - - 5.1 0.5
12d. Effects of Changes in Estimates In 2010-11, the Council made no changes to the accounting estimates it uses for Property, Plant and Equipment. 12e. Revaluations The Council carries out a rolling programme that ensures that all Property, Plant and Equipment required to be measured at fair value is revalued at least every five years and reviewed mid way through the cycle. All valuations of dwellings and other land and buildings have been undertaken by external surveyors and agreed by the Council's Property Services department. Valuations of land and buildings are carried out in accordance with the methodologies and bases for estimation set out by the Royal Institution of Chartered Surveyors, except for Council Dwellings, which are valued in accordance with Government Guidance Stock Valuation for Resource Accounting: Guidance for Valuers - 2010. The Council has not yet undertaken valuations of vehicles, plant, furniture and equipment, but when required to do so, these will be based on current prices where there is an active second-hand market or the latest list prices adjusted for the condition of the asset.
The significant assumptions applied in estimating the fair values are:
Except where specific information is available, assets are maintained in a reasonable condition.
No allowance has been made for any national or local tax whether existing or which may arise in the future.
In relation to Council dwellings, the valuation takes account of plant and machinery normally associated with valuation of land and buildings, including mains services, heating and permanent structures and other relevant installations.

66
Council Dwellings
Other Land and
Buildings
Vehicles, Equipment Plant and, Furniture
Surplus Assets
Total
£’000 £’000 £’000 £’000 £’000
Carrying amount if assets had been carried under the cost model
400,786
248,552
9,600
0
658,938
Valued at fair value as at:
1 April 2010 585,712
1 April 2009
1 April 2008 609,765
1 April 2007
1 April 2006
Current carrying value 579,158 568,918 9,695 0 1,157,771
*Please note that prior to 1 April 2010, the Council was not required to conduct rolling valuation of its vehicles, plant, furniture and equipment. The Council currently has no surplus assets.
The following items of income and expense have been accounted for in the Financing and Investment Income and Expenditure line in the Comprehensive Income and Expenditure Statement:
2010-11 2009-10
£'000 £'000
Rental income from investment property 3,836 4,859 Direct operating expenses arising from investment property (1,120) (1,090)
Net gain/(loss) 2,716 3,769
There are no restrictions on the Council‟s ability to realise the value inherent in its investment property or on its right to the remittance of income and the proceeds of disposal. The Council has no contractual obligations to purchase, construct or develop investment property or repairs, maintenance or enhancement. The following table summarises the movement in the fair value of investment properties over the year:
2010-11 2009-10
£'000 £'000
Balance at start of the year 145,220 122,892
Additions:
Purchases - -
Construction 61 -
Subsequent expenditure - -
Disposals - (331)
Net gains/losses from fair value adjustments
- 22,659
13. Investment Properties nces

67
Transfers: to/from Inventories - - to/from Property, Plant and Equipment - -
Other changes
- -
Balance at end of the year 145,281 145,220
The Council's intangible assets consist of purchased licenses and internally generated software. The Council accounts for software as an intangible asset where it provides economic benefit to the Council for a period greater than one year and if sourced from an external supplier, is licensed for a period greater than one year. Therefore, where a license is not purchased from a supplier, but a right to use software is granted in return for an annual fee, that software is not capitalised. All capitalised software is given a finite useful life of seven years, unless the software is expected to be of use to the Council for a shorter period. The intangible asset is amortised on a straight line basis over its anticipated useful life. The Council has not capitalised any major software suites for a period other than seven years. Amortisation of £254,621 was charged directly to Cultural, Environmental, Regulatory and Planning Services and £40,051 to Adult Social Care Support Service and Management Costs. The remainder, totalling £2,034,837 is absorbed as an overhead across all service headings in the Net Expenditure of Services.
The movement on Intangible Asset balances during the year is as follows:
14. Intangible Assets nces

68
2010-11
2009-10
Internally Generated
Assets
Other Assets
Total Internally Generated
Assets
Other Assets
Total
£'000 £'000 £'000 £'000 £'000 £'000
Balance at start of year:
Gross carrying amounts - 4,040 4,040 - 3,701 3,701
Accumulated amortisation
1,970 1,970
1,733 1,733
Net carrying amount at start of year
-
2,070
2,070
-
1,968
1,968
Additions:
Internal development 230 - 230 - - -
Purchases - 537 537
668 668
Acquired through business combinations
-
-
-
-
-
-
Other disposals - - - - - -
Impairment losses* - - -
(10) (10)
Amortisation for the period - (397) (397) - (252) (252)
Other changes - - - - (304) (304)
Net carrying amount at end of year
230
2,209
2,439
-
2,070
2,070
Comprising:
Gross carrying amounts 230 4,577 4,807 - 4,040 4,040
Accumulated amortisation - 2,367 2,367 - 1,970 1,970
*recognised in the Surplus/Deficit on the Provision of Services

69
15a. Financial Instruments - Balances
The borrowings and investments disclosed in the Balance Sheet are made up of the following categories of financial instruments: 31 March 2011 31 March 2010 Long
Term Current Long
Term Current
£’000 £‟000 £’000 £‟000
Borrowings Financial Liabilities (principal amount) (170,196) (12,150) (182,345) (10,186) + Accrued Interest (all short term) - (2,454) - (2,468)
Financial Liabilities at amortised cost (1) (170,196) (14,604) (182,345) (12,654) Financial Liabilities at fair value through CIES (2) - - - - Total Borrowings (170,196) (14,604) (182,345) (12,654)
Debtors Long Term Debtors 88,396 - 85,891 - Current Debtors - 36,934 - 47,454 Total Debtors 88,396 36,934 85,891 47,454
Cash Cash and Cash Equivalents - 29,347 - 34,583
Creditors Bank Accounts in Overdraft - (5,783) - (5,391) Short Term Creditors - (60,117) - (62,010) Total Creditors (65,900) (67,401)
Investments Loans and receivables (principal amount) - 93,510 - 86,330 + Accrued Interest - 74 - 35
Loans and receivables at amortised cost (1) - 93,584 - 86,365 Available-for-sale financial assets 39,388 - - 39,099 Financial Assets at fair value through CIES (2) - 40,334 - 40,046 Unquoted equity investments at cost - - - -
Total Investments (3) 39,388 133,918 - 165,510
Note 1 – Under accounting requirements the carrying value of the financial instrument value is shown in the balance sheet which includes the principal amount borrowed or lent including accrued interest. Note 2 – Fair value has been measured by direct reference to published price quotations in an active market. Note 3 – The long term investment figure on the Balance Sheet of £39.711 million includes £300,000 in respect of equity investment in Chelsea Care and £23,000 invested to maintain graves in perpetuity. These are not included within the table above.
15. Financial Instruments nces

70
15b. Financial Instruments - Gains/Losses
The gains and losses recognised in the Comprehensive Income and Expenditure Statement in relation to financial instruments are made up as follows:
2010-11 2009-10
Financial Liabilities
Financial Assets Total Financial Liabilities
Financial Assets Total
Liabilities measured at
amortised cost
Loans and receivables
Available for Sale
Assets(1)
At fair value
through CIES (2)
Liabilities measured at
amortised cost
Loans and receivables
Available for Sale Assets
At fair value
through CIES
Total
£’000 £’000 £’000 £’000 £’000 £’000 £’000 £’000
Interest Expense (13,954) - - - (13,954) (14,973) - - - (14,973)
Losses on derecognition - - - (2) (2) - - - - -
Impairment Losses - - - - - - - - - -
Interest Payable and Similar Charges
(13,954) - - (2) (13,956) (14,973) - - - (14,973)
Interest Income - 811 - 273 1,084 - 1,312 - 45 1,357
Gains on derecognition - - - 26 26 - - - - -
Interest and Investment Income - 811 - 299 1,110 - 1,312 - 45 1,357
Gains on revaluation - - - -
Losses on Revaluation (601) - (516) -
Amounts recycled to the CIES Account after Impairment
- - - -
Surplus arising on revaluation of Financial Assets
(601) - (601) (516) - (516)
Net Gain / (Loss) for the year (13,954) 811 (601) 297 (13,447) (14,973) 1,312 (516) 45 (14,132)

71
(1) Available for sale Assets: following the redemption of the Gilt purchased in 2009-10, the Council purchased a holding of £37.53 million of Gilts maturing in June 2012. These are held as available for sale assets and are valued at the year end by the custodian with reference to the price quoted by the Debt Management Office (DMO) at the close of business on 31 March. The loss on revaluation has been recognised in the Comprehensive Income and Expenditure Statement. (2) Fair Value through the Comprehensive Income and Expenditure Statement: represents the funds placed with the Council‟s external fund manager, Investec, which holds funds as part of a portfolio of identified financial instruments that can be managed together and are acquired principally for the purpose of selling or repurchasing in the near term. The prices quoted for the holdings are the bid prices. The fund manager‟s portfolio has been accounted for at fair value through the Comprehensive Income and Expenditure Statement. 15c. Financial Instruments – Fair Value of Assets and Liabilities Carried at Amortised Cost
Financial liabilities and financial assets represented by loans and receivables are carried on the Balance Sheet at amortised cost. Their fair value can be assessed by calculating the present value of the cash flows that will take place over the remaining life of the instruments, using the following assumptions:
Public Works Loan Board (PWLB) loans have been valued using the new borrowing rates published by the DMO on 31 march 2011.
No early repayment or impairment is recognised.
Where an instrument will mature in the next 12 months the carrying amount is assumed to approximate to fair value.
The fair values are calculated as follows: 31 March 2011 31 March 2010 Carrying
Amount Fair Value Carrying
Amount Fair Value
£’000 £’000 £‟000 £‟000
PWLB Debt 170,196 203,112 182,345 226,794
Loans and Receivables Money market loans <1 year 93,584 93,584 86,366 86,366 Money market loans > 1 year 0 0 0 0 Gilts < 1 year 0 0 39,099 39,099 Gilts > 1 year 39,388 39,388 0 0
Total Loans and receivables 132,972 132,972 125,465 125,465
The fair value for financial liabilities is greater than the carrying amount because the Council's portfolio of loans includes a number of fixed rate loans where the interest rate payable is higher than the rates available for similar loans in the market at the Balance Sheet date. The commitment to pay interest above current market rates increases the amount that the Council would have to pay if the lender requested or agreed to early repayment of the loans. The calculation above uses the PWLB new borrowing rate as the discount factor. If the premature redemption rate were to be used, the fair value would be £224,006 (£234,102 as at 31 March 2010).

72
The fair values for financial liabilities have been determined by reference to the PWLB redemption rules and prevailing PWLB loan rates at each Balance Sheet date. They include accrued interest. At 31 March 2011, all money market loans and receivables are repayable within one year. Therefore, the carrying amount is assumed to be approximate fair value; the figures for both years include accrued interest. The prevailing comparator market rates have been taken from indicative investment rates at the Balance Sheet date. In practice rates will be determined by the size of the transaction and the counterparty, but it is impractical to use these figures and the difference is not likely to be material. 16a. Current Debtors 2011 2010 £’000 £’000
Central government bodies 6,471 10,400 Other local authorities 10,814 12,907 NHS bodies 1,726 2,771 Public corporations and trading funds 0 0 Other entities and individuals 24,745 26,678
Total 43,756 52,756
16b. Long Term Debtors 2011 2010 £’000 £’000
Advances - Housing 181 216 Advances - Other 157 155 Deferred Capital Receipts 88,058 85,520
Total 88,396 85,891
The balance of Cash and Cash Equivalents is made up of the following elements: 2011 2010 Current Assets: £’000 £’000
Cash held by the Council 7,914 5,098 Bank current accounts 1,378 1,429 Short-term deposits with building societies 20,055 28,056
Total 29,347 34,583
Current Liabilities:
Bank accounts in overdraft (5,783) (5,391)
Net Cash and Cash Equivalents 23,564 29,192
17. Cash and Cash Equivalents
16. Debtors
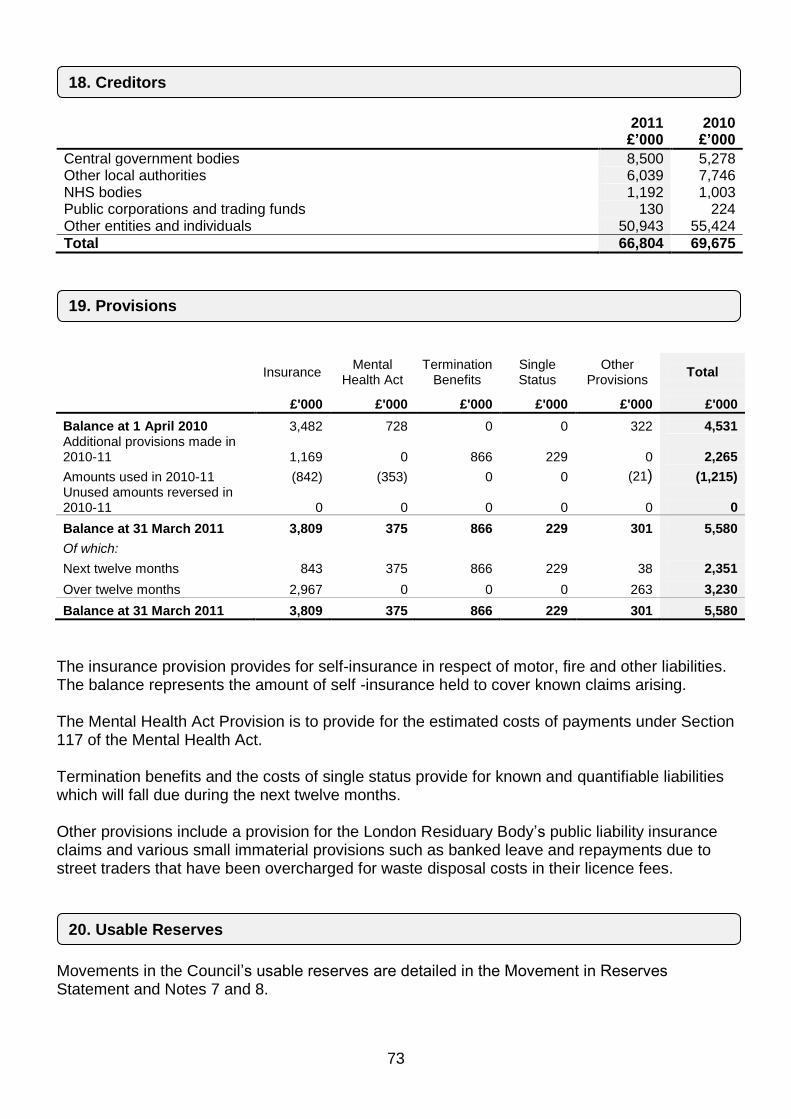
73
2011 2010 £’000 £’000
Central government bodies 8,500 5,278 Other local authorities 6,039 7,746 NHS bodies 1,192 1,003 Public corporations and trading funds 130 224 Other entities and individuals 50,943 55,424
Total 66,804 69,675
Insurance
Mental Health Act
Termination Benefits
Single Status
Other Provisions
Total
£'000 £'000 £'000 £'000 £'000 £'000
Balance at 1 April 2010 3,482 728 0 0 322 4,531 Additional provisions made in 2010-11 1,169 0 866 229 0 2,265
Amounts used in 2010-11 (842) (353) 0 0 (21) (1,215) Unused amounts reversed in 2010-11 0 0 0 0 0 0
Balance at 31 March 2011 3,809 375 866 229 301 5,580
Of which: Next twelve months 843 375 866 229 38 2,351
Over twelve months 2,967 0 0 0 263 3,230
Balance at 31 March 2011 3,809 375 866 229 301 5,580
The insurance provision provides for self-insurance in respect of motor, fire and other liabilities. The balance represents the amount of self -insurance held to cover known claims arising. The Mental Health Act Provision is to provide for the estimated costs of payments under Section 117 of the Mental Health Act. Termination benefits and the costs of single status provide for known and quantifiable liabilities which will fall due during the next twelve months. Other provisions include a provision for the London Residuary Body‟s public liability insurance claims and various small immaterial provisions such as banked leave and repayments due to street traders that have been overcharged for waste disposal costs in their licence fees.
Movements in the Council‟s usable reserves are detailed in the Movement in Reserves Statement and Notes 7 and 8.
18. Creditors
19. Provisions
20. Usable Reserves

74
21a. Total Unusable Reserves 2010-11 2009-10 £’000 £’000
Revaluation Reserve 498,834 457,560 Pensions Reserve (153,750) (321,723) Capital Adjustment Account 653,234 674,994 Deferred Capital Receipts 84,349 84,120 Financial Instruments Adjustment Account (966) (1,022) Available-for-Sale Financial Instruments Reserve (601) (516) Collection Fund Adjustment Account (133) (65) Unequal Pay Back Pay Account 0 0 Short-term Accumulating Compensated Absences Account (2,257) (2,416)
Total Unusable Reserves 1,078,710 890,932
21b. Revaluation Reserve
The Revaluation Reserve contains the gains made by the Council arising from increases in the value of its Property, Plant and Equipment. The balance is reduced when assets with accumulated gains are:
revalued downwards or impaired and the gains are lost;
used in the provision of services and the gains are consumed through depreciation; and
disposed of and the gains are realised.
The Reserve contains only revaluation gains accumulated since 1 April 2007, the date that the Reserve was created. Accumulated gains arising before that date are consolidated into the balance on the Capital Adjustment Account. 2010-11 2009-10 £’000 £’000
Balance at 1 April 457,560 347,847 Upward revaluations to assets in year* 73,800 135,921 Downward revaluation of assets and impairment losses* (31,228) (8,651) Difference between fair value depreciation and historical cost depreciation (498) (565) Impairment Adjustment relating to historic cost 0 (72) Accumulated gains on assets sold or scrapped (800) (16,920)
Movement in Year 41,273 109,713
Closing Balance at 31 March 498,834 457,560 *As reported in the CIES: Surplus or deficit on revaluation of non-current assets
21c. Pensions Reserve
The Pensions Reserve absorbs the timing differences arising from the different arrangements for accounting for post employment benefits and for funding benefits in accordance with statutory provisions. The Council accounts for post employment benefits in the Comprehensive Income and Expenditure Statement as: the benefits are earned by employees; the liabilities are updated to recognise inflation; the assumptions changed; and in light of investment returns. However, statutory requirements are that benefits earned should be financed as the Council makes employer‟s contributions to the pension funds, or pays any pensions for which it is
21. Unusable Reserves

75
directly responsible. The debit balance on the Pensions Reserve therefore shows a substantial shortfall in the benefits earned by past and current employees and the resources the Council has set aside to meet them. The statutory arrangements will ensure that funding will have been set aside by the time the benefits come to be paid. 2010-11 2009-10 £’000 £’000
Balance at 1 April (321,723) (154,446) Actuarial gains or losses on pensions assets and liabilities 120,409 (167,631) Reversal of items relating to retirement benefits debited or credited to the Surplus or Deficit on the Provision of Services in the Comprehensive Income and Expenditure Statement
26,775 (20,468) Employers‟ contributions payable to scheme 20,789 20,822
Movement in Year 167,973 (167,277)
Closing Balance at 31 March (153,750) (321,723)
21d. Capital Adjustment Account
The Capital Adjustment Account absorbs the timing differences arising from the different arrangements for accounting for the consumption of non-current assets and for financing the acquisition, construction or enhancement of those assets under statutory provisions. The Account is debited with the cost of acquisition, construction or enhancement as depreciation, impairment losses and amortisations are charged to the Comprehensive Income and Expenditure Statement, with reconciling postings from the Revaluation Reserve to convert fair value figures to a historical cost basis. The Account is credited with the amounts set aside by the Council as finance for the costs of acquisition, construction and enhancement. The Account contains accumulated gains and losses on Investment Properties and gains recognised on donated assets that have yet to be consumed by the Council. The Account also contains revaluation gains accumulated on Property, Plant and Equipment before 1 April 2007, the date that the Revaluation Reserve was created to hold such gains. Note 7 provides details of the source of all the transactions posted to the Account, apart from those involving the Revaluation Reserve:

76
2010-11 2009-10 £’000 £’000
Balance at 1 April 674,994 649,984 Reversal of items relating to capital expenditure debited or credited to the Comprehensive Income and Expenditure Statement:
Charges for depreciation and impairment of non-current assets (48,353) (24,092) Reversal of depreciation charged in respect of Dwellings (6,834) (6,623) Revaluation losses on Property, Plant and Equipment 0 0 Amortisation of intangible assets (393) (248) Revenue expenditure funded from capital under statute (7,351) (12,350) Amounts of non-current assets written off on disposal or sale as part of the gain/loss on disposal to the Comprehensive Income and Expenditure Statement
(6,951) (20,919)
Adjusting amounts written out of the Revaluation Reserve: Net written out amount of the cost of non-current assets consumed in the year 1,298 17,557 Capital financing applied in the year: Use of the Capital Receipts Reserve to finance new capital expenditure 8,600 3,732 Use of the Major Repairs Reserve to finance new capital expenditure 6,539 10,699 Capital grants and contributions credited to the Comprehensive Income and Expenditure Statement that have been applied to capital financing
15,876 15,176
Application of grants to capital financing from the Capital Grants Unapplied Account
0 0
Statutory provision for the financing of capital investment charged against the General Fund and HRA balances
1,627 1,998
Capital expenditure charged against the General Fund and HRA balances 14,180 17,421 Other Movements: Movements in the market value of Investment Properties 0 22,659 Movement in the Donated Assets Account 0 0
Movement in Year (21,760) 25,010
Closing Balance at 31 March 653,234 674,994
21e. Deferred Capital Receipts and credits
The Deferred Capital Receipts Reserve holds the gains recognised on the disposal of non-current assets, but for which cash settlement has yet to take place. Under statutory arrangements, the Council does not treat these gains as usable for financing new capital expenditure until they are backed by cash receipts. When the deferred cash settlement eventually takes place, amounts are transferred to the Capital Receipts Reserve. Deferred Capital Receipts 2010-11 2009-10 £’000 £’000
Balance at 1 April 84,051 0 Transfer of deferred sale proceeds credited as part of the gain/loss on disposal to the Comprehensive Income and Expenditure Statement 0 83,990 Unwind notional credit in respect of leaseback arrangement 245 61 Transfer to the Capital Receipts Reserve upon receipt of cash 0 0
Closing Balance at 31 March 84,296 84,051
Deferred Credits 2010-11 2009-10 £’000 £’000
Balance at 1 April 69 101

77
Transfer to the Capital Receipts Reserve upon receipt of cash (16) (33)
Closing Balance at 31 March 53 68
21f. Financial Instruments Adjustment Account
The Financial Instruments Adjustment Account absorbs the timing differences arising from the different arrangements for accounting for income and expenses relating to certain financial instruments and for bearing losses or benefiting from gains per statutory provisions. The Council uses the Account to manage premiums paid on the early redemption of loans. Premiums are debited to the Comprehensive Income and Expenditure Statement when they are incurred, but reversed out of the General Fund Balance to the Account in the Movement in Reserves Statement. Over time, the expense is posted back to the General Fund Balance in accordance with statutory arrangements for spreading the burden on council tax. In the Council‟s case, this period is the unexpired term that was outstanding on the loans when they were redeemed. As a result, the balance on the Account at 31 March 2011 will be charged to the General Fund over the next 17 years. 2010-11 2009-10 £’000 £’000
Balance at 1 April (1,022) (1,077) Premiums incurred in the year and charged to the Comprehensive Income and Expenditure Statement 0 0 Proportion of premiums incurred in previous financial years to be charged against the General Fund Balance in accordance with statutory requirements 56 56 Amount by which finance costs charged to the Comprehensive Income and Expenditure Statement are different from finance costs chargeable in the year in accordance with statutory requirements 0 0
Closing Balance at 31 March (966) (1,021)
21g. Available-for-Sale Financial Instruments Reserve
The Available for Sale Financial Instruments Reserve contains the gains made by the Council arising from increases in the value of its investments that it neither intends to hold to maturity nor hold for only a very short period of time. The balance is reduced when investments with accumulated gains are:
revalued downwards or impaired and the gains are lost; and
disposed of and the gains are realised. 2010-11 2009-10 £’000 £’000
Balance at 1 April (516) 0 Downward Movement in Book Cost (85) (516)
Closing Balance at 31 March (601) (516)

78
21h. Collection Fund Adjustment Account
The Collection Fund Adjustment Account manages the differences arising from the recognition of council tax income in the Comprehensive Income and Expenditure Statement as it falls due from council tax payers compared with the statutory arrangements for transferring amounts to the General Fund from the Collection Fund. 2010-11 2009-10 £’000 £’000
Balance at 1 April (65) 25 Amount by which council tax income credited to the Comprehensive Income Statement is different from council tax income calculated for the year in accordance with statutory and Expenditure requirements (68) (90)
Closing Balance at 31 March (133) (65)
21j. Short-term Accumulating Compensated Absences Account
The Accumulated Absences Account absorbs the differences that would otherwise arise on the General Fund Balance from accruing for compensated absences earned, but not taken in the year. For example, annual leave entitlement carried forward at 31 March. Statutory arrangements require that the impact on the General Fund Balance is neutralised by transfers to or from this Account. 2010-11 2009-10 £’000 £’000
Balance at 1 April (2,416) (2,038) Settlement or cancellation of accrual made at the end of the preceding year 2,416 2,038 Amounts accrued at the end of the current year (2,256) (2,416)
Closing Balance at 31 March (2,256) (2,416)

79
2010-11 2009-10
£'000 £'000
Total Revenue (Surplus) / Deficit on the provision of services (28,419) (84,685) Total Revenue (Surplus) / Deficit (LRB) 7 213
Total (28,412) (84,472)
Adjust for items included in the net surplus or deficit on the provision of services that are investing and financing activities:
Capital Grants 16,996 15,177
Adjust net surplus or deficit on the provision of services for noncash movements:
Non-cash Items in the Income and Expenditure Account Depreciation and Impairment Charged to Revenue (55,580) (30,791)
Other non-cash movements* (40) (23) Change in value of investment property recognised in CIES 0 22,659 Surplus or deficit on revaluation of available for sale financial assets 84 516 Net adjustments made in respect of IAS19 (Pensions Adjustment) 47,564 354
Gain / (loss) on disposal of fixed assets (3,527) 75,427
*Other movements comprise movement in deferred credits and the amortisation of premia and discounts
Movement in non-cash Assets and Liabilities Assets Increase / (Decrease) in Stock and Work In Progress (108) (89)
Increase / (Decrease) in Debtors (9,000) 4,509 Increase / (Decrease) Change in Long Term Debtors 2,505 85,477
Liabilities (Increase) / Decrease in Creditors 2,870 1,247
(Increase) / Decrease in Provisions (1,049) (1,049) (Increase) / Decrease Deferred Liabilities 245 (839)
(Increase) / Decrease in Capital Grants Received in Advance (8,872) 1,523
Cash flow from revenue activities (36,324) 89,628
Items included in net cash flow from operating activities include: Financing and Investment Income Interest payable on debt (including finance leases) (13,974) (14,989)
Investment Interest income 3,848 1,938 Rentals received on investment properties net of expenses incurred 2,716 3,769
Surplus on Trading Account Activity 30 19 2010-11 2009-10 £’000 £’000
Purchase of non-current assets 44,125 34,836 Purchase and disposal of short-term and long-term investments 7,945 (58,012) Other payments for investing activities (16,996) (15,177) Proceeds from the sale of non-current assets (3,423) (96,347)
Net cash flows from investing activities 31,651 (134,700)
22. Net Cash Flow from Operating Activities nces
23. Investing Activities nces

80
2010-11 2009-10 £’000 £’000
Cash payments for the reduction of outstanding finance lease liabilities 102 121 Repayments of short-term and long-term borrowing 10,199 10,206
Net cash flows from financing activities 10,301 10,327
This note explains the difference between directorate management accounts and amounts included in the year-end financial accounts.
25a Analysis of Directorate Income and Expenditure
Directorate Income and Expenditure 2010-11
Family and Children's Services
Housing, Health and Adult Social
Care
Planning and Borough
Development
Transport, Environment and Leisure
Services
Corporate Services
Total
£'000 £'000 £'000 £'000 £'000 £'000
Fees, charges & other service income 21,991 32,610 3,822 51,229 11,110 120,762
Government grants 96,416 4,263 34 228 166,152 267,093
Total Income 118,407 36,872 3,856 51,457 177,262 387,855
Employee expenses 41,203 33,618 5,397 14,539 12,056 106,813
Other service expenses 125,605 77,215 1,657 54,701 176,221 435,398
Support service recharges 8,536 7,575 2,044 7,196 9,925 35,276
Total Expenditure 175,345 118,408 9,098 76,435 198,201 577,487
Net Expenditure 56,937 81,535 5,241 24,978 20,940 189,631
Directorate Income and Expenditure 2009-10
Family and Children's Services
Housing, Health and Adult Social
Care
Planning and Borough
Development
Transport, Environment and Leisure
Services
Corporate Services
Total
£'000 £'000 £'000 £'000 £'000 £'000
Fees, charges & other service income 21,804 30,593 3,313 51,062 15,550 122,322
Government grants 87,964 13,974 151 91 152,929 255,109
Total Income 109,768 44,567 3,464 51,153 168,479 377,431
Employee expenses 91,412 26,212 5,363 12,749 10,834 146,570
Other service expenses 66,818 77,727 1,311 54,346 168,519 368,721
Support service recharges 8,113 9,043 1,996 7,060 9,121 35,333
Total Expenditure 166,343 112,982 8,670 74,155 188,474 550,624
Net Expenditure 56,575 68,415 5,206 23,002 19,995 173,193
24. Financing Activities nces
25. Amounts Reported for Resource Allocation Decisions nces

81
25b Reconciliation of directorate income and expenditure to the Comprehensive Income and Expenditure Statement
2010-11 2009-10
£'000 £'000
Net expenditure in the Directorate Analysis 189,631 173,193
Net expenditure of services and support services not included in the Analysis:
Amounts in the Comprehensive Income and Expenditure Statement not reported in the Council's Management Accounts:
Revenue Expenditure Funded from Capital Under Statute 7,351 11,252
Impairments 1,683 3,069
Holiday Pay Accrual (160) 378
Corporate Income (VAT Refund) (446) 0
Non Distributed Pension Costs (61,691) 3,646
Revenue in support of Capital Expenditure 787 0
IFRS Depreciation Adjustment 0 (54)
Amounts included in the Analysis not included in the cost of services in the Comprehensive Income and Expenditure Statement:
Investment Property Income and Expenditure 2,716 3,769
Finance Lease Adjustment (142) (17)
Trading Accounts 29 19
Post Audit Adjustments not reflected in management reporting 0 (258)
REFCUS included in management reporting (993) (594)
138,765 194,403
Surplus/Deficit on the Housing Revenue Account 23,643 1,184
Total Cost of Services per Comprehensive Income and Expenditure Statement 162,408 195,587

82
The services shown below operate as Trading Accounts as defined in the BVACOP. There are six main types of trading operation that may be run by local authorities:
Trading services or undertakings with the public or with other third parties.
External trading organisations that have won contracts from other public bodies.
Continuing Compulsory Competitive Tendering arrangements.
Work carried out by internal trading organisations arising from voluntary competitive tendering exercises.
Support services provided in a free internal market.
Support services provided in a limited internal market.
The figures shown below are included within the relevant service summary lines in the Comprehensive Income and Expenditure Statement, with the exception of the cash collection service which is included in the corporate section.
2010-11 2009-10 Income Exp Net Income Exp Net £’000 £’000 £’000 £’000 £’000 £’000
Trading Operation Family and Children's Services Professional Development Centre Catering (175) 194 19 (210) 215 5 Professional Development Centre Conferences (423) 331 (92) (413) 427 14 Pupil Support Services (518) 619 101 (580) 767 187 Transport, Environment and Leisure Services
Street Trading (808) 812 4 (812) 727 (85) Holland Park Theatre (2,152) 3,073 921 (2,213) 2,882 669 Corporate Services Cash Collection (450) 421 (29) (467) 450 (17) Planning and Borough Development Building Control (1,117) 1,232 115 (1,131) 1,382 251
Total (Deficit)/Surplus (5,643) 6,682 1,039 (5,826) 6,850 1,024
Professional Development Centre Catering The provision of catering at conferences and meetings held at the Isaac Newton Professional Development Centre. Professional Development Centre Conferences Income earned from the hosting of conferences and meetings at the Isaac Newton Professional Development Centre. Pupil Support Services The provision of pupil support services to schools and for looked after children. Street Trading Income is derived mainly from permanent and temporary street trading lettings. Under present legislation, the Council is limited to recovering specific associated costs from the income. Any surplus / deficit on the Street Trading Account is transferred to / from the Street Trading Account Reserve.
26. Trading Operations nces

83
Holland Park Theatre This covers the staffing and other costs of operating Opera Holland Park, which runs from June to August each year. The income is derived mainly from ticket sales and sponsorship. Cash Collection Contract with another local authority for the daily collection, counting and banking of cash from pay and display machines within its area. Building Control The Building Control Team ensures that building construction undertaken within the Royal Borough is in accordance with Building Regulations and other relevant local requirements. It achieves this by checking proposals submitted and carrying out site inspection of building work. When necessary it also undertakes enforcement action to ensure compliance with Building Regulations. Community Service Equipment 2010-11 200910 £’000 £’000
Gross Funding in Year Royal Borough of Kensington and Chelsea 373 367 Kensington and Chelsea Primary Care Trust 468 461
Total Funding 841 828
Expenditure Total Expenditure (707) (740)
Net (Overspend) / Under-spend in Year 134 88
Balance Brought Forward 116 28 Net (Overspend) / Under-spend in Year 134 88
Balance Carried Forward 250 116
2010-11 2009-10 £’000 £’000
Basic Allowance 562 576 Special Responsibility Allowance 558 635 Travel/ Subsistence / Dependent Carers' Allowance 2 4 Reimbursement of Expenses 40 41
Total 1,162 1,256
28. Members’ Allowances
27. Pooled Budgets
nces

84
29a. Disclosure of remuneration for senior employees 2010-11
Job Title Name
No
tes Salary,
Fees and Allowances
Bonuses Expenses Allowances
Other Emoluments
Total remuneration
(excluding pension
contribution)
Employer’s Pension
Contribution
Total Remuneration
(including pension
contribution)
Town Clerk and Chief Executive Derek Myers 209,809 10,490 40 637 220,976 47,499 268,475 Exec Director of Finance, Information Systems and Property Nicholas Holgate 149,547 7,210 1,032 0 157,789 33,698 191,487 Exec Director of Family and Children's Services Anne-Marie Carrie 95,039 4,440 0 0 99,479 21,388 120,867 Exec Director of Transport, Environment and Leisure Services Tot Brill 118,800 5,940 1,050 637 126,427 26,956 153,383 Exec Director of Housing, Health and Adult Social Care Jean Daintith 132,583 6,510 0 637 139,730 30,042 169,772 Exec Director of Family and Children Services Libby Blake 77,541 0 775 425 78,741 16,762 95,503 Exec Director of Planning and Borough Development Jonathan Bore 110,306 0 0 0 110,306 23,650 133,956 Director of Strategy and Service Improvement Tony Redpath 96,500 4,825 1,032 637 102,994 21,922 124,916 Director of Personnel and General Services George Bishop 126,537 12,270 0 637 139,444 29,954 169,398 Head of Media and Communications Martin Fitzpatrick 56,875 2,830 0 637 60,342 12,974 73,316
29a. Disclosure of remuneration for senior employees 2009-10
Job Title Name
No
tes Salary,
Fees and Allowances
Bonuses Expenses Allowances
Other Emoluments
Total remuneration
(excluding pension
contribution)
Employer’s Pension
Contribution
Total Remuneration
(including pension
contribution)
Town Clerk and Chief Executive Derek Myers 209,821 10,485 00 625 220,931 47,492 268,423 Exec Director of Finance, Information Systems and Property Nicholas Holgate 144,083 3,570 344 0 147,997 31,746 179,743 Exec Director of Family and Children's Services Anne-Marie Carrie 151,525 7,115 0 0 158,640 34,108 192,748 Exec Director of Transport, Environment and Leisure Services Tot Brill 119,107 3,564 0 625 123,296 26,442 149,738 Exec Director of Housing, Health and Adult Social Care Jean Daintith 129,983 6,380 0 625 136,988 29,452 166,440 Exec Director of Planning and Borough Development David Prout 1 55,983 11,740 56 295 68,074 14,624 82,698 Exec Director of Planning and Borough Development Jonathan Bore 2 2,957 0 0 0 2,957 636 3,593 Director of Strategy and Service Improvement Tony Redpath 96,342 4,730 984 625 102,681 21,864 124,545 Director of Personnel and General Services George Bishop 124,278 12,270 0 625 137,173 29,466 166,639 Head of Media and Communications Martin Fitzpatrick 56,533 2,790 0 625 59,948 12,889 72,837 Assistant Chief Executive David Tidey 3 52,809 4,505 0 1,959 59,273 12,743 72,016
1 Left 20 September 2009 – annualised salary, fees and allowances £118,000 2 Started 22 March 2010 - annualised salary, fees and allowances £110,000 3 Left 30 October 2009 – annualised salary, fees and allowances £90,000
29. Officer Remuneration
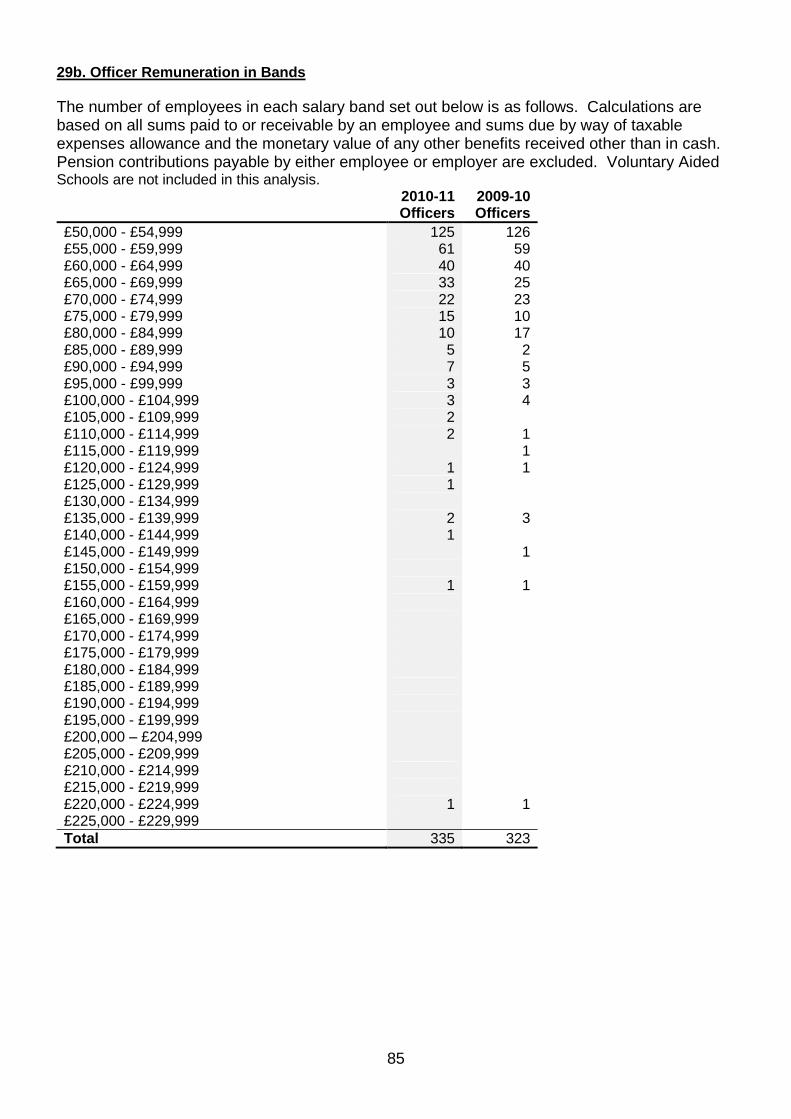
85
29b. Officer Remuneration in Bands
The number of employees in each salary band set out below is as follows. Calculations are based on all sums paid to or receivable by an employee and sums due by way of taxable expenses allowance and the monetary value of any other benefits received other than in cash. Pension contributions payable by either employee or employer are excluded. Voluntary Aided Schools are not included in this analysis. 2010-11 2009-10 Officers Officers
£50,000 - £54,999 125 126 £55,000 - £59,999 61 59 £60,000 - £64,999 40 40 £65,000 - £69,999 33 25 £70,000 - £74,999 22 23 £75,000 - £79,999 15 10 £80,000 - £84,999 10 17 £85,000 - £89,999 5 2 £90,000 - £94,999 7 5 £95,000 - £99,999 3 3 £100,000 - £104,999 3 4 £105,000 - £109,999 2 £110,000 - £114,999 2 1 £115,000 - £119,999 1 £120,000 - £124,999 1 1 £125,000 - £129,999 1 £130,000 - £134,999 £135,000 - £139,999 2 3 £140,000 - £144,999 1 £145,000 - £149,999 1 £150,000 - £154,999 £155,000 - £159,999 1 1 £160,000 - £164,999 £165,000 - £169,999 £170,000 - £174,999 £175,000 - £179,999 £180,000 - £184,999 £185,000 - £189,999 £190,000 - £194,999 £195,000 - £199,999 £200,000 – £204,999 £205,000 - £209,999 £210,000 - £214,999 £215,000 - £219,999 £220,000 - £224,999 1 1 £225,000 - £229,999
Total 335 323

86
2010-11 2009-10 £’000 £’000
Fees Payable to External Auditors in respect of: - External audit services carried out by the appointed auditor for the year 298 305 - Statutory Inspection 0 85 - The certification of grant claims and returns for the year 95 82 - Other services 0 0
Total 393 472
The Council‟s expenditure on schools is funded primarily by grant monies provided by the Department for Education (formerly the Department for Children, Schools and Families) via the Dedicated Schools Grant (DSG). DSG is ring-fenced and can only be applied to meet expenditure properly included in the Schools Budget, as defined in the School Finance (England) Regulations 2008. The Schools Budget includes elements for a range of educational services provided on an authority-wide basis and for the Individual Schools Budget, which is divided into a budget share for each maintained school.
2010-11
Central Expenditure
Individual School
Budgets Total
£’000 £’000 £’000
Final DSG 7,987 59,592 67,579 Brought forward from previous year (350) 0 (350) Carry Forward to next year agreed in advance 0 0 0
Agreed Budget Distribution 7,637 59,592 67,229 Reallocations of DSG (245) 245 0
Final Budget Distribution 7,392 59,837 67,229 Actual Central Expenditure (7,687) 0 (7,687) Actual ISB Deployed to Schools* 0 (60,080) (60,080) Council Contribution 357 243 600
Total 62 0 62
2009-10
Central Expenditure
Individual School
Budgets Total
£’000 £’000 £’000
Final DSG 7,448 56,761 64,209 Brought forward from previous year 0 0 0 Carry Forward to next year agreed in advance 0 0 0
Agreed Budget Distribution 7,448 56,761 64,209 Reallocations of DSG (1,502) 1,502 0
Final Budget Distribution 5,946 58,263 64,209 Actual Central Expenditure (6,296) 0 (6,296) Actual ISB Deployed to Schools* 0 (58,263) (58,263) Council Contribution 0 0 0
Total (350) 0 (350)
*ISB is the Individual Schools Budget
30. External Audit Costs
31. Dedicated Schools Grant

87
The Council credited the following grants, contributions and donations to the Comprehensive Income and Expenditure Statement in 2010-11: 32a. Credited to Taxation and Non Specific Grant Income 2010-11 2009-10 £’000 £’000
Area Based Grant 18,868 10,449 Council tax 78,155 77,776 National Non Domestic Rates 92,523 84,824 Revenue Support Grant 13,435 19,578
Total 202,981 192,627
32b. Credited to Services 2010-11 2009-10 £’000 £’000
Housing Benefit Subsidy 148,660 136,239 Dedicated School's Grant 67,229 63,762 Council Tax Subsidy 13,725 13,168 Standards Fund Grant 11,319 8,122 Learning and Skills Council Grants 8,314 4,862 Sure Start Grant 5,270 4,260 HRA Subsidy 4,446 5,715 School Standards Grant 2,329 2,259 Housing Benefit Admin Subsidy 2,319 2,296 Social Care Reform Grant 1,062 866 Transport for London Revenue Grant 1,033 724 Homelessness Grant 844 520 Drug Intervention Programme Grant 712 1,077 Supporting People Grant* 587 10,991 DCLG - Regeneration 553 0 Renovation Grant 478 204 Rough Sleepers 450 450 Unaccompanied Minors Grant 413 366 HIV grant 372 334 Hospital Discharge Grant 359 0 London Pay Addition Grant 355 247 Children and Young People Grant 318 0 Outreach 0 268 Local Authority Business Growth Incentive Scheme 0 254 Unaccompanied Asylum Seeking Children grants 193 871 Other Grants (under £250k) 5,486 4,169 Health Contributions 12,229 10,946
Total 289,055 272,970 *From 2010-11 this is included within the Area Based Grant
32. Grant Income

88
32c. Capital Grants Unapplied
The Council has received a number of grants and contributions that have yet to be recognised as income as they have conditions attached to them that will require the monies or property to be returned to the giver. The balances at year end are as follows: 2010-11 2009-10 £’000 £’000
Standards Fund Capital (Primary Programme) 8,201 2,895 S106 and private contributions 4,050 1,442 Social Services - Single Capital Pot 850 0 Central London Connexions 14 14 NLDC 29 29 Sure Start 13 34 Play Pathfinder – Department of Education 25 68 Youth Capital Fund - Department of Education 0 5 City Learning Centres 44 0 ICT Harnessing Technology 30 0 Other Social Services 25 0 DOH IT Infrastructure grant 78 0
Total 13,359 4,487
The Council is required to disclose material transactions with related parties: those bodies or individuals that have the potential to control or influence the Council or to be controlled or influenced by the Council. The Government The Government has effective control of all local authorities including the Council. It is responsible for the statutory framework in which the Council operates and provides the majority of the Council‟s funding. The Government limits the ability of the Council to determine the level of its Council Tax. Grants received from the Government and are set out in Note 32. Councillors Councillors have the direct control of the Council‟s policies and strategies. Day-to-day responsibility lies with the Council‟s executive, or „Cabinet‟, which comprises nine Members with authority within their respective portfolios to approve decisions of a value less than £250,000. Decisions with a value greater than £250,000 are taken by Cabinet collectively or by full Council as appropriate. No councillor has a relationship or holds a position with a company that has a material commercial relationship with the Council. Many councillors have relationships or hold positions with other public bodies and voluntary organisations with which the Council does not have a financially material relationship, but with which the Council has a financial or influential relationship. These include Western Riverside Waste Authority, schools, charities, National Health Service trusts, consultative groups, development trusts and management committees.
33. Related Parties

89
Some councillors have roles within Government and other public sector bodies with which the Council either has a financially material relationship or there is a possibility that such a relationship could exist in terms of monetary value and influence:
The Leader of the Council, Councillor Sir Merrick Cockell, is a non-executive director of the Audit Commission, the Council‟s external auditors. The fees payable to the Audit Commission in 2010/11 were £393k (as disclosed in Note 30 External Audit Costs). He is on the board of the London Pension Fund Authority. He is also chairman of the Local Government Group (June 2011 onwards).
Councillor The Right Hon The Baroness Ritchie, who is Cabinet Member for Family and Children‟s Services, is a Member of the House of Lords.
The Right Hon The Baroness Hanham, is a Member of the House of Lords and now Parliamentary Under Secretary of State at the Department for Communities and Local Government. She stood down as a councillor on 28 May 2010 upon her appointment to the Government.
Councillor Moylan, Deputy Leader of the Council and Cabinet Member for Planning Policy during the 2010-11 financial year, who has subsequently stood down as Deputy Leader and Cabinet Member, is:
o Deputy Chairman of Transport for London; o Chairman of Kensington and Chelsea Environmental Limited, a charity registered with
ENTRUST under the Landfill Tax Regulations, which undertakes environmental improvement projects in the Royal Borough;
o Co-chairman of Urban Design London; and o Member of the London Waste and Recycling Board.
Councillor (Fiona) Buxton, Councillor (Terrance) Buxton, Councillor Feilding-Mellen and Councillor Lindsay are either Trustees or Directors of Westway Development Trust.
The Council can nominate up to four persons to the fifteen-strong Board of Directors. Councillor Condon-Simmonds (controlling party) and Councillor Dent Coad (minority party) are Council nominees to the Board of Kensington and Chelsea Tenant Management Organisation. The other two nominees are independent.
A number of councillors are committee members at London Councils. Officers No officer of the Council has a relationship or holds a position with a company that has a material commercial relationship with the Council. No officer of the Council holds a position with another public body that has a material financial relationship with the Council. Other Public Bodies
The Council delivers services in close co-operation with other public bodies such as the Greater London Authority, Transport for London, the Kensington and Chelsea Partnership, Metropolitan Police Service, NHS trusts, the London Fire Brigade and other local authorities. At times, the Council will influence and be influenced by these bodies. Where the Council receives significant grant funding from another public body, this is disclosed in Note 32. The Council has made no material financial payments to another public body.

90
The Council is entering into joint working arrangements with neighbouring local authorities, the City of Westminster and the London Borough of Hammersmith and Fulham. These arrangements are currently referred to as „tri-borough working‟. The Council did not have material transactions with either in 2010/11, but may do so in the future. Work to develop the arrangements does mean that each borough influences the others. 2010-11 2009-10 £’000 £’000
Opening Capital Financing Requirement 224,042 225,604 Capital investment Property, Plant and Equipment 43,298 34,502 Long Term Investments 150 0 Investment Properties 61 0 Intangible Assets 767 668 Revenue Expenditure Funded from Capital under Statute 7,351 12,350 Sources of finance Capital receipts (8,565) (3,757) Government grants and other contributions (15,877) (15,207) Sums set aside from revenue: Direct revenue contributions (14,180) (17,421) Direct Revenue Funding (Major Repairs Reserve) (6,539) (10,699) MRP / loans fund principal (1,627) (1,998)
Closing Capital Financing Requirement 228,881 224,042
Explanation of movements in year Provision to reduce underlying need to borrow (MRP) (1,627) (1,998) Increase in underlying need to borrow (supported by government financial assistance)
0 0
Increase in underlying need to borrow (unsupported by government financial assistance)
6,466 0
Assets acquired under finance leases 0 435 Assets acquired under PFI/PPP contracts 0 0
Increase / (decrease) in Capital Financing Requirement 4,839 (1,562)
Council as Lessee Finance Leases
Assets acquired under finance leases are carried as Property, Plant and Equipment in the Balance Sheet at the following net amounts:
31 March 2011 31 March 2010
£'000 £'000
Other Land and Buildings 839 877
Vehicles, Plant, Furniture and Equipment 212 334
Total 1,051 1,210
34. Capital Expenditure and Capital Financing
35. Leases
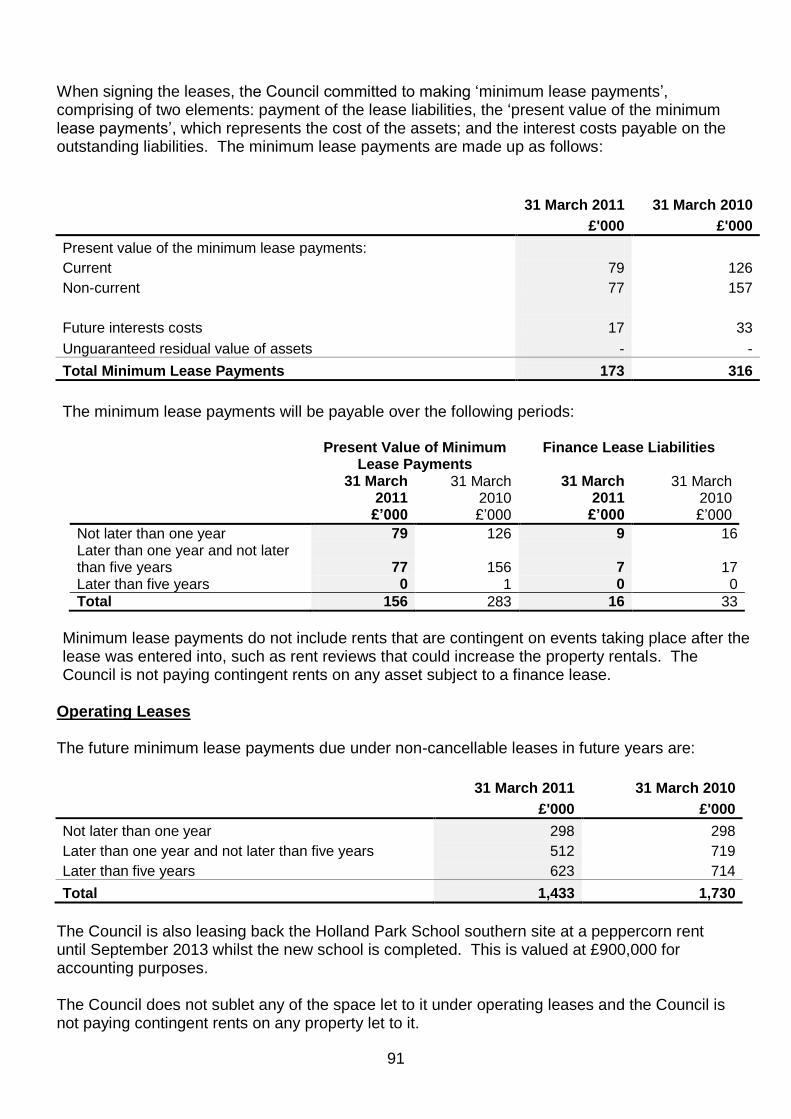
91
When signing the leases, the Council committed to making „minimum lease payments‟, comprising of two elements: payment of the lease liabilities, the „present value of the minimum lease payments‟, which represents the cost of the assets; and the interest costs payable on the outstanding liabilities. The minimum lease payments are made up as follows:
31 March 2011 31 March 2010
£'000 £'000
Present value of the minimum lease payments:
Current 79 126
Non-current 77 157
Future interests costs 17 33
Unguaranteed residual value of assets - -
Total Minimum Lease Payments 173 316
The minimum lease payments will be payable over the following periods:
Present Value of Minimum Lease Payments
Finance Lease Liabilities
31 March 2011
31 March 2010
31 March 2011
31 March 2010
£’000 £‟000 £’000 £‟000
Not later than one year 79 126 9 16 Later than one year and not later than five years 77 156 7 17 Later than five years 0 1 0 0
Total 156 283 16 33
Minimum lease payments do not include rents that are contingent on events taking place after the lease was entered into, such as rent reviews that could increase the property rentals. The Council is not paying contingent rents on any asset subject to a finance lease.
Operating Leases The future minimum lease payments due under non-cancellable leases in future years are:
31 March 2011 31 March 2010
£'000 £'000
Not later than one year 298 298
Later than one year and not later than five years 512 719
Later than five years 623 714
Total 1,433 1,730
The Council is also leasing back the Holland Park School southern site at a peppercorn rent until September 2013 whilst the new school is completed. This is valued at £900,000 for accounting purposes. The Council does not sublet any of the space let to it under operating leases and the Council is not paying contingent rents on any property let to it.

92
Minimum lease payments were charged to the Comprehensive Income and Expenditure Statement as follows:
31 March 2011 31 March 2010
£'000 £'000
Adult Social Care 5 5
Children's and Education 248 248 Cultural, Environmental, Regulatory and Planning Services 11 11
Allocated across service lines 34 34
Total 298 298
Council as Lessor Finance Leases The Council has let a number of properties, mostly land, on very long leases that are judged to be finance leases. Ten assets have been let on leases of 990 to 1001 years and three other properties have been let on terms of 126, 150 and 200 years. In each case, the Council receives a peppercorn rent (if demanded) and there is no guaranteed residual value of the property. This means that the gross investment in each lease is zero and thus no financial disclosures to be made. Properties let by the Council include: Holland Park Youth Hostel; five storage units leased to private individuals and companies; the land occupied by the Muslim Cultural Heritage Centre; the land occupied by the Tesco store in Fenelon Place; the land occupied by the Great Western Studios; the land occupied by the Manor House Estate; a parcel of land at Henry Dickens Court; a property on Notting Hill Gate; and a small parcel of land at Redcliffe Square.
The land parcels set out above have been judged to be finance leases on the basis of substance over form. In some cases a premium has been paid to secure a long tenancy at a peppercorn rate and in others, the Council has granted favourable terms to deliver social benefit. In all cases other than the land at Fenelon Place, the length of the lease is such that control of the land will not revert to the Council until 2988AD or later.

93
Operating Leases The Council leases out property and equipment under operating leases to generate additional income and to provide smaller premises for small businesses and charitable organisations in the Royal Borough that may otherwise not be available. The Council charges economic rents for its properties. Some assets are leased to companies delivering services on behalf of the Council, but income from such properties is not reported below. Such assets are recorded as operational properties and the relevant service contracts normally take account of the lease rentals, which are therefore effectively recorded as a cost under the relevant service line of the Comprehensive Income and Expenditure Statement as well as income. To report such rents as income under operating leases could potentially present a misleading view of the Council's operating lease income. The future minimum lease payments receivable under non-cancellable leases for non-operational assets in future years are:
31 March 2011 31 March 2010
£'000 £'000
Not later than one year 5,426 5,426
Later than one year and not later than five years 12,031 14,840
Later than five years 14,811 17,730
Total 32,269 37,997
Please note that the information in the table above reflects current leases, a number of which expire in the coming years. The Council anticipates that these properties will be relet to new or existing tenants.
During 2010-11, the Council impaired Holland Park School to reflect the decommissioning and demolition of the current buildings, which are being replaced. The Council debited the net loss of £1,682,811 to the Surplus or Deficit on the Provision of Services under the schools element of Children's and Education Services. The Council values its dwellings in accordance with the proper practice set out in the Government guidance Stock Valuation for Resource Accounting: Guidance for Valuers - 2010. Under the requirements of the „beacon system‟ of valuation and 70 per cent discount applied to the open market valuation of the dwellings using the „Existing Use Valuation - Social Housing‟ methodology, the Council's capital expenditure on its dwelling stock does not increase the value of the assets on a pound-for-pound basis; at best the value of a dwelling will be increased by only 30 per cent of the capital expenditure incurred upon it. The Code and associated Guidance Notes for Practitioners require the Council to impair an asset accordingly where the value of an asset increases by less than the capital expenditure incurred on it. The Council's Property Services department and external advisors have confirmed that the value of the Council's dwellings remained static in 2010-11 under the beacon system and therefore the Council has impaired £8,664,117 it spent enhancing its dwelling stock and charged the impairment to the Surplus or Deficit on the Provision of Services. The Council conducted a full revaluation of its dwelling stock as at 1 April 2010 in line with the proper practice set out in the Government guidance Stock Valuation for Resource Accounting:
36. Impairment Losses

94
Guidance for Valuers - 2010. A proportion of the assets were revalued downwards and revaluation losses in excess of the Revaluation Reserve balances for those assets totalling £28,739,403 were debited to the Surplus or Deficit on the Provision of Services. Two dwellings have been let at non-HRA rents and have therefore ceased to deliver the same level of benefit to residents of the Royal Borough and as a result, an impairment of £23,277 has been debited to the Surplus or Deficit on the Provision of Services.
The Council terminated the contracts of a number of employees in 2010-11 incurring liabilities of £1.6 million which is due to be paid and accounted for in the Balance Sheet. The Council also made £4.9 million of contributions to the Severance Reserve for future costs.
Participation in Pension Schemes
As part of the terms and conditions of employment of its officers, the Council makes contributions towards the cost of post employment benefits. Although these benefits will not actually be payable until employees retire, the Council has a commitment to make the payments that needs to be disclosed at the time that employees earn their future entitlement. The Council participates in two funds, both of which form part of the Local Government Pension Scheme which is a funded defined benefit final salary scheme, meaning that the Council and employees pay contributions into a fund, calculated at a level intended to balance the pensions liabilities with investment assets. The Council participates in the Kensington and Chelsea Pension Fund, which it administers and also that of the London Pension Fund Authority (LPFA). The Council does not award discretionary post retirement benefits upon early retirement and has not done so for many years. All such discretionary awards which were made in the past are now funded as part of the employers‟ contributions. When early retirements occur, an amount is paid directly to the Fund to cover the capital costs arising.
37. Termination Benefits
38. Defined Benefit Pension Schemes

95
Transactions Relating to Post-employment Benefits The Council recognises the cost of retirement benefits in the reported cost of services when they are earned by employees, rather than when the benefits are eventually paid as pensions. However, the charge the Council is required to make against council tax is based on the cash payable in the year, so the real cost of post employment/retirement benefits is reversed out of the General Fund via the Movement in Reserves Statement. The following transactions have been made in the Comprehensive Income and Expenditure Statement and the General Fund Balance via the Movement in Reserves Statement during the year:
RBKC Pension Scheme LPFA Pension Scheme
31 March
11 31 March
10 31 March
11 31 March
10
£'000 £'000 £'000 £'000
Comprehensive Income and Expenditure Statement (CIES)
Cost of Services:
Current service cost 21,636 4,854 266 196 Past service costs (59,075) 5,371 (2,113) 0 Settlements and curtailments (548) (1,782) 0 0
Financing and Investment Income and Expenditure:
Interest cost 36,818 30,443 1,510 1,567 Expected return on scheme assets (24,155) (19,447) (1,114) (734)
Total Post Employment Benefit Charged to the Deficit on the Provision of Services (25,324) 19,439 (1,451) 1,029
Other Post Employment Benefit Charged to the CIES:
Actuarial gains and losses* (111,592) 159,386 (8,817) 8,245
Total Post Employment Benefit Charged to the CIES (136,916) 178,825 (10,268) 9,274
Movement in Reserves Statement
Reversal of net charges made to the deficit for the Provision of Services for post employment benefits in accordance with the Code 26,775 (20,468) - -
Actual amount charged against the General Fund Balance for pensions in the year
Employers‟ contributions payable to scheme 20,452 20,447 337 375
* As reported in the CIES: Actuarial (gains)/losses on pension assets/liabilities

96
Assets and Liabilities in Relation to Post-employment Benefits
Reconciliation of present value of the scheme liabilities (defined benefit obligation):
Funded liabilities: RBKC
Pension Scheme
£’000
Funded liabilities: LPFA
Pension Scheme
£’000
2010-11 2009-10 2010-11 2009-10
Opening balance at 1 April 714,167 443,712 33,312 23,175
Current service cost 20,150 8,845 266 196
Interest cost 36,818 30,443 1,510 1,567
Contributions by scheme participants 5,701 6,379 62 74
Actuarial gains and losses (95,155) 243,347 (5,143) 9,524
Benefits paid (17,198) (18,931) (1,264) (1,092)
Past service costs (59,075) 0 (2,113) 0
Curtailments 44 1,782 0 0
Unfunded Pension Payments (1,376) (1,410) (132) (132)
Closing balance at 31 March 604,076 714,167 26,498 33,312
Reconciliation of fair value of the scheme (plan) assets:
Funded liabilities: RBKC
Pension Scheme
£’000
Funded liabilities: LPFA
Pension Scheme
£’000
2010-11 2009-10 2010-11 2009-10
Opening fair value of scheme assets 407,001 294,924 18,755 17,517
Expected rate of return 24,155 19,447 1,114 734
Actuarial gains and losses 16,437 83,961 3,674 1,279
Employer contributions (including
unfunded)
19,558 22,631 337 375
Contributions by scheme participants 5,701 6,379 62 74
Benefits paid (18,574) (20,341) (1,396) (1,224)
Entity combinations
Settlements
Closing balance at 31 March 454,278 407,001 22,546 18,755
The expected return on scheme assets is determined by considering the expected returns available on the assets underlying the current investment policy. Expected yields on fixed interest investments are based on gross redemption yields as at the Balance Sheet date. Expected returns on equity investments reflect long-term real rates of return experienced in the respective markets.

97
Scheme History
31 Mar ‘08
£000
31 Mar ‘09
£000
31 Mar ‘10
£000
31 Mar ‘11
£000
Present value of liabilities:
RBKC Pension Scheme 448,689 443,712 714,167 604,076
LPFA Pension Scheme 24,046 23,175 33,312 26,498
Fair value of assets
RBKC Pension Scheme 364,767 294,924 407,001 454,278
LPFA Pension Scheme 20,085 17,517 18,755 22,546
Surplus/(deficit) in the scheme: RBKC Pension Scheme (83,922) (148,788) (307,166) (149,798)
LPFA Pension Scheme (3,961) (5,658) (14,557) (3,952)
Total (87,883) (154,446) (321,723) (153,750)
The liabilities show the underlying long-run commitments that the Council has to meet to pay post employment retirement benefits. The total liability of £154 million has a substantial impact on the net worth of the Council recorded in the Balance Sheet. However, statutory arrangements for funding the deficit mean that the financial position of the Council remains healthy: the deficit scheme will be made good by maintaining a high level contributions over the remaining working life of employees i.e. before payments fall due, as assessed by the scheme actuary.
Finance is only required to be raised to cover discretionary benefits when the pensions are actually paid.
The total contribution the Council expects to make to the Pension Fund in the financial year to 31 March 2012 is £17,200,000. Expected contributions for the LPFA scheme in the year to 31 March 2012 are £380,000.
Basis for Estimating Assets and Liabilities
Liabilities have been assessed on an actuarial basis using: the projected unit credit method, an estimate of the pensions that will be payable in future years dependent on assumptions about mortality rates, salary levels and etc. Both the Local Government Pension Scheme and discretionary benefits liabilities have been assessed by IC Uffarez, Ebbendean and Partners, an independent firm of actuaries. Estimates for the Pension Fund are based on the latest full valuation of the scheme as at 1 April 2010.

98
The principal assumptions used by the actuary have been:
RBKC
Pension Scheme
LPFA
Pension Scheme
2010-11 2009-10 2010-11 2009-10
Long-term expected rate of return on assets in the
scheme:
Equity investments 6.4% 6.5% 7.2% 7.3%
Gilts 4.4% 4.5% 4.4% 4.5%
Other bonds 5.5% 5.5%
Target return portfolio 5.0% 5.0%
Property 5.4% 5.5%
Cash 3.0% 3.0% 3.0% 3.0%
Mortality assumptions: Longevity at 65 for current pensioners (in years):
Men 18.9 19.6 20.2 21.0
Women 23.0 22.5 22.9 23.4
Longevity at 65 for future pensioners: Men 20.9 20.7 22.2 22.0
Women 24.9 23.6 24..8 24.2
Rate of inflation 3.5% 3.9% 3.5% 3.9%
Rate of increase in salaries 5.0% 5.4% 4.5% 5.4%
Rate of increase in pensions 2.7% 3.9% 2.7% 3.9%
Rate for discounting scheme liabilities 5.5% 5.5% 5.5% 5.5%
Take-up of option to convert annual pension into retirement
lump sum
50% 50% 50% 50%
The Pension Fund‟s assets consist of the following categories, by proportion of the total assets held:
31 March 2011
%
31 March 2010
%
Equity investments 79.0 70.7
Gilts 10.0 10.3
Property 4.2 4.7
Private equity 3.8 3.4
Cash 3.0 10.8
100.0 100.0

99
History of Experience Gains and Losses
The actuarial gains identified as movements on the Pensions Reserve in 2010-11 can be analysed into the following categories, measured as a percentage of assets or liabilities at 31 March 2011:
2007-08 2008-09 2009-10 2010-11
% % % %
Differences between the expected and actual return on assets (1.67) 2.45 0.61 (0.77)
Experience gains and losses on liabilities 0.22 1.12 0.18 (0.57)
At 31 March 2011, the Council had the following contingent liabilities:
During 1992-93, the then Council‟s insurers, Municipal Mutual Insurance (MMI), ceased accepting new business. The Council is a member of a scheme of arrangement that has been put into place to try to ensure an orderly settlement of the run-off of MMI. Claim payments to date that are liable to „claw-back‟ if the scheme of arrangement is triggered, amount to a maximum of £1.94 million as at 31 March 2011. (Of which, £365,000 relates to the LRB functions.) In addition, estimated claims amounting to £285,000 (of which £130,000 relates to the LRB) remain outstanding. It is not possible at this time to determine the likelihood of the scheme of arrangement being called upon, but there are court cases relating to mesothelioma and asbestosis that increase the probability that the scheme of arrangement will be invoked.
The Government has decided that local authority planning departments can no longer charge for personal searches and that previous customers can request refunds. The Council estimates its maximum exposure to refunds is £250,000.
The Council has made a public commitment to funding a Crossrail station in the north of the Borough. This does not constitute a legally binding contract and the Council is awaiting a final decision by government.
39. Contingent Liabilities

100
The Council has made claims where either the policy of Her Majesty‟s Revenue and Customs (HMRC) has changed, or where legal judgements have changed the Valued Added Tax (VAT) treatment of a service. „Fleming claims‟ are claims for overpaid VAT, potentially going back as far as the inception of VAT in 1973. They followed the House of Lords judgements in January 2008 in the cases of Fleming and Conde Nast, which both concerned the way that the three-year time limit on making claims had been introduced by HMRC. At 31 March 2011, the Council had contingent assets relating to the following VAT claims, none of which are individually material to the Council:
Nature of Claim Amount of Claim
£’000
Off Street Car Parking 3,023
Off Street Car Parking (Fleming Claim) 1,750
Building Control Fees (Fleming Claim) 692
Trade Waste 2,916
Total 8,381
The claims are subject to litigation and therefore the timing and amounts that may be paid to the Council are uncertain. Financial liabilities and financial assets represented by loans and receivables are carried on the Balance Sheet at amortised cost. Their fair
Key Risks The Council‟s activities expose it to a variety of financial risks, the key risks are:
Credit risk: the possibility that other parties might fail to pay amounts due to the Council.
Liquidity risk: the possibility that the Council might not have funds available to meet its commitments to make payments.
Re-financing risk: the possibility that the Council might be requiring to renew a financial instrument on maturity at disadvantageous interest rates or terms.
Market risk: the possibility that financial loss might arise for the Council as a result of changes in such measures as interest rate movements.
Overall Procedures for Managing Risk The Council‟s overall risk management procedures focus on the unpredictability of financial markets, and are structured to implement suitable controls to minimise these risks. The procedures for risk management are set out through a legal framework based on the Local Government Act 2003 and the associated regulations. These require the Council to comply with CIPFA‟s Prudential Code and Code of Practice on Treasury Management in the Public Services together with investment guidance issued through the Act. Overall these procedures require the Council to manage risk in the following ways:
by formally adopting the requirements of the Code of Practice on Treasury Management in the Public Services;
40. Contingent Assets
41. Nature and Extent of Risks Arising from Financial Instruments

101
by the adoption of a Treasury Policy Statement and treasury management clauses within its constitution;
by approving annually in advance prudential and treasury indicators for the following three years limiting the Council‟s:
o overall borrowing; o maximum and minimum exposures to fixed and variable rates; o maximum and minimum exposures for the maturity structure of its debt; o maximum annual exposures to investments maturing beyond a year; and
by approving an investment strategy for the forthcoming year that sets criteria for both investing and selecting investment counterparties in compliance with the Government guidance.
These are required to be reported and approved at or before the Council‟s Council Tax is set and Revenue Budget approved. These items are reported with the Annual Treasury Strategy, which outlines the detailed approach to managing risk in relation to the Council‟s financial instrument exposure. Actual performance is also reported after each year, as is a mid-year update. These policies are implemented by the treasury team. The Council maintains written principles for overall risk management and written policies (Treasury Management Practices – TMPs) covering specific areas such as interest rate risk, credit risk and the investment of surplus cash. These TMPs are a requirement of the Code of Practice and are reviewed regularly. Credit Risk Credit risk arises from deposits with banks and financial institutions as well as credit exposure to the Council‟s customers. This risk is minimised through the Annual Investment Strategy, which requires that deposits are not made with financial institutions unless they meet identified minimum credit criteria. The Annual Investment Strategy also considers maximum amounts in respect of each financial institution. Deposits are not made with banks and financial institutions unless they meet the minimum requirements of the investment criteria. Additional selection criteria are also applied after this initial criteria is applied. The following analysis summarises the Council‟s potential maximum exposure to credit risk arising from the Council‟s investment activities, based on past experience, current market conditions and the Council‟s experience of its customer collection levels over the last five financial years: Amount
at 31 March 2011
Historical experience of default
Adjustment for market conditions at 31 March
2011
Estimated maximum
exposure to default
£’000 % % £’000
Deposits with banks and financial institutions „AAA‟ rated counterparties 95,115 0 0 0 „AA‟ rated counterparties 78,054 0 0 0 „A‟ rated counterparties 63 0 0 0 Other counterparties 0 0 0 0
173,232 0 0 0

102
The table above does not include non investment activity related financial instruments such as trade debtors are disclosed in Note 15.
While the ongoing crisis in international markets has raised the overall possibility of default, the Council maintains strict credit criteria for investment counterparties and has actively placed funds with low risk institutions such as the Debt Management Office. No breaches of the Council‟s counterparty criteria occurred during the reporting period and the Council does not expect any losses from non-performance by any counterparty in relation to outstanding deposits or non investment activity related financial instrument. In the unlikely event that the payment due for the sale of the Holland Park School southern site (deferred capital receipt disclosed in Note 16 Debtors) is not paid to the Council, the Council will be able to resell the land site potentially to recover the amount due as the debt is protected by a legal charge over the site. Liquidity Risk The Council manages its liquidity position through the risk management procedures set out above and through cash flow management procedures required by the Code of Practice on Treasury Management in the Public Services. This seeks to ensure that cash is available when needed. The Council has ready access to borrowings from the money markets to cover any day-to-day cash flow needs, while the PWLB provides access to longer term funds, it also acts as a lender of last resort to local authorities (although it will not provide funding to an authority whose actions are unlawful). The Council is also required to provide a balanced budget through the Local Government Finance Act 1992, which ensures sufficient monies are raised to cover annual expenditure. Thus there is no significant risk that the Council will be unable to raise finance to meet its commitments under financial instruments. Refinancing and Maturity Risk The Council maintains a significant debt and investment portfolio. While the cash flow procedures above are considered against the refinancing risk procedures, longer term risk to the Council relates to managing the exposure to replacing financial instruments as they mature. This risk relates to both the maturing of longer term financial liabilities and longer term financial assets. The approved prudential indicator limits for the maturity structure of debt and the limits placed on investments for greater than one year in duration are the key parameters used to address this risk. The Council‟s treasury and investment strategies address the main risks and the treasury team address the operational risks within the approved parameters. This includes:
monitoring the maturity profile of financial liabilities and amending the profile through either new borrowing or the rescheduling of the existing debt; and
monitoring the maturity profile of investments to ensure sufficient liquidity is available for the Council‟s day to day cash flow needs and spread of longer term investments provide stability of maturities and returns in relation to the longer term cash flow needs.

103
The maturity analysis of financial liabilities is as follows: £’000
Less than one year 14,604 Between one and two years 6,225 Between two and five years 22,599 Between five and ten years 39,126 Between ten and fifteen years 45,746 More than fifteen years 56,500 Total 184,800
The maturity analysis of financial assets is as follows: £’000
Less than one year 133,918 Between one and two years 39,388 Between two and three years 0 More than three years 0 Total 173,306
The above tables exclude trade payables and receivables all of which are due to be paid/received within one year. The maturity analysis of financial assets excludes the deferred capital receipt in respect of the disposal of Holland Park School southern site which is due to be received between two and three years. Market risk Interest Rate Risk: The Council is exposed to interest rate movements on its borrowings and investments. Movements in interest rates have a complex impact on the Council, depending on how variable and fixed interest rates move across differing financial instrument durations. For instance, a rise in variable and fixed interest rates would have the following effects:
Borrowing at variable rates: the interest expense charged to the Comprehensive Income and Expenditure Statement will rise.
Borrowing at fixed rates: the fair value of the borrowing liability will fall (no impact on revenue balances).
Investments at variable rates: the interest income credited to the Comprehensive Income and Expenditure Statement will rise.
Investments at fixed rates: the fair value of the assets will fall (no impact on revenue balances).
Borrowings are not carried at fair value on the Balance Sheet, so nominal gains and losses on fixed rate borrowings would not impact on the Surplus or Deficit on the Provision of Services or Other Comprehensive Income and Expenditure. However, changes in interest payable and receivable on variable rate borrowings and investments will be posted to the Surplus or Deficit on the Provision of Services and affect the General Fund Balance, subject to influences from Government grants. Movements in the fair value of fixed rate investments that have a quoted market price will be reflected in the Comprehensive Income and Expenditure Statement. The Council has a number of strategies for managing interest rate risk. The Annual Treasury Strategy draws together the Council‟s prudential and treasury indicators and its expected

104
treasury operations, including an expectation of interest rate movements. The Strategy sets a treasury indicator that provides maximum and minimum limits for fixed and variable interest rate exposure. The treasury team monitors market and forecast interest rates within the year and adjusts exposure appropriately. For instance, during periods of falling interest rates and where economic circumstances make it favourable, fixed rate investments may be taken for longer periods to secure better long term returns, similarly the drawing of longer term fixed rate borrowing would be postponed. The risk of interest rate loss is partially mitigated by Government grant payable on financing costs. The Council has no variable rate borrowing and no fixed rate investments. If all interest rates had been 1 per cent higher with all other variables held constant the financial effect would be: £’000
Increase in interest payable on variable rate borrowings 0 Increase in interest receivable on variable rate investments (1,857)
Impact on the CIES (1,857) Increase in Government grant receivable for financing costs 0 Share of overall impact debited to the HRA 218 Decrease in fair value of fixed rate investment assets 0 Decrease in fair value of fixed rate borrowings liabilities (no impact CIES) 28,756
The approximate impact of a 1 per cent fall in interest rates would be as above, but with the movements being reversed. These assumptions are based on the same methodology as used in the note: Fair Value of Assets and Liabilities carried at Amortised Cost. Price risk: the Council, excluding the Pension Fund, does not generally invest in equities or marketable bonds. Foreign exchange risk: the Council has no financial assets or liabilities denominated in foreign currencies. It therefore has no exposure to loss arising from movements in exchange rates.
Under the Building (Local Authority Charges) Regulations 1998, local authorities are required to disclose the costs and income derived from the building control functions prescribed in Regulation 4 of the Charges Regulations. The objective is to fully recover costs over a three year rolling period. 2010-11 2009-10 £’000 £’000
Expenditure Employee Costs 782 1,003 Transport 18 20 Supplies and Services 152 116 Support Services 280 243
Total Expenditure 1,232 1,382
Income Building Regulation Charges 1,117 1,131
Total Income 1,117 1,131
42. Building Regulations Charges Statement

105
Surplus/(Deficit) (115) (251)
Surplus/(Deficit) on a rolling 3 year period (442) (47)
2010-11 2009-10 £’000 £’000
Press and Public Relations Salaries 429 368 Other Costs 147 194 Misc. Advertising 338 336 Staff Recruitment Costs 150 440
Total 1,064 1,338
2011 2010 £’000 £’000
Net Pensions liability (153,750) (321,723) Long term Lease liability (110) (212) Deferred Liabilities (643) (889)
Total (154,503) (322,824)
43. Expenditure on Publicity
44. Long term Liabilities

106
31 March 2010
Comprehensive Income and Expenditure Statement
As Reported
IFRS Restated
(Extract) Net Income £000s
Net Income £000s
Difference £'000
Comments
Other Operating Expenditure
(Gain) / loss on disposal of non current assets
-85,937 -75,427 -10,510 Deferred Capital receipt revised - discounted to present value in accordance with guidance.
Financing and Investment Income and Expenditure
Changes in fair value of investment properties
- -22,659 22,659 Under IFRS there is now a requirement to recognise changes in the market value of Investment Properties in the Comprehensive Income and Expenditure Statement as opposed to the Revaluation Reserve.
Taxation and Non-Specific Grant Income
Recognised capital grants and contributions
- -15,177 15,177 New requirement to recognise capital grants in the corporate section of the Comprehensive Income and Expenditure Statement. This was previously recorded within service lines.
Other Comprehensive Income and Expenditure:
Revaluation gains - -135,921 135,921 Previously part of the Statement of Total Recognised Gains and Losses - a statement which has now been integrated into the Comprehensive Income and Expenditure Statement.
45. Key changes arising from the transition to IFRS

107
Balance Sheet (Extract) 2009 2010
31 Mar 09 31 Mar 09 Difference 31 Mar 10 31 Mar 10 Difference Comments
As Reported
£’000 Restated
£'000
As Reported
£'000 Restated
£'000
NON-CURRENT ASSETS
Property, Plant and Equipment
Other Land and Buildings 614,410 605,023 (9,387) 563,610 575,999 12,389 Reclassification of Asset Category per guidance.
Surplus Assets, held for disposal
6,596 - (6,596) 11,470 - (11,470) Reclassification of Asset Category per guidance.
LONG-TERM LIABILITIES
Government Grants Deferred
(20,693) - 20,693 (26,375) - 26,375 Item removed under IFRS. The balance has been written to the Capital Adjustment Account.
RESERVES
Unusable Reserves Revaluation Reserve (415,457) (347,847) 67,611 (553,097) (457,560) 95,536 Investment properties no longer recognised in the Revaluation Reserve.
Capital Adjustment Account
(571,144) (649,984) (78,840) (554,057) (674,994) (120,937) This includes multiple changes relating to fixed assets and grants, including the write-out of the government grants deferred balance and the write-out of investment property revaluations.
Deferred Capital Receipts / Credits
(101) (101) - (94,569) (84,120) 10,449 Deferred Capital receipt revised - discounted to present value in accordance with guidance and External Audit opinion.

108

109
Supplementary Financial Statements 2010-11

110

111
The Housing Revenue Account (HRA) Income and Expenditure Statement shows the economic cost of providing housing services in accordance with generally accepted accounting practices, rather than the amount to be funded from rents and Government grants. The Council charges rents to cover expenditure in accordance with regulations; this may be different from the accounting cost. The increase or decrease in the year, on the basis on which rents are raised, is shown in the Movement on the Housing Revenue Account Statement.
31 March ‘11 31 March ‘10 Notes
£'000 Restated
£'000
Expenditure
Repairs and maintenance 11,104 11,721
Supervision and management 17,686 18,245
Rents, rates, taxes and other charges 139 178
Depreciation and impairment of fixed assets
On dwellings 6,834 6,623 1a
On non dwellings 179 136 Impairments 37,427 13,542 1a
Debt management costs 123 125
Bad Debt Provision made in year (515) 501 8 Revenue Expenditure Funded from Capital Under Statute
1,098
Total Expenditure 72,977 52,169
Income
Dwelling rents (32,636) (31,830)
Non-dwelling rents (3,048) (3,525)
Charges for services and facilities (8,774) (9,476)
Contributions towards expenditure (468) (481) HRA Subsidy receivable (including the MRA element) (4,446) (5,715) 2
Total Income (49,372) (51,027)
Net cost of HRA services as included in the Council’s Income and Expenditure Statement 23,605 1,142
HRA service‟s share of Corporate and Democratic Core 38 42
Net Cost of HRA Services 23,643 1,184
HRA share of the operating income and expenditure included in the Comprehensive Income and Expenditure Statement:
Interest payable and similar charges 11,989 12,913 6 Amortisation of Premiums and Discounts 0 0
Interest and Investment Income (95) (83) Government Grants Applied (1,954) (1,098) (Surplus)/deficit for the year on HRA services 33,583 12,916
The Housing Revenue Account Income and Expenditure Statement nces

112
31 March ‘11 31 March ‘10 Notes
£'000 Restated
£'000
(Surplus) / Deficit for the year on the HRA Income and Expenditure Account 33,583 12,916
Transfers to/(from) Major Repairs Reserve (179) (135) Contributions to/(from) Reserves 793 (512) Capital expenditure funded by the Housing Revenue Account 50 50 Government Grants Applied 1,954 1,098 3
Impairment of Fixed Assets (37,427) (13,542) 1a Neutralisation of REFCUS 0 (1,098)
(Increase) / decrease in the Housing Revenue Account Balance (1,226) (1,223)
Housing Revenue Account surplus brought forward (10,595) (9,372)
Housing Revenue Account surplus carried forward (11,821) (10,595)
Movement on the HRA Statement nces

113
1a. Movement on Balances 2010-11
Council Dwellings
Other Land and Buildings
Vehicles, Equipment Plant and Furniture
Infrastructure Assets
Community Assets
Surplus Assets
Assets Under Construction
Investment Properties
Total
£’000 £’000 £’000 £’000 £’000 £’000 £’000 £’000
Cost or Valuation
At 1 April 2010 572,236 20,888 48 0 0 0 730 39,434 633,336
Additions 8,742 1,472 0 0 0 0 0 0 10,214
Revaluation increases / (decreases) and impairments recognised in the Revaluation Reserve 51,235 0 0 0 0 0 0 0 51,235 Revaluation increases / (decreases) and impairments recognised in the CIES (37,427) 0 0 0 0 0 0 0 (37,427) Transfers in 0 0 0 0 0 0 0 0 0
Transfers out 0 0 0 0 0 0 0 0 0
Derecognition - disposals (131) (905) 0 0 0 0 0 0 (1,035)
At 31 March 2011 594,656 21,455 48 0 0 0 730 39,434 656,323
Accumulated Depreciation and Impairment
At 1 April 2010
0 0 7 0 0 0 0 0 7
Depreciation charge 6,834 168 7 0 0 0 0 0 7,009
Revaluations 0 0 0 0 0 0 0 0 0
Impairments 8,664 0 0 0 0 0 0 0 8,664
Transfers in 0 0 0 0 0 0 0 0 0
Transfers out 0 0 0 0 0 0 0 0 0
Derecognition - disposals 0 0 0 0 0 0 0 0 0
At 31 March 2011 15,498 168 14 0 0 0 0 0 15,680
Net Book value
At 31 March 2011 579,158 21,286 35 0 0 0 730 39,434 640,643
At 31 March 2010 572,236 20,888 41 0 0 0 730 39,434 633,329
Notes to the HRA Statement nces

114
1a. Movement on Balances 2009-10 Council
Dwellings Other
Land and Buildings
Vehicles, Equipment Plant and Furniture
Infrastructure Assets
Community Assets
Surplus Assets
Assets Under Construction
Investment Properties
Total
£’000 £’000 £’000 £’000 £’000 £’000 £’000 £’000
Cost or Valuation
At 1 April 2009 470,153 13,836 48 0 0 0 902 45,710 530,649
Additions 11,350 1,567 0 0 0 0 0 0 12,917
Revaluation increases / (decreases) and impairments recognised in the Revaluation Reserve 104,424 6,280 0 0 0 0 0 0 110,704 Revaluation increases / (decreases) and impairments recognised in the CIES (13,691) (795) 0 0 0 0 (172) (6,276) (20,934) Transfers in 0 0 0 0 0 0 0 0 0
Transfers out 0 0 0 0 0 0 0 0 0
Derecognition - disposals 0 0 0 0 0 0 0 0 0
At 31 March 2010 572,236 20,888 48 0 0 0 730 39,434 633,336
Accumulated Depreciation and Impairment
At 1 April 2009
24,801 215 0 0 0 0 0 0 25,016
Depreciation charge 6,623 147 7 0 0 0 0 0 6,776
Revaluations (31,424) (362) 0 0 0 0 0 0 (31,786)
Impairments 0 0 0 0 0 0 0 0 0
Transfers in 0 0 0 0 0 0 0 0 0
Transfers out 0 0 0 0 0 0 0 0 0
Derecognition - disposals 0 0 0 0 0 0 0 0 0
At 31 March 2010 0 0 7 0 0 0 0 0 7
Net Book value
At 31 March 2010 572,236 20,888 41 0 0 0 730 39,434 633,329
At 31 March 2009 445,351 13,620 48 0 0 0 902 45,710 505,632

115
1b. Value of Land and Dwellings Within the dwellings category, the 31 March 2011 Net Book Value comprises £377,400,450 land and £201,757,920 dwellings. The total value of the property in other balance sheet categories is £61,484,673. On the 1 April 2010, Net Book Value comprised £377,457,750 land and £208,254,600 dwellings. The total value of the property in other balance sheet categories was £61,092,672. 1c. Number and Types of Dwelling
MRA Archetype 01/04/2011 01/04/2010 Difference
Houses Small Terraced <1945 0 0 0
Houses Semi Detached <1945 1 1 0
Houses Other <1945 57 57 0
Houses Small Terraced 1945-1964 0 0 0
Houses SD/Large Terraced 1945-1964
7 7 0
Houses 1965-1974 10 10 0
Houses 1974+ 67 67 0
Houses (Non Traditional) 0 0 0
Bungalows 12 12 0
Low-Rise Flats <1945 210 210 0
Low-Rise Flats >1945 200 201 -1
Medium 3661 3663 -2
High Rise 2650 2652 -2
Multi-Occupancy 46 44 2
Total 6921 6924 -3
1d. Depreciation Council Dwellings: The Major Repairs Allowance, calculated by the Government, has been used as a proxy for depreciation and componentisation in line with Government guidance. The most recent valuation of the housing stock estimated the remaining useful lives of individual dwellings at between 50 and 100 years. Use of the Major Repairs Allowance in lieu of a calculation based on the estimated useful lives of the dwellings has no material impact on the accounts. Land is not depreciated because it has an indefinite useful life. Other Land and Buildings: With the exception of the basements at Elm Park Gardens that are not yet available for use and thus are not being depreciated, buildings are depreciated on a straight line basis over their estimated useful lives, generally between 25 and 50 years. Land is not depreciated because it has an indefinite useful life. Vehicles, Equipment, Plant and Furniture Depreciation is calculated on a straight line basis over the anticipated useful life of the asset. Vehicles are normally depreciated over 7 years, furniture 7 years, plant between 9 to 30 years and equipment 3 to 10 years.

116
Assets Under Construction In line with proper practice, Assets Under Construction are not depreciated. Investment Properties In line with proper practice, Investment Properties are not depreciated. 1e. Vacant Possession Value and Valuation Basis Council dwellings are valued in accordance with Government Guidance Stock Valuation for Resource Accounting: Guidance for Valuers - 2010 using the „beacon principle‟ to reach a valuation known as the Existing Use Value-Social Housing (EUV-SH). The beacon principle divides dwellings into: archetypes, which share similar characteristics such as design, age, type or construction; and asset groups, which broadly reflect the location of the dwellings. A sample of properties from each archetype within each asset group is visited and valued to provide a representative market price that is used as the open market valuation for every dwelling within that archetype for each asset group. The valuation assumes the dwelling is vacant and is based on a price that would be agreed between a willing buyer and a willing seller in an arms length transaction that is freely entered into. EUV-SH discounts the open market valuation to take into account that a Council dwelling is worth less than its open market value because:
a) The sitting tenants enjoy occupation at less than open market rentals. b) Rentals increase at a rate that is less than the Retail Price Index. c) The sitting tenants have greater rights than the norm, such as Right to Buy. d) The Landlord (the Council) has greater liabilities than the norm, such as insurance,
repairs, maintenance and statutory obligations. The difference between the open market price and the EUV-SH valuation is known as the „Adjustment Factor‟ and is the economic cost of providing social housing. The Council uses an adjustment factor of 70 per cent. The gross balance sheet value of the Council's dwellings and the land they occupy is therefore 30 per cent of the open market price. The table below sets out the value of the Council's dwellings and the land they occupy based on the historic cost model, their market value, EUV-SH valuation and current carrying value. The current carrying value is the EUV-SH valuation after depreciation, disposals, capital investment, disposals, revaluations and impairments that took place in 2010-11.
Council
Dwellings
£'000
Carrying amount if assets had been carried under the cost model 400,786
Market Value 1,952,375
Gross EUV-SH valuation as at 1 April 2010 585,712
Current carrying value 579,158
*Please note that prior to 1 April 2007, local authorities did not use the current cost model when accounting for non-current assets. Therefore, the carrying amount of the dwellings category if the assets were carried under the historic cost model, as required by IFRS, is based upon the carrying value of the assets as at 1 April 2007.

117
1f. Impairments Under the „Existing Use Valuation - Social Housing‟ methodology, the Council's capital expenditure on its dwelling stock does not increase the value of the assets on a pound-for-pound basis; at best the value of a dwelling will be increased by only 30 per cent of the capital expenditure incurred upon it. The Code and associated Guidance Notes for Practitioners require the Council to impair an asset accordingly where the value of an asset increases by less than the capital expenditure incurred on it. The Council's Property Services department and external advisors have confirmed that the value of the Council's dwellings remained static in 2010-11 under the beacon system and thus the EUV-SH value remained static. Therefore, the Council has impaired £8,664,117 it spent enhancing its dwelling stock and charged the impairment to the Surplus or Deficit on the Provision of Services. Two dwellings have been let at non-HRA rents and have therefore ceased to deliver the same level of benefit to residents of the Royal Borough and as a result, an impairment of £23,277 has been debited to the Surplus or Deficit on the Provision of Services. The Council conducted a full revaluation of its dwelling stock as at 1 April 2010 in line with the proper practice set out in the Government guidance Stock Valuation for Resource Accounting: Guidance for Valuers - 2010. A proportion of the assets were revalued downwards and revaluation losses in excess of the Revaluation Reserve balances for those assets totalling £28,739,403 were debited to the Surplus or Deficit on the Provision of Services. 2. HRA Subsidy The Housing Revenue Account subsidy paid by the Government can be broken down as follows:
2010-11 2009-10 £’000 £’000
Received in – year 4,584 5,929
Prior year adjustment 15 60
Total Received 4,599 5,989 Due:
Management and Maintenance 17,424 17,202 Rents (33,317) (32,362) Interest on receipts (5) (7) Debt Charges 10,020 10,784 ALMO Allowance 3,475 3,475 Major Repairs Allowance 6,834 6,623
Total Due 4,431 5,715 Prior year adjustment 15 60
Total Due 4,446 5,775
Amount due to/(from) Government 153 214

118
3. Capital Expenditure
Capital Expenditure £’000 Funding Sources £’000
Land 0 Borrowing 199 Dwellings 8,742 Capital Grants & Contributions 1,954 Other Property 1,472 Usable Capital Receipts 991 Direct Revenue Financing 531 Major Repairs Reserve 6,539
Total 10,214 10,214
4. Revenue Expenditure Funded from Capital Under Statute (REFCUS) REFCUS comprises: capital expenditure on non-asset related items; maintenance that is capital expenditure under statute, but revenue expenditure under accounting rules; and expenditure below the de minimis threshold. REFCUS is charged to the Comprehensive Income and Expenditure Statement, although there is no effect on the bottom line on the Housing Revenue Account.
2010-11 2009-10 Net
Expenditure Net
Expenditure £’000 £’000
Capital Expenditure Written to revenue 0 1,098
5. Capital Receipts in Year A summary of the total capital receipts within the HRA is shown below:
2010-11 2009-10 £’000 £’000
Land 0 0
Dwellings (net of sale expenses) 1.938 1,133
Other Property 1,283 982
Loan Repayments 16 33
3,237 2,148
6. Capital Charges in the HRA Charges for capital expenditure are made to the HRA as follows: £’000 £’000
Item 8 charge based on actual interest paid by RBKC 11,989 12,913
Value of amortised premia 0 0
Total 11,989 12,913
To reflect the true cost to the HRA of its borrowing, a figure calculated by reference to the Council‟s overall borrowing costs is charged to the HRA, known as the Item 8 charge. The HRA is also liable to a share of the amortised value of any premium or discount incurred on the early repayment of loan debt.

119
7. Major Repairs Reserve 2010-11 2009-10 £’000 £’000 £‟000 £‟000
Balance at 1st April 2,166 6,242 INCOME
Contribution from HRA 7,667 6,623
EXPENDITURE
Dwellings 6,539 10,699
Surplus/(Deficit) for year 1,128 (4,076)
Balance at 31st March 3,294 2,166
8. Rent Arrears and Provision for Bad or Doubtful Debts Tenant arrears include: rent; service charges; heating and hot water charges; and arrears from garage and car park rentals. 2010-11 2009-10 Tenant Arrears £’000 £’000
Gross Arrears 1,024 2,623
Net Arrears
Former Tenants * (28) 70
Current Tenants * (874) (824)
Net Arrears at 31 March (902) (754)
*Also includes credit balances representing Receipts in Advance
The Bad Debt Provision in the Revenue Account includes in addition to the £78,000 provision made in year; additional legal costs and Major Works Refunds totalling £423,000. Other Arrears include: service charges, heating and hot water charges; and major works bills payable by leaseholders and rent arrears payable by HRA commercial property tenants. 2010-11 2009-10 Other Arrears £’000 £’000
Gross Arrears 5,147 6,836
Net Arrears
Leaseholder Charges* 4,386 6,066
Commercial Properties 301 289
Net Arrears at 31 March 4,687 6,355
*Also includes credit balances representing Receipts in Advance
Provision for bad debts has been made as follows: 2010-11 2009-10 Provision £’000 £’000
Provision at 1 April 3,863 3,974
Provision Made in Year (515) 78
Write-offs during year (373) (189)
Provision at 31 March 2,975 3,863

120
31 March ‘11 31 March ‘10 Notes
£'000 £'000
Expenditure
Precepts
Royal Borough of Kensington and Chelsea 77,915 77,499
Greater London Authority 30,845 30,687
Total Precepts 108,760 108,186
Business Rates Payment to National Pool 211,277 207,056
Costs of Collection 629 597
Business Rate Supplement Payment to Greater London Authority 10,000 0
Costs of Collection 83 0
Bad and Doubtful Debts/Appeals Write Offs 3,767 2,373
Provisions (3,789) (1,928)
Contributions Towards Previous Years Estimated Collection Fund Surplus 431 516
Total Expenditure 331,158 316,800
Income
From Council Tax 95,542 95,994 4
Transfers from General Fund
Council Tax Benefits 13,510 13,027 Transitional Relief 0 0 4
Collectable from Business Ratepayers 211,906 207,653 2 Collectable from Business Supplement payers 10,103 0 3
Total Income 331,061 316,674
Surplus or (deficit) movement on Fund Balance (97) (126)
31 March ‘11 31 March ‘10 Notes £'000 £'000
Balance at the end of the previous year (90) 36
Surplus or (deficit) movement on Fund Balance (97) (126)
Balance at the end of the year (187) (90)
The Collection Fund Revenue Account Income and Expenditure Statement nces
Collection Fund Reserve nces

121
1. General The Collection Fund (England) is an agent‟s statement that reflects the statutory obligation for billing authorities to maintain a separate Collection Fund. The statement shows the transactions of the billing authority in relation to the collection from taxpayers and distribution to local authorities and the Government of council tax and non-domestic rates. 2. National Non-Domestic Rates (NNDR) Under the arrangements for National Non-Domestic Rates, the Council collects non-domestic rates for its area that are based on local rateable values multiplied by uniform rate poundage. The total amount, less certain reliefs and other deductions, is paid to a central pool (the Pool) managed by the Government, which in turn pays back to authorities their share of the pool based on a standard amount per head of the local adult population. Under these arrangements, the amounts included in these accounts are analysed as follows: 2010-11 2009-10 £’000 £’000
Non Domestic Rates Due 252,734 220,191 Less Allowances and other adjustments
Transitional Relief (29,634) 1,586 Mandatory Reliefs (9,143) (9,913) Empty Property Reliefs 0 0 Discretionary Reliefs (171) (304) Provision for Bad Debts (1,578) (3,676) Transfer to General Fund (302) (231)
Collectable from Business Rate payers Net Contribution to Pool 211,906 207,653
The National Non Domestic Rateable Value at 31 March 2011 was £663,947,243. The standard NNDR multiplier for 2010-11 was 41.4 pence (48.5 pence in 2009-10). The Small Business Rate Relief multiplier for 2010-11 was 40.7 pence (48.1 pence for 2009-10). (Please note that the multipliers for 2010-11 are lower than for 2009-10 to take account of the rateable value revaluation which took effect on 1 April 2010). 3. Business Rate Supplement (BRS) Under the arrangements for the Business Rate Supplement, the Council collects a supplement for its area based on local rateable values in excess of £55,000 multiplied by the designated rate poundage. The total amount, less certain reliefs and other deductions, is paid to the Greater London Authority on whose behalf it is collected. 2010-11 is the first year in which a Business Rate Supplement has been payable. Under these arrangements, the amounts included in these accounts are analysed as follows: 2010-11 2009-10 £’000 £’000
Non Domestic Rates Due 10,692 0 Less Allowances and other adjustments
Mandatory Reliefs (582) 0 Discretionary Reliefs (7) 0
Collectable from Business Rate Supplement payers 10,103 0
Notes to the Collection Fund Revenue Account Income and Expenditure Statement nces

122
The Business Rate Supplement Rateable Value at 31 March 2011 was £549,561,940. The standard BRS multiplier for 2010-11 was 2.0 pence.
4. Council Tax The tax base for the Financial Year 2010-11 was calculated as follows:
Band Capital
Valuation £‟000
Number Of Dwellings
Number of Discounted Dwellings
Multiplier Add back 2nd
Home Discount
Discounted Band D
Equivalents
A 0 - 40 1,292 965 6/9 17 661
B 40 - 52 3,536 2,671 7/9 34 2,111
C 52 - 68 9,174 7,242 8/9 146 6,584
D 68 - 88 13,529 10,651 1 292 10,943
E 88 - 120 13,234 10,586 11/9 435 13,373
F 120 - 160 11,853 9,592 13/9 538 14,393
G 160 - 320 19,678 16,048 15/9 1,435 28,182
H over 320 14,418 12,518 18/9 1,038 26,075
Total: 86,714 70,273 3,935 102,322
Capital valuations are set by reference to 1991 values. The total number of dwellings in each band is reduced to a number of „discounted‟ dwellings which takes account of reductions for:
Dwellings with only one (non student) adult.
Dwellings with one or more students only.
Dwellings in exempt categories e.g. vacant properties.
Dwellings containing people who are „discounted‟ for payment of Council Tax under legislation e.g. severely mentally impaired.
Dwelling subject to discount as second homes. The Council set a Band D charge of £1,079.12 (unchanged from 2009-10). The amounts credited to the Collection Fund are analysed as follows: 2010-11 2009-10 £’000 £’000
Charges for the year including Garden 131,044 130,941 Charges
Less - Exemptions (21,993) (21,920)
- Council Tax Benefit (13,509) (13,027)
Net Charges Payable 95,542 95,994
5. Council Tax Precept Adjustments The estimated balance on the Collection Fund as at 15 January 2011 has to be distributed amongst or collected from the precepting authorities. Although the deficit on the Collection Fund was £187,000 at the 31 March, the sum of £211,000 will be additionally credited to the account in 2011-12 by way of payments from precepting authorities. The adjustment of £431,000 in 2010-11 represents the release of the estimated surplus as at 31 March 2010.

123
Introduction The Council's Pension Fund is a funded defined benefit scheme operated under the provisions of the Local Government Superannuation Acts and provides for pensions, grants on age or ill health retirement, short service grants, death grants, injury allowances and widows' pensions. The Fund is financed by contributions from employers and employees of the Council and admitted / scheduled bodies and by earnings from investment of fund monies. A full list of the admitted and scheduled bodies is shown in Note 15.
The total numbers of active members and beneficiaries at 31 March were as follows:
2010-11 2009-10
Active Members 3,562 3,588
Pensioners and Dependents 2,331 2,235
Former Employees - Deferred Benefits 3,429 3,271
Total 9,322 9,094
Statements of Main Principles Adopted in Compiling the Accounts The Pension Fund accounts have been prepared in accordance with the accounting recommendations of the Financial Reports of Pension Schemes - a Statement of Recommended Practice, (Revised May 2007), Chapter 2 Recommended Accounting Practice. Disclosures are as required by the Code.
Investments In accordance with the requirements of the Code, investments are stated at market value with any surplus or deficit on revaluation being credited direct to the fund balance. The market value of securities is determined by closing bid prices on 31 March. Until 2007-08, mid prices were used under the prevailing SORPs, but bid prices have been quoted since 2008-09. Fixed interest securities are valued on a „clean‟ basis i.e. excluding accrued interest. Purchase and sales transactions in foreign currencies are converted to sterling using a pooled average exchange rate. The property fund of funds is valued at the bid price quoted for 31 March. The private equity investment is the Fund‟s only unquoted investment and is valued from the 31 December 2010 valuation of the investment assets and the cash cost of new investments made between 1 January and 31 March 2011.
External managers administer the investments of the Fund and the cost of this is shown in the Fund Account. Internal administration expenses are charged directly to the Pension Fund on the basis of direct costs plus apportioned overheads.
The Pension Fund nces

124
Benefits Staff pensions are provided from the Pension Fund whose summarised accounts are shown below. All pension payments, except added years relating to early retirements prior to 1998-99, were paid from the Fund. Employers‟ contributions, at rates advised by the Fund's actuaries (Hymans Robertson at the 2007 Valuation), were credited to the Fund as received. Since 1998/99, additional employers‟ contributions have been made as a capital sum to the Pension Fund following the early retirement of employees. The contributions are based on a formula, provided by the actuary, to cover the cost of early payment of pension benefits and discretionary enhancements. Taxation Investments of the Fund are exempt from Capital Gains Tax, but tax on UK Dividends is irrecoverable. All Value Added Tax paid is recoverable. There is a liability for Income Tax at 20 per cent for pensions compounded into a lump sum. This liability is a minimal sum. Other The accounts summarise the transactions and net assets of the Fund. They do not take account of liabilities to pay pensions and other benefits after the period end. The ability of the Fund's contributions and investments to meet its overall obligations is reviewed in detail by a firm of independent actuaries.
The Fund excludes transactions for teachers, lecturers and youth workers that are administered by the Department for Education, to whom the Council makes a payment for this purpose.
The accounts are prepared on an accruals basis with the exception of inter-fund adjustments i.e. transfers to and from other pension funds when employees leave and join, which are accounted for on a cash basis.

125
31 March ‘11 31 March ‘10 Notes
£'000 £'000
Expenditure – Pension Benefits
Benefits Payable
Pensions 14,747 13,881 2
Lump Sums 4,209 4,765 4
Payments to and on behalf of leavers
Refund of Contributions 27 36 Transfer values Paid 4,913 4,983
Pension Administration and other expenses 650 509
Total Expenditure 24,546 24,174
Income – Contributions
Employers‟ Contributions (20,825) (21,101) 5
Employers‟ Contributions- Early Retirements (644) (1,910)
Employees‟ Contributions (6,762) (6,855) 5
Transfer Values Received (4,911) (3,130)
Other income 0 0
Total Income (33,142) (32,996)
Net (Addition) (8,596) (8,822)
Returns on Investments Investment Income (6,987) (8,683) 8
Other Investment Income (234) (1) 8 Change in Market Value (Realised and Unrealised) (42,380) (115,167)
Taxation (Irrecoverable Withholding Tax) 244 284
Investment Management Expenses 1,725 1,682
Net Returns on Investments (47,632) (121,885)
Net Increase / (Decrease) in the Fund during the Year 56,228 130,707 Opening Net Assets of the Fund 463,026 332,319 Closing Net Assets of the Fund 519,254 463,026
The Pension Fund Income and Expenditure Statement nces

126
2011 2010 2009*
% £'000 % £'000 % £'000
Fixed Interest Securities
UK Public Sector 0 0 0 0 8.6 28,534
Index Linked Securities
UK Public Sector 0 0 0 0 9.4 31,287 UK Other 0 0 0 0 0.2 670
Equities
United Kingdom 2.0 10,563 30.2 139,759 25.8 85,768
Overseas 18.0 93,286 31.4 145,218 28.2 93,737
Pooled Investment Vehicles
Overseas Equities 0 0 8.4 38,899 5.5 18,411 Global Equities 59.1 306,687
UK Index-Linked Gilt Fund 9.9 51,532 10.4 47,939 0 0 UK Corporate Bond Fund 0 0 0 0 8.8 29,364
UK Property 4.0 20,937 4.5 20,850 3.0 9,854 Overseas Private Equity 3.8 19,952 3.4 15,808 3.1 10,169
Derivative Contracts 0 0 0 0 0.0 6
Short Term Investments
Fixed Term Bank Deposit 1.0 5,000 0 0 0 0
Cash
Non Current (With Managers) 0.2 829 1.5 6,865 2.2 7,203 Current (Held Directly by Fund) 2.1 10,924 10.1 46,943 5.0 16,461 Accrued Investment Income 0.0 211 0.3 1,512 0.4 1,461 Current Assets
Contributions Due 0.1 340 0.0 135 0.0 111 Current Liabilities
Accrued Fees Due (0.1) (364) (0.1) (285) (0.1) (297) Accrued Lump Sums Payable (0.1) (643) (0.1) (617) (0.1) (420)
Net Assets and Liabilities 100 519,254 100 463,026 100 332,319
*The third balance sheet has been included in accordance with guidance on the transition to IFRS however there are no material differences arising from this transition.
The Pension Fund Net Assets Statement nces
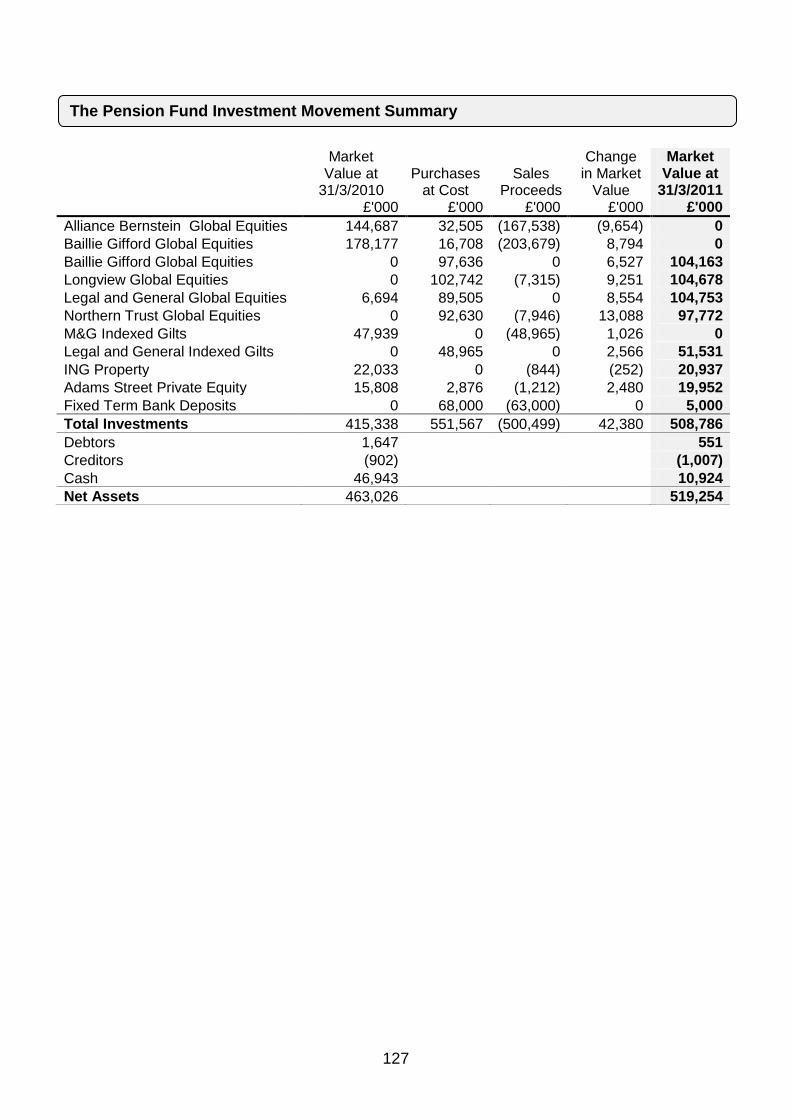
127
Market Value at
31/3/2010 Purchases
at Cost Sales
Proceeds
Change in Market
Value
Market Value at
31/3/2011 £'000 £'000 £'000 £'000 £'000
Alliance Bernstein Global Equities 144,687 32,505 (167,538) (9,654) 0
Baillie Gifford Global Equities 178,177 16,708 (203,679) 8,794 0
Baillie Gifford Global Equities 0 97,636 0 6,527 104,163
Longview Global Equities 0 102,742 (7,315) 9,251 104,678
Legal and General Global Equities 6,694 89,505 0 8,554 104,753
Northern Trust Global Equities 0 92,630 (7,946) 13,088 97,772
M&G Indexed Gilts 47,939 0 (48,965) 1,026 0
Legal and General Indexed Gilts 0 48,965 0 2,566 51,531
ING Property 22,033 0 (844) (252) 20,937
Adams Street Private Equity 15,808 2,876 (1,212) 2,480 19,952
Fixed Term Bank Deposits 0 68,000 (63,000) 0 5,000
Total Investments 415,338 551,567 (500,499) 42,380 508,786
Debtors 1,647
551
Creditors (902)
(1,007)
Cash 46,943
10,924
Net Assets 463,026
519,254
The Pension Fund Investment Movement Summary nces

128
1. The latest actuarial valuation report received is as at 31 March 2010 and was conducted on the basis set out below and supplemented in 2011:
(a) The market value of the scheme‟s assets at 31 March 2010 was £463 million and the actuary assessed the present value of the funded obligation at £751 million indicating a net liability of £288 million. The Investment Movement Summary shows how the valuation of assets has changed between 31 March 2010 and 31 March 2011. As at 31 March 2011 the market value of the scheme‟s assets was £519 million and the actuary assessed the present value of the funded obligation at £665 million indicating a net liability of £146 million under International Accounting Standard (IAS) 26.
(b) The actuarial valuation, done using the projected unit method, is based on economic and statistical assumptions, the main ones being:
i. The rate of accumulation of income and capital on new investments over the long-term and the increase from time to time of income from existing investments.
ii. Future rises in pensionable pay due to inflation and etc, and pension increases. iii. Withdrawals from membership due to mortality, ill health and ordinary retirement. iv. Progression of pensionable pay due to promotion.
(c) The contribution rate is set on the basis of the cost of future benefit accrual, increased to
bring the funding level back to 100 per cent over a period of 10 years, as set out in the Funding Strategy Statement.
(d) On the basis of a funding level of 89 per cent, the employers‟ common contribution rate for the whole Fund was set at 21.2 per cent for contributions from 1 April 2011. However, it should be noted that for the period covered by these accounts, the employers‟ common contribution rate was 20.2 per cent of pensionable pay from 1 April 2008 to 31 March 2011. The 2010 Actuarial Valuation and the 2011 IAS26 update are published with these accounts.
(e) The next actuarial revaluation of the Fund will be as at 31 March 2013.
2. Benefits payable were as follows (including all pension and lump sum payments):
Body 2010-11 2009-10
£'000 £'000
Administering Authority 17,575 17,334
Admitted Bodies 1,239 1,192
Scheduled Bodies 142 120
Total 18,956 18,646
3. Payments to pensioners exclude potential liabilities in respect of fifteen deferred members who
have reached retirement age, but cannot be contacted or located. 4. Lump sum payments included in note 2 are summarised as shown below:
2010-11 2009-10
Payment Type £'000 £'000
Commutation of Pensions and Lump Sum Retirement Benefits 4,019 4,153
Lump Sum Death Benefits 190 612
Total 4,209 4,765
Notes to the Pension Fund Account nces

129
5. Contributions were received from the following sources:
Employer’s
2010-11
Employer’s
2009-10
Body £'000 £'000
Administering Authority 17,591 17,805
Admitted Bodies 2,347 2,537
Scheduled Bodies 887 759
Total 20,825 21,101
Of which deficit funding through payroll* 7,661 7,770
These figures now include an estimate of the deficit-funding contribution for admitted and scheduled bodies
Employees’
2010-11
Employees’
2009-10
Body £'000 £'000
Administering Authority 5,646 5,690
Admitted Bodies 828 894
Scheduled Bodies 288 271
Total 6,762 6,855
6. The contributions receivable from employers relating to early retirements will vary from year to year, depending on the number of early retirements.
7. Related Party Transactions Pension administration and other expenses were £650,000 and included: the costs of administering pension entitlements; contributions and etc; the apportioned costs of Corporate Finance time spent on pension administration; and direct costs. There were no material transactions between the fund and members of the Investment Committee or between the fund and senior officers of the Council during the financial years 2009-10 and 2010-11.
8. Investment Income
2010-11 2009-10
£'000 £'000
Income from Fixed Interest Securities 0 (315)
Income from Index Linked Securities 0 (151)
Dividends from Equities 5,556 8,224
Income from Property 848 394
Income from Derivatives 0 0
Income from Private Equity 308 207
Interest on Cash Deposits 196 324
Investment Income 6,908 8,683
Other Investment Income 234 1
Now that so much of the income from the Fund‟s investments is through pooled investment vehicles, income is also included within the change in market value of these investments.

130
9. None of the UK Equities is unlisted. The scheme has no material holdings of unlisted
investments in other markets except for the Adams Street holdings in private equity, which are shown separately in these accounts.
10. Pooled Investment Vehicles (previously known as Managed Funds) are Open Ended Investment Companies investing in equities and bonds.
11. Statement of Investment Principles The Investment Committee regularly reviews its Statement of Investment Principles (SIP), which is revised following any change in circumstances. A copy of the latest version is published on the Council‟s website or can be obtained from the Executive Director for Finance, Information Systems and Property.
12. Investments The market value of assets under management at 31 March was as follows:
2011 2010
Managed by £'000 % of Total £'000 % of Total
Alliance Bernstein 0 0 144,687 31.3 Baillie Gifford 104,163 20.0 178,177 38.5 Longview 104,678 20.1 0 0 Legal and General 104,753 20.2 6,694 1.4
Northern trust 97,772 18.8 0 0
M and G 0 0 47,939 10.4 Legal and General 51,531 9.9 0 0 ING 20,937 4.0 22,033 4.8 Adams Street* 19,952 3.9 15,808 3.4
Total Managers 503,786 96.9 415,338 89.8
RBKC Cash Investment 15,924 3.1 46,943 10.2
Subtotal 519,710 100.0 462,281 100.0
Debtors 551
1,647
Creditors (1,007)
(902)
Net Assets 519,254
463,026
* The valuation is taken from the 31 December 2010 valuation of the investment assets and the cash cost of new investments made between 1 January and 31 March 2011.
** Cash held by managers is included in the totals. Interest on cash held internally is calculated at market rates of interest and credited to the Pension Fund.
13. The level of activity in the Fund's investments at cost during 2010-11 is shown in the
Investment Movement Summary.
The total change in market value of investments during the year comprises all increases and decreases in the market value of investments held at any time during the year, including profits and losses on sales of investments during the year.
14. Net Current Assets
Amounts due to and from the Fund at the Balance Sheet date have been included within the Fund Account as follows:

131
Current Liabilities £'000
Accrued Fees Due 364 Accrued lump sum payments 643 Total 1,007
Current Assets £'000
Dividends and Interest 211 Accrued Income 340
Total 551
15. Admitted and Scheduled Bodies:
Admitted Bodies
Medequip
Specialist Schools & Academies Trust
Tenant Management Organisation
Westway Development Trust
Scheduled Bodies
Kensington and Chelsea College
St Charles Roman Catholic Sixth Form College
Chelsea Academy
The following former admitted bodies have no active members and are included within the Royal Borough of Kensington and Chelsea Pool:
Housing Action Centre
Maxilla Nursery
Portobello Business Centre
West London Family Service Units
16. Additional Voluntary Contributions (AVCs)
The Local Government Pension Scheme (Management and Investment of Funds) Regulations 1998 do not permit AVCs to be paid into the Pension Fund, so they are not included in these accounts. The Council has made arrangements for current members to make additional payments through its payroll into a variety of funds operated by Prudential Assurance according to individuals‟ preferences. These funds are invested in equities, bonds, property and cash. A total of £686,000 was invested by members of this fund in this way during 2010-11.

132
2010-11 2009-10 Notes
Gross Exp
£'000
Income £'000
Net Exp
£'000 Net Exp
£'000
Income and Expenditure on Services
General Costs 26 0 26 12
Adjustment to Provisions 0 0 0 218 1
Adjustment to Assets and Liabilities 0 0 0 0
Interest 0 19 (19) (17) 3
Total Expenditure on Services 26 19 7 213
Surplus/(Deficit) for the year (7) (213)
2010-11 2009-10 £'000 £'000
Balance brought forward at 1 April 4,306 4,519
Surplus / (deficit) for the year on Income and Expenditure Account (7) (213)
Total Assets 4,299 4,306
2010-11 2009-10 Notes £'000 £'000
Current Assets
Current Debtors 0 1 4 Temporary Investment with the Council 4,517 4,523
Total Assets 4,517 4,524
Current Liabilities
Creditors 0 0
Total Assets less Current liabilities 4,517 4,524
Long Term Liabilities Provisions (218) (218) 1
Total Assets less Current liabilities 4,299 4,306 Represented by
London Residuary Body Balance 4,299 4,306
Total Net Worth 4,299 4,306
The London Residuary Body Transferred Functions Income and Expenditure Statement nces
Statement of Movement on the London Residuary Body Balance
London Residuary Body Transferred Functions Balance Sheet

133
Introduction The Council inherited Inner London functions from the London Residuary Body as follows: Education Awards from 1 August 1992 Property (Capital Receipts) from 1 April 1992 Late Rating Claims from 31 March 1994 Other Functions from 1 October 1992. Other functions included administration of leases, collection of outstanding debts and Higher Education Council for England (HEFCE) debt management. The Council was given endowments for education awards, late rating claims, and other functions, from which the net spending has been met. The Council is required to determine whether the sum left is sufficient to meet future expenditure and whether it is possible to distribute any projected excess of this to the other inner-London boroughs or, if it is not sufficient, to request funds from those boroughs. These accounts show the position on these endowments. At the present time and in order to meet potential future third party liability claims, it is considered prudent to retain the current level of balances. The position will continue to be kept under review. Notes 1. A requirement to provide for identified public liability claims arose in 2009. There has been
no movement on this during 2010-11 and the table below shows the sum set aside to cover any resulting claims.
2010-11 2009-10 Balance at 31 March £’000 £’000
Public Liability Claims 218 218
2. Contingent Liabilities During 1992-93, the London Residuary Body‟s insurers, Municipal Mutual Insurance (MMI) ceased accepting new business. The London Residuary Body is a member, through the Council, of a scheme of arrangement that has been put in place to try to ensure an orderly settlement of the run-off of MMI. Claim payments to date that are liable to „clawback‟ if the scheme of arrangement is triggered, amount to a maximum of £365,000 as at 31 March 2009. In addition estimated claims amounting to £80,000 remain outstanding. It is not possible at this time to determine the likelihood of the scheme of arrangement being called upon.
3. Interest on the endowment has been calculated at money market rates. The reduction in interest reflects the ongoing fall in external money market rates since September 2008.
4. There is a small debtor under £1,000 at the end of 2010-11.

134
Website address – www.rbkc.gov.uk Statement of Accounts 2010-11 - published in September 2011 (pending final audit opinion). This publication can be provided in other languages and formats (such as large print, Braille and speaking version) on request:- Executive Director for Finance, Information Systems and Property Town Hall Hornton Street London W8 7NX Telephone: 020 7361 2384 Email: [email protected]
Other Useful Information