Embed Size (px)
Citation preview

ARTICLE IN PRESS
0967-0637/$ - se
doi:10.1016/j.ds
E-mail addre
Deep-Sea Research I 51 (2004) 2123–2136
www.elsevier.com/locate/dsr
The Rossby wave as a key mechanism of Indian Oceanclimate variability
Mark R. Jurya, Bohua Huangb
aEnvironmental Science Department, Center for Environmental Studies, University of Zululand, KwaDlangezwa 3886, South AfricabCenter for Ocean Land Atmosphere Studies, Maryland, USA
Received 18 November 2003; received in revised form 3 June 2004; accepted 3 June 2004
Available online 7 October 2004
Abstract
We analyze the time-longitude structure of composite cases from model-assimilated ocean data in the period
1958–1998, following on from earlier work by Huang and Kinter (J. Geophys. Res. 107(C11) (2002) 3199) that studied
east–west thermocline variability in the Indian Ocean. Our analysis focuses on the Rossby wave signal along the
thermocline ridge in the tropical SW Indian Ocean (101S, 60–801E), where wind stress curl is important. Anomalous
winds in the equatorial east Indian Ocean force successive Rossby waves westward at speeds of 0.1 m s�1730%. With a
wavelength of �7000 km, the period of oscillation is in the range 1.9–5.2 years. The Indian Ocean Rossby wave is
partially resonant with the global influence of the El Nino–Southern Oscillation, except during quasi-biennial rhythm.
The presence of the Rossby wave offers potential predictability for east–west atmospheric circulation systems and
climate that affect resources in countries surrounding the Indian Ocean.
r 2004 Elsevier Ltd. All rights reserved.
1. Introduction
The west Indian Ocean (WIO) is a climaticallyimportant region, recording on average 10 tropicalcyclones each year between December and March.These storms often bring devastating conse-quences to the Mascarene Islands, Madagascarand Mozambique (Naeraa and Jury, 1998). Themean sea surface temperature (SST) in the WIOvaries between 26 and 28 1C, and is cooler than theeastern Indian Ocean, due to upwelling off
e front matter r 2004 Elsevier Ltd. All rights reserve
r.2004.06.005
ss: [email protected] (M.R. Jury).
Somalia and surface cooling off Madagascar. Azone of maximum convection occurs over theeastern warm pool (51N–101S, 70–1001E) withprecipitation rates48 mm day�1. Zonal winds inthe tropical Indian Ocean are weak within theequatorial wave-guide because of the prevailingmeridional flow of the monsoon. The equatorialthermocline lies around 120 m depth and exhibitslittle east–west slope in contrast with the Pacificand Atlantic Oceans (Xie et al., 2002). The meanstructure of the thermocline is a ridge–trough pairat 71S and 201S, respectively, with mean tempera-tures of 18 and 22 1C for the upper 234 m and
d.

ARTICLE IN PRESS
M.R. Jury, B. Huang / Deep-Sea Research I 51 (2004) 2123–21362124
thermocline depths of 80 and 180 m, respectively.Due to the lack of a zonal gradient in theequatorial zone, it was thought that the IndianOcean may not have the appropriate features todevelop its own El Nino–Southern Oscillation(ENSO)-like interannual variability (Latif andBarnett, 1995).
Yet, east–west gradients in the thermocline candevelop at times (Hastenrath et al., 1993; Websteret al., 1999; Murtugudde et al., 2000; Ueda andMatsumoto, 2000), with atmospheric circulationand convection varying in a manner consistentwith Bjerknes (1969) feedback. At the onset of aPacific El Nino event as atmospheric convectionshifts eastward from the warm pool, anomalouseasterly winds develop near the equator in the eastIndian Ocean. These generate a gradual warmingto the west (Nigam and Shen, 1993; Klein et al.,1999; Lau and Nath, 2000) that will be furtherexplored here.
Although surface fluxes explain changes in SSTover much of the tropical Indian Ocean, this is lessso in the thermocline ridge (5–121S, 55–851E)according to the results of Klein et al. (1999),Lau and Nath (2000). Ocean model results(Murtugudde and Busalacchi, 1999; Murtuguddeet al., 2000) and analysis of sea surface heightmeasurements (Chambers et al., 1999) suggest thatdynamic processes contribute to SST variability inthe tropical Indian Ocean. Huang and Kinter(2000, 2001, 2002) have used upper ocean heatcontent from data-assimilated ocean analyses toidentify the westward propagating Rossby wave asa key feature of the near-continuous interannualoscillation of the upper tropical Indian Oceansince the late 1950s. This result substantiated thefinding from the TOPEX/Poseidon altimetermeasurements during the 1990s. Observationalstudies of warm and cool events (Reason et al.,2000; Jury et al., 2002) demonstrate that local heatand radiative fluxes, and vertical entrainment fromwind stress curl account for a significant portion ofSST variance during onset phase. However, thesurface heat fluxes do not fully explain thevariations of SST there from fall to next spring.The lack of closure in the budget for local SSTchanges in the WIO may be attributed tohorizontal advection via incoming Rossby waves
(Murtugudde et al., 2000; Behera and Yamagata,2001; Xie et al., 2002).
In the present study, we further investigate themechanisms of ocean variability using model-assimi-lated data, following Huang and Kinter (2002). Ofparticular interest is the nature of sub-tropicalRossby waves and their impact on the climatesystem. Toward this end, we analyze in situ oceandata assimilated by a numerical model (Schneideret al., 1999). Key issues to be addressed include: thetime-longitude structure of Rossby waves, thecharacteristics of phase propagation, preferred loca-tions for wave amplification, and the extent ofcoupling with the atmosphere. We conclude thatmuch of ocean variability comprising the east–westdipole in the Indian Ocean can be attributed to anoff-equatorial ocean Rossby wave that propagatesslowly from the east following a surge of wind at theonset of most El Nino events. The paper is organizedinto sections on data and methods, results sub-divided into wave character and zonal phasepropagation (hovmoller analysis), and discussion.
2. Data and methods
Upper ocean heat content fields (mean tempera-ture in the top 234 m) for the period 1958–1998have been derived from an ocean data assimilationsystem operated at COLA as outlined in Huangand Kinter (2002), hereafter HK02. The dataassimilation uses a variational scheme (Derber andRosati, 1989) to combine temperature observa-tions in an ocean general circulation model(oGCM). The analysis uses all observationsavailable in a moving 10-day assimilation window.The observations are inserted into the first guessfield of the oGCM and discrepancies are iterativelyminimized. The oGCM is a version of the GFDLmodular ocean model (Huang and Schneider,1995; Schneider et al., 1999; Huang et al., 2002).It is forced by monthly averaged surface windstress from NCEP reanalysis available at anirregular grid with a variable resolution of around21 near the equator. The solar flux is prescribed(Oberhuber, 1988), surface heat and long-wavefluxes are parameterized (Philander et al., 1987;Rosati and Miyakoda, 1988).

ARTICLE IN PRESS
M.R. Jury, B. Huang / Deep-Sea Research I 51 (2004) 2123–2136 2125
Ocean temperature observations are assimilatedfrom in situ SST measurements from the COADSarchive (Slutz et al., 1985), temperature profile(XBT, MBT, CTD, etc.) measurements (Conk-right et al., 1998) and, since 1981, with satellite-blended weekly SST fields (Reynolds and Smith,1994). The number of temperature profiles isgenerally 3000–9000 per year within the squarebetween 301E and 1201E, 301S and 301N duringthe 41 years (see Fig. 1 a and b). In 1967, 1968, and1979, it surpassed 15000 profiles. In situ SSTmeasurements exceeded 90,000 per year, reachinga maximum of 270,000 per year. However, manyof these observations, especially the sub-surfacedata, are concentrated along the coasts. There are
Distribution of Temperature ProfilesProfile Number, 1958-1980
(a)
30N
25N
20N
15N
10N
5N
EQ
5S
10S
15S
20S
25S
30S
30N
25N
20N
15N
10N
5N
EQ
5S
10S
15S
20S
25S
30S110E100E90E80E70E60E50E40E30E
110E100E90E80E70E60E50E40E30E
Profile Number, 1981-1998
(b)
10
30
50
75
100
150
200
250
300
500
1000
5000
Fig. 1. The spatial distribution of profile measurements on
11lat.� 11long. grid within 301S–301N, 30–1201E during: (a)
1958–1980, and (b) 1981–1998.
more observations along key lines from Perth tothe NW, from Madagascar to the NE, fromMauritius to the north, and from Mombassa tothe east (Masumoto and Meyers, 1998), which areimportant for our present study. However, someof these, especially in the South Indian Ocean,were established with TOGA in 1985.
Fig. 1a and b shows the spatial distributions ofthe temperature profiles per degree-square for theyears 1958–1980 and 1981–1998. It is evident thatmeasurements on major ship tracks were enhancedin the later period in the South Indian Ocean. Evenafter this enhancement, the distribution of the sub-surface temperature observations was still sparseand may be wider than the typical zonal decorr-elation scale in the equatorial ocean (Smith, 1995).Therefore, the assimilated product is inevitablystrongly affected by the ocean model and thesurface forcing fields. The model-derived resultsare considered in this light and we thereforeemploy analysis techniques that highlight repeti-tious patterns (e.g., EOF, composite).
The anomalies of model-analyzed upper oceanheat content are highly correlated with theindependently derived sea surface height anoma-lies from the TOPEX/Poseidon satellite altimetermeasurements (HK02) using monthly data. Itsuggests that the assimilated temperatures areuseful for analyzing the interannual variability inthis region. One may attribute this high consis-tency to newly established ship data in recentyears. However, our EOF analysis of the heatcontent anomalies (HCa) in different periodsshows very similar patterns. We believe that thisdata set is superior to an oGCM simulation withobserved surface forcing only, because of insertionof the oceanographic observations. It significantlyreduces the systematic errors of the model so thatit can respond to surface forcing in a more realisticmanner. The inserted observations also nudge andenhance the simulated interannual signals.
HK02 analyze the anomaly fields of detrendedseasonal data using extended empirical orthogonalfunction (eEOF) analysis (Weare and Nasstrom,1982) for lags up to 2 years. This covers the life-span of a typical anomalous ‘dipole’ event in theIndian Ocean. Here we extend the work ofHK02 by analyzing the time-longitude structure
ARTICLE IN PRESS
M.R. Jury, B. Huang / Deep-Sea Research I 51 (2004) 2123–21362126
of composite HCa according to the phase of 12events occurring in the 41 year period of analysis.It should be pointed out that, in this empiricallyderived oscillation, the periods of the events arevariable. Therefore, faster and slower events areco-mingled within the record. Our preliminaryanalysis showed that each cycle went throughsimilar stages so that it is useful to construct acomposite picture based on the phases within theseevents. To perform the composite analysis, weselect data to average at certain phase-intervalswhere the time score amplitude exceeds 0:75s: Tocreate a more consistent composite analysis, theHCa data for fast events are ‘compressed’ whilstdata for the slow events are ‘stretched’. Similarly,SSTa and wind stress curl anomalies are analyzedover the life cycle of the composite event. Thecomposite results are sliced at the latitude ofmaximum HCa amplitude (101S) and plotted inhovmoller format to study the environmentalimpacts of the transient Rossby wave. Weinvestigate relationships with ENSO usingmonthly NCEP wind data in the area 51N–101S,70–1001E and Reynolds reconstructed SST in thearea 51N–51S, 150–901W (Nino3). We first waveletfilter the two indices to remove cycleso1.5 yearsso that ocean influences on the atmosphere can bemore clearly described. We then calculate theircross-modulus spectrum and instantaneous phaselag as outlined in Jury et al. (2002). Using thezonal wind index and the thermocline depth at5–101S, 651E, we isolate years with a deeper layerof warm water when east equatorial winds areanomalous easterly. We then analyze the compo-site structure of the regional circulation andconvection response.
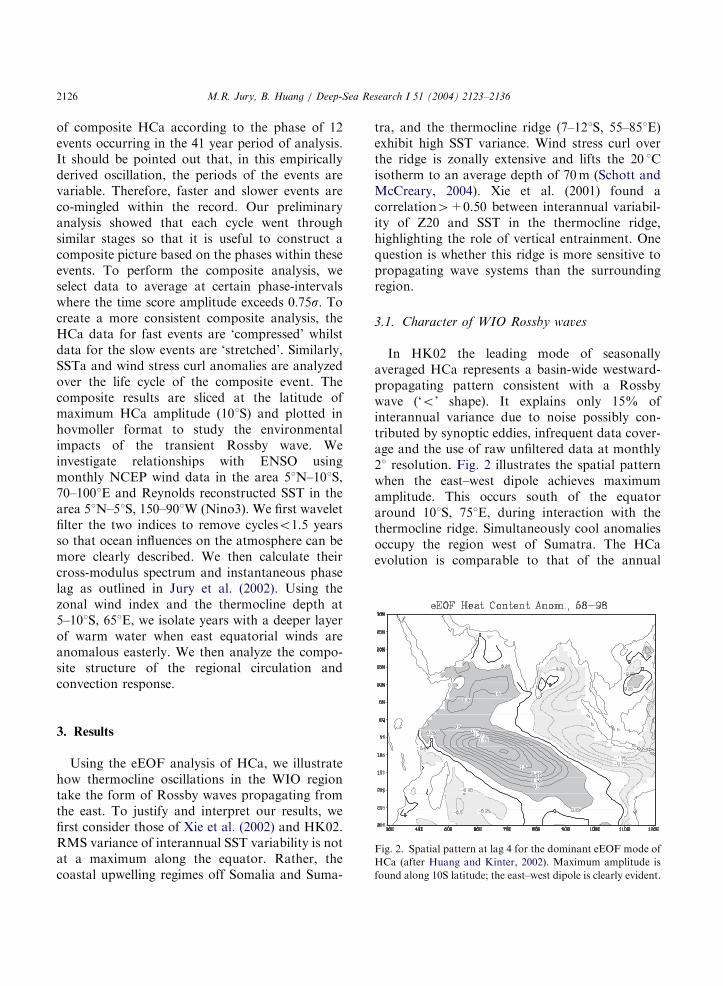
Fig. 2. Spatial pattern at lag 4 for the dominant eEOF mode of
HCa (after Huang and Kinter, 2002). Maximum amplitude is
found along 10S latitude; the east–west dipole is clearly evident.
3. Results
Using the eEOF analysis of HCa, we illustratehow thermocline oscillations in the WIO regiontake the form of Rossby waves propagating fromthe east. To justify and interpret our results, wefirst consider those of Xie et al. (2002) and HK02.RMS variance of interannual SST variability is notat a maximum along the equator. Rather, thecoastal upwelling regimes off Somalia and Suma-
tra, and the thermocline ridge (7–121S, 55–851E)exhibit high SST variance. Wind stress curl overthe ridge is zonally extensive and lifts the 20 1Cisotherm to an average depth of 70 m (Schott andMcCreary, 2004). Xie et al. (2001) found acorrelation4+0.50 between interannual variabil-ity of Z20 and SST in the thermocline ridge,highlighting the role of vertical entrainment. Onequestion is whether this ridge is more sensitive topropagating wave systems than the surroundingregion.
3.1. Character of WIO Rossby waves
In HK02 the leading mode of seasonallyaveraged HCa represents a basin-wide westward-propagating pattern consistent with a Rossbywave (‘o’ shape). It explains only 15% ofinterannual variance due to noise possibly con-tributed by synoptic eddies, infrequent data cover-age and the use of raw unfiltered data at monthly21 resolution. Fig. 2 illustrates the spatial patternwhen the east–west dipole achieves maximumamplitude. This occurs south of the equatoraround 101S, 751E, during interaction with thethermocline ridge. Simultaneously cool anomaliesoccupy the region west of Sumatra. The HCaevolution is comparable to that of the annual
ARTICLE IN PRESS
M.R. Jury, B. Huang / Deep-Sea Research I 51 (2004) 2123–2136 2127
Rossby wave according to HK02, although muchslower and asymmetrical about the equator. Theinterannual fluctuation is analogous to the ENSOcycle in the Pacific, except that there is littleevidence for a northern Rossby wave due to thepresence of the Asian land mass and associatedatmospheric circulations (monsoon) that inhibit itswestward propagation.
The interannual time scale is prominent in thephase analysis of HK02. The mean period ofoscillation is 3.3 years, with a range from 1.9 to 5.2years. The period of oscillation changes graduallyfrom faster quasi-biennial events (2.0–2.4 years inthe period 1962–1971), to slower ENSO-like events(4.8–5.2 years from 1974 to 1993). In the late 1990sthe period of oscillation was in the range 2.7–3.1years. Since the oscillation apparently has a long-term modulation, we have also calculated its meanperiod as 2.0 years in the early time (1962–1970)and 4.2 years in the later time (1978–1995). Givena wavelength of 7000 km (shown later), phasespeeds of 0.11 and 0.05 m s�1 are implied foroceanic Rossby wave propagation in these twoperiods, respectively. The free wave phase speed isgiven by C ¼ �Bg0H=f 2: With values assumed tobe B=2.25� 10�11, g0=3.8� 10�2, H=70, andf2=6.4� 10�10 at 101S. The phase speed C is�0.1 m s�1, a finding consistent with White (2000),Rao et al. (2002). Hence the observed propagationis about two-thirds of the free Rossby wave speed(Chelton et al., 1998). Such a slow speed ofmovement is indicative of coupling with theatmosphere, likely involving a shift of the Walkeroverturning circulation cells.
Using combined EOF analysis of wind stressanomalies, SSTa, and HCa, HK02 demonstratethat the HCa variability is strongly coupled withthe surface wind stress and precipitation. TheRossby wave is affected by two mechanisms; thefirst being reflection of equatorial Kelvin waves atthe Sumatran coast and local reinforcement bywinds. The second is the generation of off-equatorial Rossby waves through the combinedeffect of equatorial zonal winds and the southeasttrade winds that create strong anticyclonic sheararound 101S in the open ocean. A weakening ofthe southeast trade winds results as the equatorialwinds surge westward toward mid-basin and turn
poleward (White, 2000). HK02 showed that theleading EOF mode of the precipitation anomaliesover the Indian Ocean is characterized by thefluctuation of precipitation off the Sumatra coastand a tendency for opposing anomalies in the west.Moreover, its time series is significantly correlatedwith the time series of the combined EOF mode,with the precipitation leading winds by a season.This suggests that the convection off the Sumatracoast serves as a driving force of the anomalouswind pattern and its distribution is also affected byair–sea feedback.
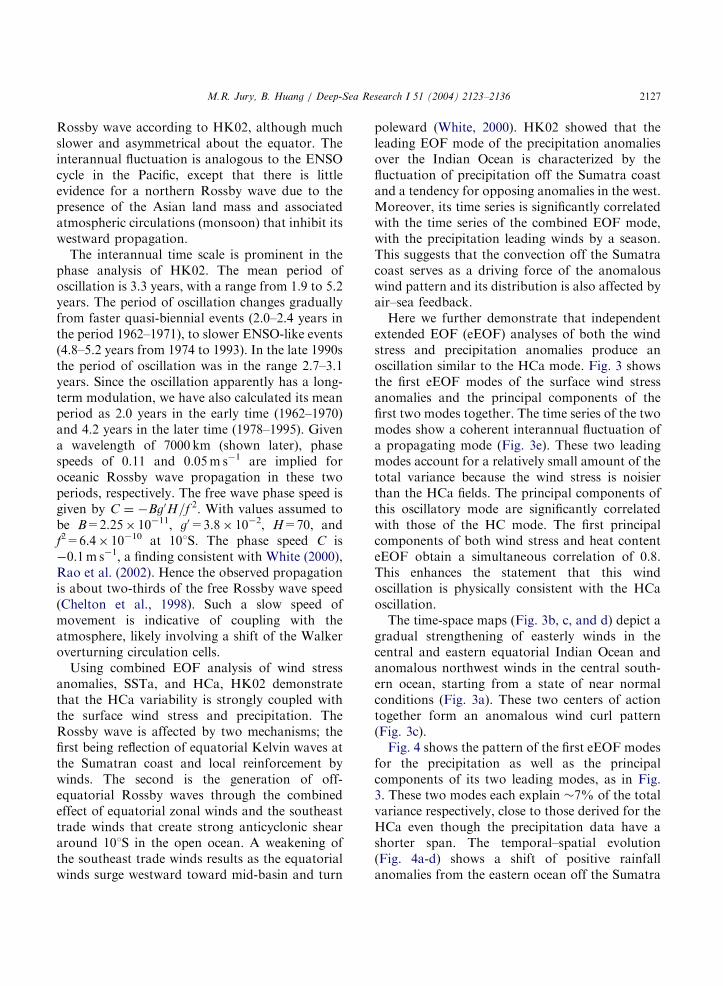
Here we further demonstrate that independentextended EOF (eEOF) analyses of both the windstress and precipitation anomalies produce anoscillation similar to the HCa mode. Fig. 3 showsthe first eEOF modes of the surface wind stressanomalies and the principal components of thefirst two modes together. The time series of the twomodes show a coherent interannual fluctuation ofa propagating mode (Fig. 3e). These two leadingmodes account for a relatively small amount of thetotal variance because the wind stress is noisierthan the HCa fields. The principal components ofthis oscillatory mode are significantly correlatedwith those of the HC mode. The first principalcomponents of both wind stress and heat contenteEOF obtain a simultaneous correlation of 0.8.This enhances the statement that this windoscillation is physically consistent with the HCaoscillation.
The time-space maps (Fig. 3b, c, and d) depict agradual strengthening of easterly winds in thecentral and eastern equatorial Indian Ocean andanomalous northwest winds in the central south-ern ocean, starting from a state of near normalconditions (Fig. 3a). These two centers of actiontogether form an anomalous wind curl pattern(Fig. 3c).
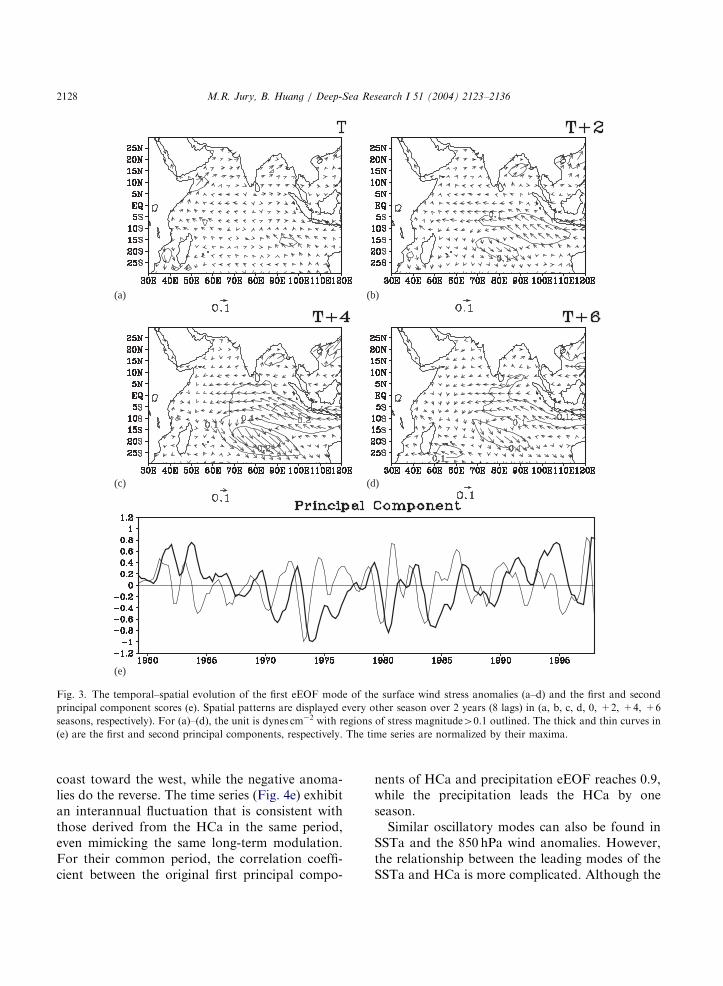
Fig. 4 shows the pattern of the first eEOF modesfor the precipitation as well as the principalcomponents of its two leading modes, as in Fig.3. These two modes each explain �7% of the totalvariance respectively, close to those derived for theHCa even though the precipitation data have ashorter span. The temporal–spatial evolution(Fig. 4a-d) shows a shift of positive rainfallanomalies from the eastern ocean off the Sumatra
ARTICLE IN PRESS
(a) (b)
(c) (d)
(e)
Fig. 3. The temporal–spatial evolution of the first eEOF mode of the surface wind stress anomalies (a–d) and the first and second
principal component scores (e). Spatial patterns are displayed every other season over 2 years (8 lags) in (a, b, c, d, 0, +2, +4, +6
seasons, respectively). For (a)–(d), the unit is dynes cm�2 with regions of stress magnitude40.1 outlined. The thick and thin curves in
(e) are the first and second principal components, respectively. The time series are normalized by their maxima.
M.R. Jury, B. Huang / Deep-Sea Research I 51 (2004) 2123–21362128
coast toward the west, while the negative anoma-lies do the reverse. The time series (Fig. 4e) exhibitan interannual fluctuation that is consistent withthose derived from the HCa in the same period,even mimicking the same long-term modulation.For their common period, the correlation coeffi-cient between the original first principal compo-
nents of HCa and precipitation eEOF reaches 0.9,while the precipitation leads the HCa by oneseason.
Similar oscillatory modes can also be found inSSTa and the 850 hPa wind anomalies. However,the relationship between the leading modes of theSSTa and HCa is more complicated. Although the
ARTICLE IN PRESS
(a) (b)
(c) (d)
(e)
Fig. 4. The temporal–spatial evolution of the first eEOF mode of the anomalies of precipitation (a–d) and the first and second
principal components (e). The spatial patterns are displayed as in Fig 3. For (a)–(d), the contour interval is 1 mm day�1 and regions
greater than 1 mm day�1 and those lower than �1 mm day�1 are darkly and lightly shaded, respectively. The thick and thin curves in (e)
are the first and second principal components, respectively, as in Fig 3.
M.R. Jury, B. Huang / Deep-Sea Research I 51 (2004) 2123–2136 2129
time series of the SSTa modes bear someresemblance to those of the HCa modes, thereare differences in the long-term modulationsbetween the two sets of principal components.The correlation is 0.6 between the first modes ofthe SSTa and HCa after the long-term trend isremoved. It is significant though not as high as the
correlation coefficients with wind stress andprecipitation. This is because of influences fromthe sub-tropical SST fluctuations, which are notdirectly related to thermocline fluctuations. In-stead, it is more strongly related to evaporativeheat fluxes, as pointed out by Behera andYamagata (2001).
ARTICLE IN PRESS
M.R. Jury, B. Huang / Deep-Sea Research I 51 (2004) 2123–21362130
Hence equatorial rainfall is modulated west ofthe zonal wind anomaly in agreement withReverdin et al. (1986). Poleward flow links theconvection associated with the Rossby wave to theatmospheric circulation in sub-tropical latitudes,giving rise to climate impacts in Australia andsouthern Africa (Nicholls, 1989; Reason andMulenga, 1999). When the ocean thermocline isdeep in the WIO, the adjacent southern hemi-sphere continents tend to experience increasedsouthwesterly flow and subsident motions thatcontribute to drought.
Our analysis suggests a dynamical couplingbetween the sub-surface Rossby wave, the atmo-spheric convection and the overlying circulation:both the zonal tropical system and the sub-tropicaltrough. Centers of action amplify and decay
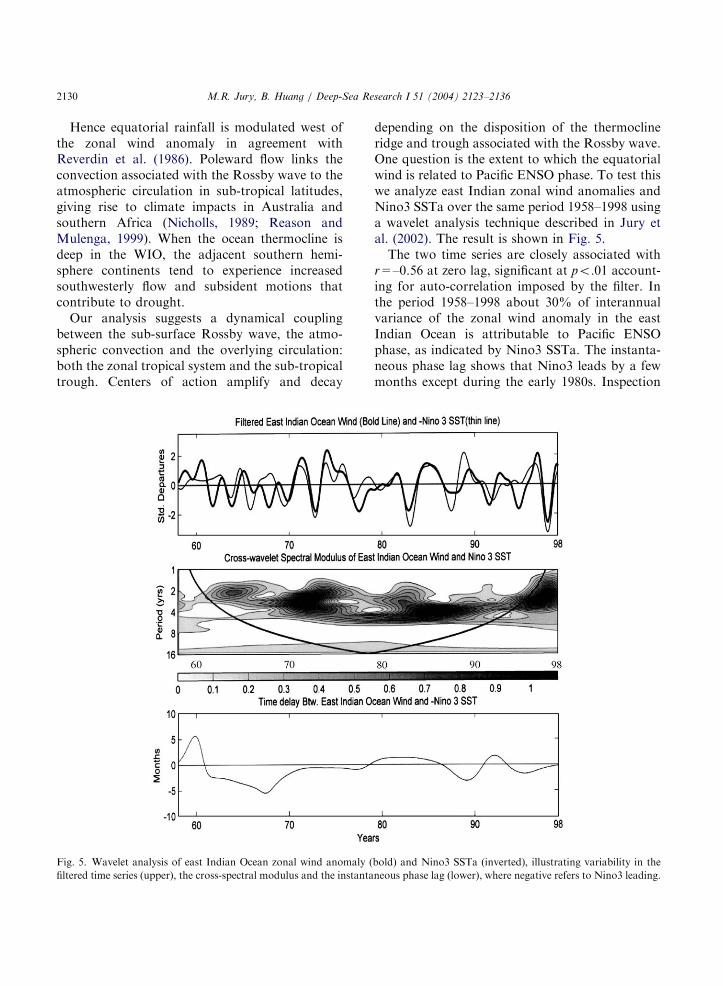
Fig. 5. Wavelet analysis of east Indian Ocean zonal wind anomaly (
filtered time series (upper), the cross-spectral modulus and the instanta
depending on the disposition of the thermoclineridge and trough associated with the Rossby wave.One question is the extent to which the equatorialwind is related to Pacific ENSO phase. To test thiswe analyze east Indian zonal wind anomalies andNino3 SSTa over the same period 1958–1998 usinga wavelet analysis technique described in Jury etal. (2002). The result is shown in Fig. 5.
The two time series are closely associated withr=–0.56 at zero lag, significant at po:01 account-ing for auto-correlation imposed by the filter. Inthe period 1958–1998 about 30% of interannualvariance of the zonal wind anomaly in the eastIndian Ocean is attributable to Pacific ENSOphase, as indicated by Nino3 SSTa. The instanta-neous phase lag shows that Nino3 leads by a fewmonths except during the early 1980s. Inspection
bold) and Nino3 SSTa (inverted), illustrating variability in the
neous phase lag (lower), where negative refers to Nino3 leading.

ARTICLE IN PRESS
M.R. Jury, B. Huang / Deep-Sea Research I 51 (2004) 2123–2136 2131
of the filtered time series suggests that the fasterIndian Ocean oscillations in the 1960s are onlypartially replicated in the Pacific SST, hence alower degree of resonance between the two oceanbasins then. In the period 1978–1982, there is ahiatus in oscillations followed by repeated ENSOevents. The cross-modulus spectrum illustrates agradual shift in period from quasi-biennial tointerannual (2-4 years) from the early 1960s tothe mid-1980s, in agreement with the Rossbywave-modulated phase. The slight delay of theIndian Ocean circulation is consistent with earliercomparisons with Pacific ENSO (Nigam and Shen,1993; Klein et al., 1999).
These results are consistent with Huang andShukla’s (2002) recent study on the decadalmodulation of the tropical Indian Ocean oscilla-tion. They noted that the variability in the Indo-Pacific domain was dominated by ENSO andassociated Walker overturning during the periodof 1977–1998. On the other hand, ENSO forcingover the Indian Ocean appears weaker during theperiod 1958–1976 and more influenced by theIndian monsoon. The shift of the convection iscontrolled by SST anomalies in the Indian andPacific Oceans, so that there is a feedback amongthem. However, it is not yet clear whether thetropical Indian Ocean affected the ENSO by
Fig. 6. Composite hovmoller analysis of HCa, SSTa and wind stres
represents time as phase lag from seasons one to eight, covering the
lowering its frequency prior to 1977. Hastenrath(2000) points out that this connection betweenthese two oceans primarily occurs in SON season.
3.2. Transient Rossby wave structure
Considering that the propagating signal in HCais most strongly represented along 101S, we slicethe oGCM-assimilated data there and compositesuccessive events (12) based on their amplitudeand phase, compressing/expanding different eventsto yield a hovmoller plot of consistent phase, asdiscussed earlier. We do this for the HCa, SSTaand wind stress curl and plot the data in hovmollerformat in Fig. 6a–c. From these patterns we canderive a wavelength of 7000 km7500 km along101S. Within each cycle, the Rossby waves areestimated to propagate at a variable phase speed,ranging from 0.05 to 0.10 m s�1.The compositeRossby wave amplifies around two centers: theSumatra upwelling region (1051E) and the thermo-cline ridge (701E). Propagation of the Rossby wavein terms of HCa is disrupted around 901E butappears enhanced across the mid-ocean ridge from601E to 721E. The presence of the Africancontinent diminishes the signal west of 551E,within 1500 km of the coast. Xie et al. (2001)found a similarly distinct westward propagation
s curl (left to right) sliced at 101S from 40–1201E. The y-axis
life cycle of a Rossby wave-modulated warm event (72 years).

ARTICLE IN PRESS
M.R. Jury, B. Huang / Deep-Sea Research I 51 (2004) 2123–21362132
by considering the lag-correlation of Z20 varia-bility along 101S from a point at 701E. They arguethat the forcing of the Rossby wave is seasonallydependent and governed by linear wave dynamics.
Composite hovmoller plots for SSTa and windstress curl are shown in Fig. 6b and c respectively.The pattern of propagation for both variables isnot as consistent as HCa. Presumably localizedforcing by the surface fluxes reduces the coherencyof SSTa propagation. The western center of actionvaries between warm and cool phases, beinglocated at 701E in the former and 551E in thelatter. The Sumatra upwelling region exhibits astrong signal in cool phase (�0.7 1C at phase 6),but a weak signal in warm phase, as expected.Such variability means that a static dipole indexcannot completely capture the basin-wide oscilla-tion. SSTa associated with the Rossby wave in theWIO thermocline ridge decay more slowly (3phases, equivalent to 3 seasons in a biennial cycle)than in the eastern center of action. Althoughthese changes appear small, they occur near theconvective threshold (28 1C), and significantlyimpact on atmospheric convection and circulationas shown here.
The hovmoller plot for wind stress curl exhibitslittle propagation, with strong anomalies confinedto the region 70–951E. The curl alternates symme-trically between anticyclonic (downwelling) andcyclonic (upwelling) events, each lasting �3 phases(seasons). The coastal regions are dissimilar,suggesting a semi-closed basin-scale circulationsystem. Considering the alternation of sign in thecontext of SSTa, we surmise that horizontal windshear drives vertical entrainment processes thatgovern changes in SST. Since the anomalous windstress curl does not ‘follow’ the westward-travelingRossby wave, the forcing may be considered to bepartially impulsive and wind-induced Ekmantransport is unlikely to drive changes in SSTfurther west. The structure of composite windssuggests a possible ‘standing’ component forRossby wave forcing. We consider this further inthe discussion section.
We have made separate composite life cycles forthe events occurring before and after 1976,considering the significant period shift around thistime. We found that that the patterns of HCa,
SSTa, and wind stress curl are not significantlydifferent in these two periods. However, this doesnot necessarily mean that the Rossby waves were‘slower’ during the latter period. It is more likelythat, because of the more persistent atmosphericforcing, there is a stronger stationary response.For instance, the HCa center in the SouthwestIndian Ocean simply remains longer west of 701E.Thus 0.1 m s�1 seems a reasonable estimate of thepropagating Rossby wave.
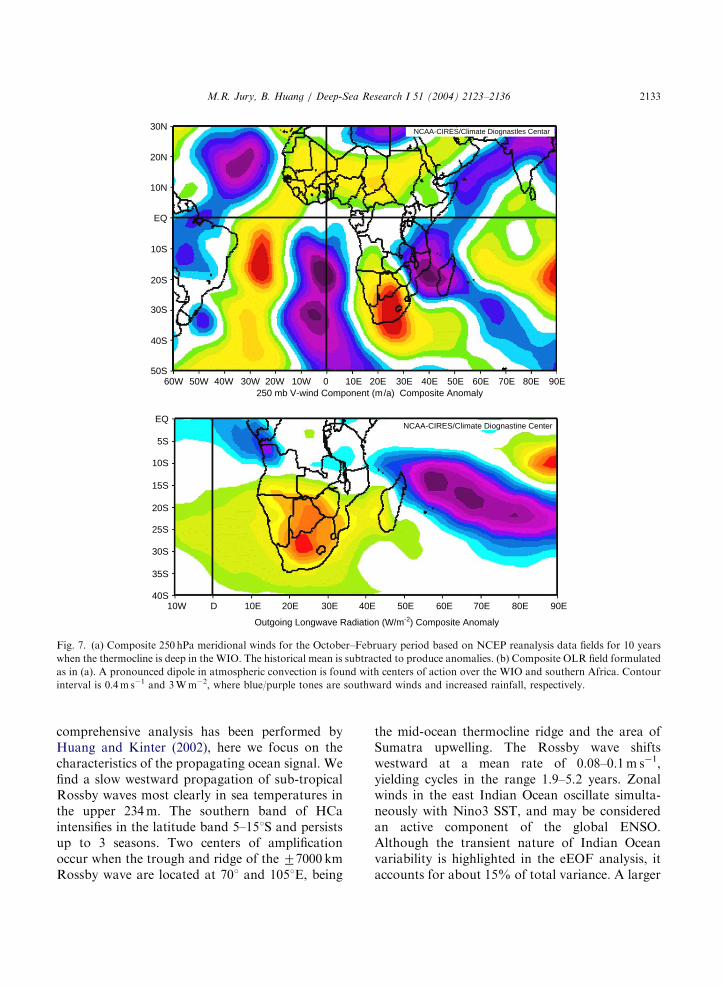
To study the impact of the seasonally phaselocked component of the WIO Rossby wave on theclimate system, we study composite plots of NCEPmeridional upper wind and out-going long-waveradiation (OLR) selected for cases when thethermocline is deep in the west (phase 7 in Fig.6a). Here we analyze November–February seaso-nal differences from the long-term mean. Themeridional upper wind (Fig. 7a) reveals a wavetrain pattern in conjunction with warm conditionsin the WIO. The wave train extends well upstream,and is related to the ENSO-modulated atmo-spheric circulation over the Atlantic (Jury et al.,2002). Significantly, the wavelength of this sub-tropical atmospheric Rossby wave (77000 km),matches that of the ocean Rossby wave. Some ofthe impacts of this coupled system are evident inFig. 7b: a convective dipole is observed withopposing values over southern Africa and theWIO. Hence dry conditions occur over land whenrainfall is increased over the ocean. Similarly, Xieet al. (2001) show that WIO tropical cyclonefrequency is related to the Rossby wave-induceddipole. Their comparison of tropical cycloneoccurrences for deep and shallow thermoclineconditions demonstrates a 66% change in tropicalcyclone days around 151S, 601E (Mauritius). Theincrease in tropical cyclone activity is consistentwith warmer SST and an anomalous cycloniccirculation west of the poleward atmospheric flowassociated with the Rossby wave.
4. Discussion
We have studied the nature of climate varia-bility in the Indian Ocean, using ocean model-assimilated data in the period 1958–1998. A
ARTICLE IN PRESS
90E80E70E60E50E40E30E20E10ED10W
Outgoing Longwave Radiation (W/m-2) Composite Anomaly
40S
35S
30S
25S
20S
15S
10S
5S
EQNCAA-CIRES/Climate Diognastine Center
NCAA-CIRES/Climate Diognastles Centar
90E80E70E60E50E40E30E20E10E010W20W30W40W50W60W250 mb V-wind Component (m/a) Composite Anomaly
50S
40S
30S
20S
10S
EQ
10N
20N
30N
Fig. 7. (a) Composite 250 hPa meridional winds for the October–February period based on NCEP reanalysis data fields for 10 years
when the thermocline is deep in the WIO. The historical mean is subtracted to produce anomalies. (b) Composite OLR field formulated
as in (a). A pronounced dipole in atmospheric convection is found with centers of action over the WIO and southern Africa. Contour
interval is 0.4 m s�1 and 3 W m�2, where blue/purple tones are southward winds and increased rainfall, respectively.
M.R. Jury, B. Huang / Deep-Sea Research I 51 (2004) 2123–2136 2133
comprehensive analysis has been performed byHuang and Kinter (2002), here we focus on thecharacteristics of the propagating ocean signal. Wefind a slow westward propagation of sub-tropicalRossby waves most clearly in sea temperatures inthe upper 234 m. The southern band of HCaintensifies in the latitude band 5–151S and persistsup to 3 seasons. Two centers of amplificationoccur when the trough and ridge of the 77000 kmRossby wave are located at 701 and 1051E, being
the mid-ocean thermocline ridge and the area ofSumatra upwelling. The Rossby wave shiftswestward at a mean rate of 0.08–0.1 m s�1,yielding cycles in the range 1.9–5.2 years. Zonalwinds in the east Indian Ocean oscillate simulta-neously with Nino3 SST, and may be consideredan active component of the global ENSO.Although the transient nature of Indian Oceanvariability is highlighted in the eEOF analysis, itaccounts for about 15% of total variance. A larger
ARTICLE IN PRESS
M.R. Jury, B. Huang / Deep-Sea Research I 51 (2004) 2123–21362134
part of interannual variance may be contributedby ‘stationary oscillations’, but these are lesspredictable and not well underpinned by theory.Indeed, the composite hovmoller results for bothSSTa and wind stress curl reveal a quasi-stationarydipole that is about twice the amplitude of themoving wave. The existence of such a dipole wassuggested by Jury (1992) in the context of atmo-spheric wave-trains and further confirmed in theanalysis of Saji et al. (1999) as an intermittentlycoupled oceanic feature.
At the onset of an El Nino event, a surge ofequatorial easterly winds creates twin anticyclonicgyres in the east Indian Ocean. The surgeprogresses westward at 70.2 m s�1 in the compo-site months August to November (Matitu, 2003).The northern gyre fades out whilst the southernone intensifies, creating the downwelling (warm-ing) effect about 151 south and west of the surgingwind system. Xie et al. (2002) suggest thatthermocline adjustments preferentially impactSSTa and the overlying atmosphere in the ridgealong 8–101S. In our analysis of precipitation inthe period 1979–1998 a high-amplitude signal isfound in the Sumatra upwelling zone where SSTsare warmer and more variable. This region is the‘gateway’ for interaction between the Indian andPacific Walker Cells during austral spring season.Although further studies are needed to resolve theocean–atmosphere coupling processes, we specu-late that changes in amplitude of the zonal see-sawdepend on how Rossby wave trains resonatingwithin the Indian Ocean interact with atmosphericzonal momentum injected from the western Pacificduring austral spring.
Jury et al. (2002) have demonstrated that localheat fluxes account for about half of the variancein SSTa in the WIO, but tend to lag by a fewmonths. Vertical motions estimated from localwind stress curl provide a significant influence atlead times of a few months, yet much of this effectis attributable to incoming Rossby waves (Murtu-gudde et al., 2000; Xie et al., 2001). east–westoscillations in the thermocline evolve slowly andpredictably, varying in period730% over theyears 1958–1998. The equatorial wind forcing isresonant with the global ENSO much of the time,yet uptake of the signal through the Rossby wave
can be expected to vary. Such is the chaotic natureof the climate system (Wang et al., 1999). Oneconclusion is that the coupled Rossby waveanticipates the phase of the dipole and providesconsiderable potential for predicting climate im-pacts around the Indian Ocean.
Our results on the westward propagation of theoceanic Rossby wave are consistent with otherrecent studies (e.g., HK02, Xie et al., 2002; Rao etal., 2002). Here more emphasis is placed on therole played by the off-equatorial wind curlassociated with coherent wind surges that enhancethe southern branch of the Rossby wave asdescribed by Masumoto and Meyers (1998). Thisprocess is not simply an air–sea interaction on theequator associated with the east–west gradient.The slower evolution and persistence associatedwith oceanic signals from higher southern latitudeshas significant implications on the climate varia-tions around the region.
This off-equatorial process is consistent with themost recent results of Yamagata et al. (2003),which demonstrated using data from observationsand a coupled ocean–atmosphere general circula-tion model the connections between the wind stresscurl and the westward propagating oceanic dis-turbance. Yamagata et al. (2004) also pointed outthat the wind curl anomalies are related to theENSO cycle. Furthermore, they argued that amajor distinction between the ENSO-related di-pole events and those triggered by other mechan-isms is in that the former are equatorially trappedwhile the latter are stronger to the south of 101S.The implication seems to be that, apart fromperturbing the Walker circulation over theIndian Ocean, ENSO affects the southeast tradesin a broader way. This issue deserves furtherexamination.
Acknowledgments
M. Jury was supported by grants from theNRF, WRC and DACST in South Africa. B.Huang was supported by the grants from the NSF,NOAA, and NASA in the USA. The SST andoceanic heat content data are derived from oceandata assimilation carried out at COLA. Part of the
ARTICLE IN PRESS
M.R. Jury, B. Huang / Deep-Sea Research I 51 (2004) 2123–2136 2135
material is adapted from COLA Technical Report94 (2001).
References
Behera, S.K., Yamagata, T., 2001. Subtropical SST dipole
events in the southern Indian Ocean. Geophysical Research
Letters 28, 327–330.
Bjerknes, J., 1969. Atmospheric teleconnections from the
equatorial Pacific. Monthly Weather Review 97, 163–172.
Chambers, D.P., Tapley, B.D., Stewart, R.H., 1999. Anom-
alous warming in the Indian Ocean coincident with El Nino.
Journal of Geophysical Research 104, 3035–3047.
Chelton, D.B., de Szoeke, R.A., Schlax, M.G., El Naggar, K.,
Siwertz, N., 1998. Geographic variability of the first
baroclinic Rossby radius of deformation. Journal of
Physical Oceanography 28, 433–460.
Conkright, et al., 1998. World Ocean Database 1998: doc-
umentation and quality control. NODC Internal Report 14,
NOAA/NESDIS, Maryland, 43pp.
Derber, J., Rosati, A., 1989. A global oceanic data assimila-
tion system. Journal of Physical Oceanography 19,
1333–1347.
Hastenrath, S., 2000. Zonal circulations over the equatorial
Indian Ocean. Journal of Climate 21, 2746–2756.
Hastenrath, S., Nicklis, A., Greischar, L., 1993. Atmospheric–
hydrospheric mechanisms of climate anomalies in the western
equatorial Indian Ocean. Journal of Geophysical Research
98, 219–235.
Huang, B., Kinter III, J.L., 2000. The interannual variability in
the tropical Indian Ocean. Preprints of 10th Conference on
Interaction of the Sea and Atmosphere, pp. 10–12.
Huang, B., Kinter III, J.L., 2001. The interannual variability in
the tropical Indian Ocean and its Relation to El Nino/
Southern Oscillation. COLA Technical Report 94, 48pp.
Huang, B., Kinter III, J.L., 2002. Interannual variability in the
tropical Indian Ocean. Journal of Geophysical Research 107
(C11), 3199–3229.
Huang, B., Schneider, E.K., 1995. The response of an ocean
general circulation model to surface wind stress produced by
an atmospheric general circulation model. Monthly Weath-
er Review 123, 3059–3085.
Huang, B., Shukla, J., 2002. The interannual variability in the
tropical Indian Ocean and its decadal modulation. Preprints
for 13th Symposium on Global Change and Climate
Variations, 225–227.
Huang, B., Kinter, J.L., Schopf, P.S., 2002. Ocean data
assimilation with intermittent analyses and continuous
model error correction. Advances in Atmospheric Sciences
19, 965–992.
Jury, M.R., 1992. A climatic dipole governing the interannual
variability of convection over the SW Indian Ocean. Trends
in Geophysical Research 1, 165–172.
Jury, M.R., Enfield, D.B., Melice, J.L., 2002. Tropical
monsoons around Africa, stability of ENSO associations
and links with continental climate. Journal of Geophysical
Research C 10 (15), 1–17.
Klein, S.A., Soden, B.J., Lau, N.C., 1999. Remote sea surface
temperature variations during ENSO: evidence for a
tropical atmospheric bridge. Journal of Climate 12,
917–932.
Latif, M., Barnett, T.P., 1995. Interactions of the tropical
oceans. Journal of Climate 8, 952–964.
Lau, N.-C., Nath, M.J., 2000. Impact of ENSO on the
variability of the Asian–Australian monsoons as simulated
in GCM experiments. Journal of Climate 13, 4287–4309.
Masumoto, Y., Meyers, G., 1998. Forced Rossby waves in the
southern tropical Indian Ocean. Journal of Geophysical
Research 103, 27589–27602.
Matitu, M., 2003. The response of tropical African rainfall to
zonal circulations over adjacent oceans. M.Sc. Thesis,
University of Zululand, South Africa, 178pp.
Murtugudde, R., Busalacchi, A.J., 1999. Interannual variability
of the dynamics and thermodynamics, and mixed layer
processes in the Indian Ocean. Journal of Climate 12,
2300–2326.
Murtugudde, R., McCreary, J.P., Busalacchi, A.J., 2000.
Oceanic processes associated with anomalous events in the
Indian Ocean with relevance to 1997–1998. Journal of
Geophysical Research 105, 3295–3306.
Naeraa, M., Jury, M.R., 1998. Tropical cyclone composite
structure and impacts over eastern Madagascar during
January–March 1994. Meteorology and Atmospheric Phy-
sics 65, 43–53.
Nicholls, N., 1989. Sea surface temperature and Australian
winter rainfall. Journal of Climate 2, 965–973.
Nigam, S., Shen, H.S., 1993. Structure of oceanic and atmo-
spheric low-frequency variability over the tropical Pacific
and Indian Oceans. Part I: COADS observations. Journal of
Climate 6, 657–676.
Oberhuber, J.M., 1988. An atlas based on the COADS data set:
budgets of heat buoyancy and turbulent kinetic energy at
the surface of the global ocean. Report 15, Max-Planck
Institut fur Meteorology, Hamburg, Germany, 199pp.
Philander, S.G.H., Hurlin, W.J., Seigel, A.D., 1987. A model of
the seasonal cycle in the tropical Pacific Ocean. Journal of
Physical Oceanography 117, 1986–2002.
Rao, S.A., Behera, S.K., Masumoto, Y., Yamagata, T., 2002.
Interannual subsurface variability in the tropical Indian
Ocean with special emphasis on the Indian Ocean dipole.
Deep Sea Research 49, 1549–1572.
Reason, C.J.C., Mulenga, H.M., 1999. Relationships between
South African rainfall and SST anomalies in the SW Indian
Ocean. International Journal of Climatology 19, 1651–1673.
Reason, C.J., Allan, R.J., Lindesay, J.A., Ansell, T.J., 2000.
ENSO and climatic signals across the Indian Ocean basin in
the global context: Part 1, interannual composite patterns.
International Journal of Climatology 20, 1285–1327.
Reverdin, G., Cadet, D., Gutzler, D., 1986. Interannual
displacements of convection and surface circulation over
the equatorial Indian Ocean. Quarterly Journal of the Royal
Meteorological Society 112, 43–67.
ARTICLE IN PRESS
M.R. Jury, B. Huang / Deep-Sea Research I 51 (2004) 2123–21362136
Reynolds, R.W., Smith, T.M., 1994. Improved global sea
surface temperature analyses using optimal interpolation.
Journal of Climate 7, 929–948.
Saji, N.H., Goswami, B.N., Vinayachandran, P.N., Yamagata,
T., 1999. A dipole mode in the tropical Indian Ocean.
Nature 401, 360–363.
Schneider, E.K., Huang, B., Zhu, Z., DeWitt, D.J., Kinter, J.L.,
Kirtnman, B.P., Shukla, J., 1999. Ocean data assimilation,
initialization, and predictions of ENSO with a coupled
GCM. Monthly Weather Review 127, 1187–1207.
Schott, F.A., McCreary, J.P., 2004. The monsoon circulation of
the Indian Ocean. Progress in Oceanography, in press.
Smith, N.R., 1995. An improved system for tropical ocean
subsurface temperature analyses. Journal of Atmospheric
and Oceanic Technology 12, 850–870.
Ueda, H., Matsumoto, J., 2000. A possible triggering process of
east–west asymmetric anomalies over the Indian Ocean in
relation to 1997/98 El Nino. Journal of the Meteorological
Society of Japan 78, 803–818.
Wang, C., Weisberg, R.H., Virmani, J.I., 1999. Western Pacific
interannual variability associated with the El Nino–-
Southern Oscillation. Journal of Geophysical Research
104, 5131–5149.
Weare, B.C., Nasstrom, J.S., 1982. Examples of extended
empirical orthogonal function analysis. Monthly Weather
Review 110, 481–485.
Webster, P.J., Moore, A.M., Loschnigg, J.P., Leben, R.R.,
1999. Coupled oceanic–atmospheric dynamics in the Indian
Ocean during 1997–98. Nature 401, 356–360.
White, W.B., 2000. Coupled Rossby waves in the Indian Ocean
on interannual timescales. Journal of Physical Oceanogra-
phy 30, 2972–2988.
Xie, S-P., Annamalai, H., Schott, F.A., McCreary, J.P., 2002.
Structure and mechanisms of south Indian Ocean climate
variability. Journal of Climate 15, 864–878.
Yamagata, T., Behera, S.K., Guo, J.J., Masson, S., Jury, M.R.,
Rao, S.A., 2004. Coupled ocean–atmosphere variability in
the tropical Indian Ocean. AGU monograph series, in press.


![The Arithmetic Geometry of Resonant Rossby Wave Triads · ARITHMETIC GEOMETRY OF RESONANT ROSSBY WAVE TRIADS 353 tion 3.17 and Chapter 6]). The -plane model was introduced by Rossby](https://img.dokumen.tips/doc/110x75/6065c2e71c4a3a76bc3dd2c3/the-arithmetic-geometry-of-resonant-rossby-wave-triads-arithmetic-geometry-of-resonant.jpg)