Embed Size (px)
Citation preview

This PDF is a selection from a published volume from the National Bureau of Economic Research
Volume Title: The Roles of Immigrants and Foreign Students in US Science, Innovation, and Entrepreneurship
Volume Authors/Editors: Ina Ganguli, Shulamit Kahn, Megan MacGarvie, editors
Volume Publisher: University of Chicago Press
Volume ISBNs: 978-0-226-69562-4 (cloth); 978-0-226-69576-1 (electronic)
Volume URL: https://www.nber.org/books-and-chapters/roles-immigrants-and-fore
ign-students-us-science-innovation-and-entrepreneurship
Conference Date: April 27, 2018
Publication Date: February 2020
Chapter Title: Immigration and Invention: Does Language Matter?
Chapter Author(s): Kirk Doran, Chungeun Yoon
Chapter URL: https://www.nber.org/books-and-chapters/roles-immigrants-and-foreign-students-us-science-innovation-and-entrepreneurship/immigration-and-invention-does-language-matter
Chapter pages in book: (p. 123 – 145)

123
5.1 Introduction
Economists have long noted several ways that immigration could aff ect innovation. Highly skilled immigrants may innovate directly, while low- skilled immigrants could aff ect the scale of production, thereby encourag-ing labor- complementary inventions and discouraging strongly labor- saving inventions (Acemoglu 2010). But the literature on immigration and inno-vation has failed to address the potential importance of one of the most obvious diff erences between immigrants and natives: language. On the one hand, immigrants may have a larger impact on innovation when there is a language similarity between the immigrants and natives. Strongly labor- complementary inventions may be incentivized more by a large homoge-neous workforce that can easily work together rather than by heterogeneous labor inputs that have trouble communicating with each other. On the other hand, immigration may have a larger impact on innovation when there is a language dissimilarity between the immigrants and natives. After all, a large literature explores the possibility that a diverse ethnolinguistic mix “brings about variety in abilities, experiences, and cultures that may be productive and may lead to innovation and creativity” (Alesina and La Ferrara 2005).
Both of the above eff ects of language on innovation are plausible, so it
5Immigration and InventionDoes Language Matter?
Kirk Doran and Chungeun Yoon
Kirk Doran is the Henkels Family Collegiate Chair and associate professor of economics at the University of Notre Dame.
Chungeun Yoon is a PhD student in the Department of Economics at the University of Notre Dame.
We thank Ina Ganguli, Megan MacGarvie, and especially Shu Kahn for very helpful com-ments on our preliminary draft. All errors are our own. For acknowledgments, sources of research support, and disclosure of the authors’ material fi nancial relationships, if any, please see https:// www .nber .org /chapters /c14102 .ack.

124 Kirk Doran and Chungeun Yoon
is helpful to consider them in light of theoretical models of what innova-tion actually is. According to many theories, innovation involves making new combinations from existing ideas and experiences (Weitzman 1998). An innovative society will thus necessarily involve people with diverse ideas communicating with each other to facilitate new combinations (innova-tions). Thus as the number of individuals increases, innovation may increase if (a) individuals communicate more and more and (b) they have a larger and larger number of unique things to communicate about.
Linguistic diversity of immigrants relative to the preexisting popula-tion can aff ect both of these channels but in opposite directions. Linguistic homogeneity increases the likelihood of (a) and decreases the likelihood of (b). Linguistic diversity decreases the likelihood of (a) and increases the like-lihood of (b). It is therefore plausible that the optimal amount of immigrant linguistic diversity for building an innovative society will be somewhere in between complete linguistic homogeneity and complete linguistic diversity. The results in this chapter are consistent with this hypothesis.1
We bring empirical evidence to bear on this question through analyzing a setting in which the language of immigrants varies independently of the lan-guage mix of the people already living in the locations that the immigrants are immigrating to. This is diffi cult because shift- share style immigration instruments build on exactly that variation in immigration that is correlated with ethnolinguistic variation in the preexisting population across locations. In this chapter, we make use of immediate- onset 1920s US immigration quotas that suddenly ended ongoing immigrant fl ows to some cities but not others. Crucially, the quotas caused cities with a circa- 1920 immigrant infl ow from quota- aff ected countries to suddenly stop receiving as many immi-grants; not every such city had a native- born population descended from long- past immigrant infl ows that had kept speaking their family’s language. As a result, among the quota- aff ected cities, some lost immigrants who spoke a common language among the preexisting population (because previous generations of immigrants had preserved their language across generations), while others lost immigrants who spoke an uncommon language among the population. These “off - diagonal” terms allow us to estimate the eff ects of immigrants on innovation in a city both when the immigrants speak a com-mon language in the city and when they do not.
The results are striking. We fi nd that native- born inventors whose cities lost immigrants who spoke uncommon languages apply for no fewer, and possibly more, patents after the quotas. Native- born inventors whose cities lost immigrants who spoke very common languages applied for somewhat fewer patents after the quotas. But native- born inventors whose cities lost
1. For a thorough overview of the theoretical tradeoff s between immigrant diversity and immigrant homogeneity in general, as well as important empirical results in this area, see Kemeny (2017).

Immigration and Invention: Does Language Matter? 125
immigrants with moderate linguistic diversity applied for many fewer pat-ents after the quotas.
These results are thus consistent with a U- shaped curve for the eff ect of linguistic diversity on the innovativeness of a society. Too much linguistic diversity creates a “Tower of Babel” eff ect (Ballatore, Fort, and Ichino 2018) in which people have unique things to talk about but no common language to say them in. Too little linguistic diversity creates a homogeneous popula-tion (Alesina and La Ferrara 2005) in which people have a common language but nothing unique to share. The optimal amount of linguistic diversity for a creative society appears to be somewhere in between.
It is important to note that, as Doran and Yoon (2019) explain, the eff ect of these low- skilled immigrants on native inventors is to act through a change in the scale of production that incentivizes strongly labor- complementary inventions (Acemoglu 2010). The role of communication, therefore, is hap-pening in the context of a low- skilled workforce, not in the context of highly skilled innovators themselves. The eff ects of linguistic diversity among highly skilled immigrants may therefore diff er from those reported here. We also note that here, as with many recent papers, we rely on policy variation for our identifi cation. We refer the reader to Doran and Yoon (2019) for historical evidence supporting the quota identifi cation strategy. In particu-lar, we there argue that “far from local eff orts to reduce all immigration to some locations but not others, these laws were national eff orts to reduce all immigration from some sources but not others” (Doran and Yoon 2019).
The chapter is organized as follows. In section 5.2, we review the literature on the 1920s quotas and explain where our results fi t in the context of that literature. In section 5.3, we introduce the data set, referring especially to Doran and Yoon (2019). In section 5.4, we introduce our empirical strategy and estimating equations. In section 5.5, we describe our results. In section 5.6, we conclude.
5.2 Existing Economics Literature on the Quotas
Before 1921, United States law placed virtually no limitations on immi-gration from Europe to the United States. Starting in the 1890s, Protestant Americans of Northern and Western European descent became concerned about the increased fl ows of non- Protestant immigrants from Southern and Eastern Europe. These concerns eventually reached an expression in law with the 1921 and 1924 immigration quotas. The Emergency Quota Act of 1921 established annual quotas for Southern and Eastern European immigration that were considerably lower than the then- current fl ows while establishing quotas for Northern and Western European immigration that were barely binding. The Immigration Act of 1924 tightened the quotas on Southern and Eastern European immigration even further.
In the last several years, a total of seven papers have emerged studying

126 Kirk Doran and Chungeun Yoon
the economic impacts of the 1920s US immigration quotas. After the initial work of Ager and Hansen (2018), these papers have been written almost simultaneously by separate teams of authors, with subtle diff erences in the implementation of the identifi cation strategies and without planned consis-tency. Nevertheless, here we argue that in fact these seven papers tell a largely consistent history in which the reported economic impacts of the quotas correspond with those predicted by models such as those presented by Bor-jas (1987), Acemoglu (2010), and Tabellini (2018). In particular, it appears that these quotas (1) reduced immigration from some sources but not oth-ers, (2) reduced immigration to some locations but not others, (3) induced diff erential wage changes among natives in aff ected locations, (4) induced a native migration response to aff ected locations that was less than one for one with the immigration reductions, (5) decreased the scale and mechanization of production in aff ected locations, and (6) decreased natives’ inventions in aff ected locations, especially those inventions relevant for industries that lost a large number of immigrant workers. This set of results is not only consistent with itself but also consistent with the new results reported here.
In this section, we review the results of this existing literature, summariz-ing the results and comparing them to models such as those in Borjas (1987) and Acemoglu (2010) and the model in appendix B by Tabellini (2018).
One of the most important papers in this literature is “Immigration in American Economic History” (Abramitzky and Boustan 2017). In this paper, Abramitzky and Boustan (2017) review the literature on historical and contemporary immigration. They focus on three major questions in the economics of immigration. First, they question whether immigrants are pos-itively or negatively selected from their home countries over time. Second, they explore how immigrants assimilate into the US. Third, they examine the eff ects of immigration on the economy, especially native employment and wages. In particular, they cover the two main eras of mass immigration—the age of mass migration from Europe (1850–1920), an era of unrestricted migration, and a recent period of constrained mass migration from Asia and Latin America (1965–present).
First, they fi nd that migrant selection was mixed in the past (with some migrants being positively selected and others being negatively selected from their home countries), while migrants are positively selected in the present. Specifi cally, migrant selection during the age of mass migration is consistent with a Roy model (Roy 1951) as developed by Borjas (1987). The Roy model would predict positive selection from Northern and Western Europe and negative selection from southern and eastern Europe, with diff erences in productive skills of migrants and income equality across sending countries. Historical evidence on income distribution supports their argument. Income distribution in Western European countries was similar to that of the US at that time, while income distribution in the European periphery was less equal than that of the US. Consistent with the model, historical evidence suggests

Immigration and Invention: Does Language Matter? 127
that low- skilled workers from southern and eastern Europe immigrated to the US and that they were thus negatively selected. The positive selection of immigrants today can be explained by both the increase in income inequality in the US (as the model would predict) and the increasing selectivity of US immigration policy, which would favor high- skilled immigration.
Second, they fi nd that assimilation of immigrants into the US economy is not consistent with the stereotypical “American Dream,” whereby poor immigrants work hard and eventually become rich. During periods of mass migration, immigrants did not catch up with US natives in the past, and they do not do so today, because immigrants start behind natives, and their occu-pational upgrading and earnings grow at a similar pace to that of US natives over time. Although immigrants experience some earnings convergence, the immigrants themselves do not catch up with US natives in the labor market during their own lifetimes. However, these gaps diminish across generations because many children of immigrants are educated and grow up in the US.
Third, the authors argue that immigrants during the age of mass migra-tion were more substitutable with natives in agriculture and manufacturing and that therefore there was some eff ect of immigration on native wages. They also fi nd that immigration in the past contributed to the spread of large factories used for mass production. In addition, unskilled immigrants and assembly- line machinery were complementary at that time.2
The fi rst paper to make use of the quotas as part of an identifi cation strat-egy to determine the economic eff ects of low- skilled immigration appears to be “Closing Heaven’s Door: Evidence from the 1920s U.S. Immigration Quota Acts” (Ager and Hansen 2018). Their fi rst main fi nding is that the areas with a large decline in incoming immigrants due to the quotas expe-rienced a decrease in the foreign- born share and lower population growth. Specifi cally, one additional missing immigrant per 100 inhabitants per year led to a decline in the foreign- born share by 1.6 percentage points and a decrease in the 10- year population growth rate by 6.7 percentage points at the county level. This suggests that any compensatory migration from non- quota- restricted immigrants or from natives was not enough to coun-teract the eff ects of the quotas on quota- aff ected immigration. Reinforcing the eff ects of this main fi nding is an associated decline in marriage rates in quota- aff ected regions. Second, they show that the quotas have a signifi cant eff ect on the earnings of native workers. Natives in counties exposed to the quotas were more likely to change to lower- wage occupations, though the eff ect varies by gender and race. In particular, white workers experienced earning losses, while black workers benefi ted from the quotas. Earnings of white female workers were not aff ected, while black female workers gained signifi cantly. These fi ndings suggest that immigrant workers during the 1920s had a higher elasticity of substitution to black native workers. Third,
2. See also related papers, such as Ward (2017) and Greenwood and Ward (2015).

128 Kirk Doran and Chungeun Yoon
they fi nd that labor productivity in manufacturing at the city level declined under the quotas.
A third important paper in this literature is Tabellini’s (2018). This paper makes two main additional contributions above and beyond the points already made in the literature described above. First, Tabellini (2018) intro-duces a notion of linguistic distance adapted from Chiswick and Miller (2005). The results show that the impact of immigration is tied closely to the linguistic distance of the source country language compared to English. The second main contribution is to introduce a model (in online appen-dix B of Tabellini 2018) that makes the following predictions: (1) (unskilled) immigration favors capital accumulation in the unskilled sector, (2) “immi-gration has a positive and unambiguous eff ect on high- skilled wages,” and (3) immigration has an ambiguous eff ect on low- skilled wages. This theoreti-cal framework is consistent with Tabellini (2018) by construction, but it is clearly consistent with the results of Ager and Hansen (2018) as well.
A fourth study in this literature is by Doran and Yoon (2019). This study addresses the question of how mass migration aff ects innovation. In particu-lar, it questions whether low- skilled immigrants could infl uence innovations through labor- complementary inventions or labor- saving inventions. The results show that incumbent inventors in cities exposed to fewer low- skilled immigration infl ows due to the 1920s quotas applied for fewer patents. To be specifi c, inventors living in quota- exposed cities that experienced a 10 percent reduction in new immigrants reduced their patent applications by 0.5 percent per year. Further, the eff ect of quotas on patents is driven by fewer patent applications relevant to the quota- exposed industries that lost immigrant workers.
The papers above tell a consistent history of the quotas—a history that lays the groundwork for this chapter. The quotas reduced low- skilled immi-gration, this decrease aff ected the large scale manufacturing that had fl our-ished in areas with many low- skilled immigrants, and inventors who sup-plied patented inventions relevant for the aff ected industries produced fewer such inventions after the quotas.
5.3 Data
Our analysis relies on a panel of individual inventors, a measure of how locations are exposed to quotas, and information on the primary languages spoken by new immigrants and the preexisting population of US cities circa 1920 (just before the quotas were enacted).
To obtain the inventor sample, we follow the method used in Doran and Yoon (2019). In particular, we use the European Patent Offi ce’s PATSTAT database, which provides characteristics such as the inventor’s full name, year of patent application, and the number of citations of each patent appli-cation granted by the US Patent Offi ce from 1899 to the present. We exploit

Immigration and Invention: Does Language Matter? 129
a fuzzy matching procedure that merges patents at the individual- name level into the complete- count 1920 US Census with names. In the 1920 Census, 43 percent of the US population is made up of people with a unique com-bination of fi rst name, middle name, and last name. If a person from this unique- name subsample is matched to a patent application made between the years 1919 and 1929, then, barring transcription errors, that person must be the author of the patent application unless someone with the exact same name immigrated after 1919 and patented soon after arrival. Furthermore, to increase the quality of the matches, we also restrict the matches to those with an implied age at the time of application of between 18 and 80 years old.
On this matched individual inventor sample, the variables from the complete- count 1920 US Census give us each individual’s birth year, birth-place, citizenship, nationality, and geographic location at the city/county level, as well as other characteristics.
Our second data set measures how locations were diff erentially exposed to the quotas over time as well as other characteristics of these locations. In Doran and Yoon (2019), we digitize immigration infl ows by source country and year, as well as the exact size of the quotas by country and year, from administrative data obtained from Willcox (1929) and the US Department of Commerce (1924, 1929, and 1931). Using data from the 1910 and 1920 US Censuses, we collect the following aggregated characteristics of each city: total population, foreign- born population, Southern and Eastern European immigrant population, Northern and Western European immigrant popu-lation, and immigrant populations by nationality and year of immigration to the US.
In the next section, we explain how unique features of the implementation of the quotas allow us to identify how the impact of low- skilled immigra-tion on American innovation varies by how closely the immigrant languages mirror that of the preexisting population.
5.4 Empirical Strategy
Typically, a shift- share instrument for immigration relies on variation in the national origin of the preexisting population across locations and assumes that the new immigrants will have a tendency to choose locations where people of their ethnicity or nationality already live. In most cases, this would also imply linguistic sorting, in which immigrants who speak a given language (say, for example, Italian) end up sorting to locations full of people who already speak that language. Given such linguistic sorting, it would be diffi cult to use such an instrument to determine the diff erential impact of immigrants who speak a relatively common language among the preexisting population from that of immigrants who speak a relatively rare language among the preexisting population in a given city. We would need a natural experiment in which immigrants who speak Italian, for example, are often

130 Kirk Doran and Chungeun Yoon
attracted to locations with relatively few Italian speakers and immigrants who do not speak Italian are often attracted to locations with relatively many Italian speakers. These “off - diagonal” sortings would enable us to determine whether immigrants have a diff erential impact when they are located in areas with relatively many or relatively few people speaking their language.
In this chapter, we exploit 1920s US immigration quotas that attracted speakers of a given language to locations with both relatively many and relatively few speakers of that language. In particular, the quotas suddenly cut off immigration to many cities that were “exposed” to the quotas because they had experienced recent fl ows of immigrants from quota- aff ected coun-tries. But these cities were not all alike: some quota- aff ected cities were popu-lated by the descendants of immigrants from previous generations whose families had preserved their native tongue (to the point of that language being their primary spoken method of communication). But other quota- aff ected cities were populated by the descendants of immigrants who pre-served an ethnic kinship with the newcomers but had not preserved their language. While both types of cities attracted new immigrants of a similar background to the preexisting foreign- born population before the quotas were enacted and both types of cities subsequently lost these new fl ows of immigrants after the quotas were enacted, only the fi rst type of city lost immigrants who spoke a language commonly spoken in their destination city. The second type of city lost immigrants who spoke a language uncommonly spoken in their destination city.
To identify the impact of low- skilled immigration on innovation in any given subsample, we follow the method in Doran and Yoon (2019), which built on Ager and Hansen (2018). To identify how these eff ects of low- skilled immigration on innovation vary depending on the linguistic distance between the new immigrants and the preexisting population in each city, we split the sample into four subsamples: (1) one in which the languages of the new immigrants had been preserved and were spoken widely among the preexisting population, (2) another in which the languages of the new immigrants were uncommon, (3) another in which the languages were mod-erately common, and (4) another in which the languages were moderately uncommon. We then replicate the main analysis in Doran and Yoon (2019) once for each subsample.
Our main estimation equations are
(1) Yict = α + β(Quotac × Postt) + θXit + τt + γi + εict,
where Yict is the number of patents by incumbent inventor i in city c and year t. We include the quartic of age of person i in year t, individual fi xed eff ects, and year fi xed eff ects. The quota- exposure variable is defi ned as follows:
(2) Quotac =100
Pc,1920j=1
J∑ Immigj,22−30 − Quotaj,22−30( ) FBjc,1920
FBj,1920
,

Immigration and Invention: Does Language Matter? 131
where Pc,1920 is the 1920 population in city c, Immigj,22−30 is the estimated average immigration infl ows that would have occurred per year from coun-try j to the United States during the postquota period from 1922 to 1930 if the quotas had not been enacted,3 Quotaj,22–30 is the average quota for coun-try j during the period from 1922 to 1930, FBjc,1920 is the foreign- born popu-lation of country j in city c in 1920, and FBj,1920 is the total foreign- born population of country j in the 1920 Census.
When a city’s predicted immigration from 1922 to 1930 (predicted from the pre–World War I annual immigration fl ows from 1900 to 1914) is much higher than quotas for the years 1922 through 1930, then the quota expo-sure variable is high. Otherwise, it is low. This quota begins to aff ect quota- exposed cities sometime after the quota acts of 1921 and 1924 are imple-mented. We compare diff erent options for the post- t variable, including 1922 and 1924. In this regression, β represents a diff erence- in- diff erences estimate of the eff ect of the quotas.
We can observe which languages the preexisting population spoke in each location by observing the individual responses in the 1920 US Census to the question in column 20: “person’s mother tongue.” Table 5.1 shows that in the US during 1920, there were considerable diff erences between the number of people born in a given country and the number of people whose mother tongue was the language of that country. Many US- born individuals contin-ued to speak the language of their immigrant parents even though they were born in the United States. This tendency for foreign- language persistence across generations varied from city to city, and this variation allows us to divide locations into those in which the languages of the new immigrants were common and those in which the languages of the new immigrants were not.
Each city c has a vector of languages in which each element, PreLanglc, is the share of the preexisting population in city c whose mother tongue is l:
(3) PreLanglc =Langlc,1920
TotalPopulationc,1920
.
Each city c also has a vector of languages in which each element, NewLanglc, is the share of the missing immigrants between 1922 and 1930 in city c whose mother tongue is l:
(4) NewLanglc =ImmigLanglc
TotalMissingImmigc
To calculate how close the languages of the new immigrants were to the languages spoken by the preexisting population, we need to determine how “close” the vector PreLang is to the vector NewLang. There is no mathemati-cally unique way to determine how “close” two vectors are to each other. We
3. The estimates are predicted from the pre–World War I annual immigration fl ows from 1900 to 1914 based on the regression model Immigjt = β1lnt + β2(lnt)2 + εjt (Ager and Hansen 2018; Doran and Yoon 2019).

132 Kirk Doran and Chungeun Yoon
make use of two methods used in Borjas and Doran (2012): the correlation coeffi cient and the index of similarity.
The correlation coeffi cient is well known. The index of similarity of Borjas and Doran (2012) is based on the “Index of Dissimilarity” used by Cutler and Glaeser (1997) and introduced by Duncan and Duncan (1955). We cal-culate the index of similarity with the following formula:
(5) LangIndexc = 1 −1
2 l=1
L∑ | PreLanglc − NewLanglc |
Clearly, the Index of Similarity will be one when the languages of the miss-ing immigrants are distributed identically to the languages of the preexist-ing population. If the preexisting languages and the languages of the miss-ing immigrants never match in the same city, then the index will be zero.4 For each of these measures of linguistic “closeness” between the missing immigrants and the preexisting population, we divide the cities into four equal groups by quartiles. We report simple statistics in table 5.2. It is clear
4. If two vectors never match, then
LangIndexc = 1 – 12 l =1
LΣ |PreLanglc – NewLanglc |
= 1 – 12 l =1
LΣ |PreLanglc | – 12 l =1
LΣ |NewLanglc | = 0.
Table 5.1 Birthplace and mother tongue in the 1920 US Census
Birthplace
Mother tongue
US UK Ireland Germany Italy Russia Poland Others(1) (2) (3) (4) (5) (6) (7) (8)
English 53.12 83.38 73.37 0.93 0.33 0.52 0.25 15.99German 17.34 0.52 0.34 95.96 0.17 8.62 7.53 8.54Italian 4.35 0.13 0.02 0.10 99.03 0.12 0.13 0.54Celtic 3.70 14.20 25.59 0.03 0.05 0.10 0.10 0.59Polish 2.10 0.09 0.05 1.43 0.01 5.10 78.54 1.58Spanish 2.51 0.04 0.02 0.05 0.05 0.05 0.02 9.67French 2.63 0.08 0.08 0.10 0.08 0.06 0.03 7.85Swedish 2.40 0.15 0.10 0.06 0.01 0.09 0.02 10.69Jewish 1.52 0.83 0.07 0.23 0.04 49.98 8.56 2.68Norwegian 1.37 0.01 0.01 0.04 0.00 0.01 0.00 5.99Czech 1.03 0.01 0.00 0.08 0.00 0.08 0.07 3.63Russian 0.79 0.11 0.00 0.04 0.00 23.91 1.15 0.14Dutch 0.84 0.10 0.03 0.13 0.01 0.05 0.03 2.90Danish 0.79 0.02 0.05 0.30 0.01 0.02 0.01 2.98Hungarian 0.69 0.01 0.01 0.09 0.01 0.06 0.07 4.57Others 4.80 0.32 0.26 0.43 0.20 11.23 3.49 21.64
Total 91,683,696 1,153,841 1,049,330 1,631,480 1,608,841 1,450,734 1,133,710 6,033,502
Note: This table shows the relationship between birthplace and mother tongue in the 1920 US Census. Each number indicates the percentage of people reporting a given mother tongue out of those born in a given birth-place. The UK numbers in column 2 exclude people born in Ireland. The last row shows the total number of individuals born in a given birthplace.
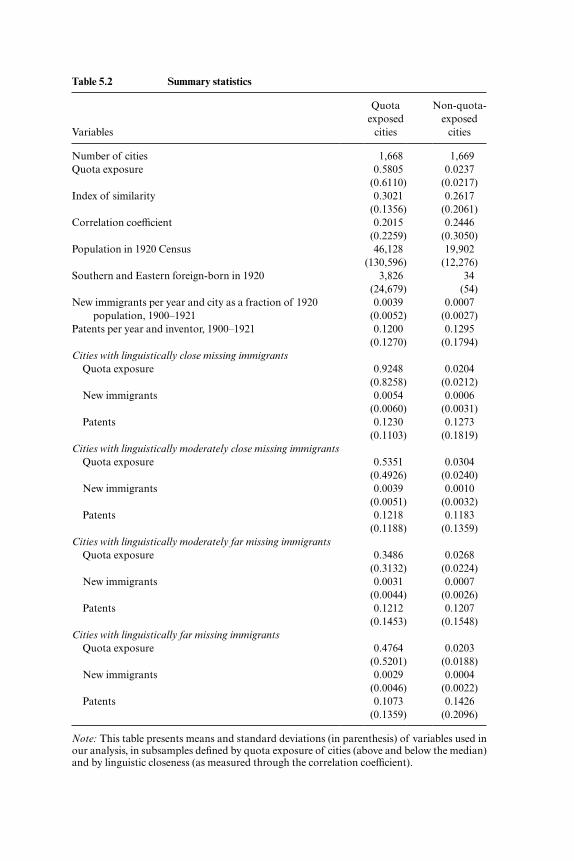
Table 5.2 Summary statistics
Variables
Quota exposed
cities
Non- quota- exposed
cities
Number of cities 1,668 1,669 Quota exposure 0.5805 0.0237
(0.6110) (0.0217)Index of similarity 0.3021 0.2617
(0.1356) (0.2061)Correlation coeffi cient 0.2015 0.2446
(0.2259) (0.3050)Population in 1920 Census 46,128 19,902
(130,596) (12,276)Southern and Eastern foreign- born in 1920 3,826 34
(24,679) (54)New immigrants per year and city as a fraction of 1920
population, 1900–19210.0039 0.0007
(0.0052) (0.0027)Patents per year and inventor, 1900–1921 0.1200 0.1295
(0.1270) (0.1794)Cities with linguistically close missing immigrants
Quota exposure 0.9248 0.0204(0.8258) (0.0212)
New immigrants 0.0054 0.0006(0.0060) (0.0031)
Patents 0.1230 0.1273(0.1103) (0.1819)
Cities with linguistically moderately close missing immigrantsQuota exposure 0.5351 0.0304
(0.4926) (0.0240)New immigrants 0.0039 0.0010
(0.0051) (0.0032)Patents 0.1218 0.1183
(0.1188) (0.1359)Cities with linguistically moderately far missing immigrants
Quota exposure 0.3486 0.0268(0.3132) (0.0224)
New immigrants 0.0031 0.0007(0.0044) (0.0026)
Patents 0.1212 0.1207(0.1453) (0.1548)
Cities with linguistically far missing immigrantsQuota exposure 0.4764 0.0203
(0.5201) (0.0188)New immigrants 0.0029 0.0004
(0.0046) (0.0022)Patents 0.1073 0.1426
(0.1359) (0.2096)
Note: This table presents means and standard deviations (in parenthesis) of variables used in our analysis, in subsamples defi ned by quota exposure of cities (above and below the median) and by linguistic closeness (as measured through the correlation coeffi cient).

134 Kirk Doran and Chungeun Yoon
that there are similar infl ows of new immigrants and similar rates of patent applications by incumbent native inventors across all quota- exposed cities regardless of the degree of linguistic closeness of the missing immigrants to that city.
In the next section, we determine whether the quota- induced change in immigration had diff erential impacts on innovation depending on whether the immigrants spoke a relatively common local language or not.
5.5 Results
We begin our analysis by showing that the quotas decreased immigra-tion infl ows in quota- exposed locations regardless of linguistic distance. In tables 5.3 and 5.4, we report the results when the outcome variable is newly arrived immigrants rescaled by the 1920 city population in a given location in a given year, after we split the sample into the four subsamples using the correlation coeffi cient and the index of similarity, respectively. It is apparent that regardless of which of the four subsamples partitioned by linguistic distance we consider, which of the two proxies (the correlation coeffi cient and the index of similarity) for linguistic distance we use to split the sample, which years we include in the sample, and which year we use as the posttreat-ment year, the quota- exposed cities experienced substantial reductions to their immigrant infl ows. Next we determine how the quotas, which decreased immigration infl ows to all four groups of cities, diff erentially aff ected inno-vation (as measured by patents) depending on the linguistic closeness of the missing immigrants to the preexisting population.
The quota- exposure variable represents the average annual number of immigrants per 100 inhabitants in a city who were “missing” due to the quotas (Ager and Hansen 2018; Doran and Yoon 2019). Doran and Yoon (2019) fi nd that a one- unit increase in quota exposure decreases immigration infl ows by approximately 100 percent and decreases patent applications by incumbent native- born inventors by about 5 percent. Thus for every 10 per-cent decrease in immigration infl ows, patent applications per year decrease by 0.5 percent.
Here we explore how these results vary with respect to the linguistic close-ness of the missing immigrants to the preexisting population. In table 5.5, we report the results of estimating equation (1) on the four subsamples of cities partitioned by linguistic closeness measured through the correlation coeffi cient. It is clear that the eff ect of the quotas on native patenting is most signifi cant when the missing immigrants and the preexisting popula-tion are moderately close linguistically. Moderately far linguistic- distance cities experience the second- largest and second- most- signifi cant eff ect on patenting. The linguistically close and linguistically far cities experience smaller and less signifi cant eff ects.
In table 5.6, we report the results of the same estimation when we parti-

Table 5.3 How the eff ect of the quotas on immigrant infl ows varies with linguistic closeness, as measured by the correlation coeffi cient
Year of immigration
1900–1929 1919–29
Posttreatment year
1922 1924 1922 1924 (1) (2) (3) (4)
A. Linguistically close missing immigrantsQuota exposure × posttreatment –0.0028*** –0.0029*** –0.0008*** –0.0010***
(0.0002) (0.0002) (0.0001) (0.0001) Dependent variable mean 0.0025 0.0024 0.0018 0.0016Number of observations 23,190 23,190 8,503 8,503Number of cities 773 773 773 773R2 0.5447 0.5409 0.6364 0.6422
B. Linguistically moderately close missing immigrantsQuota exposure × posttreatment –0.0024*** –0.0025*** –0.0006*** –0.0009***
(0.0002) (0.0002) (0.0001) (0.0001) Dependent variable mean 0.0028 0.0027 0.0021 0.0020Number of observations 23,850 23,850 8,745 8,745Number of cities 795 795 795 795R2 0.5576 0.5558 0.6972 0.7010
C. Linguistically moderately far missing immigrantsQuota exposure × posttreatment –0.0030*** –0.0032*** –0.0008*** –0.0011***
(0.0004) (0.0004) (0.0002) (0.0001) Dependent variable mean 0.0024 0.0023 0.0016 0.0016Number of observations 22,890 22,890 8,393 8,393Number of cities 763 763 763 763R2 0.5633 0.5604 0.6757 0.6821
D. Linguistically far missing immigrantsQuota exposure × posttreatment –0.0034*** –0.0035*** –0.0005*** –0.0009***
(0.0003) (0.0002) (0.0002) (0.0002) Dependent variable mean 0.0016 0.0015 0.0009 0.0008Number of observations 22,170 22,170 8,129 8,129Number of cities 739 739 739 739R2 0.5279 0.5227 0.6340 0.6439
Note: The dependent variable is new immigrants as a fraction of 1920 population. The out-come variable of new immigrants is constructed by combining information from the 1910, 1920, and 1930 US Census. Specifi cally, new immigrants per year between the years 1900 and 1909 are obtained from the 1910 Census data, those between 1910 and 1919 from the 1920 US Census, etc. We restrict data to cities that exist in all three censuses to obtain a balanced panel. The sample of cities is partitioned into four equally sized subsamples according to the quartile of linguistic closeness, as measured through the correlation coeffi cient.

Table 5.4 How the eff ect of the quotas on immigrant infl ows varies with linguistic closeness, as measured by the index of similarity
Year of immigration
1900–1929 1919–29
Posttreatment year
1922 1924 1922 1924 (1) (2) (3) (4)
A. Linguistically close missing immigrantsQuota exposure × posttreatment –0.0026*** –0.0027*** –0.0008*** –0.0010***
(0.0002) (0.0002) (0.0001) (0.0001) Dependent variable mean 0.0033 0.0032 0.0022 0.0020Number of observations 22,650 22,650 8,305 8,305Number of cities 755 755 755 755R2 0.5905 0.5864 0.7680 0.7761
B. Linguistically moderately close missing immigrantsQuota exposure × posttreatment –0.0027*** –0.0029*** –0.0007*** –0.0012***
(0.0003) (0.0003) (0.0002) (0.0001) Dependent variable mean 0.0028 0.0028 0.0021 0.0020Number of observations 23,730 23,730 8,701 8,701Number of cities 791 791 791 791R2 0.5351 0.5346 0.6228 0.6299
C. Linguistically moderately far missing immigrantsQuota exposure × posttreatment –0.0036*** –0.0039*** –0.0004* –0.0012***
(0.0003) (0.0003) (0.0002) (0.0003) Dependent variable mean 0.0020 0.0020 0.0014 0.0013Number of observations 23,400 23,400 8,580 8,580Number of cities 780 780 780 780R2 0.5127 0.5115 0.6444 0.6470
D. Linguistically far missing immigrantsQuota exposure × posttreatment –0.0034*** –0.0033*** –0.0001 –0.0003***
(0.0003) (0.0002) (0.0001) (0.0001) Dependent variable mean 0.0011 0.0011 0.0007 0.0006Number of observations 22,320 22,320 8,184 8,184Number of cities 744 744 744 744R2 0.4990 0.4905 0.6076 0.6084
Note: The dependent variable is new immigrants as a fraction of 1920 population. The out-come variable of new immigrants is constructed by combining information from the 1910, 1920, and 1930 US Census. Specifi cally, new immigrants per year between the years 1900 and 1909 are obtained from the 1910 Census data, those between 1910 and 1919 from the 1920 US Census, etc. We restrict data to cities that exist in all three censuses to obtain a balanced panel. The sample of cities is partitioned into four equally- sized subsamples according to the quartile of linguistic closeness, as measured through the index of similarity.

Table 5.5 How the eff ect of the quotas on patents varies with linguistic closeness, as measured by the correlation coeffi cient
Year of patent application
1900–1950 1919–29
Posttreatment year
1922 1924 1922 1924 (1) (2) (3) (4)
A. Linguistically close missing immigrantsQuota exposure × posttreatment –0.0011 –0.0031* 0.0004 –0.0027
(0.0020) (0.0019) (0.0035) (0.0025) Dependent variable mean 0.1215 0.1173 0.1010 0.0906Number of observations 1,217,491 1,217,491 292,122 292,122Number of inventors 27,170 27,170 27,170 27,170Number of cities 845 845 845 845R2 0.2540 0.2540 0.4292 0.4292
B. Linguistically moderately close missing immigrantsQuota exposure × posttreatment –0.0022* –0.0033*** –0.0047*** –0.0053***
(0.0012) (0.0012) (0.0015) (0.0014) Dependent variable mean 0.1291 0.1244 0.1105 0.0975Number of observations 2,370,644 2,370,644 565,794 565,794Number of inventors 52,385 52,385 52,385 52,385Number of cities 813 813 813 813R2 0.2302 0.2302 0.3999 0.3999
C. Linguistically moderately far missing immigrantsQuota exposure × posttreatment 0.0002 –0.0020 –0.0060* –0.0073***
(0.0023) (0.0022) (0.0031) (0.0027) Dependent variable mean 0.1250 0.1204 0.1060 0.0933Number of observations 2,018,139 2,018,139 482,816 482,816Number of inventors 44,749 44,749 44,749 44,749Number of cities 816 816 816 816R2 0.2149 0.2149 0.3850 0.3850
D. Linguistically far missing immigrantsQuota exposure × posttreatment 0.0042 0.0031 0.0035 0.0022
(0.0031) (0.0028) (0.0054) (0.0040) Dependent variable mean 0.1203 0.1157 0.1008 0.0886Number of observations 965,134 965,134 231,378 231,378Number of inventors 21,398 21,398 21,398 21,398Number of cities 813 813 813 813R2 0.2494 0.2494 0.3945 0.3945
Note: The dependent variable is patents by incumbent inventors in 1919. The outcome vari-able is the number of patent applications per year by native- born incumbent inventors who already had at least one patent in 1919. The sample of cities is partitioned into four equally- sized subsamples according to the quartile of linguistic closeness, as measured through the correlation coeffi cient.

Table 5.6 How the eff ect of the quotas on patents varies with linguistic closeness, as measured by the index of similarity
Year of patent application
1900–1950 1919–29
Posttreatment year
1922 1924 1922 1924 (1) (2) (3) (4)
A. Linguistically close missing immigrantsQuota exposure × posttreatment –0.0016 –0.0028*** –0.0037** –0.0049***
(0.0011) (0.0010) (0.0016) (0.0014) Dependent variable mean 0.1277 0.1233 0.1084 0.0970Number of observations 1,892,525 1,892,525 452,132 452,132Number of inventors 41,902 41,902 41,902 41,902Number of cities 823 823 823 823R2 0.2400 0.2401 0.4147 0.4147
B. Linguistically moderately close missing immigrantsQuota exposure × posttreatment –0.0039* –0.0054** –0.0066** –0.0066**
(0.0020) (0.0021) (0.0026) (0.0029) Dependent variable mean 0.1253 0.1209 0.1103 0.0971Number of observations 2,534,367 2,534,367 605,425 605,425Number of inventors 56,022 56,022 56,022 56,022Number of cities 823 823 823 823R2 0.2175 0.2175 0.3949 0.3949
C. Linguistically moderately far missing immigrantsQuota exposure × posttreatment –0.0076** –0.0085** –0.0047 –0.0042
(0.0036) (0.0034) (0.0065) (0.0044) Dependent variable mean 0.1216 0.1169 0.0990 0.0871Number of observations 1,436,744 1,436,744 344,294 344,294Number of inventors 31,986 31,986 31,986 31,986Number of cities 822 822 822 822R2 0.2464 0.2464 0.3978 0.3978
D. Linguistically far missing immigrantsQuota exposure × posttreatment 0.0099* 0.0119** 0.0082 0.0125**
(0.0052) (0.0050) (0.0071) (0.0063) Dependent variable mean 0.1250 0.1196 0.0977 0.0851Number of observations 707,772 707,772 170,259 170,259Number of inventors 15,792 15,792 15,792 15,792Number of cities 819 819 819 819R2 0.2391 0.2391 0.3783 0.3783
Note: The dependent variable is patents by incumbent inventors in 1919. The outcome vari-able is the number of patent applications per year by native- born incumbent inventors who already had at least one patent in 1919. The sample of cities is partitioned into four equally- sized subsamples according to the quartile of linguistic closeness, as measured through the index of similarity.
Immigration and Invention: Does Language Matter? 139
tion the sample of cities according to linguistic closeness as measured by the index of similarity. Here the results show that the eff ect of losing immigrants through the quotas on native patenting is positive and signifi cant if the missing immigrants were very linguistically diff erent from the preexisting population. The eff ect becomes negative and signifi cant when the missing immigrants are moderately linguistically close to the preexisting population; the eff ect is slightly smaller for those that are very linguistically close.
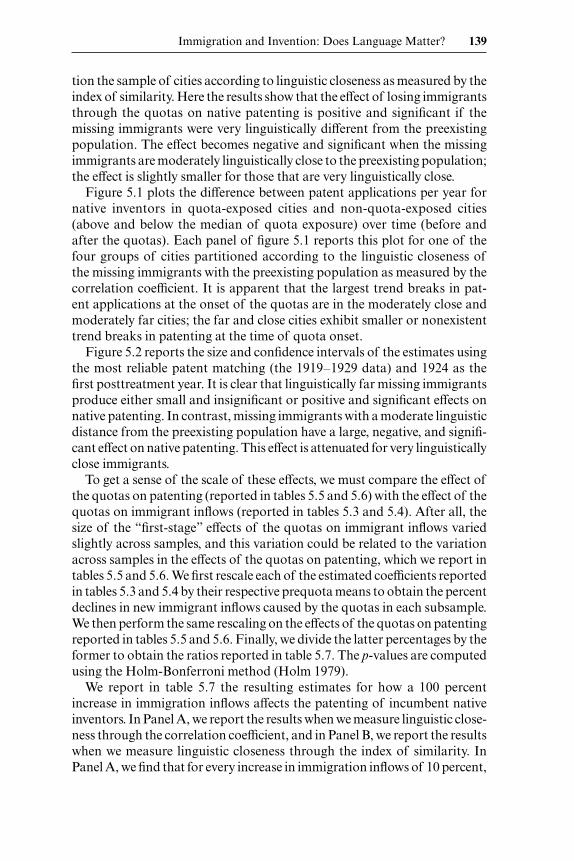
Figure 5.1 plots the diff erence between patent applications per year for native inventors in quota- exposed cities and non- quota- exposed cities (above and below the median of quota exposure) over time (before and after the quotas). Each panel of fi gure 5.1 reports this plot for one of the four groups of cities partitioned according to the linguistic closeness of the missing immigrants with the preexisting population as measured by the correlation coeffi cient. It is apparent that the largest trend breaks in pat-ent applications at the onset of the quotas are in the moderately close and moderately far cities; the far and close cities exhibit smaller or nonexistent trend breaks in patenting at the time of quota onset.
Figure 5.2 reports the size and confi dence intervals of the estimates using the most reliable patent matching (the 1919–1929 data) and 1924 as the fi rst posttreatment year. It is clear that linguistically far missing immigrants produce either small and insignifi cant or positive and signifi cant eff ects on native patenting. In contrast, missing immigrants with a moderate linguistic distance from the preexisting population have a large, negative, and signifi -cant eff ect on native patenting. This eff ect is attenuated for very linguistically close immigrants.
To get a sense of the scale of these eff ects, we must compare the eff ect of the quotas on patenting (reported in tables 5.5 and 5.6) with the eff ect of the quotas on immigrant infl ows (reported in tables 5.3 and 5.4). After all, the size of the “fi rst- stage” eff ects of the quotas on immigrant infl ows varied slightly across samples, and this variation could be related to the variation across samples in the eff ects of the quotas on patenting, which we report in tables 5.5 and 5.6. We fi rst rescale each of the estimated coeffi cients reported in tables 5.3 and 5.4 by their respective prequota means to obtain the percent declines in new immigrant infl ows caused by the quotas in each subsample. We then perform the same rescaling on the eff ects of the quotas on patenting reported in tables 5.5 and 5.6. Finally, we divide the latter percentages by the former to obtain the ratios reported in table 5.7. The p- values are computed using the Holm- Bonferroni method (Holm 1979).
We report in table 5.7 the resulting estimates for how a 100 percent increase in immigration infl ows aff ects the patenting of incumbent native inventors. In Panel A, we report the results when we measure linguistic close-ness through the correlation coeffi cient, and in Panel B, we report the results when we measure linguistic closeness through the index of similarity. In Panel A, we fi nd that for every increase in immigration infl ows of 10 percent,

A
B
Fig. 5.1 The eff ect of the quotas on patent applications per yearNote: The fi gures show the diff erence in the number of patent applications per year by incum-bent inventors between quota exposed cities (those where the quota exposure variable is greater than or equal to the median) and non- quota- exposed cities (those where the variable is below the median). The sample is partitioned into four subsamples according to linguistic closeness between the missing immigrants and the preexisting population, as measured through the correlation coeffi cient.

Immigration and Invention: Does Language Matter? 141
patent applications per year increase by about 1 percent in both moderately linguistically close cities and moderately linguistically far cities. In contrast, there is no signifi cant eff ect on linguistically far and linguistically close cit-ies. In Panel B, we fi nd that for every increase in immigration infl ows of 10 percent, patent applications per year increase by about 1 percent in both moderately linguistically close and linguistically close cities. In contrast, for
C
D
Fig. 5.1 (cont.)

A
B
Fig. 5.2 Diff erence- in- diff erences coeffi cients of the eff ect of the quotas on patent applications per yearNote: Panels (a) and (b) represent the estimated diff erence- in- diff erences coeffi cients in col-umn (4) of table 5.5 and 5.6, respectively. The estimate from the linguistically far cities is lo-cated in the fi rst quartile, while the fourth quartile shows the coeffi cient from the linguistically close cities. The coeffi cients measure the eff ect of the quotas on the number of patent applica-tions per year by incumbent inventors (those who had at least one patent by 1919) during the years 1919 through 1929 using 1924 as the fi rst posttreatment year.

Immigration and Invention: Does Language Matter? 143
linguistically far cities, for every increase in immigration infl ows of 10 per-cent, patent applications per year decrease by 3 percent.
In fi gure 5.3, we summarize these results, providing graphical evidence of a “U- shaped” curve in the eff ect of linguistic distance between newcomers and the preexisting population on patent applications.
5.6 Conclusion
In this chapter, we explore the mediating role of language in the eff ect of immigrants on innovation. We fi nd, as in Doran and Yoon (2019), that low- skilled immigrants aff ect the innovation of preexisting native inventors. But we further fi nd that the language the immigrants speak matters.
Intuitively, if innovation is the recombination of existing ideas or experi-ences into new ones (Weitzman 1998), then anything that aff ects this recom-bination could aff ect innovation. Linguistic diversity could aff ect the num-ber of unique ideas people have to talk about as well as the ability of people to talk about them. The fi rst eff ect would make linguistic diversity favorable for innovation; the second eff ect would make linguistic homogeneity favor-able for innovation.
It is plausible, therefore, that the optimal amount of linguistic diversity is somewhere in between complete diversity and complete homogeneity. The results we report here are consistent with this hypothesis.
These results are, of course, specifi c to the low- skilled immigrant work-force prevalent at the time as well as to the state of knowledge and types of inventions common during the period. Future research should determine whether the benefi ts of new ideas, abilities, and experiences from a linguis-
Table 5.7 Eff ect of immigration infl ows on patenting
Linguistic closeness
Far Moderately far Moderately close Close (1) (2) (3) (4)
A. Correlation coeffi cientPatent/immigration –0.0217 0.1057 0.1145 0.0469p- value 0.5859 0.0083 0.0003 0.2802
B. Index of similarityPatent/immigration –0.3064 0.0539 0.1095 0.1025p- value 0.0469 0.3377 0.0227 0.0004
Note: This table shows the eff ect of quotas on patents relative to its eff ect on immigration in-fl ows by dividing the estimated coeffi cients on patents relative to its mean (in column 4 on tables 5.5 and 5.6, respectively) by the estimated coeffi cients on immigration infl ows relative to its mean (in column 4 on tables 5.3 and 5.4, respectively). The p- values are computed using Holm- Bonferroni method. The estimated eff ects are graphically shown on fi gure 5.3.

Fig. 5.3 Eff ect of immigrant infl ows on patent applicationsNote: The fi gure graphically represents the estimated eff ects reported in table 5.7. We rescale each of the estimated coeffi cients reported in tables 5.3 and 5.4 by their respective prequota means to obtain the percent declines in new immigrant infl ows caused by the quotas in each subsample. We then perform the same rescaling on the eff ects of the quotas on patenting re-ported in tables 5.5 and 5.6. Finally, we divide the latter percentages by the former to obtain the ratios reported above. The p- values are computed using the Holm- Bonferroni method (Holm 1979).
A
B

Immigration and Invention: Does Language Matter? 145
tically diverse, highly skilled immigrant pool outweigh any communication barriers they bring.
References
Abramitzky, R., and L. Boustan. 2017. “Immigration in American Economic His-tory.” Journal of Economic Literature 55 (4): 1311–14.
Abramitzky, R., L. P. Boustan, and K. Eriksson. 2014. “A Nation of Immigrants: Assimilation and Economic Outcomes in the Age of Mass Migration.” Journal of Political Economy 122 (3): 467–506.
Acemoglu, D. 2010. “When Does Labor Scarcity Encourage Innovation?” Journal of Political Economy 118 (6): 1037–78.
Ager, P., and C. W. Hansen. 2018. “Closing Heaven’s Door: Evidence from the 1920s US Immigration Quota Acts.” Working Paper.
Alesina, A., and E. L. Ferrara. 2005. “Ethnic Diversity and Economic Performance.” Journal of Economic Literature 43 (3): 762–800.
Ballatore, R. M., M. Fort, and A. Ichino. 2018. “Tower of Babel in the Classroom: Immigrants and Natives in Italian Schools.” Journal of Labor Economics 36 (4): 885–921.
Borjas, G. J. 1987. “Self- Selection and the Earnings of Immigrants.” American Eco-nomic Review 77 (4): 531–53.
Borjas, G. J., and K. B. Doran. 2012. “The Collapse of the Soviet Union and the Productivity of American Mathematicians.” Quarterly Journal of Economics 127 (3): 1143–203.
Chiswick, B. R., and P. W. Miller. 2005. “Linguistic Distance: A Quantitative Mea-sure of the Distance between English and Other Languages.” Journal of Multi-lingual and Multicultural Development 26 (1): 1–11.
Doran, K. B., and C. Yoon. 2019. “Immigration and Invention: Evidence from the Quota Acts.” University of Notre Dame mimeo.
Duncan, O., and B. Duncan. 1955. “A Methodological Analysis of Segregation Indexes.” American Sociological Review 20 (2): 210–17.
Greenwood, M. J., and Z. Ward. 2015. “Immigration Quotas, World War I, and Emigrant Flows from the United States in the Early 20th Century.” Explorations in Economic History 55:76–96.
Holm, S. 1979. “A Simple Sequentially Rejective Multiple Test Procedure.” Scandi-navian Journal of Statistics 6 (2): 65–70.
Kemeny, T. 2017. “Immigrant Diversity and Economic Performance in Cities.” Inter-national Regional Science Review 40 (2): 164–208.
Roy, A. D. 1951. “Some Thoughts on the Distribution of Earnings.” Oxford Eco-nomic Papers 3 (2): 135–46.
Tabellini, M. 2018. “Gifts of the Immigrants, Woes of the Natives: Lessons from the Age of Mass Migration.” Harvard Business School Working paper no. 19- 005.
US Department of Commerce, Bureau of the Census. 1924, 1929, 1931. Statistical Abstract of the United States. Washington, DC: GPO.
Ward, Z. 2017. “Birds of Passage: Return Migration, Self- Selection and Immigration Quotas.” Explorations in Economic History 64:37–52.
Weitzman, M. L. 1998. “Recombinant Growth.” Quarterly Journal of Economics 113 (2): 331–60.
Willcox, W. F., ed. 1929. International Migrations, Volume I: Statistics. New York: National Bureau of Economic Research.