Embed Size (px)
Citation preview

The Roles of Alternative & Bio-Fuels in a New Market Equilibrium
Gil RodgersSenior Director – Global Energy Group
Copyright © 2006 Global Insight, Inc. 2
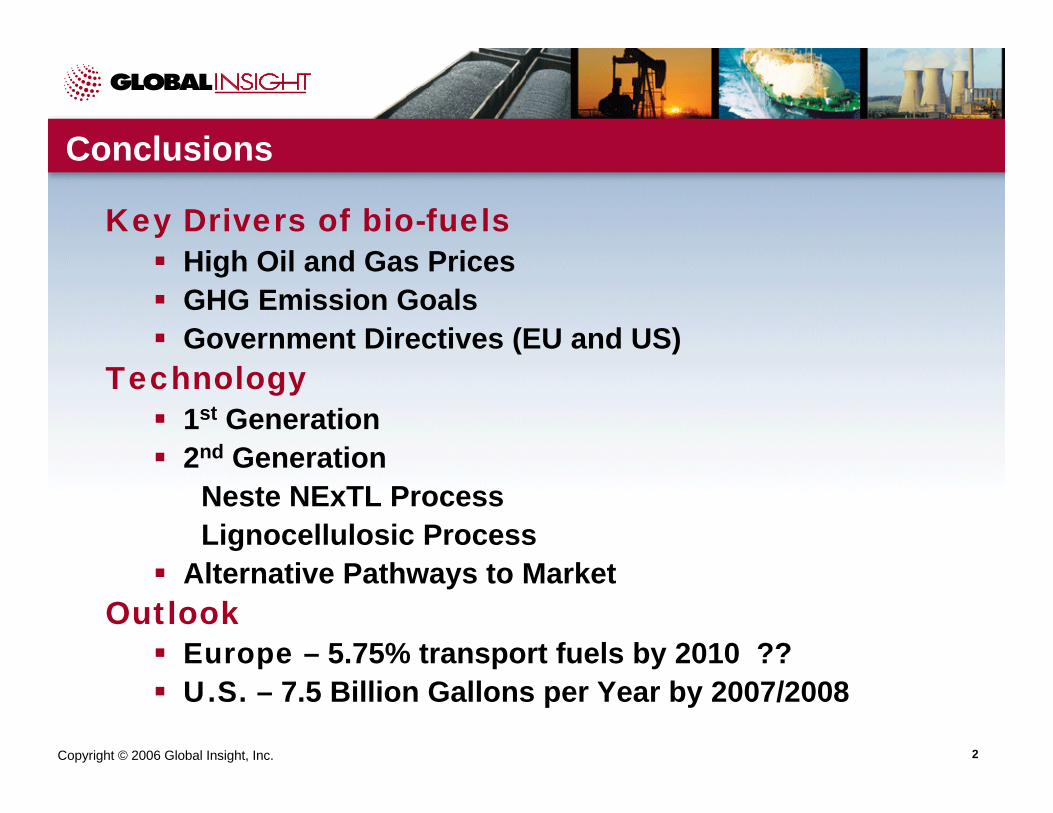
Conclusions
Key Drivers of bio-fuelsHigh Oil and Gas PricesGHG Emission GoalsGovernment Directives (EU and US)
Technology1st Generation 2nd Generation
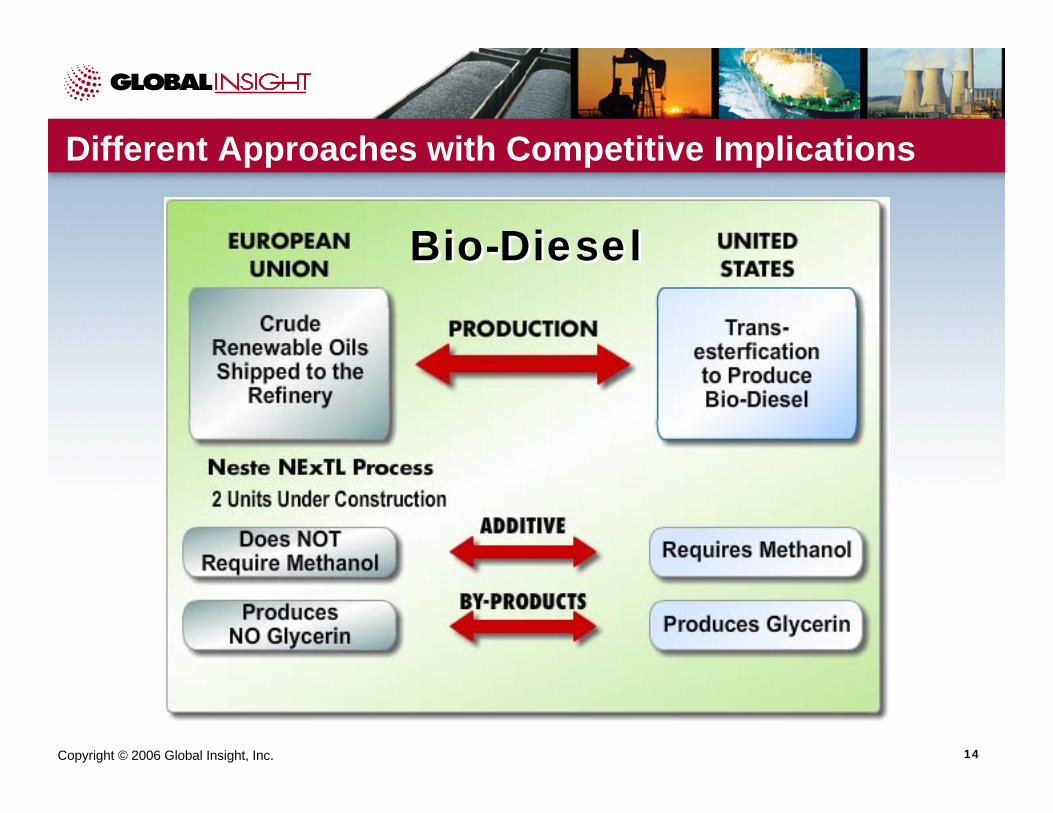
Neste NExTL ProcessLignocellulosic Process
Alternative Pathways to MarketOutlook
Europe – 5.75% transport fuels by 2010 ??U.S. – 7.5 Billion Gallons per Year by 2007/2008
Copyright © 2006 Global Insight, Inc. 3
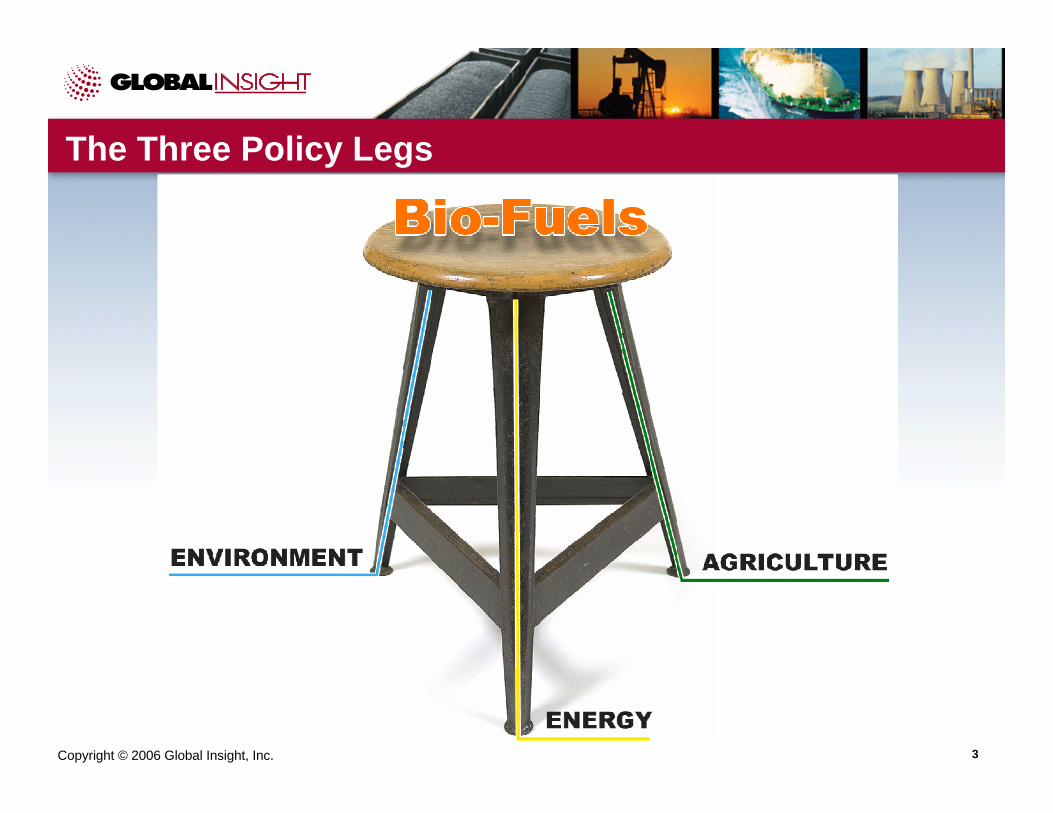
The Three Policy Legs
Copyright © 2006 Global Insight, Inc. 4
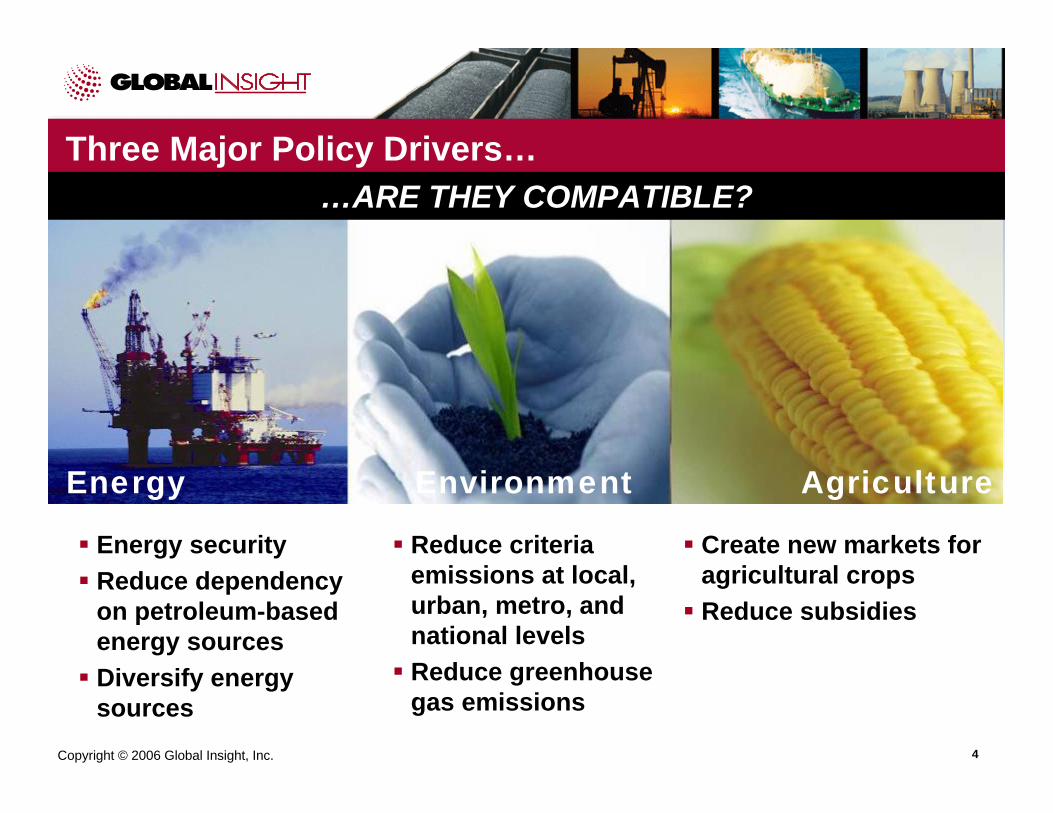
Three Major Policy Drivers…
Environment
Reduce criteria emissions at local, urban, metro, and national levelsReduce greenhouse gas emissions
Agriculture
Create new markets for agricultural cropsReduce subsidies
Energy
Energy securityReduce dependency on petroleum-based energy sourcesDiversify energy sources
…ARE THEY COMPATIBLE?
Copyright © 2006 Global Insight, Inc. 5
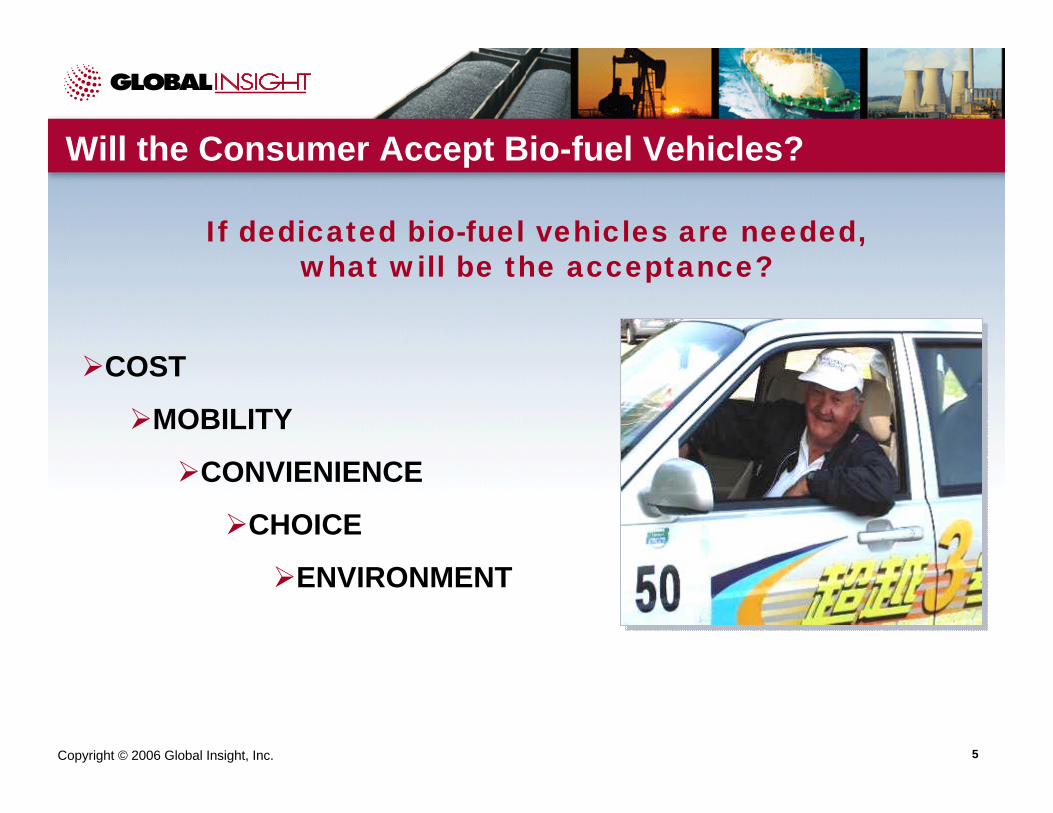
Will the Consumer Accept Bio-fuel Vehicles?
If dedicated bio-fuel vehicles are needed, what will be the acceptance?
COST
MOBILITY
CONVIENIENCE
CHOICE
ENVIRONMENT
Copyright © 2006 Global Insight, Inc. 6
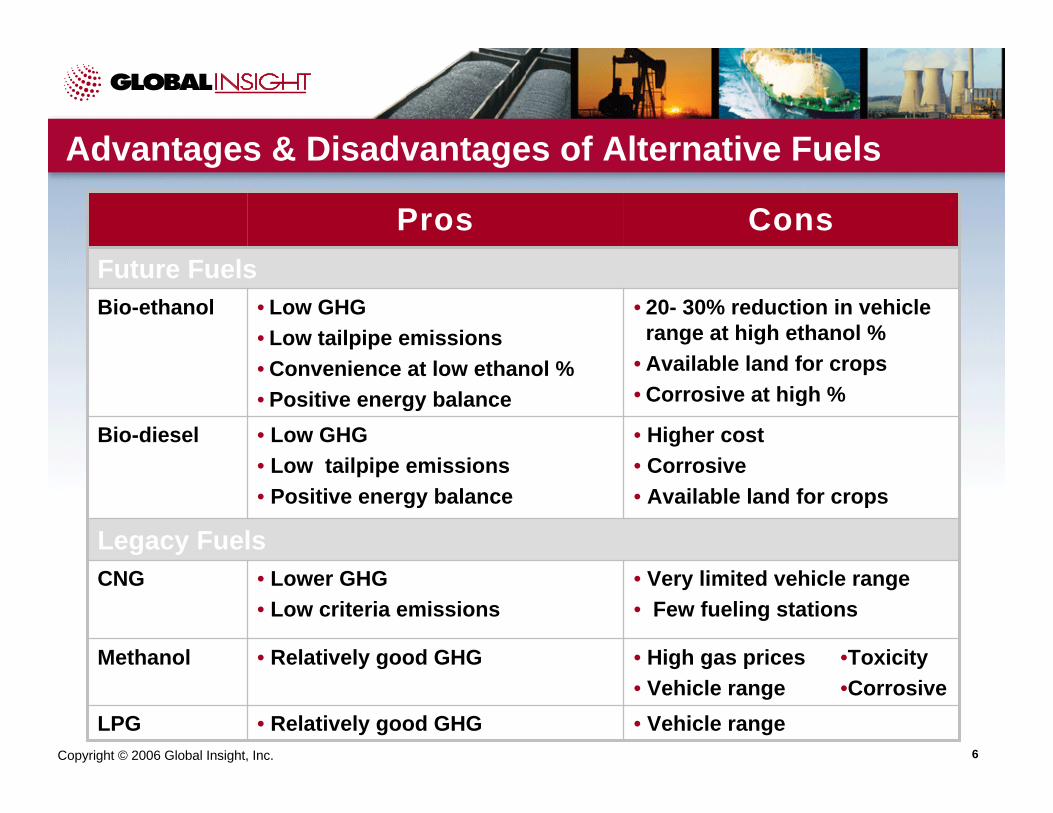
Advantages & Disadvantages of Alternative Fuels
•Toxicity•Corrosive
Legacy Fuels
ConsPros
• High gas prices• Vehicle range
• Relatively good GHGMethanol
• Vehicle range• Relatively good GHGLPG
• Very limited vehicle range• Few fueling stations
• Lower GHG• Low criteria emissions
CNG
• Higher cost• Corrosive• Available land for crops
• Low GHG• Low tailpipe emissions• Positive energy balance
Bio-diesel
• 20- 30% reduction in vehicle range at high ethanol %
• Available land for crops• Corrosive at high %
• Low GHG• Low tailpipe emissions• Convenience at low ethanol %• Positive energy balance
Bio-ethanolFuture Fuels
Copyright © 2006 Global Insight, Inc. 7
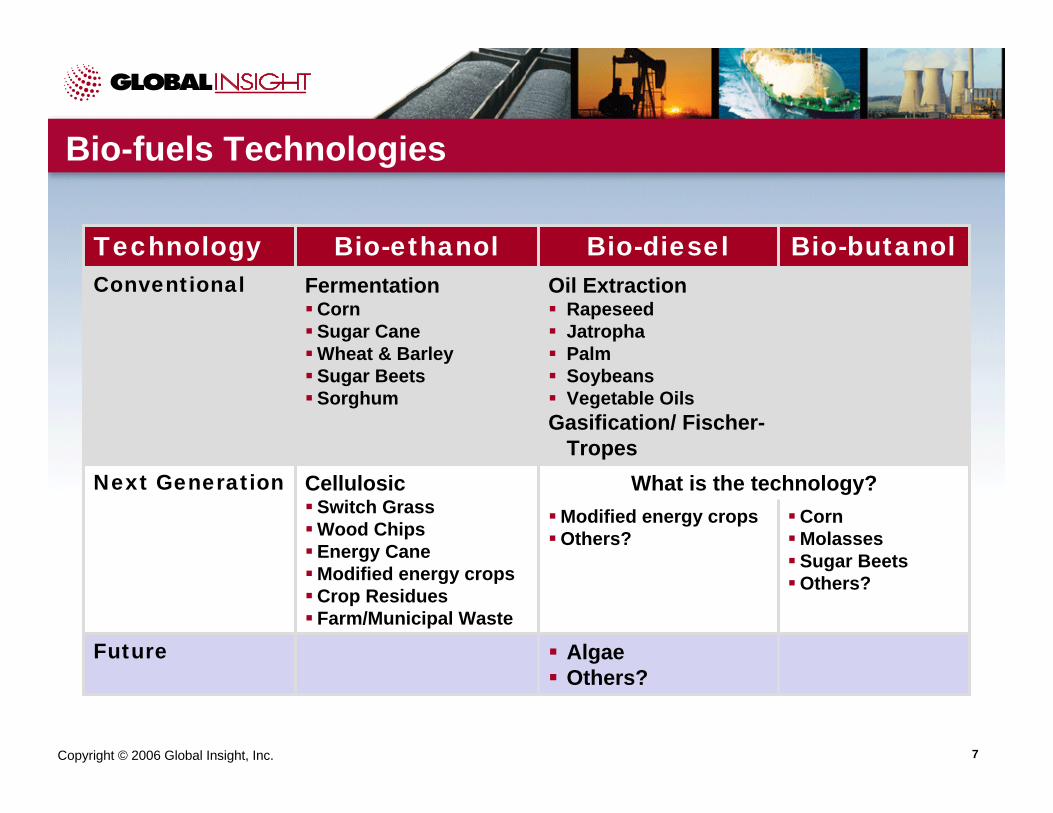
Bio-fuels Technologies
What is the technology?
AlgaeOthers?
Future
CornMolassesSugar BeetsOthers?
Modified energy cropsOthers?
CellulosicSwitch GrassWood ChipsEnergy CaneModified energy cropsCrop ResiduesFarm/Municipal Waste
Next Generation
Oil ExtractionRapeseedJatrophaPalmSoybeansVegetable Oils
Gasification/ Fischer-Tropes
FermentationCornSugar CaneWheat & BarleySugar BeetsSorghum
Conventional Bio-butanolBio-dieselBio-ethanolTechnology
Copyright © 2006 Global Insight, Inc. 8
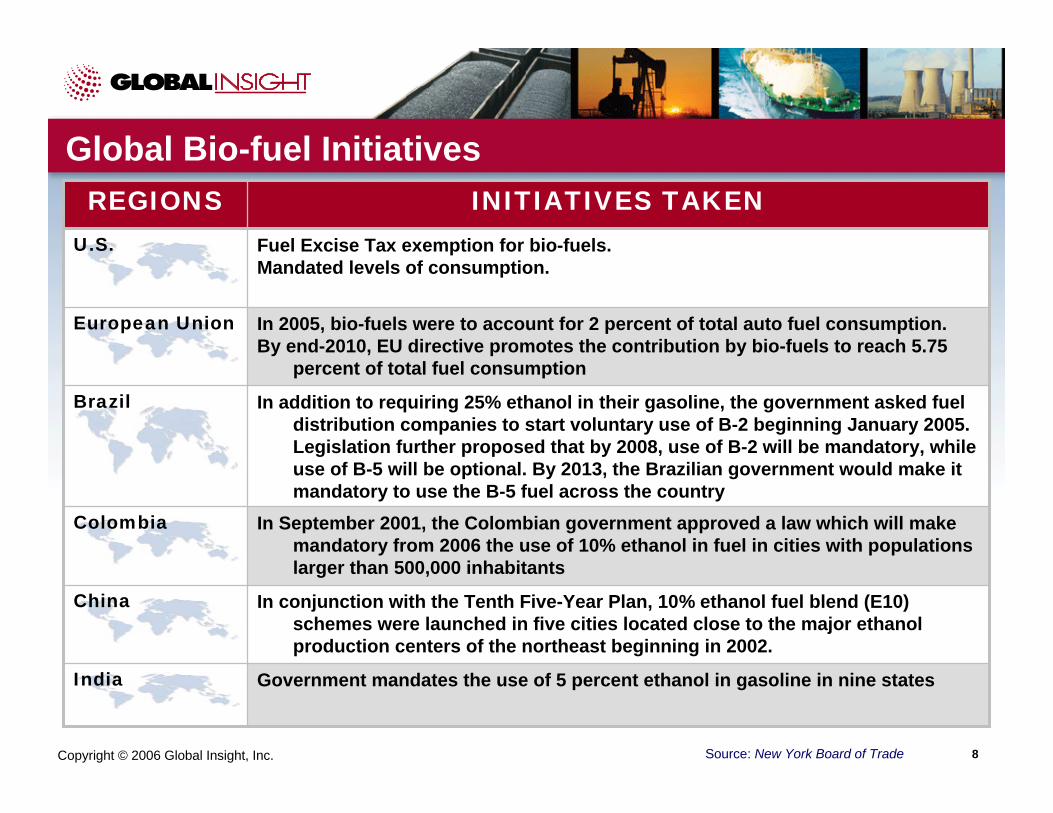
Global Bio-fuel Initiatives
In 2005, bio-fuels were to account for 2 percent of total auto fuel consumption.By end-2010, EU directive promotes the contribution by bio-fuels to reach 5.75
percent of total fuel consumption
European Union
Government mandates the use of 5 percent ethanol in gasoline in nine statesIndia
In conjunction with the Tenth Five-Year Plan, 10% ethanol fuel blend (E10) schemes were launched in five cities located close to the major ethanol production centers of the northeast beginning in 2002.
China
In September 2001, the Colombian government approved a law which will make mandatory from 2006 the use of 10% ethanol in fuel in cities with populations larger than 500,000 inhabitants
Colombia
In addition to requiring 25% ethanol in their gasoline, the government asked fuel distribution companies to start voluntary use of B-2 beginning January 2005. Legislation further proposed that by 2008, use of B-2 will be mandatory, while use of B-5 will be optional. By 2013, the Brazilian government would make it mandatory to use the B-5 fuel across the country
Brazil
Fuel Excise Tax exemption for bio-fuels. Mandated levels of consumption.
U.S.
INITIATIVES TAKENREGIONS
Source: New York Board of Trade
Copyright © 2006 Global Insight, Inc. 9
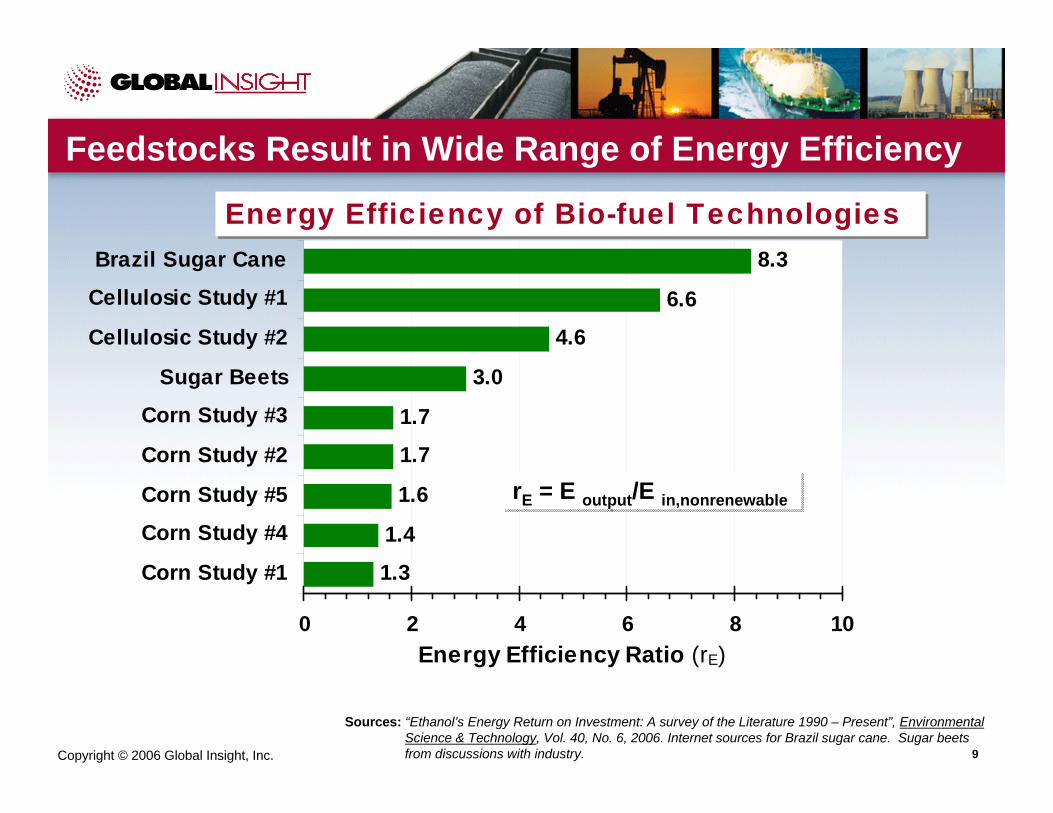
1.3
1.4
1.6
1.7
1.7
3.0
4.6
6.6
8.3
0 2 4 6 8 10
Corn Study #1
Corn Study #4
Corn Study #5
Corn Study #2
Corn Study #3
Sugar Beets
Cellulosic Study #2
Cellulosic Study #1
Brazil Sugar Cane
Energy Efficiency Ratio (rE)
Feedstocks Result in Wide Range of Energy Efficiency
Sources: “Ethanol’s Energy Return on Investment: A survey of the Literature 1990 – Present”, Environmental Science & Technology, Vol. 40, No. 6, 2006. Internet sources for Brazil sugar cane. Sugar beets from discussions with industry.
rE = E output/E in,nonrenewablerE = E output/E in,nonrenewable
Energy Efficiency of Bio-fuel TechnologiesEnergy Efficiency of Bio-fuel Technologies
Copyright © 2006 Global Insight, Inc. 10
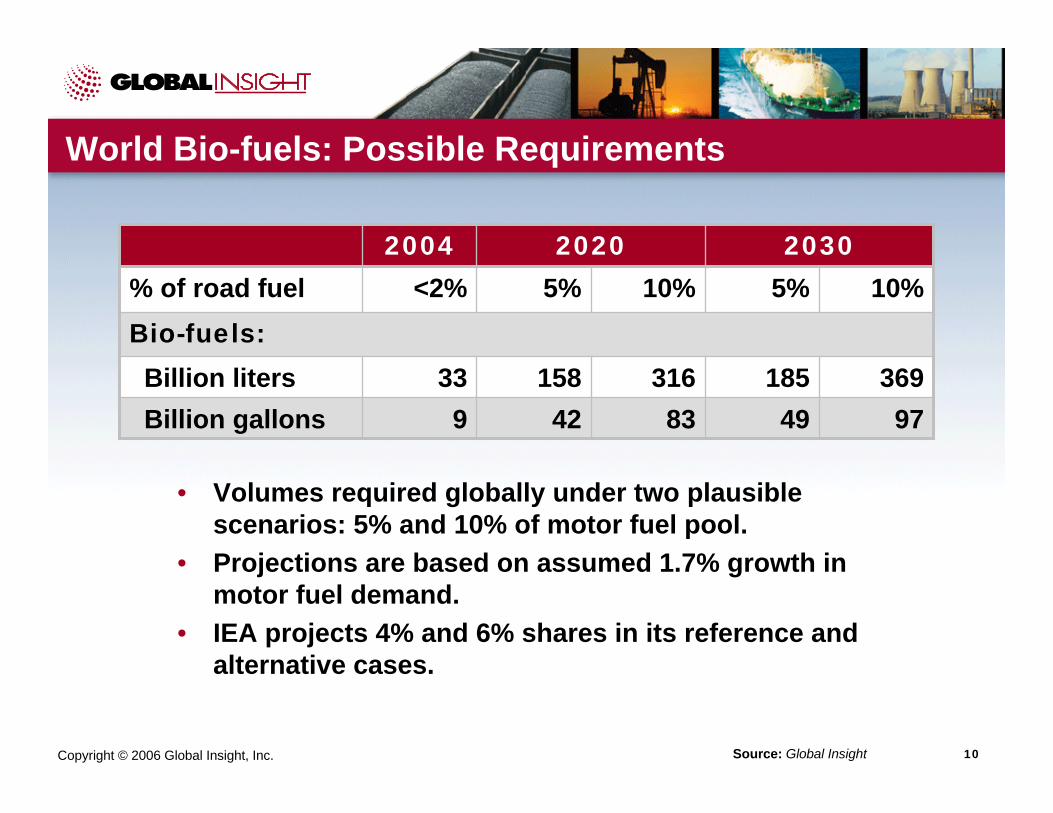
World Bio-fuels: Possible Requirements
• Volumes required globally under two plausible scenarios: 5% and 10% of motor fuel pool.
• Projections are based on assumed 1.7% growth in motor fuel demand.
• IEA projects 4% and 6% shares in its reference and alternative cases.
Source: Global Insight
933
<2%2004
Billion gallonsBillion liters
Bio-fuels:% of road fuel
83316
10%
42158
5%2020
9749369185
10%5%2030
Copyright © 2006 Global Insight, Inc. 11
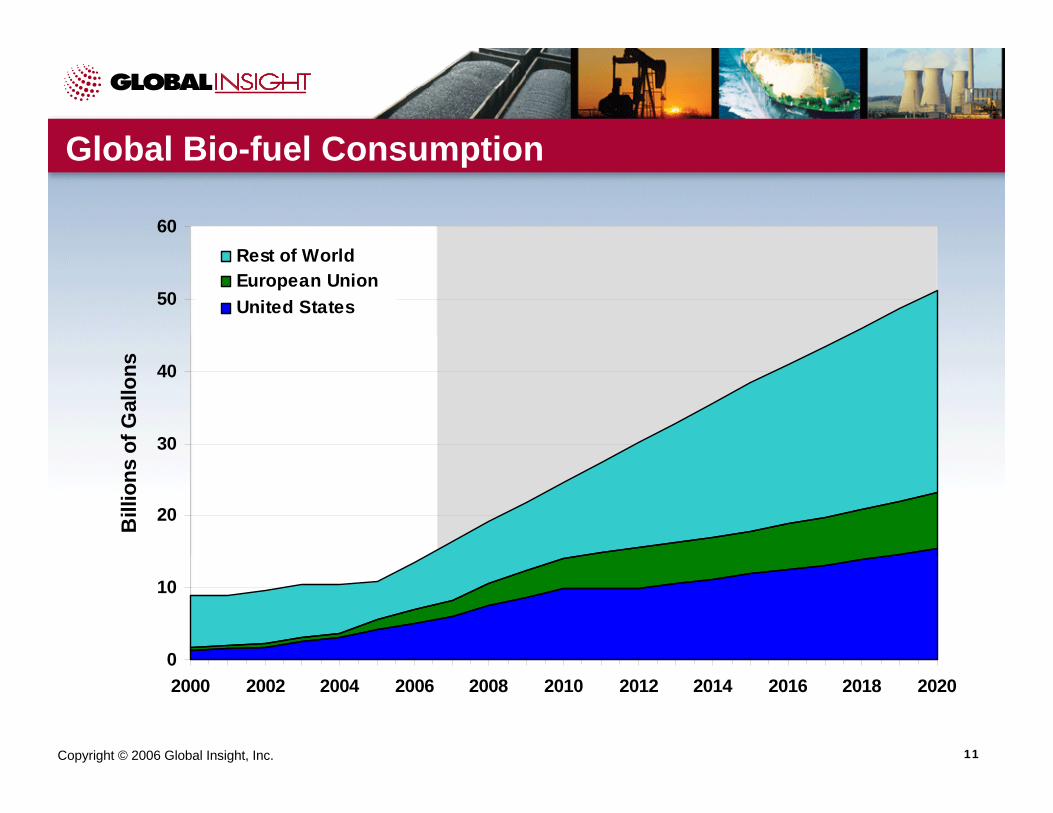
Global Bio-fuel Consumption
0
10
20
30
40
50
60
2000 2002 2004 2006 2008 2010 2012 2014 2016 2018 2020
Bill
ions
of G
allo
ns
Rest of WorldEuropean UnionUnited States
Copyright © 2006 Global Insight, Inc. 12
0.0
2.0
4.0
6.0
8.0
10.0
12.0
14.0
16.0
18.0
1995 1998 2001 2004 2007 2010 2013 2016 2019 2022 2025 2028
Bill
ions
of G
allo
ns
Ethanol
Bio-diesel
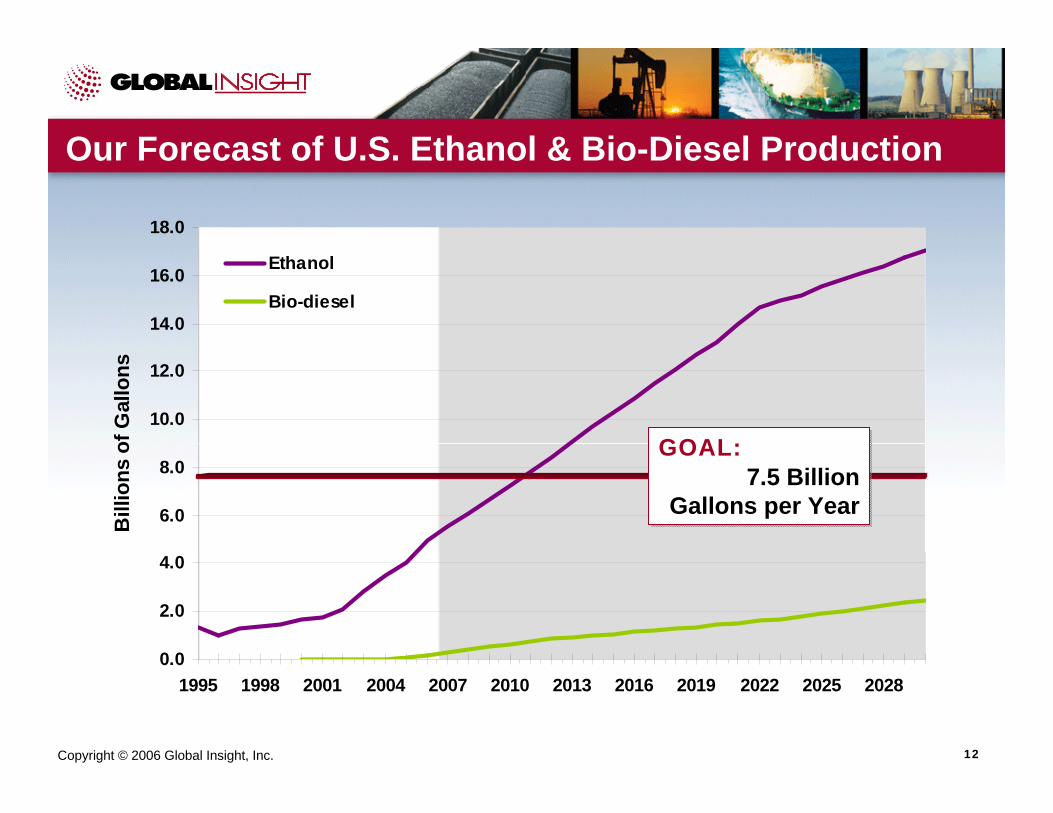
Our Forecast of U.S. Ethanol & Bio-Diesel Production
GOAL:7.5 Billion
Gallons per Year
GOAL:7.5 Billion
Gallons per Year
Copyright © 2006 Global Insight, Inc. 13
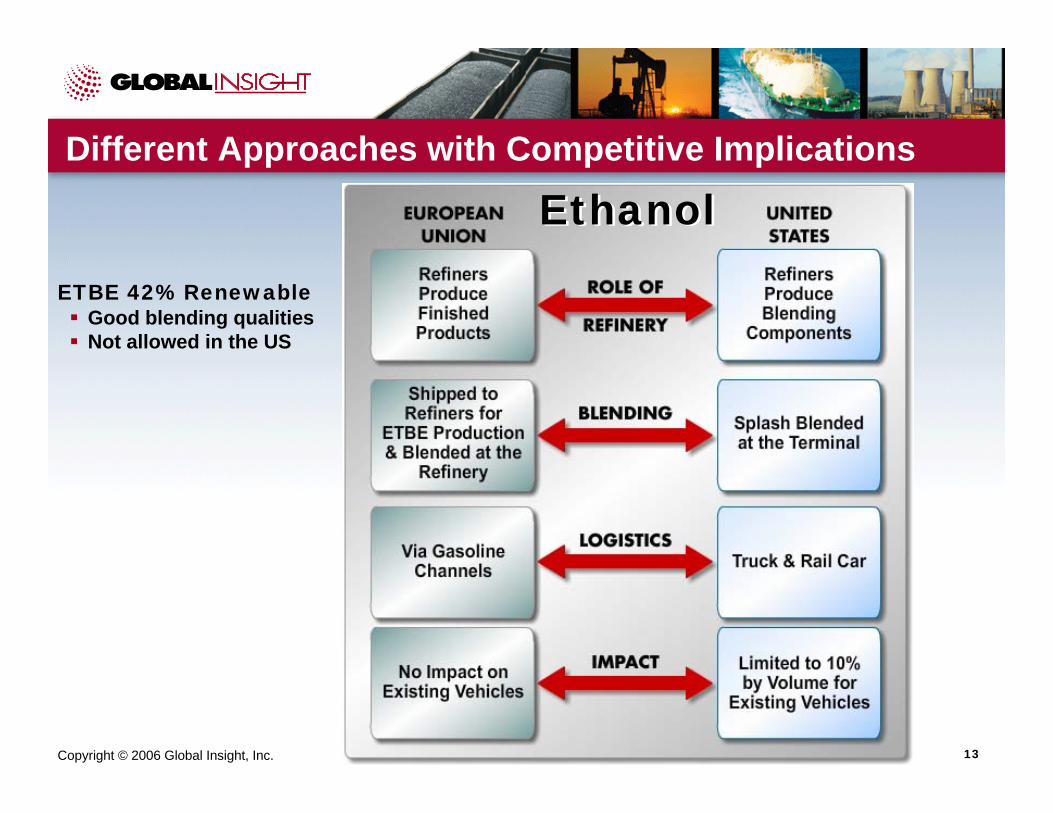
Different Approaches with Competitive Implications
ETBE 42% RenewableGood blending qualitiesNot allowed in the US
EthanolEthanol
Copyright © 2006 Global Insight, Inc. 14
Different Approaches with Competitive Implications
Bio-DieselBio-Diesel
Copyright © 2006 Global Insight, Inc. 15
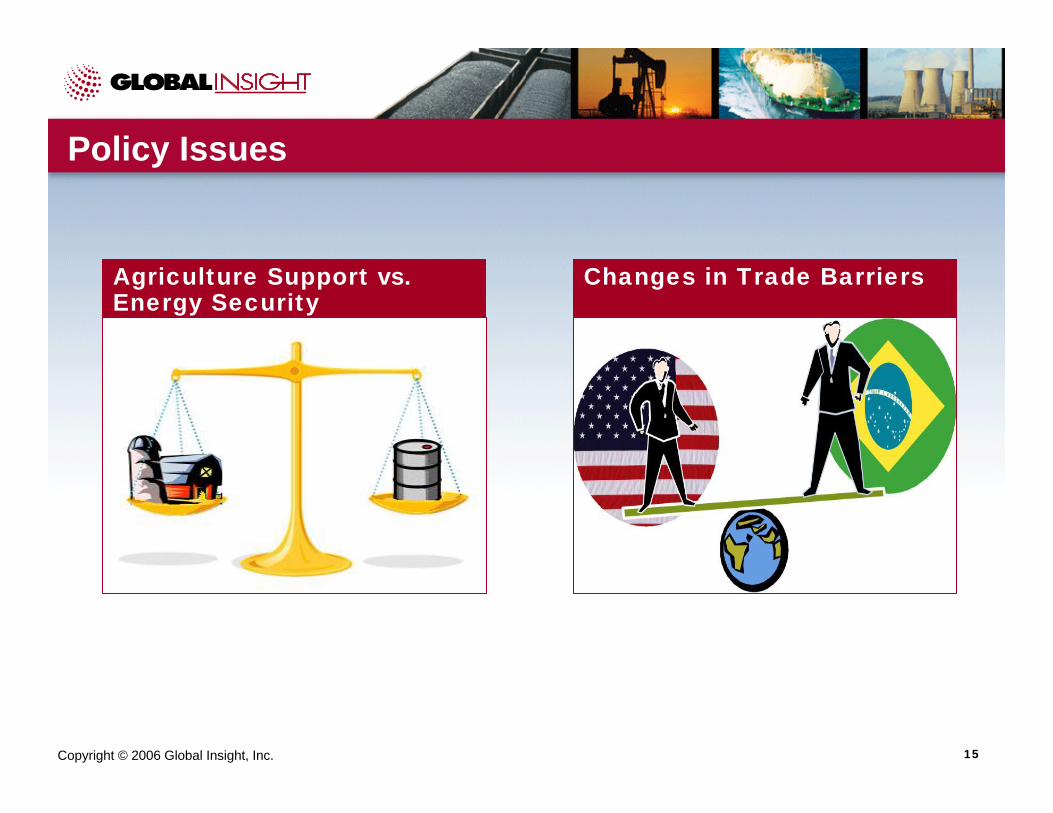
Changes in Trade Barriers
Policy Issues
Agriculture Support vs. Energy Security
Copyright © 2006 Global Insight, Inc. 16
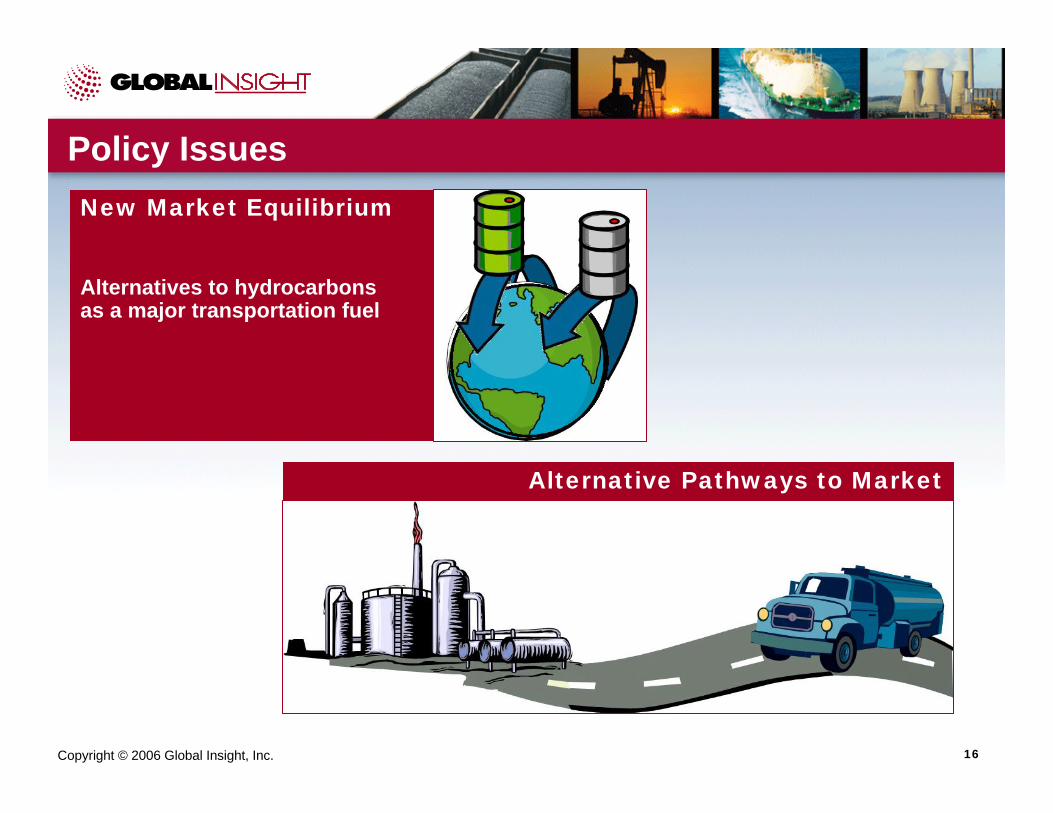
Policy Issues
Alternative Pathways to Market
New Market Equilibrium
Alternatives to hydrocarbons as a major transportation fuel