Embed Size (px)
Citation preview

THE ROLES OF ACTIVIN A AND B IN LIVER INFLAMMATION AND
FIBROSIS
by
Matthew J. Hamang
A Thesis
Submitted to the Faculty of Purdue University
In Partial Fulfillment of the Requirements for the degree of
Master of Science
Department of Biological Sciences
Indianapolis, Indiana
May 2019

2
THE PURDUE UNIVERSITY GRADUATE SCHOOL
STATEMENT OF COMMITTEE APPROVAL
Dr. Guoli Dai, Chair
Department of Biology
Dr. James Marrs
Department of Biology
Dr. Benjamin Yaden
Department of Biology
Approved by:
Dr. James Marrs
Head of the Graduate Program

3
Dedicated to Karen

4
ACKNOWLEDGEMENTS
The author would like to thank those who provided assistance in generating the work presented
here - in alphabetical order Alex Culver, Brandy Snider, Yan Wang, and Daniel Xu. In
particular, I would like to express many thanks to Dr. Dai, Dr. Marrs, and Dr. Yaden for the
opportunity to pursue this degree and for their guidance and mentorship throughout the process.
I would also like to thank Dr. Henry Bryant and Dr. Yanfei Ma for their support and finally Dr.
Masahiko Sato for kindling my passion for science and helping to launch my career many years
ago.

5
TABLE OF CONTENTS
LIST OF TABLES ...........................................................................................................................7
LIST OF FIGURES .........................................................................................................................8
LIST OF ABBREVIATIONS ........................................................................................................10
ABSTRACT ...................................................................................................................................12
CHAPTER 1. LITERATURE REVIEW .......................................................................................14
1.1 Liver injury and fibrosis.................................................................................................14
1.2 Lymphocytes in immune responses ...............................................................................15
1.3 Immune cells in liver injury and fibrosis .......................................................................17
1.4 Activin A and B in liver injury and fibrosis ..................................................................20
CHAPTER 2. MATERIALS AND METHODS ...........................................................................24
2.1 Animal care and use ......................................................................................................24
2.2 Concanavalin A immune-mediated hepatitis .................................................................24
2.3 Carbon tetrachloride-induced liver fibrosis ...................................................................25
2.4 Body composition (quantitative NMR) .........................................................................25
2.5 Biochemical assays ........................................................................................................26
2.6 Histology and immunohistochemistry ...........................................................................26
2.7 Quantitative real-time PCR ............................................................................................27
2.8 Data analysis ..................................................................................................................27
CHAPTER 3. RESULTS ...............................................................................................................28
3.1 Characterization of concanavalin A immune-mediated hepatitis ..................................28
3.2 Neutralization of activin A and B in concanavalin A immune-mediated
hepatitis ..........................................................................................................................38
3.3 Neutralization of activin A and B in CCl4-induced liver fibrosis ..................................50
CHAPTER 4. DISCUSSION .........................................................................................................61
4.1 Characterization of concanavalin A immune-mediated hepatitis ..................................61
4.2 Neutralization of activin A and B in concanavalin A immune-mediated
hepatitis ..........................................................................................................................62
4.3 Neutralization of activin A and B in CCl4-induced liver fibrosis ..................................64

6
4.4 Conclusions ...................................................................................................................66
REFERENCES ..............................................................................................................................67

7
LIST OF TABLES
Table 3-1 Groups in concanavalin A characterization study .........................................................28
Table 3-2 Groups in concanavalin A activin A and B neutralization study ..................................38
Table 3-3 Groups in CCl4 activin A and B neutralization study ....................................................50

8
LIST OF FIGURES
Figure 1-1 Schematic of liver fibrogenesis ..................................................................................15
Figure 1-2 CD4+ and CD8+ T-cell signaling ..............................................................................17
Figure 1-3 Interactions of the innate and adaptive immune systems in liver fibrosis .................20
Figure 1-4 Activin receptor signaling ..........................................................................................22
Figure 3-1 Response of ALT and AST to intravenous concanavalin A administration ..............29
Figure 3-2 Response of bilirubin and bile acids to intravenous concanavalin A
administration ............................................................................................................30
Figure 3-3 Response of glucose and cholesterol to intravenous concanavalin A
administration ............................................................................................................31
Figure 3-4 Systemic activin A and B levels following intravenous concanavalin A
administration ............................................................................................................32
Figure 3-5 Inhibin A and B expression in the liver following intravenous
concanavalin A administration ..................................................................................34
Figure 3-6 Inhibin A and B expression in the spleen following intravenous
concanavalin A administration ..................................................................................35
Figure 3-7 Liver activin A and B levels following intravenous concanavalin
administration ............................................................................................................36
Figure 3-8 Spleen activin A and B levels following intravenous concanavalin A
administration ............................................................................................................37
Figure 3-9 Tissue wet weights following activin antibody treatment and intravenous
concanavalin A administration ..................................................................................39
Figure 3-10 H&E staining in liver following activin antibody treatment and
intravenous concanavalin A administration ...............................................................40
Figure 3-11 Response of ALT and AST following activin antibody treatment and
intravenous concanavalin A administration ...............................................................41
Figure 3-12 Response of bilirubin and bile acids following activin antibody treatment
and intravenous concanavalin A administration ........................................................42
Figure 3-13 Response of glucose and cholesterol following activin antibody treatment
and intravenous concanavalin A administration ........................................................43

9
Figure 3-14 TNFα in serum following activin antibody treatment and intravenous
concanavalin A administration ..................................................................................45
Figure 3-15 IL-2 in serum following activin antibody treatment and intravenous
concanavalin A administration ..................................................................................47
Figure 3-16 IL-4 in serum following activin antibody treatment and intravenous
concanavalin A administration ..................................................................................49
Figure 3-17 Lean mass % change from baseline following activin antibody treatment
in CCl4-induced hepatic fibrosis ................................................................................51
Figure 3-18 Tissue wet weights following activin antibody treatment in CCl4-induced
hepatic fibrosis ...........................................................................................................52
Figure 3-19 ALT and AST following activin antibody treatment in CCl4-induced
hepatic fibrosis ...........................................................................................................53
Figure 3-20 Bilirubin and bile acids following activin antibody treatment in
CCl4-induced hepatic fibrosis ....................................................................................54
Figure 3-21 Glucose and cholesterol following activin antibody treatment in
CCl4-induced hepatic fibrosis ....................................................................................55
Figure 3-22 MTS staining in liver following activin antibody treatment in
CCl4-induced hepatic fibrosis ....................................................................................56
Figure 3-23 F4/80 staining in liver following activin antibody treatment in
CCl4-induced hepatic fibrosis ....................................................................................57
Figure 3-24 Ki67 staining in liver following activin antibody treatment in
CCl4-induced hepatic fibrosis ....................................................................................58
Figure 3-25 MPO staining in liver following activin antibody treatment in
CCl4-induced hepatic fibrosis ....................................................................................59

10
LIST OF ABBREVIATIONS
AICD Activation-induced cell death
ActRIIB-Fc Ectodomain of ActRIIB and Fc-region of immunoglobulin
ALK Anaplastic lymphoma kinase
ALT Alanine aminotransferase
AST Aspartate aminotransferase
APC Antigen presenting cell
BCR B-cell receptor
BQL Below quantifiable limit
CCl4 Carbon tetrachloride
CTGF Connective tissue growth factor
CTL Cytotoxic T-cell
DC Dendritic cell
ECM Extracellular matrix
GS Glycine- and serine-rich sequence
HCC Hepatocellular carcinoma
HSC Hepatic stellate cell
IFN-γ Interferon gamma
KC/GRO Keratinocyte chemoattractant/growth-regulated oncogene
LPS Lipopolysaccharide
MHC Major histocompatibility complex
MMP Matrix metalloproteinase
MTS Masson's trichrome staining

11
NASH Nonalcoholic steatohepatitis
NAFLD Nonalcoholic fatty liver disease
NK Natural killer
NKT Natural killer T
PDGF Platelet-derived growth factor
qNMR Quantitative nuclear magnetic resonance
SARA SMAD anchor for receptor activation
STAT Signal transducer and activator of transcription
TCR T-cell receptor
TGFβ Tissue growth factor beta
TIMP Tissue inhibitor of metalloproteinse
TNF Tumor necrosis factor
TLR Toll-like receptor

12
ABSTRACT
Author: Hamang, Matthew, J. MS
Institution: Purdue University
Degree Received: May 2019
Title: The Roles of Activin A and B in Liver Inflammation and Fibrosis
Committee Chair: Guoli Dai
Liver fibrosis is the result of different types of chronic liver diseases, such as cholestatic liver
disease and nonalcoholic steatohepatitis, among others. Fibrosis, if left unchecked, may progress
to the point of cirrhosis – permanently affecting liver function detrimentally and potentially
leading to development of hepatocellular carcinoma. Inflammatory response following tissue
injury is vital for the initiation of fibrosis; chronic inflammation results in abnormal tissue
healing and promotes a pro-fibrogenic response.
Activins are cytokines that have been identified as members of the TGFβ superfamily of growth
and differentiation factors. Activin A and B, in particular, have been identified as having roles in
the pathophysiology of liver disease, but have not been investigated thoroughly. We treated
mice with concanavalin A, a potent T-cell mitogen with liver specificity when administered
intravenously, and characterized the resulting response to liver injury and how activin A and B
are modulated during this acute inflammatory phase. We showed that activin B is highly
increased in circulation following inflammation, as well as locally in the liver as well as the
spleen. We then neutralized activin A and B via neutralizing antibodies in our concanavalin A-
induced liver injury model to determine if inhibition of these ligands may confer protective
effects during the acute inflammatory response in liver. Neutralization of either activin A or
activin B protected hepatocytes, improved liver function, and significantly reduced circulating
cytokines following concanavalin A administration. Finally, we determined whether inhibition

13
of activin A or B might prevent or reverse the development of liver fibrosis after disease has
been established. We induced liver fibrosis in mice via the hepatotoxin carbon tetrachloride, and
then treated with neutralizing antibodies while still maintaining carbon tetrachloride
administration. Neutralization of activin A and B markedly reduced liver fibrosis, protected
hepatocytes, and improved liver function. Our findings implicate both activin A and B as major
players in the acute inflammatory response to liver injury, as well as during chronic injury and
fibrogenesis, and demonstrate the therapeutic potential of targeting these ligands for the
treatment of fibrosis in chronic liver diseases.

14
CHAPTER 1. LITERATURE REVIEW
1.1 Liver injury and fibrosis
Liver fibrosis is the product of chronic liver damage, in addition to excess accumulation of
extracellular matrix (ECM) proteins in the liver, and is characteristic of most types of chronic
liver diseases, such as cholestatic liver disease and nonalcoholic steatohepatitis (NASH) 1,2. In
acute liver failure, generally a robust and self-limiting fibrotic and regenerative response occurs
3. This fibrotic response becomes an issue, however, when dysregulated and excessive scarring
occurs in response to persistent injury and alters tissue function 4. Eventually, if left unchecked,
liver fibrosis will progress to the point of liver cirrhosis where damage to the liver is generally
regarded as irreversible, and may eventually result in hepatocellular carcinoma (HCC).
Insult or damage to epithelial cells in the liver (either hepatocytes or cholangiocytes) results in
the release of inflammatory mediators, leading to the stimulation and activation of hepatic
stellate cells (HSCs) which transdifferentiate to become myofibroblast-like cells, characterized
by an excessive release of ECM proteins and release of pro-inflammatory and pro-fibrogenic
factors including TGFβ 4. Following damage leukocytes are recruited to the site of injury to
phagocytize apoptotic or dead cells and amplify inflammatory response by secreting pro-
inflammatory cytokines (including TGFβ), as well as by recruiting additional T-cells 4. Pro-
inflammatory mediators, growth factors, and cytokines (including PDGF, CTGF, TGFβ, and IL-
13) from cellular damage and stimulated immune cells activate mesenchymal precursor cells to
transdifferentiate to myofibroblasts as well 4,5. However, mechanisms driving the initiation and
progression of liver fibrosis remain elusive.

15
Figure 1-1: Schematic of liver fibrogenesis. Ismail, Reversal of hepatic fibrosis:
pathophysiological basis of antifibrotic therapies November 2013.
1.2 Lymphocytes in Immune Responses
Lymphocytes are white blood cells that vary in function and include T, B, and natural killer (NK)
cells; T and B cells are the effectors of adaptive immunity, and NK cells lack recombined
antigen receptors and are innate immune lymphocytes 6. Lymphocytes are essential in the
immune response to foreign antigen and through continual recirculation between specific sites
facilitate both continual immune surveillance, and recognition and response to antigen when it
enters the body 7. During development, lymphocyte lineage and specificity are determined
through generation of either T-cell receptor (TCR) for T-cells or B-cell receptor (BCR) for B-
cells. NK cells are unique in the fact that they do not express either TCR or BCR, and do not
require antibody or major histocompatibility complex (MHC) in order to activate. MHC is a
molecule expressed on the surface of all nucleated cells (and platelets) of jawed vertebrates, and
is required for priming of naïve T-cells. When T cells encounter MHC bound with antigen on
antigen presenting cells (APCs) such as dendritic cells (DC) or macrophages, TCR signals result

16
in changes in adhesion molecules to promote continued binding of the two cells which allows for
costimulatory signaling though CD28 (on the T-cell) and B7-1/2 (also known as CD80/86) (on
the APC) in CD8+ cells. In CD4+ cells, the costimulatory signaling is through CD40L (on the
T-cell) and CD40 (on the APC). Priming of naïve CD8+ T-cells (which bind MHCI expressed
on all nucleated cells and platelets) results in cytotoxic T-cells (CTL), which can directly kill
pathogen-infected cells through the release of perforin, granzymes, and granulysin - which lead
to a cascade of events that trigger apoptosis in the target cell. Primed CD4+ cells (which bind
MHCII expressed on professional APCs such as B-cells, dendritic cells, and mononuclear
phagocytes) develop into a diverse array of effector cell types that express specific master
transcription factors depending on cytokines generated from innate cells during the priming
process as well as the strength of the antigenic stimulation 8.
17
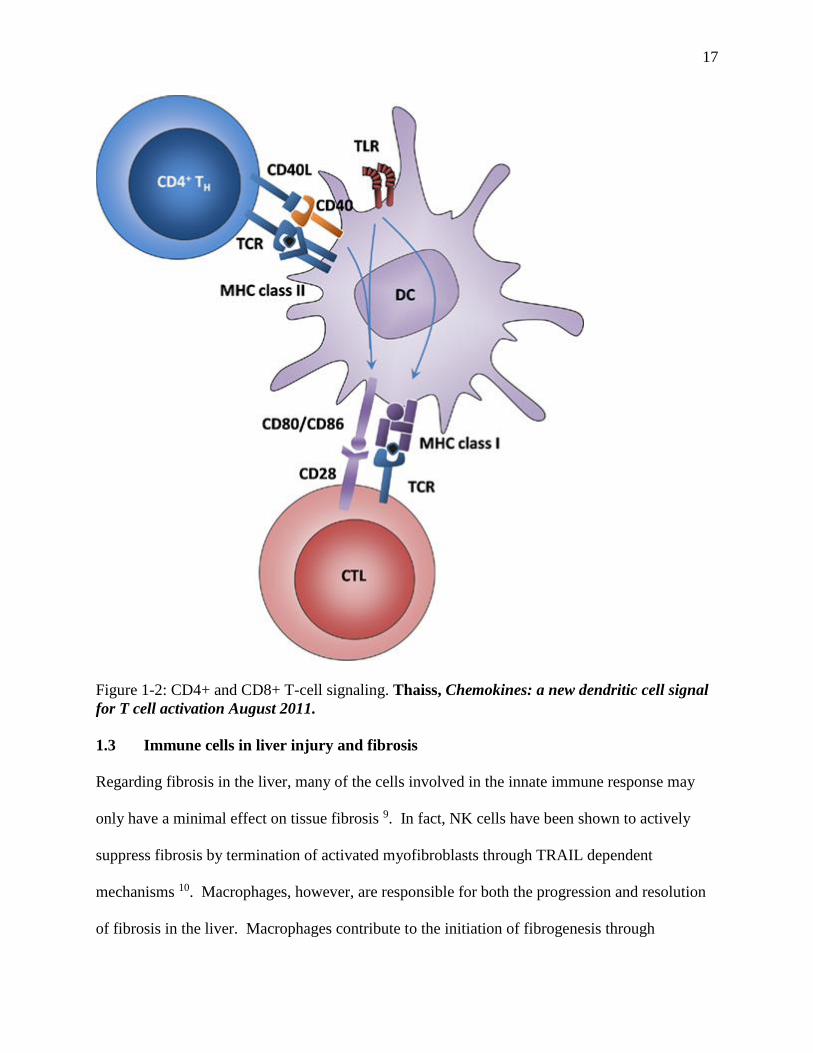
Figure 1-2: CD4+ and CD8+ T-cell signaling. Thaiss, Chemokines: a new dendritic cell signal
for T cell activation August 2011.
1.3 Immune cells in liver injury and fibrosis
Regarding fibrosis in the liver, many of the cells involved in the innate immune response may
only have a minimal effect on tissue fibrosis 9. In fact, NK cells have been shown to actively
suppress fibrosis by termination of activated myofibroblasts through TRAIL dependent
mechanisms 10. Macrophages, however, are responsible for both the progression and resolution
of fibrosis in the liver. Macrophages contribute to the initiation of fibrogenesis through

18
production of TGFβ1 and insulin-like growth factor, which promotes fibroblast expression to
start matrix remodeling 11. Additionally, macrophages have been shown to produce IL-6 and
TGFβ, which leads to maintenance of proliferation and differentiation in fibroblasts 12.
Macrophages follow two distinct patterns of activation and polarization following stimulation.
Following stimulation with Toll-like receptor (TLR) ligands, IFN-γ (produced by Th1 cells and
NK cells) and TNF (produced by APC cells) macrophages undergo classical activation
(becoming M1 macrophages) 13. These macrophages are characterized by secretion of multiple
pro-inflammatory cytokines (IFN-γ, IL-1, IL-6, IL-12, IL-23 and TNFα) and are associated with
Th1 lymphocyte response and cell-mediated immunity 9. Macrophages may also undergo
alternative activation, becoming M2 macrophages. This activation profile is a Th2 polarized
response characterized by STAT-6 signaling, secretion of IL-4 and IL-13, and upregulation of
endocytic lectin receptors 9. M2 macrophages are generally associated with resolution of
inflammation (through production of immunosuppressive IL-10) or wound healing (through
production of IL-4 and upregulation of arginase, the enzyme associated with production of
polyamides and collagen) 14.
The human liver contains a significant number of resident lymphocytes (~1010 cells), which are
comprised of both adaptive lymphocytes (B cells, CD4+ cells, and CD8+ cells) as well as innate
lymphocytes (NK and NKT cells) 15. Depletion of either T-cells or B-cells have been shown to
have protective effects from fibrosis in the liver 16,17. Additionally, RAG2-/- mice deficient in
both T and B-cells show resistance to fibrosis in acute and chronic models of liver injury 17. The
interaction of T helper cells during acute and chronic inflammation drives the polarity of the
response, and different expression profiles result from the cytokines produced by either Th1 or
Th2 cells. Generally, cytokines produced by Th1 cells (such as IFN-γ, IL-2, and TNFC) are

19
associated with an intense cellular response through cell-mediated immunity and phagocyte-
dependent inflammation 18. Th2 cytokines, on the other hand, increase the expression of several
pro-fibrogenesis genes including pro-collagen I and III, MMP2, MMP9 and TIMPs 12. Blocking
receptor for IL-13 signaling, a pro-fibrosis cytokine produced by Th2 cells 19, has been shown to
reduce liver fibrosis 20. Additionally, using targeted mutations to disrupt IL-4 and its receptor, as
well as STAT6 also attenuate liver fibrosis in mice 21. Regarding cytotoxic T-cells - transfer of
CD8+ cells, but not CD4+ cells, from mice with liver fibrosis induced by CCl4 treatment into
immune compromised SCID mice results in significant liver injury 16. In the context of fibrosis
in the liver, CD4+ cells are responsible for local production of cytokines that promote
fibrogenesis by affecting macrophages and fibroblasts, while CD8+ cells promote local tissue
injury by releasing pro-inflammatory cytokines that may indirectly lead to fibrosis 9.

20
Figure 1-3: Interactions of the innate and adaptive immune systems in liver fibrosis. Holt,
Immune interactions in hepatic fibrosis. or “Leucocyte-stromal interactions in hepatic
fibrosis” November 2018.
1.4 Activin A and B in liver injury and fibrosis
Activins are a group of cytokines classified under the TGFβ superfamily of growth and
differentiation factors 22, like TGFβ, are formed via the covalent dimerization of two subunits 23.
In humans and other mammals, four subunits of activin have been identified: beta A, beta B, beta
C and beta E. Of all of these subunits – A, B, and C have been found in humans, and A, B, C,
and E in mouse. Activin A is the homodimer of two beta A subunits, and activin B is the
homodimer of two beta B subunits. Activin has both a type I and type II receptor which both
contain a short extracellular domain that binds ligand, and a larger intracellular serine/threonine
kinase domain 24. The type II receptor (ActR-II or ActR-IIB) is constitutively active, and will
dimerize and bind activin A and B first 24. Afterwards, the bound type II receptors will recruit a
21
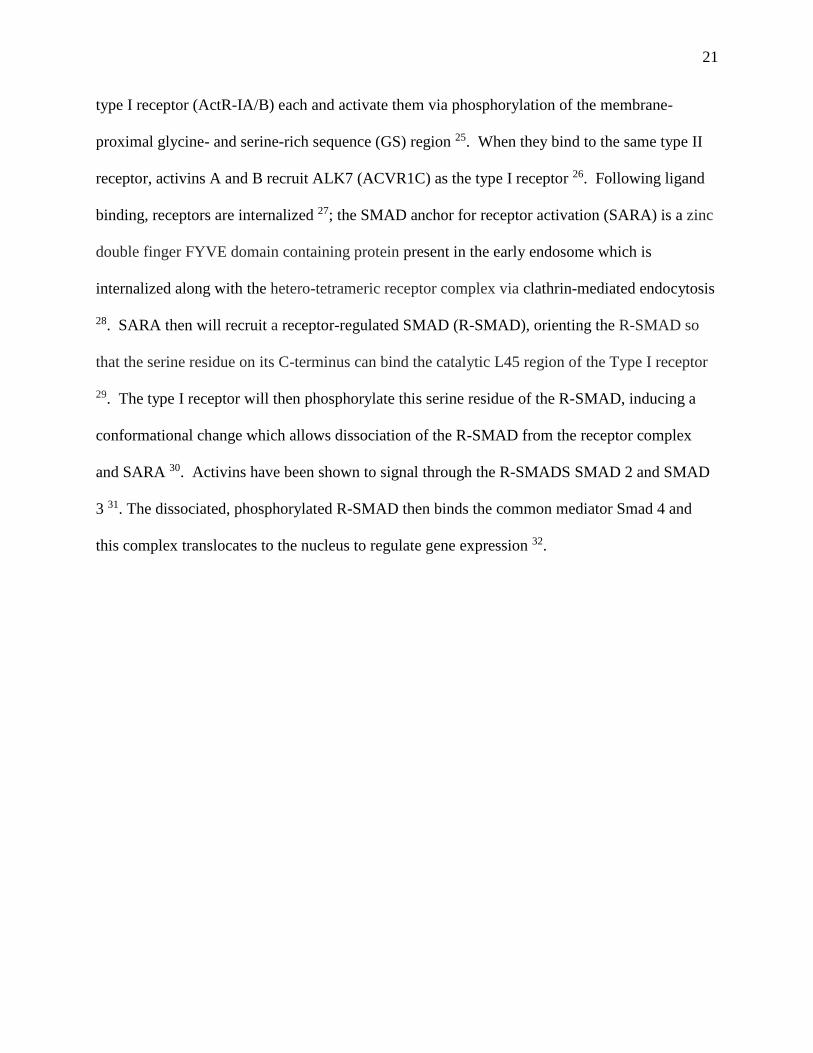
type I receptor (ActR-IA/B) each and activate them via phosphorylation of the membrane-
proximal glycine- and serine-rich sequence (GS) region 25. When they bind to the same type II
receptor, activins A and B recruit ALK7 (ACVR1C) as the type I receptor 26. Following ligand
binding, receptors are internalized 27; the SMAD anchor for receptor activation (SARA) is a zinc
double finger FYVE domain containing protein present in the early endosome which is
internalized along with the hetero-tetrameric receptor complex via clathrin-mediated endocytosis
28. SARA then will recruit a receptor-regulated SMAD (R-SMAD), orienting the R-SMAD so
that the serine residue on its C-terminus can bind the catalytic L45 region of the Type I receptor
29. The type I receptor will then phosphorylate this serine residue of the R-SMAD, inducing a
conformational change which allows dissociation of the R-SMAD from the receptor complex
and SARA 30. Activins have been shown to signal through the R-SMADS SMAD 2 and SMAD
3 31. The dissociated, phosphorylated R-SMAD then binds the common mediator Smad 4 and
this complex translocates to the nucleus to regulate gene expression 32.

22
Figure 1-4: Activin receptor signaling. Werner, Roles of activin in tissue repair, fibrosis, and
inflammatory disease February 2006.
Activin A has a wide tissue distribution and is produced by numerous cells including
macrophages, Th2 cells, and hepatocytes 32–34. Activin A is an important mediator of liver
pathophysiology, through proliferation of hepatocytes, activation of HSCs, secretion of liver
extracellular matrix, and the formation and development of liver injury 35. Activin A expression
is significantly elevated in CCl4-induced chronic liver injury in mice, marking it as a potential
regulator of liver fibrosis development 36. Additionally, activin A protein in serum as well as
liver is significantly increased in a mouse model of immune hepatitis and fibrosis, and
knockdown of activin A type 2 receptor in this model resulted in significant reductions in ALT
and AST (liver enzyme markers of damage), hydroxyproline in liver, and hepatic fibrosis as
23
measured by Masson trichrome staining 37. In humans, activin A levels in serum have been
shown to be significantly elevated in individuals with non-alcoholic fatty liver disease (NAFLD).
In patients with non-alcoholic steatohepatitis (NASH) high levels of activin A are significantly
correlated with the degree of hepatic fibrosis 38. Taken together, these lines of evidence
implicate a functional role for activin A in liver homeostasis and disease, which, however, has
not been intensively studied.
The function of activin B in the liver is poorly understood 39. Expression of beta B subunit of
activin is low in rodent liver 40, but is detectable by immunohistochemistry at low levels in
hepatocytes of normal rat livers and in connective tissue septa in fibrotic livers 41. In humans,
however, beta A and beta B transcripts are expressed at similar levels in liver 42. Expression of
activin beta B mRNA has been shown to be highly upregulated in stellate cells of rat livers
following CCL4 administration 43 and following exposure to peroxisome proliferator di-n-butyl
phthalate 44. Additionally, in a model of lipopolysaccharide (LPS)-induced liver inflammation in
mice βB subunit expression levels are significantly increased, but not inhibin α or βA subunit 45.
These data taken together suggest a role for activin B in the pathology of liver inflammation and
fibrosis.

24
CHAPTER 2. MATERIALS AND METHODS
2.1 Animal care and use
All mouse studies were performed with the approval of Eli Lilly and Company’s Institutional
Animal Care and Use Committee in accordance with the National Institute of Health Guide for
the Care and Use of Laboratory Animals. For concanavalin A immune-mediated hepatitis
studies, male Balb/c mice were used (Envigo, Indianapolis, IN) at 12 weeks of age. For carbon
tetrachloride (CCl4) induced liver fibrosis, female C57BL/6 mice were used (Envigo,
Indianapolis, IN) at 12 weeks of age. Animals were allowed to acclimate for a minimum of 72
hours in a climate controlled room (22±2°C) on a 12-hour light-dark cycle (with lights on at
6:00AM) with ad lib access to water and normal chow (TD2014, Teklad, Madison, WI). Prior to
study start, animals were randomized according to body weight.
2.2 Concanavalin A immune-mediated hepatitis
Acute immune-mediated hepatitis was induced by a single intravenous (IV) administration of
concanavalin A (MP Biomedical, Solon, OH) dissolved in phosphate-buffered saline (200 μL per
animal). For the initial dose-response characterization study, concanavalin A was administered
at 10 mg/kg, 15 mg/kg, 20 mg/kg, or 25 mg/kg. For the second study, mouse IgG1 isotype
control (50 mg/kg), activin A (10 mg/kg) or activin B (50 mg/kg) neutralizing antibodies (Eli
Lilly, Indianapolis, IN) in phosphate-buffered saline were administered subcutaneously (SC) at
16 hours prior to concanavalin A injection, which was administered at 15 mg/kg. 12 hours
following concanavalin A administration, mice were sacrificed by CO2 asphyxiation and blood
collected via cardiac puncture and serum separated using MiniCollect Z serum separating tubes
(Greiner Bio-one, Kremünster, Australia) . Following blood collection, a secondary method of
25
euthanasia was performed (cervical dislocation) and liver, gastrocnemius, and spleen were
excised and either snap-frozen in liquid nitrogen or fixed in 10% neutral-buffered formalin for
histological analysis. Serum and frozen tissues were stored at -80 °C until analyzed.
2.3 CCl4-induced liver fibrosis
Hepatic fibrosis was induced via intraperitoneal (IP) injections of CCl4 (1 mL/kg) diluted 1:10 in
corn oil twice weekly for 6 weeks. Control animals were given only corn oil following the same
dosing regimen as CCl4-treated mice. After 6 weeks of CCl4 administration, mouse IgG1 isotype
control (60 mg/kg), activin A antibody (10 mg/kg), activin B antibody (50 mg/kg), the
combination of both neutralizing antibodies, or soluble activin receptor type IIB (Eli Lilly,
Indianapolis, IN) were administered once weekly for 4 weeks. During this 4 week period, CCl4
was still administered twice weekly at 1 ml/kg. Following 4 weeks of treatment, mice were
sacrificed by CO2 asphyxiation and blood collected via cardiac puncture and processed for
serum. Following blood collection, a secondary method of euthanasia was performed (cervical
dislocation) and liver, gastrocnemius, and spleen were excised and fixed in 10% neutral-buffered
formalin for histological analysis. Serum was stored at -80 °C until analyzed.
2.4 Body composition (quantitative NMR)
In animals treated with CCl4, quantitative nuclear magnetic resonance (qNMR) imaging was
performed at the beginning of the study before CCl4 administration and after 6 weeks of CCl4
administration. During the antibody treatment phase, qNMR was performed weekly and prior to
study termination. Lean body mass, fat mass, and free water content were measured (qNMR;
Echo Medical systems, Houston, TX).

26
2.5 Biochemical assays
Serum samples were analyzed for aspartate aminotransferase (AST), alanine aminotransferase
(ALT), glucose, bile acids, total cholesterol, and total bilirubin levels with a Hitachi Modular
Analyzer (Roche Diagnostics, Indianapolis, IN). For concanavalin A studies, serum activin A
and activin B protein contents were measured via ELISA according to the manufacturer’s
protocols (activin A ELISA kit, Sigma, St. Louis, MO; activin B ELISA kit, Ansh labs, Webster,
TX). Additionally, for the concanavalin A dose response study, activin A and activin B protein
levels were measured in liver and spleen. Tissue lysates were processed using approximately
100 mg of tissue with 1mL of lysis buffer (Cell Signaling Technologies, Dancers, MA), with
protease inhibitor added (protease inhibitor tablets EDTA-free; Pierce Biotechnology, Rockford,
IL). Total protein concentrations were measured via Bradford assay (Coomassie plus protein
assay; Pierce Biotechnology, Rockford, IL) and protein content between tissue samples
normalized before performing ELISAs. For the concanavalin A antibody study, serum samples
were measured for cytokine levels using V-PLEX Plus Proinflammatory Panel 1 kit (Meso Scale
Discovery, Rockville, MD) according to the manufacturer’s protocol.
2.6 Histology and immunohistochemistry
For the CCl4 study, fixed liver samples were processed, paraffin-embedded, and subjected to a
standard procedure of immunohistochemistry. Primary antibodies against F4/80 (eBioscience,
San Diego, CA), MPO (R&D System, Minneapolis, MN), and Ki67 (Abcam, Cambridge, MA)
were used. The liver sections were subjected to Masson's trichrome staining (Abcam,
Cambridge, MA) as well. Images were acquired using digital slide scanning (ScanScope XT,
Aperio, Vista, CA) and quantification of stained areas performed using ImageJ (National
Institutes of Health, NIH, USA).

27
2.7 Quantitative real-time PCR
mRNA in liver and spleen from the concanavalin A dose response study was isolated by adding
1ml of TRIzol reagent (Ambion, Carlsbad, CA) to tissue samples in lysing matrix D FastPrep
tubes (MP Biomedicals, Solon, OH); samples were then homogenized (Fast-Prep96, MP
Biomedicals, Solon, OH). The manufacturer’s protocol for RNA isolation with TRIzol was
followed until phase separation, then aqueous phase was removed and RNA isolated and purified
using PureLink Pro 96 purification kit (Invitrogen, Carlsbad, CA). RNA concentration and
purity was assessed by measuring sample absorbance at 260/280 nm via Nanodrop
(ThermoFisher Scientific, Wilmington, DE). 2 μg of RNA was reverse-transcribed to cDNA
using a high capacity cDNA reverse-transcription kit (Applied Biosystems, Forster City, CA) in
a 20ul reaction. cDNA was combined with TaqMan Universal Fast Master Mix (Applied
Biosystems, Forster City, CA) and TaqMan primer probes (Applied Biosystems, Forster City,
CA), and qPCR analysis performed via QuantStudio 7 Flex system (Applied Biosystems,
Carlsbad, CA). Threshold values were generated for Inhibin A (Inhba, Mm00434339_m1) and
Inhibin B (Inhbb, Mm03023992_m1) in both liver and spleen, and data reported as 2–∆∆Ct relative
to control. For liver, the housekeeping gene used was Hprt1 (Hprt, Mm00446968_m1). For
spleen, the housekeeping gene used was β-actin (Actb, Mm02619580_g1).
2.8 Data analysis
All data expressed as mean ±SEM. Statistical analysis was performed using GraphPad Prism
version 7. Statistical significance (p-value ≤0.05) was analyzed by one-way ANOVA.

28
CHAPTER 3. RESULTS
3.1 Characterization of concanavalin A immune-mediated hepatitis
We evaluated an in vivo model of acute hepatitis induced by intravenous concanavalin A
administration in mice to explore the relationship between immune system activation during
acute inflammation and how activin A and B may be involved. Animals were separated into five
groups (n=6) and administered varying doses of concanavalin A (Table 3-1):
Table 3-1 Groups in concanavalin A characterization study
Group Number Stimulation
1 PBS (200 μL, IV)
2 ConA (10 mg/kg, IV)
3 ConA (15 mg/kg, IV)
4 ConA (20 mg/kg, IV)
5 ConA (25 mg/kg, IV)
Concanavalin A is a plant lectin extracted from the jack-bean (Canavalia ensiformis) and when
delivered intravenously is a liver-specific T-cell selective mitogen, crosslinking surface
glycoprotein located on liver sinusoidal endothelial cells to T-cell receptors on T-cells and
Kupffer cells, activating them 46. In this way the concanavalin A model differentiates itself from
other models as insult to liver is highly specific and mediated solely through lymphocyte
activation and immune-mediated damage, versus through primary damage to hepatic
parenchymal tissue followed by secondary immune-mediated damage (CCL4 model), or through
less tissue-specific innate and adaptive immune responses (LPS mediated) 46. We anticipated
that following concanavalin A immune-mediated damage to hepatocytes would be reflected
through increases in serum clinical markers for liver damage (aspartate aminotransferase (AST),

29
alanine aminotransferase (ALT), total bilirubin, etc.). As response to concanavalin A and
cytokine profile will vary based on time from administration, we focused on evaluating the time
at which maximum damage to liver is achieved based on increases to clinical markers, which is
roughly 12 hours after treatment 43.
Ve
hi c
l e (
PB
S,
20
0u
l I V
)
Co
nA
10
mg
/ kg
Co
nA
15
mg
/ kg
Co
nA
20
mg
/ kg
Co
nA
25
mg
/ kg
0
2 0 0 0
4 0 0 0
6 0 0 0
8 0 0 0
1 0 0 0 0
AS
T (
IU/L
)
**
Ve
hi c
l e (
PB
S,
20
0u
l I V
)
Co
nA
10
mg
/ kg
Co
nA
15
mg
/ kg
Co
nA
20
mg
/ kg
Co
nA
25
mg
/ kg
0
2 0 0 0
4 0 0 0
6 0 0 0
8 0 0 0
1 0 0 0 0
AL
T (
IU/L
)
**
A B
Figure 3-1 Response of ALT and AST to intravenous concanavalin A administration. Lean
male Balb/c mice were administered a single dose of concanavalin A intravenously. Serum levels of
ALT (A) and AST (B) were measured from serum collected 12 hours post-dose. Data are expressed
as mean ± S.E.M. (n=6 mice/group). Significance is indicated **P ≤ 0.01, treated group versus
vehicle control group (Dunnett’s one-way ANOVA).
Concanavalin A treatment showed increases in serum ALT and AST starting at 15 mg/kg,
reaching highly significant differences compared to vehicle control at 25 mg/kg. Increasing
dosage threshold from 20 mg/kg to 25 mg/kg resulted in a substantial increase in both ALT and
AST in serum. We also measured total bilirubin and bile acids in serum, which followed the
same trend that with increasing dosage of concanavalin A, clinical parameters increased.

30
Ve
hi c
l e (
PB
S,
20
0u
l I V
)
Co
nA
10
mg
/ kg
Co
nA
15
mg
/ kg
Co
nA
20
mg
/ kg
Co
nA
25
mg
/ kg
0 . 0
0 . 2
0 . 4
0 . 6
0 . 8
To
ta
l B
ilir
ub
in
(m
g/d
L)
Ve
hi c
l e (
PB
S,
20
0u
l I V
)
Co
nA
10
mg
/ kg
Co
nA
15
mg
/ kg
Co
nA
20
mg
/ kg
Co
nA
25
mg
/ kg
0
2 0
4 0
6 0
8 0
To
ta
l B
ile
Ac
ids
(m
g/d
L)
A B
Figure 3-2 Response of bilirubin and bile acids to intravenous concanavalin A
administration. Lean male Balb/c mice were administered a single dose of concanavalin A
intravenously. Serum levels of bilirubin (A) and bile acids (B) were measured from serum collected
12 hours post-dose. Data are expressed as mean ± S.E.M. (n=6 mice/group).
Additionally, we also evaluated serum glucose and total cholesterol levels following concanavalin A
treatment as liver gluconeogenesis and cholesterol homeostasis and metabolism are negatively
impacted following liver injury. We found that with increasing dosage of concanavalin A, blood
glucose levels were significantly decreased starting at 15mg/kg and steadily decreased throughout
increasing dosage. There were no significant effects on circulating cholesterol in serum.

31
Ve
hi c
l e (
PB
S,
20
0u
l I V
)
Co
nA
10
mg
/ kg
Co
nA
15
mg
/ kg
Co
nA
20
mg
/ kg
Co
nA
25
mg
/ kg
0
5 0
1 0 0
1 5 0
2 0 0
2 5 0
Glu
co
se
(m
g/d
L)
* * * *
Ve
hi c
l e (
PB
S,
20
0u
l I V
)
Co
nA
10
mg
/ kg
Co
nA
15
mg
/ kg
Co
nA
20
mg
/ kg
Co
nA
25
mg
/ kg
0
5 0
1 0 0
1 5 0
2 0 0
2 5 0
To
ta
l C
ho
les
te
ro
l (m
g/d
l)
A B
Figure 3-3 Response of glucose and cholesterol to intravenous concanavalin A
administration. Lean male Balb/c mice were administered a single dose of concanavalin A
intravenously. Serum levels of glucose (A) and cholesterol (B) were measured from serum collected
12 hours post-dose. Data are expressed as mean ± S.E.M. (n=6 mice/group). Significance is
indicated *P ≤ 0.05, **P ≤ 0.01, treated group versus vehicle control group (Dunnett’s one-way
ANOVA).
We demonstrated that in our hands, concanavalin A administered intravenously acts as a potent
immune cell mitogen in the liver, and damages hepatocytes dose-dependently through
lymphocyte and macrophage-mediated mechanisms as measured by relevant clinical markers of
liver function. However, how systemic and tissue-specific activin A and B levels are affected
following concanavalin A administration has not been well characterized. To date, only activin
A has been shown to be slightly increased following chronic (6 week) weekly IV administration
of low dosage of concanavalin A (8 mg/kg) 37, which according to our data would be considered
a sub-optimal dose to elicit relevant increases in clinical parameters of liver injury. Additionally,
it has been demonstrated that concanavalin A is not suitable for development of chronic liver
injury or disease, as mice become immunologically tolerant against concanavalin A-induced

32
liver inflammation after successful initial resolution (within roughly 8 days) 47. Therefore, we
measured circulating levels of both activin A and B following acute concanavalin A
administration to ascertain whether systemic activin production is modulated in this disease
model. What we found was that 12 hours following administration, circulating activin A levels
were increased (although not significantly) at 10, 15, and 20 mg/kg dosages of concanavalin A.
However, to our surprise, activin B levels showed a massive significant increase at every dosage
of concanavalin A administered.
Ve
hi c
l e (
PB
S,
20
0u
l I V
)
Co
nA
10
mg
/ kg
Co
nA
15
mg
/ kg
Co
nA
20
mg
/ kg
Co
nA
25
mg
/ kg
0
1 0 0 0
2 0 0 0
3 0 0 0
4 0 0 0
5 0 0 0
6 0 0 0
7 0 0 0
8 0 0 0
9 0 0 0
1 0 0 0 0
1 1 0 0 0
1 2 0 0 0
1 3 0 0 0
1 4 0 0 0
1 5 0 0 0
Se
ru
m A
ct
ivin
B (
pg
/mL
)* * * *
* * * *
* * * ** * * *
A B
Ve
hi c
l e (
PB
S,
20
0u
l I V
)
Co
nA
10
mg
/ kg
Co
nA
15
mg
/ kg
Co
nA
20
mg
/ kg
Co
nA
25
mg
/ kg
0
1 0 0 0
2 0 0 0
3 0 0 0
4 0 0 0
Se
ru
m A
ct
ivin
A (
pg
/mL
)
Figure 3-4 Systemic activin A and B levels following intravenous concanavalin A
administration. Lean male Balb/c mice were administered a single dose of concanavalin A
intravenously. Serum levels of activin A (A) and activin B (B) were measured by ELISA from
serum collected 12 hours post-dose. Data are expressed as mean ± S.E.M. (n=6 mice/group).
Significance is indicated ****P ≤ 0.0001, treated group versus vehicle control group (Dunnett’s one-
way ANOVA).
Of particular interest regarding levels of activin B in circulation following concanavalin A
administration is the fact that there is no correlation whatsoever to clinical parameters of liver

33
injury. Each dose of concanavalin A we evaluated saturated in terms of magnitude of increase in
circulating activin B compared to control. Even at 10 mg/kg, where we saw no obvious
increases to any markers of liver injury, increase in circulating activin B is equivalent to that
seen in the 25 mg/kg group, where liver damage (as reflected by ALT and AST levels) is very
appreciable. It is quite apparent that modulation of activin B plays an important role in the
pathophysiology of immune-mediated liver injury, as reflected by the robust increase in
circulating activin B in our study; cellular sources of activin B have not definitively been
identified, however. Following stimulation with lipopolysaccharide, immunolocalization of
inhibin βB has been performed via immunohistochemistry in mouse livers, which suggests
vascular endothelial cells and Kupffer cells as potential sources 45, although there may be
other sources of activin B production as well. We examined expression levels of inhibin A
and B in both liver and spleen in this model to further identify where transcription of these
genes may be modulated following immune-mediated injury to the liver.

34
Ve
hi c
l e (
PB
S,
20
0u
l I V
)
Co
nA
10
mg
/ kg
Co
nA
15
mg
/ kg
Co
nA
20
mg
/ kg
Co
nA
25
mg
/ kg
0 . 0
0 . 5
1 . 0
1 . 5
I n h i b i n A L i v e r
Fo
ld C
ha
ng
e N
or
ma
liz
ed
to
Ve
hic
le
***
**
***
Ve
hi c
l e (
PB
S,
20
0u
l I V
)
Co
nA
10
mg
/ kg
Co
nA
15
mg
/ kg
Co
nA
20
mg
/ kg
Co
nA
25
mg
/ kg
0
1 0
2 0
3 0
4 0
5 0
6 0
7 0
8 0
I n h i b i n B L i v e r
Fo
ld C
ha
ng
e N
or
ma
liz
ed
to
Ve
hic
le
***
***
***
***
A B
Figure 3-5 Inhibin A and B expression in the liver following intravenous concanavalin A
administration. Lean male Balb/c mice were administered a single dose of concanavalin A
intravenously. Transcript levels of inhibin A (A) and inhibin B (B) were quantified via qPCR using
the 2–∆∆Ct method from snap-frozen liver collected 12 hours post-dose, using hprt as the
housekeeping gene. Data are expressed as mean ± S.E.M. (n=6 mice/group). Significance is
indicated *P ≤ 0.05, **P ≤ 0.01, ***P ≤ 0.005, treated group versus vehicle control group (Dunnett’s
one-way ANOVA).
Following administration of concanavalin A, expression of inhibin A in the liver is significantly
downregulated at 12 hours post dose for all dosages. In a model of acute inflammation induced
by LPS administration, peak production of circulating activin A is achieved very quickly, within
one hour of injection, and only remains slightly elevated compared to baseline from 3 hours up
until 12 hours post administration 48. This downregulation of activin A expression and only
slight elevation in circulating ligand 12 hours post-dose may be in response to rapid, transient
elevation of activin A following inflammatory response. In contrast, inhibin B transcription is
highly upregulated (approximately 50-fold) 12 hours following concanavalin a administration,
mimicking the massive increase seen in circulating ligand. It seems likely that due to the large

35
increase in expression of inhibin B, some population of resident liver cells or infiltrating immune
cells are likely responsible for the increased production of circulating ligand.
Ve
hi c
l e (
PB
S,
20
0u
l I V
)
Co
nA
10
mg
/ kg
Co
nA
15
mg
/ kg
Co
nA
20
mg
/ kg
Co
nA
25
mg
/ kg
0
5
1 0
1 5
2 0
2 5
I n h i b i n A S p l e e n
Fo
ld C
ha
ng
e N
or
ma
liz
ed
to
Ve
hic
le
*
Ve
hi c
l e (
PB
S,
20
0u
l I V
)
Co
nA
10
mg
/ kg
Co
nA
15
mg
/ kg
Co
nA
20
mg
/ kg
Co
nA
25
mg
/ kg
0
5
1 0
1 5
2 0
2 5
I n h i b i n B S p l e e n
Fo
ld C
ha
ng
e N
or
ma
liz
ed
to
Ve
hic
le
**
*
BA
Figure 3-6 Inhibin A and B expression in the spleen following intravenous concanavalin A
administration. Lean male Balb/c mice were administered a single dose of concanavalin A
intravenously. Transcript levels of inhibin A (A) and inhibin B (B) were quantified via qPCR using
the 2–∆∆Ct method from snap-frozen spleen collected 12 hours post-dose, using beta-actin as the
housekeeping gene. Data are expressed as mean ± S.E.M. (n=6 mice/group). Significance is
indicated *P ≤ 0.05, treated group versus vehicle control group (Dunnett’s one-way ANOVA)
In the spleen, inhibin A expression is slightly upregulated starting at 15 mg/kg and dose-
dependently increases, reaching significance at 25 mg/kg. This is not a surprising finding, given
that stimulated CD4+ T-cells have been shown to produce activin A in vitro 33. Regarding
inhibin B, expression is increased to a larger extent than inhibin A, and is significantly increased
from the 15 m/kg dosage on. This increase in transcription of inhibin B may be indicative of
splenocytes an alternative source of activin B ligand in this model, be it activated T-cells,
macrophages, or some other cell type. We also examined tissue-specific protein levels for

36
activin A and B in liver to corroborate whether increased expression led to increased local
production of ligand.
Ve
hi c
l e (
PB
S,
20
0u
l I V
)
Co
nA
10
mg
/ kg
Co
nA
15
mg
/ kg
Co
nA
20
mg
/ kg
Co
nA
25
mg
/ kg
0
1 0 0 0
2 0 0 0
3 0 0 0
4 0 0 0
Liv
er
Ac
tiv
in A
(
pg
/mg
t
ot
al
pr
ot
ein
)
A B
Ve
hi c
l e (
PB
S,
20
0u
l I V
)
Co
nA
10
mg
/ kg
Co
nA
15
mg
/ kg
Co
nA
20
mg
/ kg
Co
nA
25
mg
/ kg
0
5 0
1 0 0
1 5 0
Liv
er
Ac
tiv
in B
(
pg
/mg
t
ot
al
pr
ot
ein
)
* *
*
*
Figure 3-7 Liver activin A and B levels following intravenous concanavalin A
administration. Lean male Balb/c mice were administered a single dose of concanavalin A
intravenously. Tissue-specific levels of activin A (A) and activin B (B) were measured by ELISA
from liver lysates collected 12 hours post-dose. Data are expressed as mean ± S.E.M. (n=6
mice/group). Significance is indicated *P ≤ 0.05, **P ≤ 0.01, treated group versus vehicle control
group (Dunnett’s one-way ANOVA).
In the liver, there are no significant changes to local production of activin A 12 hours following
concanavalin A administration, consistent with serum levels and liver transcript data. Activin B
production is dose-dependently increased in the liver following concanavalin A administration,
reaching statistically significant difference at 15 mg/kg.

37
Ve
hi c
l e (
PB
S,
20
0u
l I V
)
Co
nA
10
mg
/ kg
Co
nA
15
mg
/ kg
Co
nA
20
mg
/ kg
Co
nA
25
mg
/ kg
0
5 0 0
1 0 0 0
1 5 0 0
2 0 0 0
2 5 0 0S
ple
en
Ac
tiv
in A
(p
g/u
g t
ot
al
pr
ot
ein
)
Ve
hi c
l e (
PB
S,
20
0u
l I V
)
Co
nA
10
mg
/ kg
Co
nA
15
mg
/ kg
Co
nA
20
mg
/ kg
Co
nA
25
mg
/ kg
0
2 0
4 0
6 0
8 0
1 0 0
Sp
lee
n
Ac
tiv
in B
(p
g/u
g t
ot
al
pr
ot
ein
)
***
****
A B
Figure 3-8 Spleen activin A and B levels following intravenous concanavalin A
administration. Lean male Balb/c mice were administered a single dose of concanavalin A
intravenously. Tissue-specific levels of activin A (A) and activin B (B) were measured by ELISA
from spleen lysates collected 12 hours post-dose. Data are expressed as mean ± S.E.M. (n=6
mice/group). Significance is indicated **P ≤ 0.01, ***P ≤ 0.005, treated group versus vehicle
control group (Dunnett’s one-way ANOVA).
In the spleen, there are no significant changes to local production of activin A 12 hours following
concanavalin A administration, even though we saw significant upregulation of inhibin A.
Regarding activin B, there is a dose-dependent decrease in local ligand production, with the lowest
dose of concanavalin A showing significant increase in ligand production and gradual reduction with
increasing dose until reaching the highest dose, where activin B levels are similar to vehicle control.
Following activation and clearance of antigen, activated T-cells need to be cleared in order to ensure
tolerability in the periphery, maintain lymphocyte homeostasis and prevent autoimmunity 49.
Activation-induced cell death (AICD) is one mechanism though which apoptosis is induced in
activated T-cells through re-stimulation of the T-cell receptor following initial activation and
expansion 50. It is likely in the higher dosage groups that re-stimulation of T-cells may be occurring
during the contraction phase following initial stimulation, where activated T-cells are highly sensitive

38
to AICD 51, simply due to the fact that antigen may still be present and not fully cleared. This may
explain why with increasing stimulation, we see decreasing protein production, as activated T-cells
potentially responsible for production of activin B may be re-stimulated by concanavalin A not
already cleared in the higher dosage groups, inducing cell death and leading to lower local
production of ligand.
3.2 Antibody neutralization of activin A and B in concanavalin A immune-mediated
hepatitis
We sufficiently characterized both activin A and B in response to acute liver injury induced by
immune-mediated hepatitis though concanavalin A administration. We next sought to determine
whether neutralization of either activin A or B might confer beneficial effects in this particular
model. Animals were separated into five groups (n=8) and administered stimulation or
treatments listed below (Table 3-2):
Table 3-2 Groups in concanavalin A activin A and B neutralization study
Group Number Treatment Stimulation
1 PBS (200 μL, SC) PBS (200 μL, IV)
2 mIgG1 (50 mg/kg, SC) ConA (15 mg/kg, IV)
3
Anti-Activin A (10
mg/kg, SC)
ConA (15 mg/kg, IV)
4
Anti-Activin B (50
mg/kg, SC)
ConA (15 mg/kg, IV)
Dosage of activin A antibody was determined from a previous study showing efficacy of muscular
degeneration in a muscle injury model run previously 52. Activin B antibody was shown to have an
IC50 that was 5-fold higher than activin A antibody by Smad2/3 binding element promoter
luciferase assay (data not shown), so we utilized a 5x dose compared to activin A antibody. We
utilized a standard dose of 15 mg/kg for concanavalin A, as this was the lowest dosage to have

39
any sort of significant impact on clinical parameters of liver function, giving us the best chance
to see effect following antibody treatment. Antibodies were dosed 16 hours prior to
concanavalin A administration, and animals were sacrificed 12 hours following concanavalin A
administration.
Ve
hi c
l e (
PB
S,
20
0u
l I V
)
I gG
1 (
50
mg
/ kg
) +
Co
nA
(1
5m
g/ k
g)
Ac
t A
Ab
(1
0m
g/ k
g)
+ C
on
A (
15
mg
/ kg
)
Ac
t B
Ab
(5
0m
g/ k
g)
+ C
on
A (
15
mg
/ kg
)
0
5 0
1 0 0
1 5 0
2 0 0
Ga
str
oc
ne
miu
s
We
t T
iss
ue
We
igh
t (
mg
)
* *
Ve
hi c
l e (
PB
S,
20
0u
l I V
)
I gG
1 (
50
mg
/ kg
) +
Co
nA
(1
5m
g/ k
g)
Ac
t A
Ab
(1
0m
g/ k
g)
+ C
on
A (
15
mg
/ kg
)
Ac
t B
Ab
(5
0m
g/ k
g)
+ C
on
A (
15
mg
/ kg
)
0
5 0
1 0 0
1 5 0
Sp
lee
n
We
t T
iss
ue
We
igh
t (
mg
)
* * * *
Ve
hi c
l e (
PB
S,
20
0u
l I V
)
I gG
1 (
50
mg
/ kg
) +
Co
nA
(1
5m
g/ k
g)
Ac
t A
Ab
(1
0m
g/ k
g)
+ C
on
A (
15
mg
/ kg
)
Ac
t B
Ab
(5
0m
g/ k
g)
+ C
on
A (
15
mg
/ kg
)
0
5 0 0
1 0 0 0
1 5 0 0
Liv
er
We
t T
iss
ue
We
igh
t (
mg
)
* * * *
* * * *
A B
C
Figure 3-9 Tissue wet weights following activin antibody treatment and intravenous
concanavalin A administration. Lean male Balb/c mice were administered antibody treatment
listed and a single dose of concanavalin A intravenously 16 hours later. Wet tissue weights of
gastrocnemius (A), spleen (B), and liver (C) were measured 12 hours post-dose. Data are expressed
as mean ± S.E.M. (n=8 mice/group). Significance is indicated **P ≤ 0.01, ****P ≤ 0.001, treated
group versus IgG control group (Dunnett’s one-way ANOVA).

40
Concanavalin A administration significantly induces hepatomegaly and splenomegaly 12 hours
following administration; neither activin A nor B antibody treatment was effective in reducing
liver or spleen weight following concanavalin A insult. Interestingly, although there is no
significant effect on muscle wasting in this model, activin B antibody treatment significantly
increased muscle mass after only approximately 28 hours.
Figure 3-10 H&E staining in liver following activin antibody treatment and intravenous
concanavalin A administration. Lean male Balb/c mice were administered antibody treatment
listed and a single dose of concanavalin A intravenously 16 hours later. Liver sections were
subjected to hematoxylin and eosin staining. Representative images of (A) PBS treated, (B) IgG
+ ConA, (C) anti-activin A + ConA, and (D) anti-activin B + ConA treatment are presented here.
Hematoxylin and eosin staining was performed on liver sections following study termination;
concanavalin A treatment resulted in widespread necrotic damage to hepatocytes and cell death.
In animals treated with either activin A or B antibody, this resulting damage to hepatocytes
following concanavalin A administration was almost completely absent. This protective effect

41
on hepatocytes following inhibition of activin A or B is reflected by lowering of serum ALT and
AST levels as well.
Ve
hi c
l e (
PB
S,
20
0u
l I V
)
I gG
(5
0m
g/ k
g)
+ C
on
A (
15
mg
/ kg
)
Ac
t A A
b (
10
mg
/ kg
) +
Co
nA
(1
5m
g/ k
g)
Ac
t B A
b (
50
mg
/ kg
) +
Co
nA
(1
5m
g/ k
g)
0
2 0 0 0
4 0 0 0
6 0 0 0
AL
T (
IU/L
)
*
*
*
Ve
hi c
l e (
PB
S,
20
0u
l I V
)
I gG
(5
0m
g/ k
g)
+ C
on
A (
15
mg
/ kg
)
Ac
t A A
b (
10
mg
/ kg
) +
Co
nA
(1
5m
g/ k
g)
Ac
t B A
b (
50
mg
/ kg
) +
Co
nA
(1
5m
g/ k
g)
0
2 0 0 0
4 0 0 0
6 0 0 0
AS
T (
IU/L
)
*
*
*
A B
Figure 3-11 Response of ALT and AST following activin antibody treatment and
intravenous concanavalin A administration. Lean male Balb/c mice were administered a single
dose of antibody treatment listed and a single dose of concanavalin A intravenously 16 hours later.
Serum levels of ALT (A) and AST (B) were measured from serum collected 12 hours post-dose.
Data are expressed as mean ± S.E.M. (n=8 mice/group). Significance is indicated *P ≤ 0.05, treated
group versus IgG control group (Dunnett’s one-way ANOVA).
Both activin A and B antibodies, when administered prophylactically prior to concanavalin A
administration, showed significant reductions in ALT and AST in serum suggesting a protective
effect of hepatocytes against injury induced by immune activation in the liver.

42
Ve
hi c
l e (
PB
S,
20
0u
l I V
)
I gG
(5
0m
g/ k
g)
+ C
on
A (
15
mg
/ kg
)
Ac
t A A
b (
10
mg
/ kg
) +
Co
nA
(1
5m
g/ k
g)
Ac
t B A
b (
50
mg
/ kg
) +
Co
nA
(1
5m
g/ k
g)
0 . 0
0 . 1
0 . 2
0 . 3
0 . 4T
ot
al
Bil
iru
bin
(m
g/d
L)
* *
* ** *
Ve
hi c
l e (
PB
S,
20
0u
l I V
)
I gG
(5
0m
g/ k
g)
+ C
on
A (
15
mg
/ kg
)
Ac
t A A
b (
10
mg
/ kg
) +
Co
nA
(1
5m
g/ k
g)
Ac
t B A
b (
50
mg
/ kg
) +
Co
nA
(1
5m
g/ k
g)
0
2 0 0
4 0 0
6 0 0
To
ta
l B
ile
Ac
ids
(m
g/d
L)
*
* *
A B
Figure 3-12 Response of bilirubin and bile acids following activin antibody treatment and
intravenous concanavalin A administration. Lean male Balb/c mice were administered a
single dose of antibody treatment listed and a single dose of concanavalin A intravenously 16
hours later. Serum levels of bilirubin (A) and bile acids (B) were measured from serum collected
12 hours post-dose. Data are expressed as mean ± S.E.M. (n=8 mice/group). Significance is
indicated *P ≤ 0.05, **P ≤ 0.01 treated group versus IgG control group (Dunnett’s one-way
ANOVA).
Activin A and B antibodies also showed significant effects in lowering total bilirubin and
reduction of total bile acids.

43
Ve
hi c
l e (
PB
S,
20
0u
l I V
)
I gG
(5
0m
g/ k
g)
+ C
on
A (
15
mg
/ kg
)
Ac
t A A
b (
10
mg
/ kg
) +
Co
nA
(1
5m
g/ k
g)
Ac
t B A
b (
50
mg
/ kg
) +
Co
nA
(1
5m
g/ k
g)
0
5 0
1 0 0
1 5 0
2 0 0
2 5 0
Glu
co
se
(m
g/d
L) * *
Ve
hi c
l e (
PB
S,
20
0u
l I V
)
I gG
(5
0m
g/ k
g)
+ C
on
A (
15
mg
/ kg
)
Ac
t A A
b (
10
mg
/ kg
) +
Co
nA
(1
5m
g/ k
g)
Ac
t B A
b (
50
mg
/ kg
) +
Co
nA
(1
5m
g/ k
g)
0
5 0
1 0 0
1 5 0
2 0 0
To
ta
l C
ho
les
te
ro
l (m
g/d
l)
A B
Figure 3-13 Response of glucose and cholesterol following activin antibody treatment and
intravenous concanavalin A administration. Lean male Balb/c mice were administered a
single dose of antibody treatment listed and a single dose of concanavalin A intravenously 16
hours later. Serum levels of glucose (A) and cholesterol (B) were measured from serum
collected 12 hours post-dose. Data are expressed as mean ± S.E.M. (n=8 mice/group).
Significance is indicated *P ≤ 0.05, **P ≤ 0.01 treated group versus IgG control group
(Dunnett’s one-way ANOVA).
Both antibody treatments showed a modest protection of gluconeogenesis (although not
significant) following concanavalin A administration, and no effect on total cholesterol (although
total cholesterol in this particular model does not seem to be affected).
Neutralization of both activin A and B conferred protective effects against immune-mediated
liver injury induced by concanavalin A administration (reflected by significant reduction in
serum ALT, AST, and bilirubin). To investigate mechanistically how neutralization of activin A

44
and B might confer these benefits, we analyzed IFN-γ, IL-1β, IL-2, IL-4, IL-5, IL-6, IL-10, IL-
12p70, KC/GRO, and TNFα in terminal serum samples. Inhibition of activin A and B resulted in
significant decreases in TNFα, IL-2, and IL-4.

45
Ve
hi c
l e (
PB
S,
20
0u
l I V
)
I gG
(5
0m
g/ k
g)
+ C
on
A (
15
mg
/ kg
)
Ac
t iv
i n A
Ab
(1
0m
g/ k
g)
+ C
on
A (
15
mg
/ kg
)
Ac
t iv
i n B
Ab
(5
0m
g/ k
g)
+ C
on
A (
15
mg
/ kg
)
0
1 0
2 0
3 0
4 0
5 0
6 0
7 0
8 0
9 0
1 0 0
1 1 0
1 2 0T
NF
a (
pg
/mL
)
* * * *
* *
Figure 3-14 TNFα in serum following activin antibody treatment and intravenous
concanavalin A administration. Lean male Balb/c mice were administered a single dose of
antibody treatment listed and a single dose of concanavalin A intravenously 16 hours later.
Serum levels of TNFα were measured via Meso Scale Discovery Electrochemiluminescence
from serum collected 12 hours post-dose. Data are expressed as mean ± S.E.M. (n=8
mice/group). Significance is indicated *P ≤ 0.05, ****P ≤ 0.001 treated group versus IgG control
group (Dunnett’s one-way ANOVA).
Both activin A and B antibodies significantly reduced circulating levels of TNFα following
concanavalin A administration. TNFα is a pleiotropic cytokine, produced by multiple immune

46
cell types including macrophages and monocytes and triggers multiple pathways involved in
proliferation, inflammation, and apoptosis 53. One major source of TNFα is phagocytosis of
apoptotic hepatocytes by HSCs and Kupffer cells, leading to upregulation of TNFα and
additional profibrogenic factors 54. In regards to fibrosis, TNFα has been shown to induce
proinflammatory and immunogenic activity in dendritic cell in the liver 55, and blocking TNFα
has been shown to inhibit HSC activation by C-C motif chemokine receptor (CCR) 9+
macrophages 56. It stands to reason that TNFα is an essential factor in the initialization and
progression of liver fibrosis. Inhibition of activins in this case may reduce circulating levels of
TNFα by prevention of hepatocyte death (as measured by ALT and AST), preventing TNFα
production by HSCs and Kupffer cells engulfing apoptotic hepatocytes. How exactly activins
may be involved in hepatocyte preservation in this disease model needs to further investigated.

47
Ve
hi c
l e (
PB
S,
20
0u
l I V
)
I gG
(5
0m
g/ k
g)
+ C
on
A (
15
mg
/ kg
)
Ac
t iv
i n A
Ab
(1
0m
g/ k
g)
+ C
on
A (
15
mg
/ kg
)
Ac
t iv
i n B
Ab
(5
0m
g/ k
g)
+ C
on
A (
15
mg
/ kg
)
0
2 0 0
4 0 0
6 0 0
8 0 0
1 0 0 0IL
-2
(p
g/m
L)
*
B Q L
p = 0 . 0 5 2 3
Figure 3-15 IL-2 in serum following activin antibody treatment and intravenous
concanavalin A administration. Lean male Balb/c mice were administered a single dose of
antibody treatment listed and a single dose of concanavalin A intravenously 16 hours later.
Serum levels of IL-2 were measured via Meso Scale Discovery Electrochemiluminescence from
serum collected 12 hours post-dose. Data are expressed as mean ± S.E.M. (n=8 mice/group).
Significance is indicated *P ≤ 0.05, treated group versus IgG control group (Dunnett’s one-way
ANOVA). BQL - below quantifiable limit.
Neutralization of activin B showed significant reduction of circulating IL-2, and neutralization of
activin A reduced IL-2 to a lesser effect. IL-2 is primarily derived from activated CD4+ T cells,

48
activated CD8+ T cells, NK cells, dendritic cells and macrophages 57. IL-2 plays a number of
roles in immune regulation, many of which have implications regarding chronic injury and
fibrosis, including: promoting T-cell differentiation to effector or memory cells when the T-cell
is stimulated by antigen 57, development of proliferation-competent memory cells, priming of
CD8+ cells with non-infectious immunogens, and maintenance of T-cells during chronic
infection 58. Reduction of IL-2 in this model is likely due to suppression of activation of T-cells
and macrophages from concanavalin A stimulation.

49
Ve
hi c
l e (
PB
S,
20
0u
l I V
)
I gG
(5
0m
g/ k
g)
+ C
on
A (
15
mg
/ kg
)
Ac
t iv
i n A
Ab
(1
0m
g/ k
g)
+ C
on
A (
15
mg
/ kg
)
Ac
t iv
i n B
Ab
(5
0m
g/ k
g)
+ C
on
A (
15
mg
/ kg
)
0
2 0
4 0
6 0IL
-4
(p
g/m
L)
B Q L
* *
Figure 3-16 IL-4 in serum following activin antibody treatment and intravenous
concanavalin A administration. Lean male Balb/c mice were administered a single dose of
antibody treatment listed and a single dose of concanavalin A intravenously 16 hours later.
Serum levels of IL-4 were measured via Meso Scale Discovery Electrochemiluminescence from
serum collected 12 hours post-dose. Data are expressed as mean ± S.E.M. (n=8 mice/group).
Significance is indicated *P ≤ 0.05, treated group versus IgG control group (Dunnett’s one-way
ANOVA). BQL - below quantifiable limit.
Both activin A and B neutralization resulted in significant lowering of IL-4 in circulation. IL-4
promotes alternative activation of resident macrophages in the liver into M2 macrophages, and

50
depending on context, M2 macrophages may exhibit pro or anti-fibrotic activity 59. In vivo, IL-
4/IL-13 double knockout animals (both of which bind IL-4Rα) showed resistance to
development of fibrosis induced by CCL4 administration, but deletion of IL-4Rα spontaneous
fibrosis reversal is inhibited 59. In this context, it is more likely that inhibition of IL-4 would be
desirable to prevent development of fibrosis.
3.3 Antibody neutralization of activin A and B in CCl4-induced liver fibrosis
We demonstrated that neutralization of activin A and B showed protective effects in an acute
model of immune-mediated liver injury and showed potential for anti-fibrotic activity. We next
sought to determine whether neutralization of activins could have the potential to reverse
established fibrosis in a CCL4-induced model of liver fibrosis. Mice were randomized by body
weight (n=8) and administered corn oil or CCL4. CCL4 was injected twice weekly for 10 weeks;
on the seventh week after the establishment of fibrosis, we began weekly administration of the
following treatments:
Table 3-3 Groups in CCl4 activin A and B neutralization study
Group Number Treatment Stimulation
1 PBS (10 mL/kg, SC) Corn oil (10 mL/kg, IP)
2 mIgG1 (60 mg/kg, SC) CCl4 (1 mL/kg, IP)
3
Anti-Activin A
(10 mg/kg, SC)
CCl4 (1 mL/kg, IP)
4
Anti-Activin B
(50 mg/kg, SC)
CCl4 (1 mL/kg, IP)
5
Anti-A (10 mg/kg, SC)
+
Anti-B (50 mg/kg, SC)
CCl4 (1 mL/kg, IP)
6
AcvRIIB Fc
(10 mg/kg, SC)
CCl4 (1 mL/kg, IP)

51
In this study, we included two extra groups: combination treatment of both activin A and B
antibody, and pan inhibitor soluble decoy receptor AcvRIIB as a positive control. The
combination group was included to test if neutralization of both ligands may have additive or
synergistic effects in a fibrosis model.
W e e k 1 W e e k 7 W e e k 8 W e e k 9 W e e k 1 0
- 1 0
- 5
0
5
1 0
1 5
2 0
lea
n m
as
s
(%
ch
an
ge
fr
om
ba
se
lin
e)
C o r n O i l
I g G
A c t A 1 0 m g
A c t B 5 0 m g
A + B 1 0 / 5 0 m g
A c v R 2 b 1 0 m g
C C L 4 s t a r t R X s t a r t
Figure 3-17 Lean mass % change from baseline following activin antibody treatment in
CCl4-induced hepatic fibrosis. Lean female C57bl/6 mice were administered weekly treatment
listed after establishment of fibrosis. Weekly body composition was evaluated via qNMR, and
lean mass reported as percent change from study baseline. Data are expressed as mean ± S.E.M.
(n=8 mice/group).
Throughout the course of the study, body composition was monitored via qNMR. Muscle
wasting is a common comorbidity associated with clinical hepatic fibrosis and end-stage liver
disease, and incidence has been shown to progress with disease 60. In our study, neutralization of
activin A and B both had protective benefits to maintaining lean mass during progression of the
disease. Combination treatment with both neutralizing antibodies had an enhanced effect and
actually increased lean mass compared to baseline, suggesting neutralization of activin A and B

52
may confer this preservation of lean mass through different mechanisms or may modulate the
activity of one another.
Co
r n O
i l
I gG
Ac t i v
i n A
Ab
Ac t i v
i n B
Ab
Co
mb
o A
+B
Ac v
RI I
B F
c
0 . 0
0 . 5
1 . 0
1 . 5
Liv
er
we
igh
t (
g) * * *
* *
* * * ** * * *
Co
r n O
i l
I gG
Ac t i v
i n A
Ab
Ac t i v
i n B
Ab
Co
mb
o A
+B
Ac v
RI I
B F
c
0
5 0
1 0 0
1 5 0
2 0 0
Ga
st
ro
cn
em
ius
we
igh
t (
mg
)
*
* * * * * * *
A B
Figure 3-18 Tissue wet weights following activin antibody treatment in CCl4-induced
hepatic fibrosis. Lean female C57bl/6 mice were administered weekly treatment listed after
establishment of fibrosis. Wet tissue weights of gastrocnemius (A) and liver (B) were measured at
study termination. Data are expressed as mean ± S.E.M. (n=8 mice/group). Significance is indicated
*P ≤ 0.05, **P ≤ 0.01, ***P ≤ 0.005, ****P ≤ 0.001, treated group versus IgG control group
(Dunnett’s one-way ANOVA).
At study termination, wet tissue weights of liver and gastrocnemius were taken. Neutralization
of both activin A and B had the same magnitude of effect in maintaining liver weight, and
combination of neutralizing both had an additive effect. Neutralization of activin A, but not
activin B, maintained gastrocnemius weight; both combo neutralization and soluble receptor
treatments had similar effect to activin A neutralization alone.
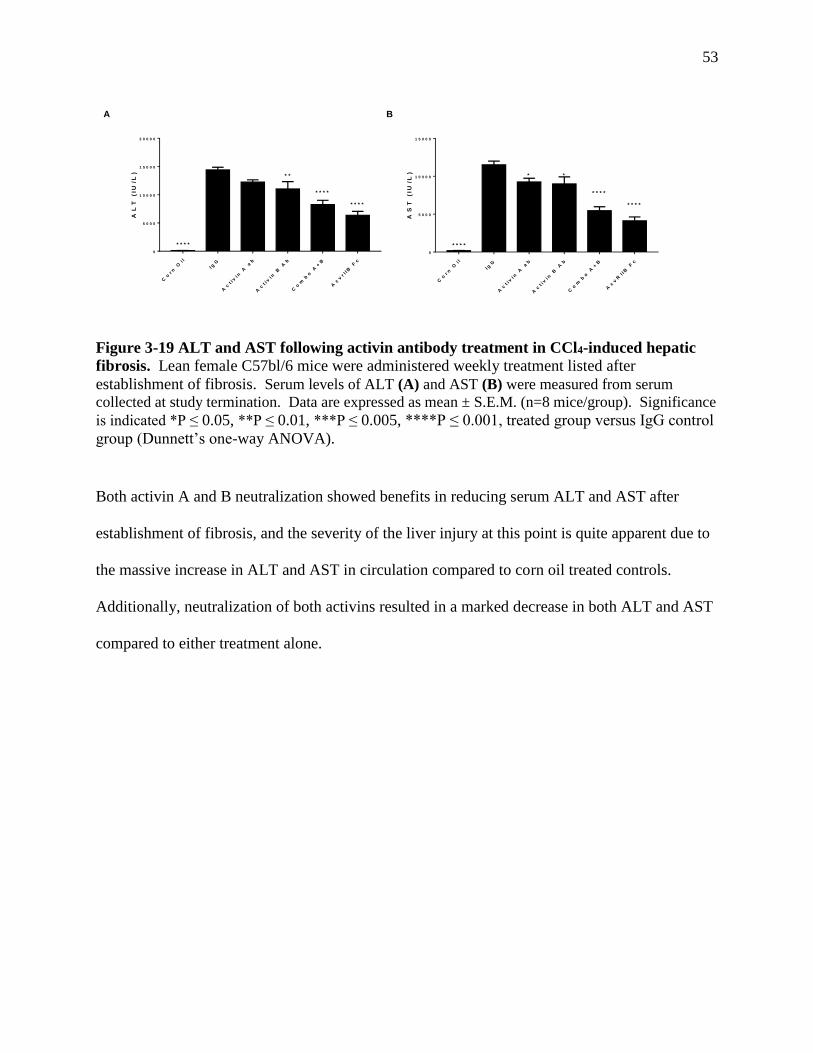
53
Co
r n O
i l
I gG
Ac
t iv
i n A
ab
Ac
t iv
i n B
Ab
Co
mb
o A
+B
Ac
vr I I
B F
c
0
5 0 0 0
1 0 0 0 0
1 5 0 0 0
2 0 0 0 0
AL
T (
IU/L
)
* * * *
* * * *
* * * *
* *
Co
r n O
i l
I gG
Ac
t iv
i n A
ab
Ac
t iv
i n B
Ab
Co
mb
o A
+B
Ac
vR
I IB
Fc
0
5 0 0 0
1 0 0 0 0
1 5 0 0 0
AS
T (
IU/L
)
* * * *
* * * *
* * * *
**
A B
Figure 3-19 ALT and AST following activin antibody treatment in CCl4-induced hepatic
fibrosis. Lean female C57bl/6 mice were administered weekly treatment listed after
establishment of fibrosis. Serum levels of ALT (A) and AST (B) were measured from serum
collected at study termination. Data are expressed as mean ± S.E.M. (n=8 mice/group). Significance
is indicated *P ≤ 0.05, **P ≤ 0.01, ***P ≤ 0.005, ****P ≤ 0.001, treated group versus IgG control
group (Dunnett’s one-way ANOVA).
Both activin A and B neutralization showed benefits in reducing serum ALT and AST after
establishment of fibrosis, and the severity of the liver injury at this point is quite apparent due to
the massive increase in ALT and AST in circulation compared to corn oil treated controls.
Additionally, neutralization of both activins resulted in a marked decrease in both ALT and AST
compared to either treatment alone.

54
Co
r n O
i l
I gG
Ac
t iv
i n A
ab
Ac
t iv
i n B
Ab
Co
mb
o A
+B
Ac
vR
I IB
Fc
0 . 0
0 . 1
0 . 2
0 . 3
0 . 4
To
ta
l B
ilir
ub
in (
mg
/dL
)
* * * *
* * *
*
Co
r n O
i l
I gG
Ac
t iv
i n A
ab
Ac
t iv
i n B
Ab
Co
mb
o A
+B
Ac
vR
I IB
Fc
0
5 0
1 0 0
1 5 0
To
ta
l B
ile
Ac
ids
(u
mo
l/L
)
* * * *
* * * *
* * * *
* * *
* *
A B
Figure 3-20 Bilirubin and bile acids following activin antibody treatment in CCl4-induced
hepatic fibrosis. Lean female C57bl/6 mice were administered weekly treatment listed after
establishment of fibrosis. Serum levels of bilirubin (A) and bile acids (B) were measured from
serum collected at study termination. Data are expressed as mean ± S.E.M. (n=8 mice/group).
Significance is indicated *P ≤ 0.05, **P ≤ 0.01, ***P ≤ 0.005, ****P ≤ 0.001, treated group versus
IgG control group (Dunnett’s one-way ANOVA).
Neither neutralization of activin A nor B alone significantly reduced bilirubin, but when
neutralized in combination a significant lowering was seen compared to control. Neutralization
of A and B separately (B more so than A) significantly lowered bile acids. Neutralization of
both ligands slightly improved this reduction.

55
Co
r n O
i l
I gG
Ac
t iv
i n A
ab
Ac
t iv
i n B
Ab
Co
mb
o A
+B
Ac
vR
I IB
Fc
0
5 0
1 0 0
1 5 0
2 0 0
2 5 0
Glu
co
se
(m
g/d
L)
* * * *
* * * *
* * * *
* * * *
* * * *
Co
r n O
i l
I gG
Ac
t iv
i n A
ab
Ac
t iv
i n B
Ab
Co
mb
o A
+B
Ac
vR
I IB
Fc
0
5 0
1 0 0
1 5 0
To
ta
l C
ho
les
te
ro
l (m
g/d
L)
* * * *
* * * * * * *
*
A B
Figure 3-21 Glucose and cholesterol following activin antibody treatment in CCl4-induced
hepatic fibrosis. Lean female C57bl/6 mice were administered weekly treatment listed after
establishment of fibrosis. Serum levels of glucose (A) and cholesterol (B) were measured from
serum collected at study termination. Data are expressed as mean ± S.E.M. (n=8 mice/group).
Significance is indicated *P ≤ 0.05, ***P ≤ 0.005, ****P ≤ 0.001, treated group versus IgG
control group (Dunnett’s one-way ANOVA).
Glucose levels were not significantly improved by neutralization of either activin A or B alone,
but combination neutralization of both ligands resulted in a highly significant improvement.
Likewise, neutralizing either ligand alone showed no improvement in cholesterol in serum, but
combination neutralization significantly reduced cholesterol to levels below corn oil control.

56
Figure 3-22 MTS staining in liver following activin antibody treatment in CCl4-induced
hepatic fibrosis. Lean female C57bl/6 mice were administered weekly treatment listed after
establishment of fibrosis. Liver sections were subjected to Masson's trichrome staining and (A)
% positive area staining for collagen was quantified using ImageJ. Representative images of (B)
corn oil, (C) IgG, (D) anti-activin A, (E) anti-activin B, (F) antibody combination, and (G)
AcvRIIB Fc treatment are presented here. Data are expressed as mean ± S.E.M. (n=8
mice/group). Significance is indicated **P ≤ 0.01, ****P ≤ 0.001, treated group versus IgG
control group (Dunnett’s one-way ANOVA).
A main endpoint of this study was to perform Masson’s trichrome staining on liver sections in
order to visualize and quantitate collagen deposition and fibrosis following CCl4 administration
and demonstrate if inhibition of either activin may reverse disease progression. The results from
10 weeks of CCl4 administration are quite striking – nearly 20% of the liver of IgG treated
animals is fibrotic. This fibrosis is prevalent throughout the entire liver, and is not contained to
only areas surrounding vasculature. Even more surprising is the marked effect neutralization of
activin A and B has in reducing fibrosis in this model. Both A, and to greater effect B,
significantly reduce fibrosis; there does not seem to be increased effect when both ligands are
neutralized.

57
Figure 3-23 F4/80 staining in liver following activin antibody treatment in CCl4-induced
hepatic fibrosis. Lean female C57bl/6 mice were administered weekly treatment listed after
establishment of fibrosis. Liver sections were stained with anti-F4/80 and (A) % positive area
staining was quantified using ImageJ. Representative images of (B) corn oil, (C) IgG, (D) anti-
activin A, (E) anti-activin B, (F) antibody combination, and (G) AcvRIIB Fc treatment are presented
here. Data are expressed as mean ± S.E.M. (n=8 mice/group). Significance is indicated **P ≤ 0.01,
***P ≤ 0.005, ****P ≤ 0.001, treated group versus IgG control group (Dunnett’s one-way
ANOVA).
Immunostaining of liver sections with anti-F4/80 was also performed and quantitated - F4/80 is a
marker of murine macrophages and Kupffer cells. CCl4 administration significantly increased
macrophage infiltration into the liver compared to corn oil treated mice. Neutralization of
activin A, B, and the combination all were effective in significantly reducing macrophage
numbers to near baseline levels. There did not seem to be any sort of additive or synergistic
effects in combination neutralization of both ligands.

58
Figure 3-24 Ki67 staining in liver following activin antibody treatment in CCl4-induced
hepatic fibrosis. Lean female C57bl/6 mice were administered weekly treatment listed after
establishment of fibrosis. Liver sections were stained with anti-Ki67 and (A) % positive cells
stained was quantified using ImageJ. Representative images of (B) corn oil, (C) IgG, (D) anti-activin
A, (E) anti-activin B, (F) antibody combination, and (G) AcvRIIB Fc treatment are presented here.
Data are expressed as mean ± S.E.M. (n=8 mice/group). Significance is indicated *P ≤ 0.05, **P ≤
0.01, ****P ≤ 0.001, treated group versus IgG control group (Dunnett’s one-way ANOVA).
Proliferative action in the liver was quantified by Ki67 staining. In the context of liver, increase
in proliferation is largely reflective hepatocytes re-entering the cell cycle from quiescence
following damage 61. This increase in proliferation may also be reflective of the activation of
HSCs into proliferative, pro-fibrogenic myofibroblast-like cells. CCl4 administration resulted in
significant positive staining of Ki67 compared to corn oil treatment, suggesting widespread
damage and apoptosis in hepatocytes and activation of HSCs. Neutralization of activin B, but
not activin A, significantly reduced this proliferation seen with CCl4 administration;
neutralization of both antibodies in combination did not improve effect compared to B
neutralization alone.

59
Figure 3-25 MPO staining in liver following activin antibody treatment in CCl4-induced
hepatic fibrosis. Lean female C57bl/6 mice were administered weekly treatment listed after
establishment of fibrosis. Liver sections were stained with anti-MPO and (A) % positive area
staining was quantified using ImageJ. Representative images of (B) corn oil, (C) IgG, (D) anti-
activin A, (E) anti-activin B, (F) antibody combination, and (G) AcvRIIB Fc treatment are presented
here. Data are expressed as mean ± S.E.M. (n=8 mice/group). Significance is indicated *P ≤ 0.05,
**P ≤ 0.01, ****P ≤ 0.001, treated group versus IgG control group (Dunnett’s one-way
ANOVA).
Myeloperoxidase (MPO) is a peroxidase enzyme abundantly expressed in neutrophil
granulocytes – in normal and acutely damaged rat liver, MPO expression is only found in
neutrophil granulocytes, but not in macrophages 62. CCl4 administration significantly increased
neutrophil infiltration into liver compared to corn oil treated animals, but neither activin A,
activin B, or the neutralization of both showed any effects on neutrophils in the liver.
Neutralization of activin A and B individually both showed significant improvements in
parameters of liver damage, liver function, fibrosis, and macrophage infiltration in a CCl4-
induced model of liver fibrosis after establishment of disease. Activin B neutralization showed a

60
more robust effect in reducing fibrosis and also significantly reduced hepatocyte and HSC
proliferation which activin A neutralization did not. Combination neutralization of both ligands
showed additive or synergistic effects in certain parameters, including protection of hepatocytes
(via reduced ALT and AST), gluconeogenesis, cholesterol metabolism, bilirubin and bile acid
production, and preservation of lean mass. Overall, neutralization of activin A, B, and the
combination of both showed profound benefits in this experimental model of liver fibrosis.

61
CHAPTER 4. DISCUSSION
4.1 Characterization of concanavalin A induced immune hepatitis
Tissue injury and the resulting inflammatory response acts as an important trigger for the
initiation of regenerative processes and the development of fibrosis; in many diseases this
inflammatory response is essential for fibrosis to occur at all 63. Understanding how activins are
modulated during this initial inflammatory response may provide insights as to if and how they
may affect the initiation and progression of liver fibrosis. Concanavalin A-induced hepatitis
provides a convenient, short-term model of inflammation highly specific to the liver mediated
through activation of T-cells and macrophages. Concanavalin A may also have direct
stimulatory effects on resident HSCs, a major cellular contributor to the initiation and
progression of fibrosis. HSCs directly stimulated by concanavalin A have been shown to induce
oxidative stress and apoptosis of hepatocytes in the absence of other effector cell types 64. In our
hands, concanavalin A administration resulted in trademarks of severe, acute inflammatory
response in the liver – increases in enzymes reflective of hepatocyte death (ALT and AST), and
impaired function (serum bilirubin and glucose). We demonstrated how activins are modulated
during this acute phase inflammation – circulating activin B levels were massively increased,
nearly 20 fold compared to control animals. It is clear that activin B production is to a certain
extent hepatically derived, as reflected by a roughly 50-fold increase in inhibin B expression and
significant increase in liver-specific protein. However, this substantial increase in circulating
activin B was even observed in dosages of concanavalin A where there were no measureable
effects on clinical parameters of liver injury or function. This finding is suggestive of some
subpopulation of activated immune cells potentially being an alternative source of activin B

62
production during the inflammatory phase. To further support this notion we also observed
significant increases in inhibin B expression and activin B protein in the spleen. Measurement of
activin B by ELISA in the conditioned cell media of stimulated splenocytes would be a simple
method of ascertaining whether or not some leukeocyte may be responsible for production of
activin B. Regarding activin A, we saw only slight effects in circulating protein 12 hours
following stimulation of concanavalin A. As previously mentioned, in a model of LPS-induced
liver inflammation, activin A production was significantly increased immediately following
stimulation, but dropped rapidly 3 hours following stimulation 48. In the content of the
concanavalin A model, is very likely that production of activin A by inflammatory insult is very
rapid and transient, and 12 hours following initial stimulation levels have already decreased
substantially. This notion is further supported by the fact that we observe significant
downregulation of activin A in the liver at 12 hours post-stimulation, likely due to inhibitory
feedback from initial signaling. Ideally, it would be best to perform characterization of this
model throughout the entire time course of stimulation, from the initial inflammatory response
all the way to resolution. Regardless, our characterization of this model demonstrated the
modulation of activins in the context of acute liver inflammation, and therefore how activins
might be involved in the pathology of fibrosis.
4.2 Antibody neutralization of activin A and B in concanavalin A-induced immune
hepatitis
Neutralization of activin A and B conferred pronounced effects in our concanavalin A immune-
mediated hepatitis model – blocking either A or B protected hepatocytes and significantly
lowered ALT and AST in the serum at 12 hours post-stimulation, and improved liver function
(significantly decreased serum bilirubin). We saw significant reductions in serum cytokines

63
TNFα, IL-2, and IL-4 when neutralizing activin A or B prior to concanavalin A stimulation.
TNFα is a known promoter of liver fibrosis; inflammation in the liver is perpetuated by TNFα
production, which results in the activation of resident HSCs into fibrogenic myofibroblasts 53.
TNFα has also been shown to directly induce apoptosis in hepatocytes 65. Mechanistically, it is
uncertain how exactly activin neutralization is modulating TNFα in this model. Phagocytosis of
apoptotic hepatocytes by HSCs or macrophages upregulates TNFα, and chronic activation of
these cells accelerates hepatocyte apoptosis and inflammation, leading to a positive feedback
loop 54. Activin neutralization may inhibit activation or recruitment of macrophages during acute
inflammation, blunting the upregulation of TNFα from phagocytosis of apoptotic hepatocytes.
Activin neutralization may also inhibit the activity of concanavalin A to stimulate activation of
HSCs. Examining histological markers of macrophages and proliferation might provide clues as
to how exactly activin neutralization downregulates TNFα. IL-2 is a Th1 cytokine, responsible
for macrophage activation among other functions 66. This downregulation of IL-2 may provide
an explanation as for the downregulation of TNFα we observed, as macrophage activation may
be inhibited. The main source of IL-2 in this model is likely from activated T-cells; activins may
play a role in the activation or proliferation of T-cells following stimulation. It may be beneficial
to explore this relationship by characterizing isolated CD3+ cells and subpopulations after
treatment with exogenous activins. IL-4 is a Th2 cytokine, responsible for induction of naïve T-
helper cells to Th2 cells – it also promotes alternative polarization of macrophages to M2
macrophages and inhibits M1 polarization. Acutely, M2 macrophages promote controlled
wound healing and tissue regeneration though IL-10, TGFβ, and other secreted factors 67. When
chronically activated, however, M2 macrophages can activate resident fibroblasts and promote
fibrosis 68; downregulation of IL-4 in chronic liver injury may confer anti-fibrotic effects and

64
inhibit the progression of fibrogenesis. Overall, neutralization of activins confers benefits during
acute-phase inflammation, and may confer benefits during chronic inflammation and
fibrogenesis.
4.3 Antibody neutralization of activin A and B in carbon tetrachloride-induced liver
fibrosis
We characterized activins in the context of the acute inflammatory phase, demonstrated
protective effects in the liver via inhibition of activins following immune stimulation, and
provided some insight mechanistically as to how activin inhibition may be conferring these
benefits and how activin modulation may be involved in chronic inflammation and the initiation
and progression of fibrosis. The final step was to characterize the effects of activin
neutralization in an experimental model of liver fibrosis. CCl4 is a commonly used, highly
potent, and well-characterized hepatotoxin used in preclinical rodent models to induce liver
fibrosis; CCl4 increases lipid profile, liver enzymes, and oxidative stress markers, while
decreasing total protein and high-density lipoprotein 69. More importantly, histological changes
in inflammation, loss of normal hepatocytes, collagen deposition and fiber segmentation
formation are observed following CCl4 administration 70. This collagen deposition and ECM
formation is driven by recruitment and activation of HSCs to the site of tissue injury, which
transdifferentiate into myofibroblast-like cells, driven by increased TGFβ signaling 71. In our
experiment, we opted to allow for development of disease by administering CCl4 without therapy
for six weeks, to evaluate the effect of activin neutralization in a therapeutic modality versus
preventative. We observed striking results following CCl4 administration for 10 weeks: a
massive increase in liver damage enzymes, marked decreases in parameters of liver function,
severe impact on gluconeogenesis, profound infiltration of macrophages, proliferation of

65
hepatocytes and HSCs, pervasive collagen deposition, and collection and retention of ascetic
fluid in the abdomen. CCl4 administration over a 10-week period is representative of clinical
presentation of advanced liver disease with concurrent fibrosis. Regardless of the severity of the
model, neutralization of activins showed drastic effects in resolving complications from
inflammatory insult and fibrogenesis resulting from CCl4 administration. We saw improvements
in liver function, protection from liver damage, resolution of fibrosis, and reduction in
macrophage infiltration. The reduction we see in chronic recruitment and activation of
macrophages may be explained by the reduction of TNFα we saw during the acute inflammatory
phase when inhibiting activins. Reduced circulating IL-2 and IL-4 we observed during acute
inflammation following activin neutralization would reflect decreased polarization of
macrophages towards M1 and M2 states during chronic injury, respectively, modulating the
acute pro-inflammatory response (M1) throughout disease progression as well as fibrotic
responses, ECM deposition, and fibroblast activation (M2). Additionally, we observed some
differentiation between activin A and B neutralization in this model. Activin B inhibition
resulted in a significant reduction in proliferation, and overall had better effects in resolving
fibrosis than activin A inhibition. Mechanistically, activin B is involved in the activation and
proliferation of HSCs and proliferation of hepatocytes following apoptosis either directly or
indirectly (as indicated by significant effects on proliferation), which also explains the enhanced
reduction in fibrosis versus activin A inhibition alone. It is worth exploring this distinction of
activin B from A, by characterizing the stimulatory response of isolated hepatocytes or HSCs to
exogenous activin A or B treatment. Finally, we observed some additive or synergistic effects
when both activin A and B were neutralized in this model. Combination therapy improved
protection of hepatocytes (via reduced ALT and AST), gluconeogenesis, cholesterol metabolism,

66
liver function, and preservation of lean mass; these improvements in combination therapy versus
individual inhibition of either ligand alone suggests activin A and B may be operating through
different pathways to confer similar effects, or that the two ligands may modulate the activities
of one another. These observations warrant further investigation into the dynamics of actin A
and B signaling in relation to one another, in particular regard to muscle metabolism which was
unfortunately beyond the scope of the work performed here. Overall, neutralization of either or
both ligands showed promising liver protective and anti-fibrotic activity in our pre-clinical model
of liver fibrosis.
4.4 Conclusions
Tissue injury and the resulting acute inflammatory response is an essential stimuli for the
initiation and progression of fibrosis encountered during chronic liver disease. Using an
immune-mediated model of acute liver inflammation, we were able to characterize resulting liver
damage and impairments to liver function following insult and how activin A and B are
modulated during this initial response. We provided mechanistic insights into activin A and B
activity in the context of acute inflammation by neutralization via antibody in our concanavalin
A model, and demonstrated the protective effects of inhibition of these ligands. Finally, we
showed how activin A and B neutralization inhibited liver injury, improved liver function, and
reduced fibrosis in a chronic model of CCl4-induced liver fibrosis and explored mechanistically
how neutralizing activins conferred these benefits. Our data taken together suggest activin A and
B as important players during not only initial inflammatory response, but also during chronic,
sustained inflammation and fibrogenesis in the liver and show the therapeutic potential of
targeting of these ligands in chronic liver disease and fibrosis.

67
REFERENCES
1. Friedman, S. L. Liver fibrosis -- from bench to bedside. J. Hepatol. 38 Suppl 1, S38-53
(2003).
2. Sanyal, A. J. Novel therapeutic targets for steatohepatitis. Clin. Res. Hepatol.
Gastroenterol. 39, S46–S50 (2015).
3. Dechêne, A. et al. Acute liver failure is associated with elevated liver stiffness and hepatic
stellate cell activation. Hepatology 52, 1008–1016 (2010).
4. Pellicoro, A., Ramachandran, P., Iredale, J. P. & Fallowfield, J. A. Liver fibrosis and
repair: immune regulation of wound healing in a solid organ. Nat. Rev. Immunol. 14, 181–
194 (2014).
5. Bataller, R. & Brenner, D. A. Liver fibrosis. J. Clin. Invest. 115, 209–218 (2005).
6. LAROSA, D. & ORANGE, J. 1. Lymphocytes. J. Allergy Clin. Immunol. 121, S364–S369
(2008).
7. Butcher, E. C. & Picker, L. J. Lymphocyte homing and homeostasis. Science 272, 60–6
(1996).
8. Fazilleau, N., McHeyzer-Williams, L. J., Rosen, H. & McHeyzer-Williams, M. G. The
function of follicular helper T cells is regulated by the strength of T cell antigen receptor
binding. Nat. Immunol. 10, 375–84 (2009).
9. Holt, A. P., Salmon, M., Buckley, C. D. & Adams, D. H. Immune interactions in hepatic
fibrosis. Clin. Liver Dis. 12, 861–82, x (2008).
68
10. Melhem, A. et al. Anti-fibrotic activity of NK cells in experimental liver injury through
killing of activated HSC. J. Hepatol. 45, 60–71 (2006).
11. Friedman, S. Cytokines and Fibrogenesis. Semin. Liver Dis. 19, 129–140 (1999).
12. Sandler, N. G., Mentink-Kane, M. M., Cheever, A. W. & Wynn, T. A. Global gene
expression profiles during acute pathogen-induced pulmonary inflammation reveal
divergent roles for Th1 and Th2 responses in tissue repair. J. Immunol. 171, 3655–67
(2003).
13. Martinez, F. O. & Gordon, S. The M1 and M2 paradigm of macrophage activation: time
for reassessment. F1000Prime Rep. 6, 13 (2014).
14. Mosser, D. M. & Edwards, J. P. Exploring the full spectrum of macrophage activation.
Nat. Rev. Immunol. 8, 958–969 (2008).
15. Shetty, S., Lalor, P. F. & Adams, D. H. Lymphocyte recruitment to the liver: molecular
insights into the pathogenesis of liver injury and hepatitis. Toxicology 254, 136–46 (2008).
16. Safadi, R. et al. Immune stimulation of hepatic fibrogenesis by CD8 cells and attenuation
by transgenic interleukin-10 from hepatocytes. Gastroenterology 127, 870–82 (2004).
17. Novobrantseva, T. I. et al. Attenuated liver fibrosis in the absence of B cells. J. Clin.
Invest. 115, 3072–3082 (2005).
18. Romagnani, S. T-cell subsets (Th1 versus Th2). Ann. Allergy, Asthma Immunol. 85, 9–21
(2000).

69
19. Chiaramonte, M. G. et al. IL-13 is a key regulatory cytokine for Th2 cell-mediated
pulmonary granuloma formation and IgE responses induced by Schistosoma mansoni
eggs. J. Immunol. 162, 920–30 (1999).
20. Chiaramonte, M. G., Donaldson, D. D., Cheever, A. W. & Wynn, T. A. An IL-13 inhibitor
blocks the development of hepatic fibrosis during a T-helper type 2–dominated
inflammatory response. J. Clin. Invest. 104, 777–785 (1999).
21. McGaha, T. L. & Bona, C. A. Role of profibrogenic cytokines secreted by T cells in
fibrotic processes in scleroderma. Autoimmun. Rev. 1, 174–81 (2002).
22. Rodgarkia-Dara, C. et al. The activin axis in liver biology and disease. Mutat. Res. Mutat.
Res. 613, 123–137 (2006).
23. Schmierer, B. & Hill, C. S. TGFβ–SMAD signal transduction: molecular specificity and
functional flexibility. Nat. Rev. Mol. Cell Biol. 8, 970–982 (2007).
24. Thompson, T. B., Woodruff, T. K. & Jardetzky, T. S. Structures of an ActRIIB:activin A
complex reveal a novel binding mode for TGF-beta ligand:receptor interactions. EMBO J.
22, 1555–66 (2003).
25. Massagué, J., Blain, S. W. & Lo, R. S. TGFbeta signaling in growth control, cancer, and
heritable disorders. Cell 103, 295–309 (2000).
26. Tsuchida, K. et al. Activin isoforms signal through type I receptor serine/threonine kinase
ALK7. Mol. Cell. Endocrinol. 220, 59–65 (2004).

70
27. Doré, J. J. E. et al. Mechanisms of Transforming Growth Factor-β Receptor Endocytosis
and Intracellular Sorting Differ between Fibroblasts and Epithelial Cells. Mol. Biol. Cell
12, 675–684 (2001).
28. Runyan, C. E., Schnaper, H. W. & Poncelet, A.-C. The role of internalization in
transforming growth factor beta1-induced Smad2 association with Smad anchor for
receptor activation (SARA) and Smad2-dependent signaling in human mesangial cells. J.
Biol. Chem. 280, 8300–8 (2005).
29. Moustakas, A. Smad signalling network. J. Cell Sci. 115, 3355–6 (2002).
30. Souchelnytskyi, S., Rönnstrand, L., Heldin, C. H. & ten Dijke, P. Phosphorylation of
Smad signaling proteins by receptor serine/threonine kinases. Methods Mol. Biol. 124,
107–20 (2001).
31. Harrison, C. A. et al. An Activin Mutant with Disrupted ALK4 Binding Blocks Signaling
via Type II Receptors. J. Biol. Chem. 279, 28036–28044 (2004).
32. Wang, S.-Y. et al. Inhibitory effect of activin A on activation of lipopolysaccharide-
stimulated mouse macrophage RAW264.7 cells. Cytokine 42, 85–91 (2008).
33. Ogawa, K., Funaba, M., Chen, Y. & Tsujimoto, M. Activin A functions as a Th2 cytokine
in the promotion of the alternative activation of macrophages. J. Immunol. 177, 6787–94
(2006).
34. Gold, E. J. et al. βA- and βC-activin, follistatin, activin receptor mRNA and βC-activin
peptide expression during rat liver regeneration. J. Mol. Endocrinol. 34, 505–515 (2005).

71
35. Wang, D.-H. et al. Role of activin A in carbon tetrachloride-induced acute liver injury.
World J. Gastroenterol. 19, 3802 (2013).
36. Gold, E. J. et al. Changes in activin and activin receptor subunit expression in rat liver
during the development of CCl4-induced cirrhosis. Mol. Cell. Endocrinol. 201, 143–53
(2003).
37. Zhang, H. et al. Adenovirus‑mediated knockdown of activin A receptor type�2A
attenuates immune‑induced hepatic fibrosis in mice and inhibits interleukin‑17‑induced
activation of primary hepatic stellate cells. Int. J. Mol. Med. 42, 279–289 (2018).
38. Yndestad, A. et al. A Complex Role of Activin A in Non-Alcoholic Fatty Liver Disease.
Am. J. Gastroenterol. 104, 2196–2205 (2009).
39. Namwanje, M. & Brown, C. W. Activins and Inhibins: Roles in Development,
Physiology, and Disease. Cold Spring Harb. Perspect. Biol. 8, a021881 (2016).
40. Vejda, S. et al. Expression and dimerization of the rat activin subunits betaC and betaE:
evidence for the ormation of novel activin dimers. J. Mol. Endocrinol. 28, 137–48 (2002).
41. De Bleser, P. J., Niki, T., Xu, G., Rogiers, V. & Geerts, A. Localization and cellular
sources of activins in normal and fibrotic rat liver. Hepatology 26, 905–912 (1997).
42. Kreidl, E., Oztürk, D., Metzner, T., Berger, W. & Grusch, M. Activins and follistatins:
Emerging roles in liver physiology and cancer. World J. Hepatol. 1, 17 (2009).
43. Heymann, F., Hamesch, K., Weiskirchen, R. & Tacke, F. The concanavalin A model of
acute hepatitis in mice. Lab. Anim. 49, 12–20 (2015).

72
44. Kobayashi, T., Niimi, S., Fukuoka, M. & Hayakawa, T. Regulation of inhibin beta chains
and follistatin mRNA levels during rat hepatocyte growth induced by the peroxisome
proliferator di-n-butyl phthalate. Biol. Pharm. Bull. 25, 1214–6 (2002).
45. Kanamori, Y. et al. Regulation of hepcidin expression by inflammation-induced activin B.
Sci. Rep. 6, 38702 (2016).
46. Wang, H.-X. et al. Immune mechanisms of Concanavalin A model of autoimmune
hepatitis. World J. Gastroenterol. 18, 119–25 (2012).
47. Erhardt, A., Biburger, M., Papadopoulos, T. & Tiegs, G. IL-10, regulatory T cells, and
Kupffer cells mediate tolerance in concanavalin A-induced liver injury in mice.
Hepatology 45, 475–485 (2007).
48. Jones, K. L. et al. Activin A is a critical component of the inflammatory response, and its
binding protein, follistatin, reduces mortality in endotoxemia. Proc. Natl. Acad. Sci. U. S.
A. 104, 16239–44 (2007).
49. Krueger, A., Fas, S. C., Baumann, S. & Krammer, P. H. The role of CD95 in the
regulation of peripheral T-cell apoptosis. Immunol. Rev. 193, 58–69 (2003).
50. Brunner, T. et al. Cell-autonomous Fas (CD95)/Fas-ligand interaction mediates activation-
induced apoptosis in T-cell hybridomas. Nature 373, 441–444 (1995).
51. Brenner, D., Krammer, P. H. & Arnold, R. Concepts of activated T cell death. Crit. Rev.
Oncol. Hematol. 66, 52–64 (2008).

73
52. Yaden, B. C. et al. Inhibition of Activin A Ameliorates Skeletal Muscle Injury and
Rescues Contractile Properties by Inducing Efficient Remodeling in Female Mice. Am. J.
Pathol. 184, 1152–1166 (2014).
53. Mee Yang, Y. & Seki, E. TNFα in liver fibrosis. doi:10.1007/s40139-015-0093-z
54. Canbay, A. et al. Kupffer cell engulfment of apoptotic bodies stimulates death ligand and
cytokine expression. Hepatology 38, 1188–1198 (2003).
55. Connolly, M. K. et al. In liver fibrosis, dendritic cells govern hepatic inflammation in
mice via TNF-α. J. Clin. Invest. 119, 3213–25 (2009).
56. Chu, P. et al. C-C motif chemokine receptor 9 positive macrophages activate hepatic
stellate cells and promote liver fibrosis in mice. Hepatology 58, 337–350 (2013).
57. Liao, W., Lin, J.-X. & Leonard, W. J. IL-2 family cytokines: new insights into the
complex roles of IL-2 as a broad regulator of T helper cell differentiation. Curr. Opin.
Immunol. 23, 598–604 (2011).
58. Bachmann, M. F. & Oxenius, A. Interleukin 2: from immunostimulation to
immunoregulation and back again. EMBO Rep. 8, 1142–8 (2007).
59. Weng, S.-Y. et al. IL-4 Receptor Alpha Signaling through Macrophages Differentially
Regulates Liver Fibrosis Progression and Reversal. EBioMedicine 29, 92–103 (2018).
60. Kalafateli, M., Konstantakis, C., Thomopoulos, K. & Triantos, C. Impact of muscle
wasting on survival in patients with liver cirrhosis. World J. Gastroenterol. 21, 7357–61
(2015).
74
61. Stepniak, E. et al. c-Jun/AP-1 controls liver regeneration by repressing p53/p21 and p38
MAPK activity. Genes Dev. 20, 2306–2314 (2006).
62. Amanzada, A. et al. Myeloperoxidase and elastase are only expressed by neutrophils in
normal and in inflamed liver. Histochem. Cell Biol. 135, 305–15 (2011).
63. Mack, M. Inflammation and fibrosis. Matrix Biol. 68–69, 106–121 (2018).
64. Rani, R., Tandon, A., Wang, J., Kumar, S. & Gandhi, C. R. Stellate Cells Orchestrate
Concanavalin A–Induced Acute Liver Damage. Am. J. Pathol. 187, 2008–2019 (2017).
65. Kudo, H. et al. Lipopolysaccharide triggered TNF-α-induced hepatocyte apoptosis in a
murine non-alcoholic steatohepatitis model. J. Hepatol. 51, 168–175 (2009).
66. Romagnani, S. Th1/Th2 cells. Inflamm. Bowel Dis. 5, 285–94 (1999).
67. Nikolic-Paterson, D. J., Wang, S. & Lan, H. Y. Macrophages promote renal fibrosis
through direct and indirect mechanisms. Kidney Int. Suppl. 4, 34–38 (2014).
68. Braga, T. T., Agudelo, J. S. H. & Camara, N. O. S. Macrophages During the Fibrotic
Process: M2 as Friend and Foe. Front. Immunol. 6, 602 (2015).
69. Ebeid, H. M., Gibriel, A. A. Y., AL-Sayed, H. M. A., Elbehairy, S. A. & Motawe, E. H.
Hepatoprotective and Antioxidant Effects of Wheat, Carrot, and Mango as Nutraceutical
Agents against CCl 4 -Induced Hepatocellular Toxicity. J. Am. Coll. Nutr. 34, 228–231
(2015).
70. Su, S.-B. et al. Mechanisms of CCl 4-induced liver fibrosis with combined transcriptomic
and proteomic analysis. J Toxicol. Sci. 41, 561-72 (2016).

75
71. Kubota, N. et al. A high-fat diet and multiple administration of carbon tetrachloride
induces liver injury and pathological features associated with non-alcoholic steatohepatitis
in mice. Clin. Exp. Pharmacol. Physiol. 40, 422–430 (2013).