Embed Size (px)
Citation preview

Coll. Antropol. 38 (2014) Suppl. 1: ???–???Professional paper
The Role of the Map in a Crisis ManagementEnvironment: Applying the Theory of Carto-graphic Communication and Visualization
Ana Kuve`di} Divjak and Miljenko Lapaine
Faculty of Geodesy, University of Zagreb, Zagreb, Croatia
A B S T R A C T
Recent crisis situations have revealed various insufficiencies in existing technologies and policies for effective crisis
management. In the field of cartography, these have highlighted the lack of guidelines, standards and symbols to design
maps specially adapted for communication in crisis management – particularly from the cartographer’s perspective. Our
intent here is to examine the concept and value of cartographic communication model in the specific environment of cri-
sis management. Based on the definition of cartographic communication and visualization, an attempt is made to dis-
tinguish the roles of crisis management maps, in order to differentiate between situations in which crisis participants
use them as means of communication, and those in which they serve as tools to assist visual thought processes. On the se-
lected cartographic examples, we aim to show that the successful cartographic displays have a defined structure, and
that it is necessary to take into account the principles of cartographic design in order to achieve the effective communica-
tion of information.
Key words: cartography, crisis management, cartographic communication, geovisualization
Introduction
The expression, »A picture is worth a thousand words«can be applied to cartography in the sense that complexinformation can be effectively displayed and communi-cated by a single picture, i.e. a map. However, there is in-creasing awareness that the expression is over-general-ised in terms of the visual, graphic communication ofinformation, data or knowledge, i.e. when there is a needto explain complex spatial information quickly and clear-ly – which is the case with crisis management maps. Ex-perience has shown that a great number of pictures,graphic displays and maps are unable to communicate in-formation effectively. Instead, the interpretation of par-ticular maps can turn into a very demanding process.
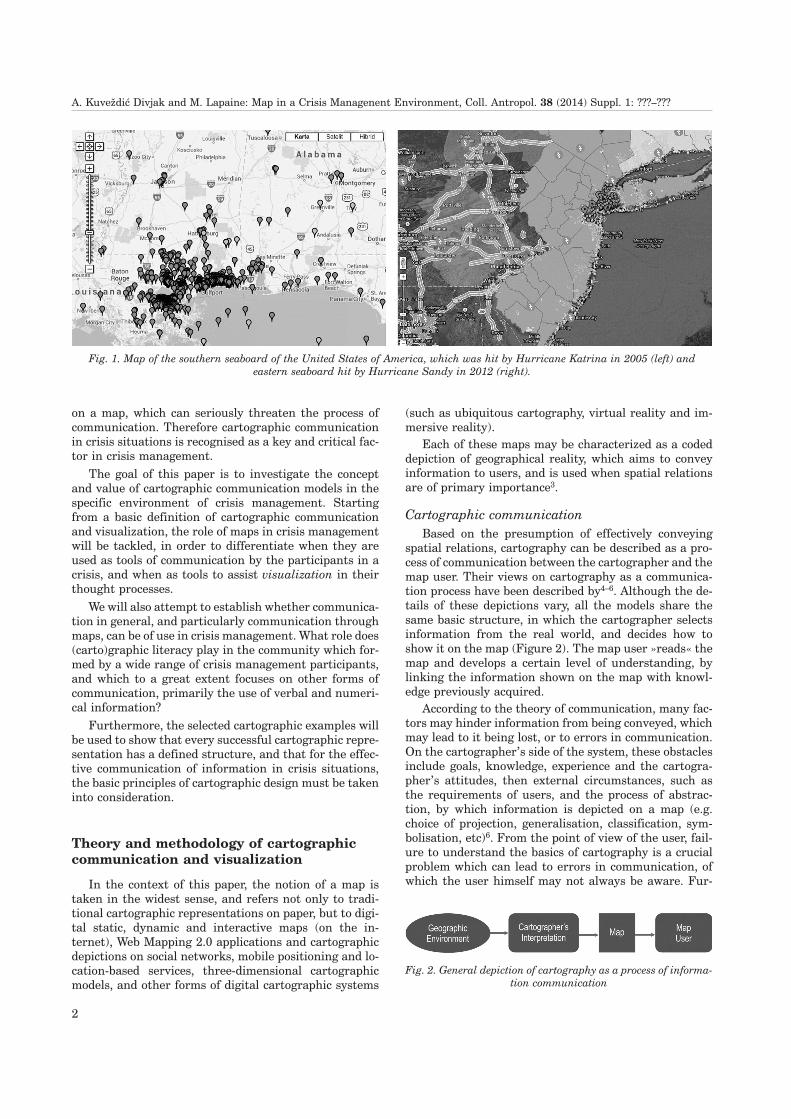
Figure 1 (left) shows an example of a map of thesouthern seaboard of the United States of America,which was hit by Hurricane Katrina at the end of August20051, while on the Figure 1 (right), the eastern seaboardhit by Hurricane Sandy in October 2012 is shown2. Bothmaps are intended for people who want to share or dis-cover information about the particular places affected bythe hurricanes, in order to gain an insight into the conse-
quences caused. Although both examples illustrate cor-rect spatial depictions of areas affected by hurricanes,they are also hopelessly overloaded cartographic repre-sentation, which fail to communicate spatial informationeffectively.
Unfortunately, many maps specially made for commu-nication and intervention in a crisis situations revealedthe fact that there are difficulties in maps produced andused by crisis communities – particularly from the car-tographer’s point of view. Whether traditional papermaps or digital, interactive maps, in many cases the roleof maps in communicating spatial information fails bad-ly.
The limits, demands and challenges of cartographiccommunication intended specifically for crisis manage-ment have not yet been systematically considered andapplied in the process of creating maps specially adaptedfor communication and intervention in a crisis. Ignoringthis approach may lead (and leads) to reduced legibilityand wrong interpretation of the information displayed
1
Received for publication November 29, 2013
on a map, which can seriously threaten the process ofcommunication. Therefore cartographic communicationin crisis situations is recognised as a key and critical fac-tor in crisis management.
The goal of this paper is to investigate the conceptand value of cartographic communication models in thespecific environment of crisis management. Startingfrom a basic definition of cartographic communicationand visualization, the role of maps in crisis managementwill be tackled, in order to differentiate when they areused as tools of communication by the participants in acrisis, and when as tools to assist visualization in theirthought processes.
We will also attempt to establish whether communica-tion in general, and particularly communication throughmaps, can be of use in crisis management. What role does(carto)graphic literacy play in the community which for-med by a wide range of crisis management participants,and which to a great extent focuses on other forms ofcommunication, primarily the use of verbal and numeri-cal information?
Furthermore, the selected cartographic examples willbe used to show that every successful cartographic repre-sentation has a defined structure, and that for the effec-tive communication of information in crisis situations,the basic principles of cartographic design must be takeninto consideration.
Theory and methodology of cartographiccommunication and visualization
In the context of this paper, the notion of a map istaken in the widest sense, and refers not only to tradi-tional cartographic representations on paper, but to digi-tal static, dynamic and interactive maps (on the in-ternet), Web Mapping 2.0 applications and cartographicdepictions on social networks, mobile positioning and lo-cation-based services, three-dimensional cartographicmodels, and other forms of digital cartographic systems
(such as ubiquitous cartography, virtual reality and im-mersive reality).
Each of these maps may be characterized as a codeddepiction of geographical reality, which aims to conveyinformation to users, and is used when spatial relationsare of primary importance3.
Cartographic communication
Based on the presumption of effectively conveyingspatial relations, cartography can be described as a pro-cess of communication between the cartographer and themap user. Their views on cartography as a communica-tion process have been described by4–6. Although the de-tails of these depictions vary, all the models share thesame basic structure, in which the cartographer selectsinformation from the real world, and decides how toshow it on the map (Figure 2). The map user »reads« themap and develops a certain level of understanding, bylinking the information shown on the map with knowl-edge previously acquired.
According to the theory of communication, many fac-tors may hinder information from being conveyed, whichmay lead to it being lost, or to errors in communication.On the cartographer’s side of the system, these obstaclesinclude goals, knowledge, experience and the cartogra-pher’s attitudes, then external circumstances, such asthe requirements of users, and the process of abstrac-tion, by which information is depicted on a map (e.g.choice of projection, generalisation, classification, sym-bolisation, etc)6. From the point of view of the user, fail-ure to understand the basics of cartography is a crucialproblem which can lead to errors in communication, ofwhich the user himself may not always be aware. Fur-
A. Kuve`di} Divjak and M. Lapaine: Map in a Crisis Managenent Environment, Coll. Antropol. 38 (2014) Suppl. 1: ???–???
2
Fig. 1. Map of the southern seaboard of the United States of America, which was hit by Hurricane Katrina in 2005 (left) and
eastern seaboard hit by Hurricane Sandy in 2012 (right).
Fig. 2. General depiction of cartography as a process of informa-
tion communication

ther potential obstacles may be the perceptual and cogni-tive abilities of the user, his understanding of symbol sys-tems (e.g. his education and previous knowledge of inter-preting symbols on maps), his goals, attitudes, timeavailable, intelligence, previous knowledge and preju-dices (Figure 3).
Cartographic visualization
As a result of constant changes and rapid develop-ments in technology in the area of cartography andgeoinformation systems, the cartographer’s view of theworld, as depicted by a model of cartographic communi-cation, is slowly losing its significance. By the mid-1990s,cartographers were realigning their research from themodel of cartographic communication to the concept ofcartographic visualization7, describing visualization asthe visual analysis of a map8. Given this definition, mapswhich were originally intended as serving the process ofcommunication could be seen as serving the visualizationof spatial information.
In order to make sense of linking visualization andcartography, we need to emphasise that visualization,like communication, does not only relate to makingmaps, but also using them. Since the communication ap-proach has dominated cartography for almost two de-cades, it was only to be expected that any attempt to ap-proach the area of visualization (facilitated by maps)would need to consider how it was linked to communica-tion (via map).
MacEachren6 defines visualization within the frame-work of map use, rather than in terms of map produc-
tion, or research approaches to cartography (Figure 4).The basic idea of MacEachren’s model of visualization isthat map use can be depicted as a three-dimensionalspace. This space is defined by using three continuums,units which are infinitely divisible (e.g. according to clas-sic physics, space and time):• the first relates to map use, which may vary from per-
sonal (in which an individual creates a map adjusted tohis own needs) to public (in which a previously pro-duced map is placed at the disposal of the wider public)
• the second shows map use focusing on discovering theunknown (in which the user may begin with the gen-eral goal of looking for »something interesting«), as op-posed to using a map which shows something known(when the user attempts to access precisely deter-mined spatial information)
• the third relates to use in which a high level of interac-tion may be achieved between the map and user (theuser can interact the map himself, e.g. effecting achange in a particular map being viewed, quicklyswitching among many available maps, overlap, com-bine or join maps, etc.), as opposed to a low level of in-teraction (the user has limited possibilities of alteringmap depictions).
We need to emphasise something which is not clearlyevident from the model of geovisualization depicted inFigure 4, and that is that MacEachren does not considerresearch on cartographic communication less worthy orimportant. As we have already explained, some maps areproduced with the goal of communicating a particularmessage. In his model, McEachren indicates that the lineseparating visualization and communication is indis-tinct, and even more, is less and less clearly expressed.Communication is an integral part of any way a map isused, even if visualization is the main goal6. Accordingly,even the most banal map intended for communicationcan serve as a means for mental visualization.
A. Kuve`di} Divjak and M. Lapaine: Map in a Crisis Managenent Environment, Coll. Antropol. 38 (2014) Suppl. 1: ???–??
3
Fig. 3. View of cartography as a process of graphic communica-
tion, according to 6.
Fig. 4. Cartography depicted as map-use space, with emphasis
on relationship between visualization and communication,
according to 6.

The roles of maps in crisis management
Since crises, emergencies and catastrophes are alwaysaccompanied by space and time components, there is astrong awareness of the importance of maps in the com-munity formed by those involved in crisis management.Given this fact, and also the wide range of uses ofgeoinformation systems, in the last two decades, thenumber of maps produced for crisis management hasgrown considerably. This has been confirmed by re-search9 illustrating the huge diversity in cartographic so-lutions produced to support decision-making in crisismanagement. The research analysed selected cartogra-phic examples (risk maps and planning and preparednessmaps, crisis intervention and evacuation maps, damageassessment maps) which have emerged under the influ-ence of various innovative technologies, such as the in-ternet, multimedia and telecommunications services.
Based on this research, it can be concluded that crisismanagement maps have been given two important roles:
(1) during or immediately after a crisis, they serve allparticipants in the crisis as means of communication, but
(2) in the phases before and after a crisis occurs, theyalso serve to assist their visual thought processes.
The diversity of ways in which maps are used in crisismanagements is best illustrated with the help of Mac-Eachren’s model of the »space« of map use (see Figure 4).In this model, there are no clearly defined boundaries formap use; however, there are extreme situations whichare easily recognisable.
Following MacEachren’s model, we have listed in Ta-ble 1 eight extreme ways in which maps are used in crisis
management. Figure 4 shows that the tip of the cubemarking the point at which the discovery of unknown in-formation, and the high level of interaction between theuser and the map in the private domain meet, definescartographic visualization (upper left field in Table 1).The tip of the cube marking the point at which the depic-tion of known information and the low level of interac-tion between the person and the map in the public do-main meet, defines cartographic communication (lowerright field in Table 1).
The design principles according to which they are pro-duced also affect these differences in the role of maps incrisis management. Therefore cartographers today usedifferent visualization methods to depict objects and phe-nomena, in order to adapt maps to the specific tasks anddemands of individual phases of crisis management.
For example, hazard maps and risk assessment mapsare used in the period before a crisis occurs, when pre-ventive measures are carried out with the aim of reduc-ing the likelihood of the crisis occurring, or alleviatingpotential damage. The basic task of such maps is tospread awareness and information about the hazardswhich may be caused by a potential crisis in a certainarea. Following the crisis, hazard assessment maps areusually produced, showing the affected area. These mapsare important in planning activities to be undertakenwith the aim of returning the affected area to its originalcondition.
On the other hand, during or immediately after theoccurrence of a crisis, intervention maps are used. Mes-sages exchanged via intervention maps by people respon-sible for action in a crisis play an important role in crisis
A. Kuve`di} Divjak and M. Lapaine: Map in a Crisis Managenent Environment, Coll. Antropol. 38 (2014) Suppl. 1: ???–???
4
TABLE 1EXAMPLE OF EIGHT EXTREME MAP USES, DEFINED ACCORDING TO MACEACHERN´S MODEL OF GEOVISUALIZATION,
ADAPTED TO CRISIS MANAGEMENT
High level of interaction Low level of interaction
Discovering the unknown Presenting the known Discovering the unknown Presenting the known
Personaluse
A geophysicist depicts theresults of field measure-ments on a map, but indoing so alters the bound-aries of the classes of mea-surement data, by analys-ing how the results obtai-ned affect the occurrenceof natural disasters (e.g.earthquakes) in an ob-served area.
He uses an interactive in-terface which allows rapidexamination of a collectionof different thematic maps(e.g. geological, traffic,noise, etc.), and how theymay be overlapped, com-bined and joined, to showthe effect of traffic on theenvironment.
A member of the protec-tion and rescue servicesdraws an earthquake haz-ard zone on a topographicmap, in order to find outbuilding density in partic-ular zones and assess theextent of potential conse-quences.
A fireman draws by handfire access paths and wa-ter sources on a topogra-phic map.
Publicuse
Organised, interactive, si-mulation exercise on theinternet with different cri-sis event scenarios (e.g.fire, flood or terrorist at-tack) in which expertsfrom various crisis actionservices participate simul-taneously.
A meteorologist shows thewidening fronts of a de-structive hurricane on aweather forecast chart,warning the public of po-tential dangers.
A dynamic, photographi-cally realistic three-dimen-sional visualization of aspreading flood wave ba-sed on assessed data isshown to the public, withthe aim of spreading awa-reness among those wholive and work in areas un-der threat.
Maps with positions mar-ked »You Are Here« show-ing exits in case of crisesare made available to thewider public in public in-stitutions (e.g. schools,shopping centres, etc.).

management. They are a source of information for allparticipants in the crisis and help respond to the crisissituation and mitigate the consequences. Since carto-graphic communication via intervention maps takes placein the unique environment exposed to risk and signifi-cant losses, the pressure of time and stress, the cartogra-pher faces a huge challenge in finding the right proce-dures and methods for communicating spatial informa-tion effectively on such maps.
However, although there are cases in which it hasbeen demonstrated that cartography can successfullysupport the phases before and after the occurrence of acrisis, providing various methods for adapting map rep-resentations to the needs of users, by various methods ofcartographic visualization, examples of recent crises ha-ve shown that the experts who are developing crisis man-agement systems often overlook a cartographic princi-ples developed over centuries, which rest on usabilityand perception, and concentrate exclusively on the tech-nical aspects of such systems10,11. In other words, theythink their task is over when the information is displa-yed on the screen. Although the importance and strengthof analytical cartography is often achieved in such sys-tems, there is still a need for good, appropriate design.
Examples of effective cartographic commu-nication in crisis situations
In most cases, including the production of crisis man-agement maps, the phase of designing the visually gra-phic elements of the map is crucial, and forms a criticalpart of cartographic communication. It concerns creativemethods which are individual to each cartographer, inwhich he subjectively adds or removes, suppresses orhighlights certain characteristics of objects shown on themap. Although there are rules and principles on how tocreate an effective map, they are often rather vague andundefined, due to the fact that the same problem can bedepicted on the map in many different ways.
The principles of cartographic design differ from therules. In »classic« cartographic textbooks, e.g.12–14, vari-ous principles are listed, which take into account the eye,brain and understanding the core problem, in order tocreate a successful link between cartography and visual-ization. These principles relate for example to respectingthe guidelines for minimum size for text and symbols onmaps, graphic density (the number of objects shown onthe map), precision of location, placing of toponyms, etc.All these contribute to the process of designing the map,but cannot guarantee a good outcome.
The Design Group of the British Cartographic Society,at its working session at the University of Glasgow (Brit-ish Cartographic Society, 1999), stated that the rules ofcartographic design can be learnt, but the principlesneed to be acquired. »Map concept before production«,
»hierarchy in connection with harmony« (the larger, themore visible, and what is more important, more notice-able), »sacrifice for the sake of simplicity« (map contentdetermines scale, or scale determines content, where
each determines the level of generalisation (sacrifice),»engage the emotions to encourage understanding« (onlyby feeling yourself what the user feels can you see whatthe user will see) – these are just some examples of howwidely these principles may be defined. On the otherhand, these principles give a good idea of how cartogra-phy can be used in the communication process, if usedproperly.
The following examples show two different maps, spe-cially adapted for communication in crisis situations.Both maps use several different means for depicting com-plex information, with the aim of avoiding overloadingthe map, cognitively speaking.Both examples implementbasic cartographic methods, based on conventional gra-phic variables (such as size, colour hue, pattern, colourvalue, direction and shape), which are applied to design-ing cartographic symbols. By presenting these examples,an attempt is made to demonstrate the different ways ofcommunicating spatial information.
The European-Mediterranean Seismic Hazard Map
The map in Figure 5 shows seismic hazard zones inthe European/Mediterranean region, in terms of peakground acceleration with a 10% chance of being exceededin 50 years for stiff soil condition15.
A simple map, with a shaded relief and the adminis-trative borders of the countries along with their capitalcities, was selected as the basis for producing and usingthe main content of this thematic map. The thematic in-formation about earthquake hazard was divided intothree classes (low, medium and high) and depicted on themap by using shades of green, yellow and red which cor-responded to the statistic variables measured. The choiceof colours was in line with the intuitive visual colour lan-guage which is more or less universal. The overall im-pression of the map is that it is clear and visually easy toread. The user is not confused by unnecessary additionalinformation, and so can concentrate on the message con-veyed. Of course, not all cartographic depictions can becreated with such simplicity; however, it is evident that amessage can be conveyed clearly and directly if the depic-tion is not overloaded with information.
Interactive cartographic information system for
visualization and communication of natural
hazards data and associated uncertainties
The interactive cartographic information system forvisualization and communication of communication ofnatural hazards data and associated uncertainties wasselected as a successful example of multidimensional,complex cartographic visualization, with an interactivefunction (Figure 6). The system is intended for experts innatural disasters, providing support in decision-making16.
The main advantages of the interactive system arethe simple, permanent access to data via the internet andfunctionality. The interactive functions provide help inthe selection of data which is of interest, and in choosingand adapting means of visualization. The cartographicdepictions in 2D and 2.5D are carefully designed so as to
A. Kuve`di} Divjak and M. Lapaine: Map in a Crisis Managenent Environment, Coll. Antropol. 38 (2014) Suppl. 1: ???–??
5

facilitate communication and interpretation of complexdata sets. Apart from multivariational groups of data re-garding natural hazards, produced on the basis of assess-ment, the system shown also provides methods for visu-alising potential hazards.
Figure 6 shows the graphic user interface system witha selected map in 2D view. The map shows a thematiclayer with data on maximum air pressure, along with the
corresponding standard deviation. The effect of air pres-sure is categorised in five classes, and shown in variousshades of blue. Standard deviations of maximum airpressure are shown in a cartodiagram in an additionallayer, in which the size of the red circle corresponds tothe level of standard deviation. The selection of individ-ual cartographic symbols creates a new space containingthe exact values of the results estimated, along with in-
A. Kuve`di} Divjak and M. Lapaine: Map in a Crisis Managenent Environment, Coll. Antropol. 38 (2014) Suppl. 1: ???–???
6
Fig. 6. Graphical user interface of the interactive cartographic information system for visualization and communication of
natural hazards data and associated uncertainties.
Fig. 5. European-Mediterranean seismic hazard map, produced by European Seismological Commission in 2003, section.

formation available on data uncertainty. This functionfacilitates the analysis of the data shown, given that thegeneralised cartographic depiction, on which it is possi-ble to distinguish only a limited number of classes, iscompleted by data which are given at the highest avail-able level of spatial resolution.
Conclusion
This paper investigates the concept and value of mod-els of cartographic communication and visualization inthe specific environment of crisis management. By meansof a theoretical basis of these models, the differences inthe principles used to create the maps are emphasised, asthey play a primary role in facilitating the conveyance ofknowledge, or communication between the small num-ber of people who produce the maps and the large num-ber of users (as is the case with intervention maps for cri-
sis management), in contrast to maps whose primaryrole is to help individuals or larger groups of people tothink spatially (as is the case with maps used before andafter crisis events).
The selected cartographic examples show that cartog-raphy can support the effective communication of spatialinformation in crisis situations – if used correctly. Thesuccess of communication depends, among other things,on the cartographer – his communication skills, the prin-ciples of cartographic design he has mastered, and therules he has learnt. On the other hand, the user must becapable of understanding and interpreting the symbolsshown on the map in terms of their actual significance.
Therefore cartographic literacy is recognised as avaluable tool which, if correctly applied to crisis manage-ment maps, can have a powerful influence on moderncommunications within the crisis management commu-nity.
R E F E R E N C E S
1. HURRICANE INFORMATION MAPS, accessed 15.3.2013. Avail-able from: URL: www.gregstoll.dyndns.org/scipionus/. — 2. SUPER-STORM SANDY INFORMATION MAP, accessed 15.3.2013. Availablefrom: URL: www.google.org/crisismap/2012-sandy. — 3. FRAN^ULA N,LAPAINE M, (Eds) Geodetsko-geoinformati~ki rje~nik (Dr`avna geodet-ska uprava, Zagreb, 2008). — 4. KOLÁ^NY A, Cartogr J, 6 (1969) 47. —5. BOARD C, Cartographica, 18 (1972) 42. — 6. MACEACHREN AM,How Maps Work: Representation, Visualization and Design (Guilford,New York, 1995). — 7. MONTELLO DR, Cartography and Geographic In-formation Science, 29 (2002) 283. — 8. KITCHIN R, PERKINS C,DODGE M, Thinking about maps. In: DODGE M, KITCHIN R and PER-KINS C (Eds) Rethinking Maps (Routledge, London, 2009). — 9. KU-VE@DI] DIVJAK A, @UPAN R, LAPAINE M, Kartografija u slu`bi ranogupozoravanja i upravljanja u kriznim situacijama. In: Proceedings (4thinternational conference »Crisis Management Days«, Ivan Toth (Ed),
Velika Gorica, 2011). — 10. VAN OOSTEROM P, ZLATANOVA S, FEN-DEL EM (Eds), Geo-information for Disaster Management (Springer--Verlag, Berlin, 2005). — 11. KONE~NÝ M, ZLATANOVA S, BANDROVATL, (Eds), Geographic Information and Cartography for Risk and CrisisManagement; Towards Better Solutions (Springer-Verlag, Beriln, 2010).— 12. LOVRI] P, Op}a kartografija (Sveu~ili{na naklada Liber, Zagreb,1988). — 13. BERTIN J, Sémiologie graphique (Paris, Gauthier-Villars,1967). (English translation of the original: Semiology of graphics, WJBerg (translator), University of Wisconsin Press, Madison, 2010). — 14.ROBINSON AH, MORRISON JL, MUEHRCKE PC, KIMERLING AJ,GUPTILL SC, Elements of Cartography (Sixth edition, John Wiley &Sons, Inc., New York, 1995). — 15. EUROPEAN-MEDITERRANEANSEISMIC HAZARD MAP, accessed 15.3.2013. Available from: URL: www.preventionweb.net. — 16. KUNZ M, HURNI L, Cartogr J, 48 (2011) 60.
A. Kuve`di} Divjak
Faculty of Geodesy, University of Zagreb, Ka~i}eva 26, 10000 Zagreb, Croatia
e-mail: [email protected]
ULOGA KARTE U ZAJEDNICI KRIZNOG UPRAVLJANJA: PRIMJENA TEORIJE KARTOGRAFSKEKOMUNIKACIJE
S A @ E T A K
Nedavne krizne situacije otkrile su mnoge nedostatke u postoje}im tehnologijama i politikama za u~inkovito kriznoupravljanje. Na podru~ju kartografije ukazale su na nedostatak smjernica, standarda i kartografskih znakova za obli-kovanje karata posebno prilago|enih komunikaciji u kriznom upravljanju – pogotovo iz perspective kartografa. Ciljrada je ispitati koncept i vrijednost modela kartografske komunikacije u specifi~noj okolini kriznog upravljanja. Naosnovu definicija kartografske komunikacije i vizualizacije nastoji se uvidjeti uloga karte u upravljanju krizom kako bise razlu~ilo kada ona sudionicima krize slu`i kao sredstvo za komunikaciju, a kada kao sredstvo za pomo} njihovomvizualnom procesu mi{ljenja. Na odabranim kartografskim primjerima nastoji se pokazati da svaki uspje{an karto-grafski prikaz ima odre|enu strukturu, te da za u~inkovito komuniciranje informacija treba uzeti u obzir osnovnana~ela kartografskog oblikovanja.
A. Kuve`di} Divjak and M. Lapaine: Map in a Crisis Managenent Environment, Coll. Antropol. 38 (2014) Suppl. 1: ???–??
7