Embed Size (px)
Citation preview

The Role of the Discount Rate in Investment and
Employment Decisions
Stig Vinther Møller and Richard Priestley∗
Abstract
We show that a decrease (increase) in the discount rate predicts both higher
(lower) investment and employment growth in the short run. In the long run, we
observe the opposite pattern. These novel findings are consonant with dynamic
models of investment and employment. The predictability by the discount rate is
substantial making it a key source of business cycle fluctuations. The patterns of
predictability are consistent with differences in the adjustment costs between invest-
ment and employment. They are also consistent with differences in the adjustment
costs of hiring and firing and the adjustment costs of increasing and decreasing
investment.
JEL Classification: E22; G12; J01
Keywords: discount rates; investment growth; employment growth; adjustment
costs.
∗Stig V. Møller is at CREATES, Aarhus University. Send correspondence to Richard Priestley,Department of Finance, BI Norwegian Business School, Nydalsveien 37, N-0444 Oslo, Norway; telephone:+47 46 410 515; e-mail: [email protected]. This paper was earlier titled: The Role of DiscountRates in Investment and Employment Growth.

1 Introduction
Predictions from standard models of investment and employment fail to capture move-
ments in actual investment and employment growth. For example, Tobin’s (1969) Q
model of investment that predicts an increase (decrease) in investment when the discount
rate falls (rises) fails in the data. Similarly, the search and matching model of Mortensen
and Pissarides (1994) which has dominated research in labor markets cannot explain
fluctuations in employment through its main component of productivity.
Production based models of asset prices that involve frictions in the form of adjustment
costs offer an alternative mechanism to help explain both investment and employment
growth. Lettau and Ludvigson (2002) derive a dynamic model that relates the discount
rate to long run investment growth. Chen and Zhang (2011) derive a dynamic model
that relates the discount rate to both short and long term employment growth. In these
models, if the discount rate varies, firms’investment and employment decisions should
be affected in the long run in the opposite direction to that of the short run. While
both of these models provide novel and interesting insights, unfortunately, the empirical
evidence to support both models is limited so far. Lettau and Ludvigson (2002) find some
evidence of a long run role for the discount rate in investment growth. Chen and Zhang
(2011) find some evidence of a short run role for the discount rate on employment growth.
However, these effects disappear when controlling for standard macroeconomic variables.
Furthermore, both Lettau and Ludvigson (2002) and Chen and Zhang (2011) ignore
how adjustment costs of investment and labor could impact on how the size and sign of
discount rate movements affect investment and employment growth. It still remains a
puzzle why discount rate variation today, which appears to be substantial in the data and
the major component of a firm’s cost of capital, has no discernible affect on employment
or investment decisions of corporate managers.
In this paper, exploiting new insights into how to measure discount rate variation and
taking into account adjustment costs of investment and employment in our analysis, we
show for the first time that short-run and long-run implications of the Lettau and Ludvig-
son (2002) and Chen and Zhang (2011) dynamic models of investment and employment
are confirmed in the data. In the short run, both investment and employment growth
increase when the discount rate falls and decrease when the discount rate rises. In the
long run, as predicted by the dynamic models, we find the opposite pattern. The impact
of the discount rate is substantial, both economically and statistically. This suggests that
corporate managers respond rationally to variations in their firm’s cost of capital when
2

making investment and employment decisions. In turn, this indicates that discount rate
variation can have a major impact on business cycle fluctuations.
We also provide novel evidence that the reaction of firms to whether the discount rate
increases or decreases is consistent with differences in adjustment costs of investment
and employment. First, we find that employment growth is more sensitive to short run
changes in the discount rate than investment growth, suggesting that the adjustment costs
of employment are lower than those of investment. Second, employment growth reacts in
the short run to both large and small changes in the discount rate but investment growth
reacts only to large changes also suggesting that the adjustment costs of investment are
higher than the adjustment costs of employment. Third, an increase in the discount rate
has a larger short run impact on employment growth than a decrease in the discount rate.
This suggests that the adjustment costs of firing are lower than those of hiring. Fourth,
large decreases in the discount rate have only a marginal impact in the short run on
increasing investment, whereas a large increase in the discount rate has a big impact
on decreasing investment growth. This suggests that adjustment costs of increasing
investment are higher than those of reducing investment.
The crucial element in assessing the ability of production based models to explain
investment and employment dynamics is to be able to accurately measure discount rate
variation over the business cycle. Research on stock return predictability, which is the
main source for understanding if discount rates vary, has produced mixed results.1 How-
ever, in a recent paper, Atanasov, Møller, and Priestley (2019) derive a new consumption
based predictor variable, cyclical consumption (cc), that is consistent with Campbell and
Cochrane’s (1999) habit based model that features time variation in risk aversion. The
empirical results in Atanasov, Møller, and Priestley (2019) document substantial discount
rate variation in both good and bad economic times, over short and long horizons, and is
stable across time. This opens up the possibility of more accurately testing the produc-
tion based model’s predictions about the impact of discount rate variation on investment
and employment, which in turn leads to a better understanding of how the discount rate
affects business cycle fluctuations.
Using this new predictor of the discount rate, we show that there is strong evidence
of both short run and long run predictability that is consistent with dynamic models of
1Goyal and Welch (2007) show that a long list of predictor variables are inconsistent and poor pre-dictors of stock returns. Rapach, Strauss, and Zhou (2010), Henkel, Martin, and Nardari (2011), Dangland Halling (2012), and Golez and Koudijs (2018) find that popular predictor variables can only forecaststock returns in bad times, whereas there is essentially no evidence of predictability in good times, thatis, during business cycle expansions.
3

investment and hiring. We find that a decrease (increase) in the discount rate predicts
higher (lower) investment and labour growth in the short run as well as predicting lower
(higher) investment and labour growth in the long run. We record an R2of 0.06 at
the one quarter horizon for investment growth rising monotonically to 0.33 at the five
year horizon. For labour growth we record an R2of 0.12 at the one quarter horizon
suggesting that labour reacts more strongly to discount rate changes than investment in
the short run. At the five year horizon the R2is 0.26. The economic impact of discount
rate movements on investment and labour growth are substantial with a one standard
deviation movement in the discount rate leading to a change in investment of 1.7% per
annum and a change in employment of 0.5% per annum.
The findings are robust to how we derive discount rate movements. For example, we
find similar results if we use predictive regressions with direct proxies for the discount
rate or if we generate discount rate news using Campbell’s (1991) decomposition of un-
expected returns from the present value model (see Campbell and Vuolteenaho (2004)).
The decomposition of unexpected returns has the advantage of also allowing us to com-
pare the impact of cash flow news (future profitability) on employment and investment
decisions. Investment growth is affected in the short run by news about both discount
rates and cash flows. Employment growth is affected only by news about discount rates.
A central feature of the dynamic models of investment and employment is that there
are adjustment costs of increasing and decreasing investment and employment. There
are various types of adjustment costs. Non-convex adjustment costs mean that firms
only invest and hire when business conditions are suffi ciently good and only fire and
disinvest when they are suffi ciently bad. So with these types of costs, there is an inaction
period which will be determined in part by the size of the discount rate movement. The
implication of this is that the discount rate might have to change by a suffi ciently large
amount if there is to be an impact on employment and investment rates. The inaction
area is the real option value of waiting that is greater than the returns from investment
and hiring. This is typical of disaggregated investment where investment spikes might be
observed. Convex adjustment costs give a smooth investment series typically observed in
the aggregate data.
There are also adjustment costs that are based om partial irreversibilities. In the
employment models the partial irreversibilities are due to hiring, training and firing costs
and can be measured as a fraction of the wage. In investment models, partial irreversibil-
ities arise from resale losses due to transaction costs, the market for lemons, fire sales,
and the physical costs of resale. When firms make new investment and hiring, this gives
4

rise to fixed disruption costs where both new capital and labour will entail a disruption
in production as they are installed which can be measured as a fixed cost loss of output.
The fixed costs of hiring can come from advertising, interviewing and training. The fixed
costs of investment could be that production is halted. Cooper and Haltiwanger (2006)
find that a model which mixes both convex and non-convex adjustment costs fits the data
best.
Bloom (2009) finds moderate non-convex labour adjustment costs and substantial non-
convex adjustment costs of investment at the firm level. That is, the adjustment costs
of investment are higher than those of employment. However, the costs can also differ
between decisions to increase or decrease investment and hiring. While there are search
costs and training costs and loss of output when making hires, the job market is more
flexible in terminating employment and does not impose such large adjustment costs.
Also there is evidence of discrete adjustment that is consistent with fixed adjustment
costs (see Varejão and Portugal (2007)) and in this case, discount rate changes would
have to be large enough to warrant a change in employment. There is also empirical
evidence at the firm level that large temporary uncertainty shocks measured through
stock market volatility lead to substantial changes in hiring and investment rates in the
short run (Bloom (2009)). Nickell (1986) and Bloom (2009) estimate hiring adjustment
costs like recruitment processes, training and redundancy payments to be around 10 to
20 percent of annual wages.
Since the discount rate is undoubtedly correlated with aggregate uncertainty, large
discount rate changes may need to be observed in order to trigger investment and em-
ployment changes.
Clearly, the adjustment costs of investment and disinvestment can be different because
disinvestment costs can be high or some investment could be irreversible which would lead
to the scenario that an increase in the discount rate will not necessarily see a decrease
in investment. However, it is diffi cult to test for these effects directly using aggregate
data for investment since it is always positive. At the aggregate level investment growth
can decrease because there is less investment, depreciation, and disinvestment. We are
likely to observe in the aggregate data that firms postpone or cut back on investment,
such that the level of investment falls. This is likely to have lower adjustment costs than
those adjustment costs associated with increasing investment. We might expect that an
increase in the discount rate has a larger effect on reducing investment because at the
aggregate level this requires firms simply cutting back on investment which has likely low
adjustment costs, as compared to a decrease in the discount rate which should lead to an
5

increase in investment in the short run, but in the presence of adjustment costs. With
aggregate employment data the situation is different in that a fall in employment growth
is associated with a decrease in the number of people employed and hence is associated
with firing.
Given these various adjustment costs and our focus on aggregate data, it might be
conceivable that i) discount rate variation has a stronger impact on employment than
investment decisions, ii) firms react stronger to larger changes in the discount rate, and
iii) firms react differently if those large changes are increases or decreases in the discount
rate. We present results consistent with all three predictions. Specifically, we present
results that for investment growth, small changes in the discount rate have no forecasting
power for investment growth. In contrast, small changes in the discount rate do forecast
employment growth in the short run. Why this happens for labour and not investment is
probably due to the fact that adjustment costs of labour are smaller than for investment
and hence employment reacts to smaller changes in the discount rate than investment
because the marginal cost of a new hiring is lower than the marginal cost of a new
investment. We also find that a large change in the discount rate does forecast short
term investment and employment. Both a fall and a rise in the discount rate forecast
employment growth where a rise in the discount rate has a much bigger impact than a
fall suggesting the adjustment costs of firing are lower than those of hiring. A rise in the
discount rate forecasts a decrease in investment growth whereas a fall in the discount rate
has only a small impact on increasing investment growth. This suggests that postponing
investment, which is what a fall in the growth rate of investment represents, has lower
adjustment cost that increasing investment.
Our paper is clearly related to Lettau and Ludvigson (2002) and Chen and Zhang
(2011). However, we make several important contribution over and above these papers.
First, Lettau and Ludvigson (2002) only find evidence in support of a long term impact
of the discount rate, as measured by the consumption to wealth ratio, cay, on investment
growth. We show that cay is not a stable predictor of stocks returns and hence may not
uncover the dynamics between discount rates and investment adequately. Furthermore,
Lettau and Ludvigson (2002) ignore how adjustment costs of investment might impact
on how the discount rate affects investment.
Chen and Zhang (2011) also find no evidence of a short run effect of the discount rate
on employment growth when including macroeconomic controls. Although the dividend
price ratio can predict long run employment growth, any additional predictability in the
long run as measured by the adjusted R2seems to be driven by overlapping observations.
6

Chen and Zhang (2011) also ignore the potential for adjustment costs of labor to affect
the impact of discount rates on employment decisions.
Overall the extant literature, whilst presenting interesting theoretical insights, has
failed to provide empirical support foe these insights. By more accurately measuring
discount rate movements and taking adjustment costs into account, our findings present
a much richer picture of the role of the discount rate on investment an employment
decisions that are consistent with theoretical insights that predict both short term and
opposite long term effects of the discount rate on investment and employment growth.
Our paper is also related to Hall (2017) who looks at the role of discount rates on
unemployment. The argument here is that a high discount rate will reduce the job value to
the owners of the firm through its affect on the present value of productivity. Job value
and the present value of wages move together but not in proportion because of sticky
wages, so wages fall less than productivity and job value. Therefore, unemployment will
increase as firms reduce the workforce when the discount rate increases. Simulations of
the model show that an increase in the discount rate has a large immediate impact on
unemployment before returning to its normal level. Hall relies on the dividend price ratio
to measure discount rates in his model. This leads to a potential weakness in that the
dividend price ratio is a weak predictor of the stock market return and hence the discount
rate especially at short horizons. Furthermore, Hall’s work relies on simulations and does
not confront the data on unemployment directly with discount rate movements. But it
is interesting to note that Hall’s model predicts that an increase in the discount rate
today should have an impact on employment in the short run. There are no long run
implications of Hall’s model. Our paper will focus both on the short run and long run
impact of the discount rate.
The rest of the paper is organized as follows. The next section presents the dynamic
models of investment and employment and their testable predictions. Section 3 presents
the data and motivates why cyclical consumption is an appropriate proxy for captur-
ing time-variation in discount rates. Section 4 presents empirical evidence on short-run
and long-run predictability of investment and employment growth. Section 5 contains
robustness checks. Section 6 concludes.
2 Dynamic Models of Investment and Employment
The single period investment model of Tobin predicts that a decrease (increase) in the
discount rate leads to an increase (decrease) in investment. Exactly when in the data this
7

should be observed is uncertain because it depends on whether there is time to build or
plan. The problem with Tobin’s model is that there appears to be little support for the
empirical predictions. Abel and Blanchard (1986) find that it is marginal profitability
that drives investment and not the discount rate. This is a puzzling finding since the
discount rate is the source of a firm’s cost of capital and it would imply that managers
do not respond to changes in it. Lamont (2000) finds that investment plans can forecast
both aggregate investment and stock returns at short horizons with a lag attributed to
time to build/plan. However, this evidence of the role between discount rates and short
term investment is rather indirect. Lettau and Ludvigson (2002) find no evidence that
investment growth is predictable by the discount rate at short horizons.
In models of employment growth such a Mortensen and Pissarides (1994) risk premi-
ums and hence the discount rate are constant and consequently there are no implications
about the short run or long run predictability of employment growth by the discount
rate.
In this section of the paper, we discuss the insights from both Lettau and Ludvigson
(2002) and Chen and Zhang (2011) that outline the role that the discount rate can have
on future investment and employment decisions in a dynamic setting that includes both
the short and long run.
2.1 Investment
Lettau and Ludvigson (2002) derive a novel insight into the role of the discount rate on
long run investment growth which predicts that a fall (rise) in the discount rate today
leads to a fall (rise) in long run investment. The intuition is as follows: if the discount
rate falls today stock prices rise, the cost of capital declines and, hence, according to
Tobin’s model investment should start to rise. Their insight is that going forward, the
decrease in the discount rate today leads to future lower stock returns which eventually
will drive down prices in the future. As a result of this the cost of capital will start to
rise and consequently future investment growth will actually fall in the long run. Thus,
a fall (rise) in the discount rate today implies a fall (rise) in investment in the long run.
To see the details of how this multi-period model works, we follow Lettau and Lud-
vigson (2002) who derive the following expression for the natural log of Tobin’s Q, qt:
qt ≈ Et
[ ∞∑j=0
ρjq[(
1− ρq)mt+1+j − rit+1+j + φt+j
]], (1)
8

where qt is expressed as a first order function of expected marginal profits, mt+1+j, and
expected future investment returns, rit+1+j. φt+j contains variance and covariance terms
along with linearization constants, and ρq = 1/ (1 + exp (m− q)). The discount rate is
embodied in the investment returns, rit+1+j. It is clear that a fall in future discount rates
through rit+1+j increases qt and with convex adjustment costs it follows that investment
increases.
Lettau and Ludvigson (2002) then use the Campbell and Shiller (1988) decomposition
of stock prices to show that qt ≈ pt:
pt ≈ Et
[ ∞∑j=0
ρjp[(
1− ρp)dt+1+j − rst+1+j
]], (2)
where pt is the current stock prices, dt+1+j is the expected future dividend, rst+1+j is the
future expected stock return, and ρp = 1/(1 + exp
(d− p
)). Comparing equations (1)
and (2) it follows that pt ≈ qt where the difference is simply due to the discount rate
being embodied in investment returns in equation (1) and embodied in stock returns in
equation (2). Cochrane (1991) shows that aggregate stock returns are equal to aggregate
investment returns and provides empirical support for this. Liu, Whited, and Zhang
(2009) provide evidence that stock returns are equal to investment returns at the portfolio
level. Therefore, given that rst+1+j = rit+1+j, we are able to assert that both pt and qtdepend on expected stock returns.
To see how observable predictor variables have been related to expected returns, note
that from the stock return predictability literature, the Campbell and Shiller decompo-
sition is written as:
dt − pt ≈ Et
[ ∞∑j=0
ρjp [rst+1+j −∆dt+1+j]
], (3)
and the dividend price ratio dpt ≡ dt − pt is shown to predict long horizon returns.
Lettau and Ludvigson (2002) note that theQ theory implies the following for expected
investment returns:
Etrit+1 ≈ ρqEt∆qt +(1− ρq
)Et [mt+1 − qt] + φt+j (4)
9
and given that rst+1+j = rit+1+j, we can substitute (4) into (3):
dt − pt ≈ Et
[ ∞∑j=0
ρjp[ρq∆qt+1+j +
(1− ρq
)[mt+1+j − qt+j] + φt+j −∆dt+1+j
]]. (5)
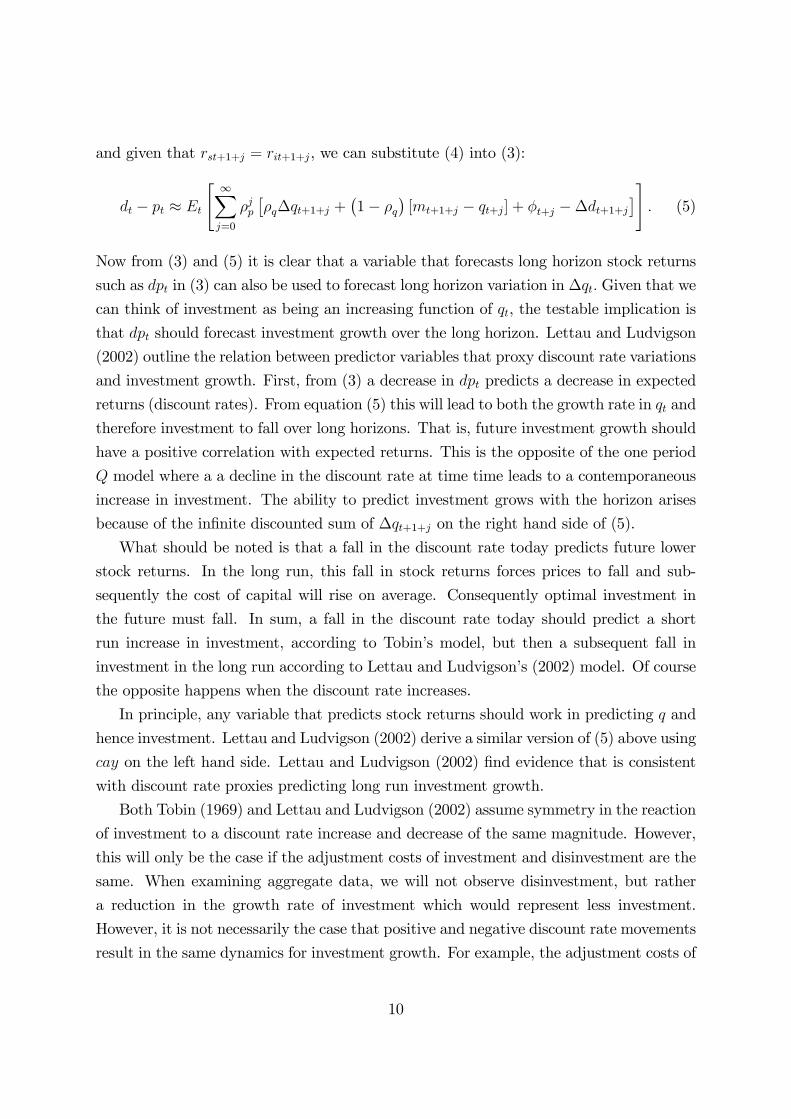
Now from (3) and (5) it is clear that a variable that forecasts long horizon stock returns
such as dpt in (3) can also be used to forecast long horizon variation in ∆qt. Given that we
can think of investment as being an increasing function of qt, the testable implication is
that dpt should forecast investment growth over the long horizon. Lettau and Ludvigson
(2002) outline the relation between predictor variables that proxy discount rate variations
and investment growth. First, from (3) a decrease in dpt predicts a decrease in expected
returns (discount rates). From equation (5) this will lead to both the growth rate in qt and
therefore investment to fall over long horizons. That is, future investment growth should
have a positive correlation with expected returns. This is the opposite of the one period
Q model where a a decline in the discount rate at time time leads to a contemporaneous
increase in investment. The ability to predict investment grows with the horizon arises
because of the infinite discounted sum of ∆qt+1+j on the right hand side of (5).
What should be noted is that a fall in the discount rate today predicts future lower
stock returns. In the long run, this fall in stock returns forces prices to fall and sub-
sequently the cost of capital will rise on average. Consequently optimal investment in
the future must fall. In sum, a fall in the discount rate today should predict a short
run increase in investment, according to Tobin’s model, but then a subsequent fall in
investment in the long run according to Lettau and Ludvigson’s (2002) model. Of course
the opposite happens when the discount rate increases.
In principle, any variable that predicts stock returns should work in predicting q and
hence investment. Lettau and Ludvigson (2002) derive a similar version of (5) above using
cay on the left hand side. Lettau and Ludvigson (2002) find evidence that is consistent
with discount rate proxies predicting long run investment growth.
Both Tobin (1969) and Lettau and Ludvigson (2002) assume symmetry in the reaction
of investment to a discount rate increase and decrease of the same magnitude. However,
this will only be the case if the adjustment costs of investment and disinvestment are the
same. When examining aggregate data, we will not observe disinvestment, but rather
a reduction in the growth rate of investment which would represent less investment.
However, it is not necessarily the case that positive and negative discount rate movements
result in the same dynamics for investment growth. For example, the adjustment costs of
10

undertaking new investments are likely to be greater than those of postponing or slowing
down the rate of investment. Furthermore, because these costs are likely to be different,
it is unlikely that investment growth reacts symmetrically to large and small movements
in the discount rate. The reason for this is that when costs are low it is more profitable
to change investment quickly, but if these costs are high, firms might wait to investment
until a change in the discount rate is large enough to offset the adjustment costs. We
investigate these possibilities in the empirical analysis.
We test the hypothesis of predictable investment growth from discount rate variation
by using a predictive regression of the form:
∆it+h = it+h − it = a0 + a1Zt + vt+h (6)
where ∆it+h = it+h − it is h-period ahead log growth in investment, Zt is a discount rateproxy, and vt+h is the error term.
2.2 Employment
Chen and Zhang (2011) derive a novel dynamic model of employment growth. The
intuition underlying their insight is the same and that of Lettau and Ludvigson (2002)
in that a fall in the discount rate at the beginning of period t, which is accompanied by
a rise in stock prices, leads to an increase in the marginal benefit of hiring and hence
should increase actual hiring. With a one-period lag in planning, the employment stock
increases at the beginning of period t+ 1, implying that a discount rate drop today will
lead to a short-run increase in employment growth. The increase in stock price and fall
in the discount rate at the beginning of period t implies that returns will fall on average
during period t, which means that the stock price will drop at the beginning of period
t + 1, and so will the level of hiring. Time-to-build effects again imply that the actual
employment stock will drop only at the beginning of period t+ 2. Based on this, a fall in
the discount rate today should forecast a short run change in employment with a negative
slope and a long run change in employment with a positive slope.
To see this in detail, we follow Chen and Zhang (2011) who base their testable hy-
potheses about predictable employment growth on the work of Yashiv (2000) and Merz
and Yashiv (2007) that brings search and matching models of employment into an ex-
pression for firm value. The first step here is to define the adjustment costs of hiring as
11

quadratic: (a2
)(λtJtNt
)2Nt (7)
where a > 0, Nt is total employment, Jt represents job vacancies, and λt is the probability
that a vacancy will be filled. Given separation rates, s, happen at a constant rate between
zero and one, the stock of employment evolves according to
Nt+1 = (1− s)Nt + λtJt. (8)
This is important since it embodies a one period time-to-build since hiring at time t, λtJtonly delivers new productive workers at time t+ 1.
Hiring costs are rising and convex in the number of hires and falling in the stock of
workers. The motivation for this specification is that the costs of searching and screening
for new workers and training them increases with the numbers that need hiring.
Assuming that the firm decides on the number of workers in order to maximize the
discounted present value of future cash flows, the return to hiring is given as the ratio of
the marginal benefit of hiring to the marginal cost of hiring:
RHt+1 =f(Xt+1)−Wt+1 +
(a2
) (Nt+2Nt+1
)2−(a2
)(1− s)2
a(Nt+1Nt
)− a (1− s)
(9)
where Xt is a productivity shock and Wt is the wage rate. Cochrane (1991) outlines
conditions for when the return from hiring is equivalent to the stock market return.
This requires constant returns to scale (see also Liu, Whited, and Zhang (2009)). So
replacing RHt+1 with the stock market return, which embodies the discount rate, provides
a number of testable hypothesis about employment growth and discount rates (expected
stock returns) that are the same as those regarding investment growth and discount
rates. In particular, an increase in the discount rate at time t should forecast first lower
employment growth(Nt+1Nt
)and subsequently higher employment growth
(Nt+2Nt+1
).
Chen and Zhang (2011) identify the dividend price ratio and Lettau and Ludvigson’s
(2001) cay-ratio as good predictors of the equity premium and hence good proxies for the
discount rate. The remaining predictor variables, the relative t-bill rate, the term spread
and the default spread do not predict the equity premium. Turning to predicting employ-
ment growth, the dividend price ratio and cay have relatively little predictive power for
employment growth (see their Table 3). The relative t-bill rate does predict employment
12

growth in the way implied by the Chen and Zhang (2011) model. However, the long
run predictability is weak. The weak evidence of long run predictability is confirmed in
multivariate regressions using all predictor variables. Furthermore, when including a set
of macroeconomic control variables the short run predictability of employment growth
by discount rate proxies disappears altogether and across all horizons there is little evi-
dence that the discount rate predicts employment growth. In sum, variables that predict
stock returns do not predict employment growth. There is evidence at short horizons
that the relative t-bill rate predicts employment growth. However, no variables predict
employment growth after controlling for macroeconomic variables.
The lack of support for Chen and Zhang’s (2011) model is not necessarily due to the
fact that the discount rate does not predict employment growth in the novel way that
they describe. The results could be because of the way they measure the discount rate
and the way to look at employment growth dynamics in the face of adjustment costs.
Whilst the models of labour dynamics are constructed around a symmetric adjustment
costs, it is not necessarily the case that the costs of hiring are the same as the costs of
firing. Therefore, it is possible that large or small, or positive or negative, discount rate
movements do not result in the same dynamics for employment growth. If the costs of
firing are lower than the costs of hiring, then employment growth may react more to a
discount rate increase than a similar sized discount rate decrease. Furthermore, because
the costs of hiring and firing are likely to be different, it is not necessarily the case that
employment growth reacts symmetrically to large and small movements in the discount
rate. The reason for this is that in the presence of high adjustment costs employment
is only likely to change after relatively large changes in the discount rate. With low
adjustment costs, such as firing, employment growth may change after relatively small
changes in the discount rate.
We can test the basic idea of whether the discount rate predicts future employment
growth with the following regression:
∆et+h = et+h − et = a0 + a1Zt + ut+h (10)
where ∆et+h = et+h − et is h-period ahead log growth in employment, Zt is a discount
rate proxy, and ut+h is the error term.
13

3 Data
Data on investment is private nonresidential investment (seasonally adjusted and inflation
adjusted). Data on employment is nonfarm payrolls (seasonally adjusted). We calculate
the growth rate of the natural log of investment and employment. All data are sampled
quarterly from the first quarter of 1954 to the fourth quarter of 2017.
Following the findings in Atanasov, Møller and Priestley (2020), as the main proxy
to track movements in the discount rate, we extract cyclical consumption fluctuations
using aggregate seasonally adjusted consumption expenditures on nondurables from the
National Income and Product Accounts Table 7.1 available from the Bureau of Economic
Analysis. The data are quarterly, in real per capita terms, and measured in 2009 chain
weighted dollars. We use the simple and robust detrending method of Hamilton (2018) to
extract the cyclical component of consumption. Following Hamilton’s linear projection
procedure, we regress the log of real per capita consumption, ct, on a constant and four
lagged values of consumption as of date t− k:
ct = b0 + b1ct−k + b2ct−k−1 + b3ct−k−2 + b4ct−k−3 + ωt, (11)
where the regression error, ωt, is our measure of cyclical consumption cct at time t:
cct = ct − b̂0 − b̂1ct−k − b̂2ct−k−1 − b̂3ct−k−2 − b̂4ct−k−3. (12)
Since cct is computed based on a one-sided filter, any finding that it predicts the future
values of another variable should represent true predictive ability rather than an artifact
of the way consumption is detrended. In addition, this detrending procedure ensures
that the cyclical component is stationary and consistently estimated for a wide range of
nonstationary processes (Hamilton, 2018).
Calculating the cyclical component of consumption using the Hamilton procedure re-
quires a choice of k in equation (11). With the purpose of capturing a slowly time-varying
risk premium and hence the discount rate, Atanasov, Møller, and Priestley (2019) show
that a choice of a six-year horizon in the detrending filter is consistent with implications
of the Campbell and Cochrane (1999) external habit formation model. Figure 1 shows
a time series plot of cc computed from Equation (12) for k = 24 along with recession
dates as defined by the NBER. The figure illustrates that cc has a clear counter-cyclical
pattern. It increases during economic expansions and tends to reach its highest values
just prior to the outbreak of recessions and decreases during economic contractions and
14

tends to reach its lowest values near the bottom of recessions. Atanasov, Møller, and
Priestley (2019) show that these fluctuations in cyclical consumption constitute a more
accurate description of good and bad economic times than previously employed predic-
tor variables and cc is the most successful predictor of stock returns and hence contains
relevant information about future discount rates.
As a control, we also consider other predictors of aggregate stock returns which have
been used previously to predict investment growth and employment growth in Chen and
Zhang (2011) and Lettau and Ludvigson (2002). These are the log dividend-price ratio
(dp) which is the log of a 12-month moving sum of dividends paid on the S&P 500 index
minus the log of prices on the S&P 500 index; the term spread (tms) which is the long-
term yield on government bonds minus the Treasury bill rate; the default yield spread
(dfy) which is the difference between the BAA- and AAA-rated corporate bond yields;
the consumption-wealth ratio (cay) which is the residual from a cointegrating relation
between log consumption, log asset (nonhuman) wealth, and log labor income (Lettau
and Ludvigson (2001)); and the relative rate (rrel) which is three month t-bill rate minus
its one-year moving average.
There are also four traditional predictive variables of investment growth that are not
related to the discount rate, also used by Lettau and Ludvigson (2002) and Chen and
Zhang (2011). These are lagged investment growth (Di) or lagged employment growth
(De); corporate profit growth (Dprofit) given as the the growth rate in after tax profits;
growth in average Q (Dq) as constructed in Bernanke, Bohn, and Reiss (1988); and the
GDP growth rate (Dgdp). Data on these variables are available from the FRED database
of the St. Louis Federal Reserve Bank.
3.1 Predicting Stock Returns
Which variables are good proxies for the discount rate? To answer this, we need to
consider which variables are able to predict stocks returns. We consider a standard
predictive regression model for analyzing aggregate stock return predictability:
rt+h = α + βZt + εt+h, (13)
where Zt is a one-quarter lagged predictor variable,and rt+h is the h-quarter ahead log
excess return on the aggregate stock market. We measure rt+h as the h-quarter contin-
uously compounded log return on the S&P500 index less the corresponding h-quarter
continuously compounded log Treasury bill return. To test the significance of β, we use
15

heteroskedasticity and autocorrelation robust t-statistics of Newey and West (1987) with
h lags.
Panel A of Table 1 provides the results from univariate regressions given in equation
(13). It is clear that cc predicts returns at all horizons with a negative coeffi cient indi-
cating that in good times when consumption is above its trend, the discount rate falls.
In bad times when consumption falls relative to its trend the discount rate rises. The
economic impact of cc is large in that a fall in cc by one standard deviation below its
mean leads to a rise in the expected return of about 6 percentage points at an annual
rate. This suggests substantial discount rate variation. The estimate of the coeffi cient
at the one quarter horizon is strongly statistically significant and the associated R̄2 is
over 0.03. Thus, expected returns and therefore the discount rate are low when cyclical
consumption is high in good times and high when cyclical consumption is low in bad
times. The estimated coeffi cients are statistically significant at all horizons with the R̄2
rising to 0.44 at the twenty quarter horizon.2 These findings confirm those in Atanasov,
Møller, and Priestley (2019) that cc is a very good predictor of aggregate stock returns
and hence an excellent candidate to track discount rate movements.
The remainder of Table 1 reports univariate stock return predictability regressions
using the other predictor variables. The dividend price ratio, the default spread, and rrel
struggle to predict stock returns at any horizon when looking at the extent of statistical
significance and the R2. The term spread has more success, at least at horizons greater
than four quarters: an increasing term spread forecast higher stock returns and hence a
higher discount rate. However, the impact in terms of the R2is much lower than that
of cc. For example, at the four quarter horizon the R̄2 is 0.13 when predicting returns
with cc and only 0.05 with tms. These differences continue right to the twenty quarter
horizon where the R̄2 is 0.44 when predicting returns with cc and 0.17 with tms. Finally,
cay has predictive power for returns at all horizons, but to a much lower extent than
cc when comparing R2s. From the perspective of these univariate regressions, there is
strong evidence to suggest that cc is a much better proxy for discount rate movements
than previously used predictor variables.
Panel B reports a multivariate regression of returns on all of the predictor variables.
Only cc and cay retain statistical significance with the extent of the statistical significance
falling at shorter horizons for cay. Therefore, it seems that both cc and cay might act as
proxies for the discount rate. Before we conclude on this issue it is important to ascertain
if the predictor variables have stable predictive power over the sample period.
2The coeffi cient estimates remain statistically significant when bootstrapping the standard errors.
16

We show in Table 2 that cc is the only predictor variable that has the ability to
predict stock returns consistently and strongly in two equal sub-samples. Panel A of
Table 2 shows the results when predicting stock returns for the early sample period from
1954Q1 to 1984Q4. cc can predict returns at all horizons with similar statistical and
economic significance as in the full sample in Table 1. The same cannot be said of other
predictor variables. For example, the dividend price ratio can predict stock returns in
this early sample at short horizons, whereas in the full sample it could not predict returns
at any horizon. The term spread can predict only at the one and two quarter horizons in
this early sample, the opposite of the full sample. The default spread has no predictive
ability in this early sample, as in the full sample. The relative interest rate has predictive
ability at horizons of a year and less in the early sample, whereas in the full sample
there is only weak evidence of predictive ability at the longest horizons. cay has strong
predictive ability at all horizons for this early sample, as in the full sample.
Panel B of Table 2 reports results for the later sample of 1985Q1 to 2017Q4. cc retains
its strong statistical and economic ability to predict returns at all horizons. Thus, cc’s
ability to predict returns is inherently strong and stable through the two sub-periods
and the full sample. This is the only predictor variable that can make this claim. For
example, the dividend price ratio can predict returns in the later sample although, as
opposed to the early sample, the predictability now is stronger at longer horizons. Even
though there is some evidence of return predictability by the dividend price ratio it is
not consistent across horizons in these two samples, and it is not consistent with the
evidence from the full sample that the dividend price ratio cannot predict stock returns.
The term structure can predict returns at the one and two quarter horizon in the early
sub-sample, the opposite is true in the later sample where it can predict returns only
at longer horizons. The default spread has no predictive ability in the later sample,
consistent with the early sample and the full sample. Whilst the relative interest rate
could predict stock returns at horizons of one year and less in the early sample, it has no
predictive ability in the later sample. Finally, we find no ability of cay to predict returns
in the later sample, in contrast to the early sample. So, although cay can predict stock
returns over the full sample period, this seems to be driven by the strong predictability
cay has in the early sample because it is not able to predict returns in the later sample.3
In sum, cc is the only variable that has the ability to predict stock returns in a
consistent and strong way over the full sample and two sub-samples. Therefore, it is the
3We have tried estimating the cointegrating regression for cay separately for the two sub-samples,but this does not lead to any noticeable differences in the results.
17

most appropriate proxy for the discount rate to consider when examining investment and
employment growth predictability. Using cc as a proxy for discount rate movements in
predicting investment and employment growth could provide new insights into investment
and employment growth dynamics.
There is a further advantage to using cc in investment and employment growth re-
gressions in that we know that extant predictor variables are in many cases only able to
predict stock returns in bad times when the discount rate increases by large amounts,
often defined as economic recessions (see, for example, Rapach, Strauss, and Zhou (2010),
Henkel, Martin, and Nardari (2011), Dangl and Halling (2012), and Golez and Koudijs
(2018)). This means that they are unable to say anything about discount rates outside of
the very short periods of recessions. This is important since, as measured by the NBER
recession dating methodology, over the sample period used here, recessions constitute
only 40 out of 255 quarters, less than 20% of the sample period. Atanasov, Møller, and
Priestley (2019) show that this is not the case for cc which can predict stock returns when
discount rates rise (bad times) and fall (good times).
The ability of the discount rate proxy to predict returns in both good and bad times
could be particularly important for investment and employment growth predictability
since a fall in the discount rate in good times will constitute an important signal to
increase investment and employment in the short term and decrease them in the long
term. This cannot be captured with stock return predictor variables that have been used
in the extant literature because they cannot predict a fall in returns in good times and
hence a fall in the discount rate. In contrast, cc can predict stock returns in good and bad
times. Thus using cc in predicting employment and investment growth regressions could
provide new insights into the role of the discount rate in investment and employment
decisions.
4 Investment and Employment Growth Predictabil-
ity
The main empirical results that we report focus on the role of cc in predicting investment
and employment growth. The reason for this is that cc is the only variable that has a
stable role in predicting aggregate stock returns and hence is a good proxy for discount
rate fluctuations. Recall that in the short run a fall (rise) in the discount rate should
predict an increase (decrease) in both investment and employment growth. In the long
18

run a fall (rise) in the discount should predict a decrease (increase) in investment and
employment growth. Therefore, we should expect a positive coeffi cient on cc in the short
run because an increase in cc reflects good economic times with lower discount rates and
hence higher investment. In contrast, theory predicts we would expect to see a negative
coeffi cient estimate when we regress long horizon investment growth on cc.
Table 3 reports the results of investment growth predictability by cc and shows that
the estimated coeffi cients are negative at all horizons. However, the coeffi cients are not
statistically significant until the fourth quarter. The coeffi cient estimate at the four
quarters horizon is statistically significant but cc only has a minor impact with an R2
of 0.04. However, at horizons of eight quarters and longer the estimated coeffi cients are
highly statistically significant and the R2ranges from 0.12 at the eight quarter horizon to
0.32 at the twenty quarter horizon. At these horizons the negative coeffi cient estimates
indicate that an increase (decrease) in cc, which corresponds to a fall (rise) in the discount
rate, predicts investment to fall in the long run. As well as having a large impact in terms
of explanatory power, the economic impact is also large. For example, a one standard
deviation movement in the discount rate, which is 4.1%, leads to a change in investment,
based on the eight quarter horizon estimate of 1.7% per annum. This is a substantial
amount compared on the mean growth rate of investment of 4% per annum.
The results confirm that there is a strong support for the long run implications of the
dynamic model of investment. However, at short horizons, the estimated coeffi cient has
the wrong sign and, hence, we do not see an immediate or short run increase (decrease)
in investment given a decrease (increase) in the discount rate. Therefore, the short run
implication of the investment model is rejected.
Table 4 examines employment growth predictability. As in the case of investment
growth predictability, we find negative coeffi cient estimates at all horizons although the
estimates are very small and are not statistically significant at the one, two or four
quarter horizons. However, like in the case of investment growth, the economic impact
of cc starts at the eighth quarter. We find that whilst there are no short term effects,
there are statistically significant and economically large longer horizon effects at eight or
more quarters. The R2increases from 0.08 at the eight quarter horizon to 0.25 at the
twenty quarter horizon. The economic effect of a one standard deviation movement in
the discount rate is substantial with employment changing in response to this by 0.5%
per annum, which is a quarter of the mean annual growth rate of 2%.
In summary, using cc to proxy discount rate movements uncovers strong support for
the long run implications of investment and employment growth and this is stronger
19

than the evidence provided in the extant literature. However, consistent with the extant
literature, there is no evidence to support the short run predictions of the models.
4.1 Short and Long Run Dynamics
So far, we have found strong support for the long run predictions of the dynamic models
of both investment and employment growth. However, we have not found evidence to
support the short run predictions of the models of investment and employment that a
fall (rise) in the discount rate leads to an initial short run increase (fall) in investment or
employment. One potential reason for this is that the level of cc is a good indication of the
direction of discount rates over longer horizons, but it might be less useful in capturing
the short run relation between the discount rate and the growth rates of investment and
employment. For example, the level of cc today may be high and a decrease in cc in the
next period is an indication of a rise in the discount rate, however, the level of cc is still
relatively high. It might be more appropriate to use the change in cc to measure the
immediate direction of the discount rate. In light of this, we examine whether the change
in cc can predict investment and employment growth in the short run. Later, we also
derive news about discount rates from the Campbell (1991) decomposition of unexpected
returns and find very similar results.
In Table 5, we report the results from regressing investment growth on the change
in cc. Just as the investment model predicts, we find that an increase (decrease) in cc,
which is consistent with a lower (higher) discount rate, predicts an increase (decrease) in
investment at short horizons. The estimated coeffi cients are statistically significant from
one quarter to the four quarter horizon, suggesting that firms increase investment given
news of a fall in the discount rate. At the one quarter horizon a one standard deviation
movement in the change in cc, which is 1%, leads to a 2% change in investment growth.
As predicted by the dynamic model of investment behavior, the impact of a change in the
discount rate does not last long. For example at the eight quarter horizon, the coeffi cient
estimates are only marginally significant and the R2falls to 0.02. At longer horizons the
estimate approaches zero and the R2turns negative.
In the lower part of Table 5, we predict investment growth with both the change in
cc and its level. These predictive regressions should capture both short run and long run
dynamics of investment growth in response to the discount rate. We find that a fall (rise)
in the discount rate does increase (decrease) investment but only in the short run. At
the same time, the level of the discount rate does predict a fall in long run investment
20

to the same extent as it did when we only included the level of cc in the regressions.
Accordingly, this is the first paper that fully confirms the impact of discount rates on
investment growth in the short and long run in a way that is consistent with theoretical
models of dynamic investment behavior. At the one quarter horizon, the R2is 0.05 and
rises to 0.33 at the twenty quarter horizon. Including the change in the discount rate
does not affect the long run predictability of investment growth, but it does capture the
dynamics of investment growth in the short run, as well as the long run, in a way that is
consistent with the dynamic model of investment growth with capital adjustment costs.
Turning to the role of changes in the discount rate and its impact on employment
growth predictability in Table 6, we find a similar pattern to that of the dynamics for
investment growth when using the change in cc. At short horizons, we find that a fall
(rise) in the discount rate leads to an increase (decrease) in employment growth at the
one quarter to four quarter horizon and the slope coeffi cient drops substantially at the
eight quarter horizon and it is not statistically significant at all after eight quarters.
It is interesting to note that the effect on employment growth as measured by the R2
is strongest at the two quarter horizon and the predictability of employment growth is
stronger at the short horizon than that of investment growth. For example, the R2s are
0.12 and 0.11 at the one and two quarter horizons when predicting employment growth
and 0.05 and 0.07 for investment growth. The economic impact is substantial as a one
standard deviation movement in the change in cc leads to a movement in employment
growth of 0.9%, recall that the mean employment growth rate is 1.7% per annum. The
larger impact the change in cc has on employment growth compared to investment growth
could imply that the adjustment costs of employment are lower than those on investment
and this is what leads to a bigger short run impact of a change in the discount rate on
employment as compared to investment.
The lower part of Table 6 also includes the level of cc along with the change in cc.
In this case, we still find that the change in the discount rate can predict short run
employment growth in that a decrease (increase) in cc, which is indicative of an increase
(decrease) in the discount rate, predicts lower employment in the short run. We also find
that in the long run employment growth decreases (increases) when the discount rate falls
(rises) just as in Table 4 when only including cc. As in the case of investment growth, we
observe that employment growth reacts to the discount rate as the dynamic model of Chen
and Zhang (2011) predicts. The extent of predictability at longer horizons is comparable
between investment growth and employment growth but there is more predictability of
employment growth at shorter horizons suggesting that adjustment costs of labour are
21

smaller than those of investment.
4.2 The Size of Discount Rate Shocks
It may be possible to get a better indication of the role of the discount rate in the determi-
nation of investment and employment growth if we look at large relative to small changes
in the discount rate. The reason for this is that in the presence of adjustment costs it may
require the discount rate to rise or fall by a large amount for firms to find it profitable to
make changes to investment and employment levels. Furthermore, looking at how invest-
ment and employment growth changes when discount rate changes are small and large
might shed further light on the relative size of investment and employment adjustment
costs. That is, can we say something more about whether employment adjustment costs
are different to investment adjustment costs? In light of these possibilities, we need to
modify the predictive regressions.
Table 7 reports the results of regressing investment growth onto discount rate changes
when decomposing the discount rate into large changes, defined as those changes that
are greater than a one standard deviation change in cc in an absolute sense, and small
changes which are those less than a one standard deviation change in cc. Large changes
in the discount rate have a statistically significant estimated coeffi cient over the one to
the four quarter horizons. They also have a much larger impact on investment growth
than small changes which never have a statistically significant estimated coeffi cient. The
lower part of Table 7 shows that the inclusion of the level of cc confirms the long run
relation between investment growth and the discount rate. Note that the inclusion of the
level of cc has no effect on the short run dynamics captured by the change in cc for both
large and small changes. The finding that a discount rate change has to be large to lead
to a change in investment growth suggests that there are reasonably sized adjustment
costs of investment that prevent firms from investing when discount rates change by less
than one standard deviation from their mean.
Table 8 reports the results for regressing employment growth on to large and small
discount rate changes. We also find that large changes in the discount rate have substan-
tial forecasting power for one to four quarters and marginally so at eight quarters. Small
changes in the discount rate also have a statistically significant coeffi cient estimate at the
one quarter horizon and marginally so at other short horizons. The estimated coeffi cients
on the small change in cc are smaller than the estimated coeffi cients on large changes in
cc. Similar to the case of investment growth, the lower part of Table 8 shows that the
22

results are unaffected by the inclusion of the level of cc.
The findings regarding the size of the change in the discount rate suggest that the
adjustment costs of investment are larger than those of employment because employment
is affected by small changes in the discount rate whereas investment is not. It appears
that firms are more likely to adjust employment levels rather than investment levels when
discount rates changes are small.
4.3 Direction and Magnitude of Changes in the Discount Rate
We now consider the possibility that adjustment costs of investment could be different
from those of disinvestment and, similarly, the adjustment costs of hiring and firing could
be different. Dealing with aggregate investment data makes the interpretation of adjust-
ment costs different than if we were analyzing data at a firm or plant level. For example,
at the plant level the adjustment costs of disinvestment can be high due to dismantling
costs or fire sales and some investment could be irreversible. This would imply high costs
of disinvestment. However, with aggregate data we do not observe disinvestment, but
rather a reduction in the level of investment. The reduction in investment which could in-
volve postponing and cancelling planned investment is likely to involve lower adjustment
costs than those of increasing investment. With employment the situation is different in
that a fall in employment growth is associated with a decrease in the number of people
employed and hence is associated with firing.
Given the use of aggregate level investment data, we might expect that an increase in
the discount rate has a larger effect on investment than a decrease in the discount rate
because at the aggregate level this requires firms simply cutting back on investment which
has no adjustment costs, as compared to a decrease in the discount rate which should
lead to an increase in investment in the short run, but in the presence of adjustment
costs. Therefore, we now attempt to interpret how positive and negative changes in the
discount rate might affect investment growth. Panel A of Table 9 reports the results with
just the positive and negative changes in the discount rate and Panel B repeats this but
conditions on including the level of the discount rate. In Panel A, we see that a fall in
cc, indicating an increase in the discount rate, has a much larger impact on investment
growth than an increase in cc which represents a fall in the discount rate. The impact of
an increase in the discount rate as measured by the size of the coeffi cient estimate is more
than double that of the impact of a change in the discount rate recorded in Table 5 when
we do not split the discount rate into positive and negative changes in the discount rate.
23

At the one quarter horizon the R2is also somewhat larger in Table 9 at 0.08 as opposed
to 0.05 in Table 5. Thus, we observe a strong reaction on investment activity from a large
increase in the discount rate where managers cut back on, or postpone investment.
In contrast, in the last three rows of Panel A in Table 9, we see that an increase in
cc indicating a fall in the discount rate does not lead to a strong short run increase in
investment. The coeffi cient estimates and R2s are smaller than when the discount rate
rises and the estimates do not become statistically significant until the second quarter and
only marginally so at the fourth quarter horizon. This suggests the time to build/plan
in increasing investment is longer than in decreasing the level of investment. This makes
sense since there is less planning and building involved in postponing or reducing in-
vestment. Panel B confirms that these short run effects of the discount rate change are
unaffected when including the level of the discount rate, and we still find the same role
for the level of cc in predicting long run investment growth.
With respect to employment, it is plausible that adjustment costs of firing are lower
than those of hiring since the latter does not require training or disruption to output.
In this case, we would expect an increase in the discount rate to have a larger impact
on decreasing employment than a decrease in the discount rate would have on increasing
employment, since the later involves higher adjustment costs.
Table 10 reports results from regressing employment growth on positive and negative
changes in cc. We observe that both positive and negative changes in cc affect employment
growth and the effects are highly statistically significant and economically large. However,
there is a substantial difference between the size of the estimated coeffi cient as well as the
size of the R2when we consider negative and positive changes which is consistent with
higher adjustment costs of hiring. A decrease in cc,which is the equivalent of an increase
in the discount rate, leads to a fall in employment growth that is statistically significant
from the first to the eighth quarter, although at the eighth quarter the impact is much
less as measured by the R2. The coeffi cient estimates rise from 0.36 at the one quarter
horizon to 1.03 at the four quarter horizon. The impact of the discount rate as measured
by the R2is decreasing from the first quarter from 0.15 to 0.05 at the eighth quarter.
Employment growth falls quickly in response to an increase in the discount rate in that
the effect is felt in the first four quarters most strongly.
We find a similar pattern when the discount rate falls are measured by an increase
in cc but the estimated coeffi cient is almost half the size of that when the discount rate
increases and the R2is more than three times smaller and only statistically significant at
the one to four quarter horizons. These patterns in the estimated coeffi cients and the R2s
24

suggest that the adjustment cost of firing are lower than those of hiring since employment
growth reacts more to an increase in the discount rate. Panel B of Table 10 confirms
that these short run effects of the discount change rate are unaffected when including the
level of the discount rate, and we still find the same role of the level of cc in predicting
long run employment growth.
4.4 Discount Rate News and Cash Flow News
The analysis so far has focused on regressions that predict investment and employment
growth with proxies for the discount rate. We have shown that changes in the discount
rate, as proxied by cc, do capture movements in investment and employment growth
which are in line with the theoretical models of investment and employment discussed
earlier. In this part of the paper, we investigate other established ways to generate news
about discount rates that might also provide information regarding the short term impact
of discount rates on investment and employment growth.
We use the Campbell and Shiller (1988) log linearization of stock returns to decompose
stock returns into news about future discount rates and news about future cash flows.
This methodology provides us with a measure of discount rate news that firms should
react to in the short term. This methodology also has the further advantage of providing
cash flow news which is a proxy of future profitability which also can be a source of
investment growth fluctuations given in equation (1). Therefore, we can compare the role
of discount rate and cash flow shocks directly on investment and employment decisions.
Consider Campbell’s (1991) decomposition of unexpected returns from the present
value model (see Campbell and Vuolteenaho (2004) also):
rt+1 − Et(rt+1) = (Et+1 − Et)∞∑j=0
ρi∆dt+1+j − (Et+1 − Et)∞∑i=1
ρirt+1+i
= NCF,t+1 −NDR,t+1
(14)
where rt+1 is the log return on the aggregate stock market, d is log dividends, ρ is the
discount factor, and NCF and NDR are news about future dividend growth (cash flows)
and future returns (discount rates), respectively. Following Campbell (1991), a VAR can
be used to obtain Et(rt+1) and (Et+1−Et)∑∞
i=1 ρirt+1+i. These are plugged into equation
(14), which can then be solved for (Et+1 − Et)∑∞
j=0 ρi∆dt+1+j. Assuming the data are
25

generated by a first order VAR:
zt = Azt−1 + ut (15)
then Campbell and Vuolteenaho (2004) show that the news terms are given by
NCF,t = (e′1 + e′1λ)ut
NDR,t = e′1λut(16)
where e1 is a vector that picks out the first element from zt, which is returns in Campbell
and Vuolteenaho (2004), and λ = ρA(I− ρA)−1.
The estimation of the news terms requires that we specify a VAR that includes vari-
ables that predict stock returns. We set z′t = [rt dpt cct] where the dividend price ratio,
dp, is included following Engsted, Pedersen, and Tanggaard (2012) who show that it is nec-
essary for the VAR to be valid. Once the VAR is estimated, we construct NDR,t = e′1λut
and NCF,t = (e′1 + e′1λ)ut.
We can use standard predictive regressions of investment and employment growth:
∆xt+h = a0 + a1NDR,t + a2NCF,t + vt+h (17)
where ∆xt+h is either investment or employment growth. Table 11 reports the results
for predicting investment growth with discount rate news and cash flow news. Regarding
the impact of discount rate news, we find very similar evidence as that when we used the
change in cc. There is a marginally statistically significant estimate at the one quarter
horizon with a coeffi cient estimate of -0.101, confirming that news regarding an increase
(decrease) in the discount rate reduces (raises) investment. At the second and fourth
quarters both the statistical significance and the economic significance of the estimated
coeffi cients increase somewhat. The coeffi cient estimates are -0.243 and -0.431 at these
two horizons. At longer horizons, news about discount rates has no statistical or economic
effect. These findings support our earlier results that use the change in cc to proxy the
discount rate and the predictions of models of investment that an increase (decrease) in
the discount rate news reduces (increases) investment in the short run.
We also see that the news about future cash flows, or profitability, does have an impact
at short horizons in that news about an increase (decrease) in cash flows raises (lowers)
investment. Like the case for discount rate news, news about cash flows has its strongest
impact on investment at the second and fourth quarters and there is also some evidence
26

of predictability at the eighth quarter, although this is much weaker than at the fourth
quarter. At longer horizons the coeffi cient estimates are not statistically significant and
the R2is zero.
Both news about cash flows and discount rates have a short run impact on investment
growth. We can try and assess which of the two news terms is the most important. For
example, based on the estimate at the second quarter horizon, a one standard deviation
movement in the discount rate news is 0.03 per quarter and leads to a change in investment
growth of just under 2% on an annual basis. This is large economically given that the
mean annual growth rate of investment is a little over 4%. It is also very close to the
impact that we measured when using the change in cc to capture short run effects. A one
standard deviation movement in the cash flow news which is 0.06 leads to around a 1%
change in investment growth on an annual basis. Thus, news about discount rates has a
larger impact on investment growth than news about cash flows.
Table 12 reports the impact of discount rate news and cash flows news on employ-
ment growth. News regarding an increase (decrease) in the discount rate reduces (raises)
employment growth. The coeffi cient estimates are statistically significant from the one
quarter horizon to the eight quarter horizon, although at the eight quarter horizon the
statistical significance falls as does the R2. A one standard deviation movement in dis-
count rate news results in a 0.7% per annum movement in employment growth which is
substantial given that the mean growth rate of employment is around 1.7% per annum
and reassuringly similar to the value found when using the change in cc to proxy the dis-
count rate. There is no strong evidence that news about cash flows predicts employment
growth at any horizon.
The results from using a VAR to generate discount rate news and cash flow news
provide a novel way to look at the issue of whether movements in discount rates and cash
flows (profitability) lead to changes in investment and employment. This alternative
methodology allows us to confirm earlier results based on the change in cc that the
discount rate predicts both investment growth and employment growth in the short run
in the manner predicted by theoretical models. We also find evidence of cash flows
news predicting investment growth in the short run as predicted by standard investment
models. Overall, discount rates tend to be important in determining movements in the
short run of both investment and employment growth, a novel result in the literature.
27

5 Robustness
In this section, we undertake some robustness tests. We first control the predictive
regressions for a set of macroeconomic variables that are unrelated to the discount rate.
The second set of robustness tests examines alternative proxies for the discount rate.
Finally, we analyze whether our results are robust to alternative ways of detrending
consumption.
5.1 Macroeconomic Controls
There are various macroeconomic variables that are unrelated to the discount rate that
have been found to predict both investment and employment growth (see, for example,
Barro (1990), Blanchard, Rhee, and Summers (1993), Lamont (2000), Lettau and Lud-
vigson (2002), and Chen and Zhang (2011)). Following this literature, we consider the
following: the first lag of the growth in gross domestic product, dgdp; the first lag of the
growth in corporate profits, dprofit ; the first lag of the growth rate in average Q, dq; and
the first lag of the growth rate in either investment or employment, di or de. We aim to
establish if the importance of discount rates that we have uncovered so far remains after
controlling for these macroeconomic variables.
Panel A of Table 13 reports the results of predicting investment growth with the
lagged level and change in cc and the four macroeconomic variables. From the table, we
see that the level of cc remains strongly statistically significant in predicting investment
growth across all horizons. In addition, the change in cc continues to be statistically at
the 10% level for the two-quarter horizon and at the 5% level for the four-quarter horizon.
Panel B of Table 13 reports the results of predicting employment growth with the lagged
level and change in cc and the four macroeconomic variables. We again observe that
the level of cc remains strongly statistically significant across all horizons and the change
in cc is now statistically at horizons up to eight quarters. We thereby confirm that our
findings regarding the role of the discount rate in investment and employment growth are
robust to the inclusion of macroeconomic controls.
5.2 Other Discount Rate Proxies
Both Lettau and Ludvigson (2002) and Chen and Zhang (2011) use the same set of
variables that have been used to predict stock returns to predict investment and employ-
ment growth respectively. These are the log dividend-price ratio (dp), the term spread
28

(tms), the default yield spread (dfy), the consumption-wealth ratio (cay) of Lettau and
Ludvigson (2001), and the relative t-bill rate (rrel).
Panel A of Table 14 reports the results of predicting investment growth with cc and
the five other predictor variables. We find that the dividend-price ratio cannot predict
investment growth over this sample period, mirroring its lack of predictability for stock
returns. Higher values of rrel predicts higher investment in the short run but the coef-
ficient estimates turn negative at horizons of and over eight quarters, and they are not
statistically significant. We find similar results as Lettau and Ludvigson (2002) for tms
and def in that the former can predict investment growth at long horizons, but with the
wrong sign, and the later at short horizons, but with the wrong sign. In this multivariate
regression using all the predictor variables, cc retains it predictive power at long horizons.
The R2at the twenty quarter horizon is 0.37, which is just a small amount larger than
the R2when using cc alone suggesting that other variables add little in terms of predict-
ing investment. In this sample period, we also find that cay has no predictive power for
investment growth.
Panel B of Table 14 reports the results of predicting employment growth with cc and
the five other predictor variables. We again find that cc stays statistically significant
at long horizons and it predicts with the right sign according to the dynamic models.
While the dividend-price ratio has weak predictive power for investment growth, it has
significant predictive power for employment growth. The term spread also has significant
predictive power for employment growth, but it predicts with the wrong sign. The default
spread predicts employment growth with significantly negative coeffi cients at horizons up
to three years, but this predictive power does not seem to have any relation to time-
varying discount rates given that def does not have a significant relation to future stock
returns. The relative short rate has significant predictive power only at very short horizons
and, finally, cay does not appear to be a strong predictor of employment growth in our
sample.
Overall, we find that cc contains significant predictive power for both stock returns,
investment growth, and employment growth, while other proxies for discount rates often
fail to contain significant predictive power or predict with the wrong sign according to
the dynamic models.
29

5.3 Alternative Ways of Detrending Consumption
We use the Hamilton (2017) filter as our preferred approach to detrend consumption
because it is a simple one-sided filter that uses only lagged data. Furthermore, it does
not require us to know the nature of the nonstationarity in consumption. To check the
robustness towards detrending techniques, we consider a quadratic trend model:
ct = β1 + β2t+ β3t2 + ωt, (18)
where cyclical consumption is then given by the residual from the quadratic equation.
We also consider the case where consumption follows a random walk, which means that
cyclical consumption is defined as cct = ct − ct−k with k = 6 years as in the above.
Table 15 shows predictability results when using these two alternative ways of detrending
consumption. We see that both measures are statistically significant in predicting stock
returns, investment growth and employment growth and that the degree of predictive
power is similar to that obtained using the Hamilton (2017) regression filter in equation
(11). In some cases, the quadratic trend model generates somewhat higher R2 statistics
and in that sense the Hamilton detrending procedure provides a conservative view of the
degree of predictability.
6 Conclusion
Dynamic models of employment and investment growth imply that discount rate variation
should affect both short-run and long-run fluctuations in employment and real investment
spending. However, a key challenge in analyzing the implications of employment and
investment models is to come up with an appropriate proxy for discount rate variation
because stock return predictor variables often exhibit unstable predictive power (see,
e.g., Goyal and Welch, (2008) and Henkel, Martin and Nardari (2011)). To overcome this
challenge, we use cyclical consumption to track discount rate variation as this variable
contains robust and strong predictive power for stock returns and hence is a suitable proxy
for capturing time-varying discount rates (see Atanasov, Møller, and Priestley (2019)).
It is important to be able to track the discount rate when it decreases as well as when
it increases because both investment and employment models predict movements in in-
vestment and employment growth when the discount rate increases (bad times) and when
the discount rate decreases (good times). This is a crucial issue because firms’investment
and employment decisions are unlikely to be symmetric around discount rate increases
30

and decreases due to asymmetries in the adjustment costs when firms increase invest-
ment and employment compared to when firms decrease investment and employment.
Furthermore, these asymmetries in adjustment costs and the difference in investment
as compared to employment adjustment costs are likely to mean that the size and the
sign of the discount rate movement might be important in determining investment and
employment decisions. This paper is the first to address all these issues.
The use of a successful, theoretically underpinned proxy for a time-varying discount
rate allows us to connect both short-run and long-run fluctuations in employment and
investment to a time-varying discount rate. We show that a current fall in the discount
rate predicts an increase in short-run investment and employment, while long-run invest-
ment and employment decreases, which is consistent with the implications of dynamic
labor market and investment models. We thereby confirm the prediction of an opposite
impact of the discount rate on employment and investment at short and long horizons.
Furthermore, we show that differences in adjustment costs of investment and employment
lead to differences in how firms react to whether the discount rate increases or decreases.
A key result is that an increase in the discount rates, which typically happens during
recessions, has a stronger effect on employment and investment than a decrease in the
discount rate. Overall, our findings suggest that a time-varying discount rate can have a
substantial impact on business cycle fluctuations at both short and long horizons through
managers’decisions regarding investment and employment.
31
References
Abel, A.B., Blanchard, O., 1986. The present value of profits and cyclical movements in
investment. Econometrica 54, 246-273.
Atanasov, V., Møller, S.V., and Priestley, R., 2019. Consumption fluctuations and ex-
pected returns. Journal of Finance forthcoming.
Barro, R.J., 1990. The stock market and investment. Review of Financial Studies 3,
115-131.
Bernanke, B.S., Bohn, H., Reiss, P.C., 1988. Alternative non-nested specification tests
of time-series investment models. Journal of Econometrics 37, 293-326
Blanchard, O.J., Rhee, C., Summers, L.H., 1993. The stock market, profit and invest-
ment. Quarterly Journal of Economics 108, 115-136.
Bloom, N., 2009, The impact of uncertainty shocks, Econometrica 77, 623-685.
Campbell, J.Y., 1991. A variance decomposition for stock returns. Economic Journal
101, 157-179.
Campbell, J.Y. and Cochrane, J.H, 1999. By force of habit: A consumption-based expla-
nation of aggregate stock market behavior. Journal of Political Economy 107, 205-251.
Campbell, J.Y., Shiller, R., 1988. The dividend-price ratio and expectations of future
dividends and discount factors. Review of Financial Studies 1, 195-227.
Campbell, J., Vuolteenaho, T. (2004). Bad beta, good beta. American Economic Review
94, 1249-1275.
Chen, L, Zhang, L, 2011. Do time-varying risk premiums explain labor market perfor-
mance? Journal of Financial Economics 99, 385-399.
Cochrane, J.H., 1991. Production-based asset pricing and the link between stock returns
and economic fluctuations. Journal of Finance 46, 207-234.
Cochrane, J.H., 2017. Macro-finance. Review of Finance 21, 945-985.
Cooper, R.W, Haltiwanger, J.C., 2006. On the nature of capital adjustment costs. Review
of Economic Studies 73, 611-633
32

Dangl, T., Halling, M., 2012. Predictive regressions with time-varying coeffi cients. Jour-
nal of Financial Economics 106, 157-181.
Engsted, T., Pedersen T.Q., and Tanggaard C., 2012. Pitfalls in VAR based return
decompositions: A clarification. Journal of Banking and Finance 36, 1255-1265.
Golez, B., Koudijs, P., 2018. Four centuries of return predictability. Journal of Financial
Economics 127, 248-263.
Goyal, A., Welch, I., 2008. A comprehensive look at the empirical performance of equity
premium prediction. Review of Financial Studies 21, 1455-1508.
Hall, R. E., 2017. High discounts and high unemployment. American Economic Review
107, 305-330.
Hamilton, J.D., 2018. Why you should never use the Hodrick-Prescott filter. Review of
Economics and Statistics 100, 831-843.
Henkel, S.J., Martin, S., Nardari, F., 2011. Time-varying short-horizon predictability.
Journal of Financial Economics 99, 560-580.
Lamont, O., 2000. Investment plans and stock returns. Journal of Finance 55, 2719-2745
Lettau, M. and Ludvigson, S.C, 2001. Consumption, aggregate wealth and expected
stock returns. Journal of Finance 66, 815-849.
Lettau, M., Ludvigson, S.C., 2002. Time-varying risk premia and the cost of capital: an
alternative implication of the Q theory of investment. Journal of Monetary Economics
49, 31-66
Liu, L.X., Whited, T.M., and Zhang, L., 2009. Investment-based expected stock returns.
Journal of Political Economy 117, 1105-1139.
Merz, M., Yashiv, E., 2007. Labor and the market value of the firm. American Economic
Review 97, 1419-1431.
Mortensen, D.T., Pissarides, C.A., 1994. Job creation and job destruction in the theory
of unemployment. Review of Economic Studies 61, 397-415.
Newey, W.K., West, K.D., 1987. A simple, positive semi-definite, heteroskedasticity and
autocorrelation consistent covariance matrix. Econometrica 55, 703-708.
Nickell, S.J., 1986, Dynamic models of labor demand, Chapter 9 in Handbook of Labor
33

Economics, Vol 1, edited by Orley C. Ashenfelter and Richard Layard. Amsterdam:
North-Holland.
Rapach, D.E., Strauss, J.K., Zhou, G., 2010. Out-of-sample equity premium prediction:
Combination forecasts and links to the real economy. Review of Financial Studies 23,
821-862.
Tobin, J., 1969. A general equilibrium approach to monetary theory. Journal of Money,
Credit, and Banking 1, 15-29.
Varejão, J., Portugal, P., 2007. Employment dynamics and the structure of labor adjust-
ment costs. Journal of Labor Economics 25, 137-165.
Yashiv, E., 2000, The determinants of equilibrium unemployment, American Economic
Review 90, 1297-1322.
34

Table 1. Predicting Discount Rates
Panel A presents results of univariate predictive regressions, rt+h = α + βZt + εt+h,
where rt+h is the h-quarter ahead log excess stock market return and Zt is a predictive
variable. The table shows results for the following predictive variables: cyclical consump-
tion (cc), the dividend-price ratio (dp), the term spread (tms), the default spread (def),
the relative interest rate (rrel), and the consumption-wealth ratio (cay). Panel B reports
results from multivariate regressions where all predictive variables are included. For each
regression, the table reports the slope estimate, the Newey-West corrected t-statistic
(h lags), and the adjusted R2 statistic. The sample covers the period from 1954Q1 to
2017Q4.
Panel A: Univariate Regressions
h = 1 h = 2 h = 4 h = 8 h = 12 h = 16 h = 20
cc -0.375 -0.740 -1.434 -2.543 -3.316 -4.427 -5.286
t-stat -3.189 -3.626 -3.885 -4.153 -4.615 -5.686 -6.128
R2
0.034 0.063 0.126 0.223 0.292 0.412 0.437
dp 0.019 0.042 0.078 0.128 0.150 0.179 0.243
t-stat 1.424 1.596 1.586 1.432 1.335 1.489 2.157
R2
0.005 0.016 0.031 0.047 0.049 0.056 0.083
tms 0.657 1.270 2.586 4.564 6.683 8.324 9.288
t-stat 1.693 1.814 2.419 3.719 4.645 3.769 2.694
R2
0.010 0.020 0.047 0.084 0.140 0.174 0.168
def 0.611 2.055 3.602 4.861 5.788 10.307 18.643
t-stat 0.399 0.863 1.051 1.026 0.961 1.359 2.126
R2
-0.003 0.002 0.006 0.006 0.006 0.022 0.064
rrel -0.819 -1.353 -2.096 -2.034 -2.548 -3.429 -4.850
t-stat -1.724 -1.520 -1.194 -1.448 -1.997 -2.127 -2.527
R2
0.010 0.014 0.018 0.007 0.010 0.016 0.027
cay 0.631 1.266 2.561 4.992 6.751 8.044 8.681
t-stat 2.601 2.709 2.932 3.901 4.768 5.263 5.407
R2
0.020 0.039 0.086 0.179 0.241 0.268 0.245
35

Panel B: Multivariate regressions
h = 1 h = 2 h = 4 h = 8 h = 12 h = 16 h = 20
cc -0.288 -0.550 -1.027 -1.797 -2.259 -3.258 -3.885
t-stat -2.054 -2.454 -2.864 -2.939 -3.062 -4.641 -5.337
dp 0.010 0.021 0.043 0.073 0.098 0.075 0.076
t-stat 0.644 0.742 0.799 0.791 0.994 0.738 0.724
term 0.052 0.233 0.986 2.608 4.471 4.633 4.435
t-stat 0.098 0.268 0.716 1.121 2.141 2.137 1.527
def -0.545 0.162 0.416 0.815 0.039 4.225 11.484
t-stat -0.348 0.068 0.119 0.206 0.010 1.036 2.116
rrel -0.726 -0.921 -0.912 0.652 1.498 1.733 1.423
t-stat -1.309 -1.013 -0.488 0.327 0.980 0.916 0.659
cay 0.485 0.989 1.980 3.901 5.102 5.839 6.138
t-stat 1.877 2.113 2.354 2.975 3.711 4.187 4.262
R2
0.042 0.088 0.191 0.364 0.496 0.617 0.631
36

Table 2. Stability
The table reports results of univariate predictive regressions, rt+h = α + βZt + εt+h,
where rt+h is the h-quarter ahead log excess stock market return and Zt is a predictive
variable. For each regression, the table reports the slope estimate, the Newey-West
corrected t-statistic (h lags), and the adjusted R2 statistic. Panel A reports results for
the period 1954Q1 to 1984Q4 and Panel B reports results for the period 1985Q1 to
2017Q4.
Panel A: 1954Q1 to 1984Q4
h = 1 h = 2 h = 4 h = 8 h = 12 h = 16 h = 20
cc -0.496 -0.911 -1.617 -2.289 -2.413 -3.436 -4.439
t-stat -2.444 -2.640 -2.527 -2.533 -3.218 -4.697 -5.296
R2
0.051 0.077 0.133 0.188 0.221 0.419 0.474
dp 0.072 0.164 0.305 0.429 0.383 0.372 0.629
t-stat 2.180 2.565 2.928 2.280 1.760 1.563 2.152
R2
0.030 0.078 0.147 0.203 0.148 0.112 0.200
tms 1.517 2.436 3.519 1.094 0.583 0.956 4.368
t-stat 2.764 2.267 1.738 0.619 0.255 0.438 0.963
R2
0.052 0.058 0.060 -0.004 -0.008 -0.007 0.019
def 1.329 2.525 2.726 0.287 -6.675 -11.818 -10.878
t-stat 0.749 0.790 0.574 0.063 -1.379 -1.305 -0.901
R2
-0.001 0.003 -0.002 -0.009 0.011 0.034 0.008
rrel -1.548 -2.684 -4.542 -2.898 -1.844 -1.084 -4.603
t-stat -2.797 -2.968 -2.492 -1.695 -1.251 -0.483 -1.570
R2
0.065 0.087 0.134 0.031 0.005 -0.006 0.019
cay 0.916 1.790 3.331 5.677 6.726 8.598 10.098
t-stat 2.601 2.333 2.236 3.366 5.268 7.330 7.433
R2
0.038 0.067 0.123 0.244 0.371 0.558 0.517
37

Panel B: 1985Q1 to 2017Q4
h = 1 h = 2 h = 4 h = 8 h = 12 h = 16 h = 20
cc -0.370 -0.783 -1.653 -3.426 -4.800 -6.237 -7.130
t-stat -2.665 -2.691 -2.858 -3.206 -3.961 -5.899 -11.359
R2
0.027 0.067 0.160 0.328 0.439 0.577 0.605
dp 0.043 0.083 0.153 0.262 0.341 0.387 0.426
t-stat 2.101 2.421 2.434 2.278 2.657 2.830 2.947
R2
0.024 0.052 0.103 0.160 0.220 0.248 0.281
tms -0.133 0.225 1.936 7.783 10.955 11.704 9.360
t-stat -0.211 0.202 1.171 2.342 2.989 3.690 2.310
R2
-0.007 -0.007 0.014 0.159 0.221 0.231 0.155
def -0.578 1.185 4.402 9.533 10.891 15.023 21.421
t-stat -0.219 0.338 0.985 1.145 1.102 1.239 1.545
R2
-0.007 -0.006 0.004 0.019 0.023 0.043 0.087
rrel 1.029 2.002 4.107 1.057 -1.165 -3.368 -3.184
t-stat 1.223 1.201 1.241 0.385 -0.285 -0.893 -1.284
R2
0.005 0.015 0.042 -0.006 -0.006 0.006 0.007
cay 0.361 0.781 1.868 4.569 6.529 6.659 5.474
t-stat 1.228 1.427 1.728 1.787 1.749 1.471 1.305
R2
-0.001 0.008 0.036 0.104 0.124 0.090 0.049
38

Table 3. Investment Predictability
The table presents results of predictive regressions, ∆it+h = it+h−it = a0+a1cct+vt+h,
where ∆it+h = it+h − it is h-period ahead log growth in investment and cct is cyclical
consumption. For each regression, the table reports the slope estimate, the Newey-West
corrected t-statistic (h lags), and the adjusted R2 statistic. The sample covers the period
from 1954Q1 to 2017Q4.
h = 1 h = 2 h = 4 h = 8 h = 12 h = 16 h = 20
cc -0.036 -0.104 -0.329 -0.858 -1.248 -1.520 -1.896
t-stat -1.083 -1.476 -2.472 -3.259 -3.017 -2.896 -3.388
R2
0.001 0.009 0.039 0.121 0.190 0.239 0.318
Table 4. Employment Predictability
The table presents results of predictive regressions, ∆et+h = et+h − et = a0 + a1cct +
ut+h, where ∆et+h = et+h − et is h-period ahead log growth in employment and cct
is cyclical consumption. For each regression, the table reports the slope estimate, the
Newey-West corrected t-statistic (h lags), and the adjusted R2 statistic. The sample
covers the period from 1954Q1 to 2017Q4.
h = 1 h = 2 h = 4 h = 8 h = 12 h = 16 h = 20
cc -0.001 -0.016 -0.073 -0.226 -0.363 -0.490 -0.643
t-stat -0.074 -0.746 -1.722 -2.473 -2.446 -2.378 -2.493
R2
-0.004 -0.001 0.020 0.082 0.138 0.186 0.246
39

Table 5. Investment Predictability: Change in the Discount Rate
The table presents results of predictive regressions, ∆it+h = it+h − it = a0 + a1cct +
a2∆cct + vt+h, where ∆it+h = it+h − it is h-period ahead log growth in investment, cct is
cyclical consumption, and ∆cct = cct − cct−1 is the change in cyclical consumption. For
each regression, the table reports the slope estimate, the Newey-West corrected t-statistic
(h lags), and the adjusted R2 statistic. The sample covers the period from 1954Q1 to
2017Q4.
h = 1 h = 2 h = 4 h = 8 h = 12 h = 16 h = 20
∆cc 0.469 0.958 1.608 1.476 0.474 0.509 0.021
t-stat 2.730 3.148 3.138 1.986 0.660 0.848 0.033
R2
0.050 0.067 0.063 0.020 -0.002 -0.003 -0.004
∆cc 0.493 1.019 1.780 1.885 1.051 1.363 1.249
t-stat 2.841 3.279 3.281 2.156 1.124 1.746 1.761
cc -0.053 -0.136 -0.385 -0.910 -1.279 -1.584 -1.975
t-stat -1.703 -2.068 -2.944 -3.209 -2.898 -2.888 -3.481
R2
0.056 0.085 0.117 0.154 0.194 0.252 0.331
40

Table 6. Employment Predictability: Change in the Discount Rate
The table presents results of predictive regressions, ∆et+h = et+h − et = a0 + a1cct +
a2∆cct + ut+h, where ∆et+h = et+h − et is h-period ahead log growth in employment, cctis cyclical consumption, and ∆cct = cct−cct−1 is the change in cyclical consumption. Foreach regression, the table reports the slope estimate, the Newey-West corrected t-statistic
(h lags), and the adjusted R2 statistic. The sample covers the period from 1954Q1 to
2017Q4.
h = 1 h = 2 h = 4 h = 8 h = 12 h = 16 h = 20
∆cc 0.200 0.351 0.554 0.639 0.480 0.456 0.258
t-stat 4.461 4.154 3.745 2.688 1.586 1.354 0.702
R2
0.123 0.109 0.084 0.040 0.012 0.006 -0.002
∆cc 0.203 0.364 0.595 0.750 0.652 0.737 0.680
t-stat 4.545 4.190 3.791 2.776 1.812 1.836 1.490
cc -0.008 -0.028 -0.091 -0.246 -0.381 -0.522 -0.678
t-stat -0.988 -1.503 -2.231 -2.606 -2.451 -2.444 -2.553
R2
0.123 0.117 0.116 0.136 0.162 0.213 0.264
41

Table 7. Investment Predictability: Large and Small Changes in theDiscount Rate
The table presents results of predictive regressions, ∆it+h = it+h − it = a0 + a1cct +
a2∆ccL,t + a2∆ccS,t + vt+h, where ∆it+h = it+h − it is h-period ahead log growth in
investment, cct is cyclical consumption, ∆ccL,t = cct − cct−1 is the change in cyclical
consumption that is greater than one standard deviation from the mean, and ∆ccS,t =
cct − cct−1 is the change in cyclical consumption that is less than than one standard
deviation from the mean. For each regression, the table reports the slope estimate, the
Newey-West corrected t-statistic (h lags), and the adjusted R2 statistic. The sample
covers the period from 1954Q1 to 2017Q4.
h = 1 h = 2 h = 4 h = 8 h = 12 h = 16 h = 20
∆cc large 0.541 1.104 1.750 1.195 0.130 0.041 -0.513
t-stat 2.754 3.173 3.075 1.557 0.171 0.067 -0.949
∆cc small 0.084 0.170 0.847 3.028 2.393 3.030 3.042
t-stat 0.319 0.381 0.996 1.722 1.232 1.303 1.298
R2
0.053 0.072 0.062 0.021 -0.001 0.001 0.001
∆cc large 0.575 1.190 1.983 1.728 0.888 1.119 0.842
t-stat 2.877 3.312 3.265 1.902 0.902 1.346 1.344
∆cc small 0.068 0.125 0.723 2.731 1.935 2.635 3.513
t-stat 0.263 0.295 0.936 1.673 1.106 1.283 1.771
cc -0.057 -0.144 -0.395 -0.902 -1.271 -1.572 -1.964
t-stat -1.848 -2.209 -3.036 -3.216 -2.898 -2.870 -3.485
R2
0.061 0.093 0.119 0.152 0.192 0.250 0.333
42

Table 8. Employment Predictability: Large and Small Changes in theDiscount Rate
The table presents results of predictive regressions, ∆et+h = et+h − et = a0 + a1cct +
a2∆ccL,t + a2∆ccS,t + ut+h, where ∆et+h = et+h − et is h-period ahead log growth in
investment, cct is cyclical consumption, ∆ccL,t = cct − cct−1 is the change in cyclical
consumption that is greater than one standard deviation from the mean, and ∆ccS,t =
cct − cct−1 is the change in cyclical consumption that is less than than one standard
deviation from the mean. For each regression, the table reports the slope estimate, the
Newey-West corrected t-statistic (h lags), and the adjusted R2 statistic. The sample
covers the period from 1954Q1 to 2017Q4.
h = 1 h = 2 h = 4 h = 8 h = 12 h = 16 h = 20
∆cc large 0.208 0.377 0.567 0.537 0.341 0.232 0.033
t-stat 4.088 3.927 3.454 2.302 1.175 0.711 0.095
∆cc small 0.154 0.214 0.485 1.203 1.256 1.662 1.530
t-stat 2.213 1.765 1.887 2.113 1.746 1.843 1.564
R2
0.121 0.109 0.080 0.043 0.015 0.015 0.005
∆cc large 0.214 0.394 0.622 0.680 0.566 0.585 0.498
t-stat 4.169 3.981 3.574 2.542 1.620 1.508 1.171
∆cc small 0.151 0.204 0.456 1.123 1.121 1.533 1.691
t-stat 2.199 1.750 1.900 2.170 1.792 1.953 1.915
cc -0.008 -0.030 -0.093 -0.243 -0.377 -0.515 -0.674
t-stat -1.051 -1.583 -2.276 -2.614 -2.456 -2.438 -2.557
R2
0.121 0.118 0.114 0.136 0.161 0.216 0.268
43

Table 9. Investment Predictability: Positive and Negative Changes in theDiscount Rate
Panel A presents results from predictive regressions of the h-period ahead log growth in
investment, ∆it+h = it+h−it, using the change in cyclical consumption, ∆cct = cct−cct−1,as regressor. We split the change in cyclical consumption into positive and negative
parts and report results from each specification. Panel B includes the level of cyclical
consumption, cct, as additional regressor. For each regression, the table reports the slope
estimate, the Newey-West corrected t-statistic (h lags), and the adjusted R2 statistic.
The sample covers the period from 1954Q1 to 2017Q4.
Panel A: Positive and Negative Discount Rate Changes
h = 1 h = 2 h = 4 h = 8 h = 12 h = 16 h = 20
∆cc negative 1.010 1.904 3.264 3.530 2.250 2.074 1.353
t-stat 3.162 3.520 3.820 2.880 1.833 1.772 1.073
R2
0.084 0.095 0.094 0.044 0.010 0.006 -0.000
∆cc positive 0.308 0.780 1.243 0.612 -0.919 -0.754 -1.399
t-stat 1.447 2.119 1.876 0.571 -0.839 -0.651 -1.047
R2
0.004 0.013 0.010 -0.003 -0.002 -0.003 -0.000
Panel B: Controlling for the Level of the Discount Rate
h = 1 h = 2 h = 4 h = 8 h = 12 h = 16 h = 20
∆cc negative 1.044 1.992 3.510 4.118 3.078 3.204 3.030
t-stat 3.230 3.609 3.911 2.897 2.060 2.552 2.389
cc -0.051 -0.134 -0.381 -0.918 -1.293 -1.573 -1.960
t-stat -1.671 -2.067 -2.976 -3.340 -2.985 -2.914 -3.472
R2
0.090 0.113 0.148 0.183 0.213 0.260 0.335
∆cc positive 0.333 0.852 1.456 1.150 -0.148 0.454 0.279
t-stat 1.555 2.276 2.110 0.964 -0.114 0.341 0.230
cc -0.040 -0.116 -0.350 -0.874 -1.246 -1.528 -1.902
t-stat -1.256 -1.697 -2.632 -3.180 -2.936 -2.851 -3.395
R2
0.006 0.025 0.055 0.122 0.186 0.236 0.315
44

Table 10. Employment Predictability: Positive and Negative Changes in theDiscount Rate
Panel A presents results from predictive regressions of the h-period ahead log growth in
employment,∆et+h = et+h−et, using the change in cyclical consumption∆cct = cct−cct−1as regressor. We split the change in cyclical consumption into positive and negative
parts and report results from each specification. Panel B includes the level of cyclical
consumption, cct, as additional regressor. For each regression, the table reports the slope
estimate, the Newey-West corrected t-statistic (h lags), and the adjusted R2 statistic.
The sample covers the period from 1954Q1 to 2017Q4.
Panel A: Positive and Negative Discount Rate Changes
h = 1 h = 2 h = 4 h = 8 h = 12 h = 16 h = 20
∆cc negative 0.365 0.637 1.032 1.152 0.882 0.724 0.374
t-stat 4.105 4.150 3.991 2.775 1.704 1.187 0.521
R2
0.145 0.127 0.104 0.047 0.015 0.005 -0.002
∆cc positive 0.195 0.346 0.521 0.636 0.460 0.544 0.344
t-stat 3.730 3.195 2.510 1.900 1.109 1.078 0.624
R2
0.039 0.036 0.024 0.012 0.001 0.001 -0.003
Panel B: Controlling for the Level of the Discount Rate
h = 1 h = 2 h = 4 h = 8 h = 12 h = 16 h = 20
∆cc negative 0.369 0.654 1.089 1.309 1.125 1.089 0.941
t-stat 4.142 4.154 4.012 2.823 1.908 1.627 1.179
cc -0.006 -0.025 -0.089 -0.245 -0.380 -0.508 -0.663
t-stat -0.760 -1.331 -2.163 -2.604 -2.463 -2.401 -2.514
R2
0.144 0.133 0.135 0.143 0.165 0.204 0.255
∆cc positive 0.197 0.359 0.571 0.782 0.691 0.944 0.929
t-stat 3.805 3.268 2.642 2.170 1.466 1.658 1.514
cc -0.004 -0.021 -0.081 -0.237 -0.373 -0.506 -0.662
t-stat -0.402 -1.050 -1.962 -2.558 -2.461 -2.411 -2.532
R2
0.036 0.038 0.049 0.102 0.146 0.198 0.254
45

Table 11. Investment Predictability: Discount Rates and Cash Flow News
The table presents results from predictive regressions of the h-period ahead log growth
in investment, ∆it+h = it+h− it, using discount rates news NDR and cash flow news NCFderived from a VAR. For each regression, the table reports the slope estimates, the Newey-
West corrected t-statistic (h lags), and the adjusted R2 statistic. The sample covers the
period from 1954Q1 to 2017Q4.
h = 1 h = 2 h = 4 h = 8 h = 12 h = 16 h = 20
NDR -0.101 -0.243 -0.431 -0.359 -0.028 0.015 0.170
t-stat -1.907 -2.673 -2.757 -1.643 -0.141 0.082 0.705
NCF 0.022 0.082 0.184 0.226 0.173 0.035 0.056
t-stat 0.935 2.227 2.783 2.452 2.115 0.447 0.634
R2
0.025 0.068 0.087 0.033 0.001 -0.008 -0.007
Table 12. Employment Predictability: Discount Rates and Cash Flow News
The table presents results from predictive regressions of the h-period ahead log growth
in employment, ∆et+h = et+h − et, using discount rates news NDR and cash flow news
NCF derived from a VAR. For each regression, the table reports the slope estimates, the
Newey-West corrected t-statistic (h lags), and the adjusted R2 statistic. The sample
covers the period from 1954Q1 to 2017Q4.
h = 1 h = 2 h = 4 h = 8 h = 12 h = 16 h = 20
NDR -0.053 -0.098 -0.161 -0.179 -0.118 -0.098 -0.036
t-stat -3.926 -3.939 -3.628 -2.615 -1.406 -1.027 -0.331
NCF 0.002 0.018 0.040 0.033 0.013 -0.024 -0.026
t-stat 0.344 1.394 1.831 1.084 0.405 -0.670 -0.675
R2
0.085 0.103 0.096 0.036 0.003 -0.003 -0.007
46

Table 13. Macroeconomic Controls
Panel A and B present results from predictive regressions of the h-period ahead log
growth in investment and employment, respectively. As predictive variables, we use
the the level and change in cyclical consumption joint with macroeconomic controls. For
each regression, the table reports the slope estimate, the Newey-West corrected t-statistic
(h lags), and the adjusted R2 statistic. The sample covers the period from 1954Q1 to
2017Q4.
Panel A: Investment Predictability
h = 1 h = 2 h = 4 h = 8 h = 12 h = 16 h = 20
∆cc 0.101 0.356 0.812 1.156 0.585 1.169 1.127
t-stat 0.940 1.882 2.111 1.621 0.810 2.018 1.860
cc -0.045 -0.128 -0.384 -0.908 -1.267 -1.634 -2.148
t-stat -2.204 -2.840 -3.469 -3.131 -2.685 -2.657 -3.306
di 0.385 0.595 0.472 -0.162 -0.530 -0.672 -0.815
t-stat 6.366 4.638 1.916 -0.446 -1.423 -1.947 -2.173
dgdp 0.492 0.912 2.037 2.206 1.832 1.223 1.374
t-stat 2.868 2.594 3.256 2.486 1.632 0.923 0.971
dprofit 0.061 0.106 0.155 0.234 0.333 0.266 0.175
t-stat 3.336 3.010 2.439 2.254 3.151 2.108 1.356
q 0.009 0.018 0.030 0.035 0.036 0.058 0.096
t-stat 2.366 1.983 1.343 0.685 0.522 0.736 1.184
R2
0.407 0.397 0.321 0.217 0.240 0.277 0.363
47

Panel B: Employment Predictability
h = 1 h = 2 h = 4 h = 8 h = 12 h = 16 h = 20
∆cc 0.077 0.143 0.280 0.446 0.375 0.457 0.357
t-stat 2.617 2.535 2.303 2.101 1.455 1.761 1.159
cc -0.010 -0.031 -0.091 -0.230 -0.348 -0.480 -0.626
t-stat -2.336 -2.644 -2.874 -2.762 -2.477 -2.423 -2.469
di 0.675 1.048 1.234 1.017 0.830 0.937 0.885
t-stat 8.114 5.516 2.936 1.441 1.099 1.063 0.785
dgdp -0.010 0.066 0.283 0.442 0.503 0.404 0.553
t-stat -0.194 0.672 1.806 1.879 1.857 1.129 1.391
dprofit 0.013 0.024 0.028 0.036 0.049 0.026 -0.002
t-stat 2.408 2.091 1.397 1.101 1.343 0.679 -0.064
q 0.001 0.001 -0.000 -0.008 -0.016 -0.022 -0.023
t-stat 0.630 0.437 -0.077 -0.625 -0.846 -0.924 -0.907
R2
0.567 0.485 0.328 0.215 0.213 0.245 0.288
48

Table 14. Alternative Discount Rate Proxies.
Panel A and B present results from predictive regressions of the h-period ahead log
growth in investment and employment, respectively. As predictive variables, we use
cyclical consumption joint with other discount rate proxies. For each regression, the
table reports the slope estimate, the Newey-West corrected t-statistic (h lags), and the
adjusted R2 statistic. The sample covers the period from 1954Q1 to 2017Q4.
Panel A: Multivariate Investment Growth Predictability
h = 1 h = 2 h = 4 h = 8 h = 12 h = 16 h = 20
cc -0.025 -0.075 -0.217 -0.549 -0.883 -1.204 -1.782
t-stat -0.851 -1.245 -1.812 -2.075 -1.918 -2.045 -3.038
dp 0.004 0.006 0.017 0.043 0.056 0.056 0.038
t-stat 0.930 0.677 0.825 1.061 1.079 0.982 0.666
tms 0.461 0.924 1.870 2.883 2.834 2.668 1.783
t-stat 3.439 3.181 3.331 2.729 1.962 1.877 1.702
def -2.028 -3.405 -5.250 -6.321 -5.931 -6.599 -7.841
t-stat -4.553 -3.767 -3.465 -2.834 -1.906 -1.613 -1.939
rrel 0.643 1.148 1.642 0.712 -0.005 -0.084 -0.230
t-stat 3.287 3.270 2.798 0.634 -0.004 -0.086 -0.243
cay -0.088 -0.174 -0.339 -0.368 -0.383 -0.601 -0.913
t-stat -1.351 -1.151 -0.970 -0.520 -0.414 -0.613 -0.994
R2
0.282 0.273 0.234 0.227 0.264 0.300 0.368
49

Panel B: Multivariate Employment Growth Predictability
h = 1 h = 2 h = 4 h = 8 h = 12 h = 16 h = 20
cc 0.013 0.016 0.005 -0.062 -0.164 -0.303 -0.480
t-stat 1.491 0.834 0.140 -1.026 -1.770 -2.307 -3.153
dp 0.004 0.008 0.018 0.037 0.048 0.054 0.058
t-stat 3.840 3.205 3.238 3.309 3.094 2.665 2.486
tms 0.153 0.310 0.616 0.988 1.007 0.754 0.405
t-stat 4.230 3.735 3.831 3.288 2.465 1.844 1.072
def -0.608 -1.152 -1.982 -2.959 -3.088 -3.032 -3.259
t-stat -5.264 -4.646 -4.185 -3.425 -2.376 -1.819 -1.871
rrel 0.156 0.229 0.260 -0.069 -0.312 -0.470 -0.586
t-stat 3.268 2.509 1.546 -0.211 -0.845 -1.191 -1.320
cay -0.036 -0.080 -0.157 -0.278 -0.403 -0.516 -0.717
t-stat -1.963 -1.903 -1.737 -1.689 -1.755 -1.927 -2.336
R2
0.255 0.235 0.228 0.289 0.329 0.354 0.433
50

Table 15. Alternative Detrending
Panel A, B, and C present results from predictive regressions of h-period ahead log
stock returns, investment growth, and employment growth. As predictive variable, we
use cyclical consumption defined either as the residual in a quadratic trend specification,
ct = β1 + β2t + β3t2 + ωt, or defined by assuming that consumption follows a random
walk such that the Hamilton filter implies that cct = ct − ct−k where k = 6 years. For
each regression, the table reports the slope estimate, the Newey-West corrected t-statistic
(h lags), and the adjusted R2 statistic. The sample covers the period from 1954Q1 to
2017Q4.
51

Panel A: Stock Return Predictability
h = 1 h = 2 h = 4 h = 8 h = 12 h = 16 h = 20
Quadratic trend
cc -0.606 -1.197 -2.355 -4.345 -5.470 -6.697 -7.377
t-stat -3.708 -3.731 -3.603 -4.337 -5.927 -7.351 -5.845
R2
0.039 0.073 0.148 0.283 0.345 0.411 0.387
Random walk
cc -0.360 -0.714 -1.382 -2.463 -3.227 -4.379 -5.380
t-stat -3.234 -3.850 -4.229 -4.372 -4.769 -5.766 -6.682
R2
0.033 0.062 0.124 0.221 0.293 0.423 0.466
Panel B: Investment Growth Predictability
h = 1 h = 2 h = 4 h = 8 h = 12 h = 16 h = 20
Quadratic trend
cc -0.028 -0.133 -0.552 -1.703 -2.645 -3.207 -3.475
t-stat -0.538 -1.159 -2.208 -3.560 -4.597 -5.315 -5.010
R2
-0.002 0.005 0.049 0.209 0.372 0.467 0.488
Random walk
cc -0.026 -0.083 -0.284 -0.757 -1.108 -1.349 -1.709
t-stat -0.838 -1.348 -2.456 -3.187 -3.017 -2.543 -2.844
R2
-0.001 0.005 0.030 0.091 0.158 0.197 0.264
Panel C: Employment Growth Predictability
h = 1 h = 2 h = 4 h = 8 h = 12 h = 16 h = 20
Quadratic trend
cc 0.004 -0.019 -0.124 -0.460 -0.780 -1.028 -1.196
t-stat 0.250 -0.602 -1.695 -3.086 -3.693 -3.679 -3.237
R2
-0.004 -0.002 0.025 0.150 0.279 0.361 0.389
Random walk
cc 0.005 -0.003 -0.046 -0.168 -0.277 -0.377 -0.501
t-stat 0.608 -0.156 -1.206 -1.983 -1.983 -1.918 -1.955
R2
-0.003 -0.004 0.006 0.046 0.083 0.114 0.151
52

Figure 1. Cyclical Consumption
53