Embed Size (px)
Citation preview

Louisiana State UniversityLSU Digital Commons
LSU Doctoral Dissertations Graduate School
2017
The Role of Surface Active Compounds in CrudeOil on Reservoir Wettability.Paulina Metili MwangiLouisiana State University and Agricultural and Mechanical College, [email protected]
Follow this and additional works at: https://digitalcommons.lsu.edu/gradschool_dissertations
Part of the Petroleum Engineering Commons
This Dissertation is brought to you for free and open access by the Graduate School at LSU Digital Commons. It has been accepted for inclusion inLSU Doctoral Dissertations by an authorized graduate school editor of LSU Digital Commons. For more information, please [email protected].
Recommended CitationMwangi, Paulina Metili, "The Role of Surface Active Compounds in Crude Oil on Reservoir Wettability." (2017). LSU DoctoralDissertations. 4353.https://digitalcommons.lsu.edu/gradschool_dissertations/4353

THE ROLE OF SURFACE ACTIVE COMPOUNDS IN CRUDE OIL ON
RESERVOIR WETTABILITY
A Dissertation
Submitted to the Graduate Faculty of the
Louisiana State University and
Agricultural and Mechanical College
in partial fulfillment of the degree of
Doctor of Philosophy
in
The Department of Petroleum Engineering.
by
Paulina Metili Mwangi
B.S. University of Rochester, 2008
MS. Louisiana State University, 2010
May 2017

ii
ACKNOWLEDGEMENTS
I wish to extend my deepest gratitude and appreciation to my committee members Dr.
Radonjic Mileva, Dr. Geoffrey Thyne, Dr. Patrick Brady, Dr. Stephen Sears, and Dr. Mayank
Tyagi, for all their guidance and support throughout my studies. I would like to express my greatest
appreciation to Dr. Dandina Rao for the opportunity to work and train in his laboratories. A very
big thank you to Dr. Geoffrey Thyne for his patience, guidance, and mentorship. I am also
thankful, for Dr. Radonjic Mileva granting me a platform to complete my dissertation. I am
particularly grateful to Craft and Hawkins Petroleum Engineering department for the financial
support of this project. I am thankful to the faculty members whom I have trained under for their
patience and generosity throughout the years. Lastly, I would like to thank my laboratory mates
(Mohamed Al Riyami, Ruiz Paidin, and Sandeep Gupta) for creating a lovely, engaging, and
enjoyable working atmosphere.
Finally, I am eternally indebted to my dearest husband and son, Chukwudi and Chibuikem,
for their endless love, humor, and support. You have certainly made this journey more enjoyable
and richer, and for that I thank you. Mom and Dad (Simon and Jane Mwangi) thank you for setting
a great example for us to follow. I also thank you for all the prayers and sacrifices you made to get
me to where I am, I dedicate this dissertation to you. To my wonderful siblings, Anthony, Dena,
and Cornelius Mwangi, you are the best, and I am super thankful for cheering me through my
academic and professional career. Much love to all of you! A special thank you to my dearest
friends and cheerleaders (Lina Bernaola, Jennifer Toscano, etc.). Thank you!!

iii
TABLE OF CONTENTS
ACKNOWLEDGEMENTS ............................................................................................................ ii
LIST OF FIGURES ...................................................................................................................... vii
LIST OF TABLES ........................................................................................................................ xii
ABSTRACT ................................................................................................................................. xiv
CHAPTER 1. INTRODUCTION ............................................................................................. 1
CHAPTER 2. LITERATURE REVIEW .................................................................................. 3
2.1. Oil-Rock Adhesion ........................................................................................................... 3
2.2. Surfaces Forces Influencing Rock-Oil-Brine Interaction................................................. 4
2.2.1. van der Waals Forces ................................................................................................ 4
2.2.2. Structural Forces ....................................................................................................... 4
2.2.3. Electrostatic Forces ................................................................................................... 5
2.2.3.1. Zeta Potential ..................................................................................................... 6
2.3. Parameters Influencing Oil-Rock-Brine Interaction ........................................................ 7
2.3.1. Rock Mineralogy ...................................................................................................... 7
2.3.2. Aqueous Chemistry ................................................................................................... 8
2.3.2.1. Brine Salinity ..................................................................................................... 9
2.3.2.2. Brine Composition ............................................................................................. 9
2.3.2.3. Brine pH .......................................................................................................... 11
2.3.3. Oil Chemistry .......................................................................................................... 11
2.3.4. Temperature ............................................................................................................ 12
2.4. Wettability Measurement Methods ................................................................................ 13
2.4.1. Flow Measurement Methods................................................................................... 13
2.4.2. Contact Angles Methods ......................................................................................... 14
2.4.3. Flotation Method ..................................................................................................... 15
2.5. Wettability of Sandstone Reservoirs .............................................................................. 17
2.5.1. Low Salinity Waterflooding in Sandstone Reservoirs ............................................ 17
2.5.2. Wettability Alteration Mechanisms in Sandstone Reservoirs ................................ 18
2.5.2.1. Effect of Fine Migration .................................................................................. 18
2.5.2.2. Effect of pH Variation ..................................................................................... 19
2.5.2.3. Effect of Multicomponent Ion Exchange ........................................................ 19
2.5.2.4. Effect of Electric Double Layer ....................................................................... 20
2.5.2.5. Chemical Low Salinity Mechanism ................................................................ 21
2.6. Wettability of Carbonate Reservoirs .............................................................................. 22
2.6.1. Low Salinity Waterflooding in Carbonate Reservoir ............................................. 22

iv
2.6.2. Wettability Alteration Mechanisms in Carbonate Reservoirs ................................ 23
2.6.2.1. Effect of Multivalent Ions................................................................................ 23
2.6.2.2. Effect of Ionic Strength ................................................................................... 25
2.6.2.3. Effect of Rock Dissolution .............................................................................. 25
2.6.2.4. Effect of Electric Double Layer ....................................................................... 26
2.7. Summary ........................................................................................................................ 26
CHAPTER 3. EXPERIMENTAL METHODOLOGY .......................................................... 28
3.1. Materials ......................................................................................................................... 28
3.1.1. Rock Material.......................................................................................................... 28
3.1.2. Oil ........................................................................................................................... 29
3.1.3. Brine ........................................................................................................................ 31
3.2. Sample Preparation ........................................................................................................ 32
3.2.1. Rock sample preparation......................................................................................... 32
3.2.2. Model oil preparation .............................................................................................. 32
3.3. Methods .......................................................................................................................... 32
3.3.1. Modified Flotation Technique ................................................................................ 32
3.3.2. Dual Drop Dual Crystal Technique ........................................................................ 33
3.3.3. X-Ray Diffraction Technique ................................................................................. 34
3.3.4. Gas Chromatograph Technique .............................................................................. 35
CHAPTER 4. MODIFIED FLOTATION TECHNIQUE FUNDAMENTALS ..................... 37
4.1. Flotation Requirements .................................................................................................. 40
4.2. Flotation Fundamentals .................................................................................................. 43
4.2.1. Flotation Force Balance .......................................................................................... 43
4.2.2. Wetting Forces in Flotation .................................................................................... 48
CHAPTER 5. TECHNIQUE DEVELOPMENT, REFINEMENT, & VALIDATION ......... 53
5.1. Development .................................................................................................................. 53
5.2. Refinement ..................................................................................................................... 56
5.2.1. Scale-Up Refinement .............................................................................................. 56
Further Procedure Refinements .......................................................................................... 57
5.2.2. Effect of Grain Size on MFT Results ..................................................................... 60
5.2.3. Rock-Oil-Brine Aging Time Investigation ............................................................. 62
5.3. Rock Mineralogy Characterization ................................................................................ 64
5.3.1. Baseline Test ........................................................................................................... 64
5.3.2. Composition of Oil-Wet versus Water-Wet Berea Samples................................... 65
Neutral Oil Results ................................................................................................................ 66
Acidic and Condensate Oil Results ....................................................................................... 66

v
5.4. MFT Validation .............................................................................................................. 67
CHAPTER 6. ROLE OF SURFACE ACTIVE COMPOUNDS ON RESERVOIR
SANDSTONE AND CARBONATE WETTABILITY................................................................ 71
6.1. Establishing Baseline Conditions of All 4 Rock Types ................................................. 71
6.2. The Effect of SAC Concentration on Wettability .......................................................... 72
6.3. A Detailed Examination of the Structure of SAC on Wettability. ................................. 77
6.3.1. Aromatic compound and its effect on wettability ................................................... 77
6.3.2. Sulfur SAC and its effect on wettability ................................................................. 78
6.3.3. Oxygen SAC and its effect on wettability .............................................................. 80
6.3.4. Nitrogen SAC and its effect on wettability ............................................................. 83
CHAPTER 7. EFFECTS OF BRINE SALINITY, TEMPERATURE, AND SURFACE
ACTIVE COMPOUNDS ON WETTABILITY ........................................................................... 85
7.1. Baseline Wetting ............................................................................................................ 85
7.2. Effect of Salinity and SACs on Sandstone and Carbonate Wettability.......................... 86
7.2.1. Aromatic ................................................................................................................. 87
7.2.2. Sulfur SAC .............................................................................................................. 88
7.2.3. Oxygen SAC ........................................................................................................... 90
7.2.4. Nitrogen SAC.......................................................................................................... 93
CHAPTER 8. DISCUSSION .................................................................................................. 95
8.1. MFT ................................................................................................................................ 95
8.1.1. MFT Limitations ..................................................................................................... 97
8.2. Effects of Surface Active Components on Wettability .................................................. 98
8.2.1. Sandstone .............................................................................................................. 101
8.2.2. Carbonates............................................................................................................. 103
8.2.3. SACs Overview .................................................................................................... 112
8.3. Wettability Revisited .................................................................................................... 115
8.3.1. Traditional wettability ........................................................................................... 115
8.3.2. Wettability: Scale of Measurement ....................................................................... 117
8.3.3. Wettability: Inherent vs. Situational Wettability .................................................. 119
8.4. Field Application .......................................................................................................... 122
8.4.1. Wettability Studies ................................................................................................ 122
8.4.1.1. Current Challenges in Studying Wettability .................................................. 122
8.4.1.2. Wettability Studies using MFT...................................................................... 123
8.4.2. Ionically Modified Waterflooding ........................................................................ 125
8.4.3. Surfactant Flooding ............................................................................................... 125
8.4.4. Core Cleaning Solvent Selection .......................................................................... 126

vi
CHAPTER 9. CONCLUSION ............................................................................................. 129
CHAPTER 10. RECOMMENDATION ................................................................................. 132
CHAPTER 11. REFERENCES .............................................................................................. 134
APPENDIX A: FIGURES AND TABLES ................................................................................ 147
APPENDIX B: CORE CLEANING SOLVENT ANALYSIS ................................................... 153
B1. Decane - DI water - Rock system................................................................................. 154
B2. Decane + Basic SAC - DI water - Rock system ........................................................... 155
B3. Decane + Acidic SAC - DI water - Rock system ......................................................... 157
APPENDIX C: RAW DATA ..................................................................................................... 160
APPENDIX D: VITA ................................................................................................................. 188

vii
LIST OF FIGURES
Figure 1: Electric double layer model (e.g. Davis et al., 1978). ..................................................... 6
Figure 2: Schematic of Amott and USBM measurements. ........................................................... 14
Figure 3: Schematic of sessile drop contact angle measurements ................................................ 14
Figure 4: Mortar and pestle were used to grind the rock samples and a series of sieves were used
to separate the rock powder to different rock size distributions. .................................................. 29
Figure 5: Schematic depiction of DDDC contact angle measurement method (Rao & Girard, 2006).
....................................................................................................................................................... 33
Figure 6: XRD instrument ............................................................................................................ 34
Figure 7: Detailed schematic depicting the MFT procedure. ....................................................... 37
Figure 8: Indirect and direct adsorption of oil on reservoir mineral surfaces (Brady & Thyne, 2016).
....................................................................................................................................................... 39
Figure 9: Results of water-wet and oil-wet 88-149 µm glass beads which are in the transitional
region. ........................................................................................................................................... 42
Figure 10: Results of water-wet and oil-wet 425-600 µm glass beads which are in transitional
region. ........................................................................................................................................... 42
Figure 11: Results of water-wet and oil-wet 3000 µm glass beads which are in the gravitational
force dominant region. .................................................................................................................. 42
Figure 12: Forces acting on a bubble-particle aggregate (Bloom & Heindel, 1997). ................... 44
Figure 13: Three-phase contact between the bubble, particle, and fluid regions (Bloom & Heindel,
1997). ............................................................................................................................................ 45
Figure 14: Heavy solid spherical particle with radius r and contact angle in the equilibrium at the
oil-water interface levelled at z=0 far from the particle. The three-phase contact line with radius rc
is depressed at the depth zc below the zero level. ........................................................................ 45
Figure 16: Test rock samples of 0.2, 0.5, and 1 grams of Berea, chalk, limestone, and dolomite
with the goal of reducing variability in measurement. ................................................................. 58
Figure 17: Different modifications (M1, M2, and M3) made to the procedure and their
improvements on the precision of wettability when using 1 gram of Berea, chalk, limestone, and
dolomite. ....................................................................................................................................... 59
Figure 18: Effect of grain size on wettability at 70°C. ................................................................. 61
Figure 19: Comparison of mineralogy of <53 µm and 149-206 µm Berea samples. ................... 61
Figure 20: 6 hrs, 1 day, and 2 days aging time for 2000 ppm Tetralin at 25°C, 70°C, & 110°C. 62
Figure 21: Aging time periods for Myristic acid (oxygen SAC) for Berea, chalk, limestone, and
dolomite. ....................................................................................................................................... 63
Figure 22: Aging time periods for Myristic acid (oxygen SAC) for Berea. ................................. 63
Figure 23: Comparison of Berea XRD measured and calculated mineralogy results. ................ 66

viii
Figure 24: The difference in composition between the settled rock fractions vs. floating rock
fraction of decane + 2000 ppm myristic SAC and condensate oil. ............................................... 67
Figure 25: Comparison between contact angle and MFT results of wettability alteration due to the
variation of sulfate concentration.................................................................................................. 69
Figure 26: Initial conditions set by decane + rock + deionized water at 70°C. ............................ 71
Figure 27: The effect of SAC concentration on the wettability of Berea sandstone. ................... 73
Figure 28: The effect of SAC concentration on the wettability of Austin chalk. ......................... 74
Figure 29: The effect of SAC concentration on the wettability of Silurian dolomite................... 75
Figure 30: The effect of SAC concentration on the wettability of Indiana limestone. ................. 76
Figure 31: Examples of aromatic compounds present in crude oil including Tetralin, which is used
as the model compound for the aromatic class. ............................................................................ 77
Figure 32: Effect of Tetralin on wettability in the presence of DI water at 70°C. ....................... 78
Figure 33: Examples of acid and non-acidic sulfur compounds. .................................................. 79
Figure 34: Structure of sulfur compounds used as sulfur SAC model compound........................ 79
Figure 35: Effect of sulfur SAC on wettability in the presence of DI water at 70°C. .................. 80
Figure 36: Structure of acidic oxygen compounds. ...................................................................... 80
Figure 37: Structure of non-acidic oxygen compounds. ............................................................... 81
Figure 38: Structures of selected acidic oxygen compounds. ....................................................... 81
Figure 39: Effect of oxygen SAC on wettability in the presence of DI water at 70°C. ................ 82
Figure 40: Examples of basic nitrogen SAC present in crude oil including pyridine and quinoline
which are used as model compounds for the basic nitrogen class. ............................................... 83
Figure 41: Examples of non-basic nitrogen SAC present in crude oil including carbazole, which is
used as the model compound for the neutral nitrogen class. ........................................................ 83
Figure 42: Effect of nitrogen SAC on wettability in the presence of DI water at 70°C. .............. 84
Figure 43: Experimental measurement of wettability for the four rock types at 0, 1000, 10,000 and
100,000 ppm TDS and three temperatures (25, 70 and 110°C). ................................................... 86
Figure 44: Experimental measurement of wettability for the four rock types at 0, 1000, 10,000 and
100,000 ppm TDS and three temperatures (25, 70, 110°C) when using tetralin. Values below 5%
are not displayed. .......................................................................................................................... 87
Figure 45: Experimental measurement of wettability for the four rock types at 0, 1000, 10,000 and
100,000 ppm TDS and three temperatures (25, 70, 110°C) when using Dibenzothiophene (S1)
SAC. Values below 5% are not displayed. ................................................................................... 88
Figure 46: Experimental measurement of wettability for the four rock types at 0, 1000, 10,000 and
100,000 ppm TDS and three temperatures (25, 70, 110°C) when using Di-n-butyl sulfide (S2)
SAC. Values below 5% are not displayed. ................................................................................... 89

ix
Figure 47: Experimental measurement of wettability for the four rock types at 0, 1000, 10,000 and
100,000 ppm TDS and three temperatures (25, 70, 110°C) when using 1-tetradecanethiol (S3)
SAC. Values below 5% are not displayed. ................................................................................... 90
Figure 48: Experimental measurement of wettability for the four rock types at 0, 1000, 10,000 and
100,000 ppm TDS and three temperatures (25, 70, 110°C) when using acetic acid (O1) SAC.
Values below 5% are not displayed. ............................................................................................. 91
Figure 49: Experimental measurement of wettability for the four rock types at 0, 1000, 10,000 and
100,000 ppm TDS and three temperatures (25, 70, 110°C) when using myristic acid (O2) SAC.
Values below 5% are not displayed. ............................................................................................. 92
Figure 50: Experimental measurement of wettability for the four rock types at 0, 1000, 10,000 and
100,000 ppm TDS and three temperatures (25, 70, 110°C) when using naphthenic acid (O3) SAC.
Values below 5% are not displayed. ............................................................................................. 92
Figure 51: Experimental measurement of wettability for the four rock types at 0, 1000, 10,000 and
100,000 ppm TDS and three temperatures (25, 70, 110°C) when using carbazole (N1) SAC. Values
below 5% are not displayed. ......................................................................................................... 93
Figure 52: Experimental measurement of wettability for the four rock types at 0, 1000, 10,000 and
100,000 ppm TDS and three temperatures (25, 70, 110°C) when using quinoline (N2) SAC. Values
below 5% are not displayed. ......................................................................................................... 94
Figure 53: Experimental measurement of wettability for the four rock types at 0, 1000, 10,000 and
100,000 ppm TDS and three temperatures (25, 70, 110°C) when using pyridine (N3) SAC. Values
below 5% are not displayed. ......................................................................................................... 94
Figure 54: (a) Pore surface network representation of Ketton carbonate extract from micro-CT
images (Menke et al., 2015) and (b) its given properties. (c) gives the calculated surface area values
of the core if it was crushed to the given grain size distribution and the ratio of the total surface
area of crushed core versus pore surface area of the whole core. ................................................. 97
Figure 55: Experimental measurement of wettability for the four rock types at 0 ppm TDS and
70°C when using oxygen SACs at 3 concentrations (1000, 2000, 4000 ppm). Values below 5% are
not displayed. ................................................................................................................................ 99
Figure 56: Experimental measurement of wettability for the four rock types at 0 ppm TDS and
70°C when using non-basic and non-acidic SACs. Values below 5% are not displayed. .......... 100
Figure 57: Experimental measurement of wettability for Berea at 0, 1000, 10,000 and 100,000 ppm
TDS and three temperatures (25, 70, 110°C) when using oxygen SACs. Values below 5% are not
displayed. .................................................................................................................................... 102
Figure 58: Experimental measurement of wettability for Berea at 0, 1000, 10,000 and 100,000 ppm
TDS and three temperatures (25, 70, 110°C) when using nitrogen SACs. Values below 5% are not
displayed. .................................................................................................................................... 103
Figure 59: Experimental measurement of wettability for chalk and limestone at 0, 1000, 10,000
and 100,000 ppm TDS and three temperatures (25, 70, 110°C) when using acetic acid SAC. Values
below 5% are not displayed. ....................................................................................................... 104

x
Figure 60: Experimental measurement of wettability for chalk and limestone at 0, 1000, 10,000
and 100,000 ppm TDS and three temperatures (25, 70, 110°C) when using carbazole SAC. Values
below 5% are not displayed. ....................................................................................................... 105
Figure 61: Experimental measurement of wettability for the carbonate rocks at 0, 2000, 4000 ppm
of nitrogen SACs and 70°C. Values below 5% are not displayed. ............................................. 106
Figure 62: Experimental measurement of wettability for chalk at 0, 1000, 10,000 and 100,000 ppm
TDS and three temperatures (25, 70, 110°C) when using long-chained oxygen SACs and acidic
sulfur acidic SAC. Values below 5% are not displayed. ............................................................ 107
Figure 63: Experimental measurement of wettability for dolomite at 0, 1000, 10,000 and 100,000
ppm TDS and three temperatures (25, 70, 110°C) when using acetic acid SAC and nitrogen SACs.
Values below 5% are not displayed. ........................................................................................... 108
Figure 64: Experimental measurement of wettability for dolomite at 0, 1000, 10,000 and 100,000
ppm TDS and three temperatures (25, 70, 110°C) when using long-chained oxygen SACs and
acidic sulfur acidic SAC. Values below 5% are not displayed. .................................................. 109
Figure 65: Experimental measurement of wettability for the carbonate rocks at 0, 1000, 10,000 and
100,000 ppm TDS and three temperatures (25, 70, 110°C) when using tetralin. Values below 5%
are not displayed. ........................................................................................................................ 109
Figure 66: Experimental measurement of wettability for dolomite at 0, 1000, 10,000 and 100,000
ppm TDS and three temperatures (25, 70, 110°C) when using acetic acid, 1-Tetradecanethiol, and
pyridine SACs. Values below 5% are not displayed. ................................................................. 111
Figure 67: Experimental measurement of wettability for dolomite at 0, 1000, 10,000 and 100,000
ppm TDS and three temperatures (25, 70, 110°C) when using naphthenic acids SAC. Values below
5% are not displayed. .................................................................................................................. 111
Figure 69: Experimental measurement of the SACs ability to change wettability of chalk as salinity
is decreased from 100,000 to 10,000 ppm TDS at 70 and 110°C. Changes in wettability less than
+/- 10% as salinity is decreased are not displayed. ..................................................................... 113
Figure 70: Experimental measurement of the SACs ability to change wettability of dolomite as
salinity is decreased from 100,000 to 10,000 ppm TDS at 70 and 110°C. Changes in wettability
less than +/- 10% as salinity is decreased are not displayed. ...................................................... 114
Figure 71: Experimental measurement of the SACs ability to change wettability of limestone as
salinity is decreased from 100,000 to 10,000 ppm TDS at 70 and 110°C. Changes in wettability
less than +/- 10% as salinity is decreased are not displayed. ...................................................... 114
Figure 72: Different scales that wettability is measured by flow measurements (whole core scale),
contact angles (contact angle core scale) and MFT (grain scale). .............................................. 116
Figure 73: Experimental measurement of wettability for dolomite at 0, 1000, 10,000 and 100,000
ppm TDS and 110°C when using acetic acid and myristic acid SACs. Values below 5% are not
displayed. .................................................................................................................................... 120
Figure 74: Experimental measurement of wettability for dolomite at 0 ppm TDS and three
temperatures (25, 70, 110°C) when using acetic acid and myristic acid SACs. Values below 5%
are not displayed. ........................................................................................................................ 120

xi
Figure 75: Experimental measurement of wettability for chalk and limestone at 0, 1000, 10,000
and 100,000 ppm TDS and 110°C when using myristic acid and carbazole SACs. Values below
5% are not displayed. .................................................................................................................. 121
Figure A1: GC results of condensate oil. .................................................................................... 147
Figure A2: 6 hrs, 1 day, & 2 days aging time for decane at 25°C, 70°C, & 110°C. .................. 148
Figure A3: 6 hrs, 1 day, & 2 days aging time for condensate at 25°C, 70°C, & 110°C. ............ 149
Figure A4: 6 hrs, 1 day, & 2 days aging time for decane +2000 ppm Di-n-butyl sulfide (sulfur
SAC) and 2000ppm Quinoline (nitrogen SAC) at 25°C, 70°C, & 110°C. ................................. 149
Figure A5: 6 hrs, 1 day, & 2 days aging time for decane +2000 ppm Quinoline (nitrogen SAC) at
25°C, 70°C, & 110°C. ................................................................................................................. 150
Figure A6: Sandstone Berea XRD mineralogy results. .............................................................. 150
Figure A7: Austin chalk XRD mineralogy results. ..................................................................... 151
Figure A8: Indiana limestone XRD mineralogy results. ............................................................ 151
Figure A9: Silurian dolomite XRD mineralogy results. ............................................................. 152
Figure B1: Effects of the selected cleaning solvents on the wettability of Berea, Austin chalk,
Silurian dolomite, and Indiana limestone in the presence of decane and DI water .................... 155
Figure B2: Effects of selected cleaning solvents on the wettability of Berea, Austin chalk, Silurian
dolomite, and Indiana limestone in the presence of decane + basic (quinoline) SAC and DI water.
..................................................................................................................................................... 156
Figure B3: Effects of the selected cleaning solvents on the wettability of Berea, Austin chalk,
Silurian dolomite, and Indiana limestone in the presence of myristic acid. ............................... 158
Figure B4: Effects of the selected cleaning solvents on the wettability of Berea, Austin chalk,
Silurian dolomite, and Indiana limestone in the presence of naphthenic acid. ........................... 158

xii
LIST OF TABLES
Table 1: Proposed mechanisms for adsorption of organic functional group (Sposito, 1989)....... 20
Table 2: Surface active compounds used in this study. ................................................................ 29
Table 3: Compositional Analysis of Condensate. ......................................................................... 30
Table 4: Brine compositions (all in mg/L). ................................................................................... 31
Table 5: XRD experimental conditions ........................................................................................ 35
Table 6: Comparison of the two published flotation experiment procedure by Wu et al (2008) and
Dubey and Doe (1993). The asterisk (*) indicates the main differences in the two procedures. . 53
Table 7: Effects of oil composition on wettability @ 70°C using Wu et al. (2008), Dubey and Doe
(1993), and Dubey and Doe (1993) with drying step. WW represents water-wet conditions; OW
is oil-wet........................................................................................................................................ 55
Table 8: Original Modified Flotation Technique (MFT) Procedure ............................................. 56
Table 9: Refined MFT Procedure ................................................................................................. 60
Table 10: XRD baseline results of Berea, chalk, limestone, and dolomite .................................. 64
Table 11: Berea MFT Wettability results. .................................................................................... 65
Table 12: Contact angle and MFT outputs and wettability........................................................... 67
Table 13: Contact angle and MFT results on the effect of varying sulfate on wettability ........... 68
Table 14: Contact angle and MFT results on the effect of varying salinity on wettability. ......... 70
Table A1: Condensate oil GC composition. ............................................................................... 147
Table C1: Raw data for 1000 ppm on wettability in the presence of 0 ppm TDS at 70°C. Each
experiment was repeated at least 3 times and their standard deviation is reported. ................... 160
Table C2: Raw data for 2000 ppm on wettability in the presence of 0 ppm brine at 70°C. Each
experiment was repeated at least 3 times and their standard deviation is reported. ................... 162
Table C3: Raw data for 4000 ppm on wettability in the presence of DI water at 70°C. Each
experiment was repeated at least 3 times and their standard deviation is reported. ................... 164
Table C4: Raw data for 2000 ppm of SAC on rock wettability in the presence of 100,000 ppm
TDS brine at 25°C. Each experiment was repeated at least 3 times and their standard deviation is
reported. ...................................................................................................................................... 166
Table C5: Raw data for 2000 ppm of SAC on rock wettability in the presence of 100,000 ppm
TDS brine at 70°C. Each experiment was repeated at least 3 times and their standard deviation is
reported. ...................................................................................................................................... 168
Table C6: Raw data for 2000 ppm of SAC on rock wettability in the presence of 100,000 ppm
TDS brine at 110°C. Each experiment was repeated at least 3 times and their standard deviation is
reported. ...................................................................................................................................... 170

xiii
Table C7: Raw data for 2000 ppm of SAC on rock wettability in the presence of 10,000 ppm TDS
brine at 25°C. Each experiment was repeated at least 3 times and their standard deviation is
reported. ...................................................................................................................................... 172
Table C8: Raw data for 2000 ppm of SAC on rock wettability in the presence of 10,000 ppm TDS
brine at 70°C. Each experiment was repeated at least 3 times and their standard deviation is
reported. ...................................................................................................................................... 174
Table C9: Raw data for 2000 ppm of SAC on rock wettability in the presence of 10,000 ppm TDS
brine at 110°C. Each experiment was repeated at least 3 times and their standard deviation is
reported. ...................................................................................................................................... 176
Table C10: Raw data for 2000 ppm of SAC on rock wettability in the presence of 1,000 ppm TDS
brine at 25°C. Each experiment was repeated at least 3 times and their standard deviation is
reported. ...................................................................................................................................... 178
Table C11: Raw data for 2000 ppm of SAC on rock wettability in the presence of 1,000 ppm TDS
brine at 70°C. Each experiment was repeated at least 3 times and their standard deviation is
reported. ...................................................................................................................................... 180
Table C12: Raw data for 2000 ppm of SAC on rock wettability in the presence of 1,000 ppm TDS
brine at 110°C. Each experiment was repeated at least 3 times and their standard deviation is
reported. ...................................................................................................................................... 182
Table C13: Raw data for 2000 ppm of SAC on rock wettability in the presence of 0 ppm TDS
brine at 25°C. Each experiment was repeated at least 3 times and their standard deviation is
reported. ...................................................................................................................................... 184
Table C14: Raw data for 2000 ppm of SAC on rock wettability in the presence of 0 ppm TDS
brine at 110°C. Each experiment was repeated at least 3 times and their standard deviation is
reported. ...................................................................................................................................... 186

xiv
ABSTRACT
This study examines the role of crude oil’s surface active compounds (SAC) in determining
the reservoir wettability. Wettability describes the relative preference of a reservoir rock for oil or
water. Wettability influences the distribution of fluids in a reservoir and the efficiency of oil
recovery methods. Unfortunately, the chemical mechanisms controlling wettability in individual
reservoirs remain hazy.
Wettability is conditional and is influenced by rock mineralogy, fluid chemistry, and
temperature. An extensive experimental study was executed to understand the impact of naturally-
occurring SACs typically found in crude oil, on the wettability of sandstone and carbonate rocks
over a range of salinities and temperatures. To isolate the effects of individual SACs, this project
used model oil mixtures of pure decane and SACs to represent the oleic phase. The four groups of
SAC studied are: aromatic, oxygen-bearing, sulfur-bearing, and nitrogen-bearing SACs. Due to
the large number of experiments in this study, standard wettability measurement methods were not
used due their limitation of the time and expense it takes to run a single experiment. To overcome
this barrier, we developed a measurement technique that was fast, reliable, and would serve as
both a screening tool and provide quantitative results. This wettability measurement method is
known as the modified flotation technique (MFT).
In the quest to determine why low salinity waterflooding is successful in increasing oil
recovery in some reservoirs and not in others, this study found that it is crucial to accurately
characterize crude oil, brine, and reservoir rock material. This allows one to effectively engineer
injection water chemistry which would favorably alter wettability, and maximize oil recovery. The
overall effect toward either oil-wet or water-wet conditions was observed to depend more on brine
salinity than temperature. As salinity was decreased nitrogen SACs, non-acidic sulfur SACs, and
the short chained oxygen SAC shifted the wettability of the carbonate rocks towards water-wet

xv
conditions. Long chained acids SACs, acidic sulfur SACs, and aromatics shifted the wettability of
carbonates towards oil-wet conditions as brine salinity was decreased. This difference in SACs’
reaction to salinity was proposed as one of the reasons why low salinity waterflooding is successful
in some reservoirs and not in others.

1
CHAPTER 1. INTRODUCTION
To meet the global rising energy demand, the oil and gas industry is challenged to
maximize oil recovery from the existing hydrocarbon reservoirs. The current global average field
recovery from waterflooding is around 35%, leaving between 60 to 70% of oil in place (Shell,
2016). This represents a substantial opportunity for enhanced oil recovery (EOR) processes. EOR
methods strive to mobilize crude oil by lowering the interfacial tension (IFT) and/or by altering
wettability to a favorable wetting state. The concept of engineering and optimizing the injected
water chemistry has proved to be a promising EOR technique popularly known as “low salinity
waterflooding (LoSal™)” by BP (Lager et al., 2008), “designer waterflooding” by Shell (Ligthelm
et al., 2011), “advanced ion management” by ExxonMobil (Gupta et al., 2009), “smart
waterflooding” by (Yousef et al., 2011), and “ionically modified waterflooding” by Sohal et al.,
2016).
In the last 2 decades, many experimental studies have been performed to investigate the
recovery mechanisms governing low salinity waterflooding. Of the proposed mechanism,
wettability alteration has garnered the most attention as the main mechanism controlling the
success of low salinity waterflooding. Numerous publications have reported low salinity’s success
in increasing oil recovery in certain reservoirs (Sylte et al., 1988; Hallenbeck et al., 1991;
Jadhunandan & Morrow, 1995; Tang & Morrow, 1997); as others, have reported small to
negligible oil recovery improvements (Boussour et al., 2009; Cissokho et al., 2009; Thyne &
Gamage, 2011; Al-Shalabi et al., 2014). This has prompted further studies to understand
wettability and the mechanisms that control wettability alteration.
Wettability describes the relative preference of a reservoir rock for oil or water, and it is a
product of the balance of surface forces between the interaction of oil and water with the surface
of the rock. Depending on the specific interactions, the wettability of a system can range from

2
strongly water-wet to strongly oil-wet. Degrees of wetting apply along the wettability continuum,
and as shown in this study, the oil chemistry, water chemistry, rock morphology and mineralogy,
and temperature govern where in the continuum the rock wettability lies. At a grain level,
wettability is homogenous, meaning it is either water-wet or oil-wet. At a reservoir scale,
wettability is heterogeneous or fractional-wet (Brown & Fatt, 1956). Fractional wettability states
that portions of the rock are water-wet while others are oil-wet. The two forms of
heterogeneous/fractional wettability are: mixed-wettability and speckled/spotted/dalmatian
wettability. Salathiel (1973) proposed mixed-wettability where oil-wet surfaces form continuous
paths through the larger pores, as the smaller pores remain water-wet and contain no oil.
Speckled/spotted/dalmatian wettability refers to continuous water-wet surface encompassing areas
of discontinuous oil-wet surfaces or vice versa (Morrow et al., 1986; Cuiec, 1991).
Knowing wettability is a key to understanding the distribution of fluids in a reservoir. In
addition, it is also the key to engineering more effective and efficient oil recovery methods.
However, wettability has proven to be a complicated geochemical problem due to the numerous
reservoir parameters that control it. This problem is further exacerbated by standard wettability
measurement methods being limited by the time (days to weeks) and expense it takes to run a
single experiment. This presents a significant bottleneck for laboratory experiments. Therefore,
the chemical mechanisms controlling wettability in individual reservoirs remain hazy.
My goals are to develop a wettability measurement technique that is inexpensive, rapid,
and reproducible, and to use it to describe the role of oil surface active compounds (SAC’s) in
determining wettability in carbonate and sandstone reservoirs.

3
CHAPTER 2. LITERATURE REVIEW
2.1. Oil-Rock Adhesion
Wettability represents a balance between cohesive and adhesive forces. In oil wetting of a
rock in the presence of water, cohesive forces within the oil cause a drop to ball up and avoid
contact with the rock surface (water-wet). Adhesive forces cause oil to spread across the rock
surface (oil-wet). At the molecular level, electrostatic (and van der Waals) interactions likely
control oil-rock adhesion (Dubey & Doe, 1993; Buckley et al., 1989). Electrostatic interactions are
governed by aqueous chemistry, oil chemistry, rock mineralogy, and temperature. Electrostatic
forces are caused by interaction between charged oil and mineral surfaces (Busireddy and Rao,
2004; Israelachvili, 2011). The oil surface is charged because polar molecules of nitrogen and
oxygen are segregated at the oil-water interface. Mineral surfaces are charged because broken,
unsaturated bonds hydrate at the mineral-water interface. Electrostatic interaction can either be
repulsive, attractive, or a combination of both (Hirasaki, 1991). Historically, quantitatively linking
electrostatics with wettability and oil recovery has been limited by three factors: (1) multiple
electrostatic mechanisms can operate simultaneously preventing determination of the individual
contributions, (2) experimental and field data from cores are the sum of chemical and physical
processes, making it difficult to isolate the specific chemical role of surface charge; and lastly, (3)
surface charge measurements on rocks have typically been measured using zeta potentials, which
are not easily converted into mechanistic and predictive thermodynamic models (Brady et al.,
2015).
SACs make up the charged sites at the crude oil-water interface and are the most likely to
interact electrostatically with the rock surface, and control wettability and recovery. SACs are
likely to be mostly nitrogen bases and carboxylic acids attached to non-polar hydrocarbon

4
chains/rings. This project tests the newly developed wettability measurement technique by
measuring the role of individual of SACs on oil adhesion to carbonate and sandstone minerals.
2.2. Surfaces Forces Influencing Rock-Oil-Brine Interaction
Derjaguin, Landau, Verwey, Overbeek (DLVO) theory suggests that the interaction forces
between rock, oil, and brine have three components: (1) van der Waals forces, (2) structural forces,
and (3) electrostatic interactions (e.g. Israelachivili, 2011).
2.2.1. van der Waals Forces
The van der Waals force acts between two materials and is typically attractive and results
from polarization between the particles on the molecular scale. While this force is not as strong as
electrostatic or hydrogen bonding interactions, it is always present. Gregory (1981) derived the
expression below for the retarded London van der Waals attractive force acting on two parallel
infinite plates
𝚷𝐋𝐕𝐀 =𝐀(𝟏𝟓.𝟗𝟔
𝐡
𝛌𝐥𝐰+𝟐)
𝟏𝟐𝛑𝐡𝟑(𝟏+𝟓.𝟑𝟐𝐡
𝛌𝐥𝐰)
𝟐 Equation 1
where A is the Hamaker constant in an oil/water/solid system, h is the distance between the two
plates, and λlw is the London wavelength. The van der Waals force can be characterized by the
Hamaker constant of a particular solid-liquid-liquid system. A negative Hamaker constant
indicates a repulsive field while a positive Hamaker constant indicates an attractive field
(Busireddy & Rao, 2004). The Hamaker constant is a coefficient of the dependence of energy on
distance and is strongly dependent on the materials in the system.
2.2.2. Structural Forces
Structural forces are short range interactions at a distance of less than 5 nm, whereas the
van der Waals and electrostatic forces are long-range interactions. These forces result when two
5
interfaces approach a distance of a few orders of molecular diameter. At this point, the continuum
theories of attractive van der Waal’s and repulsive double layer forces fail to describe surface
interactions (Israelachivili, 2011). The effects of other short range forces, such as solvation,
structural, and hydration forces, become the dominating force. Hydration forces dominate for
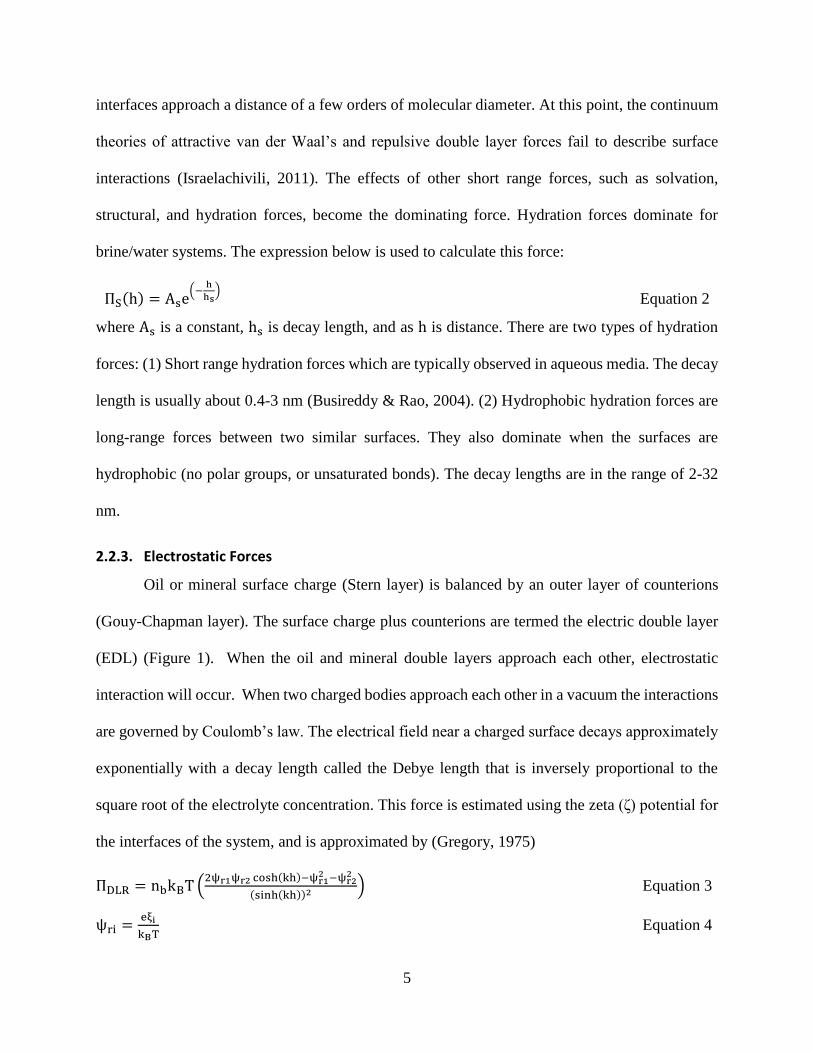
brine/water systems. The expression below is used to calculate this force:
ΠS(h) = Ase(−
h
hs) Equation 2
where As is a constant, hs is decay length, and as h is distance. There are two types of hydration
forces: (1) Short range hydration forces which are typically observed in aqueous media. The decay
length is usually about 0.4-3 nm (Busireddy & Rao, 2004). (2) Hydrophobic hydration forces are
long-range forces between two similar surfaces. They also dominate when the surfaces are
hydrophobic (no polar groups, or unsaturated bonds). The decay lengths are in the range of 2-32
nm.
2.2.3. Electrostatic Forces
Oil or mineral surface charge (Stern layer) is balanced by an outer layer of counterions
(Gouy-Chapman layer). The surface charge plus counterions are termed the electric double layer
(EDL) (Figure 1). When the oil and mineral double layers approach each other, electrostatic
interaction will occur. When two charged bodies approach each other in a vacuum the interactions
are governed by Coulomb’s law. The electrical field near a charged surface decays approximately
exponentially with a decay length called the Debye length that is inversely proportional to the
square root of the electrolyte concentration. This force is estimated using the zeta (ζ) potential for
the interfaces of the system, and is approximated by (Gregory, 1975)
ΠDLR = nbkBT (2ψr1ψr2 cosh(kh)−ψr1
2 −ψr22
(sinh(kh))2 ) Equation 3
ψri =eξi
kBT Equation 4
6
where k is the reciprocal of the Debye-Huckle double layer length, nb is the ion density of the bulk
solution, and kB is the Boltzmann constant.
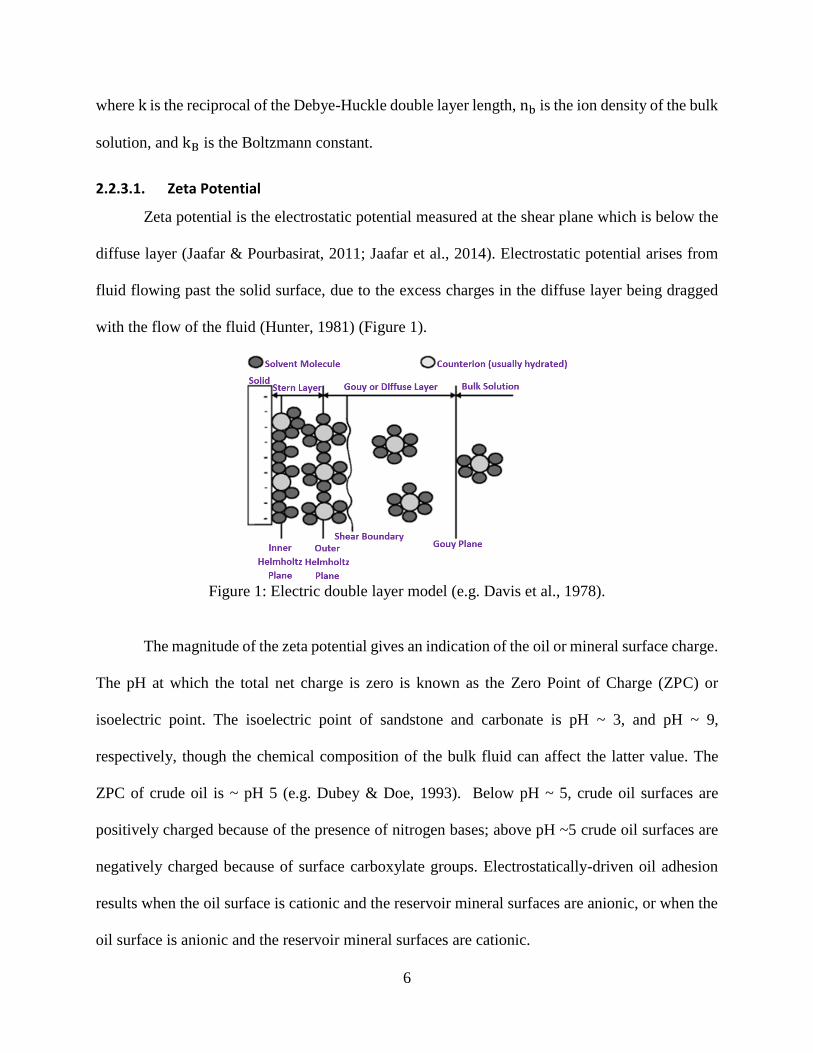
2.2.3.1. Zeta Potential
Zeta potential is the electrostatic potential measured at the shear plane which is below the
diffuse layer (Jaafar & Pourbasirat, 2011; Jaafar et al., 2014). Electrostatic potential arises from
fluid flowing past the solid surface, due to the excess charges in the diffuse layer being dragged
with the flow of the fluid (Hunter, 1981) (Figure 1).
Figure 1: Electric double layer model (e.g. Davis et al., 1978).
The magnitude of the zeta potential gives an indication of the oil or mineral surface charge.
The pH at which the total net charge is zero is known as the Zero Point of Charge (ZPC) or
isoelectric point. The isoelectric point of sandstone and carbonate is pH ~ 3, and pH ~ 9,
respectively, though the chemical composition of the bulk fluid can affect the latter value. The
ZPC of crude oil is ~ pH 5 (e.g. Dubey & Doe, 1993). Below pH ~ 5, crude oil surfaces are
positively charged because of the presence of nitrogen bases; above pH ~5 crude oil surfaces are
negatively charged because of surface carboxylate groups. Electrostatically-driven oil adhesion
results when the oil surface is cationic and the reservoir mineral surfaces are anionic, or when the
oil surface is anionic and the reservoir mineral surfaces are cationic.

7
2.3. Parameters Influencing Oil-Rock-Brine Interaction
2.3.1. Rock Mineralogy
Originally, all reservoir rocks are water-wet. Sandstone and carbonate reservoirs are water-
rich during burial. The ability of the different polar compounds to alter rock wettability depends,
in part, on the rock type. Sandstone surfaces are typically anionic; limestone surfaces are typically
cationic, though reservoir solution chemistry affects both (Brady et al., 2012). Sandstone
reservoirs are made up of quartz, feldspar, oxide coatings, carbonates, and clays. Clay minerals
will often dominate the reactive surface area seen by oil because of their smaller grain size, plate-
like morphology, and much higher surface areas. Usually, they have negatively charged faces and
positively charged edges when they get in contact with water. The negative surface charge of clays
would be balanced by cations from solution, such as sodium ions, and by positively charged groups
present at the oil-water interface, e.g. nitrogen bases (e.g. –NH+), and calcium-terminated
carboxyls (e.g. –COOCa+). Electrostatic attraction between positively charged oil surface groups
and negatively charged clay basal planes, is likely to control oil adhesion in sandstones containing
clays such as illite or smectite (Brady et al., 2013). While the number of negatively charged basal
plane clay groups is fixed by lattice composition, the abundance of charged oil surface groups
depends upon the history of the oil and chemistry of the oil and the connate fluid (e.g. pH, brine
salinity, brine composition). High numbers of nitrogen bases and calcium-terminated carboxyls
groups should favor formation of electrostatic ‘‘bridges” and oil adhesion – that increases the
degree of oil wetting (Alotaibi et al., 2011). Decreasing the numbers of nitrogen bases and calcium-
terminated carboxyls groups should reduce oil adhesion, making the formation more water wet,
resulting in greater oil mobility and recovery. Yukselen (2001) measured surface potential of
kaolinite as a function of pH and concentration and concluded that as pH was increased zeta
8
potential or surface charge became more negative. However, in the presence of divalent cations
such as calcium and magnesium decreased the zeta potential.
The surface chemistry of carbonates is significantly more complex than that of sandstones.
This is due to the presence of dolomite, Mg-rich calcites, clays, pyrite, and anhydrite (Ferno et al.,
2011). Dissolution and/or precipitation into or from solutions does influence the surface chemistry
of carbonate rocks (Hiorth et al., 2010). A study by Brady et al. (2012) found that the general
controls of calcite’s surface charge to be: calcium and carbonate ions sorption largely determined
the surface potential as opposed to hydrogen and hydroxide ions. Calcium ions were found to
increase the surface charge of calcite as carbonate and sulfate ions decreased it.
2.3.2. Aqueous Chemistry
The pore water chemistry (pH, ion composition, and salinity) influences the oil and mineral
surface charge, hence system wettability. The impact of water chemistry on wettability also
depends on temperature. Enhanced oil recovery from sandstone and carbonates by modifying
waterflood chemistry has been demonstrated by several groups (e.g. Lager et al., 2006; Zhang et
al., 2006; Rezaei Doust & Puntervold, 2009). Brine composition and salinity do affect the surface
charge of crude oil and reservoir rock and thus influencing the resultant wettability of the system
(Brady et al. 2012). For example, sulfate, calcium, and magnesium ions can adsorb to the mineral
surfaces, change the surface charge, and could potentially influence the ability of polar oil
components to adsorb. Brine composition and salinity can influence the concentration of charged
oil components at the oil-water interface. This could lead to an increase or decrease in the surface
charge of oil. In addition, ions can make complexes with the polar part of the oil components, and
this could change the solubility of the polar oil components in the oil phase.

9
2.3.2.1. Brine Salinity
In the past 10 years, several groups have carried out extensive research on the effect of
brine salinity on wettability (Tang & Morrow, 1999; Lager et al., 2006; Zhang et al., 2006). This
work was pioneered by Morrow’s group at the University of Wyoming, where they have been
studying the effect of low-salinity brines on wettability and thus oil recovery. These works have
led the oil and gas industry to be conscious of the effects that injected water chemistry can have
on oil recovery. Most research groups looking at this problem have reported that low salinity brines
seem to favorably alter the wettability and increase oil production. However, there are a
considerable number of research groups that have found that low salinity water injection does not
have significant effects on oil recovery (Al-Shalabi et al., 2014). Thyne and Gamage (2010)
evaluated the low salinity waterflooding effects in the fields in the Powder River Basin of
Wyoming. They found no increase in recovery for the 26 fields where low salinity water was
injected when they compared with the 25 fields where mixed water or formation water was
injected. Among these 51 fields, the salinity of injected water was significantly reduced in 38
fields, whereas there was little reduction in salinity in the rest of 13 fields. There was no correlation
observed between the salinity reduction and oil recovery factor. Boussour et al. (2009) conducted
low salinity waterflooding experiments on a reservoir core sample and no increased oil recovery
was observed. This project hypothesizes that the contradicting results can be attributed to the use
of complex materials (e.g. crude oil and reservoir rock) while carrying out experiments that have
a number of unknowns, and thus contradicting results.
2.3.2.2. Brine Composition
The presence of calcium, magnesium, and sulfate in water has been found to have profound
effects on oil recovery in carbonate cores (Strand et al., 2006; Zhang et al., 2006, 2007; Zhang &
Austad 2006). Zhang and Austad (2006) carried out a systematic study that investigated the impact

10
of potential determining ions (calcium, magnesium, and sulfate) in chalk. Their study showed that
when the concentration of sulfate was increased up to 4 times in injection water (seawater), oil
recovery increased from 10% to about 50% original oil in place (OOIP). Similarly, when calcium
concentration was increased from up to 4 times oil recovery also increased from 28% to 60% OOIP
after 30 days of imbibition. Strand et al. (2006) observed that when temperature was increased the
adsorption of sulfate also increased. They concluded that increase in adsorption of sulfate onto the
chalk surface will reduce the positive charge, which decreased the affinity of calcium due to the
less electrostatic interaction. In addition, they also investigated the relationship between calcium
and magnesium at the chalk surface. It was found that at low temperature the affinity of calcium
towards the chalk surface was higher than magnesium. However, at high temperature (130°C)
magnesium has a higher affinity towards chalk than calcium. They interpreted the data as showing
magnesium displacing calcium from the rock in a 1:1 reaction. However, it was not clear if the
reaction constituted pure surface substitution or it was the formation of MgCO3(s): 𝐶𝑎𝐶𝑂3 +
𝑀𝑔2+ ↔ 𝑀𝑔𝐶𝑂3(𝑠) + 𝐶𝑎2+. It was noted that the reactivity of magnesium towards the chalk
surface increased dramatically as the temperature was increased beyond 70°C, which was observed
to be the threshold for this substitution. This was explained as the small magnesium ion having a
stronger hydration energy that makes it less reactive at low temperature. One explanation could be
that sulfate, calcium, and magnesium adsorb to the pore surfaces, change the surface charge, and
could thereby potentially influence the ability of polar oil components to adsorb. The effects of
these divalent ions are illustrated in spontaneous imbibition experiments (Zhang et al., 2006,
2007). Hiorth et al. (2010) found some inconsistency with these conclusions. Their model
predicted that increasing calcium concentration below 100°C increases oil recovery but above
100°C the effect is reversed. They attributed these inconsistencies to transport effects, where when

11
“seawater-like” brine is spontaneously imbibed into the core at 70°C, sulfate is introduced to a
large part of the core. When temperature is increased to 100°C sulfate can precipitate as anhydrite
and lead to dissolution of the rock in order to supply more calcium to the system. However, when
water is spontaneously imbibed into the core at high temperature (100°C), the brines with high
calcium concentration can lose sulfate as anhydrite before the brines enter the core or very close
to the border of the core. In this case, the impact of anhydrite precipitation would be reduced. The
effect of rock dissolution is that a fresh water-wet surface is exposed. Lastly, ions in the aqueous
solution can influence the concentration of charged oil components at the oil-water interface. This
could lead to an increase or decrease in surface charge of oil. Ions can make complexes with the
polar part of the oil components and this could change the solubility of the polar oil components
in the oil phase.
2.3.2.3. Brine pH
Calcium ions present in the formation brine can influence the surface of the chalk to have
a positive charge at pH less than 9 (Zhang et al., 2006). The positive charge of the chalk surface
in the presence of calcium and magnesium ions has been confirmed by zeta potential measurements
on a milled chalk in NaCl brine suspension.
2.3.3. Oil Chemistry
Oil chemistry plays a significant role in the wettability of a system. Acid number (AN) is
the measure of acidic material in crude oil, as base number (BN) is that of basic material in the
crude oil which is typically much higher than the AN (Puntervold et al., 2007). Carboxylic groups
in naphthenic acids from the crude oil are the most strongly adsorbed material onto the rock surface
and they may act as “anchor” molecules for other surface active components present in the crude
oil (Standnes & Austad, 2003). When oil invades a chalk reservoir, the interface between oil and

12
water become negatively charged due to partial dissociation of carboxylate groups (-COOH)
present in crude oil, resulting in negatively charged carboxylates (-COO-). The resulting thin water
film between the positively charged chalk surface and the negatively charged oil-water interface
becomes unstable due to the negative disjoining pressure and the oil may contact the chalk surface.
The carboxylates in the oil could adsorb onto the chalk surface and hence make the chalk less
water-wet (Thomas 1993). Thus, (AN) could dictate the degree of water-wetness. The higher the
AN, the more carboxylates have the possibility of adsorbing onto the chalk surface and decreasing
the water wetting nature of the rock. Steric acid was also found to promote oil-wetness (Thomas
et al., 1993; Karoussi and Hamouda, 2007).
Water wetness decreases as the AN increases. Puntervold et al. 2006, studied the impact of
basic components on wetting properties of chalk by using oil with a constant AN of 0.5mg KOH/g
oil and varying the AN/BN ratio in the range of 0.24 to 4.6. They used Benzyl Amine as their basic
compound, and it was observed that the water wetness decreased as the content of base increased
up to about 4 times the concentration of acid.
2.3.4. Temperature
Temperature has been found to play a significant role in determining wettability. Rao
(1999) showed that in most cases, sandstone reservoirs become more oil-wet with increasing
temperature, while most of the carbonate reservoirs become more water-wet. Schembre et al.,
(2006) suggested that the change in temperature that results when injected water is introduced into
a reservoir causes the surface oil-wet fines to detach, leaving a clean, water-wet surface. One
implication is that changes in wettability during water displacement of oil may differ from those
during oil displacement of water. Using Rao’s conclusions and similar conclusions, Schembre’s
conclusions may explain the wettability behavior in sandstones, where when temperature is

13
decreased the systems becomes more water-wet, however, it does not explain the behavior found
in carbonates. In addition, studies have shown that decarboxylation of carboxylic material takes
place at elevated temperatures and this process could be catalyzed by the presence of carbonate
(Shimoyama & Johns 1972). This process of decomposition decreases the acid number (AN) to
base number (BN) ratio due to the decrease in AN and increases the oil-wetness of the system.
2.4. Wettability Measurement Methods
Anderson (1986) and Dixit et al. (2000) reviewed wettability measurement methods which
include: oil-water contact angles, imbibition and forced displacement (Amott), the US Bureau
Method (USBM), permeability/saturation relations, wire-line logs, imbibition rates, production
performance, capillary pressure curves, relative permeability curves, microscope examination,
flotation, nuclear magnetic resonance (NMR), displacement capillary pressure, dye adsorption,
and capillary metric methods.
2.4.1. Flow Measurement Methods
The Amott and the USBM tests are the most commonly used quantitative methods for the
assessment of wettability state (Amott, 1959; Donaldson et al., 1969; Sharma & Wunderlich,
1987). Both methods give the macroscopic average wettability of a rock-oil-brine system. The
Amott method measures the amount of fluids spontaneously and forcibly imbibed by a rock sample
(Figure 2). The USBM method is similar to the Amott method but considers the work required to
do a forced fluid displacement. Both Amott and USBM do not give absolute wettability
measurements, but they are regarded as an industry standard for comparing the wettability of core
plugs. The core is usually considered water-wet when water is preferentially imbibed in the core,
and oil-wet when oil is preferentially imbibed in the core. The core is considered neutral-wet when

14
neither oil nor water is preferentially imbibed. This is assumed to indicate that equal portions of
the surface have a preference for water or oil.
Figure 2: Schematic of Amott and USBM measurements.
2.4.2. Contact Angles Methods
Contact angle is a common measure of wettability and is most accurate when pure fluids
and artificial cores are used. This method is the prefered method of measuring wettability since it
is faster than the flow measurement methods. In addition, it has the added advantage of directly
measuring wettability under reservoir conditions. As shown in Figure 3, the surface is considered
water-wet when the contact angle is less than 75°, neutral-wet when 75°-105°, and oil-wet when
greater than 105°.
Figure 3: Schematic of sessile drop contact angle measurements

15
This method suffers from the hysteresis generated between the water-advancing and water
receding angles. Anderson (1986) showed that contact angle hysteresis can be caused by the
surface roughness, surface heterogeneity, and surface immobility on a macromolecular scale. In
addition, this technique requires preparation of the coarse mineral sample by means of polishing
and then cleaned using various solvents and leachants. All the above pretreatments of the mineral
samples can be expected to affect the surface roughness as well as surface composition of the
sample (Somasundaran, 1970; Kulkarni & Somasundaran, 1973, 1977). Smearing of the mineral
surface by contaminants during polishing can also be of significant effect (Bangs, 1962). Wagner
& Leach (1959) stated in their study that the removal of bituminous or organic coatings that have
a governing role in imparting oi1-wettability to rock surfaces during polishing can also lead to
misleading results that are not representative of the original samples. Equally important alterations
in surface variations can produce changes in both the equilibrium contact angle and the nature of
hysteresis that is important in determining the oi1 saturation. In 1956 Brown and Fatt suggested
that the concept of a contact angle, as applied to reservoir rock, be abandoned. They made this
suggestion due to the heterogeneous mineral composition of most reservoir rocks, each with a
different surface chemistry and a different capacity to adsorb surface active materials from
reservoir fluids. Furthermore, they stated that the operation of a contact angle in determining the
form of a fluid-fluid interface is difficult to picture in the very complex geometry of a pore.
2.4.3. Flotation Method
Flotation processes have been routinely used for over a century in the mining industry
(Nguyen, 2004). Flotation is a physicochemical process that is used to separate finely crushed
solids based on their wettability. This wettability measurement method has long been considered
as a qualitative method of measuring wettability in the oil and gas industry (Anderson, 1986).

16
Celik and Somasundaran (1980) studied the wettability of reservoir minerals by flotation and
correlated the wettability results with data obtained for adsorption and zeta potential. Their study
presented good correlation between mineral flotation and surfactant adsorption with both
properties exhibiting a maximum near critical micelle concentration. Dubey and Doe (1993) used
flotation to investigate the effect of acid and base numbers of crude oil on wetting characteristics.
Wu et al. (2008) used flotation to study the wetting behavior and surfactant EOR in carbonates
with model compounds.
Mwangi et al. (2013) developed a quantitative flotation technique known as Modified
Flotation Technique (MFT). They used MFT to study the effect of rock mineralogy, brine salinity,
surface active compounds commonly found in crude oil, and temperature. MFT proved to be a
successful quantitative technique to rapidly test the influence of oil and brine chemistry on the
wettability of sandstone and carbonate rocks at different temperatures. Sohal et al. (2016) studied
the effects of ionic strength and composition of brine on chalk wettability at 23°C and 100°C. They
also examined the role of potential scale forming ions (barium and strontium) in wettability
alteration and restoration, and the correlations between IFT and wettability. They studied the effect
of temperature on wettability and optimum wetting conditions for maximum oil recovery in
carbonate reservoir system (Sohal et al., 2017). Haugen (2016) used a variation of the MFT to
characterize the wettability alteration of five rocks in the presence of four brine and four oil types
from a North Sea reservoir. He observed that quartz, K-feldspar, glauconite, and a North Sea
outcrop sandstone rock were primarily water-wet for all brine-oil combinations. Muscovite
showed both water-wet and oil-wet tendencies, depending on the brine-oil combination. Also, he
demonstrated a clear correlation between the total acid number of the oil and calcium concentration
of the brine for all minerals except quartz. Fjelde et al. (2017) used MFT to screen the potential

17
for different injection water compositions to alter wettability to more water-wet. They found that
screening of potential for available injection water compositions to alter the wettability to more
water-wet can be carried out by a combination of flotation experiments with geochemical
simulations. They proposed that this combination does also allow for possibility to determine
whether direct adsorption or cation bridging is the dominating wetting mechanism.
2.5. Wettability of Sandstone Reservoirs
40-50% of the World’s oil is in sandstone reservoirs. Sandstone reservoirs are made up of
quartz and clays that are negatively charged under most conditions. Because of their strong
negative charge, and their high surface area, clays tend to sorb cationic SAC components from
crude oil. In the past decade, widespread attention has been given to low salinity waterflooding in
sandstone reservoirs (e.g. Tang and Morrow, 1999; Morrow & Buckley, 2011; Winoto et al.,
2012). Numerous experimental and field studies have demonstrated that modifying brine
composition can result in significant improvement in oil recovery (10-30% of OOIP).
2.5.1. Low Salinity Waterflooding in Sandstone Reservoirs
The popularity of this technique is due to its: low cost, water availability, ease of
application in the field, and its efficiency in displacing light to medium gravity crude oils. Evidence
of enhancement in waterflood efficiency by injecting low-salinity brine has been observed in the
laboratory and in the field on both carbonate and sandstone reservoirs (Robertson, 2010; Hadia et
al., 2013; Aladasani et al., 2014; Myint & Firoozabadi, 2015). Gamage & Thyne (2011a) showed
the advantages of using low salinity water injection in secondary mode compared to tertiary mode
by producing 6 to 20% more oil during coreflooding experiments on sandstone cores.

18
2.5.2. Wettability Alteration Mechanisms in Sandstone Reservoirs
Several mechanisms have been proposed to explain the low salinity effect. All proposed
low salinity waterflooding mechanisms invoke adhesion of oil SACs to the rock surface.
Therefore, it is necessary to quantitatively measure, and ultimately understand, the role of SAC
adhesion in order to make low salinity waterflooding predictive.
2.5.2.1. Effect of Fine Migration
Tang and Morrow (1999) proposed that the migration of fine particles, mainly kaolinite,
might play a key role in the sensitivity of oil recovery to salinity. They concluded that a range of
oil recovery and wettability observations could be explained by assuming that heavy polar
components of crude oil adsorbed onto particles and pore walls to obtain mixed wetness. During
aging, clay fines are partly in contact and exposed to crude oil, and the fines are then mixed-wet
particles. The production of oil droplets on these clays would contribute in changing the system to
a more water-wet system since the fines migration resulted in the exposure of the underlying
surfaces that lead to an increase in water-wetness of the system. When high salinity brine is present,
clays are undisturbed and retain their oil-wet nature leading to poorer displacement efficiency
(Lager et al., 2006). When the clay particles encounter low salinity water, the clay particles will
detach from the pore surface. Unfortunately, migration of clays can plug pore throats and reduce
permeability with flowing fluid (Lever and Dawe, 1984).
On the other hand, numerous other experiments with low salinity have shown an increase
in oil recovery but not observed fines migration. Several groups have reported an increase in oil
recovery with no fine migration or significant permeability reductions observed during numerous
low salinity corefloods (Lager et al., 2006; Zhang & Morrow, 2007). Valdya and Fogler (1992)
reported that a gradual reduction in salinity kept the concentration of fines in the flowing
suspension low, with formation damage minimized or totally avoided. On the other hand, Boussour

19
et al., (2009) and Romero et al., (2014) reported no low salinity effect but with sand production in
their experiments.
2.5.2.2. Effect of pH Variation
Tang and Morrow (1999) and McGuire et al. (2005) observed a pH increase by low salinity
injection on Berea and North Slope field samples, respectively. McGuire et al. (2005) proposed
that low-salinity mechanisms could be due to increased pH and reduced IFT similar to alkaline
flooding. It has been proposed that this increase in pH is due to the exchange of hydrogen ions in
water with adsorbed sodium ions (Mohan et al., 1993). Overall, a small change in bulk pH can
impose a great change in the zeta potential of the rock. pH increase can cause organic materials to
be desorbed from the clay surfaces (Austad, 2013).
2.5.2.3. Effect of Multicomponent Ion Exchange
Lager et al. (2006), proposed a Multicomponent Ionic Exchange (MIE) mechanism where
divalent ions in pore water competed and displaced oil molecules from mineral surface exchange
sites. Multivalent cations at clay surfaces are bonded to polar compounds present in the oil phase,
thus forming organo-metallic complexes and promoting oil-wetness on rock surfaces. Meanwhile,
some organic polar compounds are adsorbed directly to the mineral surface, displacing cations
present at the clay surface and enhancing the oil-wetness of the clay surface. During the injection
of low salinity brine, MIE will take place, removing organic polar compounds and organometallic
complexes from the surface and replacing them with uncomplexed cations. The evidence of MIE
was shown from an effluent analysis taken from a low salinity core flood in the North Slope. The
analysis showed that the injected brine had a lower salinity than the connate water. The
concertation of magnesium and calcium ions in the effluent samples decreased as more pore
volumes of low salinity water was injected and dropped below the concentration of the injected

20
brine. This indicated that the calcium and magnesium ions were adsorbed by the rock matrix.
Sposito (1989) proposed eight mechanisms for adsorption of organic functional group on soil
minerals (Table 9).
Table 1: Proposed mechanisms for adsorption of organic functional group (Sposito, 1989)
Adsorption Mechanisms Organic Functional Groups
Protonation Amino, heterocyclic N, carbonyl, carboxylate
Van der Waals Interactions Uncharged organic units
Anion Exchange Carboxylate
Hydrogen Bonding Amino, carbonyl, carboxyl, phenolic OH
Cation Exchange
Amino, ring NK, heterocyclic N (aromatic
ring)
Cation Bridging Carboxylate, amines, carbonyl, alcoholic OH
Ligand Bridging Carboxylate
Water Bridging Amino, carboxylate, carbonyl, alcoholic OH
Of the eight proposed mechanisms, the four affected by possible cation exchange capacity in low
salinity flooding are: cation exchange, cation bridging, ligand bridging, and water bridging.
2.5.2.4. Effect of Electric Double Layer
Lower salinity brines increase the thickness of the ionic double layer between the clay and
oil interfaces. Ligthelm et al. (2009) suggested that the concentration of cations in the high salinity
brine is sufficient to screen off the negative charge of the oil-water interface and the clay surface.
This would result in the suppression of the electrostatic repulsion force. Therefore, the wettability
of the rock in high salinity brine is less water-wet because polar components will adsorb onto the
clay surface. Low salinity brines reduce the ability of the cations to screen off negative charges of

21
the clay surface. The result is increased repulsive forces between the mineral surface and the oil-
water interface, and expansion of the electrical double layer (RezaeiDoust et al., 2011). Frontiers
BP, 2009, presented a hypothesis for low salinity effect in the presence of clay. The thickness of
the double layer will increase with decreasing salinity. They suggested that the negatively charged
clay particles produce a diffuse double layer where as the aqueous phase near clay is positively
charged.
2.5.2.5. Chemical Low Salinity Mechanism
Austad et al. (2010) proposed that the following parameters play a major role in low salinity
effects in sandstones: (1) rock mineralogy (e.g. clay properties, type, and quantity), (2) crude oil
chemistry ( e.g. SACs), and (3) aqueous chemistry (e.g. brine composition and pH). The suggested
mechanism requires both polar components and active cations be initially adsorbed onto the clay
(Austad et al., 2010). Different clays have different adsorption/desorption windows. For observing
the low salinity effect, clay minerals with high cation exchange capacity appear to be favorable.
Initially, there is a balanced adsorption onto the clay minerals of organic material, active cations
and protons, preferentially at reservoir pH of about 5. An ordinary acid-base reaction that promotes
desorption of organic material takes place between OH- and the adsorbed acid and protonated base.
As the water wetness increases, the oil recovery is increased. Injection of low salinity brine will
cause desorption of adsorbed cations which will increase the pH close to the water-clay interface
because calcium is substituted by hydrogen ions on the clay surface. If the amount of adsorbed
organic material is low and the adsorption of active ions is high, the low salinity EOR effect will
be low as a result of the rock already being water-wet. As long as the low saline injected water has
a concentration of active ions that are low enough to promote significant desorption from the clay
surface, the composition of the injected low saline may not play an important role.

22
2.6. Wettability of Carbonate Reservoirs
Chilingar and Yen (1983) reported that of 161 carbonate rocks studied, 15% were strongly
oil-wet, 65% were oil-wet, 12% were intermediate-wet, and 8% were water-wet. In fractured and
low permeability carbonate reservoirs oil displacement from the matrix blocks by spontaneous
imbibition of the injection fluid constitutes the main drive mechanism to obtain high oil recovery.
However, the unfavorable wetting state of carbonates prevents spontaneous uptake of water (and
expulsion of oil) into the matrix due to negative capillary pressure. Spontaneous imbibition of
wettability-altering water into fractured reservoirs of chalk, limestone, and dolomite (carbonate
reservoirs) is relatively inexpensive and therefore an important secondary oil recovery method.
The technique appears to function quite well under water-wet to mixed-wet conditions (Thomas
et al., 1987). To promote spontaneous imbibition into oil-wet carbonate matrices and achieve
higher oil recoveries, the capillary pressure should be increased by altering the wettability of the
rock surface to a more favorable water-wet state. This requires first understanding the link between
SACs and wettability.
Carbonates have positively charged and weakly basic surfaces in brines near neutral pH
(Anderson, 1986). Therefore, the rock-brine interface is positively charged while the oil-brine
interface is negatively charged due to the carboxylic acids in the oil. The opposite charge between
the oil/brine and mineral/brine surfaces results in an electrostatic attraction between the two
interfaces, which tends to thin the brine film and can bring the oil in direct contact with the mineral
surface (Hiraski et al. 2004).
2.6.1. Low Salinity Waterflooding in Carbonate Reservoir
One of the emerging EOR methods for wettability alteration in carbonate reservoirs is low
salinity waterflooding. The effect of low salinity water injection in carbonate reservoir has not
been as thoroughly investigated as sandstones. This is due to wettability alterations by low salinity

23
waterflooding in sandstone reservoirs related to the presence of clay (Lager et al., 2006; Doust et
al., 2009). Only a few field scale (i.e. Ekofisks and Valhall oil fields) low salinity waterflood
projects have been reported (Sylte et al., 1988; Hallenbeck et al., 1991). Interest in modifying the
water chemistry of injected water was stimulated by observation of unexpectedly high oil
recoveries from injecting seawater in the fractured Ekofisk chalk reservoir of the North Sea (Sylte
et al., 1988; Hallenbeck et al., 1991)
2.6.2. Wettability Alteration Mechanisms in Carbonate Reservoirs
Increase in oil recovery due to modified brine chemistry of injection water has attributed
to wettability alteration in carbonates. The fundamental observations from the laboratory studies
and field cases show that altering water chemistry increases oil mobility underflow and imbibition,
which means wettability has been altered. Most the observed results attributed improved oil
recovery to change of wettability to a more water-wet state (Yousef et al., 2010, 2011; Fathi et al.,
2006; Zhang et al., 2006, 2007; Strand et al., 2006), or to a more mixed-wet state (Sharma et al.,
2000; Agbalaka et al., 2008; Hazim et al., 2013). The wettability alteration mechanisms proposed
are either by potential determining ions or by decreasing the total salinity of injected water.
However, there is no consensus on a single main mechanism for the low salinity effect. This is due
to the complex nature of the interaction between crude oil, brine, and rock, as wells as a number
of conflicting observations from experimental studies. Therefore, either there are a number of
mechanisms involved to increase the oil recovery by chemically modified water or the right
mechanism has not yet been identified yet (Suijkerbuijk et al., 2012).
2.6.2.1. Effect of Multivalent Ions
Injecting low salinity with different electrolyte concentration than formation brine will
disturb the equilibrium crude oil-rock-brine system. The variations in ionic concentration results

24
in the substitution of divalent cations by the monovalent cations (Lager et al., 2006). In addition,
the presence of divalent cations in the formation brine could bridge the rock and the crude oil.
Theoretically, exchange with monovalent cations can release the crude oil from the rock surface,
which alters the system to more water-wet thus increasing the recovery factor.
Zhang et al. (2007) determined the potential of multivalent ions to improve the oil recovery
by changing chalk wettability in imbibition experiments. They observed that sulfate in the presence
of NaCl was unable to change the wettability to improve spontaneous imbibition. However, if
calcium or magnesium ions were present together with sulfate, improved spontaneous imbibition
was observed. They proposed that sulfate from the imbibing seawater adsorbed onto the chalk
surface and the positive charge is decreased. More calcium is then attracted to the surface due to
lowered electrostatic repulsion. Calcium can then react with carboxylic groups and displace it from
the surface. At high temperature, the process became more active and magnesium displaced the
calcium bound to the chalk surface as well as from the carboxylate complexes. Strand et al. (2005)
used chromatographic separation methods to show the adsorption of sulfate onto the chalk surface
increases as the temperature increases without any precipitation of CaSO4. They also observed
improved oil recovery by co-adsorption of calcium and sulfate onto the chalk surface was more
pronounced at higher temperatures. Shehata et al. (2014) and Mohanty et al. (2013) found that
sulfate and magnesium ions are more effective than calcium to improve oil recovery. Gupta et al.
(2011) recovered an additional 15% to 20% OOIP by adding borate and phosphate to seawater in
coreflood experiments using Middle Eastern limestone. They found borate and phosphates are
superior to sulfate to alter wettability to a more water-wet state.

25
2.6.2.2. Effect of Ionic Strength
Increase in oil recovery has been observed as the ionic strength of the injected water is
reduced. Shehata et al. (2014) recovered more oil by deionized water in secondary recovery mode
compare to seawater and attributed it to limestone and water interaction which increased the
repulsive forces between crude oil component and rock surface. Hazim et al. (2013) recovered
additional oil by injecting almost 40 to 200 times diluted versions of reservoir brine in water-wet
reservoir cores and ascribed additional oil recovery to mixed-wet or intermediate-wet conditions
contrary to Morrow and coworkers who attributed the additional recovery to water-wet conditions.
Yousef et al. (2011) flooded carbonate reservoir cores with two and ten times diluted seawater and
recovered a substantial amount of oil. They observed a decreasing trend in IFT correlated with
decreasing the ionic strength of injected water.
2.6.2.3. Effect of Rock Dissolution
This mechanism proposes that the lower calcium concentration in low-salinity brine causes
calcium carbonate from the rock to dissolve and establish equilibrium with the brine (Hiorth et al.,
2010). When the calcium carbonate dissolves, the adsorbed oil components are removed and the
rock surface is rendered water-wet. During the dissolution of carbonate, an excess of OH- will give
increased pH. Gupta et al. (2011) found in Middle Eastern reservoir limestone coreflooding
experiments that soft water dissolved a small amount of rock desorbing some of the oil and altering
wettability towards a more water-wet state. Yousef et al. (2010, 2012) measured pore coupling in
carbonate coreflooding experiments at reservoir conditions and found that the connectivity
between micro and macro pores was attributed to microscopic dissolution of anhydrite. Hiorth et
al. (2010) evaluated the rock dissolution concept through geochemical modeling and they
concluded that chemical dissolution of calcite appears the controlling factor.

26
2.6.2.4. Effect of Electric Double Layer
The double layer theory describes the force between charged surfaces interacting through
a liquid medium. It combines the effects of the van der Waals attraction and the electrostatic
repulsion. When low salinity water is introduced to a crude oil-brine- rock system, the double layer
of counter ions on mineral surfaces will expand when the salinity is lowered because of less
suppressive force exerted by ions in solution. This is a function of brine salinity and composition.
Divalent and trivalent ions compress the double layer more than monovalent ions (Hunter, 1988).
However, a higher concentration of divalent ions in the electrical double layer will also increase
the surface charge density. Takamura et al (1985) explained that increasing pH beyond the
isoelectric point changes the solid/water interface from positive to negative. Since the charge at
the water/oil interface is already negative repulsive electrostatic force emerge and thus expand the
electrical double layer. Strand et al. (2005) observed that the wettability of carbonates is dictated
by the stability of water film between the rock surface and the oil phase which is related to zeta
potentials of the oil water and water rock interfaces. Fathi et al. (2010a) used seawater depleted in
NaCl in order to provide calcium, magnesium, and sulfate ions easier access to approach the chalk
surface. This change of ionic composition inside the electrical double layer increased imbibition
rate and oil recovery. Yousef et al. (2012a, 2012b) used diluted seawater to change the carbonate
cores surface charge to more negative values which lead to more water interaction and eventually
alteration to the water-wet state, confirmed by zeta potential results and NMR study.
2.7. Summary
The goal of this project is to create a faster, cheaper, and more reliable wettability measurement
method that more accurately identifies the chemical controls over oil-rock adhesion and
wettability. Traditional methods are time-consuming, costly, and require considerable
interpretation. Moreover, conventional wettability tests cannot distinguish heterogeneous

27
wettability states. Developing a method to better understand wettability/oil-rock adhesion should
ultimately lead to greater enhanced oil recoveries. Using the new method, systematic experiments
to investigate the role of specific SACs on wettability were performed.

28
CHAPTER 3. EXPERIMENTAL METHODOLOGY
This section describes the materials and methods used to study the role of SACs on
wettability as a function of rock mineralogy, brine chemistry, and temperature.
3.1. Materials
3.1.1. Rock Material
Three reservoir materials were considered: sandstone, shale, and carbonate. The three
carbonates were Austin chalk, Indiana limestone, and Silurian dolomite. The four sandstones were
Berea, Gray Berea, Kirby, and Bandera sandstone; the shale was Mancos shale. Experiments using
Gray Berea, Kirby, Bandera, and Mancos shale focused on examining the effect of brine
composition on sandstone, shale, and carbonate rocks. These results will be presented in a separate
report. All rocks came from Kocurek Industries of Caldwell, TX. Each of the four rock samples
were ground and sieved to five different sizes: <53 µm, 53-105 µm, 105-149 µm, 149-206 µm,
and >206 µm as shown in Figure 4. This project used grain size distribution of 105-206 µm.
To avoid contamination, the mortar, pestle, and sieves were thoroughly cleaned using the
following procedure: blast the equipment with 100 psi air under a fume hood until the loose powder
is extracted, rinse with DI water, rinse with acetone, dry with air, crush a small amount of the rock
of interest to fine powder and use the powder to scrub the surface of the equipment with intent for
the powder to pick up any contamination stuck on the surface. Lastly, decant the potentially
contaminated powder and the equipment is ready for use.

29
Figure 4: Mortar and pestle were used to grind the rock samples and a series of sieves were used
to separate the rock powder to different rock size distributions.
3.1.2. Oil
To isolate the effects of individual SACs, this project used model oils mixtures of pure
decane and SACs to represent the oleic phase. Obviously, natural petroleum is a complex mixture
of organic molecules that a model oil can only roughly approximate. But model oils are a useful
means for isolating the effects of individual SACs on wettability. The four groups of SAC studied
are: aromatic, oxygen-bearing, sulfur-bearing, and nitrogen-bearing compounds, and a natural
condensate sample. Table 2 lists the nine SACs used in this study. Tetralin, a non-SAC aromatic
compound labeled A1, was also used.
Table 2: Surface active compounds used in this study.
Surface Active
Compounds (SAC) Label Chemical compound Chemical Formula
MW
(g/mol)
Oxygen-bearing
SAC
O1 Acetic acid (short chain) CH3COOH 60.05
O2 Myristic acid (long chain) CH3(CH2)12COOH 228.37
O3 Naphthenic acids (long
chain) C7H10O2 126.15

30
Table 2 cont’d
Surface Active
Compounds (SAC)
Label Chemical compound Chemical Formula
MW
(g/mol)
Sulfur-bearing SAC
S1 Dibenzothiophene C12H8S 184.26
S2 Di-n-Butyl Sulfide C8H18S 146.29
S3 1-Tetradecanethiol CH3(CH2)13SH 230.45
Nitrogen-bearing
SAC
N1 Carbazole C12
H9N 167.20
N2 Quinoline C9H
7N 129.16
N3 Pyridine C5H
5N 79.10
Condensate Cond Condensate
Non-reactive organic
medium
Dec Decane C10H22 142.28
The condensate was supplied by a major oil company. This fluid is clear and its specific gravity,
density, and viscosity at 22°C are 62°API, 0.7340 g/cm3, and 1.0028 cp, respectively. The
composition of the condensate is presented in Table 3. The condensate is a complex mixture
composed mostly of alkanes as shown in the GC results in Figure A1 and Table A1.
Table 3: Compositional Analysis of Condensate.
Component Carbon No. Mole % Weight %
Methane C1 0.002 0.000
Ethane C2 0.045 0.013
Propane C3 0.896 0.377

31
Table 3: Cont’d
Component Carbon No. Mole % Weight %
i-Butane iC4 1.156 0.641
-Butane nC4 3.580 1.984
i-Pentane iC5 4.333 3.478
n-Pentane nC5 5.590 3.846
Hexane C6 12.722 10.455
Heptanes Plus C7+ 71.676 79.703
Total 100.000 100.000
Properties of Heptanes Plus (C7+) of condensate
Mole % 71.7
Molecular Weight 116.5
Specific Gravity @ 60°F 0.76
3.1.3. Brine
To isolate the individual effects of brine composition on wettability, deionized water was
used for baseline tests, then individual salts were added to make up chemically different brines
(Table 4).
Table 4: Brine compositions (all in mg/L).
Salts NaCl NaHCO3 CaCl2 MgCl2 Na2CO3 NaSO4 AlCl3 FeCl3 Salinity
Brine 1 / DI Deionized water ~ 0 ppm
Brine 2 900 10 30 30 - 30 - - 1,000 ppm

32
Table 4: Cont’d
Salts NaCl NaHCO3 CaCl2 MgCl2 Na2CO3 NaSO4 AlCl3 FeCl3 Salinity
Brine 3 9,000 100 300 300 - 300 - - 10,000 ppm
Brine 4 90,000 1,000 3,000 3,000 - 3,000 - - 100,000 ppm
Brine 5 2,000 2,000 2,000 2,000 2,000 2,000 2,000 2,000
3.2. Sample Preparation
3.2.1. Rock sample preparation
All rock samples used in the wettability measurement method Modified Flotation
Technique (MFT) were ground and sieved to a fine powder. Dolomite samples used in the contact
angle experiments were cut and polished to thin wafers. A mixture of 20% methanol and 80%
chloroform was used in the Dean-Stark soxhlet system to clean the wafers prior to conducting the
contact angle experiments.
3.2.2. Model oil preparation
Ten model oils were created by the addition of 2000 ppm of SAC to pure decane. Decane
is considered non-surface reactive, is non-polar, and contains no SACs. Therefore, any observed
change in wettability from that of the baseline decane is attributed to the added SAC. Condensate
wettability was also tested.
3.3. Methods
3.3.1. Modified Flotation Technique
This project developed and used the modified flotation technique as wettability
measurement method. This method is explained in detail in Chapters 4 and 5.

33
3.3.2. Dual Drop Dual Crystal Technique
The contact angle method used is the Dual Drop Dual Crystal (DDDC) method (Rao and
Girard, 1996) depicted in Figure 5. DDDC was used to validate the MFT process (Section 5.4).
Figure 5: Schematic depiction of DDDC contact angle measurement method (Rao & Girard,
2006).
Two crude oil drops (A) are placed on two parallel polished rock surfaces held by
horizontal and vertical arms of an optical cell. The water film between the crude oil sessile drops
and mineral crystal surfaces is drained with the help of the buoyancy forces to attain adhesion
equilibrium before measuring advancing and receding contact angles with respect to aging time.
By turning the lower crystal upside down (A B) there are three possible ways the oil drop could
behave. In case B1 the oil drop remains attached to the lower crystal due to adhesion, in case B2
part of the oil drop floats away due to buoyancy, and in case B3 the oil drop detaches cleanly from
the lower crystal without leaving any oil on the surface. In case B1 and B2, the upper crystal is
lowered so that the two oil drops can mingle (C), In case B3, the upper crystal is brought down to
interact with the surface where the oil drop from the lower crystal was previously situated. The
advancing and receding contact angles are measured by shifting the lower crystal laterally (D).
The water receding contact angle determines the spreading behavior of reservoir fluids; while the
water advancing contact angle describes the wettability and rock/oil adhesion.

34
3.3.3. X-Ray Diffraction Technique
X-ray diffraction (XRD) was used to determine the mineral compositions of the rocks used
in this project. XRD is used to identify the atomic and molecular structure of a crystal in which
the crystalline atoms cause a beam of x-ray to diffract in specific directions. By measuring the
angles and intensities of these diffracted beams, a three-dimensional picture of the density of
electrons within the crystal is produced. The generated electron density is then used to determine
the mean positions of the atoms in the crystal as well as their chemical bonds and various other
parameters. This project used a Panalytical Empyrean XRD instrument shown in Figure 6. Sample
preparation is crucial for accurate diffraction pattern and repeatability. Problems associated with
poor sample preparation includes: graininess, micro-absorption, texture, sample height
displacement, surface roughness, and sample transparency.
Figure 6: XRD instrument
Even though there is a sample preparation and loading procedure for the XRD, there are minor but
crucial details that defer depending on the type of material one is testing. Therefore, it is important

35
to conduct preliminary experiments to determine the most favorable parameters for good results
such as ideal grain size distribution, sample loading (front end, back end, or side loading), etc.
Table 5 lists the conditions used in the XRD measurements.
Table 5: XRD experimental conditions
X-Ray Diffractometer Panalytical Empyrean
Loading Side loading to avoid clay orientation
Sample size 105-206 microns
Temperature Ambient
3.3.4. Gas Chromatograph Technique
Gas chromatography (GC) is a method of separating compounds with a high vapor
pressure or a relatively low boiling point so that they are separated and detected in complex
mixtures. Compounds are separated based on differences in their vapor pressures and their
attraction to solid materials inside the GC. Because the vapor pressure of a given compound is a
function of the intermolecular forces between molecules, GC takes advantage of differences in at
least one of the properties of matter. In this project, the GC instrument was used to measure the
composition of decane, the ten surface active compounds, and condensate. Each of the compounds
was diluted in dichloromethane (DCM) solvent prior to running it on the GC instrument. No
impurities were detected in the decane nor the ten surface active compounds samples. The GCMS
samples were analyzed on a Varian CP-3800 gas chromatograph connected to a Varian Saturn
2200 Ion Trap mass spectrometer (Agilent). The samples were injected in splitless mode with a
temperature program of: initial temp 40o C, hold for 6min then increasing to 240o C at a rate of
4o/min, hold of 10min then ramping to 280o at 20o/min holding for 5min with total run time being
73min. Injector temperature was constant at 200o. The carrier gas was helium at a constant flow

36
rate of 1ml/min. Electron multiplier voltage was 1900v. Spectra were submitted to NIST library
search for confirmation.

37
CHAPTER 4. MODIFIED FLOTATION TECHNIQUE FUNDAMENTALS
For over a century, flotation has been routinely used as a separation process (Perkins, 1921;
Klassen, 1948a, 1948b; Whelan, 1956; Boutin and Wheeler, 1967). For a successful flotation
process, the following criteria must be met: (1) wettability difference between the material of
interest and the waste, and (2) the grain sizes need to fall in the range where surface forces can be
dominant over gravitational forces. MFT is a flotation technique where water and oil are added to
powdered rock, mixed and allowed to separate as illustrated in Figure 7.
Figure 7: Detailed schematic depicting the MFT procedure.
The wetting of the solid grains results from the balance of surface forces between the
interaction of the oil and water with the rock grain surface. The MFT procedure mimics the
sequence of events in the creation of oil reservoirs. As shown in Step 3, all grains in the MFT
procedure start out as water-wet and thus negatively buoyant since their density is greater than

38
water. As oil is added (Step 4) and the rock, water, oil phases are thoroughly mixed, there are 3
possible results. If the geochemical conditions are such that the rock powder is: (1) water-wet, the
grains will sink (Result 1a); (2) oil-wet, the grains will be suspended in the oil-phase (Result 1b);
(3) fractional-wet, then a fraction of the rock will be suspended (oil-wet) in the oil-phase and the
rest of the grains (water-wet) will sink (Result 1c). This separation process is what allows us to
determine the wettability of the rock in an oil-water-rock system. Each portion of the rock is then
dried and weighed to quantify oil adhesion. In this work the result is normalized to decane-rock
adhesion to identify the wetting contribution of individual surface active compounds.
In 1956, Brown and Fatt proposed that the wettability of reservoir rock be stated in terms
of the fractional internal surface area that is in contact with water or oil. All surfaces on which
there is water are called water-wet; surfaces on which there is oil are called oil-wet. They proposed
that fractional water wettability is a number which represents the fraction of the internal surface
that is in contact with water. In MFT, this is the fraction of grains residing in the water phase. In
addition, fractional oil wettability is then stated as a number which represents the fraction of the
internal surface that is in contact with oil. In MFT, this is the fraction of grains residing in the oil
phase.
In MFT, the rock grains are first exposed to water and aged for 2 days to allow for
equilibrium conditions to be met (Figure 7). Solid particles carry an electrical charge when in
contact with an aqueous phase, and its magnitude depends upon the surface chemistry of the solid
and the solution chemistry of the aqueous phase (Kelebek, 1984). Once oil is introduced, the
balance of surface forces between the grain surface and oil and water, determine which of the two
immiscible fluids will adhere to the grain surface. If water adheres to the surface, then the grain is
considered water-wet. Similarly, if oil adheres to the surface, then the grain is considered oil-wet.

39
Oil-wetness can be described by direct and indirect sorption of oil to the rock surface (Brady &
Thyne, 2016), which refers to mechanism of wetting on the grain scale. Figure 7 is an illustration
of the two oil-wet scenarios, direct and indirect sorbed oil. Direct adsorption of oil occurs if the
attractive force is greater than the disjoining pressure. Solvent recovery methods such as surfactant
flooding, are required to displace the directly adhered oil (Brady & Thyne, 2016). Indirect
adsorption occurs when oil adheres loosely to the rock surface through a water film, and thus
sensitive to the brine chemistry. To identify the causes of wettability alteration in carbonate rocks,
Brady and Thyne (2016) coined the term functional wettability, which is a product of indirectly
adsorbed oil. In their work, they focused on indirectly adsorbed oil, which makes up the largest
fraction of non-free-phase original oil in place and can be influenced by waterflooding.
Figure 8: Indirect and direct adsorption of oil on reservoir mineral surfaces (Brady & Thyne,
2016).
In this project, grains referred to as oil-wet describe oil adhering to the rock both directly
and indirectly. This description of oil-wetness was selected since the synthetic oils used in this
project are not expected to have enough of an attractive force to overcome the disjoining pressure
and thus break the water film layer. Instead, the interaction between the oil and rock surface are
through a thin film of water.

40
4.1. Flotation Requirements
Flotation is a well-known physicochemical process exploiting differences in surface
properties of minerals which depend on wettability or hydrophobicity of particles (Perkins, 1921;
Klassen, 1948a, 1948b; Whelan, 1956; Boutin & Wheeler, 1967). If the solid surface of the
particles of interest is not hydrophobic (oil-wet) to begin with, a chemical agent is added to render
the surface hydrophobic, thus causing the solid to adhere to the hydrophobic phase (oil). The
hydrophobic particles then floats or remain in suspension while the hydrophilic (water-wet)
particles sink (Swinburne and Rudorf, 1906; Wang & Peng, 2014). In the case of MFT, the
wettability of the rock grains are a natural consequence of the solid interaction with oil and water.
Grain size plays a crucial role in the effectiveness of flotation processes since it determines
which forces (region) are dominant in a given condition. The three possible regions that could be
determined by grain size are: (1) The colloidal region where grain sizes are typically less than 5-
10 microns. In this region, the Brownian motion becomes essential, but the gravity-induced
capillary force is completely negligible. (Yoon, 2000; Danov & Kralchevsky, 2010). Collision
between the particles resulting from Brownian motion can lead to perikinetic coagulation (Yoon,
2000). The properties of such suspensions strongly depend on the surface properties of the
dispersed solid phase. Thus, the particles are always suspended in the fluid (e.g. bacteria or
polymer in water) regardless of wettability. Therefore, flotation processes are ineffective in this
region. (2) The gravitation force dominant region is a result of large particle sizes. In this region,
the particles will always sink regardless of its wettability making flotation impossible (Rickard,
1916; Pryor, 1965; Yoon, 2000). (3) Between the colloidal and gravitational force region, there
exist a transitional region where surface forces or gravitational forces can dominate depending on
the wettability of the particle. In this region, flotation processes are effective in separating materials
based on their wettability (Rickard, 1916; Pryor, 1965; Yoon, 2000). Numerous studies have

41
shown that the successful exploitation of differences in surface properties to separate minerals
requires the metallic ore particle size to be between 10 µm to 300 µm, and bituminous coal particle
size to be between 10 µm to 6700 µm (Rickard, 1916; Ralston 1916; Pryor, 1965). Note that the
range of grain size range eligible for flotation differs depending on the density of the grains. The
higher the density the narrower the range. Flotation processes are ineffective for particles outside
this range since they will fall in the colloidal or gravitational region.
A set of controlled visual experiments using glass beads, deionized water and decane were
conducted to demonstrate wettability measurements in a gravitation force dominant region and in
a transitional region. The colloidal region was not tested due to difficulty in attaining glass beads
sizes less than 10 µm. The three glass beads sizes selected were: 88-149 µm, 425-600 µm, and
3000 µm. For each grain size, oil-wet and water-wet cases were examined. For the water-wet cases,
the beads did not require any preparation prior to MFT experiments since the beads were made of
glass and thus hydrophilic (water-wet). For the oil-wet cases, the beads were soaked in WD-40 for
15 minutes to render the surfaces hydrophobic before the MFT experiment.
As shown by Figure 9 and Figure 10, both 88-149 µm and 425-600 µm are in the transition
region. In this region, the water-wet beads reside in the water-phase as the oil-wet beads float to
the oil phase. The oil-wet glass beads float because the downward pull of gravity is insufficient
to overcome the oil-wet adhesion to the oil phase. On the other hand, 3000 µm glass bead size was
found to be in the gravitational force dominant region as shown by Figure 11. Regardless of the
wettability, both the water-wet and oil-wet beads sink to the bottom of the beaker. Due to the large
size, the pull of gravity is large enough to overcome the oil-wet beads adhesion to the oil phase.

42
Figure 9: Results of water-wet and oil-wet 88-149 µm glass beads which are in the transitional
region.
Figure 10: Results of water-wet and oil-wet 425-600 µm glass beads which are in transitional
region.
Figure 11: Results of water-wet and oil-wet 3000 µm glass beads which are in the gravitational
force dominant region.

43
4.2. Flotation Fundamentals
Capillary forces play a crucial role in a variety of phenomena and appear whenever the
particles distort the liquid interface. These forces are responsible for the adhesion between two
solid bodies connected by a liquid bridge and for the flotation of denser particles at the free surface
of a liquid, in a gravitational field. Theoretically, determining the strength of interaction forces
between bodies at an interface requires solving the Young-Laplace equation, which describes the
interface shape (de Gennes, 1985). Analytical solutions can only be obtained for highly symmetric
situations or by using approximations. The most common approximation is the linearization of the
Young-Laplace equation, valid when the interface slope is small. Several studies on the capillary
interactions between different bodies have been done by Kralchevsky and co-workers (2000,
2001). They calculated the exact force for two cylinders and spheres numerically and compared it
with the approximated formula. They concluded that for short distances between the particles the
approximated formula underestimates the force considerably. In the case of floating spheres, they
calculate the interaction by replacing the spheres with equivalent cylinders (Paunov, et al., 1993).
Danov and Kralchevsky (2010) studied the interactions between particles at a fluid interface. In
their work, they reviewed different kinds of lateral capillary forces and derived their expression.
4.2.1. Flotation Force Balance
The process of flotation combines fluid and particle mechanics, thin film theory, and
surface science. This section presents a force balance analysis adopted from several publications
(Bloom & Heindel, 1997; Pitois and Chateau, 2002; Emerson, 2007; Binks & Horozov, 2007).
The stability of a floating particles in a fluid can be expressed by a dimensionless parameter
analogous to the bond number (Bo′) which gives the ratio of detachment forces (Fdetach) to
attachment forces (Fattach) (Schulze, 1984). The attachment force is the force that keeps the
particle in the oil-water interface and it consists of the capillary force on the liquid side (Fca) and

44
hydrostatic pressure force (Fhyd). The detachment force is the force that is needed to detach the
particle from the oil-water interface and it includes the weight of the particle (Fg − Fb), drag (Fd),
and capillary force on the bubble side (Fσ).
Bo′ =Fdetach
Fattach=
Fg−Fb+Fd+Fσ
Fca+Fhyd Equation 5
Figure 12: Forces acting on a bubble-particle aggregate (Bloom & Heindel, 1997).
Fg =4
3πRP
3 ρPg Equation 6
Fb =π
3RP
3 ρlg[(1 − cos(ω))2(2 + cos(ω))] Equation 7
Fd =4
3πRP
3 ρPac Equation 8
Fσ = πrP2Pσ ≈ πRP
2 sin2(𝜔)(2σ
R𝐵− 2R𝐵ρl𝑔) Equation 9
Fca = −2πR𝑃σ sin(𝜔) sin(𝜔 + 𝜃) Equation 10
Fhyd = πRP2 sin2(𝜔)(ρl𝑔𝑧0) Equation 11

45
where ac depends on both the structure and the intensity of the turbulent flow field, ω is the angle
in the particle, 𝜃 is the contact angle, R𝐵 is the bubble radius, R𝑃 is the particle radius, ρl is the
density of the liquid in a neighborhood of a bubble. Figure 13 illustrates the three-phase contact
between the bubble, particle, and fluid regions, that corresponds to the above equations.
Figure 13: Three-phase contact between the bubble, particle, and fluid regions (Bloom &
Heindel, 1997).
For a particle in the presence of oil and water (Figure 14), the following equations adopted
from (Binks & Horozov, 2007) would apply.
Figure 14: Heavy solid spherical particle with radius r and contact angle in the equilibrium at the
oil-water interface levelled at z=0 far from the particle. The three-phase contact line with radius
rc is depressed at the depth zc below the zero level.

46
Fγ + FP =4
3πρPr3g Equation 12
Fγ = −2𝜋𝑟γ𝑜𝑤 sin(𝜑𝑐) sin(𝜑𝑐 + 𝜃) Equation 13
FP = ρwVpwg + ρoVpog − (ρw − ρo)gzcA𝑐 Equation 14
Where Fγ is the vertical capillary force, FP is the Integration of the hydrostatic pressure distribution
around the entire particle surface, γ𝑜𝑤 is interfacial tension between oil and water, the 𝜌P, ρw, ρo
are the densities of the particle, water, and oil, respectively. Vpw =𝜋𝑟3(2−3 cos(𝜑)+𝑐𝑜𝑠3(𝜑))
3 and
Vpo =4
3πr3 − Vpw are particle volumes immersed in water and oil, respectively. and A𝑐 =
π𝑟2 sin2(θC) is the area of the contact line. When Fγ and FP are substituted into equation 12 the
following force balance equation was derived.
sin(𝜑𝑐) sin(𝜑𝑐 + θ) = −B
6[4 (
ρP−ρo
ρ𝑤−ρo ) − (1 − cos(𝜑𝑐))2(2 − cos(𝜑𝑐)) + 3
zc
rsin2(𝜑𝑐)]
Equation 15
where B =(ρ𝑤−ρo)𝑟2
γ𝑜𝑤 is the dimensionless bond number. In the considered case of a heavy particle
(ρP > ρ𝑤 > ρo), Fγ must always act upwards, therefore, 𝜑𝑐 + θ ≫ 180°, 𝜑𝑐 ≤ 180°. Hence the
left-hand side of the equation is restricted in the range of −1 ≤ sin(𝜑𝑐) sin(𝜑𝑐 + θ) ≤ 0. The
same should apply to the right-hand side of the equation.
If the particle is too big or dense, the bond number will be too large and cannot be solved.
These particles are considered to be in the gravitational dominant region and will sink regardless
of their wettability. For particles that are too small 𝑟 approaching zero, the interfacial force, which
varies linearly with r, dominates the buoyant weight of the particles which varies as 𝑟2. In this
limit, since (ρ𝑤−ρo)𝑟2
γ𝑜𝑤→ 0, the right-hand side of equation 15 is zero and thus sin(𝜑𝑐 + θ) ≈ 0.
Due to this, it has been understood that small particles can be suspended along fluid surfaces

47
without causing significant interfacial deformation no matter how heavy they are. These particles
are considered to be in the colloidal region which typically consists of particle less than 10 µm.
Krahshesky, et al. (1992, 1993) reported that the lateral particle-particle attraction force, which
arises due to interface deformation, is also insignificant when the particle diameter is smaller than
10 µm.
Krahshesky, et al. (1992, 1993, 2010) solved the Laplace equation for the interface shape
using bipolar coordinates for a case where the meniscus slope and the particle size are small. This
solution has provided expressions for calculating the capillary meniscus force between two vertical
cylinders, two spheres partially immersed in a liquid layer and between a vertical cylinder and a
sphere. Specifically, Kralchevsky and Nagayama (2000, 2001) have shown that the lateral force
Fl acting on the particles of radii of 𝑅1 and 𝑅2 separated by distance L is equal in magnitude and
opposite in sign and is given by
Fl = −2πγQ1Q2q ∗ K1(qL) Equation 16
where q is the inverse capillary length; γ is the liquid/fluid interfacial tension; K1(qL) is the
modified Bessel function of the second kind and first order, and Q1 and Q2 are capillary charges
for floating particles that can be estimated from the following expression.
Qi =1
6q2Ri
3(2 − 4Di + 3 cos(αi) − cos3(αi), (i = 1, 2) Equation 17
where Di =ρi−ρII
ρI−ρII and ρi, ρI, and ρII are the mass densities of the particle, lower (water) and upper
(oil) fluid phases.
The interface surface becomes flatter with increasing distance from the particle. When a
suspended particle is within the region of influence of another particle, it will move along the
interface due to the lateral component of the interfacial force. The above static equilibrium analysis
is useful for determining the parameter values for which the particles can remain trapped on two-

48
fluid interfaces, as well as the sign and magnitude of forces that act between two suspended
particles (Bloom & Heindel, 1997; Pitois and Chateau, 2002; Emerson, 2007; Binks & Horozov,
2007). To understand the actual motion of particles on the interface equations of motion must be
solved. Since the governing equations are complex, the dynamic behavior of fluid particles is not
well understood.
4.2.2. Wetting Forces in Flotation
The relative magnitude of intermolecular surface forces determines the wettability of the
rock-oil-brine system (Anderson, 1986; Hirasaki, 1991; Israelachivili, 2011). The magnitude of
these intermolecular surface forces is found to be significantly large when the thickness of aqueous
wetting films squeezed between the bulk oil phase and reservoir rock surface becomes significantly
small.
The wetting behavior of a liquid on a solid surface is determined by the difference between
the cohesive interactions holding the liquid together and the adhesive interactions between the
liquid and the solid (Schick, 1990; Israelachvili, 1992). The net effect of the interaction potentials
on the wetting behavior are typically quantified by considering a liquid film of thickness on a solid
surface. If the adhesive solid-liquid interactions are strong, the system can lower its free energy by
increasing the distance between the two surfaces. This leads to a net repulsive force per unit area
between the solid-liquid and liquid-vapor interfaces, which is called the disjoining pressure (de
Feijter, 1988) and can be measured in experiment. Experimentally measured magnitude of surface
forces in the form of adhesion energy per unit area is compared with either theoretically determined
disjoining pressure using DLVO theory or using the concept of work of adhesion that relies on the
theoretical determination of equilibrium (Young’s) contact angle and its comparison with
experimentally measured values of equilibrium (Young’s) contact angle (de Gennes, 1985;

49
Israelachvili, 2011). An agreement between the experimental measurements and theoretically
determined surface force-distance profile versus film thickness curves is sought for the
development of accurate mathematical models to describe wettability of complex rock/oil/water
systems at pore level. However, the experimental determination of surface force versus film
thickness relationship using atomic force microscopy or surface force apparatus has only been
reported at ambient conditions. The use of dead oil or pure hydrocarbons as oil phase in these types
of experiments also limits the use of such measurements in determining the extent of rock/oil
adhesion interactions at reservoir conditions.
There are several different ways to express the degree of wetting of a solid against liquids.
Wetting has been described in terms of spreading coefficient shown in equation 18 (de Gennes,
1985; Somasundaran & Zhang, 2004; Israelachivili, 2011;)
𝑆 = γso − γsw − γow Equation 18
Where γow, γso, and γsw are the interfacial tensions of the oil/water interface, the solid/oil interface
(Figure 15), and the solid/water interface, respectively. When S is positive the spreading of oil
occurs spontaneously.
Figure 15: A schematic representation of contact angle in rock/oil/water (Solid/Liquid/Liquid)
systems.

50
Since it is difficult to estimate γso directly, Young’s equation was extended to understand the
wettability phenomenon of rock/oil/water systems of petroleum engineering, by considering the
equilibrium state at the point of three phase contact (Saini et al., 2008).
γso = γsw + γowcos(θ) Equation 19
Where θ is the equilibrium contact angle. Similarly, Dupre’s equation explains the change in free
energy accompanying the replacement of unit area of solid-oil interface by solid-water interface.
∆𝐺 = γso − (γsw + γow) Equation 20
Thus, the displacement of water by the oil would happen when the solid-oil interfacial tension is
higher than the combined interfacial tensions of solid-water and liquid-oil. Young’s expression
combined with Dupre’s equation results in following expression.
∆𝐺 = γow (cos(θ) − 1) Equation 21
Therefore, the change in free energy for three phase contact system depends of the particle’s
hydrophobicity, which is a function of contact angle (θ). The maximum negative change in free
energy would occur for a perfect hydrophobic particle with a contact angle of 90°. However,
equation 21 is valid for an equilibrium condition where all other forces are absent in the system.
As described by Celik and Somasundran (1980), solids in flotation will reside in the oil
phase, water phase, or at the interface depending on the following criteria. If γso > γsw + γow, the
solid will reside in the water phase, thus indicating water-wet or hydrophilic nature. If γso <
γsw + γow, the solid will reside in the oil phase, thus indicating oil-wet or hydrophobic nature. If
γow > γs0 + γsw or if none of the three interfacial tensions is greater than the sum of the other
two, the solid will collect at the water-oil interface with a larger portion of the solid remaining on
the water side of the interface if γsw > γ𝑠𝑜 and θ is less than 90°, and on the oil side if the interface
of γsw < γ𝑠𝑜 and θ is greater than 90°.

51
These relationships show that all the three interfacial tensions play a role in determining
the phase where the rock grain resides. Most of the researchers agree that changing the ionic
composition of injected brine will affect the capillary forces in the core (Kilybay et al., 2017).
However, none could provide a strong evidence that oil-water IFT (γow) varied in an appreciable
manner to influence oil-recovery. Yousef et al. (2011) observed a slight decrease in oil-brine IFT
when brine salinity was decreased from formation water to sea water. However, oil-water IFT
reduction was insignificant when the brines were diluted. Zheng (2012) also observed negligible
change in oil-water IFT as brine salinity and composition variations. However, she did observe
oil-water IFT changes when surfactants were introduced to the brine. Al Quraishi et al. (2015)
conducted oil-water IFT measurements between oil and different brines at reservoir conditions.
With decreasing brine salinity by dilution of up to 10 times, the oil-water IFT was reduced by
about 6 units which is not significant enough to be a dominant mechanism for low salinity water
flooding. Al-Harrasi et al. (2012) conducted laboratory experiments on low salinity waterflooding
on carbonate rocks through spontaneous imbibition and core flooding experiments, and used brines
with different dilutions of formation water (2-100 times dilution). These brines improved the oil
recovery by 3–5% after injection of one pore volume of low salinity brine. From IFT studies, the
authors found that there was little change in the oil-water IFT as brine salinity was varied.
Therefore, they concluded that wettability alteration was the mechanism for improved oil recovery
by low salinity waterflooding in carbonate rocks. Al-Attar et al. (2013) studied low salinity water
injection with different values of salinity and concentration of calcium. They observed significant
increase in oil recovery, up to 84% original oil in place, as salinity was decreased. Their contact
angle studies showed that decreasing salinity shifted the wettability towards a more mixed wet
state and not IFT change.

52
Based on the published research, oil-water IFT (γow) does not change significantly as brine
salinity is varied. Therefore, the changes observed due to brine salinity variations can be attributed
to wettability change or the change in solid-oil (γs0) and/or solid-water (γsw) IFTs.

53
CHAPTER 5. TECHNIQUE DEVELOPMENT, REFINEMENT, & VALIDATION
This chapter details the development, refinement, and validation of the MFT. The MFT
can be used to quickly measure wettability. Existing wettability methods are limited by the time
and expense it takes to run a single experiment (days to weeks). This is a significant bottleneck for
laboratory experiments and impedes progress toward better understanding the nature of petroleum
adhesion due to the sheer number of measurements required. To overcome this barrier, we
developed a measurement technique that was fast, reliable, and would serve as both a screening
tool and provide quantitative results.
5.1. Development
Two flotation techniques in petroleum systems were identified in the literature: (1) Wu et
al. (2008) and (2) Doe and Dubey (1993), referred to as Wu and D&D, respectively (Table 6).
Both procedures give qualitative measures of wettability. The two main differences are that Wu’s
procedure dries the rock powder after it is aged in oil, while the D&D procedure ages the rock in
brine prior to aging in oil and does not include the drying step.
Table 6: Comparison of the two published flotation experiment procedure by Wu et al (2008)
and Dubey and Doe (1993). The asterisk (*) indicates the main differences in the two
procedures.
Wu et al. (2008) Procedure Dubey and Doe (1993) Procedure
Age rock in oil for two days in a test
tube
Decant the oil
Dry the remaining rock*
Add brine to the dried rock powder in
test tube
Age rock in brine for two days in a test tube*
Separate brine from rock and save the brine
Add oil in the test tube with rock grains
Age rock in oil for two days
Add the saved brine in oil-rock mixture
Stir the brine-oil-rock mixture

54
Table 6: Cont’d
Both procedures were tested for 24 different model oil-rock combinations (Table 7). It was
observed that Wu’s procedure rendered all rock types water-wet, while the D&D method indicated
sandstone to be water-wet and the carbonates to be oil-wet. The D&D procedure was modified to
add the drying step from Wu’s procedure in order to test the effect of drying, and it was observed
that both sandstone and carbonate rocks were rendered water-wet, that is no grains were floating.
These results are denoted as D&D w/ drying in Table 7. In addition, when 2.5 ml oil was added at
the end of Wu’s procedure and the contents were vigorously stirred, the powdered limestone,
chalk, or dolomite that had previously sunk to the bottom of the test tube floated in the oleic phase.
This confirmed that the drying step unique to Wu’s procedure is responsible for the difference
between the procedures. We concluded that the true nature of the carbonate rocks under the tested
conditions is oil-wet; however, the drying process is hypothesized to have destabilized the oil film
around the grains or evaporated the SACs in the oleic phase thus rendering the originally oil-wet
carbonate rock grains water-wet. Therefore, the D&D procedure is likely to be the most consistent
and reliable of the two procedures because it avoids the drying process that shifts wettability and
avoids potential evaporation of SAC in the model oil. Also, there is less chance of contamination
in the D&D procedure because the test tubes are always closed.
Wu et al. (2008) Procedure Dubey and Doe (1993) Procedure
Stir the brine-oil-rock mixture
Take measurements after 2 hours
Take measurements when the mixture settles.

55
Table 7: Effects of oil composition on wettability @ 70°C using Wu et al. (2008), Dubey and
Doe (1993), and Dubey and Doe (1993) with drying step. WW represents water-wet conditions;
OW is oil-wet.
Rock Type Procedure
Aromatic
A1
Oxygen
O1
Sulfur
S1
Nitrogen
N1
Decane
Dec
Condensate
Cond
Berea
Wu WW WW WW WW WW WW
D&D WW WW* WW WW WW WW
D&D w/ drying WW WW WW WW WW WW
Chalk
Wu WW WW WW WW WW WW
D&D OW OW OW OW OW OW
D&D w/ drying WW WW WW WW WW WW
Limestone
Wu WW WW* WW WW WW WW*
D&D OW OW OW OW OW OW
D&D w/ drying WW WW WW WW WW WW
Dolomite
Wu WW WW* WW WW WW WW
D&D OW OW OW OW OW OW
D&D w/ drying WW WW WW WW WW WW
WW*: water-wet with a small fraction of rock displaying oil-wet behavior.
The main modification of the MFT from the D&D procedure was measuring the mass of
rock added to the test tube at the start of the experiment, and measuring the mass of water-wet
grains at the bottom of the test tube at the end of the experiment. This allows us to calculate the
mass of oil-wet grains by difference. This modification transforms the D&D procedure from a
qualitative to quantitative wettability measurement method. The original MFT procedure is
illustrated in Table 8 and Figure 7.
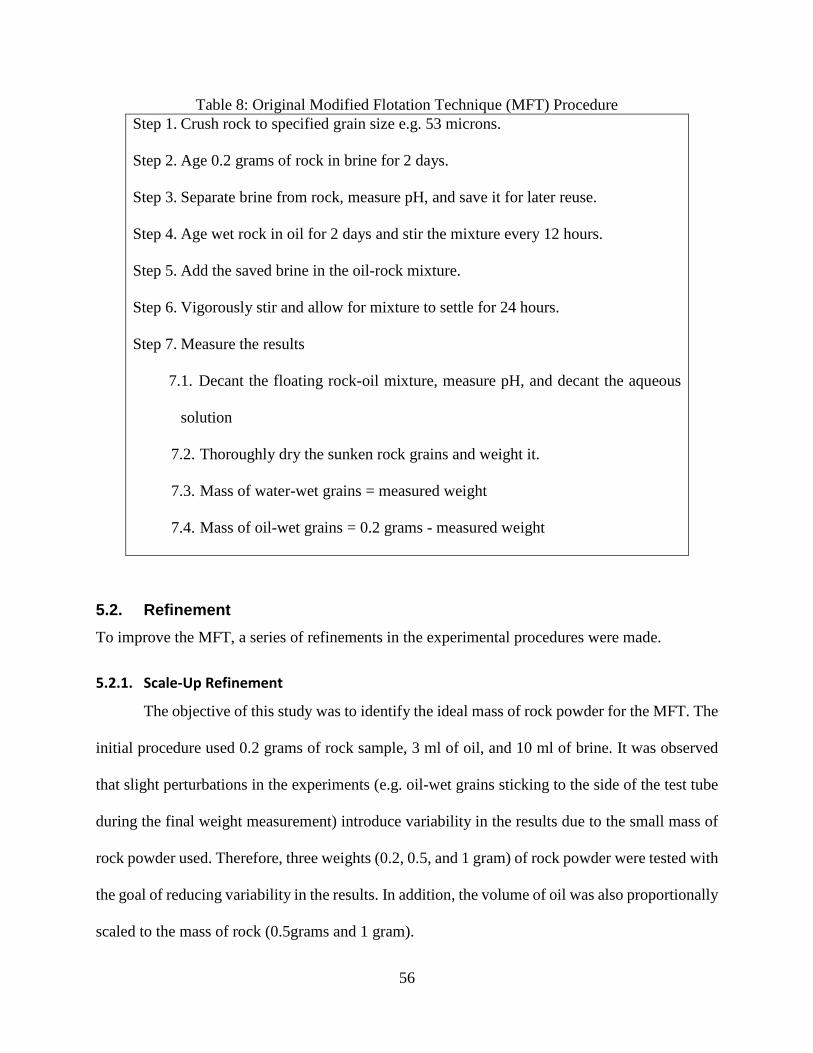
56
Table 8: Original Modified Flotation Technique (MFT) Procedure
Step 1. Crush rock to specified grain size e.g. 53 microns.
Step 2. Age 0.2 grams of rock in brine for 2 days.
Step 3. Separate brine from rock, measure pH, and save it for later reuse.
Step 4. Age wet rock in oil for 2 days and stir the mixture every 12 hours.
Step 5. Add the saved brine in the oil-rock mixture.
Step 6. Vigorously stir and allow for mixture to settle for 24 hours.
Step 7. Measure the results
7.1. Decant the floating rock-oil mixture, measure pH, and decant the aqueous
solution
7.2. Thoroughly dry the sunken rock grains and weight it.
7.3. Mass of water-wet grains = measured weight
7.4. Mass of oil-wet grains = 0.2 grams - measured weight
5.2. Refinement
To improve the MFT, a series of refinements in the experimental procedures were made.
5.2.1. Scale-Up Refinement
The objective of this study was to identify the ideal mass of rock powder for the MFT. The
initial procedure used 0.2 grams of rock sample, 3 ml of oil, and 10 ml of brine. It was observed
that slight perturbations in the experiments (e.g. oil-wet grains sticking to the side of the test tube
during the final weight measurement) introduce variability in the results due to the small mass of
rock powder used. Therefore, three weights (0.2, 0.5, and 1 gram) of rock powder were tested with
the goal of reducing variability in the results. In addition, the volume of oil was also proportionally
scaled to the mass of rock (0.5grams and 1 gram).

57
It was hypothesized that the larger the rock mass, the less sensitive the results would be to
slight weight changes/perturbations, e.g. oil-wet grains stuck on the test tube walls when the
floating rock-oil mixture is evacuated. The results of the three tested weights are shown in Figure
16. The results of the smallest rock mass (0.2 grams) varied significantly due to its greater
sensitivity to changes in weight. Experiments using 0.5 grams gave better precision in the case of
Berea and chalk. Surprisingly, experiments using 1 gram of rock mass had low precision probably
because of improper scaling of oil and water due to the limitation in test tube volume. This is likely
due to the large quantities of oil-wet grains that would be stuck on the test tube walls. Note that
regardless of the mass of rock tested, limestone and dolomite results have large deviations. This
was also attributed to the considerable fraction of oil-wet grains that were observed sticking to the
walls of the test tubes after the oil-phase was evacuated (Step 7.1). These results indicated a need
for further procedure refinements that are described in the next section.
Further Procedure Refinements
Recall that 0.5 grams of rock mass gave better results for both Berea and Chalk. But
significant quantities of oil-wet dolomite and limestone grains stuck to the test tube walls after the
oil-wet phase was evacuated, hence the results lacked precision. Presumably using a larger rock
mass would decrease the sensitivity of the MFT analysis to error in the rock mass. For this reason,
the MFT procedure was modified to use a relatively high rock powder mass of 1 gram. Again, the
variation in the 1.0 gram results shown in Figure 16 was caused by improper upscaling of brine
and oil volumes. It was realized later that only upscaling of the oil volume was necessary with the
higher mass of rock powder. The purpose of the brine is to initially wet the rock prior to its
exposure to oil, hence large quantities are not needed. On the other hand, an increase in oil volume
ensures that there is enough oil volume for 100% of rock powder to float if it is completely oil-
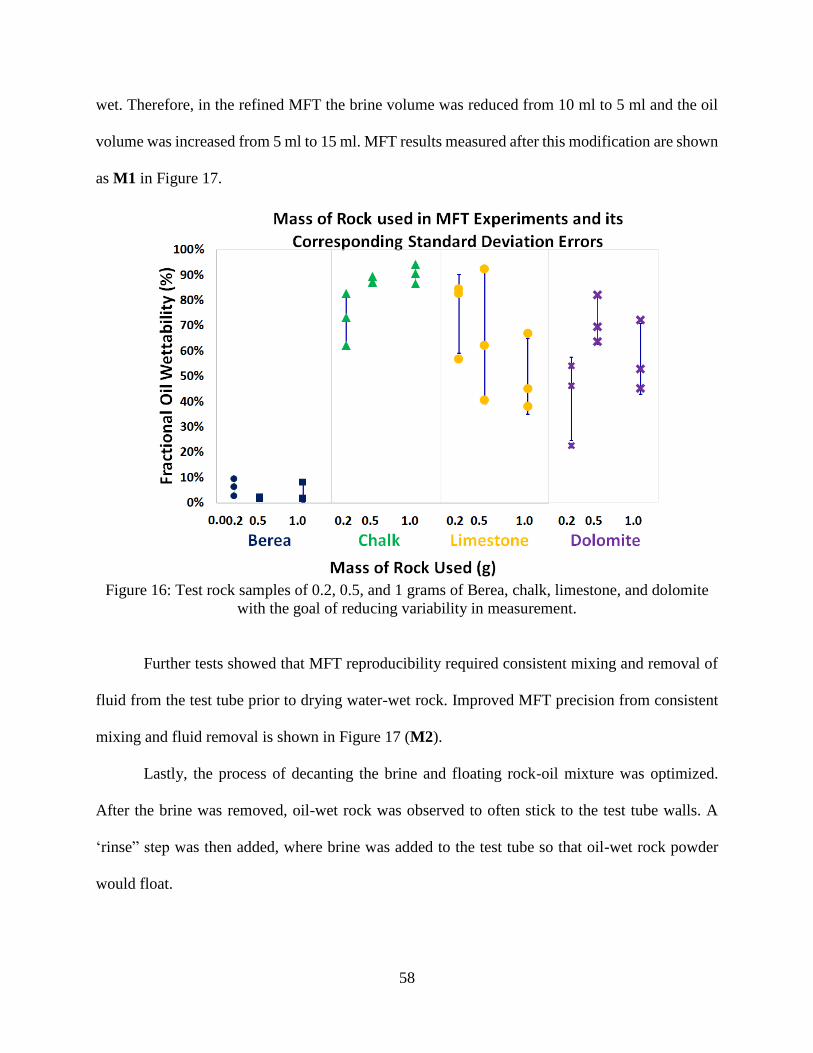
58
wet. Therefore, in the refined MFT the brine volume was reduced from 10 ml to 5 ml and the oil
volume was increased from 5 ml to 15 ml. MFT results measured after this modification are shown
as M1 in Figure 17.
Figure 16: Test rock samples of 0.2, 0.5, and 1 grams of Berea, chalk, limestone, and dolomite
with the goal of reducing variability in measurement.
Further tests showed that MFT reproducibility required consistent mixing and removal of
fluid from the test tube prior to drying water-wet rock. Improved MFT precision from consistent
mixing and fluid removal is shown in Figure 17 (M2).
Lastly, the process of decanting the brine and floating rock-oil mixture was optimized.
After the brine was removed, oil-wet rock was observed to often stick to the test tube walls. A
‘rinse” step was then added, where brine was added to the test tube so that oil-wet rock powder
would float.

59
Figure 17: Different modifications (M1, M2, and M3) made to the procedure and their
improvements on the precision of wettability when using 1 gram of Berea, chalk, limestone, and
dolomite.
In some instances, rock grains were coagulated by the oil phase and dropped to the bottom
of the test tube. These assemblages are noticeable because they lay on top of the water-wet rock
grains without mixing. If the mixture was re-stirred the assemblage would remain suspended for
some time in the oil phase, but would ultimately fall to the bottom of the test tube. To address this
problem, a ‘rinse and repeat’ step was added to the procedure. This entails adding brine to the test
tube to clean its walls and also provide a medium for the oil wet grains to float on and thus be
evacuated from the test tube. This modification improved the precision of the results as indicated
by M3 in Figure 17. The refined MFT procedure that resulted from the described modifications is
outlined in Table 9.

60
Table 9: Refined MFT Procedure
Step 1. Crush rock to specified grain size. 54-105μm/149-205μm grain size were used in this
project
Step 2. Add 1.0 gram of rock in a test tube. (M1)
Step 3. Add 5 ml of brine in the test tube, thoroughly mix, and age for 2 days.
Step 4. Age wet rock in oil for 1 day and stir the mixture every 12 hours.
Step 5. Add the saved brine in oil-rock mixture.
Step 6. Vigorously stir mixture several times every 8-12 hours then allow for it to settle for
24 hours. (M2)
Step 7. Measure the results
Step 7.1. Decant the floating rock-oil mixture, measure pH, and decant the aqueous
solution.
Step 7.2. Add brine to dislodge the oil-wet grains stuck on the sides of the test tube
and decant the brine. (M3)
Step 7.3. Thoroughly dry the sunken rock grains and weight it.
Step 7.4. Mass of water-wet grains = measured weight
Step 7.5. Mass of oil-wet grains = 1.0 gram - Mass of water-wet grains
5.2.2. Effect of Grain Size on MFT Results
A series of tests were conducted to determine the effect of grain size on the MFT wettability
results. The three grain size distributions tested were: < 53 μm, 54-105 μm, and 105-206 μm for
Berea, chalk, limestone, and dolomite. Each experiment was repeated 3 times to measure precision.
As shown in Figure 18 rock grain size does not affect wettability results for chalk, limestone, and
dolomite. However, Berea does vary with grain size. The smaller the Berea grain size the higher

61
is the percentage of rock measured to be oil-wet, which is refered to as fractional oil wettability.
This is due to higher clay content in the lower grain size, as shown in the X-Ray diffraction results
in Figure 19. The higher the clay content of a rock, the higher the fraction of rock that is measured
to be oil-wet using the MFT procedure.
Figure 18: Effect of grain size on wettability at 70°C.
Figure 19: Comparison of mineralogy of <53 µm and 149-206 µm Berea samples.

62
5.2.3. Rock-Oil-Brine Aging Time Investigation
The objective of this study was to determine the optimal oil-brine-rock aging time for the
MFT. Decane, condensate, and 4 model oils were tested. The 4 model oils were prepared by mixing
decane with 2000 ppm of surface active compound: Tetralin (A1), Myristic acid (O2), Di-n-butyl
sulfide (S2), and Quinoline (N2). Three temperatures were tested, 25°, 70°, and 110°C. The four
aging periods tested were: 6 hours, 1 day, 2 days, and 14 days.
Figure 20 shows the effect of aging time on wetting of Tetralin SAC in the presence of DI
water on Berea, chalk, limestone, and dolomite at 25°, 70°, and 110°C. MFT results were
independent of aging time after 1 day. A similar trend was observed in the rest of the experiments
(Figure A2 to Figure A5), except for the case of Berea + Myristic acid (Figure 21).
Figure 20: 6 hrs, 1 day, and 2 days aging time for 2000 ppm Tetralin at 25°C, 70°C, & 110°C.
Additional experiments were conducted to determine the ideal aging period for Berea when
myristic acid is present (Figure 22). Six aging periods were tested and it was found that the ideal
aging time for myristic acid was 2 days. Therefore, all subsequent MFTs used 2 days as the aging
time. The required aging time may ultimately vary for different rock-fluid systems. One advantage

63
of the MFT procedure is that it can quickly test and determine the appropriate aging period of the
oil-rock-fluid system of interest.
Figure 21: Aging time periods for Myristic acid (oxygen SAC) for Berea, chalk, limestone, and
dolomite.
Figure 22: Aging time periods for Myristic acid (oxygen SAC) for Berea.

64
5.3. Rock Mineralogy Characterization
This study was divided into two parts. The first set of experiments focused on measuring
the baseline mineralogy of Berea, chalk, dolomite, and limestone rocks. The second set of
experiments examined the differences in the mineralogy of the fraction of rock that is oil-wet
versus that which is water-wet.
5.3.1. Baseline Test
Baseline results of the four rock types were acquired by: crushing each rock to powder
form, sieve to 149-206 microns, and then followed by XRD measurements. Each sample was tested
twice to ensure the accuracy and repeatability of results. Table 10 outlines the XRD results for
sandstones and carbonates. The three carbonate rocks were found to be primarily composed of a
single mineral as illustrated Figure A7 to Figure A9. Therefore, in a case where wettability
differences are measured within the same sample, it can be inferred that it is not due to the
heterogeneity of the rock mineralogy. Fractional wettability in a reservoir may be caused by
variations in cementation, interconnected porosity, surface area, and so on. Berea is made up of
both quartz and clays (Figure A6) and is the focus of the more extensive wettability analysis below.
Table 10: XRD baseline results of Berea, chalk, limestone, and dolomite Rock Type Minerals
Berea
sandstone
Quartz:
67%
Illite:
21%
Kaolinite:
3%
Anorthoclase:
5%
Feldspar Group:
2%
Dolomite:
2%
Austin chalk
Calcite:
98%
Other: 2%

65
Table 10: Cont’d Rock Type Minerals
Indiana
limestone
Calcite:
99%
Other: 1%
Silurian
dolomite
Dolomite:
98%
Other: 2%
5.3.2. Composition of Oil-Wet versus Water-Wet Berea Samples
The second part of this study examined the differences in rock mineralogy between the
fraction of Berea sample that is oil-wet versus that is water-wet. Following the MFT experiment,
the oil-wet and water-wet fractions of each sample were separated and gently dried at 40oC. XRD
analyses of the two fractions were then conducted.
Berea MFT wettability measurements were conducted using deionized water at 70°C and
the oleic phase was varied by using: decane, decane + 2000 myristic acid, and condensate (Table
11). Again, decane was selected because it is typically used as the baseline oil that SAC results
can be compared to. Myristic acid and condensate were selected because they were the only oils
(including naphthenic SAC oil) that materially altered the wettability of Berea.
Table 11: Berea MFT Wettability results.
Oil type
Decane
Neutral
Decane + 2000 ppm Myristic
Acidic
Condensate
Natural Oil
Oil-wet 8% 21% 26%
Water-wet 92% 79% 74%

66
Neutral Oil Results
Berea in the presence of decane and DI water was found to be 92% water-wet and 8% oil-
wet. The water-wet fraction of the sample was mainly quartz with a small fraction of feldspar
(Figure 23). The oil-wet sample collected was too small to make XRD measurements. So the XRD
data of the water-wet sample was used to infer the likely identity of the oil-wet minerals. This was
accomplished by using the baseline fractions (Table 10 and Figure A6) and making the assumption
that 100% of the Quartz and Feldspar is water-wet. Therefore, their fractions were eliminated from
the baseline thus allowing for the clay fractions to be recalculated. Figure 23 compares the baseline
sample with the water-wet and oil-wet samples. These results match with what has been observed
in nature where quartz and feldspar are typically water-wet, but clays and carbonates are typically
oil-wet (Tang and Morrow, 1999a; Abdallah et al., 2007; Morrow and Buckley, 2011).
Figure 23: Comparison of Berea XRD measured and calculated mineralogy results.
Acidic and Condensate Oil Results
As illustrated by Figure 24, the Berea water-wet fraction in contact with Decane+Myristic
Acid and Condensate is almost all quartz. But the Berea oil-wet fraction in Decane+Myristic Acid
and Condensate also contains quartz, but a much higher fraction of clays. Unlike decane, it is
evident that both condensate and myristic acid SAC interact with quartz.

67
Figure 24: The difference in composition between the settled rock fractions vs. floating rock
fraction of decane + 2000 ppm myristic SAC and condensate oil.
5.4. MFT Validation
A useful validation of the MFT is to compare its trends with those of another measure of
wettability, for example, DDDC contact angles. Table 12 maps DDDC and MFT outputs to
wettability classifications. Table 13 shows DDDC contact angle-measured wettability of Yates oil
in contact with Silurian dolomite (Kasmaei and Rao, 2014) as a function of sulfate concentrations
in Yates Brine.
Table 12: Contact angle and MFT outputs and wettability.
Contact Angle
Wettability
Classification
Contact Angle
Result Interpretation
(Anderson, 1986)
MFT
Wettability
Classification
MFT
Result Interpretation
% rock that is oil-
wet
Strongly water-
wet
0~55º Strongly water-wet 0-15%
Weakly water-
wet
55~75º Water-wet 15-45%
Intermediate-wet 75~115º Intermediate-wet 45-55%
Oil-wet 115 ~ 135º Oil-wet 55-85%

68
Strongly oil-wet 135 ~ 180º Strongly oil-wet 85-100%
Table 13: Contact angle and MFT results on the effect of varying sulfate on wettability
Sulfate
Concentration
(g/l)
NaCl
Concentration
(g/l)
DDDC
Contact
angle (o)
DDDC
Wettability
Result
MFT
(% Rock
that is Oil-
Wet)
MFT
Wettability
Result
0 g/l 4.74 160° Oil-wet 100% Oil-wet
1.1g/l
(1x increase)
3.64 148° Oil-wet 96% Oil-wet
2.2g/l
(2x increase)
2.54 145° Oil-wet 84% Oil-wet
4.4 g/l
(4x increase)
0.34 138° Oil-wet 82% Oil-wet
10.8 g/l
(10x increase)
0 94° Intermediate 76% Intermediate
In order to maintain the same salinity, the concentration of NaCl (sodium chloride) was decreased
as the concentration of NaSO4 (sodium sulfate) was increased. Figure 25 depicts the wettability
results where both the contact angles (DDDC) and % of rock that is oil-wet (MFT) decreased. In
other words, the oil-wetting of dolomite by Yates oil declined with the increase in sulfate
concentration thus rendering the system (rock-water-oil) more water-wet. More importantly, the
MFT results accurately quantify the shift in wettability similar to the trend shown by the DDDC
contact angle measurements.

69
Figure 25: Comparison between contact angle and MFT results of wettability alteration due to
the variation of sulfate concentration.
To gain further validation of the MFT, eight additional rock-oil-brine systems were
examined by DDDC and MFT (Table 14). In the case of Berea-decane-DI water, both techniques
observed strongly water-wet conditions. Also, both techniques show that Berea becomes slightly
more oil-wet when condensate is used as the oleic phase. In addition, both dolomite and limestone
are observed to be oil-wet when in the presence of Yates oil and Yates brine. DDDC and MFT
differ for: dolomite-decane-DI water, dolomite-condensate-DI, and limestone-decane-DI water.
DDDC contact angle results indicate that the three systems are strongly water-wet, while the
opposite (oil-wet) is observed in the MFT case. This highlights one of the unique features of the
MFT procedure. In the MFT procedure, rock samples are crushed to powder, which increases the
surface area of the rock significantly. In the absence of ions in the brine, the dipole moment that
exists in the carbon-hydrogen bonds of decane interacts with the large surface area of the rock.
This interaction between the dipoles of decane and the large surface area of dolomite and limestone
result in the oil-wet MFT results. The same is true for the dolomite-condensate-DI water case.

70
However, as the brine salinity is increased (Yates brine case) dolomite becomes more water-wet
because the weak interaction between decane and the rock surface is replaced by stronger
electrostatic interactions between the oil and the rock surface. Note that these weak interactions
are not observed in the case of Berea-decane-DI water system. This is likely because the surface
of dolomite and limestone has a positive charge rather than the negative charge of the clays and
quartz in Berea (Buckley et al., 1989; Buckley, 2001; Hiorth et al., 2001). This suggests the
interaction is between the positive surface and negative portion of the dipole in decane. Only the
MFT can capture these weak interactions, unlike e.g. contact angle experiments.
Table 14: Contact angle and MFT results on the effect of varying salinity on wettability.
Rock - Oil – Brine System
DDDC
Contact Angle
θa, deg
DDDC
Wettability
Result
MFT
(% Rock
that is Oil-
Wet)
MFT
Wettability
Result
Berea - Decane - DI water ~ 0° Water-wet 5% Water-wet
Berea - Condensate - DI water 63° Water-wet 20% Water-wet
Dolomite - Decane - DI water ~ 0° Water-wet 93% Oil-wet
Dolomite - Decane - Yates brine ~ 0° Water-wet 53%
Intermediate-
wet
Dolomite - Yate oil - Yates brine 164° Oil-wet 100% Oil-wet
Dolomite – Condensate – DI
water
~ 0° Water-wet 98% Oil-wet
Limestone - Decane - DI water ~ 0° Water-wet 90% Oil-wet
Limestone - Yate oil - Yates
brine
135° Oil-wet 100% Oil-wet

71
CHAPTER 6. ROLE OF SURFACE ACTIVE COMPOUNDS ON RESERVOIR
SANDSTONE AND CARBONATE WETTABILITY
MFT results are used below to describe the role of oil SAC in determining wettability in
carbonate and sandstone reservoirs. Electrostatic models describing measured wettability are
proposed on the basis of the mineralogy of the rocks, model oils, and water used.
6.1. Establishing Baseline Conditions of All 4 Rock Types
Baseline conditions were acquired by measuring the wettability of each rock in the
presence of decane and deionized water (Figure 26).
Figure 26: Initial conditions set by decane + rock + deionized water at 70°C.
Decane is an alkane hydrocarbon with the chemical formula of C10H22 with 75 structural
isomers. A dipole moment exists between the carbon and hydrogen atoms of decane which creates
a weak polar charge. In the presence of DI water, this charge is strong enough to interact with the
opposite charge on the rock surface. The effect of the presence of salt will be discussed in Chapter
7.

72
Berea would be considered water-wet since 92% of the rock fraction is water-wet (quartz
and feldspar) and 8% is clay. The 8% fraction of Berea floating is a result of the weak polar charge
in decane interacting with the charge on the clay minerals.
The carbonate rocks are predominately oil-wet. Note that MFT procedure ages the rock in
water prior to introducing it to the oleic phase. Therefore, the starting wettability is usually water-
wet and the presence of the oleic phase may or may not foster interaction with the rock surface.
As observed in Figure 26 decane binds to a large fraction of the carbonate rocks, 88% of Austin
chalk (Ca0.845Mg0.155CO3), 75% of Silurian dolomite (CaMg(CO3)2), and 69% of Indiana limestone
(CaCO3). The observed decane binding to carbonate rocks is a result of the dipole moment of
decane interacting with the positive charge carbonate rock surfaces. These interactions are weak,
however, once salinity is increased stronger electrostatic forces become more prevalent as shown
in Section 7.1.
6.2. The Effect of SAC Concentration on Wettability
Three SAC concentrations (1000 ppm, 2000 ppm, 4000 ppm) were tested at 70°C. DI water
was used as the aqueous phase. The results of these experiments are grouped by rock type, where
each graph reports the percent change of wettability for each of the nine SACs, Tetralin, and
condensate. The percent change in wettability is calculated by normalizing the wettability result
of each SAC and condensate to that of decane. A positive change in wettability denotes an increase
in the fraction of rock that is oil-wet. A negative change denotes an increase in the fraction of rock
that is water-wet. Results in the region of ±5% are considered as analytical uncertainty and thus
normalized to zero.
Figure 27 illustrates the effect of SAC concentration on the wettability of Berea in the
presence of DI water at 70°C. Only condensate and the long-chained oxygen SAC have an effect
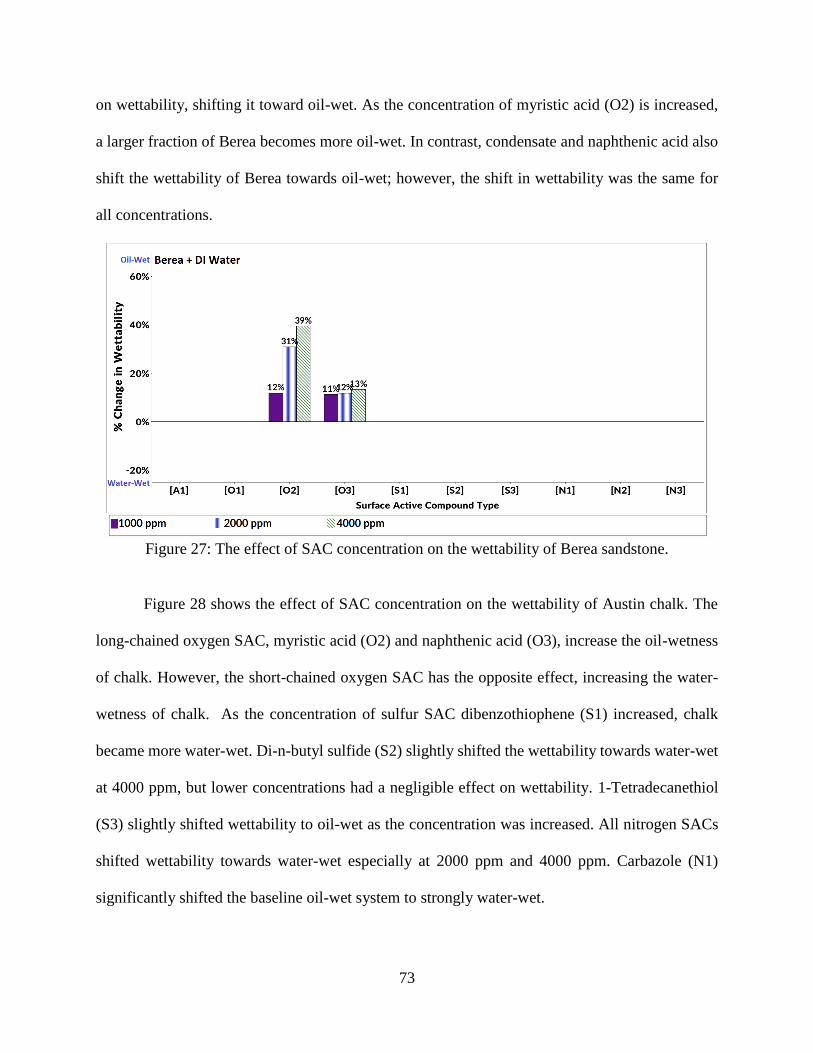
73
on wettability, shifting it toward oil-wet. As the concentration of myristic acid (O2) is increased,
a larger fraction of Berea becomes more oil-wet. In contrast, condensate and naphthenic acid also
shift the wettability of Berea towards oil-wet; however, the shift in wettability was the same for
all concentrations.
Figure 27: The effect of SAC concentration on the wettability of Berea sandstone.
Figure 28 shows the effect of SAC concentration on the wettability of Austin chalk. The
long-chained oxygen SAC, myristic acid (O2) and naphthenic acid (O3), increase the oil-wetness
of chalk. However, the short-chained oxygen SAC has the opposite effect, increasing the water-
wetness of chalk. As the concentration of sulfur SAC dibenzothiophene (S1) increased, chalk
became more water-wet. Di-n-butyl sulfide (S2) slightly shifted the wettability towards water-wet
at 4000 ppm, but lower concentrations had a negligible effect on wettability. 1-Tetradecanethiol
(S3) slightly shifted wettability to oil-wet as the concentration was increased. All nitrogen SACs
shifted wettability towards water-wet especially at 2000 ppm and 4000 ppm. Carbazole (N1)
significantly shifted the baseline oil-wet system to strongly water-wet.
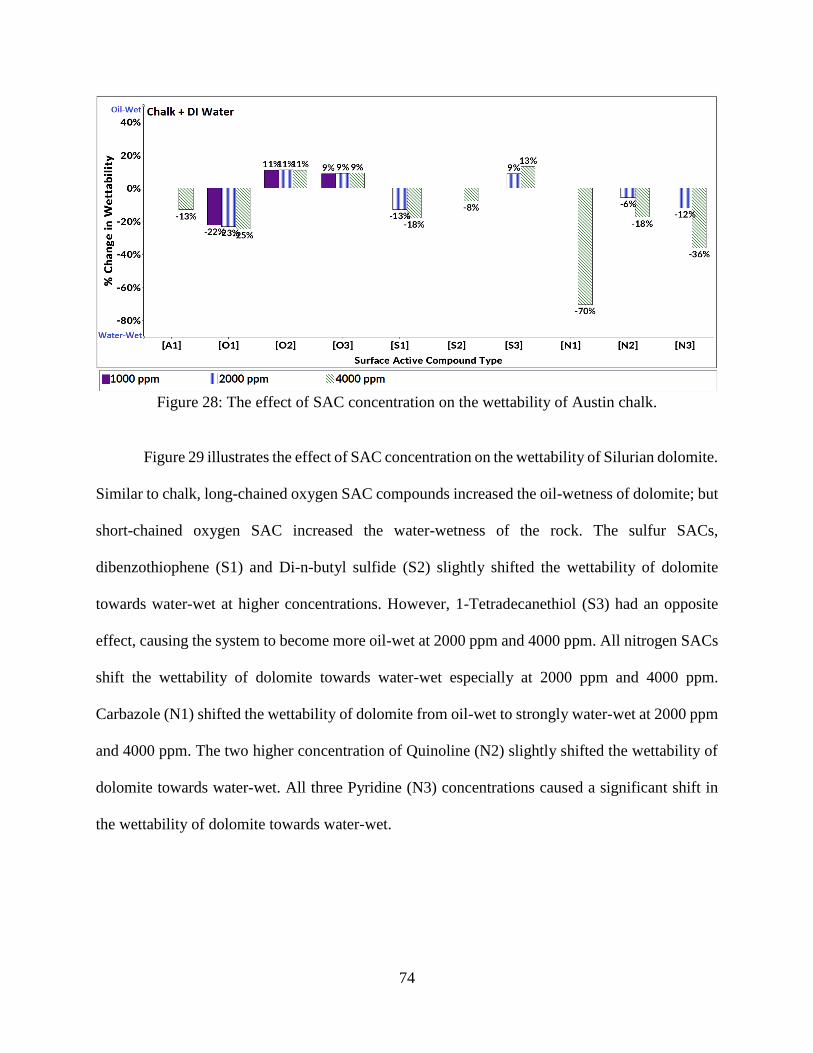
74
Figure 28: The effect of SAC concentration on the wettability of Austin chalk.
Figure 29 illustrates the effect of SAC concentration on the wettability of Silurian dolomite.
Similar to chalk, long-chained oxygen SAC compounds increased the oil-wetness of dolomite; but
short-chained oxygen SAC increased the water-wetness of the rock. The sulfur SACs,
dibenzothiophene (S1) and Di-n-butyl sulfide (S2) slightly shifted the wettability of dolomite
towards water-wet at higher concentrations. However, 1-Tetradecanethiol (S3) had an opposite
effect, causing the system to become more oil-wet at 2000 ppm and 4000 ppm. All nitrogen SACs
shift the wettability of dolomite towards water-wet especially at 2000 ppm and 4000 ppm.
Carbazole (N1) shifted the wettability of dolomite from oil-wet to strongly water-wet at 2000 ppm
and 4000 ppm. The two higher concentration of Quinoline (N2) slightly shifted the wettability of
dolomite towards water-wet. All three Pyridine (N3) concentrations caused a significant shift in
the wettability of dolomite towards water-wet.

75
Figure 29: The effect of SAC concentration on the wettability of Silurian dolomite.
Figure 30 shows the effect of SAC concentration on the wettability of Indiana limestone.
Similar to dolomite and chalk long-chained oxygen SAC shifted Indiana limestone wettability
towards oil-wet and short-chained SAC shifted Indiana limestone wettability towards water-wet.
Sulfur SACs, dibenzothiophene (S1) and Di-n-butyl sulfide (S2) slightly shifted the wettability of
dolomite towards water-wet at 4000 ppm. 1-Tetradecanethiol (S3) had the opposite effect; the
system became more oil-wet at 2000 ppm and 4000 ppm. All nitrogen SACs shifted limestone
wettability towards water-wet at 2000 ppm and 4000 ppm. Carbazole (N1) shifted the wettability
of limestone from oil-wet to strongly water-wet at all concentrations. Quinoline (N2) and Pyridine
(N3) produced a significant shift in limestone wettability towards water-wet.
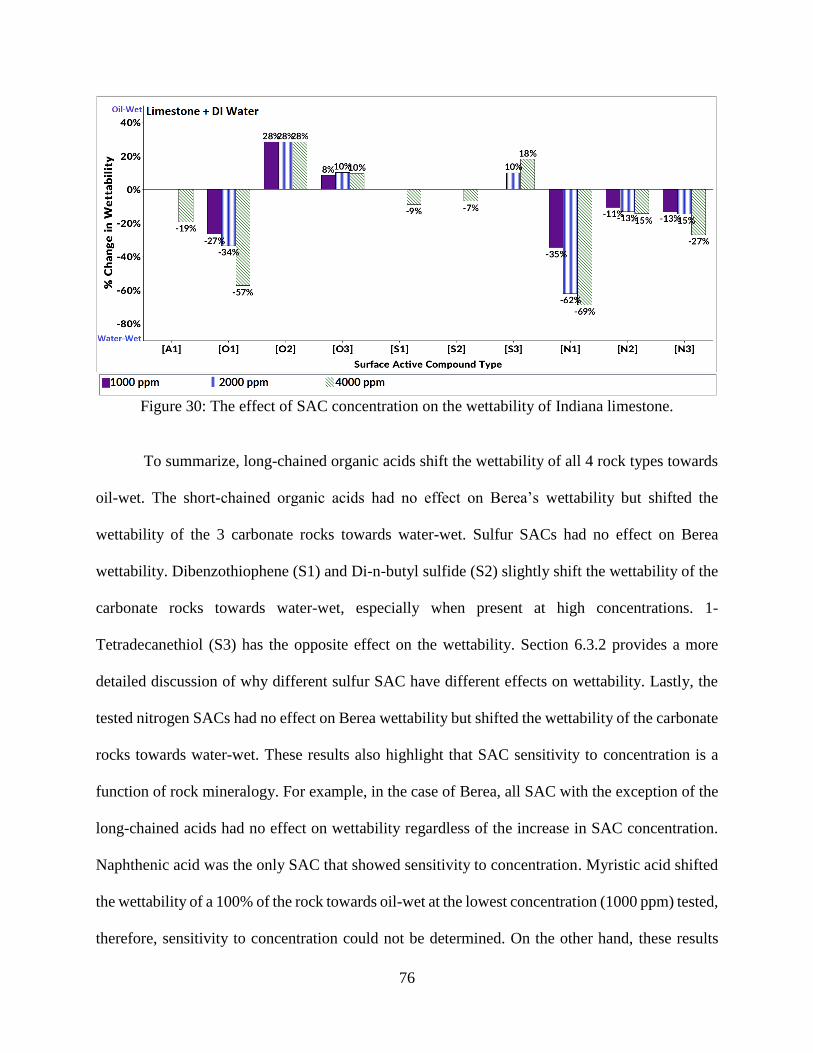
76
Figure 30: The effect of SAC concentration on the wettability of Indiana limestone.
To summarize, long-chained organic acids shift the wettability of all 4 rock types towards
oil-wet. The short-chained organic acids had no effect on Berea’s wettability but shifted the
wettability of the 3 carbonate rocks towards water-wet. Sulfur SACs had no effect on Berea
wettability. Dibenzothiophene (S1) and Di-n-butyl sulfide (S2) slightly shift the wettability of the
carbonate rocks towards water-wet, especially when present at high concentrations. 1-
Tetradecanethiol (S3) has the opposite effect on the wettability. Section 6.3.2 provides a more
detailed discussion of why different sulfur SAC have different effects on wettability. Lastly, the
tested nitrogen SACs had no effect on Berea wettability but shifted the wettability of the carbonate
rocks towards water-wet. These results also highlight that SAC sensitivity to concentration is a
function of rock mineralogy. For example, in the case of Berea, all SAC with the exception of the
long-chained acids had no effect on wettability regardless of the increase in SAC concentration.
Naphthenic acid was the only SAC that showed sensitivity to concentration. Myristic acid shifted
the wettability of a 100% of the rock towards oil-wet at the lowest concentration (1000 ppm) tested,
therefore, sensitivity to concentration could not be determined. On the other hand, these results
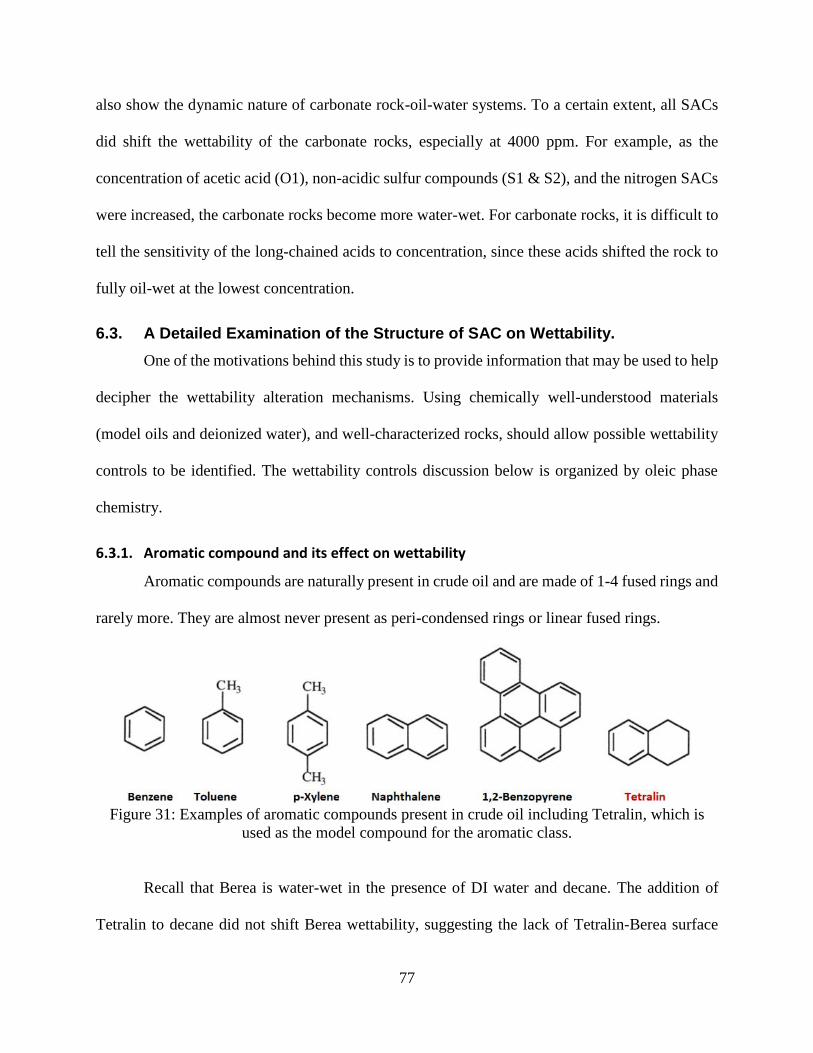
77
also show the dynamic nature of carbonate rock-oil-water systems. To a certain extent, all SACs
did shift the wettability of the carbonate rocks, especially at 4000 ppm. For example, as the
concentration of acetic acid (O1), non-acidic sulfur compounds (S1 & S2), and the nitrogen SACs
were increased, the carbonate rocks become more water-wet. For carbonate rocks, it is difficult to
tell the sensitivity of the long-chained acids to concentration, since these acids shifted the rock to
fully oil-wet at the lowest concentration.
6.3. A Detailed Examination of the Structure of SAC on Wettability.
One of the motivations behind this study is to provide information that may be used to help
decipher the wettability alteration mechanisms. Using chemically well-understood materials
(model oils and deionized water), and well-characterized rocks, should allow possible wettability
controls to be identified. The wettability controls discussion below is organized by oleic phase
chemistry.
6.3.1. Aromatic compound and its effect on wettability
Aromatic compounds are naturally present in crude oil and are made of 1-4 fused rings and
rarely more. They are almost never present as peri-condensed rings or linear fused rings.
Figure 31: Examples of aromatic compounds present in crude oil including Tetralin, which is
used as the model compound for the aromatic class.
Recall that Berea is water-wet in the presence of DI water and decane. The addition of
Tetralin to decane did not shift Berea wettability, suggesting the lack of Tetralin-Berea surface

78
interactions. This may be because Tetralin only has a dipole moment just like decane. On the other
hand, Tetralin apparently slightly shifted the wettability of the three carbonate rocks towards
water-wet, especially at 4000 ppm. Recall that baseline wettability for carbonates is oil-wet. The
presence of Tetralin in decane, especially at higher concentrations, apparently disrupts the weak
interactions between decane and the three carbonate rocks thus shifting wettability towards water-
wet. Tetralin slightly shifts the wettability of dolomite at all three concentrations but shows no
change with concentration.
Figure 32: Effect of Tetralin on wettability in the presence of DI water at 70°C.
6.3.2. Sulfur SAC and its effect on wettability
Sulfur in crude oils is mainly present in the form of organosulfur compounds. Hydrogen
sulfide is the only important inorganic sulfur compound found in crude oil. Organosulfur
compounds can either be classified as acidic or non-acidic. Examples of acid and non-acidic SAC
are shown in Figure 33. Figure 34 illustrates the structure of the three sulfur SACs selected for this
project; two were non-acidic and one was acidic.

79
Figure 33: Examples of acid and non-acidic sulfur compounds.
Figure 34: Structure of sulfur compounds used as sulfur SAC model compound.
Sulfur SACs did not alter the wettability of Berea. The non-acidic sulfur SACs slightly
shifted the wettability of chalk, dolomite, and limestone towards water-wet, especially at higher
concentrations. This similar trend was also observed when Tetralin (aromatic compound) was
tested. Both non-acid SACs and Tetralin have dipole moments caused by: carbon-sulfur bonds in
the case of non-acidic SACs, and carbon-carbon bonds in the case of Tetralin. I hypothesize that
even though these dipole moments are slight, at higher concentrations of the SAC, their polarity is
enough to disrupt the weak polar interactions of decane and the carbonate rock.
The opposite was observed for the acidic sulfur SAC 1-tetradecanethiol that slightly shifted
the wettability of the carbonate rocks towards oil-wet. This behavior is similar to what was
observed for the long-chained oxygen SAC. Deprotonated thiol groups are hypothesized to
coordinate to positively charged carbonate surface groups to increase oil wetness by the reactions
below. The shift towards oil-wetness is small because thiols are only weak acids; hence they are
not fully deprotonated in the test fluids.

80
Calcite_Ca+ + Decane_CH3(CH2)13S− → Decane_CH3(CH2)13SCa_Calcite Equation 22
Dolomite_Ca+ + Decane_CH3(CH2)13S− → Decane_CH3(CH2)13SCa_Dolomite Equation 23
Figure 35: Effect of sulfur SAC on wettability in the presence of DI water at 70°C.
6.3.3. Oxygen SAC and its effect on wettability
Most oxygen compounds found in crude oils are weakly acidic e.g. carboxylic acids,
cresylic acid, phenol, and naphthenic acid. Examples of acidic and non-acidic oxygen SAC are
shown in Figure 36 and Figure 37. Naphthenic acids are mainly cyclopentane and cyclohexane
derivatives having a carboxyalkyl side chain. Since acidic oxygen compounds have long been
identified as wettability altering compounds, three of them were tested; their structures are
illustrated in Figure 38.
Figure 36: Structure of acidic oxygen compounds.

81
Figure 37: Structure of non-acidic oxygen compounds.
Figure 38: Structures of selected acidic oxygen compounds.
The tested oxygen SACs affected wettability differently. The long-chained oxygen SAC
strongly shifted both the Berea and the carbonate rocks towards oil-wet. Similarily, Benner and
Bartell (1941) reported that naphthenic acid displaced water to form a contact angle of 106°
measured through water phase on calcite. Morrow et al. (1973) found that octanoic acid (0.1 molar
in decane) gave a contact angle of as high as 145° on dolomite. We proposed electrostatic
interaction responsible for the oil-wet shift for carbonates is indicated below where myristic acid
and naphthenic acids are represented as RCOOH. Organic acids are hypothesized to give a stronger
oil-wet shift than acidic sulfur SAC because they are stronger acids hence are more deprotonated
under the experimental conditions.
Calcite_Ca+ + Decane_RCOO− → Decane_RCOOCa_Calcite Equation 24
Dolomite_Ca+ + Decane_RCOO− → Decane_RCOOCa_Dolomite Equation 25
In a flotation study by Fuerstenau and Miller (1967), they proposed a similar electrostatic reaction
as Equation 5 and 6 between the fatty acids and calcite as follows. solid CaCO3 +
2RCOO− → solid Ca(RCOO)2
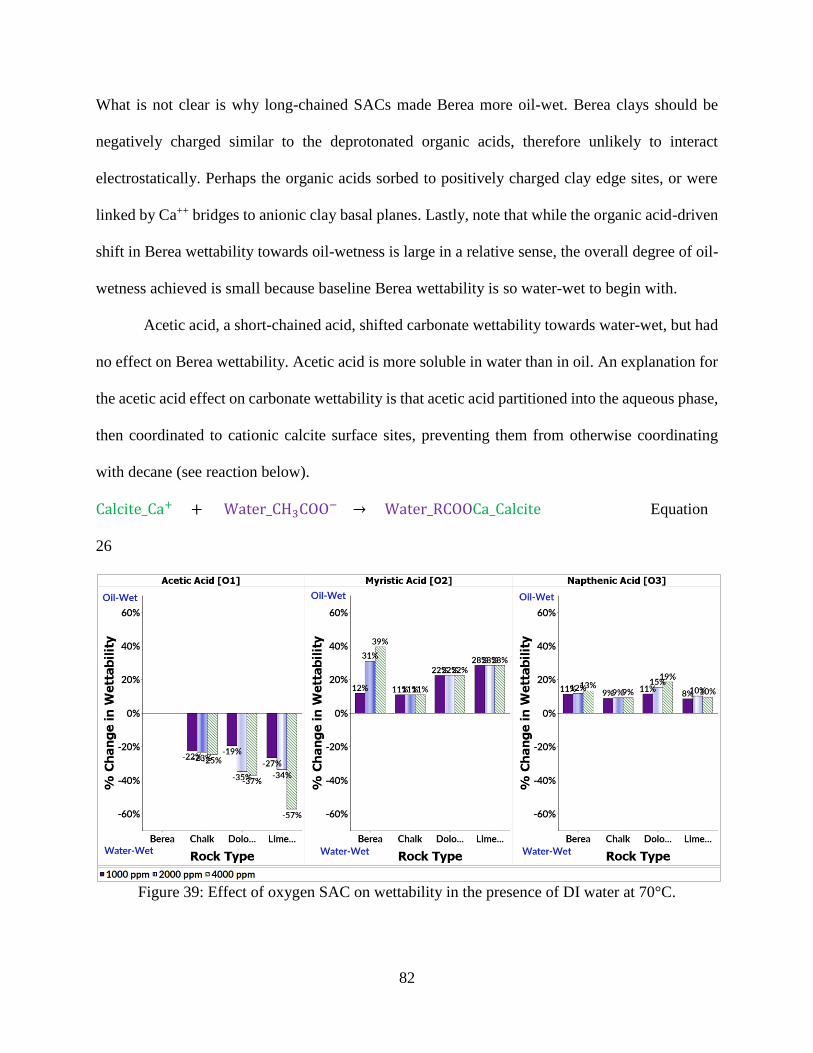
82
What is not clear is why long-chained SACs made Berea more oil-wet. Berea clays should be
negatively charged similar to the deprotonated organic acids, therefore unlikely to interact
electrostatically. Perhaps the organic acids sorbed to positively charged clay edge sites, or were
linked by Ca++ bridges to anionic clay basal planes. Lastly, note that while the organic acid-driven
shift in Berea wettability towards oil-wetness is large in a relative sense, the overall degree of oil-
wetness achieved is small because baseline Berea wettability is so water-wet to begin with.
Acetic acid, a short-chained acid, shifted carbonate wettability towards water-wet, but had
no effect on Berea wettability. Acetic acid is more soluble in water than in oil. An explanation for
the acetic acid effect on carbonate wettability is that acetic acid partitioned into the aqueous phase,
then coordinated to cationic calcite surface sites, preventing them from otherwise coordinating
with decane (see reaction below).
Calcite_Ca+ + Water_CH3COO− → Water_RCOOCa_Calcite Equation
26
Figure 39: Effect of oxygen SAC on wettability in the presence of DI water at 70°C.

83
6.3.4. Nitrogen SAC and its effect on wettability
Nitrogen compounds are subdivided into two categories: (1) pyridinic forms that are
considered basic nitrogen compounds, and (2) pyrrolic forms which are known as neutral, or non-
basic, nitrogen compounds (Robbins and Hsu, 1999). The nitrogen content in most crude oils is
low and does not exceed 0.1 wt. %. In some heavy crudes, however, the nitrogen content may
reach up to 0.9 wt. % (Matar and Hatch 2001). Nitrogen compounds are more thermally stable
than sulfur compounds and accordingly, are concentrated in heavier petroleum fractions and
residuals.
Figure 40: Examples of basic nitrogen SAC present in crude oil including pyridine and quinoline
which are used as model compounds for the basic nitrogen class.
Figure 41: Examples of non-basic nitrogen SAC present in crude oil including carbazole, which
is used as the model compound for the neutral nitrogen class.
The three nitrogen SACs tested did not alter Berea wettability, but shifted carbonate
wettability towards water-wet. Carbazole, the non-basic nitrogen SAC, had the biggest effect on
wettability. The lack of a wettability shift of the nitrogen bases when contacting Berea is likely
due to the fact that, at the pH of the Berea experiments (pH ~ 7), quinoline and pyridine will largely
be uncharged and unlikely to interact electrostatically with charged Berea clay surfaces, since
quinoline and pyridine pKa’s are respectively, 4.9 and 5.2. The calcite experiments likely had an
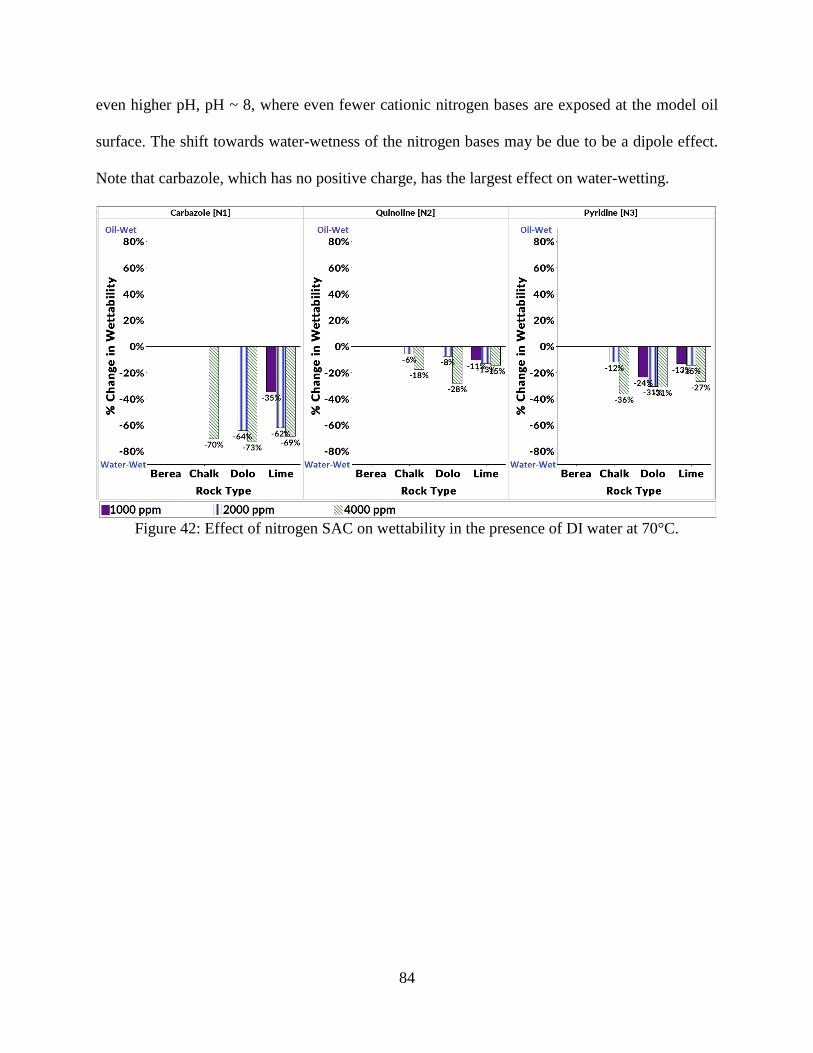
84
even higher pH, pH ~ 8, where even fewer cationic nitrogen bases are exposed at the model oil
surface. The shift towards water-wetness of the nitrogen bases may be due to be a dipole effect.
Note that carbazole, which has no positive charge, has the largest effect on water-wetting.
Figure 42: Effect of nitrogen SAC on wettability in the presence of DI water at 70°C.

85
CHAPTER 7. EFFECTS OF BRINE SALINITY, TEMPERATURE, AND
SURFACE ACTIVE COMPOUNDS ON WETTABILITY
Brine chemistry has been shown to experimentally affect the stability of water films and
the sorption of organic oil components on mineral surfaces (Tang and Morrow, 1999; Hiorth et al.,
2001; Winoto et al., 2012). This can be attributed to its ability to change the charge on the rock
surface and affect the rock wettability, which could lead to increase/decrease in oil recovery. In
certain cases, lowering of brine salinity has been found to enhance oil production (Tang and
Morrow, 1999; Lager et al., 2006; Zhang et al., 2006). Subsequently, temperature has been found
to play a significant role in determining wettability. Rao (1999) showed that in most cases,
sandstone reservoirs become more oil-wet with increasing temperature, while most of the
carbonate reservoirs become more water-wet. This study examines the effect of brine salinity and
temperature on the wettability of sandstone and carbonate rocks. Four brine salinities (0, 1000
ppm, 10,000 ppm, 100,000 ppm (Table 4)) were tested at 25°C, 70°C, and 110°C.
7.1. Baseline Wetting
Figure 43 shows the fraction of rock mass that is oil-wet in decane. As noted earlier Berea
has little electrostatic interaction with decane because decane has only a weak dipole charge. The
limited interaction is only apparent in water with few ions, i.e. distilled water. In the case of
carbonate rocks, the interaction between surface and decane is larger at low salinity, but rapidly
declines as salinity increases from 1,000 ppm and 10,000 ppm. These results suggest that lower
salinity brines promote oil-wet conditions in carbonate rocks. The data also show that the degree
of decane wetting in all three carbonate rock types is not very sensitive to temperature variations.
Examining the data for limestone we see that changing salinity significantly changes wettability
between 1000 and 10,000 ppm, but there is little change as salinity is further increased to 100,000

86
ppm. Increasing salinity does shift the wettability of the rock surface to decane towards water-
wet.
At low salinity, the decane weak dipole moment can interact with the charged carbonate
surfaces. At higher salinity, the ionic species with stronger dipole moments dominate the
interactions with rock surfaces. Dilution of brine salinity increases oil-rock adhesion for decane,
and probably for other alkanes, thus driving the wettability towards oil-wet. However, this effect
is only significant at very low salinities. Therefore, as noted by other researchers the presence of
acids and bases (SAC) are required to observe the low salinity effect since the aliphatic component
appears to have very limited interaction at reservoir salinities.
Figure 43: Experimental measurement of wettability for the four rock types at 0, 1000, 10,000
and 100,000 ppm TDS and three temperatures (25, 70 and 110°C).
7.2. Effect of Salinity and SACs on Sandstone and Carbonate Wettability
The effect of SACs and Tetralin on wettability is examined as a function of brine salinity
(0, 1000 ppm, 10,000 ppm, 100,000 ppm) and temperature (25°C, 70°C, and 110°C). The 10 model

87
oils used are created by adding 2000 ppm of SAC to decane. Again, the percent change in
wettability is calculated by normalizing the wettability result of each SAC and condensate to that
of decane. Results in the region of ±5% are considered within analytical uncertainty and thus
normalized to zero.
7.2.1. Aromatic
Berea is water-wet in the presence of DI water and decane. Tetralin shifted the wettability
of the three carbonate rocks towards water-wet as brine salinity was increased (Figure 44). The
amount of shift was different for each carbonate with dolomite wettability being the most sensitive
to Tetralin.
Figure 44: Experimental measurement of wettability for the four rock types at 0, 1000, 10,000
and 100,000 ppm TDS and three temperatures (25, 70, 110°C) when using tetralin. Values below
5% are not displayed.
The effect of temperature was small with small changes in the impact of Tetralin increasing
at higher temperature. Dolomite wettability showed the most temperature sensitivity. Salinity also
has little effect on the wettability with Tetralin. The largest salinity effect is for dolomite where

88
decreasing salinity increases the oil-wetting. In sum, the weak baseline Tetralin-carbonate
interaction is somewhat enhanced with decreasing salinity shifting wettability to more oil-wet was
greatest for dolomite, less so for chalk and limestone.
7.2.2. Sulfur SAC
The non-acidic sulfur SACs S1 and S2 (Dibenzothiophene and Di-n-butyl sulfide) did not
change the Berea and carbonate wettability from the water-wet baseline as salinity and temperature
increased (Figure 45 and Figure 46). The only exceptions were small shifts toward more water-
wet for chalk with Dibenzothiophene and dolomite with Di-n-butyl sulfide.
Figure 45: Experimental measurement of wettability for the four rock types at 0, 1000, 10,000
and 100,000 ppm TDS and three temperatures (25, 70, 110°C) when using Dibenzothiophene
(S1) SAC. Values below 5% are not displayed.
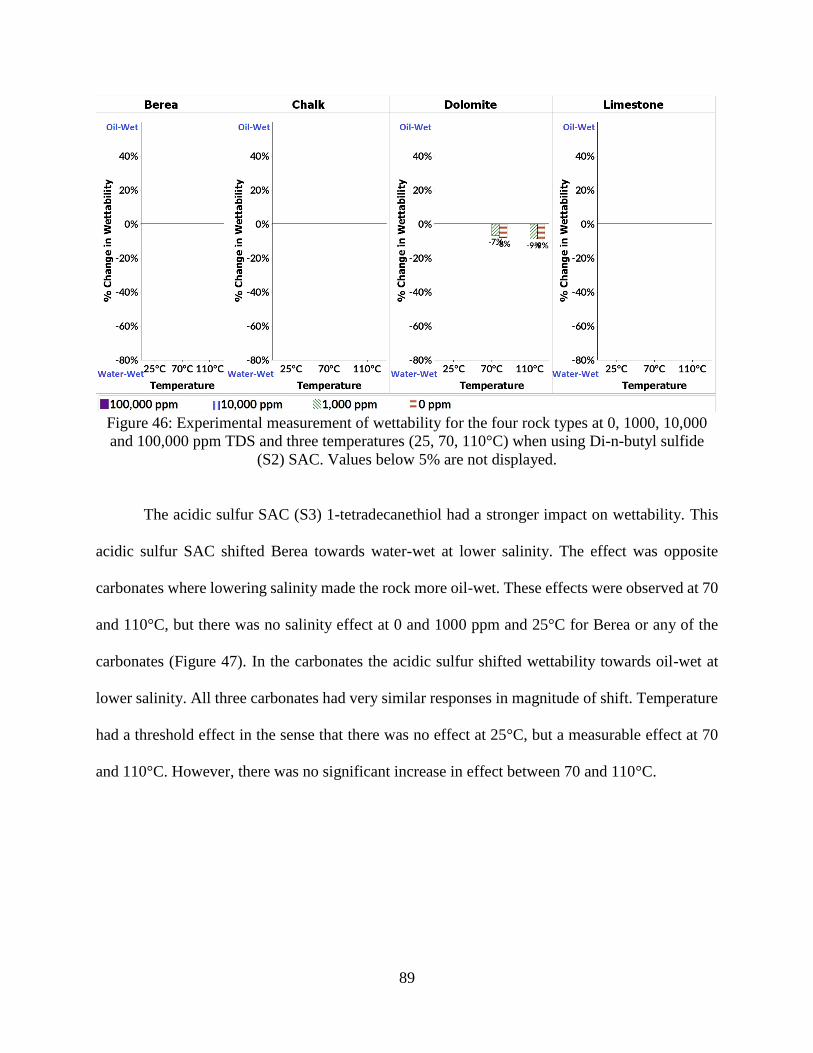
89
Figure 46: Experimental measurement of wettability for the four rock types at 0, 1000, 10,000
and 100,000 ppm TDS and three temperatures (25, 70, 110°C) when using Di-n-butyl sulfide
(S2) SAC. Values below 5% are not displayed.
The acidic sulfur SAC (S3) 1-tetradecanethiol had a stronger impact on wettability. This
acidic sulfur SAC shifted Berea towards water-wet at lower salinity. The effect was opposite
carbonates where lowering salinity made the rock more oil-wet. These effects were observed at 70
and 110°C, but there was no salinity effect at 0 and 1000 ppm and 25°C for Berea or any of the
carbonates (Figure 47). In the carbonates the acidic sulfur shifted wettability towards oil-wet at
lower salinity. All three carbonates had very similar responses in magnitude of shift. Temperature
had a threshold effect in the sense that there was no effect at 25°C, but a measurable effect at 70
and 110°C. However, there was no significant increase in effect between 70 and 110°C.

90
Figure 47: Experimental measurement of wettability for the four rock types at 0, 1000, 10,000
and 100,000 ppm TDS and three temperatures (25, 70, 110°C) when using 1-tetradecanethiol
(S3) SAC. Values below 5% are not displayed.
7.2.3. Oxygen SAC
Acetic acid (O1) had a significant effect on wettability for all the rock types tested. Acetic
acid shifts Berea towards water-wet at 70 and 110°C as the salinity declines. There is no effect at
25°C or in distilled water. Decreasing salinity during waterflood would shift the wettability to
more water-wet. The impact of acetic acid (acetate at experimental pH) is greater in the carbonate
rocks. Carbonate rocks shift from water-wet at higher salinity and to oil-wet at low salinity and
the amount of shift with salinity is similar for all three rocks. There is little to no effect on
wettability at 25°C, but acetate has about the same effect at 70 and 110°C.

91
Figure 48: Experimental measurement of wettability for the four rock types at 0, 1000, 10,000
and 100,000 ppm TDS and three temperatures (25, 70, 110°C) when using acetic acid (O1) SAC.
Values below 5% are not displayed.
The long-chain acids O2 and O3 (myristic acid and naphthenic acid) also have a significant
effect on both Berea and the carbonates. In the sandstone, both acids shift the wettability towards
oil-wet as the salinity declines. The myristic acid effect is greatest at high temperature (110°C),
but only slightly less at 25 and 70°C. The effect is slightly enhanced at higher temperatures (Figure
47). The salinity effect is greater for the carbonates, with the largest shift for limestone, followed
by dolomite and finally chalk. There was some increase of the effect with temperature, but it was
minor. Naphthenic acid has the same effect as myristic on Berea wettability increasing oil-wetting.
However, effect is not sensitive to salinity or temperature. The carbonate rocks show the same
pattern of shifting towards oil-wet with lower salinity. The effect is greatest for chalk, followed by
limestone and dolomite. The data show less change in wettability with salinity at lower
temperature. This may be a result of sulfate coordinating with the positive carbonate surface group,
thus shifting the charge of the rock surface to negative that would repel the negatively charged oil

92
at reservoir salinity. As salinity is lowered the rock surface is more positive and the negatively-
charged oil is attracted.
Figure 49: Experimental measurement of wettability for the four rock types at 0, 1000, 10,000
and 100,000 ppm TDS and three temperatures (25, 70, 110°C) when using myristic acid (O2)
SAC. Values below 5% are not displayed.
Figure 50: Experimental measurement of wettability for the four rock types at 0, 1000, 10,000
and 100,000 ppm TDS and three temperatures (25, 70, 110°C) when using naphthenic acid (O3)
SAC. Values below 5% are not displayed.

93
7.2.4. Nitrogen SAC
Carbazole, the non-basic nitrogen SAC (N1), shifted Berea slightly towards oil-wet with
decreasing salinity and temperature (Figure 51). The carbonates had the opposite pattern with all
three rocks becoming much more water-wet with decreasing brine salinity. There was a small
temperature effect with greater shift with salinity at higher temperature. The amount of shift with
salinity was large for limestone and dolomite, but much smaller for chalk.
Figure 51: Experimental measurement of wettability for the four rock types at 0, 1000, 10,000
and 100,000 ppm TDS and three temperatures (25, 70, 110°C) when using carbazole (N1) SAC.
Values below 5% are not displayed.
The basic nitrogen SAC N2 and N3 (quinoline and pyridine) did not change the wettability
of Berea regardless of salinity and temperature (Figure 52 and Figure 53). They also had little
effect on the carbonate rocks; possibly due to the reduction of dipole interaction as salinity is
increased. The pH of the experiments means most of the basic nitrogen is uncharged. The greatest
effect was in dolomite at 110°C. Lowering salinity significantly increased water wetting. The
effect was greatest at 110°C and less at 70°C. There was no effect at 25°C. The same pattern was
observed for limestone and chalk, but the change with salinity was less.

94
Figure 52: Experimental measurement of wettability for the four rock types at 0, 1000, 10,000
and 100,000 ppm TDS and three temperatures (25, 70, 110°C) when using quinoline (N2) SAC.
Values below 5% are not displayed.
Figure 53: Experimental measurement of wettability for the four rock types at 0, 1000, 10,000
and 100,000 ppm TDS and three temperatures (25, 70, 110°C) when using pyridine (N3) SAC.
Values below 5% are not displayed.
95
CHAPTER 8. DISCUSSION
8.1. MFT
An accurate determination of the reservoir wettability leads to an effective selection of the
most suitable EOR method for the reservoir of interest. Proposed mechanisms responsible for the
increase in oil recovery by ionically modified waterflooding, and to a certain extend processes
such as surfactant flooding and caustic flooding are attributed to wettability alteration. Several
wettability measurement methods have been developed, however, they all have limitations: contact
angle measurements lack natural surface roughness and geometry, and flow-based tests like
Amott-Harvey, USBM and spontaneous imbibition take months and do not give absolute
wettability measurements. In addition, traditional methods for the measurement of wettability are
time-consuming and usually require expensive equipment. This dissertation details the
development of the MFT method and its use in studying the effects of surface active compounds
(SAC) on wettability for variations in rock mineralogy, brine chemistry, and temperature. MFT is
the application of the well-established flotation process that has been routinely used for over a
century in the mining industry to petroleum systems. Flotation has been recognized as a non-
quantitative technique for wettability measurement (Anderson, 1986). The modified flotation
technique is quantitative and uses core material or cuttings, saving valuable cores for traditional
experiments. The technique measures wettability at the grain scale directly and is very sensitive,
fast and easy to use. This work has shown that MFT can serve as a screening tool to estimate the
wettability alteration potential of brines in a short time with high precision. MFT can also
differentiate the impact of potential determining ions and salinity on wettability alteration that is
hard to measure by other means.
MFT is an excellent tool for measuring heterogeneous wettability. None of the standard
wettability measurement methods have the ability to directly measure heterogeneous wettability.

96
MFT accomplishes this by physically separating the hydrophobic (oil-wet) rock grains from the
hydrophilic (water-wet) rock grains. This allows one to further investigate differences between the
oil-wet versus water-wet rock grains. For example, XRD experiments can be performed on the
either fraction to examine differences in mineralogy. The Berea results (Section 0) showed there
was a mineralogical difference between the oil-wet samples that were clay-rich versus the water-
wet samples that were quartz-rich. Heterogeneous wettability in a reservoir is typically attributed
to variations in the rock properties such as: cementation, surface area, etc. MFT allows further
investigation of the differences in the rock properties of the oil-wet versus the water-wet fraction
on the grain scale.
Compared to other standard wettability measurement methods, MFT has the added
advantage of directly examining the rock-fluid interactions between fluids and the rock surface.
Wettability is a geochemical property, and flotation interrogates the rock-fluid interactions at the
grain scale, by directly by looking at the chemical reactions. Contact angles do give direct
wettability measurements, however, only a minimal surface area is examined. Therefore,
numerous experiments would be needed in order to get a more representative wettability of the
rock sample. Amott and USBM do not give absolute wettability measurements since wettability is
estimated from flowing fluid through a core sample. The MFT technique facilitates examination
of the rock-fluid interactions by crushing the rock to small grain sizes (105 to 205 microns), and
thus promoting maximum surface contact with the oil and brine. Therefore wettability
measurements are much faster.
Figure 54 shows the difference between the surface area of a whole core sample and a
crushed core sample. The core property data was acquired from a dynamic 3D pore scale imaging
study where the properties of a Ketton Carbonate core were calculated from a micro-CT scan

97
image and compared to experimental data (Menke et al., 2015). We compare the whole core’s pore
surface area to the total surface area of the grains if the whole core were to be crushed to 105-205
microns grains. As shown, the total surface area of the crushed core is 3.8 to 7.4 times larger than
the pore surface area of the whole core. Therefore, a wettability result by MFT (using the crushed
core sample) would be a product of the fluids interacting with 3.8 to 7.4 times more rock surface
area, than an Amott/USBM method using the whole core.
Figure 54: (a) Pore surface network representation of Ketton carbonate extract from micro-CT
images (Menke et al., 2015) and (b) its given properties. (c) gives the calculated surface area
values of the core if it was crushed to the given grain size distribution and the ratio of the total
surface area of crushed core versus pore surface area of the whole core.
8.1.1. MFT Limitations
Similar to the standard wettability measurement methods, MFT cannot determine the exact
wettability of an entire oil field with a single measurement. However, due to the ease in conducting
numerous experiments at once, MFT can help construct a clearer picture of the reservoir wettability
faster, provided with reservoir material from different parts of the reservoir and field. MFT cannot
simulate reservoir pressure conditions which can play a role in controlling the formation water pH
which can have an effect on wettability.
The purpose of this project was to examine the impact of SACs on reservoir sandstone and
carbonate rocks. To accomplish this task, outcrop rocks were used instead of the pure minerals.

98
Similar to reservoir rocks, outcrop rocks are natural and contain several minerals. Unlike reservoir
rocks, outcrop rocks are typically clean and do not contain crude oil and other contaminants that
arise from coring and plugging. The use of outcrop material eliminated the need for core cleaning
process which is complex and can introduce artifacts. All MFT experiments were made in a
narrow range of pH which is not representative of the reservoir pH. This project recommends
future experiments to be conducted in the reservoir pH range where the impact of SACs can be
studied at reservoir conditions. There are analytical uncertainties up to +/-5 as shown by the raw
data section in Appendix C. Results in the region of ±5% are considered as analytical uncertainty
and thus normalized to zero.
8.2. Effects of Surface Active Components on Wettability
In the last 2 decades, the level of investigation in the optimization of injected brine
chemistry (e.g. low salinity flooding, smart waterflood, etc.) has drastically increased (Morrow
and Buckley, 2011). This form of EOR changes the surface properties of the reservoir rock,
favorably altering wettability and subsequently increasing oil recovery. However, this EOR
method has not succeeded in improving oil recovery in certain reservoirs (Boussour et al., 2009;
Cissokho et al., 2009; Thyne & Gamage, 2011; Al-Shalabi et al., 2014). This has led to further
studies on understanding the chemical controls that govern wettability. This includes developing
a good understanding of the components of reservoir rock, brine, and crude oil that play a role in
intermolecular interactions. With this understanding, an effective formulation of injected water
chemistry that favorably alters wettability and thus increases oil recovery can be customized for
the reservoir of interest. This project placed focus on understanding the influence of crude oil’s
surface active compounds (SAC) on the rock-oil-brine wettability.
In wettability studies, crude oil is typically characterized by its total acid number (TAN),
total base number (TBN), and asphaltene content (Thomas, 1993; Dubey & Doe, 1993; Buckley,
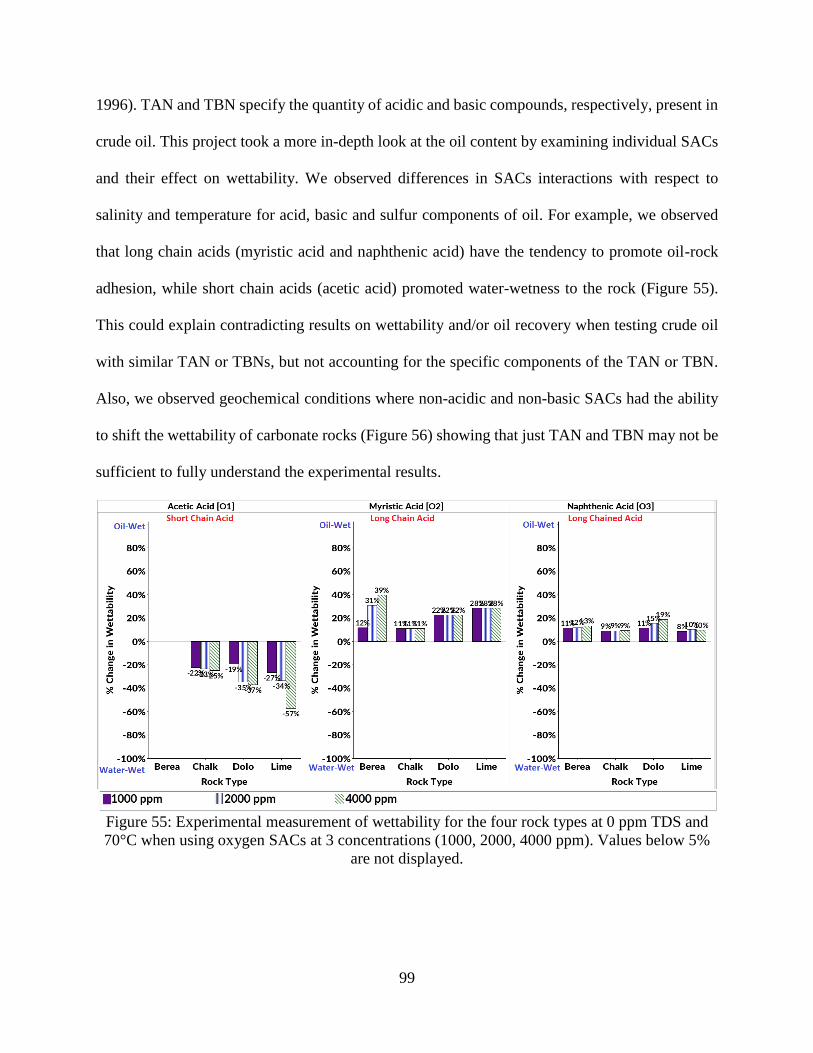
99
1996). TAN and TBN specify the quantity of acidic and basic compounds, respectively, present in
crude oil. This project took a more in-depth look at the oil content by examining individual SACs
and their effect on wettability. We observed differences in SACs interactions with respect to
salinity and temperature for acid, basic and sulfur components of oil. For example, we observed
that long chain acids (myristic acid and naphthenic acid) have the tendency to promote oil-rock
adhesion, while short chain acids (acetic acid) promoted water-wetness to the rock (Figure 55).
This could explain contradicting results on wettability and/or oil recovery when testing crude oil
with similar TAN or TBNs, but not accounting for the specific components of the TAN or TBN.
Also, we observed geochemical conditions where non-acidic and non-basic SACs had the ability
to shift the wettability of carbonate rocks (Figure 56) showing that just TAN and TBN may not be
sufficient to fully understand the experimental results.
Figure 55: Experimental measurement of wettability for the four rock types at 0 ppm TDS and
70°C when using oxygen SACs at 3 concentrations (1000, 2000, 4000 ppm). Values below 5%
are not displayed.

100
Figure 56: Experimental measurement of wettability for the four rock types at 0 ppm TDS and
70°C when using non-basic and non-acidic SACs. Values below 5% are not displayed.
Therefore, this work concludes that TAN/TBN values on their own are not sufficient to
reliably predict the nature of wettability. These values only give a measure of the amount of
acid/base in a sample and not the specific quantities of acidic/basic compounds or their affinity to
either adhere or repel from the rock. In addition, non-acidic and non-basic SACs with the ability
to shift wettability are not accounted for. This observation has also been made in corrosion
chemistry where numerous groups have reported that TAN/TBN values cannot be relied upon to
predict corrosion (Kane et al., 1998; Babaian-Kibala, et al., 1999; Ayello et al., 2010). This is
because it is possible to have two oils with the same TAN values, but one has high levels of
corrosive acids (e.g. naphthenic acids) while the other has much lower levels of the same corrosive
acids. Therefore, to accurately characterize crude oils and capture relevant information needed to
reliably predict wettability, we recommend crude oil testing that captures the major SACs present
in the crude oil and their respective quantities. With this information, a comprehensive study can
be conducted to link SACs to their ability to either promote or depress oil-rock adhesion under
101
different geochemical conditions. This approach would further the effort of building accurate
wettability prediction models by providing more accurate information on wetting parameters of
crude oil.
The pH of the experiments is a critical factor in interpreting and applying the results. As
discussed earlier, wettability is the result of electrostatic interactions between the oil and rock
surface. The MFT experimental solutions had final pH values between 7 and 8, while reservoir pH
is typically 5 to 6. The polar components present in the oil phase are ionized depending on the pH
value. The ionization of basic material results in positively charged crude oil components; while
the ionization of acidic material results in negatively charged crude oil components (Cuiec, 1975).
8.2.1. Sandstone
Similar to what has been published (Anderson, 1986), Berea was generally found to be
water-wet in this study (Figure 26). The SACs that had a significant effect on Berea’s wettability
as salinity and temperature were varied are: acetic acid (O1), myristic acid (O2), naphthenic acids
(O3), 1-Tetradecanethiol (S3), and carbazole (N1).
The acid SAC’s will have a negative charge at experimental pH and should be able to
strongly interact with rock surfaces. Of the SACs tested on Berea, only the long-chained acids
promoted oil-rock adhesion, which decreased as salinity was increased (Figure 57). On the other
hand, the short-chained acid tested, slightly shifted Berea towards water-wet with increasing
salinity and temperature (Figure 57). A clear distinction observed was that the long-chained acids
promoted oil-wetness as the short-chained acids either promoted water-wetness or had no effect
on the rock wettability. Therefore, considering the parameters tested, long-chained acids are the
most important in shifting the wettability of Berea and by extrapolation, other sandstones. Multiple
groups have reported that the wettability of sandstone changed to more oil-wet conditions at higher

102
acid numbers (Skauge et al., 1999; Shabib-Asl et al., 2015). Based on the results of this project, I
would hypothesize that the significant amounts of the acids present in their crude oil were long-
chained acids with a strong affinity to adhere to the sandstone rock surface.
Figure 57: Experimental measurement of wettability for Berea at 0, 1000, 10,000 and 100,000
ppm TDS and three temperatures (25, 70, 110°C) when using oxygen SACs. Values below 5%
are not displayed.
Skauge et al., (1999) and Shabib-Asl et al., (2015) observed that crude oils with high base
numbers promoted water-wet conditions. In this study, we examined the effect of both basic and
non-basic nitrogen SACs. The Berea samples examined were initially water-wet, and with the
introduction of nitrogen SACs the wettability remained water-wet (Figure 27). Changes in salinity
are not observed to have any effects on the wettability of Berea in the presence of the base nitrogen
SACs. However, the non-basic nitrogen SAC did shift the wettability of Berea towards water-
wetness as salinity was increased (Figure 58). It appears that temperature was not a significant
parameter in the relationship between the basic SACs and Berea. In interpreting this data, we have
to consider that the nitrogen bases are neutral species at the experimental pH, and have dipole
moments rather than charge. This may account for the apparent lack of effect on wettability in the

103
data. The non-basic nitrogen SAC did have an effect that is greater with higher salinity and
temperature. This SAC is uncharged and would not contribute to TBN, yet has an effect on
wettability.
Figure 58: Experimental measurement of wettability for Berea at 0, 1000, 10,000 and 100,000
ppm TDS and three temperatures (25, 70, 110°C) when using nitrogen SACs. Values below 5%
are not displayed.
All in all, we observe that at the geochemical conditions tested, oxygen SACs play a more
significant role in shifting the wettability of Berea than the other SACs. To have a better
understanding of how these SACs would shift wettability in a typical reservoir, we recommend
repeating these experiments using reservoir pH conditions and examining the impact of the basic
SACs.
8.2.2. Carbonates
The three carbonates examined in this project were found to be predominantly oil-wet
(Figure 26), the same as other authors (Treiber et al., 1972; Chilingar & Yen, 1983). The SACs
that had a significant effect on the carbonates’ wettability as salinity and temperature were varied

104
are: tetralin, acetic acid (O1), myristic acid (O2), naphthenic acids (O3), 1-Tetradecanethiol (S3),
carbazole (N1), quinoline (N2), and pyridine (N3).
For the most part, the three carbonates examined displayed similar trends in wettability
change as a function of SAC type, salinity, and temperature. However, the degree of oil-adhesion
due to brine salinity, SAC, and/or temperature varied from one carbonate rock to another. Figure
59 and Figure 60 illustrate the effect of two SACs on the wettability of chalk and limestone,
respectively.
Figure 59: Experimental measurement of wettability for chalk and limestone at 0, 1000, 10,000
and 100,000 ppm TDS and three temperatures (25, 70, 110°C) when using acetic acid SAC.
Values below 5% are not displayed.
As shown, the wettability trend produced by the two SACs is similar between the carbonate
rocks. However, there are variations in the degree at which each SAC impacts the wettability of
the two rocks. For example, acetic acid shifted the wettability of both carbonate rocks in a similar
fashion and degree (Figure 59). Carbazole slightly shifted the wettability of chalk towards water-
wetness at 1000 ppm and 10,000 ppm brine salinities and at the higher temperatures (70°C and

105
110°C). However, carbazole significantly shifted the wettability of limestone at 0 ppm, 1000 ppm,
and 10,000 ppm for the three temperatures examined (Figure 60). All in all, we conclude that care
must be taken when generalizing the wettability behavior of carbonate, sandstone, or shale rocks.
Figure 60: Experimental measurement of wettability for chalk and limestone at 0, 1000, 10,000
and 100,000 ppm TDS and three temperatures (25, 70, 110°C) when using carbazole SAC.
Values below 5% are not displayed.
In this work, we observed both basic and non-basic nitrogen SACs playing a major role in
carbonate wetting, by increasing the water-wetness of the carbonate rocks, especially at higher
concentrations. Puntervold et al. (2007) made a similar observation with natural bases, where she
observed an increase in water-wetness as the basic material was increased.

106
Figure 61: Experimental measurement of wettability for the carbonate rocks at 0, 2000, 4000
ppm of nitrogen SACs and 70°C. Values below 5% are not displayed.
Morrow et al. (1973) reported hydrocarbon containing sulfur SACs did not induce oil
adhesion in either quartz or dolomite surfaces. Similarly, we found non-acidic sulfur compounds
S1 and S2 did not induce oil adhesion in sandstone, and slightly shifted the wettability of the
carbonate rocks towards water-wetness (Figure 35, Figure 45, Figure 46). On the other hand, we
observed an opposite effect with long-chained oxygen SACs and acidic sulfur SAC; both promoted
oil-rock adhesion (Figure 62). This effect was attributed to the bonding between the negatively
charged acids (RCOO-) and the positively charged sites on carbonate surfaces. Different groups
have made similar observations and thus concluded that acids/oxygen SACs can play a significant
role in the wetting of carbonates (Morrow et al., 1973; Speight, 1999, Standnes and Austad 2000a,
Fathi et al., 2011).

107
Figure 62: Experimental measurement of wettability for chalk at 0, 1000, 10,000 and 100,000
ppm TDS and three temperatures (25, 70, 110°C) when using long-chained oxygen SACs and
acidic sulfur acidic SAC. Values below 5% are not displayed.
Puntervold et al. (2007) suggested that an acid-base complex could be formed in the crude
oil that to an extent made the acidic material less active towards the carbonate surface. Also,
reservoir temperature has been found to decrease the acid number of crude oil due to the
decarboxylation process at high temperatures (Shomoyama & Johns, 1972). Therefore, with these
observations, one can hypothesize that the nitrogen SACs have more influence towards
determining wettability than the oxygen SACs. This study found that the oxygen SACs play a
major role in the wetting of carbonate rocks. However, only one of the three nitrogen SAC had a
significant effect. This is assumed to be due to the lack of charge at experimental pH. To determine
which of the two SAC groups has a larger influence on wettability, a systematic study is needed
to examine the effects of combining long-chained oxygen SAC (acids) that promote oil-rock
adhesion with nitrogen SAC (base) that promote water-wetness at reservoir pH values. This

108
recommended study would highlight the synergetic effects of the two groups, but more
importantly, help identify the key SACs that either promote or depress oil-rock adhesion.
The effect of four brine salinities (0 ppm, 1,000 ppm, 10,000 ppm, and 100,000 ppm) on
the wettability of the carbonate and sandstone rocks was examined. Brine salinity was found to
play a major role in the wettability of the carbonate rocks. With decreasing brine salinity, nitrogen
SACs and the short-chained oxygen SAC shifted the wettability of the carbonate rocks towards
water-wet conditions (Figure 63). On the other hand, long-chained acids SACs, acidic sulfur SACs,
and aromatic compound shifted the wettability of carbonates towards oil-wet conditions as salinity
declined (Figure 64, Figure 65). The degree of wettability alteration varied for each carbonate.
Figure 63: Experimental measurement of wettability for dolomite at 0, 1000, 10,000 and 100,000
ppm TDS and three temperatures (25, 70, 110°C) when using acetic acid SAC and nitrogen
SACs. Values below 5% are not displayed.

109
Figure 64: Experimental measurement of wettability for dolomite at 0, 1000, 10,000 and 100,000
ppm TDS and three temperatures (25, 70, 110°C) when using long-chained oxygen SACs and
acidic sulfur acidic SAC. Values below 5% are not displayed.
Figure 65: Experimental measurement of wettability for the carbonate rocks at 0, 1000, 10,000
and 100,000 ppm TDS and three temperatures (25, 70, 110°C) when using tetralin. Values below
5% are not displayed.

110
These results give us a detailed understanding on how different SACs shift wettability with
respect to brine salinity. Various published studies (Zhang and Austad 2006; Alameri et al. 2014)
have reported positive improvement on oil recovery through low salinity waterflooding, and others
(Hamouda et al., 2014; Gandomkar & Rahimpour, 2015) have reported small or negligible effects
on recovery. Typically, the low salinity effect is probed by performing spontaneous imbibition and
coreflooding experiments demonstrating additional oil recovery. The incremental oil released is
typically attributed to wettability alteration of carbonate surfaces. A proposed explanation for the
lack of low salinity effect in some reservoirs has been attributed to the lack of potential determining
ions (e.g. Mg2+, Ca2+, and SO42-) in the injected brine (Austad et al., 2005; Al-Attar et al., 2013).
This study proposes that the lack of low salinity effect may dependent on the crude oil having high
levels SACs with minimum sensitivity to salinity change, and/or low levels of SACs with high
sensitivity to salinity.
Temperature was found to play a role in the wettability of the carbonate rocks. Three
temperatures were examined in this project, 25°C, 70°C, and 110°C. A significant difference in
the wettability of the rocks was noticed between the low temperature (25°C) and higher
temperatures (70°C, and 110°C) as shown in Figure 66. Of the SACs successful in shifting
wettability, only a few were successful at 25°C. The degree of the wettability alteration was greater
at the higher temperatures, but the difference in wettability between 70°C and 110°C was observed
to be small.
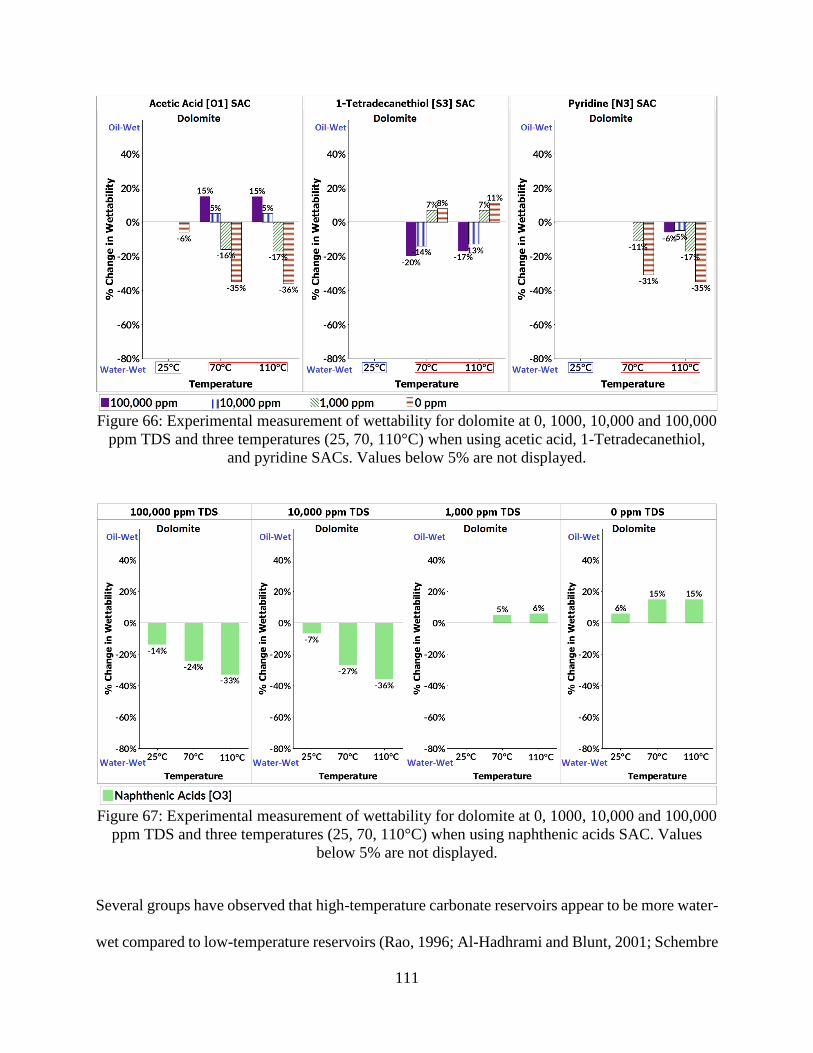
111
Figure 66: Experimental measurement of wettability for dolomite at 0, 1000, 10,000 and 100,000
ppm TDS and three temperatures (25, 70, 110°C) when using acetic acid, 1-Tetradecanethiol,
and pyridine SACs. Values below 5% are not displayed.
Figure 67: Experimental measurement of wettability for dolomite at 0, 1000, 10,000 and 100,000
ppm TDS and three temperatures (25, 70, 110°C) when using naphthenic acids SAC. Values
below 5% are not displayed.
Several groups have observed that high-temperature carbonate reservoirs appear to be more water-
wet compared to low-temperature reservoirs (Rao, 1996; Al-Hadhrami and Blunt, 2001; Schembre

112
et al., 2006; Hamouda and Karoussi, 2008). However, in this study we found that while
temperature accentuated the wettability effect of the SAC of interest on the rock, the effect toward
either oil-wet (low salinities) or water-wet (higher salinities) depends more on salinity.
8.2.3. SACs Overview
This study has been successful in highlighting the role of SACs in shifting the wettability
of Berea, chalk, dolomite, and limestone, as brine salinity and temperature are varied. We found
that the overall effect toward either oil-wet or water-wet conditions depended more on brine
salinity than temperature. This section focuses on SACs that shifted the wettability of the four
rocks as the brine salinity was decreased from 100,000 to 10,000 ppm at 70 and 110°C. These
conditions were selected because they are more representative of reservoir conditions. Graphs in
this section display the wettability alteration values greater than 10% due to salinity change. These
screening criteria show very few SACs were significant in controlling wettability as shown by
Figure 68 to Figure 71. As shown in Figure 68, the SACs tested in this study did not significantly
shift the wettability of Berea at these conditions. Of the SACs examined, oxygen SACs shifted the
wettability of the carbonate rocks at varying degrees as brine salinity was decreased from 100,000
ppm to 10,000 ppm. At these conditions, chalk was found to be more sensitive to brine salinity
variation as dolomite was the least sensitive. This information can be used in conjunction with
TAN/TBN values to predict wettability.

113
Figure 68: Experimental measurement of the SACs ability to change wettability of berea as
salinity is decreased from 100,000 to 10,000 ppm TDS at 70 and 110°C. Changes in wettability
less than +/- 10% as salinity is decreased are not displayed.
Figure 69: Experimental measurement of the SACs ability to change wettability of chalk as
salinity is decreased from 100,000 to 10,000 ppm TDS at 70 and 110°C. Changes in wettability
less than +/- 10% as salinity is decreased are not displayed.

114
Figure 70: Experimental measurement of the SACs ability to change wettability of dolomite as
salinity is decreased from 100,000 to 10,000 ppm TDS at 70 and 110°C. Changes in wettability
less than +/- 10% as salinity is decreased are not displayed.
Figure 71: Experimental measurement of the SACs ability to change wettability of limestone as
salinity is decreased from 100,000 to 10,000 ppm TDS at 70 and 110°C. Changes in wettability
less than +/- 10% as salinity is decreased are not displayed.

115
8.3. Wettability Revisited
Wettability is determined by the balance of surface forces between the interaction of oil
and water with the surface of the rock. Depending on the specific interactions, the wettability of a
system can range from strongly water-wet to strongly oil-wet. Degrees of wetting apply along the
wettability continuum, and as shown in this study, the oil chemistry, water chemistry, rock
morphology and mineralogy, and temperature govern where in the continuum the rock wettability
lies. This study has prompted us to evaluate our understanding of wettability, and in this section,
we share our thoughts, hypothesis, and conclusions regarding the subject.
8.3.1. Traditional wettability
Wettability has traditionally been classified into three categories: water-wet, neutral-wet,
and oil-wet. The three wettability classifications are generally defined by the common wettability
measurement methods, such as flow measurement (Amott and USBM) and contact angle methods.
The flow measurement methods produce results (oil-wet, etc.) equivalent with a specified range
of contact angle values. However, the correlation between these wettability measurements is not
the best. This is probably attributed to the different scales that wettability is measured (Figure 72).
Both the Amott and USBM methods estimate the average wettability of a core by
measuring the imbibition and displacement of oil and water (Anderson, 1986). The size of the core
samples varies from 1 to 1.5 inches in diameter and 2 to 3 inches in length (Haugen, 2016). The
rock is characterized as water-wet when water is preferentially imbibed in the core, which is
assumed to indicate the rock’s preference to the water phase rather than the oil phase. The rock is
considered neutral-wet when neither oil or water are preferentially imbibed, which is assumed to
indicate that equal portions of the rock surface have a preference for water or oil. Lastly, the rock
is characterized as oil-wet when oil is preferentially imbibed into the core.

116
The contact angle method makes a direct wettability measurement of a small, flat, and
polished rock surface that is suspended horizontally and encapsulated by water. The wettability
measurement is based on the average wettability of the grains contacted by the drop of oil placed
on the rock surface. The rock is said to be: water-wet when the contact angle between the rock and
oil is less than 75°, neutral-wet when between 75° to 105°, and oil-wet when greater than 105°.
Figure 72: Different scales that wettability is measured by flow measurements (whole core
scale), contact angles (contact angle core scale) and MFT (grain scale).
For the flow measurement methods, the fluids contact millions of grain surfaces, and an
average wettability is calculated or estimated. This scale of measurement will be referred to as
whole core scale (Figure 72). For contact angles, the drop of oil contacts at least several grains and
an average wettability of those grains forming the polished surface is measured. This scale of
measurement will be referred to as contact angle core scale (Figure 72). By crushing the core, MFT
directly interrogates the rock-fluid interactions at the grain scale by looking at the chemical
reactions. This scale of measurement will be referred to as grain scale (Figure 72). Therefore, if
standard wettability measurement methods generally define wettability classifications, how do the
different scales of measurement influence the definition and understanding of wettability?

117
8.3.2. Wettability: Scale of Measurement
The definitions of homogenous wettability states, water-wet and oil-wet, are consistent
between flow measurements, contact angle, and MFT methods. At a core and grain scale level,
water-wetness describes the preference of the rock to be in contact with water, thus having a film
of water coating the rock grain surfaces. In a porous media, water exists as a continuous phase
throughout the pore network as oil is a discontinuous phase consisting of globules in the larger
pores surrounded by water (Donaldson & Waqi, 2006). On the other hand, when the system is
preferentially oil-wet, the locations of water and oil in the rock are reversed from the water-wet
case. Oil occupies the smaller pores and is in contact with most of the rock grain surfaces, whereas
water resides as globules in the larger pores.
Researchers have also recognized that rocks can have a mixture of water-wet and oil-wet
grains within the sample. Brown and Fatt (1956) proposed that the wettability of reservoir rock be
stated in terms of the fractional internal surface area that is in contact with water or oil, fractional-
wettability. The condition of heterogeneous/fractional wettability is described by terms such as:
mixed wet, speckled, and dalmatian wettability. Mixed-wettability was introduced by Salathiel
(1973) where he proposed that oil-wet surfaces form continuous paths through the larger pores, as
the smaller pores remain water-wet and contain no oil. Therefore, since all the oil is contained in
the larger pores, a small but finite oil permeability exists down to very low oil saturation. Salathiel
proposed that this condition could occur during the original accumulation of oil in a reservoir if
natural oil containing SACs displace connate water from the larger pores. Oil would not enter the
smaller pores where the threshold capillary pressure for displacement of water is too large.
Speckled/spotted/dalmatian wettability refers to continuous water-wet surface encompassing areas
of discontinuous oil-wet surfaces or vice versa (Morrow et al., 1986; Cuiec, 1991).

118
These forms of heterogeneous wettability refer back to the measurements and apply to
describing wettability at core scale. Both the contact angle and flow measurement methods do not
have the ability to directly measure heterogeneous wettability. Flow methods do observe
spontaneous imbibition of both fluids for mixed-wet rocks. The result (Amott/USBM index)
classifies the rock as neutral wet (Donaldson & Waqi, 2006). MFT can directly measure
heterogeneous wettability of a core, by physically separating the oil-wet rock grains from the
water-wet rock grains. It may also be possible to have heterogeneous wettability at a grain scale
level, where part of the grain is oil-wet, and another is water-wet. A controlled study similar to the
glass beads experiments in section 4.1, could be undertaken where parts of a glass bead surface
can be altered to simulate natural inclusions and variation in surface mineralogy and morphology.
In section 4.1, we established that grains in the surface force dominant range would float and
reside in the oil phase if oil-wet, as the water-wet grains will sink and reside in the water phase. If
both hydrophobic and hydrophilic beads were mixed to create heterogeneous surfaces, we expect
that the fraction of beads that are oil-wet to float and the fraction that is water-wet to sink. As an
extension of this, I hypothesize that if several hydrophobic and hydrophilic beads were clustered
together to form a smooth flat surface, a measured contact angle of the heterogeneous surface
would give an average wettability of the grains. Also, if the hydrophobic and hydrophilic glass
beads were packed in a cylindrical tube to mimic a core, the flow measurement methods would
give an average estimate of the wettability. If equal amounts of hydrophobic and hydrophilic grains
were used, we hypothesize that contact angle and flow measurements would indicate neutral-wet
conditions. However, depending on the arrangement pattern of the hydrophobic and hydrophilic
grains, different patterns of wettability could be formed, e.g. mixed-wet or speckled wettability.
We recommend testing these hypotheses as a way to accurately relate the microscale to macroscale
119
wettability measurements. Since we measure numerous grains in flotation and aggregate the result,
there should be an equivalence with the other macroscale measurements. Individual grains are not
neutral wet. Depending on the geochemical condition present, the grain will show a degree of
preference towards water or oil.
Lastly, we also recommend wettability discussions to include scale in order to provide context.
As more work is done to further this area of research, there needs to be an application of the
wettability knowledge gathered from the grain scale to the core scale, and how it helps us
understand the reservoir scale wettability.
8.3.3. Wettability: Inherent vs. Situational Wettability
Another aspect of wettability established in this study is that it is not an inherent property
of the rock surface to be water-wet or oil-wet. Instead, it is a function of the oil, water, rock, and
temperature. These four parameters create a unique geochemical condition that produces a
wettability state specific to it. Therefore, the wettability of a rock can vary from water-wet to oil-
wet depending on the geochemical condition present. This makes wettability “situational” rather
than an inherent characteristic of the rock.
Figure 73 illustrates four different salinity conditions for two SAC’s. The rock type used
is dolomite and the temperature is 110°C. In the case of acetic acid, we observe that the SAC
shifts the wettability of dolomite from oil-wet to water-water as salinity is decreased. This is an
example of how salinity can influence wettability of a rock. However, if all conditions are kept the
same and the SAC in the model oil chemistry is changed from acetic acid to myristic acid, we
observe an opposite wettability trend as salinity is decreased. This shows how oil chemistry can
influence the wettability of a rock.

120
Figure 73: Experimental measurement of wettability for dolomite at 0, 1000, 10,000 and 100,000
ppm TDS and 110°C when using acetic acid and myristic acid SACs. Values below 5% are not
displayed.
In Figure 74 brine salinity is held constant at 0 ppm and the temperature was varied from 25°C to
110°C. In the case of acetic acid, temperature does make a difference in the degree of wettability
change. However, in the case of myristic acid, the effect of temperature on wettability is much less
or negligible. This shows that temperature has the ability to influence the wettability of a rock.
Figure 74: Experimental measurement of wettability for dolomite at 0 ppm TDS and three
temperatures (25, 70, 110°C) when using acetic acid and myristic acid SACs. Values below 5%
are not displayed.
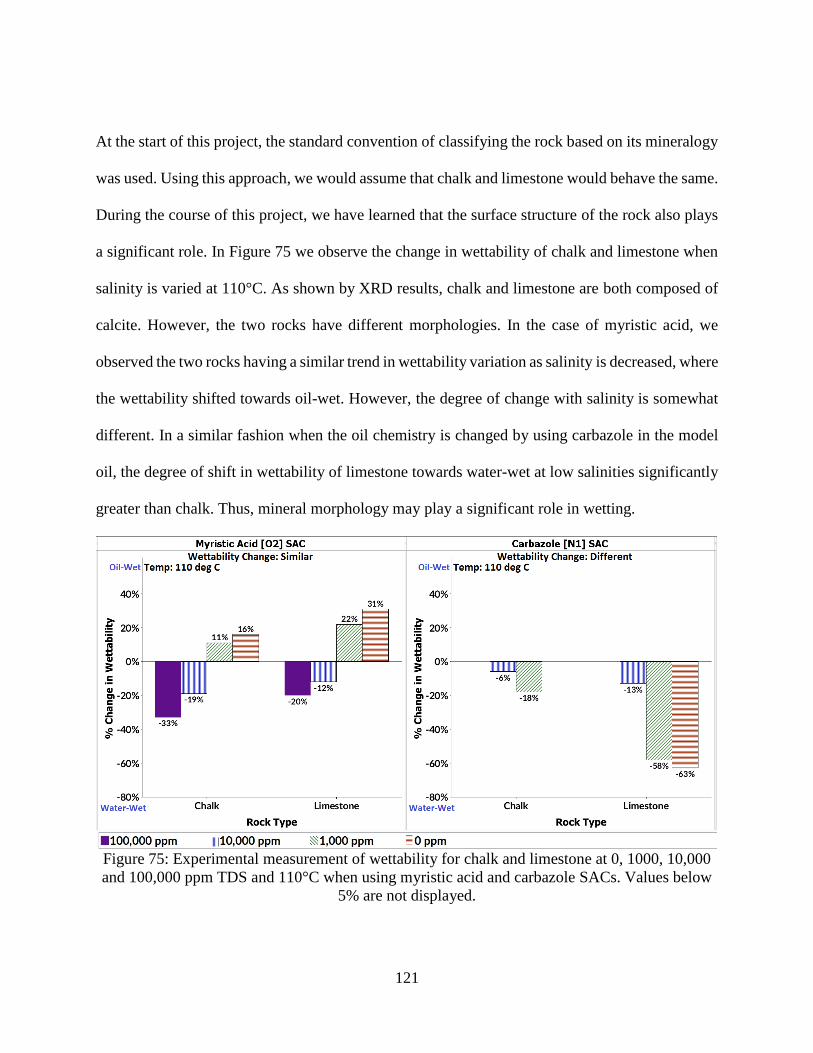
121
At the start of this project, the standard convention of classifying the rock based on its mineralogy
was used. Using this approach, we would assume that chalk and limestone would behave the same.
During the course of this project, we have learned that the surface structure of the rock also plays
a significant role. In Figure 75 we observe the change in wettability of chalk and limestone when
salinity is varied at 110°C. As shown by XRD results, chalk and limestone are both composed of
calcite. However, the two rocks have different morphologies. In the case of myristic acid, we
observed the two rocks having a similar trend in wettability variation as salinity is decreased, where
the wettability shifted towards oil-wet. However, the degree of change with salinity is somewhat
different. In a similar fashion when the oil chemistry is changed by using carbazole in the model
oil, the degree of shift in wettability of limestone towards water-wet at low salinities significantly
greater than chalk. Thus, mineral morphology may play a significant role in wetting.
Figure 75: Experimental measurement of wettability for chalk and limestone at 0, 1000, 10,000
and 100,000 ppm TDS and 110°C when using myristic acid and carbazole SACs. Values below
5% are not displayed.

122
Since MFT physically separates the oil-wet and water-wet rock grains, we recommend
material (rock, oil, and water) analysis of the different fractions. We expect the careful examination
of the rock properties such as composition, morphology and surface area using techniques such as
micro-CT will reveal further insights that can help us better understand rock-fluid interactions and
will help identify additional characteristics that influence wetting.
8.4. Field Application
The two major contributions of this project are: (1) the development of a wettability
measurement technique (MFT) that is fast, reliable, and serves as an effective screening tool; and
(2) a clearer understanding of the role of SAC in altering wettability at different geochemical
conditions. This section explores how these contributions can be applied in the oil and gas industry.
8.4.1. Wettability Studies
8.4.1.1. Current Challenges in Studying Wettability
In petroleum engineering, wetting forces play a crucial role in determining the distribution
and flow of reservoir fluids, and the effectiveness of oil recovery methods. Sophisticated
wellbores, completions systems, and fracture networks can be implemented, however, their
success and failure in achieving high oil recovery is a function of whether the rock’s wettability
(rock-oil-brine interaction) is favorable, thus facilitating the flow of oil to the production well.
Nevertheless, as significant as this parameter is, it has historically been assumed to be inherent
rather than an easily manipulated parameter. This mindset has largely been a result of the following
issues: (1) most petroleum engineers rarely consider wettability in their day to day work mainly
because it is a parameter that is not measured in the field or used directly in most reservoir related
calculations. (2) wettability is indirectly included in flow equations and reservoir simulations
through relative permeability data which is influenced by multiple parameters. (3) lack of direct

123
integration of wettability in fluid flow equations is largely due to the unclear understanding of the
rock-oil-brine interactions. As shown in this project, wettability is influenced by the reservoir rock
mineralogy and morphology, aqueous chemistry, oleic chemistry, and temperature. Each of these
parameters can have many different variations in a specific reservoir thus resulting in a wide-range
of geochemical conditions that can affect wettability. To examine the effects of these geochemical
conditions on wettability, thousands of experiments are required. Unfortunately, standard methods
are limited by the time and expense it takes to run a single experiment (days to weeks). This
significant bottleneck for laboratory experiments has greatly hindered the progress toward better
understanding the nature of wettability. To overcome this barrier, a wettability measurement
technique that was fast, reliable, and would serve as both a screening tool and provide quantitative
results would be needed. This led to the creation of MFT.
8.4.1.2. Wettability Studies using MFT
As of now, MFT and its variations have been used by several groups to study different
aspects of wettability (Mwangi et al. 2013; Haugen et al., 2016; Sohal et al. 2016; Sohal et al.
2017; Fjelde et al., 2017). As shown by these studies, MFT can rapidly determine important
parameters for further studies. Since this tool is fast, reliable, and easy to use, it lends itself to
carrying out extensive systematic wettability studies that can examine the wettability of different
rock types under different geochemical conditions. This can lead to the creation of extensive
wettability libraries/databases that can be used to predict the rock’s wettability, and variations in
wettability as geochemical conditions are modified. More importantly, these wettability
libraries/databases would serve as important platforms in creating accurate and robust wettability
prediction models.

124
In the quest to decipher the mechanism(s) that govern wettability, extensive systematic
studies of well-characterized reservoir material (such as this project) are important. By changing
one parameter at a time, we were able to identify the critical parameters and how their effect on
wettability. The next step would be to postulate and test different theories of the mechanisms that
dictated the shifts in wettability. For example, understanding how neutral compounds are able to
shift wettability, or the differences between the short-chained and long-chained acid effect on
wettability. Significant strides can be made to decipher these mechanisms by coupling the
experimental data with geochemical modeling. Fjelde et al. (2007) used MFT to study the potential
of injected water composition in shifting the wettability of reservoir sandstone rocks to more
water-wet conditions. Their study found that combining flotation experiments with geochemical
simulations was effective in screening the ability for injection water composition to alter
wettability. They concluded that a combination of flotation experiments and geochemical
simulations has the potential to determine whether direct adsorption or cation bridging are the
dominating wetting mechanisms. Their results indicated that cation bridging to be the dominating
wetting mechanism for their rock-oil-water system.
In summary, MFT is not meant to replace but rather complement the standard wettability
measurement methods. MFT studies wettability at a grain scale whereas contact angles and flow
measurement methods study wettability at a macroscale. These techniques working in coordination
and leveraging their strengths would provide an invaluable synergy and insight to the inner
workings of wettability. As a result, this would bring us closer to the ultimate goal of significantly
improving oil recovery hydrocarbon reservoirs.
125
8.4.2. Ionically Modified Waterflooding
This study has shown that the success of ionically modified waterflood is dependent on
knowing the details of oil, brine, rock, and temperature. The brine chemistry, rock mineralogy,
and temperature can be characterized using current technologies. Regarding crude oil, this study
recommends the development of an analytical process to identify and quantify surface active
compounds in crude oils. Extensive characterization of reservoir material would significantly
assist in engineering effective chemistry of the injection water that would optimize the oil
recovery. This would also decrease/eliminate instances where this EOR process would not work.
Due to the ease of measuring the wettability of numerous geochemical conditions using MFT,
many brine chemistries can be tested. MFT can be used as a screening tool to narrow down a few
brine chemistries that can be tested using standard wettability measurement methods and
coreflooding experiments. Sohal et al. (2016) found that MFT can serve as a screening tool to
estimate the wettability alteration potential of brines in a quick time frame and with high
repeatability and is an excellent process to differentiate the impact of potential determining ions
and low salinity on wettability alteration that is hard to measure otherwise. Fjelde et al. (2007)
found that using MFT to screen injection brine composition is much less time consuming than
standard experiments, and only a small amount of rock samples were required. They concluded by
stating that the potential for the most promising injecting water compositions can then be further
evaluated by core flooding experiments, including chemical analyses to study rock-brine
interactions, injectivity, and oil recovery potential.
8.4.3. Surfactant Flooding
MFT can also be used as a tool to select surfactant type and concentration for surfactant
flooding processes. MFT can also help determine the surfactant types and concentrations that
would form emulsions. Surfactants increase oil recovery by lowering the interfacial tension (IFT)

126
between oil and water and also altering wettability to a desirable state (water-wet). Many studies
have been executed to understand how surfactants impact IFT, and the mechanisms involved are
relatively well understood. However, the mechanisms that govern wettability alteration due to
surfactant use are still not well understood. The effect of surfactants on wettability depends on
how much is adsorbed to the rock, and how they are adsorbed. Surfactant adsorption on the rock
and resultant wettability changes are determined mainly by the chemical structure and mix of the
surfactants, surface properties of the rock, oil chemistry, nature of additives (e.g. polymers added),
brine chemistry, and temperature. Rock mineralogy plays a crucial role in determining interactions
between reservoir minerals and surfactants/polymers. Also, some of the rock minerals can be
sparingly soluble causing surfactant precipitation and changes in wettability. Before surfactant
flooding, many parameters must be determined in order to create an optimal surfactant flood. These
parameters are: surfactant type and concentration determination, ideal injection brine chemistry,
etc. This study suggests that the use of MFT as a screening tool to determine the most suitable
parameters for coreflooding experiments to further study the selected parameters.
8.4.4. Core Cleaning Solvent Selection
Appendix B presents a core cleaning solvent analysis that can be used in the selection of
solvent(s) used in the core restoration process. Core material is often cleaned to a strongly water-
wet state, then aged with formation water and reservoir oil to build up the initial conditions that
are representative of reservoir conditions (Shariatpanahi et al., 2012). The aging period is
significant limiting the number of experiments that can be conducted. The time needed for
equilibration to restore the original wetting condition for reservoir core samples is significant.
MFT has the advantage of reducing the required aging time. The common procedure of wettability
restoration is to clean the reservoir core sample to make it strongly water-wet thus mimicking the

127
initial wetting condition before oil migrated into the reservoir (Cuiec, 1975; Anderson, 1986;
Jadhunandan, 1990). Thereafter, oil is injected into the brine saturated core and aged. MFT
eliminates this limitation by crushing the core, thus increasing the surface area of the rock
promoting maximum contact with oil and brine. The aging experiments (section 5.2.3) highlight
that the formation of the organic surface reactions are rapid for decane, condensate, and 4 model
oils were tested in the presence of DI water on Berea, chalk, limestone, and dolomite at 25°, 70°,
and 110°C. MFT results were independent of aging time after 1 day except for the case of Berea
+ Myristic acid that required a period of 2 days. Based on the results of this project we can conclude
that the long (weeks to months) equilibration times during the aging process reported in the
literature are mainly due to the rock structure limiting the rate of contact with all the surfaces.
Even though many studies have been carried out to find the most effective cleaning solvent,
core cleaning remains mostly a trial and error process, where the selection of the best solvents to
be used greatly depends on the experience with the particular rock. Standard wettability
measurement techniques are limited in the time and expense it takes to run a single experiment.
Therefore, an extensive core cleaning solvent selection analysis is impossible. For instance,
toluene followed by methanol is commonly used to remove hydrocarbons including asphaltenes
and adsorbed polar components. As shown in this project, rock mineralogy, brine chemistry, oil
chemistry, and temperature will affect wettability, and thus the effectiveness of the cleaning
solvent. Therefore, we propose MFT can be used to identify an effective cleaning solvent for the
rock of interest with respect to brine, crude oil, and temperature used that minimizes or avoids
alteration of wettability.
Lastly, the results of this study pose an interesting question of whether it is possible to
restore the wettability of the core to its reservoir wettability. The natural flora/fauna/microbes

128
found in the reservoir would be eliminated in the core cleaning process, and it is not possible
restore these components. These organic constituents would contribute to the geochemical
conditions that produce the reservoir wettability.

129
CHAPTER 9. CONCLUSION
The aim of this project was to develop a wettability measurement technique that is
inexpensive, rapid, and reproducible, and to use it to describe the role of oil surface active
compounds (SACs) in determining wettability in carbonate and sandstone reservoirs. This project
details the development, validation, theory, and application of the modified flotation technique
(MFT) for that study. MFT proved to be a successful quantitative technique that can rapidly test
the influence of oil and brine chemistry on wettability on sandstone and carbonate reservoir
material at different temperatures and salinity. The MFT procedure allows us to tackle one of the
fundamental problems of petroleum engineering, which is the link between subsurface chemistry,
wettability, and oil recovery. This novel wettability measurement method is fast, low cost, and
produces not just quantitative wettability measurements but also allows physical separation of oil-
wet and water-wet surfaces for more in-depth study. In addition, it gives us the ability to resolve
the chemical controls over oil adhesion to reservoir minerals. This is a great advance that has the
potential to move the field forward substantially and allow us to precisely tailor waterflood
chemistries for maximal oil recovery.
MFT was used to study the effect of rock mineralogy (Austin chalk, Indiana limestone,
Silurian dolomite, and Berea sandstone), aqueous chemistry (salinity), surface active compounds
(SACs), and temperature. To isolate the effects of individual SACs, this project used model oils
mixtures of pure decane and a single SACs to represent the oleic phase. The main conclusions
drawn from this study were:
In the case of Berea, only the long-chained oxygen acids shifted the wettability by promoting
oil-rock adhesion that increased when the salinity was decreased. Therefore, of the SACs
examined long-chained oxygen SACs were the most influential in shifting the wettability of
Berea.

130
In the case of carbonate rocks, short-chained oxygen SAC, non-acidic sulfur SACs, and
nitrogen SAC’s promoted water-wet conditions as their concentration was increased. On the
other hand, an opposite effect was observed with long-chained oxygen SACs and acidic sulfur
SAC where they promoted oil-rock adhesion. Organic acids gave a stronger oil-wet shift than
acidic sulfur SAC’s because they are stronger acids, hence are more deprotonated under the
experimental conditions. Nitrogen and oxygen SACs had to have the greatest impact on
carbonate wettability.
Carbonates were also found to be more sensitive to salinity than Berea. In the case of carbonate
rocks, as brine salinity was decreased nitrogen SACs and the short-chained oxygen SAC
shifted the wettability of the carbonate rocks towards water-wet conditions. On the other hand,
long-chained acids SACs, acidic sulfur SACs, and aromatics shifted the wettability of
carbonates towards oil-wet conditions. This difference in SACs’ reaction to salinity was
proposed as one of the reasons why low salinity waterflooding is successful in some reservoirs
and not in others. Therefore, this study proposes that the lack of low salinity effect can also be
attributed to a crude oil having high levels of oil-wet promoting SACs with minimum
sensitivity to salinity change, and/or low levels of water-wet promoting SACs. Therefore, for
IOR processes dependent on wettability alteration to be successful, it is important to have a
detailed characterization of the crude oil as well as brine and rock mineralogy. This work
recommends an additional characterization of crude oils where SACs can be identified and
quantified based on their ability to promote oil-wetness or water-wetness.
Temperature was found to play a role in the wettability of the carbonate rocks. A significant
difference in the wettability of the rocks was noticed between the low temperature (25°C) and

131
higher temperatures (70°C, and 110°C). Most of the wettability alteration was at the higher
temperatures and the difference between the 2 higher temperatures was small to negligible.
The two major aspects of wettability established in this study: microscale versus
macroscale wettability, and inherent versus situational wettability. Traditionally, wettability
classifications are generally defined by the common wettability measurement methods. These
methods usually measure wettability at different scales. This has caused some confusion especially
in defining heterogenous wettability, making a lot of the literature confusing. We have found that
scale needs to be accounted for when discussing wettability. On a microscale (grain scale)
wettability is homogenous. On a macroscale, wettability is heterogenous since it an average of all
the grains wettability. MFT measures wettability on a grain scale (microscale) as contact angle and
flow measurements estimate/calculate wettability on a macroscale. Since MFT measures
numerous grains in flotation and aggregate the result, there should be an equivalence with the other
macroscale measurements. Lastly, wettability is not an inherent property of the rock surface to be
water-wet or oil-wet. Instead, it is a function of the oil, water, rock, and temperature. These four
parameters create a unique geochemical condition that produces a wettability state specific to it.
Therefore, the wettability of a rock can vary from water-wet to oil-wet depending on the
geochemical condition present. This makes wettability “situational” rather than an inherent
characteristic of the rock.

132
CHAPTER 10. RECOMMENDATION
The experimental work upon which this thesis is built has given many interesting results that would
be worth looking further into. Below are some thoughts on proposed future work:
We recommend developing an analytical process to identify and quantify surface active
compounds in crude oils. Subsequently, these surface active compounds will be examined at
different geochemical conditions, in order to create a database linking their ability to promote,
depress or not affect the wettability of different rock types. The aim of this study would be to
better characterize crude oils and provide useful and accurate information used in building
accurate wettability prediction models.
We found that both long-chained oxygen SACs and nitrogen SAC play an important role on
the wettability of carbonate rocks. To determine which of the two SAC groups has a more
significant influence on wettability, a systematic study is needed to examine the effects of
combining long-chained oxygen SAC (acids) that promote oil-rock adhesion with nitrogen
SAC (base) that promote water-wetness. This recommended study would highlight the
synergetic effects of the two groups, but more importantly bring forth key SACs that either
promote or depress oil-rock adhesion.
This study did examine the effects of SACs on the wettability of sandstone and carbonate rocks
in the presence of various brine salinities and temperature. We recommend furthering this
study by examining the effect of SACs in the presence of: identified potential determining ions,
various pH levels, different sandstone and shale rock types. We also recommend studying more
than 3 SACs per chemical group.
To have a better understanding of how these SACs would shift wettability in a typical reservoir,
we recommend repeating these experiments using reservoir pH conditions and examining the
impact of the basic SACs.

133
It is possible to have heterogeneous wettability at a grain scale level, where part of the grain is
oil-wet, and another is water-wet. A controlled study like the glass beads experiments in
section 4.1, could be undertaken where parts of a glass bead surface can be altered to simulate
natural inclusions and variation in surface mineralogy and morphology
Experiments shows the relationship between grain scale and core scale experiments.
A comprehensive injection water chemistry customization study is recommended using
reservoir core, crude oil, and brine. This study would use MFT as a screening tool for the brine
composition and salinity, and solvent(s) for cleaning the rock. Once MFT is used for selecting
the optimal parameters, coreflood experiments can then be conducted to measure oil recovery.
A continuation of this study would be the addition of surfactant to the injected water. For
surfactant flooding studies, the surfactant type and concentration selection process can be time-
consuming. MFT can satisfy this experimental gap by allowing numerous surfactant types and
concentration to be rapidly tested.
Lastly, we recommend the using the data generated in this project in a surface complexation
model. A surface complexation model is a chemical model that describes the reactions
occurring at the interface of mineral and solution and simulates the chemical equilibrium. The
reactions lead to the formation of surface complexes that are ultimately responsible for the
charges at the mineral surface and have specific equilibrium (stability) constants that are
similar to reactions in the bulk solution. In the area of improved oil recovery, Brady et al.
(2012) and Brady and Krumhansl (2013) have used this type of modeling to examine the
proposed wettability alteration theories and to give insight into the primary oil (polar functional
groups) and mineral coordination reactions leading to oil adhesion to clay and calcite.

134
CHAPTER 11. REFERENCES
1. Abdallah, W., J.S. Buckley, A. Carnegie, J. Edwards, B. Herold, E. Fordham, A. Graue, T.
Habashy, N. Zeleznev, C. Signer, H. Hussien, B. Montaron, and M. Ziauddin, 2007,
Fundamentals of wettability: Oilfield Review, v. 19/2, p. 44-61.
2. Agbalaka C, Abhijit Y. Dandekar, Shirish L. Patil, Khataniar S, Hemsath JR. (2008) “The
effect of wettability on oil recovery: a review”, paper SPE 114496 presented at SPE Asia
Pacific oil and gas conference and exhibition, Perth, Australia, 20–22 October 2008.
3. Al-Adasani Ahmad, Bai, B., & Wu, Y.-S. (2012) “Investigating Low-Salinity Waterflooding
Recovery Mechanisms in Sandstone Reservoirs”. SPE 152997, 18th SPE Improved Oil
Recovery Symposium.
4. Al-Attar, H. H., Mahmoud, M. Y., Zekri, A. Y., Almehaideb, R. A., and Ghannam, M. T.,
(2013) “Low salinity flooding in a selected carbonate reservoir: experimental approach,” in
Proceedings of the EAGE Annual Conference & Exhibition incorporating SPE Europec,
London, UK, June 2013.
5. Al Harrasi, A., Al-Maamari, R. S., and Masalmeh, S. K., (2012) “Laboratory investigation of
smart waterflooding for carbonate reservoirs,” in Proceedings of the Abu Dhabi International
Petroleum Conference and Exhibition, SPE-161468-MS, Abu Dhabi, UAE.
6. Al-Shalabi, E.W., Sepehrnoori, K., and Delshad, M. 2014 “Mechanisms behind low salinity
water injection in carbonate reservoirs” Fuel, vol. 121, pp. 11–19
7. Al Quraishi, A. A., Al Hussinan, S. N., and Al Yami, H. Q. (2015) “Efficiency and recovery
mechanisms of low salinity waterflooding in sandstone and carbonate reservoir,” in
Proceedings of the Offshore Mediterranean Conference and Exhibition, OMC-2015-223,
Ravenna, Italy.
8. Alotaibi, M.B., Nasralla, R.A., and Nasr-El-Din, H.A. (2011) “Wettability Studies Using Low-
Salinity Water in Sandstone Reservoirs.” SPE Reservoir Evaluation & Engineering, 14, pp.
713–725. SPE-149942-PA
9. Anderson, William G., 1986. “Wettability Literature Survey-Part 1: Rock/Oil/Brine
Interactions and the Effects of Core Handling on Wettability”, SPE 13932, Pages 1125 – 1127
10. Austad, T., Shariatpanahi, S.F., Strand, S., Black, C.J.J. and Webb, K.J., 2011. Condition for
low salinity EOR-effect in carbonate oil reservoirs. 32nd Annual IEA EOR Symposium and
Workshop, 17-19 October.
11. Austad, T., RezaeiDoust, A. and Puntervold, T., 2010. Chemical mechanism of low salinity
water flooding in sandstone reservoirs. Paper SPE 129767 prepared for presentation at the 2010
SPE Improved Oil Recovery Symposium, 24-28 April.

135
12. Austad, T., Strand, S., Madland, M.V., Puntervold, T. and Korsnes, R.I., 2008a. Seawater in
chalk: An EOR and compaction fluid. SPE Reservoir Evaluation & Engineering, 11(4): 648-
654.
13. Austad, T., Strand, S., Puntervold, T. and Ravari, R.R., 2008b. New method to clean carbonate
reservoir cores by seawater. Paper SCA2008-15 presented at the International Symposium of
the Society of Core Analysts, 29 Oct - 2 Nov.
14. Austad, T., (2012) “Enhanced Oil Recovery Field Case Studies: Chapter 13. Water-Based EOR
in carbonates and sandstones. New Chemical Understanding of the EOR potential using “Smart
Water”.
15. Ayello, F., Robbins, W.K., Richter, S., & Nesic, S. (2008a). Crude oil chemistry effects on
inhibition of corrosion and phase wetting. 17th International Corrosion Congress, paper no.
3149
16. Bangs. L.B. (1962) "Hysteresis of Contact Angles in the System Benzene-Water-Quartz." M.S.
thesis. M.l.T. Cambridge, Mass. (1962).
17. Benner, F.C., and Bartell, F.E. (1942) “The effect of polar impurities upon capillary and
surface phenomena in petroleum production.” Drill. and Prod. Prac., API, New York City, pp.
341-348.
18. Bergeron, V., Radke, C.J., (1995) “Disjoining pressure and stratification in asymmetric thin-
liquid films.” Colloid Polymer Science, 273, pp. 165–174.
19. Binks, BP., and Horozov, TS., (2007) “Colloidal particles at liquid interfaces: An
Introduction.” Cambridge University Press, pp. 1-10.
20. Blake, T. D., Kitchener, J. A., (1972) J. Chem. Soc. Faraday Trans 1, 68, pp. 1435.
21. Bloom, F., and Heindel, T.J., (1997) “A Theoretical Model of Flotation Deinking Efficiency,”
Journal of Colloid and Interface Science, 190, pp.182-197.
22. Boussour, S., Cissokho, M., Cordier, P., Bertin, H., Hamon, G., (2009) “Oil Recovery by Low-
Salinity Brine Injection: Laboratory Results on Outcrop and Reservoir Cores.” SPE 124277
presented at the SPE Annual Technical Conference and Exhibition. New Orleans, Louisiana,
4–7 October.
23. Boutin, P. and Wheeler, D. A. (1967), “Column Flotation Development Using an 18 Inch Pilot
Unit”, Canadian Mining Journal, March 1967, Vol. 88, pp. 94-101.
24. Brady, P., Krumhansl, J. and Mariner, P. (2012) “Surface Complexation Modeling for
Improved Oil Recovery.” Paper SPE 153744 presented at the SPE Improved Oil Recovery
Symposium, Tulsa, Oklahoma, USA, 14–18.
25. Brady, P., Krumhansl, J. and Sandia National Laboratories, (2013) “Surface Complexation
Modeling for Waterflooding of Sandstones.” SPE 163053.

136
26. Brady, P., Morrow, N., Fogden, A., Deniz, V., Loahardjo, N., and Winoto., (2015)
Electrostatics and the low salinity effect in sandstone reservoirs. Energy and Fuels, 29, pp.
666-677.
27. Brown, R.J. and Fatt, I., (1956) “Measurements of fractional wettability of oilfield rocks by
the nuclear magnetic relaxation method” Trans., AIME, 207, 262-264.
28. Buckley, J.S., Takamura, K., and Morrow, N.R. (1989) Influence of Electric Surface Charges
on the Wetting Properties of Crude Oils. SPE Reservoir Engineering, 4 (3), pp. 332-340.
29. Buckley, J.S. (2001) “Effective wettability of minerals exposed to crude oil.” Curr. Opin.
Colloid Interface Sci. 6(3), pp. 191–196.
30. Busireddy, C., and Rao, D. N., (2004) “Application of DLVO Theory to characterize spreading
in crude oil brine rock systems” SPE 8942.
31. Celik, M.S., and Somasundaran, P., (1980) “Wettability of Reservoir Minerals by Flotation
and Correlation with Surfactant Adsorption,” SPE Paper 9002.
32. Chilingar, G.V. and Yen, T.F., (1983) “Some notes on wettability and relative permeabilities
of carbonate rocks, II.” Energy Sources, 7, pp. 67-75.
33. Cueic, L., (1984) “Rock/crude-oil interactions and wettability: An attempt to understand their
interrelation.” Paper SPE 13211 presented at the 59th Annual Conference and Exhibition,
Texas, pp. 16-19.
34. Cueic, L. E., (1991) “Evaluation of Reservoir Wettability and Its Effect on Oil Recovery," in
Interfacial Phenomena in Petroleum Recovery, N. R. Morrow ed., Marcel Dekker Inc, New
York Ch.9 31 9-373.
35. Danov, KD., Kralchevsky, PA. (2010) “Capillary forces between particles at a liquid interface:
General theoretical approach and interactions between capillary multipoles” Advances in
colloid and interface science 154 (1), pp. 91-103
36. Davis, J.A., James, R.O., and Leckie, J.O. (1978) “Surface ionization and complexation at the
oxide/water interface: I. Computation of electrical double layer properties in simple
electrolytes”. J. Colloid Interface Sci., 63: pp. 480-499.
37. de Gennes, P.G., (1985) “Wetting: statics and dynamics” Rev. Mod. Phys. 57, 827 (1985) –
Published.
38. Denekas, M.O., Mattax, C.C. and Davis, G.T., (1959) “Effects of crude oil components on
rock wettability.” Petroleum Transactions AIME, 216, pp. 330-333.
39. Derjaguin, B. V., & Landau, L. (1941). Acta Physicochim URSS, 14, 633

137
40. Dixit, A.B., Buckley, J.S., McDougall, S.R., Sorbie, K.S., (2000) “Empirical measures of
wettability in porous media and the relationship between them derived from porescale
modeling.” Trans. Porous Media, 40, pp. 27–54.
41. Donaldson, E.C., Thomas, R.D. and Lorenz, P.B., (1969) "Wettability determination and its
effect on recovery efficiency." Soc. Pet. Eng. J., pp. 13-20.
42. Drummond, C., Israelachvili, J., (2002) Surface forces and wettability, Journal of Petroleum
Science Engineering, 33, pp. 123–133.
43. Dubey, S.T., Doe, P.H., (1993) “Base number and wetting properties of crude oils.” Soc. Pet.
Eng. Res. Eng. 8, 195.
44. Efird, K.D., & Jasinki, R.J., (1989). Effect of the crude oil on corrosion of steel in crude
oil/brine production. Corrosion Engineering, 45(2), 165-171.
45. Emerson, ZI., (2007) “Particle and buble interactions in flotation systems” PhD dissertation,
Submitted to the Graduate Faculty of the Auburn University.
46. Fatt, 1. And Klikoff, W.A., (1959) “Effect of fractional wettability on multiphase Flow through
porous media” Trans. AIE216, pp. 426-432.
47. Fathi, S. J., Austad, T., and Strand, S. Smart Water as a Wettability Modifier in Chalk: The
Effect of Salinity and Ionic Composition, Energy & Fuels 2010 24 (4), 2514-2519. (2010a)
48. Fathi, S.J., Austad, T., Strand, S., and Puntervold, T. Wettability Alteration in Carbonates: The
Effect of Water-Soluble Carboxylic Acids in Crude Oil. Energy & Fuels 2010 24 (5), 2974-
2979.
49. Fathi, S. J., Austad, T., and Strand, S. Water-Based Enhanced Oil Recovery (EOR) by Smart
Water: Optimal Ionic Composition for EOR in Carbonates, Energy & Fuels 2011 25 (11),
5173-5179.
50. Fathi, S. J., Austad, T., & Strand, S. (2012, January). Water-Based Enhanced Oil recovery
(EOR) by" Smart Water" in Carbonate Reservoirs. In SPE EOR Conference at Oil and Gas
West Asia. Society of Petroleum Engineers.
51. Fatt, I., Klikoff, W. (1959) “Effect of Fractional Wettability on Multiphase Flow Through
Porous Media.” SPE-1275-G, v. 11(10).
52. Ferno, M. A., Gronsdal, R., Aheim, J., et al. (2011) “Use of Sulfate for Water Based Enhanced
Oil Recovery during Spontaneous Imbibition in Chalk.” Energy & Fuel, 25, pp. 1697-1706.
53. Fjelde, I., Omekeh, A., Haugen, P., (2017) “Screening of the potential for different injection
water compositions to alter wettability to more water-wet” SPE 184918.
54. Frontiers, BP Magazine, “Less Salt, More Oil,” Issue 25, August 2009

138
55. Gamage, P., Thyne, G. (2011a), "Comparison of Oil Recovery by Low Salinity waterflooding
in secondary and Tertiary Recovery Modes", SPE 147375. SPE Annual Technical Conference
and Exhibition, Denver, Colorado, USA
56. Gamage, P. and Thyne, G. D., (2011b), Systematic Investigation of the Effect of Temperature
during Aging and Low-Salinity Flooding of Sandstones, 16th European Symposium on
Improved Oil Recovery, Cambridge, UK, 12-14 April 2011.
57. Gregory, J., (1975) “Interaction of Unequal Double Layers at Constant Charge.” Journal of
Colloid and Interface Science. 51, pp. 44-51
58. Gregory, J., (1981) “Approximate Expressions for Retarded van der Waals Interaction.”
Journal of Colloid and Interface Science. 83, pp. 138-145
59. Gupta, R. Smith, G. G, Hu, L., (2011) “Enhanced waterflood for carbonate reservoirs—impact
of injection water composition,” in Proceedings of the SPE Middle East Oil and Gas Show and
Conference, SPE-142668-MS, Manama, Bahrain.
60. Hadia, N. J.; Ashraf, A.; Tweheyo, M. T.; Torsæter, O., (2013) “Laboratory investigation on
effects of initial wettabilities on performance of low salinity waterflooding”. Journal of
Petroleum Science Engineering, 105, pp. 18−25.
61. Hallenbeck, L., Sylte, J., Ebbs, D., Thomas, L. (1991) “Implementation of the Ekofisk field
waterflood” SPE Form. Eval. 6, pp. 284−290.
62. Hamaker, H. C. (1937). Physica, 4, 1058–1072.
63. Haugen, P. E., (2016) “Characterization of wettability alteration by flotation”’ M.Sc. Thesis,
Submitted to The Graduate School of Natural and Applied Sciences, University of Stavanger.
64. Hazim H. Al-Attar, Mohamed Y. Mahmoud, Abdulrazag Y. Zekri, Reyadh Almehaideb,
Mamdouh Ghannam. (2013) “Low-salinity flooding in a selected carbonate reservoir:
experimental approach” J Petrol Explor Prod Technol, 3, pp. 139–149.
65. Helgeson, H., Kirkham, D., (1974) “Theoretical prediction of the thermodynamic behavior of
aqueous electrolytes at high pressures and temperatures; ii, debye-huckel parameters for
activity coefficients and relative partial molal properties.” Am J Sci, 274, pp. 1089–1198
66. Hiorth, A. Cathles, L.M., and Madland, M.V., (2010) “The Impact of Pore Water Chemistry
on Carbonate Surface Charge and Oil Wettability” Transport Porous Media, 85, pp. 1-21.
67. Hirasaki, G.J., (1991) “Wettability: Fundamentals and surface forces” SPE Formation
Evaluation. 6, pp. 217-226
68. Hoeiland S., Barth T., Blokhus A. M., Skauge A., (2001) “The effect of crude oil acid fractions
on wettability as studies by interfacial tension and contact angles” Journal of Petroleum
Science and Engineering, 30, pp. 91-103.

139
69. Hunter, R.J., (1981) “Zeta Potential in Colloid Science: Principles and Applications.” 3rd Edn.,
Academic Press, New York, USA., ISBN-13: 9780123619600, pp. 386.
70. Israelachvili, J.N., (2011), Intermolecular and Surface Forces, Revised Third Edition,
Academic Press, New York city
71. Jaafar, M.Z. and Pourbasirat, A., (2011) “Measurement of streaming potential coupling
coefficient on carbonate rocks for downhole monitoring in smart wells”. Journal Technology
(Sains Kejuruteraan), 56: pp. 87-99.
72. Jaafar, M.Z., Mohd Nasir, A., and Hamid, M.F. (2014) “Measurement of Isoelectric Point of
Sandstone and Carbonate Rock for Monitoring Water Encroachment”. Journal of Applied
Sciences, 14, pp. 3349-3353
73. Karoussi, O., Hamouda, A., (2007) “Imbibition of sulfate and magnesium ions into carbonate
rocks at elevated temperatures and their influence on wettability alteration and oil recovery.”
Energy Fuels 21, pp. 2138–2146
74. Kasmaei, A.K., & Rao, D. (2014) “Is Wettability Alteration the Main Cause for Enhanced
Recovery in Low Salinity Waterflooding?” SPE-169120-MS, 12.
75. Kelebek, S. (1984) “Surface properties and selective flotation of inherently hydrophobic
minerals’ M.Sc. Thesis, Submitted to the faculty of graduate studies and research, Department
of Mining and Metallurgical Engineering, McGill University, Montreal, Quebec, Canada.
76. Kilybay, A., Ghosh, B., and Thomas, N., (2017) “A Review on the Progress of Ion-Engineered
Water Flooding” Journal of Petroleum Engineering, Volume 2017 (2017), Article ID 7171957,
9 pages
77. Klassen, V. I., (1948a) Theoretical reasons for intensification of the flotation process -
activation of floated minerals by air precipitating from solution” v 22(8), pp. 991-998.
78. Klassen, V. I., (1948b) Effect of gas adsorption on the floatability of minerals, Gomyi Zhur.
122(9), 32-34.
79. Koper, G. J. M., (2009) “An Introduction to Interfacial Engineering.” VSSD, Delft.
80. Kocurek Industries, Hard Rock Division, 8535 State Highway 36 S, Caldwell, TX 77836, (979)
596-3504, [email protected], www.kocurekindustries.com
81. Kovscek, A.R., Wong, H., Radke, C.J., (1993) “A pore-level scenario for the development of
mixed wettability in oil-reservoirs.” AICHE Journal, 39 pp. 1072–1085
82. Kralchevsky, PA., Nagayama, K., (2000) “Capillary interactions between particles bound to
interfaces, liquid films and biomembranes” Advances in colloid and interface science, 85(2),
pp. 145-192.

140
83. Kralchevsky, PA., Nagayama, K., (2001) “Particles at fluid interfaces and membranes”
Elsevier Science.
84. Kralchevsky, PA., Denkov, ND., (2001) “Capillary forces and structuring in layers of colloid
particles.” Current Opinion in Colloid & Interface Science 6(4), pp. 383-401.
85. Kulkarni, R.D., Somasundaran, P. (1973) “The effect of aging on the electrokinetic properties
of wuartz in Aqueous Solution." Oxide-Electrolyte Interfaces. American Electrochemical
Society, Princeton, B.J. pp. 31-44.
86. Kulkarni, R.D., Somasundaran, P., (1977) "Effect of Pretreatment on the Electrokinetic
Properties of Quartz," Int. J. Miner. Process., Vol. 4, p.89-98. Lager, A., Webb K.J., Black,
C.J. Singleton, M., Sorbie, K.S. (2006) “Low Salinity Oil Recovery - An Experimental
Investigation” Society of Core Analyst, SCA2006-36, pp. 1-12
87. Lager, A., Webb, K. J., Black, C. J. J., (2006) “Low Salinity Oil Recovery: An Experimental
Investigation.” Paper presented at the International Symposium of the Society of Core Analysts
held in Trondheim, Norway 12-16 September.
88. Lager, A., Webb K.J., Collins, I. R., Richmond, D. M., (2008) “LoSal enhanced oil recovery:
evidence of enhanced oil recovery at the reservoir scale,” in Proceedings of the SPE
Symposium on Improved Oil Recovery, SPE-113976-MS, Tulsa, Okla, USA.
89. Lever, A., and Dawe, R., (1984) “Water-sensitivity and migration of fines in the hopeman
sandstone” Journal of Petroleum Geology, 7(1), pp. 97-107.
90. Ligthelm, D.J., Gronsveld, J., Hofman, J.P., Brussee, N.J., Marcelis, F. and van der Linde,
H.A., 2009. Novel waterflooding strategy by manipulation of injection brine composition.
Paper SPE 119835 presented at the 2009 SPE EUROPEC/EAGE Annual conference and
exhibition, Amsterdam, The Netherlands, 8-11 June 2009.
91. Lyklema, J. (1989) Fundamentals of Interface and Colloid Science, Volume 1, Academic
Press, 1993.
92. Matar, S., Hatch, L. F., (2001). Chemistry of Petrochemical Processes, Second Edition (2nd
Edition), Gulf Professional Publishing, Houston, Texas.
93. McGuire, P. L., Chatham, J. R., Paskvan, F. K., Sommer, D. M., Carini, F. H. (2005) “Low Salinity
Oil Recovery: An Exciting New EOR Opportunity for Alaska’s North Slope” Paper SPE 93903,
SPE Western Regional Meeting held in Irvine, CA, USA, 30 March-1 April
94. Menezes, J.L., Yan, J. and Sharma, M.M., (1989) “The mechanisms of wettability alteration
due to surfactants in oil-based mud. Paper SPE 18460 presented at the SPE International
Symposium on Oilfield Chemistry, Houston, Texas, 8-10 February
95. Michaels, A.S. and Timmins, R.S., (1960) "Chromatographic Transport of Reverse Wetting
Agents and Its Effect on Oi1 Disp1acement in Porous Media," Trans. AIME, Vo1. 219, p. 150.

141
96. Mohammadi-Jam, S.; Burnett, D. J.; Waters, K. E. (2014) “Surface energy of minerals
applications to flotation.” Minerals Engineering, 66-68, 112−118.
97. Mohan, K.K., Vaidyab, R.N., Reed, M.G., Fogler, H.S., (1993) “Water sensitivity of
sandstones containing swelling and non-swelling clays.” Colloids and Surfaces A.
Physicochemical and Engineering Aspects, 73(1), 231-254.
98. Morrow, N.R., Lim, H.T., and Ward, J.S., (1986) “Effect of crude oil induced wettability
changes on oil recovery’” SPE Formation Evaluation, pp. 89-103.
99. Morrow, N.R. and J. S. Buckley, (2011) “Improving oil recovery by low salinity
waterflooding.” SPE 129421_JPT.
100. Myint, P. C.; Firoozabadi, A. (2015) “Thin liquid films in improved oil recovery from low-
salinity brine. Curr. Opin. Colloid Interface Sci., 20, pp. 105−114
101. Nasralla, R. A., Bataweel, M. A., Nasre-El-Din, H. A. (2011a) “Investigation of Wettability
Alteration and Oil-Recovery Improvement by Low-Salinity Water in Sandstone Rock”,
Journal of Canadian Petroleum Technology, March 2013, pp. 144-154.
102. Nasralla, R. A., Alotaibi, M. B., Nasre-El-Din, H. A. (2011b) “Efficiency of Oil Recovery
by Low Salinity Water Flooding in Sandstone Reservoirs”, Paper SPE 144602, SPE Western
North American Regional Meeting held in Anchorage, Alaska, USA, 7-11 May 2011.
103. Nguyen, A.V., and Schulze, H. J. (2004) Colloidal Science of Flotation, Surfactant Science
Series, 118, Marcel Dekker, New York.
104. Paunov, VN., Kralchevsky, PA., Denkov, ND., Nagayama, K., (1993) “Lateral capillary
forces between floating submillimeter particles.” Journal of colloid and interface science
157(1), pp. 100-112.
105. Perkins, C. L. (1921), Flotation fundamentals, U.S. Patent, 1,364,304.
106. Pitois, O., and X. Chateau., (2002) “Small particle at a fluid interface: Effect of contact
angle hysteresis on force and work of detachment.” Langmuir 18, pp. 9751–9756.
107. Platikanov, D., (1964) “Experimental Investigation on the “Dimpling” of Thin Liquid
Films”, J. Phys. Chem, 68, pp. 3619-3624.
108. Pryor, E.J., (1965) “Principles of Froth Flotation” Mineral Processing, Elsevier Publishing
Company Limited, Chapter 17, pp. 457-519.
109. Puntervold, T., Strand., S, Austad, T. (2007). “Water flooding of carbonate reservoirs:
Effects of a model base and natural crude oil bases on chalk wettability.” Energy & Fuels
21(3), pp. 1606-1616.

142
110. Puntervold, T., Strand., S, Austad, T. (2007). “New method to prepare outcrop chalk cores
for wettability and oil recovery studies at low initial water saturation”. Energy & Fuels 21(6),
pp. 425-3430.
111. Ralston, O.C. (1916) “Why do minerals float.” The flotation Process, Edited by T.A.
Rickard, San Francisco: Mining and Scientific Press
112. Rao, D. N., and Girard, M. G.: (1996) “A New Technique for Reservoir Wettability
Characterization,” Journal of Canadian Petroleum Technology, Vol. 35, No.1, pp.31- 39.
113. Rao, D.N., (1999) “Wettability effects in thermal recovery operations.” SPE Reservoir
Eval. & Eng., 2, pp. 420-430
114. Rao, D.N.: (2001) “Fluid-fluid and solid-fluid interfacial interactions in petroleum
reservoirs,” Petroleum Science and Technology, 19, pp. 157-188
115. Rao, D.N., and Karyampudi, R.S., (2002) “Application of the dual-drop dual crystal
contact angle technique to characterize heavy oil reservoir wettability,” J. Adhesion Sci.
Technol., Vol. 16, No. 5, pp-581-598
116. RezaeiDoust, A., Puntervold, T., Strand, S., (2009) “Smart Water as Wettability Modifier
in Carbonate and Sandstone: A Discussion of Similarities/Differences in the Chemical
Mechanisms.” Energy & Fuels 23(9), pp. 4479-4485.
117. RezaeiDoust, A., Puntervold, T. and Austad, T., (2011) “Chemical verification of the EOR
mechanism by using low saline/smart water in sandstone.” Energy & Fuels, 25: 2151- 2162.
118. Rickard, T. A., (1916) “The Flotation Process” San Francisco, Mining & Scientific Press.
119. Robbins, K., & Hsu, C.S., (1999). “Composition,” Kirk-Othmer Encyclopedia of Chemical
Technology (4th Edition), 18, 351-370.
120. Romero, M.I., Gamage, P., Jiang, H., Chopping, C. and G. Thyne, (2013) “Study of low-
salinity waterflooding for single- and two-phase experiments in Berea sandstone cores.” J. Pet.
Sci Eng. 110, pp. 149-154.
121. Robertson, E. P., (2010) “Oil Recovery Increases by Low-Salinity Flooding: Minnelusa
and Green River Formations. Proceedings of the SPE Annual Technical Conference and
Exhibition; Florence, Italy, SPE-132154-MS, DOI: 10.2118/132154-MS.
122. Saini, D., Zheng, Y., Rao, D. N., (2008) “Line Tension-Based Modification of Young's
Equation for Rock-Oil-Brine Systems.” SPE Symposium on Improved Oil Recovery
123. Salathiel, R. A. (1973) “Oil recovery by surface film drainage in mixed wettability rocks.”
Journal of Petroleum Technology, 25, pp. 1216−1224.
124. Sayyouh, M.H., Dahab, A.S. and Omar, A. (1990) “Effect of Clay Content on Wettability
of Sandstone Reservoir.” Journal of Petroleum Science, 4(2), pp. 119-125
143
125. Sayyouh, M.H., Hemeida, A.M., Al Blehed, M.S. and Desouky, S.K., (1991) “Role of
Polar Compounds in Crude Oils on Rock Wettability” Journal of Petroleum Science 6, pp. 225-
233
126. Schembre, J., Tang, G.Q., Kovscek, A. (2006) “Wettability alteration and oil recovery by
water imbibition at elevated temperatures.” Journal of Petroleum Science, 52, pp. 131–148
127. Schulze, H.J., (1984) “Physico-chemical Elementary Processes in Flotation.” Elsevier Pub,
Amsterdam.
128. Shabib-Asl A, Ayoub MA, Bin Mohd Saaid I, Paulo Jose Valentim P. (2015)
“Experimental investigation into effects of crude oil acid and base number on wettability
alteration by using different low salinity water in sandstone rock.” Journal of the Japan
Petroleum Institute. 58(4) pp. 228–236.
129. Sharma, M.M., and Wunderlich, R.W. (1987) "The Alteration of Rock Properties Due to
Interaction with Drilling Fluid Components", Journal of Petroleum Science and Engineering.
130. Shariatpanahi, S.F., Strand, S., Austad, T., Aksulu, H., (2012) “Wettability restoration of
limestone cores using core material from the aqueous zone.” Petroleum Science and
Technology, 30, pp. 1-9.
131. Shehata, A. M., Alotaibi, M. B., Nasr-El-Din, H. A., (2014). “Waterflooding in Carbonate
Reservoirs: Does the Salinity Matter?” Society of Petroleum Engineers.
132. Shell (2016) “Hydrocarbon Recovery Optimisation” http://www.shell.com/energy-and-
innovation/overcoming-technology-challenges/making-the-most-of-our-
resources/_jcr_content/par/textimage.stream/1462800199005/d085390840610177756bec1a9
980b9bab72e09ecc9728c3c456421ce9b56a257/eor-brochure-2016.pdf
133. Shimoyama, A. and Johns, W.D., (1972) “Formation of alkanes from fatty acids in the
presence of CaCO3.” Geochimica et Cosmochimica Acta, 36, pp. 87-91
134. Skopec and A., R., (1994) "Proper Coring and Wellsite Core Handling Procedures: The
First Step toward Reliable Core Analysis" Vol. 46, Society of Petroleum Technology,
Richardson, TX.
135. Snyder, L.R., (1970). “Petroleum nitrogen compounds and oxygen compounds.” Accounts of
chemical research, 3(9), pp. 290-299.
136. Sohal, M.A., Thyne, G., Søgaard, E.G. (2016) “Novel Application of the Flotation
Technique to Measure the Wettability Changes by Ionically Modified Water for Improved Oil
Recovery in Carbonates.” Energy Fuels, 30, pp. 6306−6320.
137. Somasundaran, P., (1970) "Preatreatment of Mineral Surfaces and Its Effect on Their
Properties” Clean Surfaces: Their Preparation and Characterization for Interfacial Studies, pp.
285-306, Marcel Dekker, New York, N.Y.

144
138. Somasundaran, P. and Zhang, L., (2004) “Adsorption of Surfactants on Minerals for
Wettability Control in Improved Oil Recovery Processes,” Paper presented at the 8th
International Symposium on Reservoir Wettability, Houston, TX.
139. Sposito G. (1989) The Chemistry of Soils. Oxford University Press, New York, 277.
140. Standnes, D.C. and Austad T., (2003) “Wettability alteration in carbonates: Interaction
between cationic surfactant and carboxylates as a key factor in wettability alteration from oil-
wet to water-wet conditions.” Colloids and Surfaces A: Physicochemical and Engineering
Aspects. 16, pp. 243–259.
141. Strand, S., Hognesen, E.J., Austad, T., (2006) “Wettability alteration of carbonates: effects
of potential determining ions (Ca2+ and SO42-) and temperature.” Colloid and surface A,
275(1–3), PP. 1–10
142. Suijkerbuijk, B., Hofman, J., Ligthelm, D. J., Romanuka, J., Brussee, N., van der Linde,
H., & Marcelis, F. (2012). “Fundamental Investigations into Wettability and Low Salinity
Flooding by Parameter Isolation” presented at the 18th SPE IOR Symposium held in Tulsa.
143. Swinburne, J.; Rudorf, G. (1906) Sci. Am., 61, pp. 25202−25204.
144. Sylte, J. E.; Hallenbeck, L. D.; Thomas, L. K., (1988) “Ekofisk Formation Pilot
Waterflood”. Proceedings of the SPE Annual Technical Conference and Exhibition, Houston,
TX, USA, Oct. 2−5, 1988; Society of Petroleum Engineers: Richardson, TX, USA, Paper SPE
18276
145. Tang, G.Q. and Morrow, N.R., (1997) “Salinity, Temperature, oil composition, And Oil
Recovery by Waterflooding.” SPE Reservoir Engineering, pp. 269-276
146. Tang, G. Q., Morrow, N. R. (1999) Influence of brine composition and fines migration on
crude Oil/brine/rock interactions and oil recovery, Journal of Petroleum Science and Engineering
24, pp. 99–111.
147. Takamura, K., Chow, R. S. (1985). “The electric properties of the bitumen/water interface
Part II. Application of the ionizable surface-group model.” Colloids and Surfaces, 15, 35-48.
148. Takahashi S. Water imbibition, electrical surface forces, and wettability of low
permeability fractured porous media. (Ph.D. thesis) Stanford University; 2009.
149. Tebogo, P.P., & Muzenda, E. (2010). “A multistage sulphidisation flotation procedure for
a low grade malachite copper ore.” International Journal of Chemical, Nuclear, Metallurgical
and Materials Engineering, 4.
150. Thomas, M., Clouse, J.A., Longo, J.M., (1993) “Adsorption of organic-compounds on
carbonate Minerals: 1. Model compounds and their influence on mineral wettability.” Chem.
Geol. 109, PP. 201–213

145
151. Thyne, G., Gamage, P., (2010) “Evaluation of the Effect of Low Salinity Waterflooding
for 26 Fields in Wyoming.” Paper 147410 presented at the SPE Annual Technical Conference
and Exhibition. Denver, Colorado, USA, 30 October–2 November.
152. Treiber, L.E., Archer, D.L. and Owens, W.W., (1972) “A laboratory evaluation of the
wettability of fifty oil producing reservoirs.” SPE 03526. SPE Journal, pp. 531-540
153. Valdya, R.N., Fogler, H.S., (1992) “Fines migration and formation damage: influence of
pH and ion exchange.” SPE Prod. Eng. 7 (4), pp. 325–330.
154. Verwey, E. J. W., & Overbeek, J. T. G. (1948). Theory of stability of lyophobic colloids.
Amsterdam: ELSEVIER.
155. Wagner, O.R., Leach, R.O., (1959). "Improving Oil Displacement Efficiency by
Wettability Adjustment” Trans. AIME, Vol. 216, pp. 65-72.
156. Wang, Y., Xu, H., Yu, W., Bai, B., Song, X., & Zhang, J. (2011) “Surfactant induced
reservoir wettability alteration: Recent theoretical and experimental advances in enhanced oil
recovery.” Petroleum Science, 8(4), 463-476.
157. Webb, K.J., Black, C.J.J. and Edmonds, I.J., (2005a) “Low salinity oil recovery - The role
of reservoir condition corefloods” Paper C18 presented at the 13th European Symposium on
Improved Oil Recovery, 25-27 April.
158. Webb, K.J., Black, C.J.J. and Tjetland, G., (2005b) “A laboratory study investigating
methods for improving oil recovery in carbonates” International Petroleum Technology
Conference (IPTC).
159. Whelan, P. F., and Brown, D. J. (1956), “Particle-Bubble Attachment in Froth Flotation”,
Bulletin of the Institute of Mining and Metallurgy, No. 591, pp. 181-192.
160. Wu, Y., Shuler, P. J., Blanco, M., Tang, Y., Goddard, W. A., (2008) “An experimental
study of wetting behavior and surfactant EOR in carbonates with model compounds” SPE
Journal 2008, 13, pp. 26−34.
161. Yoon R.H., (2000) “The role of hydrodynamic and surface forces in bubble-particle
interaction”, Int. J. Miner. Process. 58, pp. 129-143.
162. Yousef, A. A., Al-Saleh, S., Al-Kaabi, A. U., & Al-Jawfi, M. S. (2010, January 1).
Laboratory Investigation of Novel Oil Recovery Method for Carbonate Reservoirs. Society of
Petroleum Engineers.
163. Yousef, A. A., Al-Salehsalah, S. H., & Al-Jawfi, M. S. (2011). “New Recovery Method
for Carbonate Reservoirs through Tuning the Injection Water Salinity: Smart Waterflooding.”
in Proceedings of the SPE EUROPEC/EAGE Annual Conference and Exhibition, SPE-
143550-MS, Vienna, Austria.

146
164. Yousef, A. A., Liu, J. S., Blanchard, G. W., Al-Saleh, S., Al-Zahrani, T., Al-zahrani Rashad
Madees, Al-mulhim Nayef. (2012). “Smart Waterflooding: Industry” Society of Petroleum
Engineers.
165. Yousef, A. A., Al-Salehsalh, S., & Al-Jawfi, M. S. (2012, January 1). Improved/Enhanced
Oil Recovery from Carbonate Reservoirs by Tuning Injection Water Salinity and Ionic
Content. Society of Petroleum Engineers. (2012a)
166. Yukselen, Y., (2001) “A Study of Zeta Potential of Clay Minerals in the Presence of
Various Chemical Solutions” M.Sc. Thesis, Submitted to The Graduate School of Natural and
Applied Sciences, Dokuz Eylul University, 82 pp
167. Zhang, P.M., Austad, T. (2006) “Wettability and oil recovery from carbonates: Effects of
temperature and potential determining ions.” Colloid and surface A, 279, pp. 179–187.
168. Zhang, P.M., Tweheyo, M.T., Austad, T., (2006) “Wettability alteration and improved oil
recovery in chalk: the effect of calcium in the presence of sulfate.” Energy Fuels 20(5), pp.
2056–2062.
169. Zhang, Y., Xie, X. and Morrow, N.R., (2007) “Waterflood performance by injection of
brine with different salinity for reservoir cores” Paper SPE 109849 presented at the 2007 SPE
Annual Technical Conference and Exhibition, 11-14 Nov.
170. Zhang, P.M., Tweheyo, M.T., Austad, T. (2007) “Wettability alteration and improved oil
recovery by spontaneous imbibition of seawater into chalk: Impact of the potential determining
ions Ca2+, Mg2+, and SO42-.” Colloid and surface A, physico chemical and Engineering
Aspects Energy Fuels, 301 (1–3), PP. 199–208.
171. Zhang, Y. and Morrow, N.R., (2006) Comparison of secondary and tertiary recovery with
change in injection brine composition for crude oil/sandstone combinations. Paper SPE 99757
presented at the 2006 SPE/DOE Symposium on Improved Oil Recovery, 22-26 April.
172. Zheng, Y., (2012) “Effect of surfactants and brine salinity and composition on spreading,
wettability and flow behavior in gas-condensate reservoirs’ PhD dissertation, Submitted to the
Graduate Faculty of the Louisiana State University and Agricultural and Mechanical College.
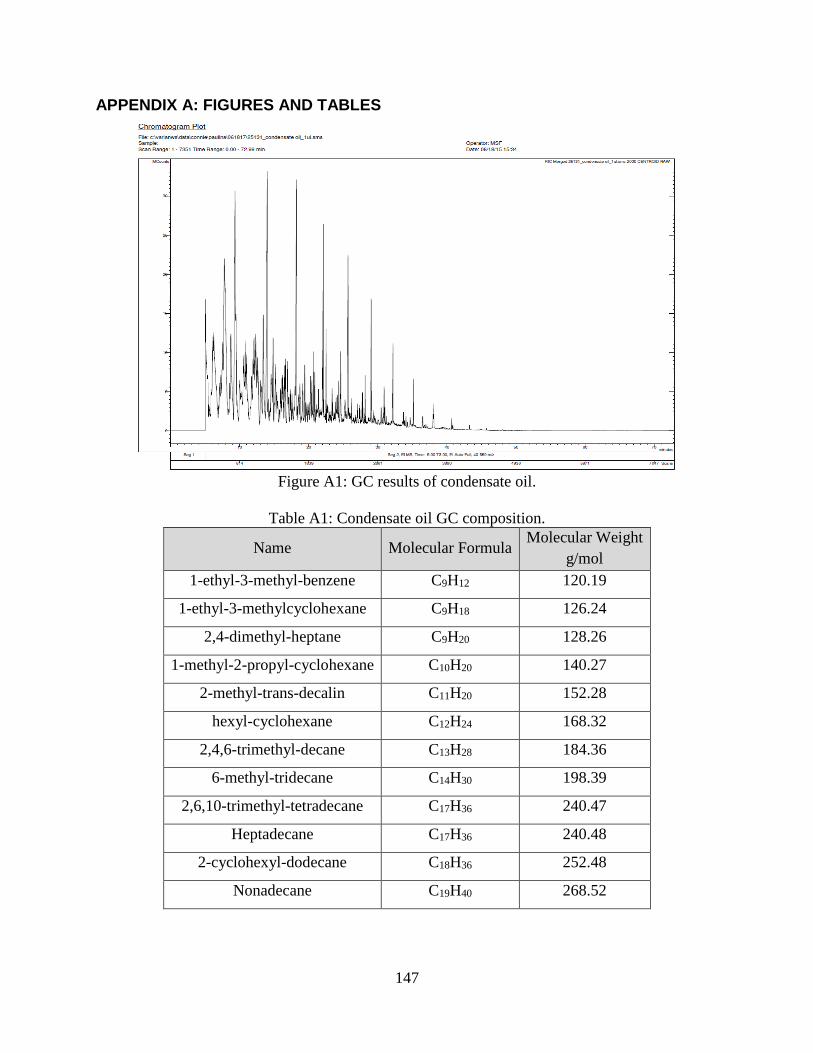
147
APPENDIX A: FIGURES AND TABLES
Figure A1: GC results of condensate oil.
Table A1: Condensate oil GC composition.
Name Molecular Formula Molecular Weight
g/mol
1-ethyl-3-methyl-benzene C9H12 120.19
1-ethyl-3-methylcyclohexane C9H18 126.24
2,4-dimethyl-heptane C9H20 128.26
1-methyl-2-propyl-cyclohexane C10H20 140.27
2-methyl-trans-decalin C11H20 152.28
hexyl-cyclohexane C12H24 168.32
2,4,6-trimethyl-decane C13H28 184.36
6-methyl-tridecane C14H30 198.39
2,6,10-trimethyl-tetradecane C17H36 240.47
Heptadecane C17H36 240.48
2-cyclohexyl-dodecane C18H36 252.48
Nonadecane C19H40 268.52

148
Table A1: Cont’d
Name Molecular Formula Molecular Weight
g/mol
10-methylnonadecane C20H42 282.55
n-heptadecylcyclohexane C23H46 322.61
3,5,24-trimethyl-tetracontane C43H88 605.16
2-ethyl-1-decanol C12H26O 186.33
2-butyl-1-octanol C12H26O 186.33
2-hexyl-1-octanol C14H30O 214.39
2-hexyl-1-decanol C16H34O 242.44
Figure A2: 6 hrs, 1 day, & 2 days aging time for decane at 25°C, 70°C, & 110°C.

149
Figure A3: 6 hrs, 1 day, & 2 days aging time for condensate at 25°C, 70°C, & 110°C.
Figure A4: 6 hrs, 1 day, & 2 days aging time for decane +2000 ppm Di-n-butyl sulfide (sulfur
SAC) and 2000ppm Quinoline (nitrogen SAC) at 25°C, 70°C, & 110°C.

150
Figure A5: 6 hrs, 1 day, & 2 days aging time for decane +2000 ppm Quinoline (nitrogen SAC) at
25°C, 70°C, & 110°C.
Figure A6: Sandstone Berea XRD mineralogy results.

151
Figure A7: Austin chalk XRD mineralogy results.
Figure A8: Indiana limestone XRD mineralogy results.

152
Figure A9: Silurian dolomite XRD mineralogy results.

153
APPENDIX B: CORE CLEANING SOLVENT ANALYSIS
Laboratory studies typically aim to simulate reservoir behavior by using parameters as
close to the reservoir conditions as possible. Reservoir fluids (oil, brine, and gas), temperature, and
pressure can be duplicated in the laboratory. However, it is difficult to know how well the core
sample represents the original reservoir condition. Mud infiltration during the coring processes
contaminates the cores and alters their native state due to the surfactant components in the oil-
based muds that are typically used in the core extraction process. In addition, when cores are
brought to the surface their interaction with atmospheric conditions can alter the wetting state due
to the temperature drop, and pressure drop that may result in the evaporation of light components.
In addition, air exposure may lead to oxidization of some of the active chemicals which may result
in precipitation of polar components if present (Skopec, 1994). Lastly, core preparation techniques
such as cutting, polishing, etc. may also introduce contaminants. Consequently, it is almost
impossible to maintain the natural wetting state of core sample and thus cores have to be cleaned
properly with solvents and try to restore their wetting state.
Even though many studies have been carried out to find the most effective cleaning solvent,
core cleaning still remains mostly a trial and error process, where the selection of the best solvents
to be used greatly depends on the experience with particular rocks. Cuiec (1975) and Gant and
Anderson (1988) concluded that solvent mixtures work better than single solvents. Recommended
solvent mixtures are: benzene/carbon disulphide, toluene/methanol, chloroform/methanol, and
toluene/ethanol. Cuiec (1975) recommended acidic type solvents to clean sandstone rocks since
they are known to have a surface of acid type (negative charge). The opposite was recommended
for limestone that is known to have a basic type (positive charge) surface and thus basic solvents
were observed to clean better. The core cleaning process is said to be successful when all the
contaminants are removed from the surface of the rock leaving it strongly water-wet (Gant and

154
Anderson, 1988). The main challenge in core cleaning has typically been viewed as finding the
most convenient solvent(s) that can dissolve all the organic compounds on the surface of the rock.
However, when one thinks of this problem from a surface chemistry perspective several challenges
arise. The solvent of choice may be effective in solubilizing the organic compounds present in the
rock, however, what effect does the solvent have on the chemistry of the rock? Does the solvent(s)
change the way the rock may interact with brine and/or water, thus wettability? This study
examines the effect of three common cleaning solvents on the wettability of Berea, Austin chalk,
Silurian dolomite, and Indiana limestone. Three model oil types were tested: decane, decane +
acidic SAC, decane + basic SAC. The three common solvents selected are: toluene which is
typically used to remove hydrocarbons, isopropyl alcohol (IPA) which is typically used as a
dehydrating agent, and methanol/chloroform (20%/80%) mixture which is typically recommended
for cleaning carbonate rocks.
A little over 100 MFT experiments were carried out to test the effect of the selected
cleaning solvents on the wettability of Berea, Austin chalk, Silurian dolomite, and Indiana
limestone. The percent change in wettability reported in the graphs is calculated by comparing the
wettability of the cleaned rock by a particular solvent with the wettability of the fresh rock sample.
B1. Decane - DI water - Rock system
Figure B1 illustrates the effects of the selected cleaning solvents on the four rock types
when decane is used. As observed, the three solvents did not affect the wettability of Berea,
therefore, Berea remained strongly water-wet. In the case of chalk, IPA and toluene did not have
an effect on wettability; however, the methanol/chloroform mixture shifted the wettability of chalk
to more water-wet. All three solvents shifted the wettability of dolomite towards more oil-wet.
Lastly, IPA shifted the wettability of limestone towards oil-wet; toluene did the opposite (water-
wet), and the methanol-chloroform mixture did not have an effect on wettability.

155
Figure B1: Effects of the selected cleaning solvents on the wettability of Berea, Austin chalk,
Silurian dolomite, and Indiana limestone in the presence of decane and DI water
Similar results were also observed when using DDDC contact angle measurement
techniques. It was observed that in the presence of Yates oil and brine, dolomite rock crystal
became extremely oil-wet (180°) after they were cleaned with the methanol-chloroform mixture.
However, when the crystals were boiled in water instead of using the methanol-chloroform solvent,
the measured contact angle was about 165° (less oil-wet). Solvents obviously have different effects
on rock wettability, and the effect can differ even in rocks that are chemically similar, e.g. chalk,
dolomite, and limestone.
B2. Decane + Basic SAC - DI water - Rock system
In this set of experiments, DI water was used as the aqueous phase and 4000 ppm of
Quinoline was added to decane in order to simulate a basic type oil. The results are illustrated in

156
Figure B2 As previously discussed in section 6.3.4, Quinoline had no effect on Berea wettability:
this result did not change when Berea was cleaned with the selected solvents. However, for all
three carbonates the cleaning solvents behaved differently in the presence of a basic type oil.
Figure B2: Effects of selected cleaning solvents on the wettability of Berea, Austin chalk,
Silurian dolomite, and Indiana limestone in the presence of decane + basic (quinoline) SAC and
DI water.
As illustrated in Figure B2, IPA and toluene did not alter chalk wettability; but the
methanol/chloroform mixture slightly shifted its wettability towards oil-wet. Note that previously
when decane was used as the oleic phase, the methanol/chloroform mixture had the opposite effect
on chalk where the wettability shifted towards water-wet. Similar to the previous case (decane-DI
water-dolomite), both IPA and methanol-chloroform mixtures shift the wettability towards oil-wet
but not as significantly as the decane case. Toluene had no effect on dolomite wettability when the
oleic phase was basic, as opposed to the decane case where toluene shifted the wettability towards
an oil-wet state. Lastly, all three solvents shifted the wettability of limestone towards water-wet.

157
Note that the effect of IPA and methanol-chloroform solvent on the wettability of limestone differs
in the presence of decane verses decane + 4000ppm Quinoline.
B3. Decane + Acidic SAC - DI water - Rock system
In this set of experiments, DI water was used as the aqueous phase and 4000 ppm of
myristic acid was added to decane to simulate an acidic oil. As previously discussed, myristic acid
has a tendency to strongly interact with all four rock types, especially the carbonates. Carbonate
wettability was unaffected by all three solvents. Toluene shifted Berea wettability towards oil-wet.
A subsequent set of experiments was conducted but using an acid SAC that did not bind as
strongly to the rocks as myristic acid. In this set of experiments, DI water was used as the aqueous
phase and 4000 ppm of naphthenic acid was added to decane. Similar to myristic acid, naphthenic
acid is also a long-chained oxygen SAC that has a tendency to shift the wettability of the four rock
types to oil-wet, however, not as strongly oil-wet as myristic acid does. Of the three solvents,
toluene shifted Berea wettability towards oil-wet as seen in Figure B4. In the case of chalk, IPA
and methanol/chloroform mixture shifted the wettability towards water-wet. All three solvents
shifted dolomite wettability to oil-wet but not as significantly as the decane-dolomite-DI water
case. Lastly, both IPA and methanol-chloroform mixture shifted the wettability of limestone
towards oil-wet. Toluene did not have an effect on limestone in the presence of decane + 4000
ppm naphthenic acid.

158
Figure B3: Effects of the selected cleaning solvents on the wettability of Berea, Austin chalk,
Silurian dolomite, and Indiana limestone in the presence of myristic acid.
Figure B4: Effects of the selected cleaning solvents on the wettability of Berea, Austin chalk,
Silurian dolomite, and Indiana limestone in the presence of naphthenic acid.

159
In summary, the effectiveness of a cleaning fluid is a function of the rock mineralogy, oil-
type, brine type, contaminant type, etc. A particular cleaning solvent might be effective in cleaning
chalk and limestone, without altering wettability, however, this may might not be true for dolomite.
Therefore, blanket statements about cleaning solvents being effective in cleaning ‘carbonates’ or
‘sandstone’ should not be made unless they have been tested for all applicable conditions. In
addition, it was observed that a particular cleaning solvent may have different effects on a rock’s
ability to interact with different oil-types. I therefore propose that the way to find the most
appropriate cleaning solvent for a particular oil-brine-rock system is by testing different cleaning
solvents. This can be a time-consuming process when using conventional wettability-measuring
techniques: but it can be done very rapidly with the MFT. Prior to the coreflood experiment, a
small section of the rock would be crushed and sieved to an ideal size. Several cleaning solvents
of interested would then be tested and their wettability would be compared to that of a fresh sample.
The cleaning solvent(s) displaying the least alteration of wettability compared to the fresh sample
would then be used in core cleaning.
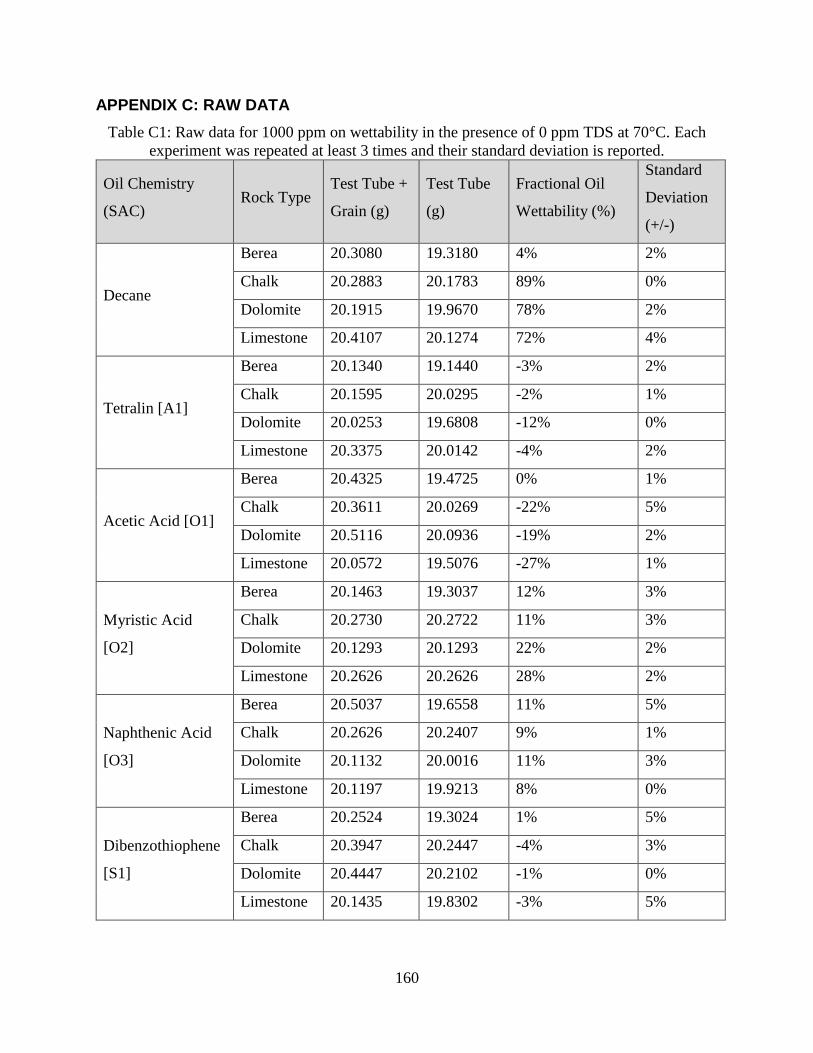
160
APPENDIX C: RAW DATA
Table C1: Raw data for 1000 ppm on wettability in the presence of 0 ppm TDS at 70°C. Each
experiment was repeated at least 3 times and their standard deviation is reported.
Oil Chemistry
(SAC) Rock Type
Test Tube +
Grain (g)
Test Tube
(g)
Fractional Oil
Wettability (%)
Standard
Deviation
(+/-)
Decane
Berea 20.3080 19.3180 4% 2%
Chalk 20.2883 20.1783 89% 0%
Dolomite 20.1915 19.9670 78% 2%
Limestone 20.4107 20.1274 72% 4%
Tetralin [A1]
Berea 20.1340 19.1440 -3% 2%
Chalk 20.1595 20.0295 -2% 1%
Dolomite 20.0253 19.6808 -12% 0%
Limestone 20.3375 20.0142 -4% 2%
Acetic Acid [O1]
Berea 20.4325 19.4725 0% 1%
Chalk 20.3611 20.0269 -22% 5%
Dolomite 20.5116 20.0936 -19% 2%
Limestone 20.0572 19.5076 -27% 1%
Myristic Acid
[O2]
Berea 20.1463 19.3037 12% 3%
Chalk 20.2730 20.2722 11% 3%
Dolomite 20.1293 20.1293 22% 2%
Limestone 20.2626 20.2626 28% 2%
Naphthenic Acid
[O3]
Berea 20.5037 19.6558 11% 5%
Chalk 20.2626 20.2407 9% 1%
Dolomite 20.1132 20.0016 11% 3%
Limestone 20.1197 19.9213 8% 0%
Dibenzothiophene
[S1]
Berea 20.2524 19.3024 1% 5%
Chalk 20.3947 20.2447 -4% 3%
Dolomite 20.4447 20.2102 -1% 0%
Limestone 20.1435 19.8302 -3% 5%
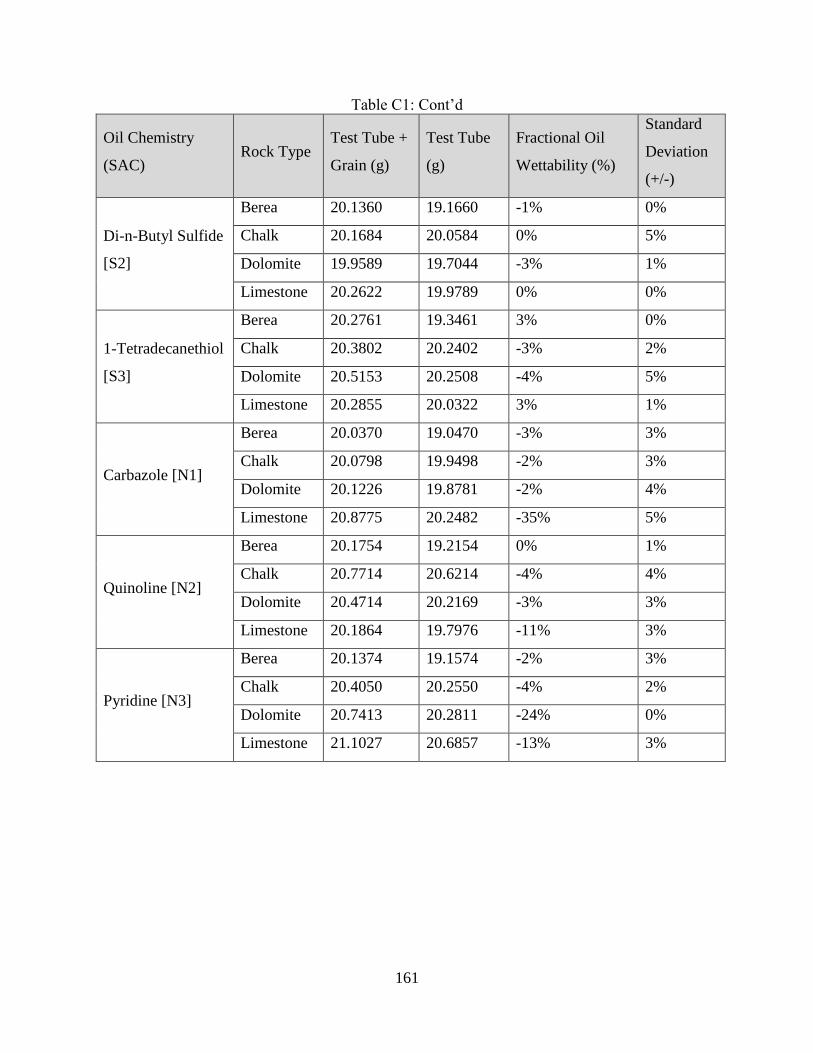
161
Table C1: Cont’d
Oil Chemistry
(SAC) Rock Type
Test Tube +
Grain (g)
Test Tube
(g)
Fractional Oil
Wettability (%)
Standard
Deviation
(+/-)
Di-n-Butyl Sulfide
[S2]
Berea 20.1360 19.1660 -1% 0%
Chalk 20.1684 20.0584 0% 5%
Dolomite 19.9589 19.7044 -3% 1%
Limestone 20.2622 19.9789 0% 0%
1-Tetradecanethiol
[S3]
Berea 20.2761 19.3461 3% 0%
Chalk 20.3802 20.2402 -3% 2%
Dolomite 20.5153 20.2508 -4% 5%
Limestone 20.2855 20.0322 3% 1%
Carbazole [N1]
Berea 20.0370 19.0470 -3% 3%
Chalk 20.0798 19.9498 -2% 3%
Dolomite 20.1226 19.8781 -2% 4%
Limestone 20.8775 20.2482 -35% 5%
Quinoline [N2]
Berea 20.1754 19.2154 0% 1%
Chalk 20.7714 20.6214 -4% 4%
Dolomite 20.4714 20.2169 -3% 3%
Limestone 20.1864 19.7976 -11% 3%
Pyridine [N3]
Berea 20.1374 19.1574 -2% 3%
Chalk 20.4050 20.2550 -4% 2%
Dolomite 20.7413 20.2811 -24% 0%
Limestone 21.1027 20.6857 -13% 3%

162
Table C2: Raw data for 2000 ppm on wettability in the presence of 0 ppm brine at 70°C. Each
experiment was repeated at least 3 times and their standard deviation is reported.
Oil Chemistry
(SAC) Rock Type
Test Tube +
Grain (g)
Test Tube
(g)
Fractional Oil
Wettability (%)
Standard
Deviation
(+/-)
Decane
Berea 20.8553 19.3180 8% 0%
Chalk 20.7938 20.1783 88% 5%
Dolomite 20.7770 19.9670 69% 1%
Limestone 8.0000 20.1274 75% 1%
Tetralin [A1]
Berea 20.7252 19.7852 -2% 2%
Chalk 20.0183 19.8583 -4% 0%
Dolomite 20.2951 19.8846 -10% 3%
Limestone 20.9166 20.6266 -4% 5%
Acetic Acid [O1]
Berea 20.5387 19.5887 -3% 2%
Chalk 20.7446 20.3913 -23% 3%
Dolomite 20.8549 20.1967 -35% 4%
Limestone 20.3915 19.8062 -34% 4%
Myristic Acid
[O2]
Berea 20.0390 19.4282 31% 1%
Chalk 20.3543 20.3443 11% 5%
Dolomite 20.4820 20.3966 22% 5%
Limestone 20.4236 20.4570 28% 2%
Naphthenic Acid
[O3]
Berea 20.3108 19.5086 12% 2%
Chalk 20.0349 20.0053 9% 2%
Dolomite 20.8855 20.7294 15% 4%
Limestone 20.8905 20.7430 10% 2%
Dibenzothiophene
[S1]
Berea 20.3731 19.4331 -2% 0%
Chalk 20.6287 20.3787 -13% 0%
Dolomite 20.5726 20.2226 -4% 3%
Limestone 20.0987 19.8287 -2% 0%

163
Table C2: Cont’d
Oil Chemistry
(SAC) Rock Type
Test Tube +
Grain (g)
Test Tube
(g)
Fractional Oil
Wettability (%)
Standard
Deviation
(+/-)
Di-n-Butyl Sulfide
[S2]
Berea 20.3670 19.4170 -3% 4%
Chalk 20.4512 20.3312 0% 3%
Dolomite 20.3715 19.9811 -8% 1%
Limestone 20.2956 20.0456 0% 0%
1-Tetradecanethiol
[S3]
Berea 20.3067 19.4067 2% 4%
Chalk 20.9591 20.9274 9% 1%
Dolomite 20.7736 20.5393 8% 0%
Limestone 20.8081 20.6581 10% 1%
Carbazole [N1]
Berea 20.5716 19.6116 -4% 5%
Chalk 20.6977 20.5577 -2% 1%
Dolomite 20.8729 19.9210 -64% 5%
Limestone 20.6677 19.7966 -62% 1%
Quinoline [N2]
Berea 20.8865 19.9465 -2% 3%
Chalk 20.4730 20.2964 -6% 5%
Dolomite 20.1173 19.7322 -8% 2%
Limestone 20.1717 19.7890 -13% 0%
Pyridine [N3]
Berea 20.5236 19.5736 -3% 3%
Chalk 20.1586 19.9186 -12% 4%
Dolomite 20.5574 19.9406 -31% 0%
Limestone 20.8790 20.4836 -15% 5%

164
Table C3: Raw data for 4000 ppm on wettability in the presence of DI water at 70°C. Each
experiment was repeated at least 3 times and their standard deviation is reported.
Oil Chemistry
(SAC) Rock Type
Test Tube +
Grain (g)
Test Tube
(g)
Fractional Oil
Wettability (%)
Standard
Deviation
(+/-)
Decane
Berea 20.8553 19.3180 5% 3%
Chalk 20.7938 20.1783 89% 0%
Dolomite 20.7770 19.9670 78% 5%
Limestone 20.2578 20.1274 72% 4%
Tetralin [A1]
Berea 20.7252 19.7552 -2% 5%
Chalk 20.0183 19.7785 -13% 2%
Dolomite 20.2951 19.9702 -10% 2%
Limestone 20.9166 20.4414 -19% 1%
Acetic Acid [O1]
Berea 20.5387 19.5687 -2% 3%
Chalk 20.7446 20.3882 -25% 2%
Dolomite 20.8549 20.2599 -37% 3%
Limestone 20.3915 19.5355 -57% 3%
Myristic Acid
[O2]
Berea 20.0390 19.4834 39% 0%
Chalk 20.3543 20.3543 11% 1%
Dolomite 20.4820 20.4820 22% 2%
Limestone 20.4236 20.4236 28% 3%
Naphthenic Acid
[O3]
Berea 20.3108 19.4933 13% 3%
Chalk 20.0349 20.0181 9% 4%
Dolomite 20.8855 20.8462 19% 4%
Limestone 20.8905 20.7028 10% 2%
Dibenzothiophene
[S1]
Berea 20.3731 19.4331 1% 0%
Chalk 20.6287 20.3378 -18% 0%
Dolomite 20.5726 20.2464 -10% 5%
Limestone 20.0987 19.7253 -9% 5%

165
Table C3: Cont’d
Oil Chemistry
(SAC) Rock Type
Test Tube +
Grain (g)
Test Tube
(g)
Fractional Oil
Wettability (%)
Standard
Deviation
(+/-)
Di-n-Butyl Sulfide
[S2]
Berea 20.3670 19.3770 -4% 1%
Chalk 20.4512 20.2637 -8% 2%
Dolomite 20.3715 19.9668 -18% 0%
Limestone 20.2956 19.9422 -7% 3%
1-Tetradecanethiol
[S3]
Berea 20.3067 19.3867 3% 4%
Chalk 20.9591 20.9808 13% 5%
Dolomite 20.7736 20.7526 20% 4%
Limestone 20.8081 20.7048 18% 5%
Carbazole [N1]
Berea 20.5716 19.5816 -4% 4%
Chalk 20.6977 19.8845 -70% 0%
Dolomite 20.8729 19.9232 -73% 5%
Limestone 20.6677 19.6966 -69% 5%
Quinoline [N2]
Berea 20.8865 19.8965 -4% 3%
Chalk 20.4730 20.1885 -18% 5%
Dolomite 20.1173 19.6112 -28% 5%
Limestone 20.1717 19.7434 -15% 1%
Pyridine [N3]
Berea 20.5236 19.5336 -4% 5%
Chalk 20.1586 19.6881 -36% 1%
Dolomite 20.5574 20.0231 -31% 1%
Limestone 20.8790 20.3255 -27% 4%

166
Table C4: Raw data for 2000 ppm of SAC on rock wettability in the presence of 100,000 ppm
TDS brine at 25°C. Each experiment was repeated at least 3 times and their standard deviation is
reported.
Oil Chemistry
(SAC) Rock Type
Test Tube +
Grain (g)
Test Tube
(g)
Fractional Oil
Wettability (%)
Standard
Deviation
(+/-)
Decane
Berea 21.1488 20.2288 0% 5%
Chalk 21.1641 20.8941 -15% 1%
Dolomite 20.9863 20.5563 -12% 4%
Limestone 21.0656 20.7256 -9% 3%
Tetralin [A1]
Berea 20.8073 19.8473 -4% 4%
Chalk 20.9572 20.8972 6% 0%
Dolomite 21.1613 20.8513 0% 2%
Limestone 21.0000 20.8100 6% 2%
Acetic Acid [O1]
Berea 20.7993 19.9493 7% 4%
Chalk 20.7368 20.4668 -15% 2%
Dolomite 20.5513 20.1513 -9% 5%
Limestone 20.7862 20.4162 -12% 2%
Myristic Acid
[O2]
Berea 20.3478 19.4578 3% 1%
Chalk 20.6133 20.3353 -16% 4%
Dolomite 20.5191 20.0711 -14% 1%
Limestone 20.4015 19.9115 -24% 1%
Naphthenic Acid
[O3]
Berea 20.5222 19.6022 0% 0%
Chalk 20.4437 20.3237 0% 0%
Dolomite 20.4060 20.1060 1% 1%
Limestone 21.0022 20.8022 5% 2%
Dibenzothiophene
[S1]
Berea 20.4235 19.5435 4% 3%
Chalk 21.0051 20.9051 2% 0%
Dolomite 21.2351 20.9451 2% 2%
Limestone 20.5198 20.3098 4% 4%

167
Table C4: Cont’d
Oil Chemistry
(SAC) Rock Type
Test Tube +
Grain (g)
Test Tube
(g)
Fractional Oil
Wettability (%)
Standard
Deviation
(+/-)
Di-n-Butyl Sulfide
[S2]
Berea 20.6224 19.7424 4% 4%
Chalk 21.0068 20.8868 0% 5%
Dolomite 21.0274 20.7374 2% 3%
Limestone 20.4925 20.2925 5% 4%
1-Tetradecanethiol
[S3]
Berea 20.7846 19.8746 1% 4%
Chalk 20.4643 20.3943 5% 5%
Dolomite 20.6832 20.4132 4% 5%
Limestone 20.8094 20.5894 3% 2%
Carbazole [N1]
Berea 20.4343 19.5543 4% 2%
Chalk 21.1765 21.0865 3% 5%
Dolomite 20.9672 20.7072 5% 5%
Limestone 20.7306 20.5306 5% 5%
Quinoline [N2]
Berea 20.5330 19.6330 2% 4%
Chalk 20.6132 20.5032 1% 5%
Dolomite 20.6926 20.4226 4% 0%
Limestone 20.9860 20.7460 1% 0%
Pyridine [N3]
Berea 20.5531 19.6431 1% 0%
Chalk 20.3823 20.2623 0% 0%
Dolomite 21.1220 20.8620 5% 2%
Limestone 20.8233 20.6233 5% 0%

168
Table C5: Raw data for 2000 ppm of SAC on rock wettability in the presence of 100,000 ppm
TDS brine at 70°C. Each experiment was repeated at least 3 times and their standard deviation is
reported.
Oil Chemistry
(SAC) Rock Type
Test Tube +
Grain (g)
Test Tube
(g)
Fractional Oil
Wettability (%)
Standard
Deviation
(+/-)
Decane
Berea 21.5585 20.6285 -1% 3%
Chalk 21.5370 21.3280 -9% 3%
Dolomite 21.6919 21.2959 -9% 0%
Limestone 21.1488 20.7573 -14% 2%
Tetralin [A1]
Berea 21.1641 20.0841 -16% 4%
Chalk 20.9863 21.0563 19% 2%
Dolomite 21.0656 20.9066 15% 1%
Limestone 20.8073 20.7233 17% 0%
Acetic Acid [O1]
Berea 20.9572 20.1372 10% 5%
Chalk 21.1613 20.7713 -27% 0%
Dolomite 21.0000 20.5400 -15% 4%
Limestone 20.7993 20.3693 -18% 3%
Myristic Acid
[O2]
Berea 20.7368 19.9068 9% 1%
Chalk 20.5513 20.0913 -34% 1%
Dolomite 20.7862 20.2352 -24% 0%
Limestone 20.3478 19.7978 -30% 1%
Naphthenic Acid
[O3]
Berea 20.6133 19.7233 3% 0%
Chalk 20.5191 20.4291 3% 3%
Dolomite 20.4015 20.1415 5% 3%
Limestone 20.5222 20.2822 1% 1%
Dibenzothiophene
[S1]
Berea 20.4437 19.5537 3% 3%
Chalk 20.4060 20.3060 2% 4%
Dolomite 21.0022 20.7222 3% 5%
Limestone 20.4235 20.1735 0% 2%

169
Table C5: Cont’d
Oil Chemistry
(SAC) Rock Type
Test Tube +
Grain (g)
Test Tube
(g)
Fractional Oil
Wettability (%)
Standard
Deviation
(+/-)
Di-n-Butyl Sulfide
[S2]
Berea 21.0051 20.1951 11% 4%
Chalk 21.2351 20.9851 -13% 5%
Dolomite 20.5198 20.0098 -20% 5%
Limestone 20.6224 20.2624 -11% 0%
1-Tetradecanethiol
[S3]
Berea 21.0068 19.9368 -15% 1%
Chalk 21.0274 20.9174 1% 5%
Dolomite 20.4925 20.2025 2% 1%
Limestone 20.7846 20.5746 4% 3%
Carbazole [N1]
Berea 20.4643 19.5843 4% 0%
Chalk 20.6832 20.5832 2% 5%
Dolomite 20.8094 20.5594 6% 4%
Limestone 20.4343 20.1843 0% 1%
Quinoline [N2]
Berea 21.1765 20.3065 5% 0%
Chalk 20.9672 20.8972 5% 5%
Dolomite 20.7306 20.4206 0% 1%
Limestone 20.5330 20.3330 5% 5%
Pyridine [N3]
Berea 20.6132 19.7232 3% 3%
Chalk 20.6926 20.6026 3% 5%
Dolomite 20.9860 20.6960 2% 0%
Limestone 20.5531 20.3331 3% 5%

170
Table C6: Raw data for 2000 ppm of SAC on rock wettability in the presence of 100,000 ppm
TDS brine at 110°C. Each experiment was repeated at least 3 times and their standard deviation
is reported.
Oil Chemistry
(SAC) Rock Type
Test Tube +
Grain (g)
Test Tube
(g)
Fractional Oil
Wettability (%)
Standard
Deviation
(+/-)
Decane
Berea 20.3682 19.4082 -4% 1%
Chalk 20.1676 20.0476 0% 2%
Dolomite 19.9829 19.4129 -26% 0%
Limestone 20.2071 19.8171 -14% 3%
Tetralin [A1]
Berea 20.0140 18.9440 -15% 0%
Chalk 20.6201 20.7101 21% 3%
Dolomite 20.4286 20.2686 15% 0%
Limestone 20.5961 20.5361 19% 1%
Acetic Acid [O1]
Berea 20.2027 19.3927 11% 5%
Chalk 19.9127 19.4627 -33% 4%
Dolomite 19.7946 19.3346 -15% 1%
Limestone 20.7276 20.2776 -20% 2%
Myristic Acid
[O2]
Berea 20.1364 19.3164 10% 0%
Chalk 20.5647 19.9147 -53% 1%
Dolomite 20.0383 19.3983 -33% 1%
Limestone 19.9527 19.3227 -38% 0%
Naphthenic Acid
[O3]
Berea 20.4331 19.5231 1% 3%
Chalk 20.1930 20.1130 4% 5%
Dolomite 20.3884 20.1084 3% 0%
Limestone 20.2845 20.0845 5% 5%
Dibenzothiophene
[S1]
Berea 19.8354 18.9554 4% 2%
Chalk 20.0017 19.9017 2% 0%
Dolomite 20.3381 20.0481 2% 1%
Limestone 19.8855 19.6855 5% 3%

171
Table C6: Cont’d
Oil Chemistry
(SAC) Rock Type
Test Tube +
Grain (g)
Test Tube
(g)
Fractional Oil
Wettability (%)
Standard
Deviation
(+/-)
Di-n-Butyl Sulfide
[S2]
Berea 20.0753 19.2753 12% 1%
Chalk 19.8398 19.5398 -18% 2%
Dolomite 20.1592 19.6792 -17% 5%
Limestone 20.0195 19.6295 -14% 3%
1-Tetradecanethiol
[S3]
Berea 19.9415 18.8515 -17% 1%
Chalk 20.0745 19.9945 4% 2%
Dolomite 20.6386 20.3386 1% 4%
Limestone 19.8153 19.6153 5% 1%
Carbazole [N1]
Berea 20.5834 19.6834 2% 2%
Chalk 20.5615 20.4415 0% 5%
Dolomite 20.1827 19.9327 6% 5%
Limestone 19.9509 19.7509 5% 1%
Quinoline [N2]
Berea 19.8773 19.9573 100% 5%
Chalk 19.8238 19.7738 7% 0%
Dolomite 20.0537 19.6837 -6% 5%
Limestone 20.2601 20.0701 6% 3%
Pyridine [N3]
Berea 20.2388 19.3288 1% 2%
Chalk 20.2489 20.1489 2% 3%
Dolomite 20.6160 20.3160 1% 2%
Limestone 20.5945 20.3545 1% 4%

172
Table C7: Raw data for 2000 ppm of SAC on rock wettability in the presence of 10,000 ppm
TDS brine at 25°C. Each experiment was repeated at least 3 times and their standard deviation is
reported.
Oil Chemistry
(SAC) Rock Type
Test Tube +
Grain (g)
Test Tube
(g)
Fractional Oil
Wettability (%)
Standard
Deviation
(+/-)
Decane
Berea 19.6483 18.7283 0% 3%
Chalk 19.2504 19.1304 0% 5%
Dolomite 19.0686 18.7386 -2% 4%
Limestone 19.7717 19.4717 -5% 2%
Tetralin [A1]
Berea 19.4705 18.5305 -2% 1%
Chalk 19.6478 19.5278 0% 3%
Dolomite 19.5141 19.2341 3% 1%
Limestone 19.4426 19.2426 5% 0%
Acetic Acid [O1]
Berea 19.8648 19.0348 9% 2%
Chalk 19.6837 19.4837 -8% 1%
Dolomite 19.3584 19.0284 -2% 1%
Limestone 18.9294 18.6194 -6% 0%
Myristic Acid
[O2]
Berea 19.3821 18.4821 2% 1%
Chalk 19.2398 19.0298 -9% 2%
Dolomite 19.5387 19.1617 -7% 5%
Limestone 19.0257 18.6552 -12% 4%
Naphthenic Acid
[O3]
Berea 19.8850 18.9350 -3% 3%
Chalk 19.7368 19.5868 -3% 2%
Dolomite 19.4547 19.1247 -2% 0%
Limestone 19.6615 19.3815 -3% 2%
Dibenzothiophene
[S1]
Berea 19.7024 18.7724 -1% 5%
Chalk 19.1774 19.0374 -2% 4%
Dolomite 19.0177 18.6877 -2% 5%
Limestone 19.0746 18.8146 -1% 4%

173
Table C7: Cont’d
Oil Chemistry
(SAC) Rock Type
Test Tube +
Grain (g)
Test Tube
(g)
Fractional Oil
Wettability (%)
Standard
Deviation
(+/-)
Di-n-Butyl Sulfide
[S2]
Berea 19.5537 18.6337 0% 2%
Chalk 19.2228 19.0828 -2% 3%
Dolomite 18.9320 18.5820 -4% 0%
Limestone 19.0360 18.7460 -4% 5%
1-Tetradecanethiol
[S3]
Berea 19.5899 18.6199 -5% 3%
Chalk 19.6783 19.5483 -1% 2%
Dolomite 19.7265 19.4165 0% 0%
Limestone 19.3963 19.0963 -5% 3%
Carbazole [N1]
Berea 19.7574 18.7874 -5% 1%
Chalk 19.0906 18.9506 -2% 4%
Dolomite 19.2570 18.9170 -3% 0%
Limestone 19.7107 19.4607 0% 1%
Quinoline [N2]
Berea 19.7598 18.7898 -5% 3%
Chalk 19.7349 19.5949 -2% 5%
Dolomite 19.8828 19.5628 -1% 5%
Limestone 19.2471 18.9671 -3% 0%
Pyridine [N3]
Berea 19.3643 18.4143 -3% 0%
Chalk 19.5511 19.4011 -3% 3%
Dolomite 19.8424 19.4824 -5% 3%
Limestone 18.9017 18.6417 -1% 4%

174
Table C8: Raw data for 2000 ppm of SAC on rock wettability in the presence of 10,000 ppm
TDS brine at 70°C. Each experiment was repeated at least 3 times and their standard deviation is
reported.
Oil Chemistry
(SAC) Rock Type
Test Tube +
Grain (g)
Test Tube
(g)
Fractional Oil
Wettability (%)
Standard
Deviation
(+/-)
Decane
Berea 20.3456 19.4156 -1% 4%
Chalk 21.1707 21.0107 -4% 5%
Dolomite 20.2221 19.8126 -10% 0%
Limestone 20.9172 20.5772 -9% 1%
Tetralin [A1]
Berea 20.8441 19.7341 -19% 5%
Chalk 21.1205 21.0685 7% 2%
Dolomite 20.6875 20.4275 5% 4%
Limestone 20.6615 20.4615 5% 3%
Acetic Acid [O1]
Berea 20.8098 19.9998 11% 4%
Chalk 21.1035 20.8235 -16% 0%
Dolomite 20.3433 19.9733 -6% 4%
Limestone 20.6301 20.2801 -10% 0%
Myristic Acid
[O2]
Berea 20.5648 19.7548 11% 5%
Chalk 20.4932 20.2232 -15% 4%
Dolomite 20.5159 19.9359 -27% 4%
Limestone 21.0832 20.6932 -14% 0%
Naphthenic Acid
[O3]
Berea 20.9844 20.0544 -1% 0%
Chalk 20.5403 20.3703 -5% 0%
Dolomite 20.3093 19.9693 -3% 1%
Limestone 20.4867 20.2167 -2% 3%
Dibenzothiophene
[S1]
Berea 20.2779 19.3279 -3% 4%
Chalk 20.3580 20.2080 -3% 4%
Dolomite 20.9617 20.6217 -3% 5%
Limestone 20.6061 20.3361 -2% 3%

175
Table C8: Cont’d
Oil Chemistry
(SAC) Rock Type
Test Tube +
Grain (g)
Test Tube
(g)
Fractional Oil
Wettability (%)
Standard
Deviation
(+/-)
Di-n-Butyl Sulfide
[S2]
Berea 20.6983 19.8583 8% 4%
Chalk 20.5460 20.3160 -11% 0%
Dolomite 21.1153 20.6653 -14% 5%
Limestone 21.0586 20.7286 -8% 2%
1-Tetradecanethiol
[S3]
Berea 20.3441 19.2741 -15% 2%
Chalk 21.1495 20.9795 -5% 5%
Dolomite 20.3268 19.9268 -9% 5%
Limestone 20.4804 20.1504 -8% 5%
Carbazole [N1]
Berea 20.4955 19.5355 -4% 2%
Chalk 20.5021 20.4321 5% 2%
Dolomite 20.6208 20.4008 9% 2%
Limestone 21.0758 20.7758 -5% 5%
Quinoline [N2]
Berea 20.4876 19.5376 -3% 0%
Chalk 21.1740 21.0140 -4% 2%
Dolomite 20.7749 20.4549 -1% 0%
Limestone 20.9540 20.6640 -4% 3%
Pyridine [N3]
Berea 20.4218 19.4618 -4% 2%
Chalk 20.9909 20.8709 0% 4%
Dolomite 21.0733 20.7533 -1% 3%
Limestone 21.1039 20.8439 -1% 5%

176
Table C9: Raw data for 2000 ppm of SAC on rock wettability in the presence of 10,000 ppm
TDS brine at 110°C. Each experiment was repeated at least 3 times and their standard deviation
is reported.
Oil Chemistry
(SAC) Rock Type
Test Tube +
Grain (g)
Test Tube
(g)
Fractional Oil
Wettability (%)
Standard
Deviation
(+/-)
Decane
Berea 20.6102 19.6602 -3% 5%
Chalk 21.0845 20.8645 -10% 1%
Dolomite 21.1483 20.5983 -24% 5%
Limestone 20.8165 20.4565 -11% 5%
Tetralin [A1]
Berea 20.5411 19.4511 -17% 0%
Chalk 21.1656 21.1356 9% 0%
Dolomite 20.9011 20.6411 5% 2%
Limestone 20.2258 20.0458 7% 5%
Acetic Acid [O1]
Berea 20.2421 19.4321 11% 2%
Chalk 20.9819 20.6719 -19% 2%
Dolomite 21.1909 20.8109 -7% 5%
Limestone 21.1405 20.7705 -12% 0%
Myristic Acid
[O2]
Berea 21.1926 20.3726 10% 0%
Chalk 21.1106 20.6106 -38% 3%
Dolomite 20.5785 19.9085 -36% 5%
Limestone 20.2650 19.6950 -32% 2%
Naphthenic Acid
[O3]
Berea 20.4969 19.5469 -3% 2%
Chalk 20.7719 20.6019 -5% 4%
Dolomite 21.0187 20.6987 -1% 0%
Limestone 21.1523 20.9023 0% 5%
Dibenzothiophene
[S1]
Berea 21.1009 20.1309 -5% 1%
Chalk 20.2280 20.1080 0% 5%
Dolomite 20.7060 20.3660 -3% 3%
Limestone 21.0596 20.7996 -1% 3%

177
Table C9: Cont’d
Oil Chemistry
(SAC) Rock Type
Test Tube +
Grain (g)
Test Tube
(g)
Fractional Oil
Wettability (%)
Standard
Deviation
(+/-)
Di-n-Butyl Sulfide
[S2]
Berea 20.8315 19.9915 8% 5%
Chalk 21.1603 20.8703 -17% 3%
Dolomite 21.0520 20.6120 -13% 4%
Limestone 20.9743 20.6343 -9% 4%
1-Tetradecanethiol
[S3]
Berea 21.1862 20.1362 -13% 3%
Chalk 21.0623 20.8823 -6% 2%
Dolomite 21.0781 20.6981 -7% 5%
Limestone 20.9840 20.6040 -13% 4%
Carbazole [N1]
Berea 20.8785 19.9185 -4% 0%
Chalk 20.6386 20.5286 1% 1%
Dolomite 20.7722 20.5422 8% 0%
Limestone 20.6435 20.4635 7% 5%
Quinoline [N2]
Berea 20.2855 19.3655 0% 5%
Chalk 21.0756 20.9556 0% 5%
Dolomite 20.9899 20.6299 -5% 5%
Limestone 20.5316 20.2316 -5% 5%
Pyridine [N3]
Berea 20.6853 19.7553 -1% 4%
Chalk 21.0093 20.8393 -5% 5%
Dolomite 20.2631 19.9531 0% 2%
Limestone 20.2392 19.9792 -1% 0%
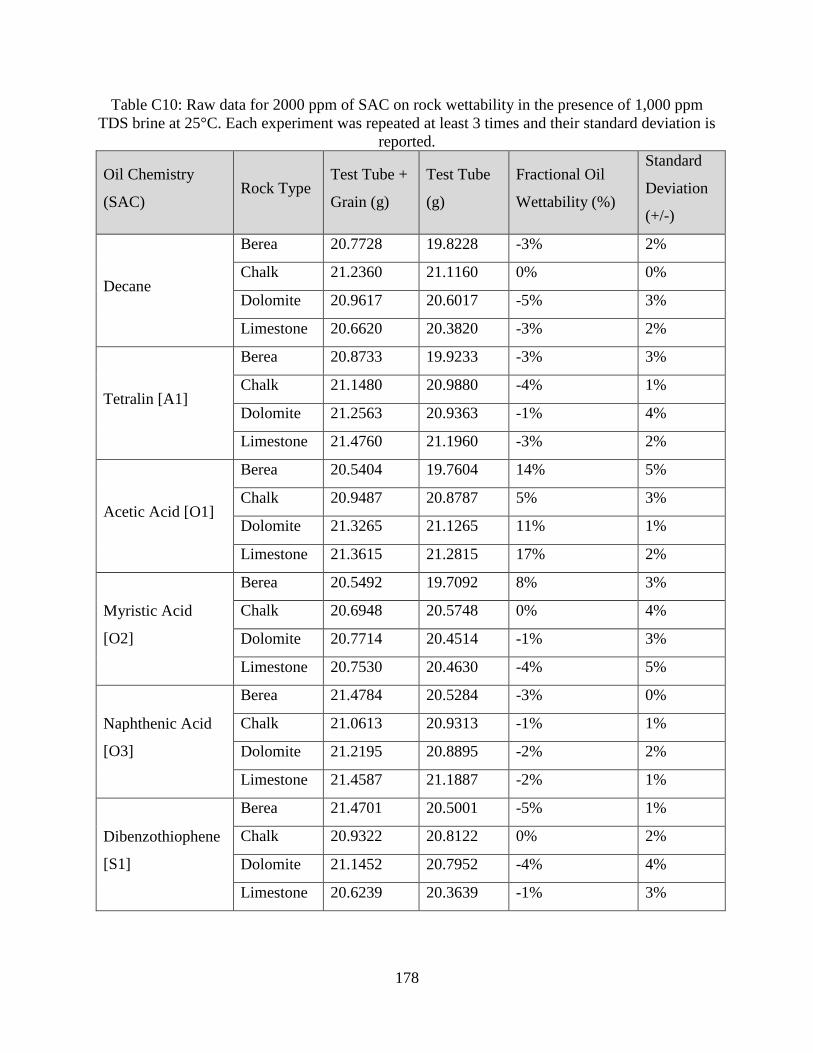
178
Table C10: Raw data for 2000 ppm of SAC on rock wettability in the presence of 1,000 ppm
TDS brine at 25°C. Each experiment was repeated at least 3 times and their standard deviation is
reported.
Oil Chemistry
(SAC) Rock Type
Test Tube +
Grain (g)
Test Tube
(g)
Fractional Oil
Wettability (%)
Standard
Deviation
(+/-)
Decane
Berea 20.7728 19.8228 -3% 2%
Chalk 21.2360 21.1160 0% 0%
Dolomite 20.9617 20.6017 -5% 3%
Limestone 20.6620 20.3820 -3% 2%
Tetralin [A1]
Berea 20.8733 19.9233 -3% 3%
Chalk 21.1480 20.9880 -4% 1%
Dolomite 21.2563 20.9363 -1% 4%
Limestone 21.4760 21.1960 -3% 2%
Acetic Acid [O1]
Berea 20.5404 19.7604 14% 5%
Chalk 20.9487 20.8787 5% 3%
Dolomite 21.3265 21.1265 11% 1%
Limestone 21.3615 21.2815 17% 2%
Myristic Acid
[O2]
Berea 20.5492 19.7092 8% 3%
Chalk 20.6948 20.5748 0% 4%
Dolomite 20.7714 20.4514 -1% 3%
Limestone 20.7530 20.4630 -4% 5%
Naphthenic Acid
[O3]
Berea 21.4784 20.5284 -3% 0%
Chalk 21.0613 20.9313 -1% 1%
Dolomite 21.2195 20.8895 -2% 2%
Limestone 21.4587 21.1887 -2% 1%
Dibenzothiophene
[S1]
Berea 21.4701 20.5001 -5% 1%
Chalk 20.9322 20.8122 0% 2%
Dolomite 21.1452 20.7952 -4% 4%
Limestone 20.6239 20.3639 -1% 3%

179
Table C10: Cont’d
Oil Chemistry
(SAC) Rock Type
Test Tube +
Grain (g)
Test Tube
(g)
Fractional Oil
Wettability (%)
Standard
Deviation
(+/-)
Di-n-Butyl Sulfide
[S2]
Berea 20.6388 19.6788 -4% 0%
Chalk 20.8073 20.6673 -2% 3%
Dolomite 21.2967 20.9767 -1% 2%
Limestone 21.0803 20.8203 -1% 0%
1-Tetradecanethiol
[S3]
Berea 21.3630 20.4330 -1% 0%
Chalk 20.7893 20.6493 -2% 5%
Dolomite 21.0095 20.4595 -24% 0%
Limestone 21.1568 20.6168 -29% 4%
Carbazole [N1]
Berea 21.4020 20.4820 0% 5%
Chalk 20.5244 20.3644 -4% 4%
Dolomite 20.6789 20.3389 -3% 2%
Limestone 20.6689 20.4189 0% 3%
Quinoline [N2]
Berea 21.3724 20.4024 -5% 3%
Chalk 21.4557 21.2857 -5% 3%
Dolomite 20.7162 20.3562 -5% 2%
Limestone 21.3083 21.0183 -4% 3%
Pyridine [N3]
Berea 21.3893 20.4193 -5% 1%
Chalk 21.1879 21.0479 -2% 5%
Dolomite 21.3706 21.0506 -1% 1%
Limestone 20.5943 20.3343 -1% 2%
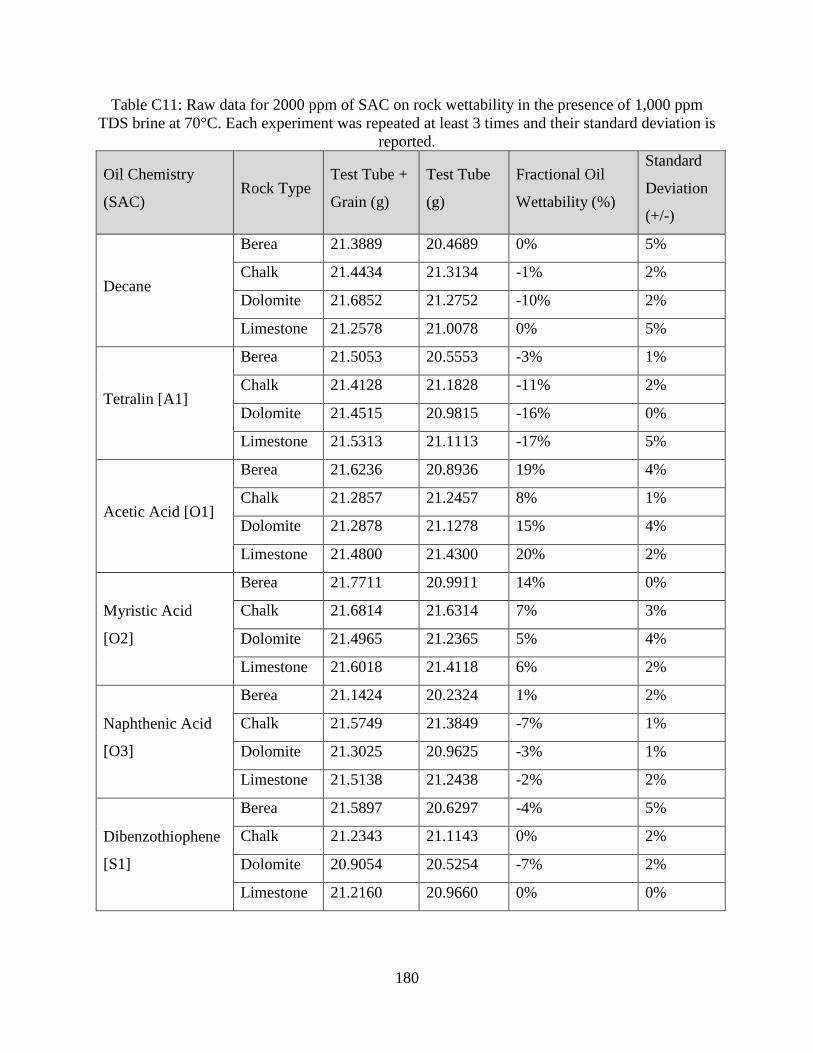
180
Table C11: Raw data for 2000 ppm of SAC on rock wettability in the presence of 1,000 ppm
TDS brine at 70°C. Each experiment was repeated at least 3 times and their standard deviation is
reported.
Oil Chemistry
(SAC) Rock Type
Test Tube +
Grain (g)
Test Tube
(g)
Fractional Oil
Wettability (%)
Standard
Deviation
(+/-)
Decane
Berea 21.3889 20.4689 0% 5%
Chalk 21.4434 21.3134 -1% 2%
Dolomite 21.6852 21.2752 -10% 2%
Limestone 21.2578 21.0078 0% 5%
Tetralin [A1]
Berea 21.5053 20.5553 -3% 1%
Chalk 21.4128 21.1828 -11% 2%
Dolomite 21.4515 20.9815 -16% 0%
Limestone 21.5313 21.1113 -17% 5%
Acetic Acid [O1]
Berea 21.6236 20.8936 19% 4%
Chalk 21.2857 21.2457 8% 1%
Dolomite 21.2878 21.1278 15% 4%
Limestone 21.4800 21.4300 20% 2%
Myristic Acid
[O2]
Berea 21.7711 20.9911 14% 0%
Chalk 21.6814 21.6314 7% 3%
Dolomite 21.4965 21.2365 5% 4%
Limestone 21.6018 21.4118 6% 2%
Naphthenic Acid
[O3]
Berea 21.1424 20.2324 1% 2%
Chalk 21.5749 21.3849 -7% 1%
Dolomite 21.3025 20.9625 -3% 1%
Limestone 21.5138 21.2438 -2% 2%
Dibenzothiophene
[S1]
Berea 21.5897 20.6297 -4% 5%
Chalk 21.2343 21.1143 0% 2%
Dolomite 20.9054 20.5254 -7% 2%
Limestone 21.2160 20.9660 0% 0%

181
Table C11: Cont’d
Oil Chemistry
(SAC) Rock Type
Test Tube +
Grain (g)
Test Tube
(g)
Fractional Oil
Wettability (%)
Standard
Deviation
(+/-)
Di-n-Butyl Sulfide
[S2]
Berea 21.6468 20.7468 2% 0%
Chalk 21.1839 21.1239 6% 5%
Dolomite 21.0421 20.8021 7% 0%
Limestone 21.0218 20.8418 7% 4%
1-Tetradecanethiol
[S3]
Berea 21.7895 20.7995 -7% 0%
Chalk 21.5292 21.2292 -18% 3%
Dolomite 21.7035 21.0635 -33% 5%
Limestone 21.4889 20.7989 -44% 3%
Carbazole [N1]
Berea 20.9547 20.0247 -1% 4%
Chalk 21.5350 21.4050 -1% 3%
Dolomite 21.8116 21.4816 -2% 0%
Limestone 21.2060 20.9060 -5% 5%
Quinoline [N2]
Berea 21.3570 20.4170 -2% 3%
Chalk 21.5487 21.3687 -6% 2%
Dolomite 21.8427 21.4227 -11% 3%
Limestone 21.4164 21.0864 -8% 0%
Pyridine [N3]
Berea 21.3163 20.4163 2% 1%
Chalk 21.6445 21.5245 0% 5%
Dolomite 21.1569 20.8569 1% 1%
Limestone 21.3782 21.1182 -1% 2%

182
Table C12: Raw data for 2000 ppm of SAC on rock wettability in the presence of 1,000 ppm
TDS brine at 110°C. Each experiment was repeated at least 3 times and their standard deviation
is reported.
Oil Chemistry
(SAC) Rock Type
Test Tube +
Grain (g)
Test Tube
(g)
Fractional Oil
Wettability (%)
Standard
Deviation
(+/-)
Decane
Berea 20.9508 20.0208 -1% 4%
Chalk 20.6800 20.4600 -10% 1%
Dolomite 20.3639 19.8434 -21% 4%
Limestone 21.1060 20.8560 0% 3%
Tetralin [A1]
Berea 20.8106 19.8306 -6% 5%
Chalk 20.9833 20.7133 -15% 1%
Dolomite 20.2789 19.7989 -17% 1%
Limestone 20.5937 20.1437 -20% 4%
Acetic Acid [O1]
Berea 20.4694 19.7594 21% 3%
Chalk 20.5614 20.5514 11% 3%
Dolomite 20.1804 20.0204 15% 1%
Limestone 20.3618 20.3318 22% 4%
Myristic Acid
[O2]
Berea 20.8817 20.0917 13% 2%
Chalk 20.3640 20.3240 8% 1%
Dolomite 20.5420 20.2920 6% 3%
Limestone 20.9195 20.7195 5% 3%
Naphthenic Acid
[O3]
Berea 20.5074 19.5974 1% 2%
Chalk 20.8110 20.6310 -6% 2%
Dolomite 20.4322 20.1022 -2% 0%
Limestone 20.2286 19.9386 -4% 4%
Dibenzothiophene
[S1]
Berea 20.3791 19.4491 -1% 0%
Chalk 20.2557 20.1257 -1% 5%
Dolomite 20.3973 19.9973 -9% 2%
Limestone 21.0425 20.8025 1% 0%

183
Table C12: Cont’d
Oil Chemistry
(SAC) Rock Type
Test Tube +
Grain (g)
Test Tube
(g)
Fractional Oil
Wettability (%)
Standard
Deviation
(+/-)
Di-n-Butyl Sulfide
[S2]
Berea 20.2127 19.3127 2% 5%
Chalk 20.7990 20.7290 5% 3%
Dolomite 20.2480 20.0080 7% 3%
Limestone 20.6083 20.4483 9% 1%
1-Tetradecanethiol
[S3]
Berea 20.8872 19.8972 -7% 2%
Chalk 20.6912 20.3912 -18% 5%
Dolomite 20.3225 19.5425 -47% 3%
Limestone 20.9677 20.1377 -58% 0%
Carbazole [N1]
Berea 20.2267 19.3167 1% 2%
Chalk 20.7197 20.5297 -7% 5%
Dolomite 21.1076 20.7876 -1% 0%
Limestone 20.4947 20.1947 -5% 5%
Quinoline [N2]
Berea 21.0315 20.1315 2% 1%
Chalk 20.4541 20.2841 -5% 1%
Dolomite 21.0253 20.5453 -17% 5%
Limestone 20.3741 20.0541 -7% 4%
Pyridine [N3]
Berea 20.4814 19.5414 -2% 3%
Chalk 20.7004 20.5504 -3% 5%
Dolomite 20.8578 20.5378 -1% 5%
Limestone 20.2646 20.0046 -1% 0%
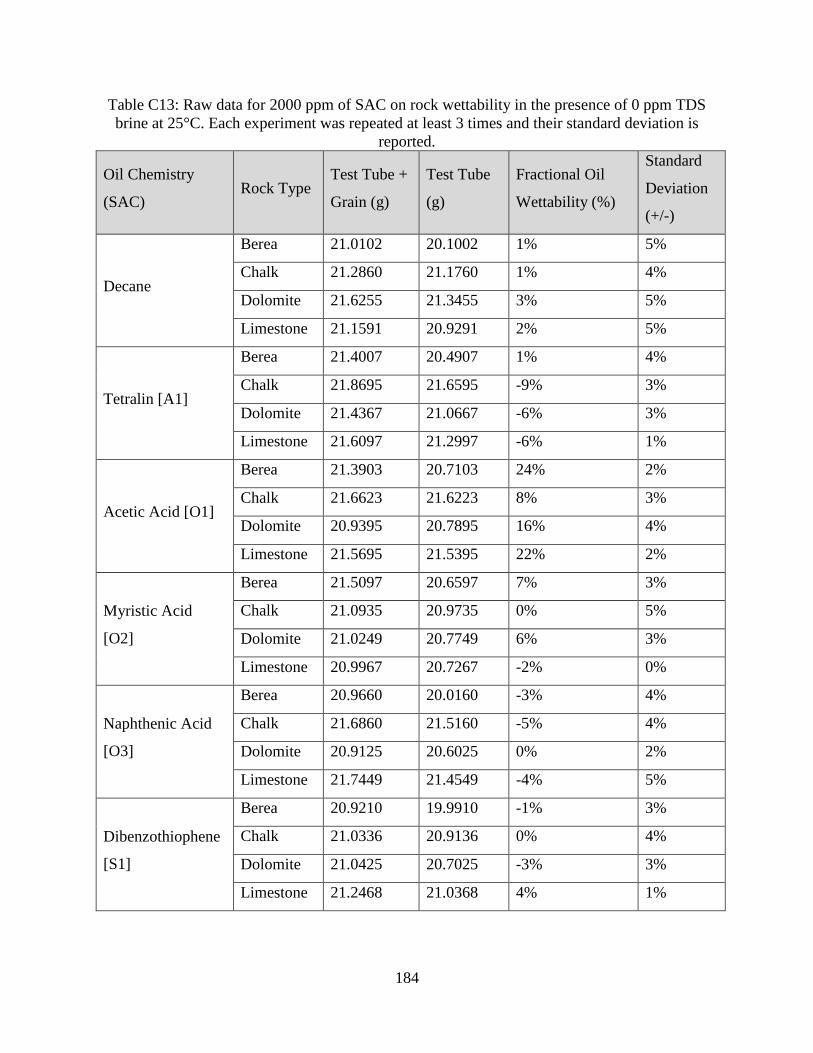
184
Table C13: Raw data for 2000 ppm of SAC on rock wettability in the presence of 0 ppm TDS
brine at 25°C. Each experiment was repeated at least 3 times and their standard deviation is
reported.
Oil Chemistry
(SAC) Rock Type
Test Tube +
Grain (g)
Test Tube
(g)
Fractional Oil
Wettability (%)
Standard
Deviation
(+/-)
Decane
Berea 21.0102 20.1002 1% 5%
Chalk 21.2860 21.1760 1% 4%
Dolomite 21.6255 21.3455 3% 5%
Limestone 21.1591 20.9291 2% 5%
Tetralin [A1]
Berea 21.4007 20.4907 1% 4%
Chalk 21.8695 21.6595 -9% 3%
Dolomite 21.4367 21.0667 -6% 3%
Limestone 21.6097 21.2997 -6% 1%
Acetic Acid [O1]
Berea 21.3903 20.7103 24% 2%
Chalk 21.6623 21.6223 8% 3%
Dolomite 20.9395 20.7895 16% 4%
Limestone 21.5695 21.5395 22% 2%
Myristic Acid
[O2]
Berea 21.5097 20.6597 7% 3%
Chalk 21.0935 20.9735 0% 5%
Dolomite 21.0249 20.7749 6% 3%
Limestone 20.9967 20.7267 -2% 0%
Naphthenic Acid
[O3]
Berea 20.9660 20.0160 -3% 4%
Chalk 21.6860 21.5160 -5% 4%
Dolomite 20.9125 20.6025 0% 2%
Limestone 21.7449 21.4549 -4% 5%
Dibenzothiophene
[S1]
Berea 20.9210 19.9910 -1% 3%
Chalk 21.0336 20.9136 0% 4%
Dolomite 21.0425 20.7025 -3% 3%
Limestone 21.2468 21.0368 4% 1%

185
Table C13: Cont’d
Oil Chemistry
(SAC) Rock Type
Test Tube +
Grain (g)
Test Tube
(g)
Fractional Oil
Wettability (%)
Standard
Deviation
(+/-)
Di-n-Butyl Sulfide
[S2]
Berea 20.9081 20.0181 3% 0%
Chalk 21.8290 21.7090 0% 4%
Dolomite 21.2696 20.9996 4% 0%
Limestone 21.8423 21.6023 1% 1%
1-Tetradecanethiol
[S3]
Berea 21.2326 20.3226 1% 4%
Chalk 21.8643 21.7643 2% 2%
Dolomite 21.7062 20.8862 -51% 2%
Limestone 21.8670 21.1470 -47% 2%
Carbazole [N1]
Berea 20.9276 19.9876 -2% 4%
Chalk 21.3710 21.2410 -1% 2%
Dolomite 21.2233 20.8833 -3% 1%
Limestone 21.6518 21.3918 -1% 4%
Quinoline [N2]
Berea 21.3143 20.3543 -4% 2%
Chalk 21.1629 20.9929 -5% 2%
Dolomite 20.9699 20.6599 0% 0%
Limestone 20.8921 20.6021 -4% 2%
Pyridine [N3]
Berea 21.7161 20.7561 -4% 2%
Chalk 21.8534 21.7334 0% 4%
Dolomite 21.4575 21.1375 -1% 5%
Limestone 21.3892 21.1092 -3% 4%

186
Table C14: Raw data for 2000 ppm of SAC on rock wettability in the presence of 0 ppm TDS
brine at 110°C. Each experiment was repeated at least 3 times and their standard deviation is
reported.
Oil Chemistry
(SAC) Rock Type
Test Tube +
Grain (g)
Test Tube
(g)
Fractional Oil
Wettability (%)
Standard
Deviation
(+/-)
Decane
Berea 20.3913 19.4713 0% 2%
Chalk 20.3093 20.1065 -8% 1%
Dolomite 20.7644 20.3044 -15% 3%
Limestone 20.9952 20.7452 0% 4%
Tetralin [A1]
Berea 21.0221 20.1021 0% 5%
Chalk 20.8460 20.4360 -29% 5%
Dolomite 20.6141 19.9441 -36% 1%
Limestone 20.2889 19.6689 -37% 4%
Acetic Acid [O1]
Berea 20.8393 20.2393 32% 3%
Chalk 20.1323 20.1723 16% 0%
Dolomite 20.1279 20.0479 23% 3%
Limestone 20.6683 20.7283 31% 2%
Myristic Acid
[O2]
Berea 20.8559 20.0559 12% 4%
Chalk 20.6574 20.6974 16% 0%
Dolomite 20.7826 20.6226 15% 5%
Limestone 20.6964 20.5564 11% 1%
Naphthenic Acid
[O3]
Berea 20.6490 19.7390 1% 2%
Chalk 20.7687 20.4987 -15% 0%
Dolomite 20.1239 19.8139 0% 5%
Limestone 20.3840 20.1040 -3% 1%
Dibenzothiophene
[S1]
Berea 21.0188 20.1088 1% 1%
Chalk 20.2303 20.0803 -3% 0%
Dolomite 20.6807 20.2807 -9% 3%
Limestone 20.2027 19.9127 -4% 1%

187
Table C14: Cont’d
Oil Chemistry
(SAC) Rock Type
Test Tube +
Grain (g)
Test Tube
(g)
Fractional Oil
Wettability (%)
Standard
Deviation
(+/-)
Di-n-Butyl Sulfide
[S2]
Berea 20.3596 19.4096 -3% 5%
Chalk 20.2060 20.2260 14% 2%
Dolomite 20.2165 20.0165 11% 4%
Limestone 20.2206 20.1106 14% 0%
1-Tetradecanethiol
[S3]
Berea 20.3193 19.3793 -2% 2%
Chalk 20.7041 20.5641 -2% 1%
Dolomite 20.8307 19.8407 -68% 1%
Limestone 20.6604 19.7804 -63% 4%
Carbazole [N1]
Berea 20.1163 19.2063 1% 4%
Chalk 20.3124 20.0624 -13% 3%
Dolomite 20.5396 20.1696 -6% 5%
Limestone 20.3070 19.9570 -10% 3%
Quinoline [N2]
Berea 20.7903 19.8403 -3% 5%
Chalk 20.9342 20.7242 -9% 0%
Dolomite 20.4657 19.8057 -35% 2%
Limestone 20.2819 19.9119 -12% 5%
Pyridine [N3]
Berea 20.6838 19.7338 -3% 2%
Chalk 20.5047 20.3447 -4% 4%
Dolomite 20.4783 20.1283 -4% 4%
Limestone 20.4565 20.1865 -2% 3%

188
APPENDIX D: VITA
Paulina Metili Mwangi was born and raised in Kajiado District, Kenya and Lynn, MA, USA
to Simon Mwangi Ngachu and Jane Nyawira Mwangi. She completed her high school education
at Lynn Classical High School, Lynn, MA. She acquired her Bachelors in Chemical Engineering
with minors in Geology and American Sign Language from the University of Rochester,
Rochester, NY in May 2008. She obtained her Masters of Science in Petroleum Engineering in the
December 2010 from the Louisiana State University. She is currently a candidate for the degree of
Doctor of Philosophy in Petroleum Engineering to be awarded in May 2017.