Embed Size (px)
Citation preview

Contents lists available at SciVerse ScienceDirect
Journal of Financial Economics
Journal of Financial Economics ] (]]]]) ]]]–]]]
0304-40
http://d
$ We
Hanig, B
referee
thanks
Chicago
Initiativ
Busines
with AQ
value an Corr
E-m
(T.J. Mo
PleasJourn
journal homepage: www.elsevier.com/locate/jfec
The role of shorting, firm size, and time on market anomalies$
Ronen Israel a, Tobias J. Moskowitz b,n
a AQR Capital Management, United Statesb University of Chicago and NBER, United States
a r t i c l e i n f o
Article history:
Received 11 July 2011
Received in revised form
21 May 2012
Accepted 29 May 2012
JEL classification:
G12
Keywords:
Asset pricing
Market anomalies
Market efficiency
Size
Value
Momentum
5X/$ - see front matter & 2012 Elsevier B.V
x.doi.org/10.1016/j.jfineco.2012.11.005
thank Cliff Asness, John Cochrane, And
ryan Johnson, Lars Nielsen, Lasse Pedersen
for useful comments and suggestions. T
the Center for Research in Security Prices
for financial support. This research was fu
e on Global Markets at the University of Chi
s. Moskowitz has an ongoing compensated
R Capital Management, which invests in, am
nd momentum.
esponding author. Tel.: þ1 773 834 2757; fa
ail address: tobias.moskowitz@chicagobooth
skowitz).
e cite this article as: Israel, R., Moal of Financial Economics (2013), h
a b s t r a c t
We examine the role of shorting, firm size, and time on the profitability of size, value,
and momentum strategies. We find that long positions make up almost all of size, 60%
of value, and half of momentum profits. Shorting becomes less important for
momentum and more important for value as firm size decreases. The value premium
decreases with firm size and is weak among the largest stocks. Momentum profits,
however, exhibit no reliable relation with size. These effects are robust over 86 years of
US equity data and almost 40 years of data across four international equity markets and
five asset classes. Variation over time and across markets of these effects is consistent
with random chance. We find little evidence that size, value, and momentum returns
are significantly affected by changes in trading costs or institutional and hedge fund
ownership over time.
& 2012 Elsevier B.V. All rights reserved.
1. Introduction
The returns to portfolios based on firm size, value, andmomentum have presented a challenge to asset pricing
. All rights reserved.
rea Frazzini, Marco
, and an anonymous
obias J. Moskowitz
at the University of
nded in part by the
cago Booth School of
consulting relation
ong other strategies,
x: þ1 773 702 0458.
.edu
skowitz, T.J., The rolettp://dx.doi.org/10.10
theory since their discovery.1 The pervasiveness, robust-ness, and magnitude of the return premia associated withsize, value, and momentum has made them the focalpoint for discussions of market efficiency as well ascritical inputs for describing the cross section of expectedreturns. These market anomalies have been shown to berobust in other stock markets, other time periods, and
1 Initially, these were challenges to the Capital Asset Pricing Model
(CAPM). Small stocks on average outperform large stocks (based on market
capitalization), even after adjusting for market exposure (Banz, 1981; Roll,
1983; Fama and French, 1992). Likewise, value stocks, with high ratios of
fundamental or book value to market value (such as book-to-market equity,
cash flow-to-price, or earnings-to-price ratios) outperform growth stocks,
which have low book-to-price ratios (Stattman, 1980; Rosenberg, Reid, and
Lanstein, 1985; DeBondt and Thaler, 1985; Fama and French, 1992;
Lakonishok, Shleifer, and Vishny, 1994). There is also positive momentum
in stock returns. Stocks that have done well relative to other stocks over the
last six months to a year continue to outperform their peers over the next six
months to a year, and stocks that have done relatively poorly continue to
underperform (Jegadeesh and Titman, 1993; Asness, 1994; Fama and French,
1996; Moskowitz and Grinblatt, 1999; Grinblatt and Moskowitz, 2004).
of shorting, firm size, and time on market anomalies.16/j.jfineco.2012.11.005i

2 We follow the academic literature and, specifically, Fama and
French (1992, 2008, and 2010) in forming portfolios that use all publicly
traded stocks on the NYSE, Amex, and Nasdaq. This means our smallest
size groupings of stocks contain mostly micro-cap stocks that could be
difficult to trade and implement in a real-world portfolio. The smallest
grouping of stocks contain firms that are much smaller than firms in the
Russell 2000 universe.
R. Israel, T.J. Moskowitz / Journal of Financial Economics ] (]]]]) ]]]–]]]2
other asset classes (Chan, Hamao, and Lakonishok, 1991;Hawawini and Keim, 1995; Fama and French, 1998, 2012;Rouwenhorst, 1998; Griffin, Ji, and Martin, 2003; Asness,Moskowitz, and Pedersen, forthcoming) and have moti-vated the use of empirical asset pricing models thatincorporate their returns (Fama and French, 1993, 2012;Carhart, 1997; Asness, Moskowitz, and Pedersen, forth-coming). The vast literature on these anomalies hasgenerated a wide debate as to the underlying explana-tions for these return premia, which generally fall intotwo categories: rational risk-based models or behavioraltheories. Also, a lack of consensus exists on the imple-mentability of these strategies in practice. Both of theseissues are paramount to discussions of market efficiencywith respect to these anomalies.
Given the disparate views in the literature, we takestock of the empirical evidence of these market anoma-lies, to shed some light on these issues. We investigatethree questions. First, how important is short selling tothe profitability of these strategies? Second, what roledoes firm size play in the efficacy of these investmentstyles? Third, how have the returns to these strategies andthe role of size and shorting varied over time? Theimportance of size, shorting, and time to the profitabilityof these strategies helps identify possible explanationsas well as implementation costs associated with eachanomaly. Without having to specify a trading cost model,which is investor specific, we acknowledge that smallstocks are more costly and more difficult to trade and thatshorting is more costly and more constrained. Arbitrageactivity and capital are, therefore, likely to be morelimited in small stocks and when shorting. Consistentwith this view, many behavioral theories suggest strongerreturns among smaller, less liquid securities and whenthere is negative news (Hong and Stein, 1999; Hong, Lim,and Stein, 2000; Lee and Swaminathan, 2000). How theseeffects have evolved over time could also help reveal whatdrives these anomalies. We examine how these effectshave varied with changes to trading costs and institu-tional ownership over time, including the surge in hedgefund activity over the last two decades.
We examine the role of shorting from two perspectives:the value added from short selling of assets in a long-shortportfolio and the value added from underweighting stocksrelative to a benchmark (e.g., the market portfolio). Becauseshort positions are generally more costly to maintain thanlong positions and because some investors are restrictedfrom taking short positions (e.g., mutual funds and institu-tions) the net of trading cost returns could be substantiallylower and not accessible to many investors, if shorting is animportant driver of the profits to these strategies.
The role of firm size also plays a dual part in our study.First, we examine the return premium associated with size.Second, we examine the interaction between firm size andthe return premia to value and momentum, including theinteraction of firm size with the importance of shorting forthese strategies. If the bulk of the returns to these strategiesis concentrated among small or micro-cap stocks, then thefraction of the market affected by these anomalies could besmall. Moreover, trading costs are typically highest amongthe smallest stocks, and small stocks are the most difficult
Please cite this article as: Israel, R., Moskowitz, T.J., The roleJournal of Financial Economics (2013), http://dx.doi.org/10.10
and costly to short. Hence, the interaction between firmsize and the other anomalies provides insight into theimplementation costs of these strategies.
Using data over the last 86 years in the U.S. stock market(from 1926 to 2011) and over the last four decades ininternational stock markets and other asset classes (from1972 to 2011), we find that the importance of shorting isinconsequential for all strategies when looking at rawreturns. For an investor who cares only about raw returns,the return premia to size, value, and momentum aredominated by the contribution from long positions. Shortingonly matters if investors care about returns relative to abenchmark, such as the market portfolio. Looking at market-adjusted returns (market alphas), long positions comprisethe bulk of the size premium, capture about 60% of the valuepremium, and comprise half of the momentum returnpremium. Long-only versions of value and momentumdeliver positive and significant alphas relative to the market.
Looking across different size firms, we find that themomentum premium is present and stable across all sizegroups. Little evidence exists that momentum is substan-tially stronger among small cap stocks over the entire86-year US sample period. The value premium, mean-while, is largely concentrated only among small stocksand is insignificant among the largest two quintiles ofstocks (largest 40% of NYSE stocks).2
The contribution to value and momentum profits fromshorting varies with firm size. Shorting becomes less(more) important for momentum and more (less) impor-tant for value strategies as firm size decreases (increases).However, across all size groups, we cannot reject that theabnormal profits to value and momentum trading aregenerated equally by long and short positions.
We examine the robustness of these findings over timeand in relation to time series variation in trading costs,institutional ownership, and hedge fund assets. First, wefind that significant momentum returns are presentacross size categories in every 20-year subsample weexamine, including the most recent two decades thatfollowed the initial publication of the original momentumstudies. Moreover, the findings of Hong, Lim, and Stein(2000) and Grinblatt and Moskowitz (2004) that momen-tum is markedly stronger among small cap stocks and onthe short side seems to be sample specific. Outside of thesamples studied in those papers [most notably, 1980 to1996, the sample period covered in Hong, Lim, and Stein(2000)], we find no evidence that momentum is strongeramong small stocks or from shorting, and, over the entireperiod that includes those samples, no significant differ-ence emerges in momentum returns across size groups orfrom shorting. Returns to value investing, however, areconsistently stronger among small cap stocks in everysubperiod and are largely nonexistent among large cap
of shorting, firm size, and time on market anomalies.16/j.jfineco.2012.11.005i

R. Israel, T.J. Moskowitz / Journal of Financial Economics ] (]]]]) ]]]–]]] 3
stocks in three of the four subperiods we examine.We find no evidence that returns to these strategies havechanged over time or that the contribution from longversus short positions has changed over time.
Second, we examine how the returns to size, value, andmomentum have varied with changes in trading costs andinstitutional ownership over the last century, includinghedge fund participation over the most recent two decades.While we find some weak evidence that momentumreturns rise as trading costs rise, particularly among smallstocks, little evidence exists that trading cost changes havehad a material effect on these return premia. Likewise, wefind little to no relation between institutional ownership orhedge fund growth and these return premia, other than adecline in the size premium with increased institutionalownership, consistent with Gompers and Metrick (2001).
Finally, we also examine these strategies across fourinternational stock markets and five other asset classesover a 40-year period. Additional evidence from theseother markets confirms the existence of value andmomentum return premia and similarly finds an equalcontribution of long and short positions to those returns.
Our findings shed new light on the vast literature onsize, value, and momentum effects in asset pricing. Hong,Lim, and Stein (2000) and Grinblatt and Moskowitz (2004)also examine momentum returns across firm size and thelong versus short side contributions to momentum profits.Their conclusions that momentum is stronger among smallcap stocks and that two-thirds of the profits come fromshorting are not robust in our larger sample. We find thatmomentum returns are largely unaffected by size and thatthe short side is no more profitable than the long side overour longer 86-year sample period and in eight othermarkets and asset classes. Fama and French (2012) examinevalue and momentum in international stock markets from1990 to 2009 across size groupings. They find that bothvalue and momentum premia are present in all markets,with the exception of momentum in Japan, and that valueand momentum premia exist in all size groups, with returnpremia being stronger as size decreases.3 Over our longer86-year sample period, we find no evidence that momen-tum declines with firm size, but we do find consistentevidence that value returns are weaker for larger stocks.
The rest of the paper is organized as follows. Section 2describes our data and portfolios. Section 3 analyzes theimportance of shorting and time on size, value, andmomentum strategies. Section 4 examines the role offirm size on value and momentum return premia as wellas the interaction between firm size and the importanceof shorting. Section 5 analyzes how the importance ofshorting and firm size varies over time and whethervariation in trading costs or institutional ownership andhedge fund participation has impacted these strategiesover time. Section 6 examines other equity markets andasset classes. Section 7 concludes.
3 See Asness (2011) for a counter view of whether momentum exists
in Japan. Asness (2011) argues that, relative to a value benchmark or the
Fama and French (2012) three-factor model in Japan, momentum
exhibits a robust and sizable alpha. The mean-variance frontier of
Japanese stocks contains a significant positive weight on momentum.
Please cite this article as: Israel, R., Moskowitz, T.J., The roleJournal of Financial Economics (2013), http://dx.doi.org/10.10
2. Data
Most of the analysis in this study pertains to US equityportfolios over the period July 1926 to December 2011 forvalue and size portfolios and over the period January 1927to December 2011 for momentum portfolios. We alsoexamine international equity portfolios and portfolios ofother asset classes that include country equity indices,government bonds, currencies, and commodities futuresover the period February 1972 to December 2011.
2.1. US equity portfolios
Most of the data for US equity portfolios comes fromKen French’s data library (French, 2012) and is derivedfrom underlying stock returns data from the Centerfor Research in Security Prices (CRSP). We examinevalue-weighted and equal-weighted decile and quintileportfolios formed on size (market capitalization), value(book-to-market equity, BE/ME), and momentum (past12-month return, skipping the most recent month), aswell as five-by-five quintile double sorted portfoliosformed sequentially on size then value and also size thenmomentum (i.e., dependent sorts on size).
For each anomaly, we use a single, simple, and fairlystandard characteristic to sort stocks into portfolios basedon size, value, and momentum. There are several ways tomeasure each anomaly and form portfolios. For value, weuse the standard book-to-market equity ratio, BE/ME, asmeasured by Fama and French (1992, 1993, 1996, 2008),which is the book value of equity of the stock from theprevious year-end divided by the market value of equityat that time. Other value measures, such as book valuesdivided by more recent market values as in Asness andFrazzini (2012), or those considered by Lakonishok,Shleifer, and Vishny (1994) and Fama and French(1996), such as earnings-to-price ratio (E/P), cash flow-to-price ratio (C/P), dividend yield (D/P), and long-termreversal [the negative of the past 60-month return, -
Ret(1,60), as first used by DeBondt and Thaler (1985)],could yield slightly different results but should generallybe consistent. We provide some robustness tests usingthese alternative measures in the Appendix.
For momentum, we simply use the standard past12-month return skipping the most recent month,Ret(2,12). Other momentum measures such as Novy-Marx(2012), who advocates that Ret(7,12) is a stronger predictorof returns than Ret(2,6),4 the disposition effect momentummeasures of Grinblatt and Han (2005) and Frazzini (2006),or earnings momentum measures of Chan, Jegadeesh, andLakonishok (1996) could also yield slightly different resultsbut should be largely consistent with our findings. In thispaper, we use a single variable for value (BE/ME) andmomentum [Ret(2,12)] to maintain uniformity across timeand markets. These measures are available over the longest
4 However, Novy-Marx (2012) finds that one cannot reject whether
Ret(7,12) is a better predictor than Ret(2,12) in his sample. Hence, both
measures seem to capture the same phenomenon. Moreover, Goyal and
Wahal (2012) find that Ret(7,12) is not a better predictor than Ret(2,6)
outside of the US in 34 out of 35 countries.
of shorting, firm size, and time on market anomalies.16/j.jfineco.2012.11.005i

7 SMB and HML are formed by first splitting the universe of stocks into
two size categories (S and B) using NYSE market cap medians and then
splitting stocks into three groups based on book-to-market equity [highest
30% (H), middle 40% (M), and lowest 30% (L), using NYSE breakpoints]. The
intersection of stocks across the six categories are value-weighed and used
to form the portfolios SH (small, high BE/ME), SM (small, middle BE/ME), SL
R. Israel, T.J. Moskowitz / Journal of Financial Economics ] (]]]]) ]]]–]]]4
time period from 1926 to 2011 and are the most commonlyused measures in the literature.5
The size decile portfolios are formed by ranking stocks ontheir market capitalization in June of the previous year andforming ten equal groups based on NYSE breakpoints. Allpublicly traded stocks on the NYSE, Amex, and Nasdaq arethen assigned based on their June market caps to one of thesedecile groups and the returns to each decile are computedover the following year.6 Two sets of decile portfolio returnsare computed: value-weighting the stocks in each decile andequal weighting them. The same procedure is used to formdecile portfolios based on value, in which firms are rankedeach June based on BE/ME instead of firm size, and decileportfolios for momentum, in which stocks are ranked eachmonth on their past 12-month return, skipping the mostrecent month (cumulative return from month t-12 to t-2).
The five-by-five double-sorted size and value and sizeand momentum portfolios are formed similarly, except thatsize quintile portfolios are formed first (using NYSE break-points) and value and momentum portfolios are formeddependently within each size quintile. For more details onthe construction of these portfolios, see Ken French’s datalibrary (French, 2012). We use the 25 size-value and 25 size-momentum portfolios to examine the results for value andmomentum across different size stocks. To give a sense ofthe size groupings, in December 2011, the average size stockin the largest size group, Quintile 5, is just over $36 billion.The average size stock in the Russell 1000 at the end of 2011is about $14 billion. The second largest size group, Quintile4, has an average size of $4.8 billion at the end of 2011. Theaverage size stock in the Russell Midcap index at that time isaround $5 billion. Size Quintile 3 has an average market capof about $2 billion, which is larger than the average size firmin the Russell 2000 index at that time, which is under $800million. The smallest size groupings, Quintiles 2 and 1, haveaverage market caps of $855 million and $156 million,respectively. Size Quintile 2, therefore, contains stocks thatare on average about the size of the average stock in theRussell 2000 index, and Quintile 1 contains essentiallymicro-cap stocks. Stocks in Quintiles 1 and 2 could facesignificant trading costs for any reasonably sized portfolio.
We also obtain the Fama and French factor portfoliosRMRF, SMB, HML, and UMD, which are, respectively, thereturns to the CRSP value-weighted market portfolio in excessof the Treasury bill rate (RMRF), a small minus big (SMB)factor that is long the smallest half of firms and short thelargest half of firms, a high minus low (HML) book-to-market
5 Other measures of value, such as E/P or C/P, are available only
beginning in 1951 and other measures of momentum, such as the
disposition effect measures, are limited by the availability of volume
data. Assessing the differential effects on returns from using different
measures of value and momentum is beyond the scope of this paper,
though we discuss the robustness of our results to other measures when
appropriate.6 Fama and French (1993, 1996, and 2008) use NYSE breakpoints so
that each decile contains an equal number of NYSE stocks. Because Amex
and Nasdaq contain much smaller stocks on average, this prevents the
deciles from becoming exchange specific and, therefore, for comparisons
across deciles to be confounded by exchange effects. In addition, because
Amex begins in 1963 and Nasdaq in 1973, use of NYSE breakpoints
provides more consistency over time to allow for more meaningful
comparisons to be made prior to 1963.
Please cite this article as: Israel, R., Moskowitz, T.J., The roleJournal of Financial Economics (2013), http://dx.doi.org/10.10
factor, and an up minus down (UMD) momentum factor.7 Wealso examine just the long side of these factors: portfolios S,H, and U, which are, respectively, a value-weighted portfolioof the smallest half of stocks based on NYSE breakpoints, theaverage of the two highest 30% BE/ME portfolios among smalland large stocks, and the average of the two highest 30%momentum portfolios among small and large stocks.
2.2. International equity and other asset class portfolios
International equity and other asset class portfoliosare obtained from Asness, Moskowitz, and Pedersen(forthcoming). International equity returns are from Data-stream and are aggregated across four regions: the US, UK,Europe (excluding UK), and Japan. All returns are denomi-nated in US dollars. Data from the US and UK cover theperiod February 1972 to December 2011; Europe andJapan, February 1974 to December 2011. Equity indexreturn data come from MSCI for 18 developed marketscovering the period January 1978 to December 2011.International government bond returns come fromBloomberg and Datastream covering ten developed mar-kets from January 1982 to December 2011. Currencyreturns for ten developed countries come from Bloombergfor the period January 1979 to December 2011. Commod-ity futures returns on 27 commodities come from avariety of exchanges and cover the period January 1972to December 2011. Details on the source of these returnsand their construction can be found in Asness, Moskowitz,and Pedersen (forthcoming).
We obtain the value and momentum portfolios in eachof these markets and asset classes used by Asness,Moskowitz, and Pedersen (forthcoming), who divide eachmarket’s or asset classes’ securities into three equalgroups based on value or momentum rankings, in whichmomentum is defined as the past 12-month return oneach security, skipping the most recent month’s return,and value is defined as book-to-market equity for stocksand stock indices and by the negative of the past 60-month return of the security for other asset classes.8
(small, low BE/ME), BH (big, high BE/ME), BM (big, middle BE/ME), and BL
(big, low BE/ME), where SMB is the average of the three small stock
portfolios (1/3SHþ1/3SMþ1/3SL) minus the average of the three big stock
portfolios (1/3BHþ1/3BMþ1/3BL) and HML is the average of the two high
book-to-market portfolios (1/2SHþ1/2BH) minus the average of the two
low book-to-market portfolios (1/2SLþ1/2BL). UMD is constructed simi-
larly to HML, in which two size groups and three momentum groups
[highest 30% (U), middle 40% (M), lowest 30% (D)] are used to form six
portfolios and UMD is the average of the small and big winners minus the
average of the small and big losers.8 The motivation for using the negative past five year return as a
value indicator comes from DeBondt and Thaler (1985, 1987) and Fama
and French (1996), who show that the past five year performance of
stocks is a signal of value. Asness, Moskowitz and Pedersen (forthcoming)
find that stock portfolios created from past five year returns are on
average 0.86 correlated with portfolios created from other value mea-
sures such as BE/ME.
of shorting, firm size, and time on market anomalies.16/j.jfineco.2012.11.005i

Fig. 1. Cumulative returns to size, value, and momentum portfolios. Plotted are the monthly cumulative sum of log returns on size, value, and momentum portfolios from July 1926 (January 1927 for
momentum) to December 2011. Panels A and B plot the cumulative raw returns and Capital Asset Pricing Model (CAPM) alphas (with respect to the value-weighted market index), respectively, of long-short
portfolios, and panels C and D plot the raw returns and alphas, respectively, of long-only portfolios. SMB¼small minus big; HML¼high minus low; UMD¼up minus down.
Ple
ase
citeth
isa
rticlea
s:Isra
el,
R.,
Mo
sko
witz,
T.J.,
Th
ero
leo
fsh
ortin
g,
firm
size,
an
dtim
eo
nm
ark
et
an
om
alie
s.Jo
urn
al
of
Fina
ncia
lE
con
om
ics(2
01
3),
http
://dx
.do
i.org
/10
.10
16
/j.jfin
eco
.20
12
.11
.00
5i
R.
Israel,
T.J.
Mo
sko
witz
/Jo
urn
al
of
Fina
ncia
lE
con
om
ics]
(]]]])]]]–
]]]5

R. Israel, T.J. Moskowitz / Journal of Financial Economics ] (]]]]) ]]]–]]]6
Securities are then value weighted within each group inthe case of individual stocks and equal weighted in thecase of other asset classes. The spread in returns betweenthe portfolios representing the top and bottom third ofsecurities capture the value and momentum premiawithin each market or asset class.
3. The importance of shorting and time
We examine how important short selling and time areto the profitability of size, value, and momentum strategies.
3.1. Fama and French factor portfolios
We begin by looking at the profits to size, value, andmomentum long-short strategies from the Fama andFrench factor portfolios. Fig. 1, Panel A plots the cumulative(sum of log) returns of the Fama and French portfolios SMB,HML, and UMD. Over the common 1927 to 2011 timeperiod, returns to momentum are highest, averaging 8.26%per year with an annual standard deviation of 16.6% (anannual Sharpe (Sharpe, 1964) ratio of 0.50), followed byvalue, averaging 4.56% per year with 12.4% annual volatility(Sharpe ratio of 0.37), and then size, averaging 2.9% per yearwith 11.5% standard deviation (Sharpe ratio of 0.25).
Fig. 1, Panel B plots the cumulative capital asset pricingmodel (CAPM) alphas of SMB, HML, and UMD, in whichCAPM betas are estimated unconditionally over the entire
Table 1Capital Asset Pricing Model (CAPM) alphas of size, value, and momentum port
Reported are the CAPM alphas (and t-statistics of those alphas) of the Fama an
and UMD (up minus down), representing size, value, and momentum long-short
portfolio, for the full sample period from July 1926 (January 1927 for moment
momentum) to December 1962, January 1963 to December 2011, July 1926 (Jan
1969, January 1970 to December 1989, and January 1990 to December 2011.
estimating market betas over each sample period separately.
CAPM Alphas
1926–2011 1926–1962 1963–2011 1
Size
Small 2.05 0.70 3.08
(1.72) (0.33) (2.30)Big 0.65 �0.01 1.19
(1.40) (�0.01) (2.49)SMB 1.42 0.71 1.92
(1.16) (0.37) (1.29)
Value
High 2.93 0.73 4.72
(2.40) (0.33) (4.21)Low �0.58 0.05 �1.07
(�0.87) (0.05) (�1.27)HML 3.45 0.68 5.74
(2.80) (0.33) (4.14)
Momentum
Up 5.55 5.79 5.45
(6.74) (4.34) (5.16)Down �4.94 �6.44 �3.76 �
(�3.74) (�2.89) (�2.43) (�UMD 10.48 12.23 9.21
(6.13) (4.49) (4.35)
Please cite this article as: Israel, R., Moskowitz, T.J., The roleJournal of Financial Economics (2013), http://dx.doi.org/10.10
sample period by running a time series regression of eachportfolio’s monthly returns on the CRSP value-weightedmarket index return in excess of the T-bill rate. SMB exhibitsan insignificant 1.42% per year alpha that is statisticallyindistinguishable from zero (t-statistic¼1.16). HML has a3.45% per year alpha that is 2.8 standard errors from zero,and UMD has a 10.48% per year alpha that is more than 6standard errors from zero. Comparing Fig. 1, Panels A and B,adjusting for market beta decreases the size and valuepremia but increases the momentum premium.
Fig. 1, Panel C plots the cumulative raw excess returnsof the long-only components of the Fama and Frenchfactor portfolios: S, H, and U. The same ranking ofperformance among the three investment styles is pre-sent. The long-only momentum portfolio generates 13.6%(in excess of T-bills) per year on average with a 21.8%standard deviation (Sharpe ratio of 0.62). The long-onlyvalue portfolio produces 12.4% (in excess of T-bills) peryear with a higher 26.5% volatility (Sharpe ratio of 0.47),and the long-only size portfolio generates 11.5% (in excessof T-bills) per year with 26.3% standard deviation (Sharperatio of 0.44). Because the long-only portfolios are domi-nated by general stock market exposure, we also reportthe unconditional market betas of each portfolio. Smallstocks and value stocks have betas of 1.26 and 1.27,respectively, and recent 12-month winners have a betaof 1.08. Fig. 1, Panel D plots the cumulative alphas of thelong-only portfolios relative to the market portfolio. Sizeand value exhibit 2.05 and 2.93% per year alphas,
folios over time.
d French factor portfolios SMB (small minus big), HML (high minus low),
portfolio returns, respectively, as well as the long and short sides of each
um) to December 2011 and six subperiods: July 1926 (January 1927 for
uary 1927 for momentum) to December 1949, January 1950 to December
All alphas are annualized and expressed as percents and are calculated
(t-stats)
926–1949 1950–1969 1970–1989 1990–2011
3.12 1.72 2.62 2.27
(1.01) (1.03) (1.29) (1.07)
0.26 0.77 1.72 0.90
(0.25) (1.66) (3.41) (0.96)
2.86 0.99 0.90 1.39
(1.02) (0.59) (0.42) (0.56)
2.71 2.67 5.91 2.98
(0.86) (1.72) (3.50) (1.66)
1.21 �0.40 �2.23 �1.04
(0.80) (�0.41) (�1.82) (�0.75)
1.50 3.04 8.10 3.95
(0.51) (1.82) (4.10) (1.67)
6.69 5.43 5.08 4.68
(3.36) (4.32) (3.55) (2.71)
3.61 �4.83 �4.39 �4.19
1.14) (�3.28) (�2.03) (�1.54)
10.29 10.26 9.47 8.87
(2.61) (5.21) (3.32) (2.38)
of shorting, firm size, and time on market anomalies.16/j.jfineco.2012.11.005i

R. Israel, T.J. Moskowitz / Journal of Financial Economics ] (]]]]) ]]]–]]] 7
respectively, and momentum has a 5.55% alpha. More-over, the residual volatility of the momentum portfolio(7.60%) is smaller than that of size (11.05%) or value(11.30%). Hence, long-only momentum produces anannual information ratio almost three times larger thanvalue or size (0.73 information ratio for momentumcompared with only a 0.26 information ratio for long-only value and 0.19 for long-only size).
Fig. 1, Panel D indicates that a long-only version ofsize produces a marginally significant abnormal return,but that long-only versions of value and momentumdeliver significant abnormal returns relative to the mar-ket. Hence, for an investor constrained to hold long-onlyinvestments, size, value, and momentum still offer addi-tional return premia above the general market return, inwhich momentum offers the largest premium and thelowest residual risk.
Table 1 reports the CAPM alphas of the long, short,and long minus short returns associated with size, value,and momentum over various subperiods, using the Famaand French factor portfolios. The first column reports resultsfor the full sample from 1926 (or 1927 in the case ofmomentum) to 2011, the second column reports results upto 1962 before the introduction of Amex (1963) and Nasdaq(1973) stocks to CRSP, and the third column reportsresults from 1963 to 2011. Beginning with size, there isno significant alpha for SMB over any of these time periods,though the long-side, S, exhibits a marginally signifi-cant alpha of 2.05% per year over the full sample period(t-statistic¼1.72) and a significant alpha of 3.08%(t-statistic¼2.30) from 1963 to 2011. HML exhibits a sig-nificant CAPM alpha of 3.45% per year over the entire sampleperiod, but all of it comes from the second half of the sample,in which there is a 5.74% per year alpha (t-statistic¼4.14).Before 1963, however, HML exhibits an insignificant 0.68%
Table 2Decile portfolios based on size, value, and momentum from July 1926 to Dece
Reported are the average raw returns in excess of the one-month T-bill rate, S
on size, value (BE/ME), and momentum (past 12-month return, skipping the mos
to December 2011. The difference between Deciles 10 and 1 (10-1) is also repo
and the average of Deciles 1 and 2 (9-2), the average of Deciles 8 through 10 a
through 10 and the average of Deciles 1 through 4 (7-4).
Decile portfolios (value-weighte
1 2 3 4 5 6
SizeRaw excess 13.66 11.56 11.54 10.96 10.49 10.42 9Sharpe 0.39 0.37 0.41 0.42 0.42 0.43 0Alpha
t-statistic2.97 1.26 1.63 1.67 1.30 1.47 1
(1.22) (0.71) (1.18) (1.38) (1.34) (1.83) (1
Value
Raw excess 6.65 7.68 7.85 7.58 8.38 8.88 9Sharpe 0.33 0.40 0.42 0.36 0.43 0.41 0Alpha
t-statistic�0.75 0.48 0.90 �0.27 1.15 0.97 0
(�1.08) (0.85) (1.52) (�0.39) (1.58) (1.18) (0
Momentum
Raw excess 0.10 4.83 5.04 6.65 6.78 7.51 8Sharpe 0.00 0.17 0.21 0.30 0.32 0.37 0Alpha
t-statistic�11.38 �5.04 �3.62 �1.46 �0.84 �0.05 1
(�6.00) (�3.53) (�3.17) (�1.55) (�1.04) (�0.08) (1
Please cite this article as: Israel, R., Moskowitz, T.J., The roleJournal of Financial Economics (2013), http://dx.doi.org/10.10
alpha. This result is consistent with Fama and French (2006),who also find that the CAPM captures HML in the pre-1962period. Momentum, as proxied by UMD, exhibits a robustand consistent alpha over both periods: 12.23% from 1927 to1962 and 9.21% from 1963 to 2011.
Looking at the long and short sides of these strategies,SMB is dominated by long positions; HML is driven mostly,but not entirely, by the long side; and UMD appears to beequally driven by long and short profitability. Focusingonly on the long side of each strategy, momentum con-tinues to produce larger and more consistent alphas thansize or value, and each produce positive alpha only in thesecond half of the sample.
The remaining four columns of Table 1 report resultsacross four subperiods split into roughly equal 20-yearintervals. Looking at these finer time slices, there is nosignificant size premium in any subperiod after adjustingfor the market. The value premium is positive in everysubperiod but is only statistically significant at the 5%level in one of the four 20-year periods, from 1970 to1989. The momentum premium, however, is positive andstatistically significant in every subperiod, producingreliable alphas that range from 8.9% to 10.3% per yearover the four subperiods.
3.2. Decile portfolios
To further examine the role shorting plays in theefficacy of size, value, and momentum strategies, weexamine portfolios based on finer sorts of these character-istics. Table 2 reports the average raw returns in excess ofT-bills, Sharpe ratios, and market (CAPM) alphas of value-weighted decile-sorted portfolios based on size, value, andmomentum over the period July 1926 (January 1927 formomentum) to December 2011. To gauge the importance
mber 2011.
harpe ratios, and CAPM alphas of value-weighted decile portfolios formed
t recent month) over the period July 1926 (January 1927 for momentum)
rted along with the differences between the average of Deciles 9 and 10
nd the average of Deciles 1 through 3 (8-3), and the average of Deciles 7
d) Differences
7 8 9 10 10-1 9-2 8-3 7-4
.81 9.11 8.43 6.80 �6.86 �4.99 �4.14 �3.39
.43 0.42 0.41 0.38 �0.26 �0.24 �0.24 �0.23
.25 0.90 0.54 �0.06 �3.03 �1.87 �1.49 �1.22
.85) (1.67) (1.29) (�0.19) (�1.15) (�0.89) (�0.86) (�0.83)
.00 10.83 11.66 12.54 5.89 4.93 4.28 3.57
.39 0.45 0.44 0.39 0.26 0.28 0.28 0.28
.71 2.27 2.46 1.81 2.56 2.27 1.97 1.72
.70) (2.00) (1.91) (0.95) (1.11) (1.26) (1.28) (1.32)
.51 9.94 10.81 14.59 14.50 10.24 8.46 6.81
.44 0.53 0.54 0.64 0.53 0.45 0.44 0.42
.33 3.02 3.65 7.04 18.42 13.55 11.25 9.13
.94) (4.33) (4.41) (5.35) (6.63) (5.97) (5.83) (5.57)
of shorting, firm size, and time on market anomalies.16/j.jfineco.2012.11.005i

R. Israel, T.J. Moskowitz / Journal of Financial Economics ] (]]]]) ]]]–]]]8
of the long and short sides of these strategies, as well asany asymmetries in their returns, we report the differencesbetween Deciles 10 and 1 (10-1), as well as the differencesbetween the average of Deciles 9 and 10 and the average ofDeciles 1 and 2 (9-2), 8 through 10 and 1 through 3 (8-3),and 7 through 10 and 1 through 4 (7-4). These differencesare informative about whether the extreme portfoliosbehave any differently and how monotonic the relation isbetween these characteristics and returns.
As Table 2 shows, size, value, and momentum allexhibit a monotonic relation with average raw excessreturns. Moving across the deciles generates consistentlyhigher mean returns, and the spread in returns fromDeciles 10-1 through Deciles 7-4 declines monotonically.However, the monotonic relation is not as evident whenlooking at Sharpe ratios because volatility tends to be U-shaped across the deciles, being highest for the two mostextreme portfolios. The Sharpe ratios of size and valueportfolios are flat across the deciles as a result, with thehigher returns for the higher deciles being offset by highervolatility. Momentum exhibits a more monotonic relationacross deciles with respect to Sharpe ratios, though therelation is flatter than it is for average returns, suggestingthat volatility rises across the deciles but not as fast asaverage returns rise. Thus, there is added return per unitof volatility going across the momentum deciles, which isnot evident for the size or value decile portfolios.
Looking at market alphas, no significant abnormalreturns exist for size or value decile spreads over theentire 1926 to 2011 time period. In other words, over thefull 86-year sample period, the CAPM seems to price wellportfolios sorted on size and value (BE/ME). This resultseems to contradict Fama and French (1992), who exam-ine size and BE/ME portfolios from 1963 to 1990 and findthat the CAPM cannot capture their returns. Over theirsample period, we confirm their results. However, overthe longer period from 1926 to 2011, the CAPM capturesthe returns to these portfolios well.
Alphas for momentum decile portfolio spread returnsare statistically and economically large, indicating that,unlike size and BE/ME decile portfolios, momentum decileportfolio returns are unexplained by the CAPM over thefull sample period.
Table 2 also highlights that long-only versions of size,value, and momentum produce positive alphas, but those ofsize and value are statistically weak. For momentum, how-ever, winners deliver significant abnormal performancerelative to the market, and this performance is not concen-trated only among the securities with the most extremecharacteristics. Deciles 8 and 9 also produce robust andsignificant positive alphas.
In the Appendix, we also report results for value-weighted decile portfolios sorted on other measures ofvalue: E/P, C/P, D/P, -Ret(1,60), and a composite value indexthat is an equal-weighted average of portfolios sorted onthese four measures of value and BE/ME. Unfortunately, datafor E/P and C/P are available only from July 1951 toDecember 2011, so we cannot evaluate how these portfoliosperform going back to 1926. As Table A1 in the Appendixshows, E/P and C/P each produce significant spreads inreturns, and D/P and -Ret(1,60), which go back to 1927 and
Please cite this article as: Israel, R., Moskowitz, T.J., The roleJournal of Financial Economics (2013), http://dx.doi.org/10.10
1931, respectively, do not. Hence, of the five value measureswe examine (including BE/ME), three produce insignificantspreads in returns and two produce significantly positivespreads. However, the two value measures, E/P and C/P, thatproduce positive spreads do so over the later 1951 to 2011period. If we also examine the three other value measures[BE/ME, D/P, and -Ret(1,60)] over the 1951 to 2011 period, weobtain significantly positive alphas as well, except for-Ret(1,60). Thus, it appears that the efficacy of value strategiesvaries by time period, and, over the full sample period datingback to 1926, it is hard to find a reliable value premiumamong value-weighted decile portfolios.
As a final measure of value, we compute a compositeindex of all five value measures dating back to 1926taking an equal-weighted average of all available valuemeasures. The composite index is composed of justBE/ME, D/P, and -Ret(1,60) in the early part of the sample,and then E/P and C/P are included after July 1951. Thespread in alphas from portfolios sorted on this compositevalue index are positive and significant at the 5% levelover the full sample period from 1926 to 2011. Hence,evidence shows an abnormal value premium over the fullcentury of data when taking an average of several valuemeasures, but the value premium appears to be muchweaker in the early half of the sample.
3.3. What happened to the size effect?
Tables 1 and 2 show no evidence of an abnormal sizepremium relative to the CAPM over the entire sampleperiod or any of the 20-year subperiods. This resultappears inconsistent with the Banz (1981) original dis-covery of an abnormal size effect. Two key differencesbetween our results and Banz (1981) are sample periodand methodology. Banz (1981) studies returns from 1936to 1975 and primarily uses Fama and MacBeth (1973)cross-sectional regressions to examine the size effect. InTable A2 of the Appendix, we conduct analysis similar toBanz (1981) over both the entire sample period 1926 to2011 and the Banz (1981) original sample period from1936 to 1975.
Panel A of Table A2 reports the spread portfolio returnsbetween the smallest and largest decile of stocks (basedon NYSE breakpoints) over both periods. The first set ofrows reports results for value-weighted decile portfoliosidentical to those used in Table 2. As the first rows ofPanel A of Table A2 indicate, the size decile spread returnsare only slightly higher over the Banz (1981) 1936 to 1975time period, but there is still no evidence of a significantsize effect. The next set of rows in Panel A of Table A2repeats the analysis for equal-weighted portfolios. Banz(1981) uses Fama and MacBeth regressions on a set of 20size- and beta-sorted portfolios. Fama and MacBethregression coefficients can be interpreted as portfolioreturns (see Fama, 1976), in which the securities areessentially weighted by their volatility (to minimizesum of residual squared errors), which makes them moretilted toward smaller securities than value weighting. AsPanel A of Table A2 shows, the equal weighted decileportfolios, which are closer to what is obtained from aFama and MacBeth regression, produce alphas that are
of shorting, firm size, and time on market anomalies.16/j.jfineco.2012.11.005i
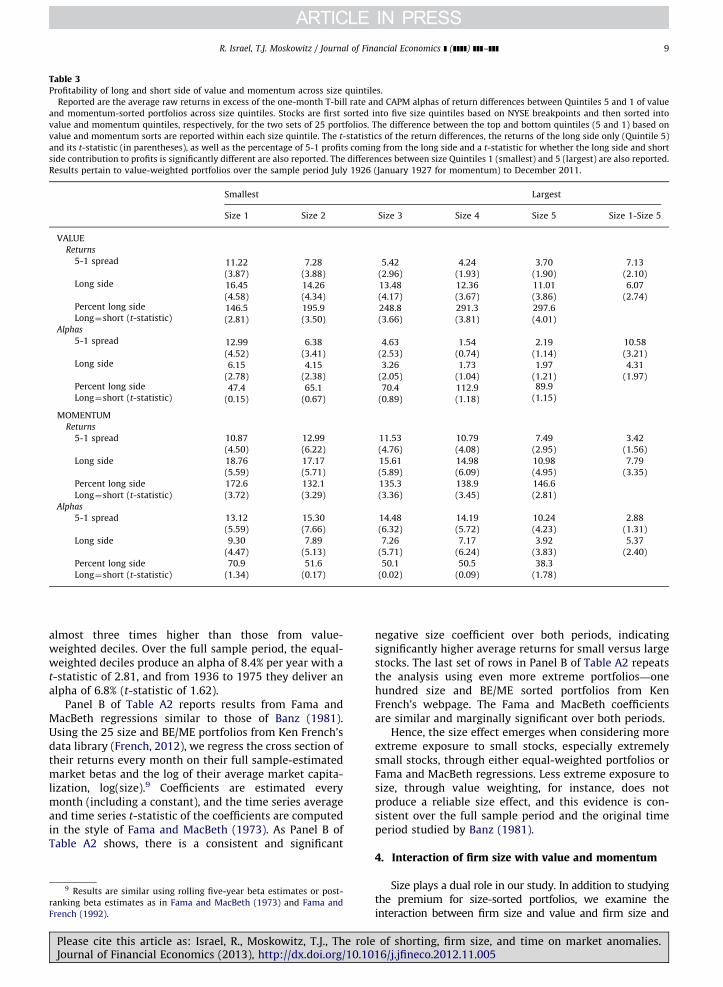
Table 3Profitability of long and short side of value and momentum across size quintiles.
Reported are the average raw returns in excess of the one-month T-bill rate and CAPM alphas of return differences between Quintiles 5 and 1 of value
and momentum-sorted portfolios across size quintiles. Stocks are first sorted into five size quintiles based on NYSE breakpoints and then sorted into
value and momentum quintiles, respectively, for the two sets of 25 portfolios. The difference between the top and bottom quintiles (5 and 1) based on
value and momentum sorts are reported within each size quintile. The t-statistics of the return differences, the returns of the long side only (Quintile 5)
and its t-statistic (in parentheses), as well as the percentage of 5-1 profits coming from the long side and a t-statistic for whether the long side and short
side contribution to profits is significantly different are also reported. The differences between size Quintiles 1 (smallest) and 5 (largest) are also reported.
Results pertain to value-weighted portfolios over the sample period July 1926 (January 1927 for momentum) to December 2011.
Smallest Largest
Size 1 Size 2 Size 3 Size 4 Size 5 Size 1-Size 5
VALUE
Returns
5-1 spread 11.22 7.28 5.42 4.24 3.70 7.13
(3.87) (3.88) (2.96) (1.93) (1.90) (2.10)Long side 16.45 14.26 13.48 12.36 11.01 6.07
(4.58) (4.34) (4.17) (3.67) (3.86) (2.74)Percent long side 146.5 195.9 248.8 291.3 297.6Long¼short (t-statistic) (2.81) (3.50) (3.66) (3.81) (4.01)
Alphas
5-1 spread 12.99 6.38 4.63 1.54 2.19 10.58
(4.52) (3.41) (2.53) (0.74) (1.14) (3.21)Long side 6.15 4.15 3.26 1.73 1.97 4.31
(2.78) (2.38) (2.05) (1.04) (1.21) (1.97)Percent long side 47.4 65.1 70.4 112.9 89.9
Long¼short (t-statistic) (0.15) (0.67) (0.89) (1.18) (1.15)
MOMENTUM
Returns
5-1 spread 10.87 12.99 11.53 10.79 7.49 3.42
(4.50) (6.22) (4.76) (4.08) (2.95) (1.56)
Long side 18.76 17.17 15.61 14.98 10.98 7.79
(5.59) (5.71) (5.89) (6.09) (4.95) (3.35)
Percent long side 172.6 132.1 135.3 138.9 146.6
Long¼short (t-statistic) (3.72) (3.29) (3.36) (3.45) (2.81)
Alphas
5-1 spread 13.12 15.30 14.48 14.19 10.24 2.88
(5.59) (7.66) (6.32) (5.72) (4.23) (1.31)
Long side 9.30 7.89 7.26 7.17 3.92 5.37
(4.47) (5.13) (5.71) (6.24) (3.83) (2.40)
Percent long side 70.9 51.6 50.1 50.5 38.3
Long¼short (t-statistic) (1.34) (0.17) (0.02) (0.09) (1.78)
R. Israel, T.J. Moskowitz / Journal of Financial Economics ] (]]]]) ]]]–]]] 9
almost three times higher than those from value-weighted deciles. Over the full sample period, the equal-weighted deciles produce an alpha of 8.4% per year with at-statistic of 2.81, and from 1936 to 1975 they deliver analpha of 6.8% (t-statistic of 1.62).
Panel B of Table A2 reports results from Fama andMacBeth regressions similar to those of Banz (1981).Using the 25 size and BE/ME portfolios from Ken French’sdata library (French, 2012), we regress the cross section oftheir returns every month on their full sample-estimatedmarket betas and the log of their average market capita-lization, log(size).9 Coefficients are estimated everymonth (including a constant), and the time series averageand time series t-statistic of the coefficients are computedin the style of Fama and MacBeth (1973). As Panel B ofTable A2 shows, there is a consistent and significant
9 Results are similar using rolling five-year beta estimates or post-
ranking beta estimates as in Fama and MacBeth (1973) and Fama and
French (1992).
Please cite this article as: Israel, R., Moskowitz, T.J., The roleJournal of Financial Economics (2013), http://dx.doi.org/10.10
negative size coefficient over both periods, indicatingsignificantly higher average returns for small versus largestocks. The last set of rows in Panel B of Table A2 repeatsthe analysis using even more extreme portfolios—onehundred size and BE/ME sorted portfolios from KenFrench’s webpage. The Fama and MacBeth coefficientsare similar and marginally significant over both periods.
Hence, the size effect emerges when considering moreextreme exposure to small stocks, especially extremelysmall stocks, through either equal-weighted portfolios orFama and MacBeth regressions. Less extreme exposure tosize, through value weighting, for instance, does notproduce a reliable size effect, and this evidence is con-sistent over the full sample period and the original timeperiod studied by Banz (1981).
4. Interaction of firm size with value and momentum
Size plays a dual role in our study. In addition to studyingthe premium for size-sorted portfolios, we examine theinteraction between firm size and value and firm size and
of shorting, firm size, and time on market anomalies.16/j.jfineco.2012.11.005i

R. Israel, T.J. Moskowitz / Journal of Financial Economics ] (]]]]) ]]]–]]]10
momentum profitability. We analyze whether value andmomentum premia are stronger among various sized stocks,whether the contribution to profits from longs and shortsdiffers across size groups, and whether any of these effectschange over time. To evaluate the role firm size plays in thereturns to value and momentum, we examine the 25 Famaand French size-value portfolios and the 25 size-momentumportfolios. We focus on value-weighted versions of each ofthese sets of 25 portfolios but also report results for equal-weighted portfolios.
4.1. Size-value portfolios
Table 3 reports the raw excess returns and market(CAPM) alphas of the 25 size and value and 25 size andmomentum sorted portfolios estimated over the entiresample period. Returns and alphas are estimated frommonthly returns but reported as annualized percentages.The 5-1 quintile spread return differences betweenhigh BE/ME and low BE/ME stocks and high and lowmomentum stocks within each size quintile, as well as thereturns and alphas of just the long side [Quintile portfolio 5]within each size quintile are reported. Table 3 also reportsthe t-statistic of the mean returns and alphas and thepercentage of 5-1 profits coming from the long side, includ-ing a formal statistical test of whether the profits from thelong side are significantly different from 50%, an equal splitbetween long and short contribution to profits. The lastcolumn of Table 3 reports the difference in mean returnsand alphas between the smallest and largest quintile ofstocks for both the 5-1 spread and long only (Quintile 5)portfolios of value and momentum.
As the top half of Table 3 indicates, the value premiumdeclines monotonically with firm size. The raw return spreadfor high minus low BE/ME firms is 11.22% per year amongthe smallest quintile of stocks and 3.70% among the largestquintile of stocks. More than 100% of these return differencescome from the long side. That is, an investor not worriedabout market exposure would be better off only taking thelong side of these value strategies in each size quintile.However, adjusting for market exposure and market returnschanges the picture somewhat. First, alphas of the 5-1 valuespread in returns are also stronger among small stocks andare insignificant among large stocks. Second, looking at thelong-only side of value strategies across size quintiles, thesame pattern emerges: strong positive alphas for long-onlyvalue among small cap stocks and insignificant alphasamong large caps. The difference in long-only value returnsacross size groups is economically and marginally statisti-cally significant (t-statistic of 1.97), with a 4.31% per yeardifference in long-only value returns between the smallestand largest quintiles. Because the difference in long-short5-1 value spread alphas is 10.58% between the smallest andlargest size quintiles, this implies that shorting profits tovalue strategies vary more across size groups. The contribu-tion of long side returns to value profitability increases assize increases. Among the smallest stocks, the long side ofvalue contributes only 47% to total profits, but among thelargest stocks the contribution of long positions is nearly90%. Because shorting small, growth stocks could be expen-sive or difficult to implement, this could reduce the net of
Please cite this article as: Israel, R., Moskowitz, T.J., The roleJournal of Financial Economics (2013), http://dx.doi.org/10.10
trading cost returns to a small value strategy in practice.While long positions comprise nearly the entire valuepremium among the largest stocks, the alpha for valueamong large cap stocks is not reliably different from zero.
4.2. Size-momentum portfolios
The bottom half of Table 3 shows that momentumexhibits strong predictability within each size quintile, withlittle evidence that momentum returns are stronger amongsmall cap stocks. Momentum returns appear slightly strongeramong the smallest quintile of stocks relative to the largestquintile of stocks, but the differences are small and insignif-icant. Moreover, the relation between momentum and size isnot monotonic. The middle size quintiles exhibit the stron-gest returns, though, again, the differences across size are notstatistically reliable. Comparing the returns with value andmomentum across size, the momentum premium is consis-tently larger than the value premium in every size groupexcept the smallest one, in which they are essentially equal.
Statistically significant differences exist in the returns andalphas of the long-only component of momentum across sizequintiles, however. Long-only momentum is strongestamong the smallest stocks and weakest among the largeststocks, though it is statistically and economically significantin each. As a percentage of total momentum profits, the longside contributes more than 100% of total profits in raw returnspace. That is, just like value, an investor not concerned withmarket risk should only go long winners and not short losers.However, adjusting for the market, the long side of amomentum strategy contributes more to its profitabilityamong small stocks than large stocks. The long side con-tributes 71% of profits among small cap momentum and only38% among large cap momentum. This is the oppositepattern exhibited by value. The importance of shorting formomentum strategies declines as firm size gets smaller.From an implementation perspective, this is good newsbecause shorting small, losing stocks should be difficultand expensive. Hence, momentum has the nice featurethat shorting losers becomes less important as firm sizedeclines.
The results for momentum seem at odds with theconclusions drawn in Hong, Lim, and Stein (2000) andGrinblatt and Moskowitz (2004), who claim that momentumprofits are stronger among small stocks and that shortingcontributes more to momentum profits than the long side(about two-thirds of profits), particularly among small capstocks. We find no discernible differences in momentumprofits across size groups and that the importance of short-ing for momentum declines instead of increases for smallstocks. The key difference in our findings is primarily drivenby sample period. Hong, Lim, and Stein (2000) examinereturns from 1980 to 1996, and Grinblatt and Moskowitz(2004) examine returns from 1963 to 1999. We examinereturns from 1927 to 2011. As shown in Table A3 of theAppendix, when looking over the same time period as Hong,Lim, and Stein (2000) and Grinblatt and Moskowitz (2004),we find results consistent with those studies. Momentumappears to be stronger among small caps and more driven byshorting. These results, however, are not borne out in othertime periods out-of-sample. Looking over our entire sample
of shorting, firm size, and time on market anomalies.16/j.jfineco.2012.11.005i

Fig. 2. Contribution of long and short sides of value (VAL) and momentum (MOM) strategies across size quintiles. Plotted are the CAPM alphas of the
difference between Quintile 5 and Quintile 1 portfolios formed on value and momentum within size quintiles over the period July 1926 (January 1927 for
momentum) to December 2011. The contributions to total profits from the long side (Quintile 5) and short side (Quintile 1) are highlighted on the graph.
The top graph shows results from value-weighted portfolios; the bottom graph, equal-weighted portfolios.
R. Israel, T.J. Moskowitz / Journal of Financial Economics ] (]]]]) ]]]–]]] 11
period or out-of-sample from these studies, we find nostatistical or economic evidence that the long and short sideprofits of a momentum strategy are different and no reliabledifferences in momentum returns across firm size groups.
Please cite this article as: Israel, R., Moskowitz, T.J., The roleJournal of Financial Economics (2013), http://dx.doi.org/10.10
In fact, the result that shorting small losers is a bigcomponent of momentum profitability, as concluded byHong, Lim, and Stein (2000) and Grinblatt and Moskowitz(2004), seems to be unique to the 1980 to 1996 sample
of shorting, firm size, and time on market anomalies.16/j.jfineco.2012.11.005i

11 The introduction of Amex and Nasdaq stocks to the CRSP universe
in 1963 and 1973, respectively, which introduces a large set of much
R. Israel, T.J. Moskowitz / Journal of Financial Economics ] (]]]]) ]]]–]]]12
period studied by Hong, Lim, and Stein (2000). As Table A3in the Appendix shows, removing the period 1980 to 1996from the Grinblatt and Moskowitz (2004) sample (which is1963 to 1999), we no longer find this result in their sampleand we do not find it in the longer sample from 1927 to2011. Even looking at the out-of-sample period from 2000to 2011 following the Grinblatt and Moskowitz (2004)study, we find no evidence that momentum is strongeramong small stocks or from shorting losers. Even within thesubsamples, where there is a size-momentum interaction,it appears mostly driven by the short side. In the Hong, Lim,and Stein (2000) and Grinblatt and Moskowitz (2004)subsamples, no reliable difference is found in long-onlymomentum profits across size quintiles.10 Only during the1980 to 1996 period examined in Hong, Lim, and Stein(2000) is there any evidence that shorting small losersmatters. Over the full sample that includes this period,however, no evidence shows that momentum is strongeramong small stocks or from shorting. In fact, the impor-tance of shorting gets weaker for small stocks.
More recently, Avramov, Chordia, Jostova, and Philipov(2007) claim that momentum profits are stronger amonglow credit–rated firms and nonexistent among highly ratedfirms, and Avramov, Chordia, Jostova, and Philipov (2012)claim that a host of anomalies, including momentum, derivethe bulk of their profits from shorting high credit risk firms.These results seem at odds with our findings on the lack of asize-momentum interaction and the lack of importance ofshorting. However, Avramov, Chordia, Jostova, and Philipov(2007) and Avramov, Chordia, Jostova, and Philipov (2012)study returns over the 1985 to 2003 and 1985 to 2008sample periods, respectively, which, as we show, are periodsover which a size-momentum interaction exists and shortingsmall (possibly distressed) firms appears more important.Over the full sample period we examine from 1926 to2011, the size interaction and importance of shorting formomentum do not seem robust. However, because creditrating data are not available prior to 1985, we cannotsay whether the momentum-credit rating interaction theseauthors find would be robust over the longer sample periodwe examine.
Fig. 2 summarizes our findings by plotting the 5-1quintile spread in alphas for value and momentum strategiesacross size quintiles, with the contribution from the long andshort sides highlighted on the graph. The long side is thealpha of Quintile 5, and the short side is the negative of thealpha of Quintile 1. The top figure reports results for value-weighted portfolios, and the bottom figure for equal-weighted portfolios. No discernible pattern emerges inmomentum returns across size quintiles, even for equalweighted portfolios. (In fact, the smallest size quintile exhi-bits the lowest momentum returns among equal-weightedportfolios, and shorting losers contributes negatively tomomentum profits among the smallest quintile of stockswhen equal weighted.) But, there is a markedly decliningvalue premium as size increases. Shorting contributes to
10 This finding is also consistent with Grinblatt and Moskowitz
(2004). Fama and French (2012) also find stronger momentum profits
among small cap stocks in international data over the 1990 to 2009 time
period.
Please cite this article as: Israel, R., Moskowitz, T.J., The roleJournal of Financial Economics (2013), http://dx.doi.org/10.10
less than 30% of the profits to a momentum strategyamong small caps, about half of momentum among themiddle size quintiles, and about 60% among the largeststocks. For value strategies, shorting makes up a littlemore than half of the premium in small caps for value-weighted portfolios and about a third for equal-weightedportfolios, with the importance of shorting declining asfirm size increases. However, because the premium forvalue also declines substantially as firm size increases, thedecline in the importance of shorting for a value strategycoincides with a much lower value premium. The patternsare similar for equal-weighted portfolios.
5. Variation over time
In this section, we examine the returns to size, value,and momentum over time and how the contribution toprofits from the long and short side varies over time.
5.1. Time trends
Fig. 3 plots the CAPM alphas of value-weighted portfoliosfor value and momentum strategies within size quintilesover four subperiods: July 1926 (January 1927 for momen-tum) to December 1949, January 1950 to December 1969,January 1970 to December 1989, and January 1990 toDecember 2011. The momentum premium is strong in everysubperiod and all size quintiles, including the most recent 20years of data following the initial discovery and publicationof the momentum effect in the early 1990s. This is consistentwith the out-of-sample evidence on the robustness ofmomentum profits found in Jegadeesh and Titman (2001,2005), Fama and French (2008, 2012), and Asness, Mosko-witz, and Pedersen (forthcoming). As noted in Section 4,some differences are evident in the magnitude of themomentum premium across size quintiles over time. Inthe two most recent periods, momentum is stronger amongsmall stocks, but in the two earlier subperiods no discerniblerelation exists between momentum profits and size.
Also, no evidence shows that shorting matters morefor small stocks either. The only discernible differenceacross the size quintiles is that long-only momentum issomewhat stronger among small stocks, consistent withthe evidence in Table A3 of the Appendix.11 In summary, therelation between size and momentum and the importanceof shorting found previously in the literature are due to onespecific sample period and not robust out-of-sample.
Conversely, turning to value sorted portfolios, Fig. 3 showsa stronger value premium among small and micro-cap stocksin every subperiod, consistent with the previous litera-ture (Fama and French, 1993, 1996, 2008; Grinblatt andMoskowitz, 2004). However, we find no reliable value
smaller firms into the sample, is not responsible for these results. In the
first half of our sample the universe of stocks is exclusively from the
NYSE, and if we separate out NYSE stocks from Amex and Nasdaq stocks
post-1963, we find similar effects (see appendix Table A4). Moreover,
the use of NYSE breakpoints for the construction of our portfolios should
also mitigate the effect of Amex and Nasdaq stocks in the sample.
of shorting, firm size, and time on market anomalies.16/j.jfineco.2012.11.005i

Fig. 3. Value (VAL) and momentum (MOM) long and short side alphas across size quintiles over time. Plotted are the CAPM alphas of the difference between Quintile 5 and Quintile 1 portfolios formed on value
and momentum within size quintiles over four subperiods: July 1926 (January 1927 for momentum) to December 1949, January 1950 to December 1969, January 1970 to December 1989, and January 1990 to
December 2011. The contributions to profits from the long side (Quintile 5) and short side (Quintile 1) are highlighted on each graph.
Ple
ase
citeth
isa
rticlea
s:Isra
el,
R.,
Mo
sko
witz,
T.J.,
Th
ero
leo
fsh
ortin
g,
firm
size,
an
dtim
eo
nm
ark
et
an
om
alie
s.Jo
urn
al
of
Fina
ncia
lE
con
om
ics(2
01
3),
http
://dx
.do
i.org
/10
.10
16
/j.jfin
eco
.20
12
.11
.00
5i
R.
Israel,
T.J.
Mo
sko
witz
/Jo
urn
al
of
Fina
ncia
lE
con
om
ics]
(]]]])]]]–
]]]1
3

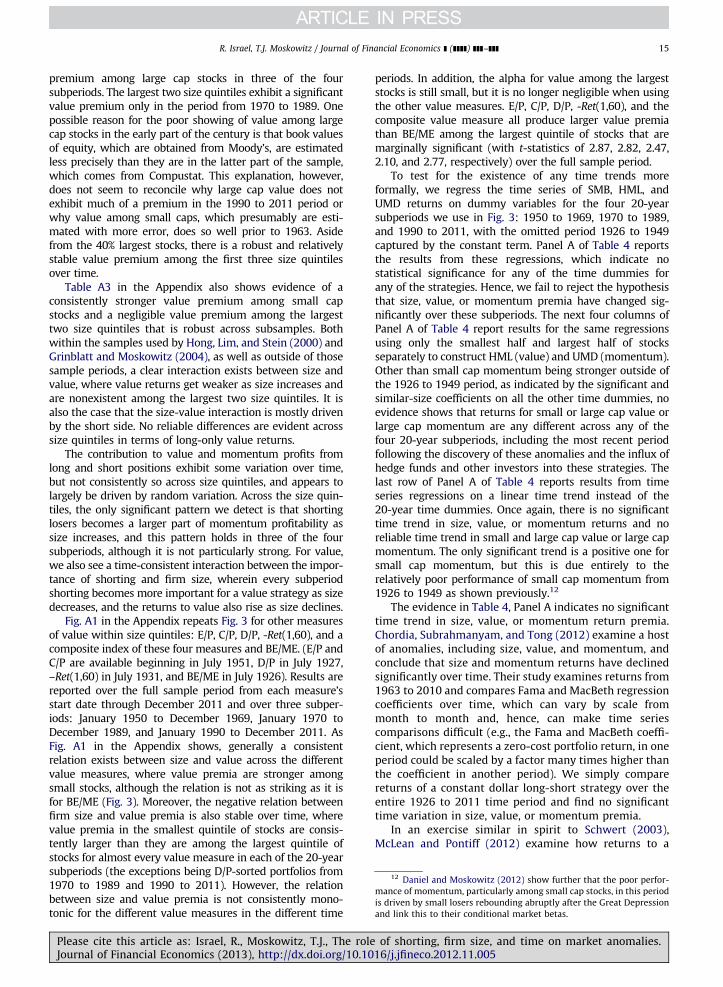
Table 4Size, value, and momentum returns over time, average trading costs, and institutional ownership.
Reported are coefficient estimates and t-statistics from time series regressions of size, value, and momentum returns on time trend variables,
aggregate trading cost measures, and measures of institutional and hedge fund investment. The dependent variables are the returns to SMB, HML, UMD,
small cap HML, large cap HML, small cap UMD, and large cap UMD. The independent variables in Panel A are time variables, in which the first regression
uses dummy variables for 20-year intervals over the entire 1926 to 2011 sample period, and the second regression uses a linear time trend as the
regressor. Panel B examines the relation between returns and aggregate trading cost measures for the US stock market over time that include the Jones
(2002) total trading cost measure, which accounts for effective spreads plus commissions and average turnover on the Dow Jones stocks from 1926
through 2005 averaged each year across all stocks, the Jones (2002) effective spread measure, which is the annual cross-sectional average of effective
spreads on the Dow Jones stocks from 1926 to 2005, and the value-weighted average of the Hasbrouck (2009) Gibbs’s sampler estimate of effective
trading costs across all NYSE stocks each year from 1926 to 2011. Panel C examines the relation between returns and institutional investment proxies
that include the percentage of institutional ownership (IO) of corporate equities from the Flow of Funds Account quarterly from 1945 to 2011 and the
annual hedge fund assets under management (AUM) from Dow Jones Credit Suisse as a percentage of institutional ownership from 1990 to 2011.
Beginning of year values are used for the institutional investment proxies. All variables in Panels B and C are detrended using a linear time trend.
SMB HML UMD Small value Large value Small
momentum
Large
momentum
Sample period
Panel A: Time trend variables
1950–1969 �0.240 �0.144 0.425 �0.628 �0.642 1.213 0.833
(�0.87) (�0.47) (1.07) (�0.94) (�1.43) (2.22) (1.47)
1970–1989 �0.171 0.217 0.167 �0.222 �0.192 1.495 0.328 1926–2011
(�0.62) (0.71) (0.42) (�0.33) (�0.43) (2.74) (0.58)
1990–2011 �0.138 �0.140 0.011 �0.244 �0.729 1.398 0.215
(�0.51) (�0.47) (0.03) (�0.37) (�1.66) (2.62) (0.39)
Time trend �0.002 �0.004 �0.029 �0.035 �0.091 0.193 �0.006 1926–2011
(�0.05) (�0.08) (�0.51) (�0.36) (�1.39) (2.44) (�0.07)
Panel B: Trading Cost Measures
Levels
Average trading cost �0.680 0.337 1.440 1.697 1.605 2.421 0.0981926–2005(�0.74) (0.33) (1.08) (0.76) (1.07) (1.33) (0.05)
Effective spread 0.953 0.730 �1.700 �0.819 1.204 �2.008 �1.7911926–2005(2.10) (1.45) (�2.57) (�0.74) (1.63) (�2.21) (�1.90)
Hasbrouck Gibbs’s estimate 1.500 1.156 �3.093 0.705 2.246 �3.048 �5.4131926–2011(2.51) (1.74) (�3.59) (0.48) (2.31) (�2.57) (�4.43)
First differences
Average trading cost 0.246 3.306 0.574 9.789 4.025 �3.623 2.7141927–2005(0.13) (1.63) (0.22) (2.21) (1.36) (�1.01) (0.73)
Effective spread 0.069 0.029 0.469 �1.789 0.536 0.682 0.6671927–2005(0.18) (0.07) (0.85) (�1.93) (0.89) (0.91) (0.85)
Hasbrouck Gibbs’s estimate �2.107 0.803 �2.847 �4.862 2.406 �1.904 �3.9571927–2011(�2.43) (0.83) (�2.28) (�2.31) (1.83) (�1.12) (�2.23)
Post�1950
Levels
Average trading cost �0.284 1.423 1.022 1.614 1.736 5.717 �3.0151950–2005(�0.21) (1.11) (0.55) (0.85) (0.94) (2.63) (�1.16)
Effective spread 0.409 �0.449 0.592 �0.793 �0.104 0.474 1.7571950–2005(0.82) (�0.93) (0.84) (�1.11) (�0.15) (0.58) (1.79)
Hasbrouck Gibbs’s estimate �1.277 1.048 3.132 1.451 �1.043 8.938 0.0471950–2011(�0.90) (0.76) (1.56) (0.71) (�0.53) (3.84) (0.02)
First differences
Average trading cost 5.158 �1.712 �1.356 �6.122 �1.770 �3.553 �0.9441950–2005(1.61) (�0.56) (�0.30) (�1.34) (�0.40) (�0.67) (�0.15)
Effective spread 0.324 �0.515 2.060 �0.879 �0.248 2.585 2.6411950–2005(0.85) (�1.42) (3.84) (�1.62) (�0.47) (4.16) (3.53)
Hasbrouck Gibbs’s estimate �2.300 �1.827 7.645 �1.750 �2.549 10.493 8.4691950–2011
(�1.45) (�1.22) (3.44) (�0.78) (�1.17) (4.08) (2.73)
Panel C: Institutional and hedge fund investment
Levels
Institutional ownership �11.275 �3.125 �2.071 1.434 �1.993 �3.739 �3.3111945–2010(�3.25) (�0.92) (�0.42) (0.28) (�0.41) (�0.64) (�0.48)
Hedge fund AUM/IO �0.001 �0.001 �0.001 0.001 �0.001 �0.003 �0.0011990–2010(�1.08) (�1.03) (�0.91) (0.32) (�0.49) (�1.88) (�0.06)
First differences
Institutional ownership 15.169 6.668 �14.333 13.980 �4.950 �11.912 �19.2481946–2010(2.13) (0.96) (�1.42) (1.35) (�0.50) (�1.01) (�1.36)
Hedge fund AUM/IO 0.001 �0.001 �0.003 �0.002 0.001 �0.004 �0.0031991–2010(1.09) (�0.80) (�1.71) (�1.24) (0.45) (�2.07) (�1.08)
Please cite this article as: Israel, R., Moskowitz, T.J., The role of shorting, firm size, and time on market anomalies.Journal of Financial Economics (2013), http://dx.doi.org/10.1016/j.jfineco.2012.11.005i
R. Israel, T.J. Moskowitz / Journal of Financial Economics ] (]]]]) ]]]–]]]14
12 Daniel and Moskowitz (2012) show further that the poor perfor-
mance of momentum, particularly among small cap stocks, in this period
is driven by small losers rebounding abruptly after the Great Depression
and link this to their conditional market betas.
R. Israel, T.J. Moskowitz / Journal of Financial Economics ] (]]]]) ]]]–]]] 15
premium among large cap stocks in three of the foursubperiods. The largest two size quintiles exhibit a significantvalue premium only in the period from 1970 to 1989. Onepossible reason for the poor showing of value among largecap stocks in the early part of the century is that book valuesof equity, which are obtained from Moody’s, are estimatedless precisely than they are in the latter part of the sample,which comes from Compustat. This explanation, however,does not seem to reconcile why large cap value does notexhibit much of a premium in the 1990 to 2011 period orwhy value among small caps, which presumably are esti-mated with more error, does so well prior to 1963. Asidefrom the 40% largest stocks, there is a robust and relativelystable value premium among the first three size quintilesover time.
Table A3 in the Appendix also shows evidence of aconsistently stronger value premium among small capstocks and a negligible value premium among the largesttwo size quintiles that is robust across subsamples. Bothwithin the samples used by Hong, Lim, and Stein (2000) andGrinblatt and Moskowitz (2004), as well as outside of thosesample periods, a clear interaction exists between size andvalue, where value returns get weaker as size increases andare nonexistent among the largest two size quintiles. It isalso the case that the size-value interaction is mostly drivenby the short side. No reliable differences are evident acrosssize quintiles in terms of long-only value returns.
The contribution to value and momentum profits fromlong and short positions exhibit some variation over time,but not consistently so across size quintiles, and appears tolargely be driven by random variation. Across the size quin-tiles, the only significant pattern we detect is that shortinglosers becomes a larger part of momentum profitability assize increases, and this pattern holds in three of the foursubperiods, although it is not particularly strong. For value,we also see a time-consistent interaction between the impor-tance of shorting and firm size, wherein every subperiodshorting becomes more important for a value strategy as sizedecreases, and the returns to value also rise as size declines.
Fig. A1 in the Appendix repeats Fig. 3 for other measuresof value within size quintiles: E/P, C/P, D/P, -Ret(1,60), and acomposite index of these four measures and BE/ME. (E/P andC/P are available beginning in July 1951, D/P in July 1927,–Ret(1,60) in July 1931, and BE/ME in July 1926). Results arereported over the full sample period from each measure’sstart date through December 2011 and over three subper-iods: January 1950 to December 1969, January 1970 toDecember 1989, and January 1990 to December 2011. AsFig. A1 in the Appendix shows, generally a consistentrelation exists between size and value across the differentvalue measures, where value premia are stronger amongsmall stocks, although the relation is not as striking as it isfor BE/ME (Fig. 3). Moreover, the negative relation betweenfirm size and value premia is also stable over time, wherevalue premia in the smallest quintile of stocks are consis-tently larger than they are among the largest quintile ofstocks for almost every value measure in each of the 20-yearsubperiods (the exceptions being D/P-sorted portfolios from1970 to 1989 and 1990 to 2011). However, the relationbetween size and value premia is not consistently mono-tonic for the different value measures in the different time
Please cite this article as: Israel, R., Moskowitz, T.J., The roleJournal of Financial Economics (2013), http://dx.doi.org/10.10
periods. In addition, the alpha for value among the largeststocks is still small, but it is no longer negligible when usingthe other value measures. E/P, C/P, D/P, -Ret(1,60), and thecomposite value measure all produce larger value premiathan BE/ME among the largest quintile of stocks that aremarginally significant (with t-statistics of 2.87, 2.82, 2.47,2.10, and 2.77, respectively) over the full sample period.
To test for the existence of any time trends moreformally, we regress the time series of SMB, HML, andUMD returns on dummy variables for the four 20-yearsubperiods we use in Fig. 3: 1950 to 1969, 1970 to 1989,and 1990 to 2011, with the omitted period 1926 to 1949captured by the constant term. Panel A of Table 4 reportsthe results from these regressions, which indicate nostatistical significance for any of the time dummies forany of the strategies. Hence, we fail to reject the hypothesisthat size, value, or momentum premia have changed sig-nificantly over these subperiods. The next four columns ofPanel A of Table 4 report results for the same regressionsusing only the smallest half and largest half of stocksseparately to construct HML (value) and UMD (momentum).Other than small cap momentum being stronger outside ofthe 1926 to 1949 period, as indicated by the significant andsimilar-size coefficients on all the other time dummies, noevidence shows that returns for small or large cap value orlarge cap momentum are any different across any of thefour 20-year subperiods, including the most recent periodfollowing the discovery of these anomalies and the influx ofhedge funds and other investors into these strategies. Thelast row of Panel A of Table 4 reports results from timeseries regressions on a linear time trend instead of the20-year time dummies. Once again, there is no significanttime trend in size, value, or momentum returns and noreliable time trend in small and large cap value or large capmomentum. The only significant trend is a positive one forsmall cap momentum, but this is due entirely to therelatively poor performance of small cap momentum from1926 to 1949 as shown previously.12
The evidence in Table 4, Panel A indicates no significanttime trend in size, value, or momentum return premia.Chordia, Subrahmanyam, and Tong (2012) examine a hostof anomalies, including size, value, and momentum, andconclude that size and momentum returns have declinedsignificantly over time. Their study examines returns from1963 to 2010 and compares Fama and MacBeth regressioncoefficients over time, which can vary by scale frommonth to month and, hence, can make time seriescomparisons difficult (e.g., the Fama and MacBeth coeffi-cient, which represents a zero-cost portfolio return, in oneperiod could be scaled by a factor many times higher thanthe coefficient in another period). We simply comparereturns of a constant dollar long-short strategy over theentire 1926 to 2011 time period and find no significanttime variation in size, value, or momentum premia.
In an exercise similar in spirit to Schwert (2003),McLean and Pontiff (2012) examine how returns to a
of shorting, firm size, and time on market anomalies.16/j.jfineco.2012.11.005i

Fig. 4. Size, value, and momentum returns versus average trading costs and institutional ownership over time. The graphs plot the returns to size (Panel
A), value (Panel B), and momentum (Panel C) using the Fama and French zero-cost portfolios SMB, HML, and UMD, respectively, against the time series of
average effective trading costs from Hasbrouck (2009), which is a value-weighted average across all stocks’ effective trading costs measured using the
Gibbs’s sampler in Hasbrouck annually over the period July 1926 to December 2011, and against the percentage of institutional ownership of corporate
equities from the Flow of Funds Account from January 1945 to December 2011. The left-most graphs in each panel plot the cumulative raw returns of
each strategy against the time series of effective trading costs and institutional ownership, and the right-most graphs plot the cumulative residual returns
of each strategy relative to the market portfolio against the (linear) detrended time series of effective trading costs and institutional ownership. Each
series is normalized by a constant to plot the series on the same scale.
R. Israel, T.J. Moskowitz / Journal of Financial Economics ] (]]]]) ]]]–]]]16
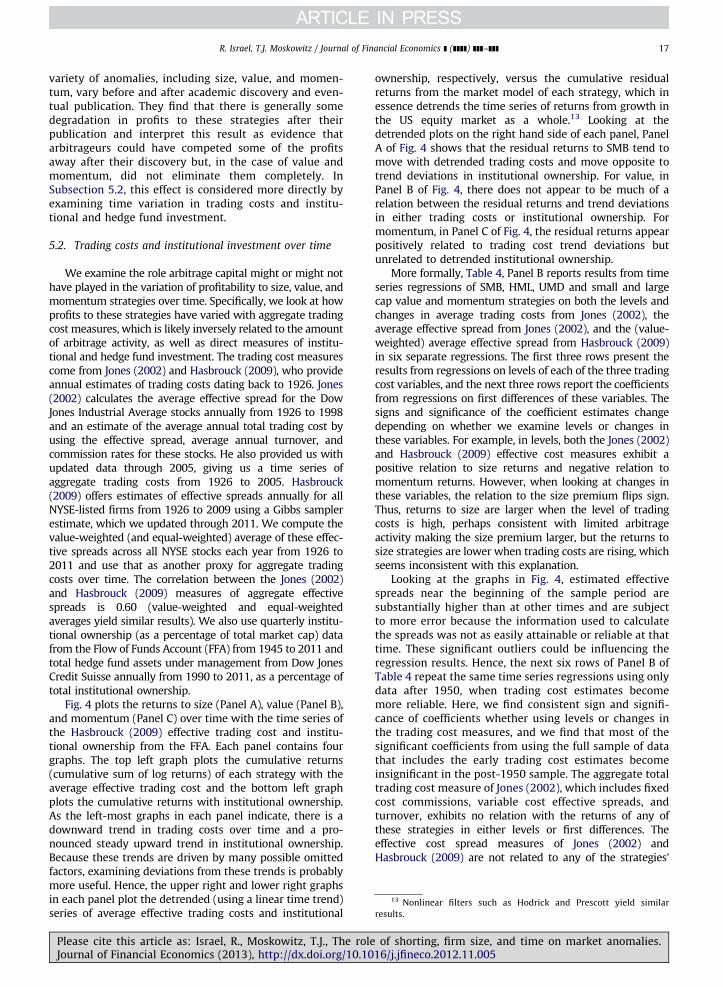
13 Nonlinear filters such as Hodrick and Prescott yield similar
results.
R. Israel, T.J. Moskowitz / Journal of Financial Economics ] (]]]]) ]]]–]]] 17
variety of anomalies, including size, value, and momen-tum, vary before and after academic discovery and even-tual publication. They find that there is generally somedegradation in profits to these strategies after theirpublication and interpret this result as evidence thatarbitrageurs could have competed some of the profitsaway after their discovery but, in the case of value andmomentum, did not eliminate them completely. InSubsection 5.2, this effect is considered more directly byexamining time variation in trading costs and institu-tional and hedge fund investment.
5.2. Trading costs and institutional investment over time
We examine the role arbitrage capital might or might nothave played in the variation of profitability to size, value, andmomentum strategies over time. Specifically, we look at howprofits to these strategies have varied with aggregate tradingcost measures, which is likely inversely related to the amountof arbitrage activity, as well as direct measures of institu-tional and hedge fund investment. The trading cost measurescome from Jones (2002) and Hasbrouck (2009), who provideannual estimates of trading costs dating back to 1926. Jones(2002) calculates the average effective spread for the DowJones Industrial Average stocks annually from 1926 to 1998and an estimate of the average annual total trading cost byusing the effective spread, average annual turnover, andcommission rates for these stocks. He also provided us withupdated data through 2005, giving us a time series ofaggregate trading costs from 1926 to 2005. Hasbrouck(2009) offers estimates of effective spreads annually for allNYSE-listed firms from 1926 to 2009 using a Gibbs samplerestimate, which we updated through 2011. We compute thevalue-weighted (and equal-weighted) average of these effec-tive spreads across all NYSE stocks each year from 1926 to2011 and use that as another proxy for aggregate tradingcosts over time. The correlation between the Jones (2002)and Hasbrouck (2009) measures of aggregate effectivespreads is 0.60 (value-weighted and equal-weightedaverages yield similar results). We also use quarterly institu-tional ownership (as a percentage of total market cap) datafrom the Flow of Funds Account (FFA) from 1945 to 2011 andtotal hedge fund assets under management from Dow JonesCredit Suisse annually from 1990 to 2011, as a percentage oftotal institutional ownership.
Fig. 4 plots the returns to size (Panel A), value (Panel B),and momentum (Panel C) over time with the time series ofthe Hasbrouck (2009) effective trading cost and institu-tional ownership from the FFA. Each panel contains fourgraphs. The top left graph plots the cumulative returns(cumulative sum of log returns) of each strategy with theaverage effective trading cost and the bottom left graphplots the cumulative returns with institutional ownership.As the left-most graphs in each panel indicate, there is adownward trend in trading costs over time and a pro-nounced steady upward trend in institutional ownership.Because these trends are driven by many possible omittedfactors, examining deviations from these trends is probablymore useful. Hence, the upper right and lower right graphsin each panel plot the detrended (using a linear time trend)series of average effective trading costs and institutional
Please cite this article as: Israel, R., Moskowitz, T.J., The roleJournal of Financial Economics (2013), http://dx.doi.org/10.10
ownership, respectively, versus the cumulative residualreturns from the market model of each strategy, which inessence detrends the time series of returns from growth inthe US equity market as a whole.13 Looking at thedetrended plots on the right hand side of each panel, PanelA of Fig. 4 shows that the residual returns to SMB tend tomove with detrended trading costs and move opposite totrend deviations in institutional ownership. For value, inPanel B of Fig. 4, there does not appear to be much of arelation between the residual returns and trend deviationsin either trading costs or institutional ownership. Formomentum, in Panel C of Fig. 4, the residual returns appearpositively related to trading cost trend deviations butunrelated to detrended institutional ownership.
More formally, Table 4, Panel B reports results from timeseries regressions of SMB, HML, UMD and small and largecap value and momentum strategies on both the levels andchanges in average trading costs from Jones (2002), theaverage effective spread from Jones (2002), and the (value-weighted) average effective spread from Hasbrouck (2009)in six separate regressions. The first three rows present theresults from regressions on levels of each of the three tradingcost variables, and the next three rows report the coefficientsfrom regressions on first differences of these variables. Thesigns and significance of the coefficient estimates changedepending on whether we examine levels or changes inthese variables. For example, in levels, both the Jones (2002)and Hasbrouck (2009) effective cost measures exhibit apositive relation to size returns and negative relation tomomentum returns. However, when looking at changes inthese variables, the relation to the size premium flips sign.Thus, returns to size are larger when the level of tradingcosts is high, perhaps consistent with limited arbitrageactivity making the size premium larger, but the returns tosize strategies are lower when trading costs are rising, whichseems inconsistent with this explanation.
Looking at the graphs in Fig. 4, estimated effectivespreads near the beginning of the sample period aresubstantially higher than at other times and are subjectto more error because the information used to calculatethe spreads was not as easily attainable or reliable at thattime. These significant outliers could be influencing theregression results. Hence, the next six rows of Panel B ofTable 4 repeat the same time series regressions using onlydata after 1950, when trading cost estimates becomemore reliable. Here, we find consistent sign and signifi-cance of coefficients whether using levels or changes inthe trading cost measures, and we find that most of thesignificant coefficients from using the full sample of datathat includes the early trading cost estimates becomeinsignificant in the post-1950 sample. The aggregate totaltrading cost measure of Jones (2002), which includes fixedcost commissions, variable cost effective spreads, andturnover, exhibits no relation with the returns of any ofthese strategies in either levels or first differences. Theeffective cost spread measures of Jones (2002) andHasbrouck (2009) are not related to any of the strategies’
of shorting, firm size, and time on market anomalies.16/j.jfineco.2012.11.005i

16 Fama and French (2012) do find a robust value premium in the
UK and Europe among smaller stocks. Because the Asness, Moskowitz,
and Pedersen (forthcoming) portfolios use primarily large-cap stocks
and are value weighted, the value premium is weaker.17 Asness (2011) argues that evidence exists of momentum in Japan
when evaluating momentum relative to a value strategy. As Asness
R. Israel, T.J. Moskowitz / Journal of Financial Economics ] (]]]]) ]]]–]]]18
returns in levels, and in changes appear to be significantlyrelated only to momentum, particularly small cap momen-tum. These results suggest that increases in trading costscoincide with momentum strategies becoming more profit-able, perhaps because higher trading costs limit arbitrageactivity that would otherwise dampen momentum. Becausemomentum is a much higher turnover strategy than size orvalue (Israel and Moskowitz, 2012), it makes sense thatvariable trading costs might impact momentum more sothan the other strategies. In addition, the fact that small capmomentum is particularly sensitive to effective trading costchanges is consistent with this conjecture.14,15
Panel C of Table 4 reports results from time seriesregressions of the strategies’ returns on beginning of yearinstitutional ownership levels (from 1945 to 2010) andchanges (from 1946 to 2010) as well as hedge fund assetsunder management divided by institutional ownership inboth levels (from 1990 to 2010) and changes (from 1991to 2010). Aside from SMB, which has a negative relationwith the level of institutional ownership and a positiverelation with changes in institutional ownership, consis-tent with Gompers and Metrick (2001), no significantrelation exists between trading strategy profits and insti-tutional ownership levels or changes. For hedge fundassets, the only marginally significant result is that smallcap momentum appears to do worse when either the levelof hedge fund assets is high or hedge fund assets areincreasing. This result is also consistent with arbitrageactivity, as proxied by hedge fund investment, loweringthe profits to momentum trading strategies, particularlyin small stocks, and is consistent with the results obtainedfrom effective trading costs above.
6. International and other asset class evidence
For further robustness on the importance of shorting, wealso examine the value and momentum portfolios of Asness,Moskowitz, and Pedersen (forthcoming) in internationalequity markets and other asset classes. The data span theJanuary 1972 to December 2011 time period, with somevariation in starting dates for some markets and asset classes.Here, we examine neither time variation in the returns tovalue and momentum because of the short sample periodnor the role of firm size because size is not an easily appliedcharacteristic in some asset classes (e.g., currencies orcommodities).
Table 5 reports the alphas (over the local marketindex) of return differences between the top and bot-tom third of value and momentum-sorted portfoliosfrom Asness, Moskowitz, and Pedersen (forthcoming) asdescribed in Section 2. Alphas are calculated relative tothe relevant MSCI index for each local market for theindividual stock strategies in the US, UK, Europe, andJapan and are calculated relative to an equal-weightedaverage of all securities in each asset class for the otherasset classes. The t-statistics of the alphas, the alpha of
14 Lagging the trading cost measures produces similar results as well.15 See Frazzini, Israel and Moskowitz (2012) for a detailed discussion
of the trading costs of asset pricing anomalies, including those examined in
this paper.
the long side only (Portfolio 3) and its t-statistic, andthe percentage of high minus low total profits comingfrom the long side are reported. We also report thet-statistic for whether the long side and short sidecontribution to profits are significantly different fromeach other. Panel A of Table 5 reports results for theindividual stock strategies globally, and Panel B ofTable 5 reports results for the other asset classes.
Beginning with the international stock data in Panel Aof Table 5, we see that value and momentum premia arerobust across international equity markets. These resultsare identical to those in Asness, Moskowitz, and Pedersen(forthcoming) and consistent with those in Fama andFrench (2012). The only exceptions seem to be the lackof a value premium in the UK and Europe and the lackof a momentum premium in Japan. All exhibit positiveprofits, but are statistically insignificant.16 The lack ofsignificance of value in the UK and Europe and lack of amomentum premium in Japan are perfectly consistentwith random chance.17 Long-only value portfolios exhibitpositive and significant alphas in every region and long-only momentum portfolios produce positive alphas inevery region that are also statistically significant, exceptfor Japan.
We also report results for global average portfolios, inwhich we weight each market by the inverse of its fullsample volatility (standard deviation of returns) such thateach market contributes an equal amount to total ex postvolatility because return volatility varies widely across assetclasses. (For example, the volatility of commodities andequities is about seven times that of fixed income instru-ments and about five times that of currencies.) The globalportfolios exhibit strong value and momentum effects inboth long-short and long-only contexts.
Examining the percentage of value and momentumprofits that come from the long side, we find that slightlymore than half of the value and momentum profits comefrom the long side (on average 59.4% for value and 59.2% formomentum). Statistically, we cannot reject that valueprofits are split evenly between the long and short sides,and we cannot reject that the long and short sides ofmomentum contribute equally to profits. Hence, a 50–50contribution from long and short positions seems to accu-rately reflect the composition of both value and momentumprofits across all markets. This is consistent with our earlierresults for US stock portfolios over a longer time period.
Panel B of Table 5 shows consistent value and momen-tum premia across diverse asset classes for both long-short and long-only portfolios. Consistent with our
(2011) and Asness, Moskowitz, and Pedersen, (forthcoming) argue the
strong negative correlation between value and momentum and strong
performance of value in Japan makes momentum returns in Japan look
weak when viewed on a stand-alone basis. The same argument can be
made to explain the apparent poor showing of value in the UK or Europe
over this period, when momentum was strong.

Table 5Profitability from long and short side of value and momentum portfolios across markets and asset classes.
Reported are the alphas (over the local market index) of return differences between the top and bottom third of value and momentum-sorted portfolios from Asness, Moskowitz, and Pedersen (forthcoming)
across international stock markets and asset classes. Results are reported for individual stock strategies from four regions: the US, UK, Europe (excluding UK), and Japan; and from 18 country equity indexes,
government bond futures from ten developed countries, ten currency forwards from ten developed countries relative to the US dollar, and 27 commodity futures. The details of each series are contained in
Asness, Moskowitz, and Pedersen, (forthcoming) and all returns are expressed in US dollars. Alphas are calculated relative to the relevant MSCI index for each local market for the individual stock strategies and
relative to an equal-weighted average of all contracts for the other asset classes. The t-statistics of the alphas, the alpha of the long side only (tretile 3) and its t-statistic, as well as the percentage of 3-1 profits
coming from the long side and a t-statistic for whether the long side and short side contribution to profits is significantly different are reported. Panel A reports results for the individual stock strategies; Panel B,
for the other asset classes. Also reported are results for global average portfolios, which are portfolios formed across markets and assets classes, in which each market and asset class is weighted by the inverse of
its full sample volatility (standard deviation of returns).
Panel A: International stocks
US UK Europe Japan Global stocks
February 1972–
December 2011
February 1972–
December 2011
February 1974–
December 2011
February 1974–
December 2011
February 1974–
December 2011
Value
Alpha of 3-1 spread 5.33 3.74 3.41 12.78 5.76
(t-statistic) (2.66) (1.58) (1.70) (4.78) (3.49)
Alpha of long side 3.62 3.22 2.84 5.64 3.42
(t-statistic) (3.17) (2.03) (2.27) (2.99) (3.58)
Percentage long side 68.0 86.1 83.4 44.1 59.4
Long¼short (t-statistic) (2.01) (1.60) (1.36) (�0.62) (1.12)
Momentum
Alpha of 3-1 spread 5.99 6.77 9.47 1.65 6.00
(t-statistic) (2.30) (2.68) (3.97) (0.54) (3.05)
Alpha of long side 3.69 3.60 5.91 0.65 3.55
(t-statistic) (2.34) (2.36) (4.12) (0.38) (3.13)
Percentage long side 61.5 53.1 62.4 39.3 59.2
Long¼short (t-statistic) (0.99) (0.18) (0.59) (�0.40) (1.14)
Panel B: Other asset classes
Equity indexes Currencies Fixed income Commodities Global other Global all assets
January 1978–
December 2011
January 1979–
December 2011
January 1982–
December 2011
January 1972–
December 2011
January 1982–
December 2011
January 1982–
December 2011
Value
Alpha of 3-1 spread 5.96 3.32 1.77 7.80 3.28 4.61
(t-statistic) (3.45) (1.81) (1.68) (2.02) (3.29) (4.33)
Alpha of long side 2.72 2.01 0.60 4.83 1.61 2.53
(t-statistic) (2.76) (2.01) (1.03) (2.34) (2.99) (4.24)
Percentage long side 45.6 60.5 34.0 61.9 49.0 55.0
Long¼short (t-statistic) (�0.54) (1.01) (�0.95) (1.14) (�0.16) (0.91)
Momentum
Alpha of 3-1 spread 8.37 3.49 �0.29 11.51 3.51 4.67
(t-statistic) (4.00) (1.83) (�0.29) (3.06) (3.14) (3.08)
Alpha of long side 4.43 2.02 �0.10 5.89 1.89 2.50
(t-statistic) (4.00) (2.02) (�0.17) (2.71) (3.15) (2.97)
Percentage long side 53.0 58.0 34.0 51.2 53.9 53.7
Long¼short (t-statistic) (0.57) (0.83) (�0.17) (0.17) (0.67) (0.53)
Ple
ase
citeth
isa
rticlea
s:Isra
el,
R.,
Mo
sko
witz,
T.J.,
Th
ero
leo
fsh
ortin
g,
firm
size,
an
dtim
eo
nm
ark
et
an
om
alie
s.Jo
urn
al
of
Fina
ncia
lE
con
om
ics(2
01
3),
http
://dx
.do
i.org
/10
.10
16
/j.jfin
eco
.20
12
.11
.00
5i
R.
Israel,
T.J.
Mo
sko
witz
/Jo
urn
al
of
Fina
ncia
lE
con
om
ics]
(]]]])]]]–
]]]1
9

Fig. 5. Long and short side contributions to value (VAL) and momentum (MOM) profitability across markets and asset classes. Plotted are the local
market alphas of the difference between the top and bottom third value-weighted portfolios formed on value and momentum across international
markets and asset classes. The contribution from the long side (top third) versus the short side (bottom third) is highlighted on the graph. The top graph
shows results across four international stock regions: US, UK, Europe, and Japan. The bottom graph shows results across four asset classes: equity indexes
(EQI), fixed income (FI), currencies (FX), and commodities (COM). Also reported are global averages across the regions and across asset classes, in which
each region or asset class is weighted by the inverse of its full sample volatility.
Please cite this article as: Israel, R., Moskowitz, T.J., The role of shorting, firm size, and time on market anomalies.Journal of Financial Economics (2013), http://dx.doi.org/10.1016/j.jfineco.2012.11.005i
R. Israel, T.J. Moskowitz / Journal of Financial Economics ] (]]]]) ]]]–]]]20

R. Israel, T.J. Moskowitz / Journal of Financial Economics ] (]]]]) ]]]–]]] 21
previous results, we find that the contribution from thelong side for value is 49%, and the contribution from thelong side for momentum is about 54%. Overall, across allmarkets and asset classes, the contribution to profitscomes equally from the long and short sides for bothvalue and momentum. Fig. 5 summarizes these findingsby plotting the alphas of value and momentum portfoliosacross markets and asset classes, highlighting the con-tribution from the long and short sides.
7. Conclusion
We examine the role of shorting, firm size, and time onsize, value, and momentum strategies over the last centuryin US data and over the last four decades in internationalstock markets and other nonstock asset classes. We find thatthe returns to value decrease with size over our sampleperiod and are insignificant for the largest stocks. Momen-tum premia are present in every size group and do not varyreliably across size groups over the entire sample period. Wefind no consistent evidence that momentum returnsdecrease with firm size as suggested by the literature. Wealso find that about half of value profits and half ofmomentum profits come from the long side. We find noevidence that shorting profits are more important formomentum, in contrast to claims in the literature. The roleof shorting and size on momentum profits previously shownin the literature are not a robust feature of the data. Using amuch longer time series and looking across other equity
Please cite this article as: Israel, R., Moskowitz, T.J., The roleJournal of Financial Economics (2013), http://dx.doi.org/10.10
markets and asset classes, we find no reliable size effect inmomentum or stronger role for shorting. However, thecontribution of long versus short positions does vary withfirm size. Short selling profits become more important formomentum strategies and less important for value strategiesas size increases, and they become less important formomentum and more important for value as size decreases.These patterns are generally consistent over time. Long-onlyversions of value and momentum also consistently yieldpositive alphas across size groups, across markets and assetclasses, and across time. Overall, the premium for momen-tum, whether long-short or long-only, appears to be con-sistently higher than that of value, especially among largecap stocks in which the value premium is weakest.
Finally, we examine whether profits to these strategieshave changed significantly over time or in relation to changesin trading costs or institutional and hedge fund investmentover time. We find little evidence that size, value, ormomentum premia have changed over time or are affectedby changes in institutional or hedge fund participation inmarkets and find only mild evidence that trading costs haveany relation to the profitability of these strategies. Our resultshave implications for understanding the nature of size, value,and momentum return premia and for implementing size,value, and momentum portfolios in practice.
Appendix A
See Fig. A1 and Tables A1–A4.
of shorting, firm size, and time on market anomalies.16/j.jfineco.2012.11.005i

Fig. A1. Other value measures’ long and short side alphas across size quintiles over time. Plotted are the CAPM alphas of the difference between Quintile 5 and Quintile 1 portfolios formed on five other measures of
value within size quintiles. The measures of value are: E/P, C/P, D/P, and [-Ret(1,60)], where the E/P and C/P portfolios begin in July 1951, the D/P portfolios begin in July 1927, and the –Ret(1,60) portfolios begin in July
1931. Results are reported over the full sample period from each measure’s start date to December 2011 and over three subperiods: January 1950 to December 1969, January 1970 to December 1989, and January 1990
to December 2011. The contributions to profits from the long side (Quintile 5) and short side (Quintile 1) are highlighted on each graph.
Ple
ase
citeth
isa
rticlea
s:Isra
el,
R.,
Mo
sko
witz,
T.J.,
Th
ero
leo
fsh
ortin
g,
firm
size,
an
dtim
eo
nm
ark
et
an
om
alie
s.Jo
urn
al
of
Fina
ncia
lE
con
om
ics(2
01
3),
http
://dx
.do
i.org
/10
.10
16
/j.jfin
eco
.20
12
.11
.00
5i
R.
Israel,
T.J.
Mo
sko
witz
/Jo
urn
al
of
Fina
ncia
lE
con
om
ics]
(]]]])]]]–
]]]2
2

Table A1Decile portfolios formed from other measures of value.
Reported are the average raw returns in excess of the one-month T-bill rate, Sharpe ratios, and CAPM alphas and t-statistics of value-weighted decile
portfolios formed on other measures of value: E/P, C/P, D/P, BE/ME and [-Ret(1,60)]. The difference between Deciles 10 and 1 (10-1) is also reported along
with the differences between the average of Deciles 9 and 10 and the average of Deciles 1 and 2 (9-2), the average of Deciles 8 through 10 and the average
of Deciles 1 through 3 (8-3), and the average of Deciles 7 through 10 and the average of Deciles 1 through 4 (7-4). The E/P and C/P portfolios begin in July
1951, the D/P portfolios begin in July 1927, and the –Ret(1,60) portfolios begin in July 1931. All series end in December 2011. Also reported are results for
the D/P and –Ret(1,60) portfolios over the common period 1951 to 2011, as well as BE/ME-sorted portfolios over the same period for comparison. Finally,
results from Decile portfolios from a composite index of value measures, which is the equal-weighted average of all five value measures [BE/ME, E/P, C/P,
D/P, and -Ret(1,60)] are also reported from 1926 to 2011, using all available value measures at each point in time.
Decile portfolios (value-weighted) Differences
1 2 3 4 5 6 7 8 9 10 10-1 9-2 8-3 7-4
E/P, 1951–2011
Raw excess 5.59 5.12 6.62 6.33 7.13 9.01 9.37 10.17 11.14 12.08 6.48 6.25 5.35 4.77
Sharpe 0.29 0.32 0.43 0.43 0.47 0.60 0.63 0.65 0.67 0.67 0.45 0.55 0.57 0.60
Alpha �2.12 �1.50 0.42 0.34 0.96 3.08 3.50 4.16 4.83 5.21 7.33 6.83 5.80 5.14
t-statistics (�2.12) (�2.17) (0.55) (0.45) (1.28) (3.57) (4.13) (4.19) (4.49) (4.43) (4.00) (4.70) (4.76) (4.99)
C/P, 1951–2011
Raw excess 5.49 6.08 5.69 7.18 7.66 7.45 8.18 9.04 10.47 12.15 6.67 5.53 4.80 3.85
Sharpe 0.29 0.38 0.37 0.46 0.49 0.48 0.55 0.59 0.67 0.67 0.47 0.49 0.50 0.48
Alpha �2.12 �0.50 �0.55 0.89 1.39 1.43 2.44 3.20 4.52 5.38 7.50 6.26 5.42 4.45
t-statistics (�2.31) (�0.70) (�0.73) (1.20) (1.73) (1.61) (2.71) (3.27) (4.52) (4.51) (4.14) (4.31) (4.44) (4.36)
D/P, 1927–2011
Raw excess 6.59 7.61 6.94 8.29 6.70 7.96 9.00 9.50 9.32 8.73 2.14 1.92 2.13 1.78
Sharpe 0.29 0.38 0.36 0.44 0.34 0.41 0.47 0.47 0.44 0.38 0.11 0.13 0.16 0.17
Alpha �1.44 0.31 �0.05 1.48 �0.34 1.19 2.30 2.56 2.23 1.47 2.91 2.41 2.48 2.06
t-statistics (�1.61) (0.43) (�0.07) (2.17) (�0.42) (1.41) (2.79) (2.61) (1.99) (0.99) (1.43) (1.45) (1.73) (1.76)
-Ret(�1,�60), 1931–2011
Raw excess 7.05 6.90 8.65 8.78 8.42 9.54 8.98 11.30 11.18 13.55 6.50 5.39 4.48 3.41
Sharpe 0.32 0.34 0.44 0.43 0.43 0.44 0.42 0.47 0.41 0.44 0.29 0.29 0.28 0.26
Alpha �1.37 �0.81 1.02 0.98 0.87 1.40 0.98 2.50 1.48 3.29 4.65 3.48 2.81 2.11
t-statistics (�1.46) (�1.13) (1.47) (1.29) (1.14) (1.59) (1.07) (2.15) (1.02) (1.68) (1.90) (1.72) (1.64) (1.47)
D/P, 1951–2011
Raw excess 6.59 7.61 6.94 8.29 6.70 7.96 9.00 9.50 9.32 8.73 2.14 1.92 2.13 1.78
Sharpe 0.29 0.38 0.36 0.44 0.34 0.41 0.47 0.47 0.44 0.38 0.11 0.13 0.16 0.17
Alpha �1.37 �0.91 �0.04 1.22 0.10 1.69 1.75 3.69 3.56 2.81 4.18 4.33 4.13 3.23
t-statistics (�1.44) (�1.19) (�0.05) (1.50) (0.11) (1.86) (1.98) (3.81) (3.23) (1.88) (2.05) (2.65) (3.02) (2.85)
-Ret(1,60), 1951–2011
Raw excess 7.05 6.90 8.65 8.78 8.42 9.54 8.98 11.30 11.18 13.55 6.50 5.39 4.48 3.41
Sharpe 0.32 0.34 0.44 0.43 0.43 0.44 0.42 0.47 0.41 0.44 0.29 0.29 0.28 0.26
Alpha �1.48 �0.47 0.97 1.79 1.85 1.95 1.57 2.59 1.95 1.91 3.39 2.90 2.47 1.80
t-statistics (�1.57) (�0.60) (1.27) (2.36) (2.41) (2.48) (1.92) (2.66) (1.79) (1.16) (1.58) (1.72) (1.71) (1.45)
BE/ME,1951–2011
Raw excess 6.65 7.68 7.85 7.58 8.38 8.88 9.00 10.83 11.66 12.54 5.89 4.93 4.28 3.57
Sharpe 0.33 0.40 0.42 0.36 0.43 0.41 0.39 0.45 0.44 0.39 0.26 0.28 0.28 0.28
Alpha �1.32 �0.11 0.69 0.47 1.84 1.76 2.02 3.42 3.66 3.66 4.99 4.38 3.83 3.26
t-statistics (�1.60) (�0.18) (1.06) (0.63) (2.32) (2.29) (2.22) (3.44) (3.48) (2.51) (2.51) (2.95) (3.09) (3.13)
Composite, 1926–2011
Raw excess 6.55 7.18 7.81 7.96 7.72 8.77 9.31 10.49 11.01 12.25 5.70 4.76 4.07 3.39
Sharpe 0.31 0.37 0.42 0.41 0.40 0.44 0.46 0.48 0.46 0.45 0.34 0.34 0.34 0.34
Alpha �1.34 �0.15 0.70 0.56 0.47 1.23 1.71 2.50 2.41 2.87 4.21 3.38 2.86 2.43
t-statistics (�2.00) (�0.32) (1.46) (1.09) (0.87) (1.92) (2.58) (2.87) (2.39) (2.11) (2.35) (2.30) (2.24) (2.31)
Please cite this article as: Israel, R., Moskowitz, T.J., The role of shorting, firm size, and time on market anomalies.Journal of Financial Economics (2013), http://dx.doi.org/10.1016/j.jfineco.2012.11.005i
R. Israel, T.J. Moskowitz / Journal of Financial Economics ] (]]]]) ]]]–]]] 23

Table A2Analyzing the size effect shown in Banz (1981).
Panel A reports the average raw returns in excess of the one-month T-bill rate, Sharpe ratios, and CAPM alphas
of value-weighted and equal-weighted decile portfolio spread returns formed on size over the full sample period
from July 1926 to December 2011 and over the original Banz (1981) sample period from January 1936 to
December 1975. The difference in returns between Deciles 1 and 10 (1-10) is reported. Panel B reports Fama and
MacBeth (1973) cross-sectional regression coefficients, in which the cross section of returns on 25 size and BE/ME
and one hundred size and BE/ME sorted portfolios are regressed each month on their market betas (b) and the log
of their average market capitalization [log(Size)]. The time series average of the coefficient estimates and the time
series t-statistics of those coefficients are reported over the full sample period July 1926 to December 2011 and
the original Banz (1981) sample period from January 1936 to December 1975. Betas are estimated over each full
subsample.
Panel A: Size decile spread portfolio returns
Value weighted decile portfolio 1-10 spread
1926–2011 1936–1975 [Banz (1981) sample]
Raw excess 6.86 7.12
Sharpe 0.26 0.29
Alpha 3.03 2.30
(1.14) (0.63)
Equal weighted decile portfolio 1-10 spread
1926–2011 1936–1975 [Banz (1981) sample]
Raw excess 11.81 11.30
Sharpe 0.41 0.41
Alpha 8.38 6.84
(2.81) (1.62)
Panel B: Fama and MacBeth coefficients
25 Size-BE/ME portfolios
1926–2011 1936–1975 [Banz (1981) sample]
b �0.204 �0.086
(�0.57) (�0.29)
log(Size) �0.076 �0.068
(�2.38) (�2.14)
100 Size-BE/ME portfolios
1926–2011 1936–1975 [Banz (1981) sample]
b 0.123 0.185
(0.37) (0.70)
log(Size) �0.067 �0.059
(�2.06) (�1.72)
Please cite this article as: Israel, R., Moskowitz, T.J., The role of shorting, firm size, and time on market anomalies.Journal of Financial Economics (2013), http://dx.doi.org/10.1016/j.jfineco.2012.11.005i
R. Israel, T.J. Moskowitz / Journal of Financial Economics ] (]]]]) ]]]–]]]24

Table A3Profitability of long and short side of value and momentum portfolios across size over sample periods from Hong, Lim, and Stein (2000), Grinblatt and Moskowitz (2004), and excluding those sample periods.
Reported are the CAPM alphas of return differences between Quintiles 5 and 1 of value and momentum sorted portfolios within size quintiles. The t-statistics of the return differences, the returns of the long
side only (Quintile 5) and its t-statistic, as well as the percentage of 5-1 profits coming from the long side and a t-statistic for whether the long side and short side contribution to profits is significantly different
are also reported. The differences between size Quintiles 1 (smallest) and 5 (largest) are also reported. Results pertain to value-weighted portfolios over five sample periods: January 1980 to December 1996
(pertaining to Hong, Lim, and Stein, 2000), July 1963 to December 1999 (pertaining to Grinblatt and Moskowitz, 2004), July 1963 to December 1999 excluding January 1980 to December 1996, January 1927 to
December 2011 excluding January 1980 to December 1996, and January 2000 to December 2011.
Momentum Value
Smallest Largest Smallest Largest
Size 1 Size 2 Size 3 Size 4 Size 5 Size 1-Size 5 Size 1 Size 2 Size 3 Size 4 Size 5 Size 1-Size 5
1980–1996, Hong, Lim, and Stein (2000)
Alpha of 5-1 spread 22.42 17.09 12.01 7.00 2.28 20.13 17.76 10.72 8.18 5.29 4.34 13.42
(t-statistic) (8.95) (5.77) (3.62) (1.75) (0.50) (5.54) (7.24) (3.81) (2.84) (1.88) (1.44) (4.44)
Alpha of long side 6.31 5.46 5.53 3.54 1.85 4.46 4.81 3.78 4.93 4.34 4.65 0.16
(t-statistic) (2.28) (2.29) (2.47) (1.81) (0.94) (1.38) (1.91) (1.75) (2.56) (2.33) (2.14) (0.05)
Percent long side 28.14 31.97 45.99 50.64 80.82 27.08 35.26 60.21 82.18 107.18
Long¼short (t-statistic) (1.77) (1.45) (0.26) (0.03) (0.55) (1.58) (0.83) (0.57) (1.65) (2.29)
1963–1999, Grinblatt and Moskowitz (2004)
Alpha of 5-1 spread 19.92 17.21 14.58 12.50 9.21 10.71 11.92 9.17 7.93 5.24 2.69 9.23
(t-statistic) (9.68) (7.83) (5.94) (4.76) (3.11) (4.36) (6.51) (4.48) (3.99) (2.54) (1.23) (4.04)
Alpha of long side 9.09 7.43 7.79 6.54 4.03 5.05 6.48 5.28 5.11 4.00 2.66 3.82
(t-statistic) (4.15) (4.09) (4.75) (4.69) (2.89) (2.05) (3.05) (2.94) (3.13) (2.55) (1.70) (1.65)
Percent long side 45.61 43.18 53.44 52.32 43.78 54.36 57.54 64.51 76.27 98.68
Long¼short (t-statistic) (0.39) (0.70) (0.36) (0.27) (0.70) (0.24) (0.44) (0.91) (1.49) (1.78)
1963–1999, (excluding 1980–1996)
Alpha of 5-1 spread 17.66 17.06 16.28 16.85 14.53 3.13 7.08 7.97 7.81 5.41 1.40 5.69
(t-statistic) (5.62) (5.36) (4.66) (4.88) (3.87) (0.97) (2.69) (2.71) (2.84) (1.82) (0.45) (1.70)
Alpha of long side 11.67 9.22 9.64 9.06 5.72 5.96 8.29 6.79 5.52 3.96 1.03 7.26
(t-statistic) (3.56) (3.45) (4.07) (4.61) (2.92) (1.66) (2.57) (2.49) (2.19) (1.66) (0.46) (2.15)
Percent long side 66.09 54.01 59.19 53.75 39.36 117.03 85.23 70.71 73.24 73.79
Long¼short (t-statistic) (0.86) (0.28) (0.74) (0.42) (1.50) (1.47) (1.17) (0.83) (0.87) (0.33)
1927–2011, (excluding 1980–1996)
Alpha of 5-1 spread 10.37 14.40 14.40 15.29 11.60 �1.25 11.97 5.87 4.28 1.32 2.04 9.61
(t-statistic) (3.66) (6.13) (5.39) (5.32) (4.21) (�0.49) (3.39) (2.70) (2.02) (0.55) (0.91) (2.37)
Alpha of long side 10.18 8.49 7.51 7.91 4.23 5.95 7.01 4.66 3.34 1.64 1.62 5.49
(t-statistic) (4.07) (4.65) (5.07) (5.89) (3.62) (2.24) (2.65) (2.24) (1.78) (0.83) (0.84) (2.10)
Percent long side 98.14 58.96 52.13 51.72 36.48 58.57 79.34 77.97 124.18 79.64
Long¼short (t-statistic) (2.05) (0.76) (0.26) (0.27) (2.01) (0.37) (1.01) (0.96) (1.01) (0.67)
2000–2011
Alpha of 5-1 spread 13.12 15.30 14.48 14.19 10.24 2.88 12.99 6.38 4.63 1.54 2.19 10.58
(t-statistic) (5.59) (7.66) (6.32) (5.72) (4.23) (1.31) (4.52) (3.41) (2.53) (0.74) (1.14) (3.21)
Alpha of long side 9.30 7.89 7.26 7.17 3.92 5.37 6.15 4.15 3.26 1.73 1.97 4.31
(t-statistic) (4.47) (5.13) (5.71) (6.24) (3.83) (2.40) (2.78) (2.38) (2.05) (1.04) (1.21) (1.97)
Percent long side 70.87 51.58 50.11 50.54 38.30 47.39 65.09 70.38 112.88 89.92
Long¼short (t-statistic) (1.34) (0.17) (0.02) (0.09) (1.78) (0.15) (0.67) (0.89) (1.18) (1.15)
Ple
ase
citeth
isa
rticlea
s:Isra
el,
R.,
Mo
sko
witz,
T.J.,
Th
ero
leo
fsh
ortin
g,
firm
size,
an
dtim
eo
nm
ark
et
an
om
alie
s.Jo
urn
al
of
Fina
ncia
lE
con
om
ics(2
01
3),
http
://dx
.do
i.org
/10
.10
16
/j.jfin
eco
.20
12
.11
.00
5i
R.
Israel,
T.J.
Mo
sko
witz
/Jo
urn
al
of
Fina
ncia
lE
con
om
ics]
(]]]])]]]–
]]]2
5

Table A4Profitability of long and short side of value and momentum portfolios for NYSE only and Nasdaq and Amex only stocks.
Reported are the CAPM alphas of return differences between Quintiles 5 and 1 of value and momentum sorted portfolios across size quintiles for NYSE only and Nasdaq and Amex only stocks. Size breakpoints
are based on NYSE stocks only for both the NYSE-only and Nasdaq and Amex only subsamples, so that the same breakpoints are used for each. The t-statistics of the return differences, the returns of the long
side only (Quintile 5) and its t-statistic, as well as the percentage of 5-1 profits coming from the long side and a t-statistic for whether the long side and short side contribution to profits is significantly different
are also reported. The differences between size Quintiles 1 (smallest) and 5 (largest) are also reported. Results pertain to value-weighted portfolios for NYSE stocks only from January 1927 to December 2011,
for NYSE stocks only from July 1963 to December 2011, and for Nasdaq and Amex stocks only from July 1963 to December 2011.
Smallest Largest Smallest Largest
Size 1 Size 2 Size 3 Size 4 Size 5 Size 1-Size 5 Size 1 Size 2 Size 3 Size 4 Size 5 Size 1-Size 5
Momentum Value
1927–2011, NYSE only
Alpha of 5-1 spread 13.09 13.28 12.21 10.94 9.41 3.69 8.11 3.25 2.81 2.18 3.92 4.18
(t-statistic) (5.31) (6.63) (5.75) (4.94) (4.08) (1.47) (2.62) (1.82) (1.72) (1.13) (2.03) (1.15)
Alpha of long side 10.95 7.22 7.04 5.99 4.38 6.57 6.14 3.88 2.88 3.15 4.04 2.10
(t-statistic) (5.20) (4.91) (5.91) (5.63) (4.54) (2.85) (2.74) (2.27) (1.83) (1.91) (2.40) (0.93)
Percent long side 83.60 54.38 57.66 54.72 46.52 75.78 119.54 102.58 144.48 102.94
Long¼short (t-statistic) (2.36) (0.64) (1.26) (0.94) (�0.37) (0.80) (1.57) (1.35) (2.36) (2.47)
1963–2011, NYSE only
Alpha of 5-1 spread 15.01 13.76 11.13 9.20 9.45 5.56 3.90 2.78 4.55 2.62 2.10 1.80
(t-statistic) (5.60) (5.54) (4.41) (3.63) (3.37) (2.05) (1.52) (1.51) (2.55) (1.37) (1.12) (0.62)
Alpha of long side 9.83 7.86 7.44 5.48 4.38 5.44 4.49 4.33 4.31 3.66 1.79 2.70
(t-statistic) (5.00) (4.71) (5.05) (4.19) (3.47) (2.41) (2.14) (2.60) (2.54) (2.34) (1.17) (1.24)
Percent long side 65.47 57.13 66.86 59.60 46.37 115.22 155.78 94.83 139.48 85.36
Long¼short (t-statistic) (2.31) (0.67) (1.21) (0.95) (�0.34) (0.87) (1.61) (1.32) (2.46) (2.53)
1963–2011, Nasdaq/Amex only
Alpha of 5-1 spread 15.85 16.56 15.52 16.23 16.18 �0.34 12.44 7.28 10.65 10.82 �2.05 14.49
(t-statistic) (5.97) (5.70) (4.80) (4.34) (3.50) (�0.08) (6.34) (2.82) (3.35) (2.92) (�0.48) (3.54)
Alpha of long side 9.07 8.19 6.37 6.85 7.77 1.30 7.93 5.19 7.52 8.90 �1.23 9.17
(t-statistic) (4.21) (3.88) (2.90) (3.02) (2.62) (0.41) (4.15) (2.63) (3.20) (2.96) (�0.36) (2.54)
Percent long side 57.24 49.45 41.05 42.21 47.99 63.79 71.33 70.60 82.21 60.17
Long¼short (t-statistic) (0.69) (�0.16) (�0.50) (�0.43) (�0.00) (0.99) (1.20) (1.67) (2.24) (0.01)
Ple
ase
citeth
isa
rticlea
s:Isra
el,
R.,
Mo
sko
witz,
T.J.,
Th
ero
leo
fsh
ortin
g,
firm
size,
an
dtim
eo
nm
ark
et
an
om
alie
s.Jo
urn
al
of
Fina
ncia
lE
con
om
ics(2
01
3),
http
://dx
.do
i.org
/10
.10
16
/j.jfin
eco
.20
12
.11
.00
5i
R.
Israel,
T.J.
Mo
sko
witz
/Jo
urn
al
of
Fina
ncia
lE
con
om
ics]
(]]]])]]]–
]]]2
6

R. Israel, T.J. Moskowitz / Journal of Financial Economics ] (]]]]) ]]]–]]] 27
References
Asness, C., 1994. Variables that explain stock returns. Ph.D. dissertation.University of Chicago, Chicago, IL.
Asness, C., 2011. Momentum in Japan: the exception that provesthe rule. Unpublished working paper. AQR Capital Management,Greenwich, CT.
Asness, C., Frazzini, A., 2012. The devil in HML’s details. Unpublishedworking paper. AQR Capital Management, Greenwich, CT.
Asness, C., Moskowitz, T., Pedersen, L. Value and momentum every-where. Journal of Finance, forthcoming.
Avramov, D., Chordia, T., Jostova, G., Philipov, A., 2007. Momentum andcredit rating. Journal of Finance 62, 2503–2520.
Avramov, D., Chordia, T., Jostova, G., Philipov, A., 2012. Anomalies andfinancial distress. Unpublished working paper. Emory University,Atlanta, GA.
Banz, R., 1981. The relationship between return and market valueof common stocks. Journal of Financial Economics 9, 3–18.
Carhart, M., 1997. On persistence in mutual fund performance. Journalof Finance 52, 57–82.
Chan, L., Hamao, Y., Lakonishok, J., 1991. Fundamentals and stock returnsin Japan. Journal of Finance 46, 1739–1764.
Chordia, T., Subrahmanyam, A., Tong, Q., 2012. Whither cross-sectionalreturn predictability. Unpublished working paper. Universityof California, Los Angeles, CA.
Daniel, K., Moskowitz, T., 2012. Momentum crashes. Unpublished work-ing paper. University of Chicago, Chicago, IL.
DeBondt, W., Thaler, R., 1985. Does the stock market overreact? Journalof Finance 40, 793–805.
DeBondt, W., Thaler, R., 1987. Further evidence on investor overreactionand stock market seasonality. Journal of Finance 42, 557–581.
Fama, E., 1976. Foundations of Finance. Basic Books, New York, NY.Fama, E., French, K., 1992. The cross section of expected stock returns.
Journal of Finance 47, 427–465.Fama, E., French, K., 1993. Common risk factors in the returns on stocks
and bonds. Journal of Financial Economics 33, 3–56.Fama, E., French, K., 1996. Multifactor explanations of asset pricing
anomalies. Journal of Finance 51, 55–84.Fama, E., French, K., 1998. Value versus growth: the international
evidence. Journal of Finance 53, 1975–1999.Fama, E., French, K., 2008. Dissecting anomalies. Journal of Finance 63,
1653–1678.Fama, E., French, K., 2012. Size, value, and momentum in international
stock returns. Unpublished working paper. University of Chicago,Chicago, IL.
Fama, E., MacBeth, J., 1973. Risk, return, and equilibrium: empirical tests.Journal of Political Economy 81 (3), 607–636.
Frazzini, A., 2006. The disposition effect and under-reaction to news.Journal of Finance 61 (4), 2017–2046.
Frazzini, A., Israel, R., Moskowitz, T., 2012. Trading costs of asset pricinganomalies. Unpublished working paper. University of Chicago, Chi-cago, IL.
French, K., 2012. Data library. /http://mba.tuck.dartmouth.edu/pages/faculty/ken.french/data_library.htmlS.
Gompers, P., Metrick, A., 2001. Institutional investors and equity prices.Quarterly Journal of Economics 116, 229–259.
Please cite this article as: Israel, R., Moskowitz, T.J., The roleJournal of Financial Economics (2013), http://dx.doi.org/10.10
Goyal, A., Wahal, S., 2012. Is momentum an echo? Unpublished workingpaper. Arizona State University, Tempe, AZ.
Griffin, J., Ji, S., Martin, S., 2003. Momentum investing and business cyclerisk: evidence from pole to pole. Journal of Finance 58, 1547–2515.
Grinblatt, M., Han, B., 2005. Prospect theory, mental accounting, andmomentum. Journal of Financial Economics 78, 311–339.
Grinblatt, M., Moskowitz, T., 2004. Predicting stock price movementsfrom past returns: the role of consistency and tax-loss selling.Journal of Financial Economics 71, 541–579.
Hasbrouck, J., 2009. Trading costs and returns for U.S. equities: estimat-ing effective costs from daily data. Journal of Finance 64, 1445–1477.
Hawawini, G., Keim, D.B., 1995. On the predictability of commonstock returns: world-wide evidence. In: Jarrow, R.A., Maksimovic,V., Ziemba, W.T. (Eds.), Handbooks in Operations Research andManagement Science, Vol. 9, Finance, North-Holland, pp. 497–537.
Hong, H., Lim, T., Stein, J., 2000. Bad news travels slowly: size, analystcoverage, and the profitability of momentum strategies. Journal ofFinance 55, 265–295.
Hong, H., Stein, J., 1999. A unified theory of underreaction, momentumtrading and overreaction in asset markets. Journal of Finance 54,2143–2184.
Israel, R., Moskowitz, T., 2012, How tax efficient are equity styles?Unpublished working paper. University of Chicago, Chicago, IL.
Jegadeesh, N., Titman, S., 1993. Returns to buying winners and sellinglosers: implications for stock market efficiency. Journal of Finance48, 65–91.
Jegadeesh, N., Titman, S., 2001. Profitability of momentum strategies: anevaluation of alternative explanations. Journal of Finance 56,699–720.
Jegadeesh, N., Titman, S., 2005. Momentum: a review. In: Thaler, R. (Ed.),Advances in Behavioral Finance, Princeton Press, Princeton, NJ.
Jones, C., 2002. A century of stock market liquidity and trading costs.Unpublished working paper. Columbia University, New York, NY.
Lakonishok, J., Shleifer, A., Vishny, R.W., 1994. Contrarian investment,extrapolation, and risk. Journal of Finance 49, 1541–1578.
Lee, C., Swaminathan, B., 2000. Price momentum and trading volume.Journal of Finance 55, 2017–2070.
McLean, R.D., Pontiff, J., 2012. Does academic research destroy stockreturn predictability? Unpublished working paper. Boston College,Boston, MA.
Moskowitz, T.J., Grinblatt, M., 1999. Do industries explain momentum?Journal of Finance 54, 1249–1290.
Novy-Marx, R., 2012. Is momentum really momentum? Journal ofFinancial Economics 103, 429–453.
Roll, R., 1983. Vas ist das? the turn-of-the-year effect and the returnpremia of small firms. Journal of Portfolio Management 9, 18–28.
Rosenberg, B., Reid, K., Lanstein, R., 1985. Persuasive evidence of marketinefficiency. Journal of Portfolio Management 11, 9–17.
Rouwenhorst, K.G., 1998. International momentum strategies. Journal ofFinance 53, 267–284.
Schwert, W., 2003. Anomalies and market efficiency. In: Constantinides,G., Harris, M., Stulz, R.M. (Eds.), Handbook of the Economics ofFinance, Elsevier Science, pp. 937–972.
Sharpe, W.F., 1964. Capital asset prices: a theory of market equilibriumunder conditions of risk. Journal of Finance 19, 425–442.
Stattman, D., 1980. Book values and stock returns. Chicago MBA:A Journal of Selected Papers 5, 25–45.
of shorting, firm size, and time on market anomalies.16/j.jfineco.2012.11.005i