Embed Size (px)
Citation preview

THE ROLE OF SHOCKS AND INSTITUTIONS IN THERISE OF EUROPEAN UNEMPLOYMENT: THE
AGGREGATE EVIDENCE�
Olivier Blanchard and Justin Wolfers
Two key facts about European unemployment must be explained: the rise in unemploymentsince the 1960s, and the heterogeneity of individual country experiences. While adverse shockscan potentially explain much of the rise in unemployment, there is insuf®cient heterogeneityin these shocks to explain cross-country differences. Alternatively, while explanations focusingon labour market institutions explain current heterogeneity well, many of these institutionspre-date the rise in unemployment. Based on a panel of institutions and shocks for 20 OECDnations since 1960 we ®nd that the interaction between shocks and institutions is crucial toexplaining both stylised facts.
Fig. 1 shows the evolution of unemployment in Europe since 1960. The ®gureplots average unemployment rates over 5-year intervals, starting in 1960, bothfor the OECD-Europe as a whole (the line) and for 15 individual OECD-Europe countries.1 It shows the increase in the overall unemployment rate,from 1.7% in the early 1960s to 11.0% in the mid 1990s, together with thelarge dispersion in unemployment rates across countries, from 4.0% in Switzer-land to more than 20% in Spain in the mid 1990s.
Explanations for these evolutions fall into three classes:
· Explanations that focus on the role of adverse economic shocks. Adverseshocks can indeed increase the unemployment rate, at least for some time.And there are many plausible candidates for such adverse shocks over the last30 years. As unemployment started rising in the 1970s, the focus was on oilprice increases and the TFP growth slowdown. Since then, the evolution of thereal interest rate, and other shifts in labour demand have been added to thelist. Explanations based solely on shocks run, however, into a major empiricalproblem. Shocks can potentially explain the general increase in unemploy-
The Economic Journal, 110 (March), C1±C33. # Royal Economic Society 2000. Published by BlackwellPublishers, 108 Cowley Road, Oxford OX4 1JF, UK and 350 Main Street, Malden, MA 02148, USA.
[ C1 ]
� Harry Johnson Lecture. We thank Steve Nickell, Ed Lazear, John Addison and Paula Adam at theOECD for providing us with some of the data. We also thank Daron Acemoglu, Alberto Alesina, TitoBoeri, Bill Brainard, David Blanch¯ower, Peter Diamond, Ben Friedman, Jenny Hunt, Larry Katz, SteveNickell, Andrew Oswald, Steve Pischke, Chris Pissarides, Chris Sims, Betsey Stevenson, and RobertSolow for useful suggestions and comments. An appendix containing the data, the programs, anddescribing the construction of the data, is available at http://web.mit.edu/blanchar/www/articles.html
1 The 8 time periods are 1960±4 to 1990±4, and 1995� (typically 1995±6.) The 15 countriesincluded in OECD-Europe are Austria (AUT), Belgium (BEL), Denmark (DNK), Finland (FIN), France(FRA), Germany (DEU), Ireland (IRE), Italy (ITA), the Netherlands (NLD), Norway (NOR), Portugal(PRT), Spain (ESP), Sweden (SWE), Switzerland (CHE) and the United Kingdom (GBR). Left out areGreece, Iceland and Luxembourg, for which we could not construct time series for all the explanatoryvariables used later in the article. The unemployment rates are the rates according to nationalde®nitions, rather than standardised ratesÐwhich typically do not exist back to 1960. (For the periodwhen both unemployment rates exist, using one or the other makes little difference.) Also, while the®gures only show what has happened in Europe, the regressions we run later look at all available OECDcountries; they include, in addition to Europe, the United States (USA), Canada (CAN), Australia(AUS), New Zealand (NZL) and Japan (JPN).

ment over time. But, as we shall see, they do not differ enough across countriesto explain the cross-country variation so evident in Fig. 1.
· Explanations that focus on the role of adverse labour market institutions.Labour market institutions affect the nature of unemployment, and some canindeed potentially generate a high unemployment rate. With the persistenceof high unemployment for now more than two decades, explanations based onadverse institutions (`labour market rigidities') have become steadily morepopular. Explanations based solely on institutions also run however into amajor empirical problem: many of these institutions were already presentwhen unemployment was low (and similar across countries), and, while manybecame less employment-friendly in the 1970s, the movement since then hasbeen mostly in the opposite direction. Thus, while labour market institutionscan potentially explain cross country differences today, they do not appearable to explain the general evolution of unemployment over time.
· Explanations that focus on the interaction of adverse shocks with adversemarket institutions. Some institutions may affect the impact of shocks onunemployment. For example, better coordination in bargaining may lead to afaster adjustment of real wages to a slowdown in productivity growth. Someinstitutions may affect the persistence of unemployment in response to shocks.For example, if labour market institutions lead to a labour market with longunemployment duration, adverse shocks are more likely to lead some of theunemployed to become disenfranchised, reducing the pressure of unemploy-ment on wages, thereby slowing, and possibly even halting the return to lower
1960 1970 1980 1990 2000period
0
0.1
0.2
0.3
Note: line links average unemployment rate for the E15.Mnemonics are listed in footnote 1.
Fig. 1. Unemployment Rate, E15
C2 [ M A R C HT H E E C O N O M I C J O U R N A L
# Royal Economic Society 2000

unemployment. It is easy to see what makes this third class of explanationsattractive. It has the potential to explain not only the increase in unemploy-ment over time (through adverse shocks), but also the heterogeneity ofunemployment evolutions (through the interaction of the shocks with differ-ent labour market institutions).
In a companion paper (Blanchard, 1999), we took stock of the underlyingalternative theories. We looked at whether and how different shocks anddifferent institutions may affect the unemployment rate. We looked at thechannels through which shocks and institutions might interact. This led us toargue in favour of the third class of explanations. In this article, we look at theaggregate empirical evidence more formally, at the role of shocks, institutions,and interactions, in accounting for the evolution of European unemployment.
To do so, we look at the data through two panel data speci®cations. In the®rst, we assume unobservable but common shocks across countries. In thesecond, we construct and use country-speci®c time series for a number ofshocks. In both speci®cations, we allow for an interaction between shocks andinstitutions: The effect of a given shock on unemployment is allowed todepend on the set of labour market institutions of the country.
We see the results as surprisingly (at least given our priors) good: Speci®ca-tions that allow for shocks, institutions, and interactions can account both formuch of the rise and much of the heterogeneity in the evolution of unemploy-ment in Europe. The magnitudes of the effects of the shocks on unemploy-ment are plausible. The magnitudes of the effects of institutions are equally so.And their interactions explain much of the difference across countries.
These results notwithstanding, three caveats are in order. First, the resultsare preliminary. In many cases, we do not have time series for institutions, andthe series we have may not be very good. Second, the results are typicallyweaker when we allow for time-varying rather than time-invariant measures forinstitutions. This gives some reasons to worry. Last, the fact that the speci®ca-tions ®t the data does not prove that the underlying theories are right; just thatthey are not obviously inconsistent with the aggregate data.
We believe we are the ®rst to analyse the panel data evidence lookingsimultaneously at shocks, institutions and interactions. But we build on a largenumber of previous studies. Bruno and Sachs (1985) were among the ®rst toemphasise both shocks and institutions in the initial rise in unemployment. Anempirical attempt to explain UK unemployment as a result of shocks, institu-tions, and interactions was presented by Layard et al. (1991) in their book onunemployment. Two recent in¯uential studies are by Phelps (1994) and byNickell (1997). We differ mostly from Phelps by allowing for institutions, andfor interactions. We differ mostly from Nickell by allowing for observableshocks, and by having a panel data dimension going back to the 1960s. Ourresults are partly consistent with those of Phelps with respect to shocks, andlargely consistent with those of Nickell with respect to institutions.
Our article is organised as follows: Section 1 looks at shocks, both acrosscountries and over time. Section 2 does the same for institutions. Section 3
2000] C3T H E R O L E O F S H O C K S A N D I N S T I T U T I O N S
# Royal Economic Society 2000

discusses potential interactions between shocks and institutions. Section 4reports the results of estimation under the assumption of unobservable butcommon shocks across countries. Section 5 reports the results of estimationusing country-speci®c time series for shocks. Section 6 concludes.2
1. Shocks
Three shocks appear to have played an important role in the increase inEuropean unemployment. (This short declarative sentence conveys morecertainty than is justi®ed. Caveats follow.)
1.1. The Decline in TFP Growth
Starting in the early 1970s, Europe suffered a large decrease in the underlyingrate of total factor productivity (TFP) growth. This is shown in Fig. 2.3 The twolines in Fig. 2a give the evolution of the average rate of TFP growth for the 15countries of OECD-Europe (E15 in what follows) and for the 5 largest Euro-pean countries, France, Germany, Italy, Spain, and the United Kingdom (E5).To give a sense of the heterogeneity across countries, Fig. 2b gives theevolution of TFP growth in each of the E5 countries. (Showing all 15 countrieswould clutter the ®gure but yield similar conclusions). TFP growth which hadbeen close to 5% in the 1960s decreased to 3% in the ®rst half of the 1970s,and to 2% in the second half of the 1970s. It has remained around 2% sincethen. The decline has affected countries in roughly similar fashion.4
The decrease in TFP growth was initially partially hidden by the largeincrease in the relative price of oil and other raw materials. Thus, much of thefocus of the initial research (for example Bruno and Sachs (1985)) was on thisincrease in relative prices rather than on the slowdown in TFP growth. Inretrospect, the slowdown in TFP growth from its unusually high level in the®rst 30 years after World War II was surely the more important shock of theperiod.5
There is no question that a slowdown in TFP growth can lead to a higherequilibrium unemployment rate for some time (we prefer to use `equilibriumrate' rather than `natural rate', but the meaning is the same.) All that isneeded is that it takes some time for workers and ®rms to adjust expectationsto the new lower underlying rate, leading to wage growth in excess of pro-
2 We shall use the existence of the companion paper as an excuse for keeping our discussion oftheoretical issues, and of relevant references, to a minimum.
3 We ®rst construct the rate of TFP growth for each year and each country. We do so by computingthe Solow residual for the business sector, and then dividing it by the labour share in the sector. Underthe assumption of Harrod neutral technological progressÐthe assumption that allows for steady stategrowthÐthis is the right measure of technological progress, and gives the rate at which real wages cangrow along the balanced growth path. We then take averages for each 5-year period, for each country.E5 and E15 are constructed as simple (unweighted) averages of TFP growth over countries.
4 Note that, in contrast to the other observations which are based on ®ve yearly observations, theobservation for 1995 is typically based on only one year (1995) or two years (1995 and 1996). Thus, oneyear can make a lot of difference. This is the case for Italy in this ®gure.
5 An early article on that theme is Grubb et al. (1982).
C4 [ M A R C HT H E E C O N O M I C J O U R N A L
# Royal Economic Society 2000

ductivity growth for some time. Can the effects of such a slowdown onunemployment be permanent? Theory suggests that the answer, to a ®rstapproximation, is no. Once expectations have adjusted, the effect on unem-ployment should mostly go away. There lies the ®rst puzzle of Europeanunemployment. The initial shock is clearly identi®ed. But, after more than
Fig. 2. TFP Growth (a) E15 and E5 (b) E5
E15 (simple average) E5 (simple average)
1960 1970 1980 1990 2000
5-Year period
0
0.02
0.04
0.06A
nnua
l rat
e of
TF
P g
row
th
1960 1970 1980 1990 20005-Year period
20.05
0
0.05
0.1
Ann
ual r
ate
of T
FP
gro
wth
2000] C5T H E R O L E O F S H O C K S A N D I N S T I T U T I O N S
# Royal Economic Society 2000

twenty years, it is hard to believe that its effects are not largely gone. So, whataccounts for today's high unemployment? There is much less agreement here,but two other shocks appear relevant.
1.2. The Real Interest Rate
Fig. 3a gives the evolution of the average real interest rate for both the E15and the E5. Fig. 3b gives the real interest rate for each of the E5 countries.6
Fig. 3 shows that, both for the E15 and E5 countries, the real rate turnedfrom positive in the 1960s to sharply negative in the second half of the 1970s,and then to large and positive in the 1980s and the 1990s. For some countries,the decline in the 1970s was nearly as dramatic as the ensuing increase. Fig. 3bshows how the real rate in Spain went down from 2% in the 1960s to ÿ5% inthe mid 1970s, back to 5% in the 1980s and the 1990s. For others, such asGermany, the real rate has remained much more stable.
Why might such changes in the real interest rate affect the equilibriumunemployment rate?7 Because they are likely to affect capital accumulation,and so, at a given wage (and thus a given ratio of employment to capital), toshift labour demand. Are the effects on unemployment likely to be perma-nent? Theory is largely agnostic here. Again, a plausible answer is that long runeffects, if present, are likely to be small.
It is clear from Fig. 3 that the pattern of interest rates may help explain whyunemployment kept increasing in the 1980s, even as the effects of lower TFPgrowth on unemployment wereÐpresumablyÐdeclining. This suggests that,had real interest rates been stable, unemployment would have been higher inthe 1970s, and lower in the 1980s. Put another way, the low real interest ratesof the 1970s delayed some of the increase in unemployment by a decade or so.The higher real interest rates since the early 1980s may help explain whyunemployment has remained high in the 1980s and the 1990s.
1.3. Shifts in Labour Demand
Fig. 4 gives the evolution of the log of the labour share for both the E15 andthe E5 (normalised to equal zero in 1960). For both groups of countries, theevolution of the share is quite striking. After increasing in the 1970s, thelabour share started decreasing in 1980s and the decline has continued sincethen. For the E5, the labour share is now 10% lower than it was in 1960; for theE15, it is 8% lower.
Why look at the evolution of the labour share? Suppose that technology were
6 We ®rst compute the real interest rate for each year and each country, as the nominal long rate ongovernment bonds minus a ®ve-year average of lagged in¯ation. We then take averages for each 5-yearperiod.
7 The focus here is on the effects on the equilibrium unemployment rate. Changes in the realinterest rate also affect the deviation of actual unemployment from the equilibrium rate. We focus onthat effect below.
C6 [ M A R C HT H E E C O N O M I C J O U R N A L
# Royal Economic Society 2000

characterised by a Cobb-Douglas production function, both in the short andthe long run. The decrease in the share since the 1980s would then re¯ecteither technological bias away from labourÐa decrease in the coef®cient onlabour in the production functionÐor a decrease in the wage relative to themarginal product of labour. In either case, the implication would be an
Fig. 3. Real Interest Rate. (a) E15 and E5 (b) E5
E15 (simple average) E5 (simple average)
1960 1970 1980 1990 20005-Year period
20.02
0
0.02
0.04
0.06R
eal l
ong-
term
inte
rest
rat
e
1960 1970 1980 1990 20005-Year period
20.05
0
0.05
Rea
l lon
g-te
rm in
tere
st r
ate
2000] C7T H E R O L E O F S H O C K S A N D I N S T I T U T I O N S
# Royal Economic Society 2000

adverse shift in labour demand and thus a potential source of unemploymentin the 1980s and 1990s.8
The elasticity of substitution may be equal to one in the long run, but issurely less than one in the short run. In that case, movements in the share willalso re¯ect the dynamic response of factor proportions to factor prices.Indeed, much of the increase in the labour share in the 1970s surely re¯ectsthe effects of the increase in the real wage relative to TFP growth together witha low short-run elasticity of substitution, and some of the decrease since thenre¯ects the adjustment of proportions over time. In Blanchard (1997), weargued however that more has been at work than the adjustment of factorproportions to factor prices, and that the large decline in the share re¯ects agenuine adverse shift in labour demand.
We shall use the measure of the shift in labour demand constructed in thatearlier article. This measure can be thought of as the log of the labour sharepurged of the effects of factor prices on the share in the presence of a lowelasticity of substitution in the short run. Fig. 5a plots the evolution of thismeasure of the labour demand shift for both the E5 and the E15. Fig. 5b plotsthe evolution of the measure for each of the E5 countries. Both ®gures showhow the adjustment eliminates much of the increase and subsequent unwind-
1960 1970 1980 1990 20005-Year period
E15 (simple average) E5 (simple average)
20.1
20.05
0
0.05
0.1L
og la
bor
shar
e (1
9605
0)
Fig. 4. Log Labour Share, E15 and E5
8 Let Y � N a K 1ÿa . Let the ratio of the wage to the marginal product of labour w=Yn � ì. ì is equalto 1 under perfect competition in both goods and labour markets, but may differ from 1 otherwise.Then the share of labour á � aì. A decrease in á re¯ects a decrease in a or a decrease in ì. Also labourdemand can be written as log N � log Y ÿ log w � logá. A decrease in logá leads to an equal decreasein log N given output and the wage. This is why we look at the log share.
C8 [ M A R C HT H E E C O N O M I C J O U R N A L
# Royal Economic Society 2000

ing in the share in the 1970s (visible in Fig. 4). Fig. 5a shows little movementin the measure until the mid 1980s, with a strong decrease thereafter. Fig. 5bshows the sharp difference between the United Kingdom where, if anythingthe shift has been positive (the underlying labour share has remained roughly
Fig. 5. Labour Demand Shifts (a) E15 and E5 (b) E5
1960 1970 1980 1990 20005-Year period
E5 (simple average)E15 (simple average)
20.1
20.05
0
0.05L
abou
r de
man
d sh
ifts
(19
605
0)
1960 1970 1980 1990 20005-Year period
20.15
20.1
20.05
0
0.05
Lab
our
dem
and
shif
ts (
1960
50)
2000] C9T H E R O L E O F S H O C K S A N D I N S T I T U T I O N S
# Royal Economic Society 2000

constant) and countries such as Spain or France (where the adverse shift hasexceeded 10%).9
Such an adverse shift in labour demand can clearly lead to higher equili-brium unemployment for some time. Its dynamic effects however are quitedifferent from those of the two shocks we looked at earlier. Think for exampleof the shift as coming from a reduction in labour hoarding by ®rmsÐone ofthe interpretations suggested in Blanchard (1997). As ®rms get rid of redun-dant workers, the result will be a decrease in employment, and so an increasein unemployment. Thus, such a shift has the potential to explain whyunemployment has remained high in many countries in the 1990s. But thedecrease in labour hoarding also leads to higher pro®t, which in turn shouldlead, over time, to capital accumulation and higher employment. This is arelevant point to keep in mind when one thinks about the future. If it is thecase that such a shift is indeed responsible for some of the unemployment ofthe 1990s, then this suggests a brighter future, as the favourable effects startdominating and lead to an increase in employment over time.
1.4. Equilibrium Versus Actual Unemployment
We have focused so far on factors that affect equilibrium unemployment.There is no question however that part of the evolution of unemployment inEurope comes from the deviation of actual unemployment from equilibriumunemployment.
In environments of low to medium in¯ation, the change in in¯ation is likelyto be a good signal of where equilibrium unemployment is relative to actualunemployment. Decreasing in¯ation is likely to re¯ect an unemployment rateabove the equilibrium rate; increasing in¯ation re¯ects the reverse. Fig. 6ashows the evolution of the change in in¯ation for the E5 and the E15. Fig. 6bshows the evolution of the change in in¯ation for each of the E5.10 The changein in¯ation was positive in the 1970s, suggesting an actual unemployment ratebelow the equilibrium rate. The change in in¯ation has been negative sincethen, suggesting the equilibrium rate has been lower than the actual rate. Inother words, macroeconomic policy probably delayed some of the increase inunemployment from the 1970s to the 1980s. And, as in¯ation is still slowlydeclining, actual unemployment probably exceeds equilibrium unemploymentat this point. By how much is dif®cult to say: the relation between the changein in¯ation and the deviation of unemployment from its equilibrium may wellbe different at very low in¯ation.
Two caveats as we end this section. First, what we have taken as `shocks' are
9 This distinction between Anglo-Saxon and Continental countries is discussed in Blanchard (1997).The differences in evolutions re¯ects divergence rather than convergence of the shares in levels: Forthe last period (1995�), the labour share in the business sector was 62% for France and Spain, versus70% for the United Kingdom and 67% for the United States. (The caveat about the dangers ofcomparing share levels across countries applies.)
10 We ®rst construct the change in in¯ation (using the business sector GDP de¯ator) for each yearand each country. We then take the average for each 5-year period.
C10 [ M A R C HT H E E C O N O M I C J O U R N A L
# Royal Economic Society 2000

at best proximate causes, and should be traced to deeper causes. This isparticularly clear for real interest rates and labour demand shifts. Second,there may well have been other shocks, from increased turbulence (althoughthe quantitative evidence on this is not very supportive), to shifts in the relativedemand for skilled and unskilled workers (although, on this point as well, the
Fig. 6. Change in In¯ation Rate (a) E15 and E5 (b) E5
E15 (simple average) E5 (simple average)
1960 1970 1980 1990 20005-Year period
20.5
0.5
0
Ave
rage
ann
ual c
hang
e in
infl
atio
n ra
te(P
erce
ntag
e po
ints
per
yea
r)
1960 1970 1980 1990 20005-Year period
Ave
rage
ann
ual c
hang
e in
infl
atio
n ra
te(P
erce
ntag
e po
ints
per
yea
r)
21.0
20.5
0
0.5
1.0
2000] C11T H E R O L E O F S H O C K S A N D I N S T I T U T I O N S
# Royal Economic Society 2000

evidence for Europe is mixed. See for example Nickell and Bell (1994).) Wehave not explored their role here.
To conclude: This section suggests the following story. Europe was hit withmajor adverse shocks in the 1970s, oil price increases, but also, and moreimportantly, a large and sustained decrease in TFP growth. Unemploymentincreased, but the adverse impact was initially softened both by lower realinterest rates and an expansionary macroeconomic policy leading to less of anincrease in actual than in equilibrium unemployment. As the effect of theadverse shocks of the 1970s receded, higher interest rates and tight macro-economic policy contributed to higher equilibrium and actual unemploymentin the 1980s. Finally, adverse labour demand shifts can potentially account forwhy unemployment has remained high in the 1990s. Thus, shocks appear tohave the potential to explain the broad evolution of European unemployment.But, at least to the naked eye, differences in the evolution of unemploymentacross countries seem dif®cult to trace back to differences in shocks.
2. Institutions
While in the 1970s the discussion of the rise of unemployment focusedprimarily on shocks, the persistence of high unemployment for another twodecades has led to a shift in focus from shocks to labour market institutions.Indeed, many discussions of European unemployment ignore shocks alto-gether, and focus exclusively on `labour market rigidities'. What typicallyfollows is a long list of so-called `rigidities', from strong unions, to high payrolltaxes, to minimum wages, to generous unemployment insurance, to highemployment protection, and so on.
We have learned however from theory that things are more complicated.Some of the so-called rigidities may represent rough institutional correctionsfor other distortions in the labour market. Some institutions may be bad forproductivity, for output, and for welfare, but may not lead to an increase inunemployment. A short summary of the large literatureÐa literature largelytriggered by the rise in European unemploymentÐgoes as follows:11
· Some labour market institutions increase the equilibrium unemploymentrate. First among them is the unemployment insurance system. More generousinsurance increases unemployment through two separate channels: The ®rst,and the focus of most microeconomic empirical work, is lower search intensity.The second is the effect on the bargained wage at a given rate of unemploy-ment. Both combine to increase equilibrium unemployment duration, and, byimplication, the equilibrium unemployment rate.12
· Some labour market institutions change the nature of unemployment,
11 A longer discussion is given in our companion paper. A nice theoretical discussion is given byMortensen and Pissarides (1998). A wider ranging presentation of both theory and facts is given byNickell and Layard (1998).
12 The steady state unemployment rate is equal to unemployment duration times the ¯ow intounemployment as a ratio to the labour force. Unemployment bene®ts increase duration, and leave the¯ow roughly unchanged, increasing the unemployment rate.
C12 [ M A R C HT H E E C O N O M I C J O U R N A L
# Royal Economic Society 2000

but have an ambiguous effect on the equilibrium unemployment rate. This isthe case for employment protection. Employment protection both decreasesthe ¯ows of workers through the labour market, and increases the duration ofunemployment. This makes for a more stagnant labour market, with a higherproportion of long-term unemployed. But the effect of lower ¯ows and higherduration on the equilibrium rate itself is ambiguous.
· Some labour market institutions may not have much effect either on therate or on the nature of unemployment. Their incidence may be mainly on thewage, not on unemployment. This is the case for many of the components ofthe so called `tax wedge'. Some of these components are really not taxes, butrather payments for health bene®ts, or retirement: the effect of these compo-nents on unemployment should be small. As to the tax component, whatmatters is how taxes affect the ratio of after-tax unemployment bene®ts toafter-tax wages. Taxes which by their nature apply equally on the unemployedand the employed, such as consumption or income taxes, are likely to beroughly neutral. And if the unemployment insurance system tries to achieve astable relation of unemployment bene®ts to after-tax wagesÐa reasonableassumptionÐeven payroll taxes may not matter very much.
Turning to the evidence, the two relevant questions are: How much do labourmarket institutions vary across countries? And how have they evolved overtime?
Thanks to work by the OECD and by a large number of researchers, we havefairly good answers to the ®rst question. The state of knowledge has recentlybeen summarised by Nickell (1997) and Nickell and Layard (1998).13 In muchof what we do later, we shall use the data for institutions put together byNickell and described in those two articles. For the moment, suf®ce it to saythat, based on the measures which have been constructed for various labourmarket institutions, and the cross section evidence: (1) there is substantialheterogeneity across European countries and (2) this heterogeneity appears tohave the potential to explain differences in unemployment rates acrosscountries today: countries with high unemployment rates typically have lessemployment-friendly institutions.
This raises the second question, the evolution of institutions over time. Thebasic question is a simple one. Have European labour market institutionsbecome steadily worse since the early 1970s (in which case explanations basedsolely on institutions can potentially explain the evolution of unemployment)?Or do they in fact date back much further, to a time when unemployment wasstill low (in which case explanations based solely on institutions face a majorpuzzle)? The question is simple, but the answer is not.
Time series for at least part of the period and a subset of countries havebeen put together for some institutionsÐreplacement rates, unionisation, thetax wedgeÐby the OECD and other researchers. But, in general, our know-
13 In addition to the references in these two articles: For a recent comparison of various measures ofunemployment insurance, see Salomaki and Munzi (1999). For a recent comparison of measures ofemployment protection, see OECD (1999), Chapter 2.
2000] C13T H E R O L E O F S H O C K S A N D I N S T I T U T I O N S
# Royal Economic Society 2000

ledge of the evolution of institutions is rather limited. We shall look here attwo institutions only, unemployment insurance, and employment protection.
· The OECD has constructed a measure of the replacement rate for eachcountry, every two years, going back to 1961. The measure is an average of thereplacement rates for different categories of workers, different family situa-tions, and different durations of unemployment. Each replacement rate isconstructed as the ratio of pre-tax social insurance and social assistancebene®ts to the pre-tax wage. Fig. 7a gives the evolution of this measure of thereplacement rate, for each 5-year period, for each of the E5 countries. The®gure clearly shows the different evolutions across countries. In Germany,France, and the United Kingdom, the replacement rate was relatively high tostart; it has increased a bit in France, decreased a bit in Germany, decreased abit more in the United Kingdom. In Spain and Italy, the replacement rate wasvery low at the start. It increased in the 1960s in Spain, and only more recentlyin Italy. Both are now at levels comparable to other countries. In short, there isno simple common trend.
The OECD measure is a summary measure of the replacement rate, andin some ways, not a very attractive one. It gives equal weight to the replacementrate in year 1 of an unemployment spell, to the average replacement rate inyears 2 and 3, and to the average replacement rate for years 4 and 5; but giventhe exit rate from unemployment, the generosity of bene®ts in years 4 and 5for example is clearly less important for the determination of unemploymentthan the generosity of unemployment in year 1. Fig. 7b provides a differentangle by showing the maximum replacement rate over all categories and alldurations of unemployment for each country and each subperiod. What clearlycomes out is how this rate increased until the late 1970s, and how (except forItaly, which has converged from a low maximum replacement rate to theEuropean average) it has decreased since then. In other words, the worstexcesses have been largely eliminated. This may be more important thanchanges in the average replacement rate.
· Putting together series on employment protection is dif®cult. We havetaken a ®rst step by constructing series based on recent work by the OECD(see OECD (1999)), as well as on earlier work by Lazear (1990)). Details ofconstruction are given in the appendix. There are a number of reasons whythese series are at best rough approximations to the evolution of employmentprotection. In particular, the OECD data, which we use to construct themeasures from 1985 on, are based on a much broader set of dimensions ofemployment protection than the Lazear series (notice period and severancepay for a blue collar worker with ten years seniority) which we use to constructthe series before 1985.
This caveat notwithstanding, Fig. 8 shows the evolution of the employ-ment protection index for the E5 countries since 1960. (The ®gure for the E15would be harder to read, but yield similar conclusions). Note again thediversity of evolutions, and the lack of a simple answer.
Spain and Italy appear to have had high employment protection
C14 [ M A R C HT H E E C O N O M I C J O U R N A L
# Royal Economic Society 2000

throughout. Employment protection in Spain was high even under Franco,before unemployment increased. In both countries, employment protectionhas decreased since the mid 1980sÐin Spain, largely because of the develop-ment of ®xed term contracts rather than the weakening of protection forworkers on inde®nite contracts. In France and Germany, employment protec-
Fig. 7. Replacement Rates, E5
1960 1970 1980 1990 20005-Year period
0
10
20
30
40O
EC
D s
umm
ary
repl
acem
ent r
ate
(a) OECD
1960 1970 1980 1990 20005-Year period
0
50
100
Max
imum
rep
lace
men
t rat
e
(b) Maximum
2000] C15T H E R O L E O F S H O C K S A N D I N S T I T U T I O N S
# Royal Economic Society 2000

tion was low to start with, then increased in the late 1960s and early 1970s, andhas been roughly stable since then.14
To conclude: There is enough heterogeneity in labour market institutionswithin Europe to explain potentially differences in unemployment rates today.As to the evolution of institutions over time, it is clear that neither the view thatlabour market institutions have been stable through time, nor the view thatlabour market rigidities are a recent development are right. Some countrieshave had these institutions for a long time, others have acquired them morerecently. There clearly was an increase in employment-unfriendly institutionsin the late 1960s and early 1970s. Since then, there appears to have been asmall but steady decline.
3. Interactions
Our review of facts makes clear why it is tempting to look for explanations ofthe rise of European unemployment based on the interaction of shocks andinstitutions: Adverse shocks can potentially explain the general increase inunemployment. Differences in institutions can potentially explain differencesin outcomes across countries. This is indeed the direction that has been
1960 1970 1980 1990 20005-Year period
0
1
2
3
4
Em
ploy
men
t Pro
tect
ion
(0–6
)
Fig. 8. Constructed Employment Protection Index, E5
14 Informal evidence suggests that employment protection was high in France even in the 1960s.Again, this is not re¯ected in the Lazear measure, and by implication, not re¯ected in our measureeither. This may be an issue for other countries as well.
C16 [ M A R C HT H E E C O N O M I C J O U R N A L
# Royal Economic Society 2000

explored in much of the recent research on unemployment. This section givesa brief assessment of the current state of knowledge.15
One can think of labour market institutions as shaping the effects of shockson unemployment in two ways. First, they can affect the impact of shocks onunemployment. Second, they can affect the persistence of unemployment inresponse to shocks.
Most of the initial research explored the ®rst direction, focusing on how thenature and the details of collective bargaining might determine the responseof unemployment to various shocks.16 It pointed for example to the impor-tance of indexation clauses in labour contracts. It also pointed to the potentialimportance of the level and the structure of collective bargaining: it might beeasier for example to achieve a slowdown in wage growth in response to aslowdown in productivity growth if bargaining takes place at the nationalrather than the ®rm or sectoral levelÐwhere aggregate trends may be less wellperceived and understood, and coordination of the slowdown may be moredif®cult to achieve.
As unemployment remained high, the research shifted to how labourmarket institutions might also explain the persistence of unemployment inresponse to shocks.17 The general idea is as follows. Take an adverse shockwhich leads to higher unemployment. The normal adjustment mechanism isthen for unemployment to put downward pressure on wages until unemploy-ment has returned to normal. To the extent that some labour market institu-tions reduce the effect of unemployment on wages, they will increase thepersistence of unemployment in response to shocks. Research has identi®ed anumber of such channels. Here is a non-exhaustive list:
· A rise in unemployment typically comes with higher unemploymentduration (rather than higher ¯ows in and out of unemployment). If some ofthe unemployed remain unemployed for a long time, they may either stopsearching or lose skills. Indeed, the two factors reinforce each other: if ®rmsperceive the long term unemployed as more risky, they may be reluctant tohire them, decreasing the incentives of the long term unemployed to searchfor a job. But if they are not actively searching or employable, these unem-ployed workers become irrelevant to wage formation. Firms do not considerthem. Employed workers do not see them as competition. The pressure ofunemployment on wages decreases, and unemployment becomes more persis-tent. Layard and Nickell (1987) were the ®rst to point to the potentialmacroeconomic relevance of such duration dependence.
Why should institutions matter in this context? Because of their effect onthe average duration of unemployment. A well documented fact aboutEuropean labour markets is that, probably because of institutions such as more
15 Again, see our companion paper for references, and discussion.16 This was indeed one of the main themes of Bruno and Sachs (1985).17 This was the motivation behind the admittedly crude `hysteresis model' of unemployment in
Blanchard and Summers (1986). Research since then has shown that while full hysteresis (permanenteffects of shocks) is unlikely, institutions can lead to high persistence.
2000] C17T H E R O L E O F S H O C K S A N D I N S T I T U T I O N S
# Royal Economic Society 2000

generous bene®ts and employment protection, a given unemployment rate isassociated with much longer duration than in the United States.18 And thelonger the average duration of unemployment to begin with, the more likelythe effects above are to play an important role. If an increase in the unemploy-ment rate from 5 to 10% is associated with an increase in unemploymentduration from 3 to 6 months, few of the unemployed will become long-termunemployed. If instead, the same increase in the unemployment rate impliesan increase in duration from 1 to 2 years, then disenfranchising effects aremuch more likely to be important.
· Higher unemployment falls unevenly on different groups in the labourmarket. In most countries, higher unemployment tends to fall disproportion-ally on the youngest workers and the less educated.
Labour market institutions affect the compostion of the unemployed,thus affecting the effects of unemployment back on wages. For example, ahigh minimum wage can both increase the effect of adverse shocks on theunemployment rate of the less educated workers, andÐbecause the minimumwage is ®xedÐreduce the effect of unemployment on wages. Collectivebargaining, to the extent that it re¯ects primarily the preferences and thelabour market prospects of prime-age workers, may also lead to little responseof wages to youth unemployment, and thus lead to more persistence inunemployment.
· Higher unemployment may lead to a change in normsÐan argumentdeveloped in particular by Wilson (1987) in the context of urban poverty inthe United States, and by Lindbeck in the context of European unemployment(for example Lindbeck (1995)). As long as unemployment is low, workers maybe largely ignorant of the rules governing unemployment insurance, or theremay be a stigma attached to being unemployed. After a period of highunemployment, ignorance is likely to disappear; attitudes vis-a-vis unemploy-ment are likely to change. Thus, countries with a more generous welfare systemmay end up with higher unemployment, even when the shocks are gone.
Other channels have been explored as well: Sargent and Ljundqvist (1995)have explored the effect of unemployment insurance rules on the relationbetween `turbulence' shocks and equilibrium unemployment. Mortensen andPissarides (1999) have explored the effect of unemployment insurance andemployment protection on the relation between relative demand shifts andequilibrium unemployment. Our understanding of the speci®c channels andtheir empirical relevance remains rather primitive. This is still very much workin progress, and there is a need for substantially more theoretical andempirical work. Nevertheless, the general thrust is suf®ciently clear for us toexplore the potential role of interactions in explaining the evolution ofunemployment. This is what we do in the rest of the article.
18 See for example the comparison of the labour markets in Portugal and the United States inBlanchard and Portugal (1999).
C18 [ M A R C HT H E E C O N O M I C J O U R N A L
# Royal Economic Society 2000

4. Common Unobservable Shocks and Interactions
In looking more formally at the data, we proceed in two steps. In this section,we treat shocks as unobservable but common across countriesÐin effect wetreat them as time effects. In the next, we treat shocks as observable andcountry speci®c.
Our ®rst speci®cation in this section relies on the set of time invariantmeasures of institutions used by Nickell (1997).19 The speci®cation we use isthe following:
uit � ci � dt 1�Pj
bj X ij
� �� eit (1)
where i is a country index, t a (5-year) period index, and j an institutionindex. The dependent variable, uit , is the unemployment rate in country i inperiod t. ci is the country effect for country i. dt is the time effect for period t.X ij is the value of institution j in country i (in this ®rst speci®cation, we do notallow for time variation in institutions, so there is no index t.) The speci®ca-tion allows for the effects of the common time effects on unemployment todepend on the speci®c set of labour market institutions of a country. Thisdependence is captured by the parameters bj .
The speci®cation of (1) is clearly more a description of the data than theoutcome of a tightly speci®ed theory of interactions. It does not distinguish inparticular between the effects of institutions on the impact or on the persis-tence of shocks on unemployment. But it captures the basic hypothesis that,given the same shocks, countries with worse institutions will experience higherunemployment.
We estimate this equation using data from 20 countriesÐthe E15 countrieslisted and examined earlier, plus the United States, Canada, New Zealand,Australia and Japan. (These countries are clearly important controls for anystory about European unemployment.) There seems to be little point inlooking at year-to-year movements in institutions or in shocks unless one wantsto learn more about dynamic effects, and this would take us too far. So, as inearlier ®gures, we divide time into 8 ®ve-year periods, from 1960±4 to 1995�.
Following Nickell, we use measures for eight `labour market institutions'(the reader is referred to Nickell (1997) for more details):
· Three are measures of different dimensions of the unemploymentinsurance system: the replacement rate (RR), the number of years over whichunemployment bene®ts are paid (Ben), and a measure of active labour marketpolicies (ALMP).
· One is a measure of employment protection (EP).· One is a measure of the tax wedge (Tax).· The last three measure aspects of collective bargaining: union contract
coverage (Cov), union density (Den), and (union and employer) coordinationof bargaining (Coor).
19 Nickell gives values for these institutions for both 1983±8, and 1989±94. We use the average of thetwo.
2000] C19T H E R O L E O F S H O C K S A N D I N S T I T U T I O N S
# Royal Economic Society 2000

The results of estimation of (1) (by non-linear least squares) are presented inTable 1. All the measures of labour market institutions are de®ned so that anincrease in the measure is expected to increase the effect of an adverse shockon unemployment: the expected sign of each bj is positive.20 Also, all measuresof institutions are constructed as deviations from the cross-country mean; thisway the time effects gives the evolution of unemployment for a country withmean values for all 8 institutions.
The results of Table 1 are surprisingly strong (relative to our priors). Theestimated equation gives the following description of the data:
· Estimated time effects account for an increase in the unemployment rateequal to 7.3%. That is, the equation implies that, if a country had had meanvalues for all eight institutions, its unemployment rate would have grown by7.3% over the period.
· Coef®cients on all 8 institutions have the predicted sign: Higher replace-ment rates, longer duration of unemployment bene®ts, higher employmentprotection, a higher tax wedge, higher union contract coverage and density,lead to a larger effect of shocks on unemployment. Active labour marketpolicies and coordination lead to a smaller effect (remember our sign conven-tion in de®ning each institution).
All coef®cients, except for the union coverage variable, are statisticallysigni®cant.21
Table 1Time Effects Interacted with Fixed Institutions
(1)Coef®cients
(2)Range of
independentvariable
(3)Implied range ofeffect of shock
(mean � 1)
Time effects� 7.3%Replacement rate 0.017 (5.1) ÿ46.3 32.6 0.21 1.55Bene®t length 0.206 (4.9) ÿ2.0 1.6 0.60 1.33Active labour policy 0.017 (3.0) ÿ47.2 9.5 0.20 1.16Employment protection 0.045 (3.1) ÿ9.5 9.5 0.58 1.42Tax wedge 0.018 (3.2) ÿ17.8 22.2 0.68 1.40Union coverage 0.098 (0.6) ÿ1.7 0.3 0.83 1.03Union density 0.009 (2.1) ÿ30.4 39.6 0.73 1.36Coordination 0.304 (5.1) ÿ2.0 2.0 0.40 1.60Country effects yesR 2 0.863
� Time effects: Estimated time effect for 1995� minus estimated time effect for1960±64. Column (1): regression results, t-statistics in parentheses. Number ofobservations: 159.
20 Thus, we multiply the original Nickell measures of active labour market policies and of coordina-tion by ÿ1. We take the expected effect of employment protection to be that more employmentprotection leads to a larger effect of adverse shocks on unemployment, and the expected effect ofcoordination that more coordination reduces the effects of adverse shocks on unemployment.
21 The t-statistics are computed under the assumption of iid residuals. The residuals show howeverboth spatial and serial correlation, and adjusted t-statistics would probably be lower.
C20 [ M A R C HT H E E C O N O M I C J O U R N A L
# Royal Economic Society 2000

To give a sense of magnitudes, column (2) gives the range for eachinstitutional measure (recall that these are deviations from the cross countrymean). Column (3) then shows the effect of a given shock for the lowest andhighest value of the corresponding institution. The way to read the column isas follows. Take three countries, each with mean values for all institutionsexcept oneÐsay, employment protection (line 5). Take an adverse shockwhich would raise unemployment by 1 percentage point in the country withthe mean value of employment protection. Then the same shock will have aneffect of only 0.58 percentage point in the country with the lowest employmentprotection, but an effect of 1.42 percentage point in the country with thehighest employment protection. The conclusion one should draw from col-umn (3) is, given the existing variation in labour market institutions, the rangeof the effects of institutions on the impact of a given shock on unemploymentis roughly similar across institutions.
· Not only are the coef®cients on institutions plausible, but the modeldoes a good job of explaining the differential evolution of unemploymentrates across countries. Fig. 9 plots the change in the actual and the ®ttedunemployment rates from 1965±9 to 1995�. The ®t is quite good. Interactionsbetween common shocks and different institutions can account for much ofthe actual difference in the evolution of unemployment rates across countries(Recall that a pure time effect model with no interactions would predict novariation in predicted unemployment rates across countries: all the pointswould lie on a horizontal line.)
· Another way of thinking about these results is as follows. Consider a
0 0.05 0.1 0.15 0.2Actual change in unemployment rate
0
0.05
0.1
0.15
0.2
Pre
dict
ed c
hang
e in
une
mpl
oym
ent r
ate
Fig. 9. Actual and Predicted Change in u, 1995� over 1965±9
2000] C21T H E R O L E O F S H O C K S A N D I N S T I T U T I O N S
# Royal Economic Society 2000

model with unobservable shocks and unobservable institutionsÐequivalently amodel with time, country, and interacted time and country effects:
uit � ci � dt(1� bi)� eit : (19)
Equation (1) can then be thought of as imposing the restriction that bi
be a linear function of country i's institutions: bi �P
X ij bj . This raises thequestion of how much better we would do if we did not impose this restrictionand estimated (19) instead. One way to answer the question is to look at twoR 2s. The R 2 from estimation of (19) is 0.903, compared to 0.863 in Table 1.The R 2 from a second state regression of the estimated b̂ i on labour marketinstitutions X ij 's is 0.57. We read these results as saying that (1) the statisticaldescription of the evolution of unemployment as the result between shocksand institutions has the potential to give a good description of the data (asre¯ected in the ®rst stage R 2), and that (2) labour market institutions do agood job of explaining country interaction effects (as re¯ected in the secondstage R 2).
In short, (1) gives a good description of the heterogeneity of unemploymentevolutions as the result of interactions between shocks and institutions. Theseresults are indeed consistent with the two cross sections estimated by Nickell,and show that his results are robust both to the use of a longer time periodand the introduction of country effects.22
One must worry however that these results are in part the result of researchDarwinism. The measures used by Nickell have all been constructed ex-postfacto, by researchers who were not unaware of unemployment developments.When constructing a measure of employment protection for Spain, it is hardto forget that unemployment in Spain is very high. . . Also, given the complex-ity in measuring institutions, measures which do well in explaining unemploy-ment have survived better than those that did not. Thus, in the rest of thissection, we look at robustness.
4.1. Dropping Institutions, Countries, or Country Fixed Effects
To give a sense of robustness with respect to the set of institutions, column (1)in Table 2 reports the results of 8 separate regressions, each regressionallowing interactions with only one of the 8 measures for institutions. Whenintroduced on their own, three measures are highly signi®cant: the length ofbene®ts, the degree of employment protection, and the degree of unioncoverage (which is insigni®cant in the multivariate speci®cation). In contrast,the replacement rate, which is highly signi®cant in the multivariate speci®ca-tion, is insigni®cant when introduced alone. Another strategy is to see whathappens when we drop one institution at a time. The results (not reported)indicate that the coef®cients reported in Table 1 are robust to such a variation.
22 There are however some differences between estimated coef®cients. In particular: employmentprotection is signi®cant here, not in Nickell. Union contract coverage is not signi®cant here, but issigni®cant in Nickell.
C22 [ M A R C HT H E E C O N O M I C J O U R N A L
# Royal Economic Society 2000

Second, we look at robustness with respect to the set of countries. In general,dropping one country at a time makes little difference to the results (notreported here). The only exception is the importance of Spain in determiningthe coef®cient on employment protection. When dropping Spain, the coef®-cient on employment protection goes from 0.045 in Table 1 to 0.015.
Third, we look at robustness with respect to the treatment of country effects.Column (2) in Table 2 reports the results of estimation of (1), replacingcountry effects by the set of (time invariant) measures of labour marketinstitutions for each country. That is, it imposes the constraint that alldifferences in unemployment rates be explained by differences in institutions;such a constraint is surely too strong, but it is worth seeing how it affects theresults. Only the coef®cients on interactions are reported in column (2). Theyare roughly the same as in Table 1. The coef®cients on the levels of the labourmarket institutions (not reported) are typically insigni®cant. The ®t is signi®-cantly worse than in Table 1.
4.2. Looking at Alternative Measures of Institutions
Table 3 looks at the implications of using alternative measures for some of theinstitutions. This is the work-in-progress part of our article. Our goal iseventually to construct time series for all 8 institutions. So far, we have done soonly for replacement rates and for employment protection. Columns (1) and
Table 2Time Effects Interacted with Fixed Institu-
tions. Alternative Speci®cations
(1)Institutions
enteredindividually
(2)No country
effects
Time effects 7.1%RR 0.004 (1.0) 0.017 (4.1)Ben 0.268 (6.6) 0.213 (4.1)ALMP 0.007 (1.4) 0.017 (2.4)EP 0.043 (4.0) 0.049 (2.8)Tax 0.012 (2.2) 0.017 (2.4)Cov 0.532 (4.9) 0.049 (0.2)Dens ÿ0.002 (ÿ0.5) 0.009 (1.8)Coor 0.048 (1.1) 0.301 (4.3)CE yes noR 2 0.797
Column (1): each coef®cient is estimated using adifferent regression, allowing interactions betweenthe time effects and the speci®c institution variable.Column (2): Levels of institutional measures en-tered, but coef®cients not reported. Number ofobservations: 159.
2000] C23T H E R O L E O F S H O C K S A N D I N S T I T U T I O N S
# Royal Economic Society 2000

(2) report our results using alternative measures for replacement rates.Columns (3) and (4) report our results using alternative measures for employ-ment protection.
Using the OECD database on replacement rates for each country since 1961,we construct an alternative set of measures for the generosity of unemploy-ment insurance. The ®rst measure, RR1, is the replacement rate during the®rst year of an unemployment spell, averaged over all categories. The second,RR25, is the average replacement rate during years 2 to 5 of an unemploymentspell, averaged over all categories.
Column (1) shows the results of estimation using time invariant values forRR1 and RR25. For comparisons with the results using Nickell's measureswhich apply to the late 1980s and early 1990s, we use the mean value of the tworeplacement rates for the period 1985±9. Measures for the other 6 institutionsare the same as in Table 1. The ®t is a bit worse than in Table 1. The tworeplacement rates are both individually signi®cant, and jointly highly signi®-cant. Coef®cients on the other labour market institutions are often less signi®-cant than in Table 1. In particular, the coef®cient on employment protectionis smaller, and less signi®cant.
Column (2) shows the results of estimation using time-varying measures forRR1 and RR25. Relative to column (1), the ®t, measured by R 2, is marginallyimproved (but is still worse than in Table 1). The part of the increase in
Table 3Time Effects Interacted with Institutions. Alternative Measures
(1)Alternative
replacementrates
(2)Time varyingreplacement
rates
(3)Alternative
employmentprotection
(4)Time varyingemploymentprotection
Time effects 7.3% 6.2% 7.3% 7.1%(N) RR 0.017 (5.2) 0.017 (4.7)(N) Ben 0.238 (5.6) 0.205 (4.4)(Alt) RR1 0.009 (2.6) 0.007 (2.0)(Alt) RR25 0.009 (1.4) 0.019 (2.7)(N) ALMP 0.014 (1.6) 0.005 (0.5) 0.019 (3.2) 0.017 (2.6)(N) EP 0.024 (1.4) 0.032 (1.7)(Alt) EP 0.294 (4.3) 0.167 (2.2)(N) Tax 0.016 (2.4) 0.015 (2.1) 0.019 (3.5) 0.021 (3.7)(N) Cov 0.413 (2.1) 0.395 (1.9) 0.085 (0.5) 0.287 (1.8)(N) Dens 0.004 (0.8) 0.000 (0.0) 0.010 (2.5) 0.008 (1.7)(N) Coor 0.272 (4.9) 0.325 (4.5) 0.392 (6.5) 0.361 (5.3)CE yes yes yes yesR 2 0.824 0.831 0.872 0.857
(N) means Nickell measure. Column (1): estimation using time-invariant valuesof RR1 and RR25, equal to their average values for 1985±9. Column (2):estimation using the time series for RR1 and RR25. Column (3): estimationusing the value of EP for the late 1980s. Column (4): estimation using the timeseries for EP . Number of observations: 159.
C24 [ M A R C HT H E E C O N O M I C J O U R N A L
# Royal Economic Society 2000

unemployment due to time effects decreases from 7.3% to 6.2%. Coef®cientson labour market institutions are largely the same as in column (1).
Columns (3) and (4) use the index of employment protection discussed inSection 2. In contrast to the Nickell index, which is a ranking of countries andthus ranges from 1 to 20, this index is a cardinal index, ranging theoreticallyfrom 0 to 6, empirically from 0 to about 4. Thus, in comparing coef®cients tothose obtained using the Nickell speci®cation, keep in mind that the coef®-cients should be about 5 times larger to generate the same effect on unemploy-ment.
Column (3) shows the results of estimation using time-invariant values ofthe index, equal to its value for 1985±9. The results are very similar to Table 1.R 2 is a little higher. The effect of employment protection is similar inmagnitude to that in Table 1 (i.e. the coef®cient is about 5 times larger), andhighly signi®cant.
Column (4) shows the results of estimation using the time varying values ofthe employment protection index. Allowing for time variation does notimprove the results: R 2 is slightly lower. The coef®cient on the employmentprotection index decreases by nearly half and becomes less signi®cant. Theseresults can be read in three ways. First, the effects of employment protectionare indeed less strong than suggested by previous regressions using time-invariant measures. Two, the time series we have constructed for employmentprotection are not very reliable; as we discussed in Section 2, we are worriedabout the evolution of the index in the early part of the sample. Three, ourearlier and apparently stronger results come in fact from reverse causality.Under this intepretation, the rise in unemployment has led over time to moreemployment protection, which is why there is a close relation between employ-ment protection at the end of the sample and unemployment. But employ-ment protection has little effect on unemployment, which is why the relation isweaker when using time series. Given the lack of strong evidence about thepresence of a strong and reliable feedback from unemployment to institutions,we are sceptical; but we cannot exclude this interpretation.
To conclude: a model with common unobservable shocks and interactionswith institutions provides a good description of the evolution of unemploy-ment rates across time and countries. The description appears reasonablyrobustÐalthough less so with respect to time variation in institutions. Thisconclusion leaves open the issue of what these shocks might have been, andwhether they have indeed been similar across countries. For this reason, wenow turn to a speci®cation based on observable shocks.
5. Country Speci®c Observable Shocks, and Interactions
The benchmark speci®cation we use in this section is the following:
uit � ci �P
kYkit ak
� �1�P
jX ij bj
� �� eit (2)
where the notation is the same as before, but the unobservable common
2000] C25T H E R O L E O F S H O C K S A N D I N S T I T U T I O N S
# Royal Economic Society 2000

shocks of Section 3 are now replaced by a set of country speci®c shocks; Ykit
denotes shock k for country i in period t.23 Again our benchmark relies ontime invariant measures of institutions, thus the lack of an index t for X . Lateron, we look at results allowing for time variation for institutions.
Following the discussion in Section 2, we consider three sources of shocksand construct three variables for each country and each period. They are therate of TFP growth, the real rate of interest, and the labour demand shiftmeasure, respectively. We enter them as levels, but, given the presence ofcountry dummies in the regression, they can be thought of as deviations fromcountry averagesÐor from their 1960 values. To make it easy to read the tables,each variable is measured so an increase is expected to increase unemploy-ment initially; therefore the original measure of TFP growth is multiplied byÿ1. Due to some missing data for some countries, the panel is (slightly)unbalanced. Also, one observation requires special treatment. As discussed inBlanchard (1997), the Portuguese revolution was associated with a largepermanent increase in the measured labour share (20% of GDP)Ðwithout acorresponding increase in unemployment. While this evolution is interestingin its own right, we have decided to ignore it by allowing for a dummy forPortugal, from 1960 to 1974.24
The natural ®rst question is: Ignoring differences in institutions acrosscountries, how much of the evolutions of unemployment across time andcountries can be explained by our three shocks? The answer is given in Table 4and in Fig. 10.
Column 1 in Table 4 presents regressions of the unemployment rate on thethree shocks, leaving institutions out. Two of the three shocks (TFP growth,and the real interest rate) are signi®cant. A decrease in TFP growth of 3percentage points, as has happened in many countries, translates into anincrease in the unemployment rate of about 1.5%. An increase in the real
23 Most theories predict that the interaction of institutions and shocks may be different for differentshocks. But allowing for different interactions between each shock and each institution struck us asasking too much from our limited data set (131 data points for the regressions in this section).
24 The difference between macro and labour panel data regressions is that, in macro, each data pointis intimately known by the researcher . . .
Table 4Shocks only
Dependent var(1)u
(2)u� sacri®ceratio � 0:2
(3)u� sacri®ceratio � 4:0
TFP growth 0.47 (3.1) 0.36 (2.6) 0.25 (1.7)Real rate 0.67 (5.6) 0.63 (6.1) 0.63 (6.1)LD shift 0.07 (1.1) 0.08 (1.5) 0.09 (1.7)CE yes yes yesR 2 0.566 0.590 0.584
Number of observations: 131.
C26 [ M A R C HT H E E C O N O M I C J O U R N A L
# Royal Economic Society 2000
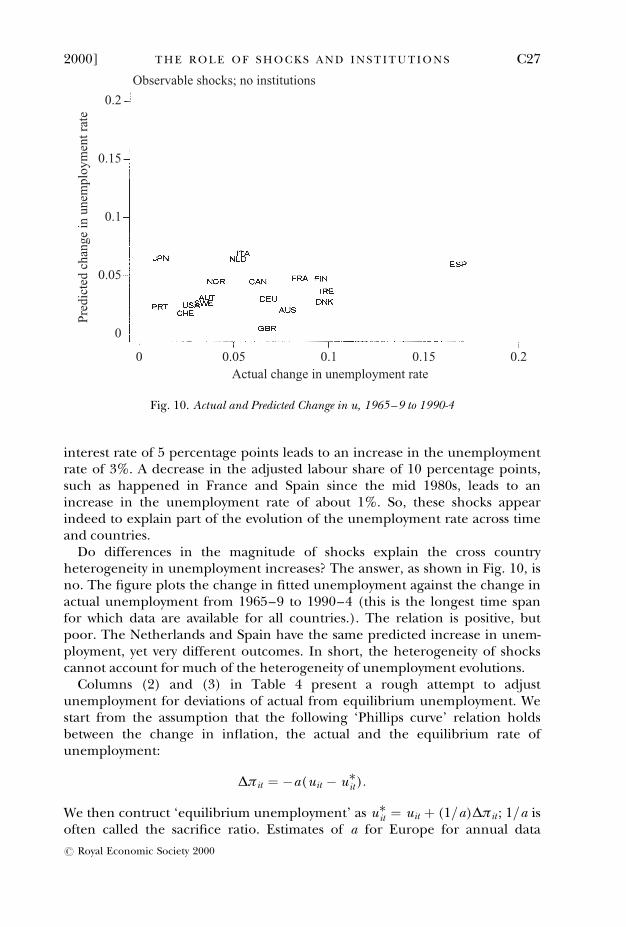
interest rate of 5 percentage points leads to an increase in the unemploymentrate of 3%. A decrease in the adjusted labour share of 10 percentage points,such as happened in France and Spain since the mid 1980s, leads to anincrease in the unemployment rate of about 1%. So, these shocks appearindeed to explain part of the evolution of the unemployment rate across timeand countries.
Do differences in the magnitude of shocks explain the cross countryheterogeneity in unemployment increases? The answer, as shown in Fig. 10, isno. The ®gure plots the change in ®tted unemployment against the change inactual unemployment from 1965±9 to 1990±4 (this is the longest time spanfor which data are available for all countries.). The relation is positive, butpoor. The Netherlands and Spain have the same predicted increase in unem-ployment, yet very different outcomes. In short, the heterogeneity of shockscannot account for much of the heterogeneity of unemployment evolutions.
Columns (2) and (3) in Table 4 present a rough attempt to adjustunemployment for deviations of actual from equilibrium unemployment. Westart from the assumption that the following `Phillips curve' relation holdsbetween the change in in¯ation, the actual and the equilibrium rate ofunemployment:
Äðit � ÿa(uit ÿ u�it ):
We then contruct `equilibrium unemployment' as u�it � uit � (1=a)Äðit ; 1=a isoften called the sacri®ce ratio. Estimates of a for Europe for annual data
0 0.05 0.1 0.15 0.2Actual change in unemployment rate
0
0.05
0.1
0.15
0.2P
redi
cted
cha
nge
in u
nem
ploy
men
t rat
eObservable shocks; no institutions
Fig. 10. Actual and Predicted Change in u, 1965±9 to 1990-4
2000] C27T H E R O L E O F S H O C K S A N D I N S T I T U T I O N S
# Royal Economic Society 2000

typically range from 0.25 to 0.50.25 Column (2) constructs u� using a sacri®ceratio of 2.0; column (3) does the same using a ratio of 4.0.26 The ®t in columns(2) and (3) is better than in column (1)Ðthe dependent variable is not thesame however. The effects of each of the three shock variables are roughlysimilar.
Table 5 presents the results of the speci®cation that allows for both shocksand interactions with institutions. Column (1) presents the results fromestimating the benchmark speci®cation (2).
All three variables measuring shocks are now very signi®cant. The effects ofTFP growth and the labour demand shift are larger than in Table 4, the effectsof the real interest rate slightly smaller. A decrease in TFP growth of 3percentage points translates into an increase in the unemployment rate ofabout 2%. An increase in the real interest rate of 5 percentage points leads toan increase in the unemployment rate of 2.5%. A decrease in the adjustedlabour share of 10 percentage points leads to an increase in the unemploy-ment rate of about 2%.
Coef®cients on 7 of 8 institutions have the expected sign. Only unioncoverage is negative, but insigni®cant. The most signi®cant coef®cients are onthe replacement rate, the length of bene®ts, union density and coordination.Except for union coverage, the pattern of coef®cients is the same as in Table 1
25 If our approach to measuring the equilibrium unemployment rate is right however, then mostexisting estimates of a, which rely on a much rougher measure of equilibrium unemployment, are notright. We did not take up the task of estimating a in this article.
26 In doing so, we are implicitly assuming that the sacri®ce ratio is not related to institutions. This isprobably incorrect.
Table 5Shocks Interacted with Fixed Institutions
(1)Benchmark
equation
(2)Institutions
enteredindividually
(3)u� sacri®ceratio � 2:0
TFP growth 0.71 (5.0) 0.58 (4.5)Real rate 0.47 (5.1) 0.49 (5.7)LD shift 0.19 (2.7) 0.15 (2.4)
RR 0.025 (3.7) 0.013 (2.4) 0.025 (3.7)Ben 0.267 (3.0) 0.203 (2.3) 0.313 (3.3)ALMP 0.028 (1.4) ÿ0.009 (ÿ0.7) 0.033 (1.6)EP 0.095 (2.7) 0.047 (2.7) 0.090 (2.6)Tax 0.033 (2.4) 0.026 (2.6) 0.037 (2.6)Cov ÿ0.501 (ÿ1.1) 0.639 (3.0) ÿ0.466 (ÿ1.0)Dens 0.033 (3.2) ÿ0.002 (ÿ0.3) 0.033 (2.8)Coor 0.414 (2.9) ÿ0.039 (ÿ0.4) 0.439 (2.9)CE yes yes yesR 2 0.674 0.702
Number of observations: 131.
C28 [ M A R C HT H E E C O N O M I C J O U R N A L
# Royal Economic Society 2000

(estimated with unobservable shocks), up to a factor of proportionality greaterthan 1. That is, they are in general 1.5 to 2 times larger than in Table 1. Themechanical explanation is that the observable shocks explain less of thegeneral increase in unemployment, and the interactions must thereforeexplain more. The R 2 is much lower than in Table 1: despite the fact that theycan differ across countries, the 3 observable shocks do not do as good a job asthe set of 8 time effects in Table 1.
The speci®cation does a good job of explaining differences in unemploy-ment evolutions across countries. This is shown in Fig. 11, which plots thechange in ®tted unemployment against the change in actual unemployment,from 1965±9 to 1990±4. The ®t is quite good; clearly much better than inFig. 10, if not quite as good as in Fig. 9. Fig. 12 gives another way of looking at®t, by plotting the actual and ®tted unemployment rate for each of the 20countries over time. The visual impression is one of a good ®t in nearly allcases. (To facilitate comparison of unemployment rates across countries, thevertical scale is the same for all countries. The drawback is that it is harder toassess the ®t for each country.)
Column (2) looks at the effects of entering institutions one at a time. Theconclusions are largely similar to those in the previous section. In particular,union coverage is very signi®cant on its own, but not in combination withother institutions. Column (3) replaces actual by equilibrium unemployment,assuming as sacri®ce ratio of 2.0. The ®t is better, but the results are otherwisevery similar.
0 0.05 0.1 0.15 0.2Actual change in unemployment rate
0Pre
dict
ed c
hang
e in
une
mpl
oym
ent r
ate
0.1
0.2
Observable shocks; interacted with fixed institutions
Fig. 11. Actual and Predicted Change in u, 1965±9 to 1990±4
2000] C29T H E R O L E O F S H O C K S A N D I N S T I T U T I O N S
# Royal Economic Society 2000

1960 1970 1980 1990 2000 1960 1970 1980 1990 2000 1960 1970 1980 1990 2000 1960 1970 1980 1990 2000 1960 1970 1980 1990 20000
0.1
0.2
0.3
0
0.1
0.2
0.3
0
0.1
0.2
0.3
0
0.1
0.2
0.3Australia
Finland
Japan
Spain
Austria
France
Netherlands
Sweden
Belgium
Germany
Norway
Switzerland
Canada
Ireland
NZ
UK
Denmark
Italy
Portugal
USA
Observable shocks; interacted with fixed institutions
Fig. 12. Actual (o) and Predicted (�) Unemployment Rates
C30
[M
AR
CH
TH
EE
CO
NO
MIC
JOU
RN
AL
#R
oyal
Eco
no
mic
Society
2000
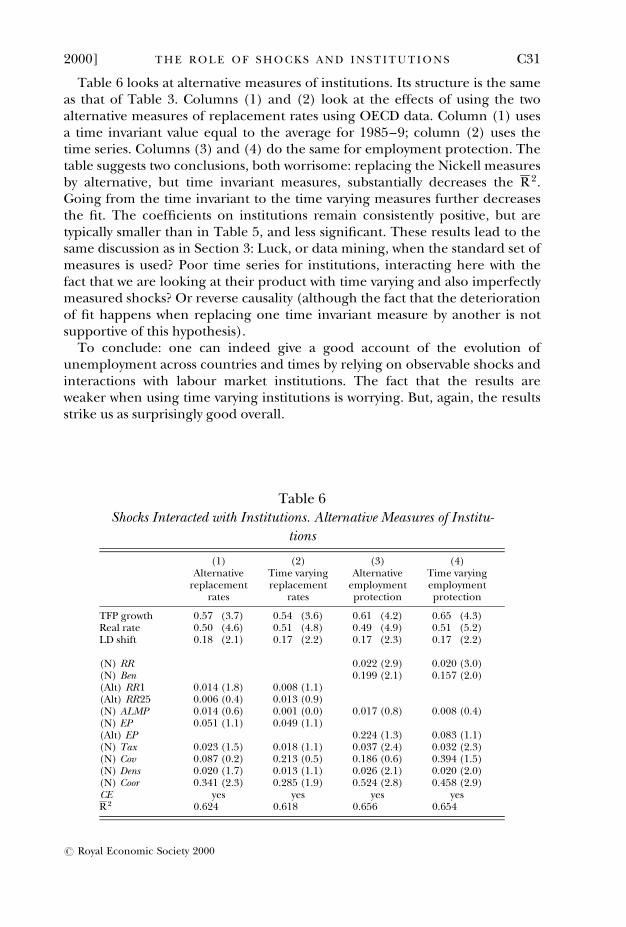
Table 6 looks at alternative measures of institutions. Its structure is the sameas that of Table 3. Columns (1) and (2) look at the effects of using the twoalternative measures of replacement rates using OECD data. Column (1) usesa time invariant value equal to the average for 1985±9; column (2) uses thetime series. Columns (3) and (4) do the same for employment protection. Thetable suggests two conclusions, both worrisome: replacing the Nickell measuresby alternative, but time invariant measures, substantially decreases the R 2.Going from the time invariant to the time varying measures further decreasesthe ®t. The coef®cients on institutions remain consistently positive, but aretypically smaller than in Table 5, and less signi®cant. These results lead to thesame discussion as in Section 3: Luck, or data mining, when the standard set ofmeasures is used? Poor time series for institutions, interacting here with thefact that we are looking at their product with time varying and also imperfectlymeasured shocks? Or reverse causality (although the fact that the deteriorationof ®t happens when replacing one time invariant measure by another is notsupportive of this hypothesis).
To conclude: one can indeed give a good account of the evolution ofunemployment across countries and times by relying on observable shocks andinteractions with labour market institutions. The fact that the results areweaker when using time varying institutions is worrying. But, again, the resultsstrike us as surprisingly good overall.
Table 6Shocks Interacted with Institutions. Alternative Measures of Institu-
tions
(1)Alternative
replacementrates
(2)Time varyingreplacement
rates
(3)Alternative
employmentprotection
(4)Time varyingemploymentprotection
TFP growth 0.57 (3.7) 0.54 (3.6) 0.61 (4.2) 0.65 (4.3)Real rate 0.50 (4.6) 0.51 (4.8) 0.49 (4.9) 0.51 (5.2)LD shift 0.18 (2.1) 0.17 (2.2) 0.17 (2.3) 0.17 (2.2)
(N) RR 0.022 (2.9) 0.020 (3.0)(N) Ben 0.199 (2.1) 0.157 (2.0)(Alt) RR1 0.014 (1.8) 0.008 (1.1)(Alt) RR25 0.006 (0.4) 0.013 (0.9)(N) ALMP 0.014 (0.6) 0.001 (0.0) 0.017 (0.8) 0.008 (0.4)(N) EP 0.051 (1.1) 0.049 (1.1)(Alt) EP 0.224 (1.3) 0.083 (1.1)(N) Tax 0.023 (1.5) 0.018 (1.1) 0.037 (2.4) 0.032 (2.3)(N) Cov 0.087 (0.2) 0.213 (0.5) 0.186 (0.6) 0.394 (1.5)(N) Dens 0.020 (1.7) 0.013 (1.1) 0.026 (2.1) 0.020 (2.0)(N) Coor 0.341 (2.3) 0.285 (1.9) 0.524 (2.8) 0.458 (2.9)CE yes yes yes yesR 2 0.624 0.618 0.656 0.654
2000] C31T H E R O L E O F S H O C K S A N D I N S T I T U T I O N S
# Royal Economic Society 2000

6. Conclusions
We see our results as preliminary. We see our dynamic speci®cation of theeffects of shocks as much too crude. We still need to construct and introducetime series for some labour market institutions. We worry about the endogene-ity of labour market institutions. Nevertheless, we believe that the results so farsuggest that an account of the evolution of unemployment based on theinteraction of shocks and institutions can do a good job of ®tting the evolutionof European unemployment, both over time and across countries.
If our account is correct, one can be mildly optimistic about the future ofEuropean unemployment. The effects of some of the adverse shocks should goaway. The real interest rate is likely to be lower in the future than in the recentpast. The dynamic effects of what we have identi®ed as adverse labour demandshifts should eventually prove favourable to employment. Institutions are alsoslowly becoming employment-friendly. Our results suggest that the morefavourable macroeconomic environment and the improvement in institutionsshould lead to a substantial decline in unemployment.
MIT and NBER
Harvard University
ReferencesBlanchard, O. (1997). `The medium run', Brookings Papers on Economic Activity, no. 2, pp. 89±158.Blanchard, O. (1999). `European unemployment: the role of shocks and institutions', Baf® Lecture,
Rome, (forthcoming, 1999).Blanchard, O. and Portugal, P. (1998). `What hides behind an unemployment rate. Comparing
Portuguese and U.S. unemployment', NBER Working Paper 6636.Blanchard, O. and Summers, L. (1986). `Hysteresis and the European unemployment problem', NBER
Macroeconomics Annual no. 1, pp. 15±78 (S. Fischer, ed), MIT Press.Bruno, M. and Sachs, J. (1985). The Economics of Worldwide Stag¯ation, Oxford: Basil Blackwell.Grubb, O., Jackman, R. and Layard, R. (1982). `Causes of the current stag¯ation', Review of Economic
Studies, vol. 49(5), pp. 707±30.Layard, R. and Nickell, S. (1987). `The labour market', In (R. Dornbusch and R. Layard, eds) The
Performance of the British Economy, Oxford: Clarendon Press.Layard, R., Nickell, S. and Jackman, R. (1991). Unemployment; Macroeconomic Performance and the Labour
Market, Oxford: Oxford University Press.Lazear, E. (1990). `Job security provisions and employment', Quarterly Journal of Economics, vol. 105-3,
pp. 699±725.Lindbeck, A. (1995). `Hazardous welfare-state dynamics', American Economic Review, vol. 85(2), pp. 9±15.Mortensen, D. and Pissarides, C. (1998). `Job reallocation, employment ¯uctuations, and unemploy-
ment differences, mimeo (forthcoming, Handbook of Macroeconomics).Mortensen, D. and Pissarides, C. (1999). `Unemployment responses to ``skill biased'' shocks: the role of
labour market policy', Economic Journal, vol. 109, pp. 1±24.Nickell, S. (1997). `Unemployment and labour market rigidities: Europe versus North America', Journal
of Economic Perspectives, vol. 11(3), pp. 55±74.Nickell, S. and Bell, B. (1994). `Would cutting payroll taxes on the unskilled have a signi®cant effect on
unemployment?', Presented at CEPR conference on Unemployment Policy, Vigo, Spain,September.
Nickell, S. and Layard, R. (1998). `Labour market institutions and economic performance', CEPDiscussion Paper 407 (forthcoming, Handbook of Labor Economics).
OECD (1999). OECD Employment Outlook, OECD, Paris.Phelps, E. (1994). Structural Slumps. The modern equilibrium theory of unemployment, interest and assets,
Cambridge MA: Harvard University Press.Salomaki, A. and Munzi, T. (1999). `Net replacement rates of the unemployed. Comparisons of various
C32 [ M A R C HT H E E C O N O M I C J O U R N A L
# Royal Economic Society 2000

approaches', Economic Paper 133, European Commission, Directorate General for Economic andFinancial Affairs.
Sargent, T. and Ljundqvist, L. (1995). `The European unemployment dilemma', WP 95-17, FederalReserve Bank of Chicago.
Wilson, W. J. (1987). The Truly Disadvantaged, Chicago: University of Chicago Press.
2000] C33T H E R O L E O F S H O C K S A N D I N S T I T U T I O N S
# Royal Economic Society 2000


![Aula 02.1 [07 mar] - Wolfers, National Security as an Ambiguous Symbol, 1952.pdf](https://img.dokumen.tips/doc/110x75/55cf9c91550346d033aa462f/aula-021-07-mar-wolfers-national-security-as-an-ambiguous-symbol-1952pdf.jpg)

