Embed Size (px)
Citation preview

THE ROLE OF SENSORY FEEDBACK ON THE
COORDINATION DYNAMICS OF A LIMB AND A VOICE TASK
by
Elizabeth Urban Grillo
B.M., Indiana University, 1997
M.S., Teachers College Columbia University, 2000
Submitted to the Graduate Faculty of
School of Health and Rehabilitation Sciences in partial fulfillment
of the requirements for the degree of
Doctor of Philosophy
University of Pittsburgh
2006

UNIVERSITY OF PITTSBURGH
FACULTY OF THE SCHOOL OF HEALTH AND REHABILITATION SCIENCES
This dissertation was presented
by
Elizabeth Urban Grillo
It was defended on
June 7th, 2006
and approved by
Jere Gallagher, Ph.D., School of Education, Health, and Physical Activity
Tim Lee, Ph.D., Department of Kinesiology, McMaster University
Susan Shaiman, Ph.D., Communication Science and Disorders
Scott Yaruss, Ph.D., Communication Science and Disorders
Katherine Verdolini, Ph.D., Communication Science and Disorders Dissertation Chair
ii

Copyright © by Grillo
2006
iii
THE ROLE OF SENSORY FEEDBACK ON THE
COORDINATION DYNAMICS OF A LIMB AND A VOICE TASK
Elizabeth Urban Grillo, B.M., M.S., Ph.D.
University of Pittsburgh, 2006
Although it is generally acknowledged that sensory feedback is required to fine tune movement patterns, its role in coordinative dynamics has received less attention. Experiment 1 investigated the role of visual and auditory feedback on 0º and 180º relative phase patterns at increasing frequency of oscillation for a bimanual limb task. The dependent variables were mean error of relative phase and standard deviation of relative phase. Results indicated that the visual and auditory feedback conditions did not influence the accuracy and the variability in performance of the 2 relative phase patterns, whereas increasing frequency influenced the performance of the 180º relative phase pattern, but not the 0º relative phase pattern. Experiment 2 investigated the role of auditory feedback on breathy, normal, and pressed voice qualities at increasing fundamental frequency for a voice coordination task. The dependent variables were mean of laryngeal resistance (cmH2O/l/s) and standard deviation of laryngeal resistance (cmH2O/l/s). Results indicated that the masked auditory feedback condition significantly increased variability in performance across all 3 voice qualities and specifically, the masked auditory feedback condition facilitated significantly higher mean laryngeal resistance values for the pressed voice quality but not for the breathy and the normal voice qualities. As a potential explanation of the current findings in Experiment 1, it is hypothesized that the bimanual coordination task did not rely on visual and auditory feedback because the task was governed by proprioceptive feedback, which was not controlled in the present study. For Experiment 2, sensory feedback may be relevant for voice patterns that have a shallow basin of attraction (i.e., pressed voice), but irrelevant for voice patterns that have a steep basin of attraction (i.e., breathy and normal voice). Perhaps the breathy and normal voice qualities were governed by voice coordination dynamics, while the pressed voice quality was partly influenced by auditory feedback connections. In addition, level of expertise may also play a role in the coordination dynamics of a voice task. The influence of auditory feedback on voice coordination dynamics suggests an expanded view of dynamic systems theory and supports the role of auditory feedback in vocal rehabilitation.
iv

TABLE OF CONTENTS
PREFACE.................................................................................................................................. XII
1.0 CHAPTER 1: INTRODUCTION.............................................................................. 1
1.1 BASIC FOUNDATIONS OF NONLINEAR DYNAMICS.............................. 3
1.1.1 Concepts related to the field of nonlinear dynamics.................................. 3
1.1.2 Linear versus Nonlinear Systems ................................................................ 3
1.1.3 Dynamic Systems .......................................................................................... 4
1.1.4 Order and Control Parameters ................................................................... 6
1.1.5 Stability .......................................................................................................... 7
1.1.6 Historical Review of the Field of Nonlinear Dynamics.............................. 7
1.1.7 Nonlinear Mathematical and Physical Dynamics Applied to Voice
Production................................................................................................................... 15
1.2 DYNAMIC SYSTEMS THEORY APPLIED TO MOTOR BEHAVIOR
AND THE HKB (1985) MODEL: PREDICTIONS AND LIMITATIONS................. 20
1.2.1 Predictions of Dynamic Systems Theory of Motor Behavior.................. 25
1.2.2 A Limitation of Dynamic Systems Theory of Motor Behavior addressed
by Expansion of the Original HKB (1985) Model ................................................... 28
1.2.3 Limitations of Dynamic Systems Theory of Motor Behavior: Support
from Neurophysiological and Behavioral Research ............................................... 30
1.2.3.1 Recent neurophysiological research pointing to a dynamic
heterarchy of nervous system organization and function. ............................. 30
1.2.3.2 Recent evidence for the role of attention in bimanual coordination.
34
1.2.3.3 Recent evidence for the role of perception in bimanual
coordination........................................................................................................ 36
v

1.2.3.4 Recent evidence for the role of visual feedback in bimanual
coordination........................................................................................................ 40
1.2.3.5 Limitations in methodology question preliminary evidence for
attractor states in voice production.................................................................. 44
1.3 GAPS IN THE LITERATURE ADDRESSED IN THE PRESENT STUDIES
48
1.4 FURTHER EXTENSION OF DYNAMIC SYSTEMS THEORY
PERSPECTIVE TO THE CASE OF VOICE PRODUCTION ..................................... 49
1.4.1 Subglottic Pressure ..................................................................................... 51
1.4.2 Average Airflow .......................................................................................... 53
1.4.3 Normative Studies Involving Laryngeal Resistance ................................ 55
1.4.4 The Capability of Laryngeal Resistance to Distinguish Pathological from
Normal Voice Production.......................................................................................... 57
1.5 STATEMENT OF PURPOSE, SPECIFIC AIMS, EXPERIMENTAL
QUESTIONS, AND HYPOTHESES ................................................................................ 64
2.0 CHAPTER 2: EXPERIMENT 1.............................................................................. 69
2.1 RESEARCH METHODS.................................................................................. 69
2.1.1 Purpose......................................................................................................... 69
2.1.2 Participants.................................................................................................. 69
2.1.3 Equipment and Software............................................................................ 70
2.1.4 Experimental Design................................................................................... 71
2.1.5 Procedures ................................................................................................... 72
2.1.6 Data Reduction............................................................................................ 74
2.1.7 Statistical Analysis ...................................................................................... 75
2.2 RESULTS ........................................................................................................... 77
2.2.1 Dependent Variable: Mean Error of Relative Phase.............................. 77
2.2.2 Dependent Variable: Standard Deviation of Relative Phase ................. 82
2.2.3 Summary...................................................................................................... 87
2.3 DISCUSSION..................................................................................................... 88
2.3.1 Limitations................................................................................................... 93
3.0 CHAPTER 3: EXPERIMENT 2.............................................................................. 94
vi

3.1 RESEARCH METHODS.................................................................................. 94
3.1.1 Purpose......................................................................................................... 94
3.1.2 Participants.................................................................................................. 94
3.1.3 Equipment and Software............................................................................ 96
3.1.4 Experimental Design................................................................................... 98
3.1.5 Procedures ................................................................................................... 99
3.1.6 Data Reduction.......................................................................................... 103
3.1.7 Statistical Analysis .................................................................................... 104
3.2 RESULTS ......................................................................................................... 106
3.2.1 Analysis of Laryngeal Resistance Values Compared to Previous Data107
3.2.2 Analysis of Fundamental Frequency and Intensity Level Targets....... 108
3.2.3 Dependent Variable: Standard Deviation of Laryngeal Resistance.... 114
3.2.4 Dependent Variable: Mean of Laryngeal Resistance ........................... 119
3.2.5 Descriptive Analysis of Subjects 17, 19, and 20...................................... 127
3.3 DISCUSSION................................................................................................... 133
3.3.1 Subjects 17, 19, and 20.............................................................................. 138
3.3.2 Limitations................................................................................................. 139
4.0 CHAPTER 4: CONCLUSIONS AND AVENUES FOR FUTURE RESEARCH
142
5.0 CHAPTER 5: BIBLIOGRAPHY .......................................................................... 147
vii

LIST OF TABLES
Table 1. Laryngeal resistance (cm H2O/l/s) pairwise comparisons for R=Resonant, N=Normal,
P=Pressed, and B=Breathy with 95% confidence intervals. ....................................................... 63
Table 2. Vocal efficiency (dB/cmH2O/ l/s) pairwise comparisons for R=Resonant, N=Normal,
P=Pressed, and B=Breathy with 95% confidence intervals. ....................................................... 63
Table 3. Sample mean and 95% confidence intervals that could cover the population parameter
of µ for breathy, normal, and pressed voice qualities by laryngeal resistance (cm H2O/l/s). ...... 63
Table 4. Order of the sensory feedback conditions and relative phase patterns for 15 subjects. 72
Table 5. Repeated measures ANOVA for phase (i.e., 0º and 180º relative phase patterns), speed
(i.e., increasing frequency of oscillation), and feedback (i.e., 4 sensory feedback conditions) on
mean error of relative phase. ....................................................................................................... 79
Table 6. Pairwise comparisons for 0º in-phase pattern at slow (1Hz), medium (2Hz), and fast
(3Hz) speeds. ............................................................................................................................... 81
Table 7. Pairwise comparisons for 180º anti-phase pattern at slow (1Hz), medium (2Hz), and
fast (3Hz) speeds. ........................................................................................................................ 81
Table 8. Pairwise comparisons for 0º and 180º relative phase patterns within a single speed;
slow (1Hz), medium (2Hz), and fast (3Hz). ............................................................................... 82
Table 9. Repeated measures ANOVA for phase (i.e., 0º and 180º relative phase patterns), speed
(i.e., increasing frequency of oscillation), and feedback (i.e., 4 sensory feedback conditions) on
standard deviation of relative phase. ........................................................................................... 84
Table 10. Pairwise comparisons for 0º in-phase pattern at slow (1Hz), medium (2Hz), and fast
(3Hz) speeds. ............................................................................................................................... 86
Table 11. Pairwise comparisons for 180º anti-phase pattern at slow (1Hz), medium (2Hz), and
fast (3Hz) speeds. ........................................................................................................................ 86
viii

Table 12. Pairwise comparisons for 0º and 180º relative phase patterns within a single speed;
slow (1Hz), medium (2Hz), and fast (3Hz) speeds. .................................................................... 86
Table 13. Order of the sensory feedback conditions and voice coordination patterns for the 21
subjects. ....................................................................................................................................... 99
Table 14. Sample mean and 95% confidence intervals ............................................................. 108
Table 15. Means of fundamental frequency (Hz) for each voice coordination pattern at the target
7 fundamental frequencies (Hz) under normal auditory feedback and masked auditory feedback
for 18 subjects. ............................................................................................................................ 109
Table 16. Means of intensity level (dBSPL) for each voice coordination pattern at the target 7
fundamental frequencies (Hz) under normal auditory feedback and masked auditory feedback for
18 subjects................................................................................................................................... 112
Table 17. Repeated measures ANOVA for quality (i.e., breathy, normal, and pressed voice
qualities), pitch (i.e., increasing fundamental frequency), and feedback (i.e., normal versus
masked auditory feedback) on standard deviation of laryngeal resistance. .............................. 115
Table 18. Repeated measures ANOVA for quality (i.e., breathy, normal, and pressed), pitch (i.e.,
increasing fundamental frequency), and feedback (i.e., normal versus masked auditory feedback)
on mean of laryngeal resistance. ............................................................................................... 121
Table 19. Pairwise comparisons for normal auditory feedback at breathy, normal, and pressed
voice coordination patterns. ...................................................................................................... 125
Table 20. Pairwise comparisons for masked auditory feedback at breathy, normal, and pressed
voice coordination patterns. ...................................................................................................... 125
Table 21. Pairwise comparisons for normal and masked feedback within a single voice
coordination pattern; breathy, normal, and pressed. ................................................................. 126
Table 22. Mean of laryngeal resistance (cmH20/l/s) across breathy, normal, and pressed voice
qualities under normal and masked auditory feedback conditions for subjects 17, 19, and 20 only
and for all 18 subjects excluding subjects 17, 19, and 20........................................................... 128
Table 23. Standard deviation of laryngeal resistance (cmH20/l/s) across breathy, normal, and
pressed voice qualities under normal and masked auditory feedback conditions for subjects 17,
19, and 20 only and for all 18 subjects excluding subjects 17, 19, and 20................................. 129
ix

LIST OF FIGURES
Figure 1. Lissajous plots from Kelso (1984). ............................................................................ 26
Figure 2. Hand positions and relative phase patterns. ............................................................... 37
Figure 3. Apparatus used in the Mechsner and colleagues (2001) .............................................. 39
Figure 4: Bimanual Linear Slide.................................................................................................. 71
Figure 5. Significant main effect for phase. Mean error of relative phase ................................. 79
Figure 6. Significant main effect for speed. Mean error of relative phase ................................. 80
Figure 7. Significant two-way interaction for phase x speed. .................................................... 80
Figure 8. Significant main effect for phase. Standard deviation of relative phase ..................... 84
Figure 9. Significant main effect for speed. Standard deviation of relative phase ..................... 85
Figure 10. Significant two-way interaction for phase x speed. Standard deviation ................... 85
Figure 11. The experimental set-up for Experiment 2, the voice study....................................... 97
Figure 12. Breathy voice produced at the seven target fundamental frequencies (Hz) under
normal and masked auditory feedback conditions. ................................................................... 110
Figure 13. Normal voice produced at the seven target fundamental frequencies (Hz) under
normal and masked auditory feedback conditions. ................................................................... 110
Figure 14. Pressed voice produced at the seven target fundamental frequencies (Hz) under
normal and masked auditory feedback conditions. ................................................................... 111
Figure 15. Breathy voice produced at the seven target pitches (Hz) under normal and masked
auditory feedback conditions. ................................................................................................... 113
Figure 16. Normal voice produced at the seven target pitches (Hz) under normal and masked
auditory feedback conditions. ................................................................................................... 113
Figure 17. Pressed voice produced at the seven target pitches (Hz) under normal and masked
auditory feedback conditions. ................................................................................................... 114
Figure 18. Significant main effect for quality. Standard deviation........................................... 116
x

Figure 19. Significant main effect for feedback. Standard deviation ........................................ 117
Figure 20. Pressed voice under normal and masked auditory feedback. Standard deviation... 118
Figure 21. Breathy voice under normal and masked auditory feedback. Standard deviation .. 118
Figure 22. Normal voice under normal and masked auditory feedback. Standard deviation... 119
Figure 23. Voice qualities were maintained at each of the 7 fundamental frequencies. .......... 122
Figure 24. Significant main effect for quality. Mean of laryngeal resistance........................... 123
Figure 25. Significant main effect for feedback. Mean of laryngeal resistance ....................... 123
Figure 26. Significant two-way interaction for quality x feedback. Mean................................ 124
Figure 27. Pressed voice under normal and masked auditory feedback. Mean........................ 126
Figure 28. Breathy voice under normal and masked auditory feedback. Mean ....................... 127
Figure 29. Normal voice under normal and masked auditory feedback. Mean........................ 127
Figure 30. Pressed voice under normal and masked auditor feedback for subjects 17, 19, and 20.
Mean of laryngeal resistance (cmH2O/l/s) as a function of the 7 fundamental frequencies (Hz)
for normal and masked auditory feedback.................................................................................. 130
Figure 31. Normal voice under normal and masked auditory feedback for subjects 17, 19, and
20. Mean of laryngeal resistance (cmH2O/l/s) as a function of the 7 fundamental frequencies
(Hz) for normal and masked auditory feedback. ........................................................................ 130
Figure 32. Breathy voice under normal and masked auditory feedback for subjects 17, 19, and
20. Mean of laryngeal resistance (cmH2O/l/s) as a function of the 7 fundamental frequencies
(Hz) for normal and masked auditory feedback. ........................................................................ 131
Figure 33. Normal auditory feedback for subjects 17, 19, 20 across breathy, normal, and pressed
voice qualities. Mean of laryngeal resistance ............................................................................ 131
Figure 34. Masked auditory feedback for subjects 17, 19, 20 across breathy, normal, and pressed
voice qualities. Mean of laryngeal resistance ............................................................................ 132
xi
PREFACE
Completing a doctoral degree is truly a team effort. I was blessed to have an amazing
team encouraging me to learn, to persevere, and to remember what matters in life. This
acknowledgement section provides an opportunity to thank my team. Kittie, my dissertation
advisor, mentor, and friend, thank you for all your support and guidance over the past 4 years. I
know that we will continue to collaborate on future projects and more importantly we will
continue to be great friends.
I would also like to thank the other members of my committee. Dr. Tim Lee, thank you
for all your expertise in guiding a novice through the immense motor control and motor learning
literature. I felt like a fish out of water, but your calm reassurance and amazing intellect put me
at ease and helped me to realize, “I can do this.” Dr. Jere Gallagher, thank you for providing my
first introduction to the world of behavioral motor control and motor learning. You helped me to
recognize the feasibility of expanding investigations beyond the typical bimanual coordination
domain to the novel voice coordination domain. Dr. Susan Shaiman, thank you for listening
when things got difficult. Your advice and compassion kept me going and reminded me that a
light exists at the end of the tunnel, just keep moving. Dr. Scott Yaruss, thank you for offering
your fair-minded suggestions in solving scientific questions. I will always continue to consider
what is relevant to the experimental question
xii

Three other collaborators were integral to completion of my dissertation and to my
growth as a scientist. Dr. Elaine Rubinstein, thank you for your statistical expertise in
experimental design and analysis. I truly love thinking through a design of an experiment and
applying the analysis. Your enthusiasm and ability to adapt to a new project is truly amazing. I
will always appreciate your prompt responses to emails and your flexibility with scheduling
appointments. You were always willing to help. Dr. Quincy Almeida, thank you for the
opportunity to run the limb study in your lab at Wilfrid Laurier. Not only did you provide
guidance on performing and writing up the limb study, but you also organized my visit securing
a place to stay, offering your home for a much needed meal break, and recruiting all of my 15
subjects. Mr. Neil Szuminsky, without you, the voice study would still be a dream and not a
reality. Thank you for your engineering skills. The software program you designed for the voice
study is so easy to use and I can’t wait to incorporate it into future studies both clinical and
theoretical. All the times you met with me, driving from Mars or the VA, I will never forget
your generosity and your compassion for a student with little funds. I think the voice world is
ready for a new aerodynamic tool for both research and clinic.
To my parents, I am so grateful that pursing the Ph.D. meant moving back to Pittsburgh.
Having your support only 30-minutes away has helped me get through some really tough times.
Mom, thanks for reminding me not to stress out and that life is too short to worry about all the
little things. Dad, thanks for your constant support and for always believing in me. To all my
friends, Beth, Cari, fellow lab mates, you were always willing to listen and to offer advice when
things got tough. Finally, to my husband John, without you in my life none of this would have
been possible. You were always a shoulder to lean on when things got tough. You believed in
xiii

me and encouraged me to pursue the doctorate. Thank you for all the times we spent in the lab
recording all the data from that “crazy limb machine”. This degree also has your name on it.
I love you.
xiv

1.0 CHAPTER 1: INTRODUCTION
Motor control and motor learning are core issues in many rehabilitation programs
involving occupational, physical and speech therapy. Consequently, just as investigations into
pharmaceutical agents and surgical tools are central to the practice of medicine and surgery,
investigations into motor control and motor learning are central to rehabilitation science.
Surprisingly, theoretical explorations of the mechanisms by which people acquire new physical
skills and override old ones have largely been overlooked in the rehabilitation literature (see
however, Buchanan & Ulrich, 2001; Gonnella, Hale, Ionta & Perry, 1981; Hochstenbach &
Mulder, 1999; Latash & Anson, 1996; Mulder, 1991; Mulder, Zijlstra, Zijlstra, & Hochstenbach,
2004; Rouselle & Wolff, 1991; Scholz, 1990; Smethurst & Carson, 2001; Winstein,1991;
Woolridge & McLaurin, 1976).
Complicating such investigation are theoretical debates that have raged across two
primary contemporary accounts of motor control and motor learning: schema theory, which
emphasizes a generally top-down approach with covert rules for movement constructed by the
actor (Schmidt, 1975, 1976, 2003) and dynamic systems theory, which is generally bottom-up in
emphasizing coordinative factors that exist independent of the actor (Haken, Kelso & Bunz,
1985; Jeka & Kelso, 1989; Kelso, 1995; Wallace, 1996). A central issue in the debates has
regarded the relative contribution of a hypothetical “generalized motor program” (GMP) versus
synergistic dynamics to motor control and learning. Schema theory asserts a central role of a
GMP, conceived as a command function causal to movement, and executed by the
1

biomechanical system. In contrast, dynamic systems theory takes the opposite approach,
claiming that the motor system self-organizes according to synergistic principles of coordinated
structures without any necessary command functions.
Somewhat in contrast to both approaches, recent neurophysiological research points to a
dynamic heterarchy of nervous system organization and function in which influences are seen
from top-down, bottom-up, and horizontal operations (Crick & Koch, 1990, 2003; Davis, 1976;
Edelman, 1987; Guillery & Sherman, 2002; Jones, 2001; Mountcastle, 1979). To the extent that
theories of motor control and learning seek coherence across behavioral and neurophysiological
data, what is needed is an expanded theory of motor control and learning that is consistent with
recent behavioral as well as neurophysiological views of nervous system organization and
function. The present studies, which are conducted with a general dynamic systems framework,
address this theoretical need as well as a practical one. The theoretical pursuit regards the
relevance of heterarchical features in motor control and specifically, the role of sensory feedback
(i.e., vision and audition) on the coordination dynamics of a limb and a voice task. The practical
focus is a newly developing Global Voice Therapy Program that emphasizes the importance of
auditory and kinesthetic feedback in voice training (Grillo, in preparation).
In sum, the present studies are motivated by a convergence of theoretical and practical
concerns. This chapter provides critical background information addressing the following issues:
(1) basic foundations of nonlinear dynamics, (2) dynamic systems theory applied to motor
behavior and the Haken, Kelso, and Bunz (HKB) (1985) model including predictions and
limitations, (3) gaps in the literature addressed in the present studies, (4) further extension of
dynamic systems theory perspective to the case of voice production, and (5) statement of
purpose, specific aims, experimental questions, and hypotheses in the present series.
2

1.1 BASIC FOUNDATIONS OF NONLINEAR DYNAMICS
1.1.1 Concepts related to the field of nonlinear dynamics
The next sections provide an overview of elemental concepts in nonlinear dynamics with
specific reference to linear versus nonlinear systems and dynamic systems. Key concepts are
also defined including order parameters, control parameters, and stability.
1.1.2 Linear versus Nonlinear Systems
In geometry, linearity refers to lines, planes, and flat three-dimensional space with
predictable linear trajectories. Linear objects and resultant linear trajectories appear the same no
matter how they are examined (Farin & Hansford, 2005). Conversely, nonlinear behavior is any
behavior that suddenly deviates from a previously smooth and predictable linear trajectory
(Slotine & Li, 1991). For example, a nonlinear object, such as a sphere, deviates from a
predictable linear trajectory when it is viewed from different vantage points. A sphere looks like
a sphere from 2 feet away; however, when the sphere is viewed from 50 feet away it looks like a
point. These deviations or discontinuities from predictable linear behavior have been recognized
in many scientific fields (e.g., physical, chemical, biological), but have not been seriously
studied in behavioral research until recently (Briggs & Peat, 1989; Campbell, 1987; Gleick,
1987; Haken, 1983, 1984, 1988; Haken, Kelso & Bunz, 1985; Laskar, 1989; Lorenz, 1963;
Slotine & Li, 1991). One reason for this lack of investigation is that nonlinear behavior has often
been considered an anomaly and sometimes even noise within various systems. The smooth,
predictable, linear aspects of behavior, therefore, have traditionally garnered most of the
attention in science (Briggs & Peat, 1989).
3

In fact, from the time of Newton and his laws of motion; science has been preoccupied
with describing the order in nature through predictable linear behaviors and equations (Fauvel,
Flood, Shortland & Wilson, 1988). For example, in the following linear equation a change in the
known independent variable (x) leads to a proportional change in the dependent variable (y)
(Fauvel et al., 1988).
If x=y, then 4x=4y, 16x=16y, and so on for all values of x and y.
Of course, this type of linear equation has been helpful in many human enterprises, such as
measuring the weight of objects, building bridges, and early theorizing about speech production.
The traditional source-filter theory of speech production suggested a linear equation (Fant,
1960).
Vocal fold vibration + filter functions → speech output.
Recent research, however, suggests that the linear source-filter theory of speech production
(Fant, 1960) is inadequate in describing speech production due to the nonlinear behavior between
the filter function and vocal fold vibration (Austin & Titze, 1997; Titze & Story, 1997).
Although the source-filter theory of speech production has been the predominant model of
speech for nearly half a century, a perusal of the literature indicates that vocal fold vibrations in
voice production were originally described by nonlinear equations as self-sustained oscillations
(Ishizaka & Flanagan, 1972; Ishizaka & Isshiki, 1976).
1.1.3 Dynamic Systems
Nonlinear science is interrelated with the concept of dynamic systems. Dynamic systems
are complex systems composed of two or more component parts that self-organize with a
continuous flow of energy in and out of the system (Coveney & Highfield, 1990; Gleick, 1987;
4

Hale & Kocak, 1991; Kelso, Holt, Kugler & Turvey, 1980; Kugler, Kelso & Turvey, 1980;
Prigogine & Stengers, 1984). According to the movement sciences literature, the component
parts interact for production of functional gestures (Kelso et al., 1980; Kugler et al., 1980;
Turvey, Rosenblum, Schmidt & Kugler, 1986). The component parts of a dynamic system are
proposed to be self-organized, and thus the need for a central command structure is eliminated.
Moreover, according to dynamic system theory of motor behavior, central commands would be
unfavorable to movement production because they would slow down the movement system
(Kelso et al., 1980; Kugler et al., 1980).
Dynamic systems are nonlinear and consist of a phase space (Coveney & Highfield,
1990; Gleick, 1987; Hale & Kocak, 1991). The phase space specifies the system completely by
predicting how the system will function in the immediate future. The patterns of behavior that
exist in the phase space can be finite (e.g., two states for the ideal coin toss, head or tails) or
infinite (e.g., all real numbers as possible states) (Coveney & Highfield, 1990; Gleick, 1987;
Hale & Kocak, 1991). The coordinates of the phase space describe the dynamic system at any
instant and specify the immediate trend of all variables given the initial conditions of the
dynamic system variables (Coveney & Highfield, 1990; Gleick, 1987; Hale & Kocak, 1991).
Dynamic systems can be deterministic or random depending upon the number of reasonable
outcomes from a defined probability distribution (Campbell, 1987; Gleick, 1987; Hale & Kocak,
1991). A deterministic dynamic system requires a unique reasonable outcome for every possible
state, whereas a random dynamic system has more than one reasonable outcome for every
possible state (Campbell, 1987; Gleick, 1987; Hale & Kocak, 1991). Most nonlinear dynamic
investigations deal with deterministic systems.
5
1.1.4 Order and Control Parameters
Order parameters are indices along which patterns of behavior emerge from the internal
self-organization of the component parts of a dynamic system (Haken, 1984, 1988). In contrast,
control parameters are external variables that influence the patterns of behavior (Haken, 1984,
1988). Stated differently, the order parameter can be seen as a dependent variable, whereas the
control parameter can be seen as an independent variable. The control parameter does not carry
information about how it will influence the behaviors, but rather guides the dynamic system
through the various behaviors on a moment-to-moment basis (Haken, 1984, 1988). To better
illustrate the distinction between order and control parameters, consider heating oil in a pan for
cooking vegetables. As the pan is gradually heated, the order parameter of the oil molecules
achieves a pre-boiling state in which cooler oil molecules are positioned on the surface of the pan
and warmer molecules are positioned on the bottom of the pan. As the temperature increases, the
order parameter of the oil molecules reaches the boiling state as hot oil molecules consume the
pan. The order parameter of the oil molecules (e.g., pre-boiling versus boiling) was influenced
by changes in an external variable or control parameter (e.g., heat). Proponents of dynamic
system theory in motor behavior propose that order parameters emerge from self-organization
within the movement system, whereas control parameters represent all external variables that
influence the movement system, including frequency of oscillation and environmental
constraints (Fowler & Turvey, 1978; Kugler & Turvey, 1987; Newell, Kugler, van Emmerik &
McDonald, 1989).
6

1.1.5 Stability
Another important principle in nonlinear dynamics is “stability” or resistance to change
within a dynamic system (Kelso et al., 1980). In the preceding illustration around heated oil
molecules, the pre-boiling state was stable for a short time before it was replaced by the boiling
state when heat was added from the control parameter. Stated differently, each behavior pattern
(e.g., pre-boiling and boiling) has stability or a resistance to change once the pattern is
established. Stability of a behavior pattern, however, can be overcome by the influence of a
control parameter as demonstrated in the oil molecules example. That is, the continuous scaling
of a control parameter (e.g., heat) produces a discrete shift in the order parameter (e.g., oil
molecule activity). The concept of stability and loss of stability lies at the heart of nonlinear
dynamic systems theory and will be discussed later in the chapter.
To summarize, component parts of nonlinear dynamic systems are self-organized for
production of functional gestures. Order parameters are the index along which patterns of
behaviors emerge from the dynamic system. External variables called control parameters can act
upon the dynamic system and push it into different patterns of behavior. These core concepts
provide a framework within which to understand the most elemental theoretical constructs that
govern dynamic systems theory’s predictions around motor behavior.
1.1.6 Historical Review of the Field of Nonlinear Dynamics
The relevance of dynamic systems theory is perhaps best appreciated within the larger
context of the history of science. Some historians would agree that the foundations of
contemporary physical science had origins with Isaac Newton’s Principia published in 1686
7
(Briggs & Peat, 1989; Coveney & Highfield, 1990; Fauvel et al., 1988). In Principia, Newton
attempted to describe the state and motion of a body in space as well as factors that influence the
body’s motion (see Fauvel et al., 1988 for a biography of Newton’s life and scientific
contributions). Newton’s laws, as described in Principia, present a linear, predictive description
of factors that govern and influence the trajectory of a body in space (Fauvel et al., 1988). The
linear explanation of bodies in space allowed for the study of isolated parts within a complex
system, such as the planetary system. The notion was that if the isolated parts of a complex
system could be understood, then a simple reassembly of them would result in an understanding
of the whole. This reductionist approach, which broke the behavior of dynamic systems up into
its component parts, became a pervasive paradigm throughout science (Briggs & Peat, 1989;
Coveney & Highfield, 1990; Fauvel et al., 1988). The reductionist approach is still prevalent
today as seen in efforts to search for the building blocks of life, map smaller and smaller areas of
the brain, and identify central pattern generators in the central nervous system (CNS). The
reductionist approach has made significant contributions to the understanding of nature;
however, proponents of nonlinear dynamics believe that the emphasis on microscopic behaviors
in isolation does not allow for a full description of dynamic, complex systems (Campbell, 1987;
Gleick, 1987).
A threat to Newtonian mechanics and the reductionist approach began to emerge by the
19th century (Briggs & Peat, 1989; Coveney & Highfield, 1990; Gleick, 1987; Prigogine &
Stengers, 1984). The threat arose from observations of macroscopic features of complex systems
rather than individual or microscopic elements. Interestingly, this threat to Newtonian
mechanics began with an innocent interest in the behavior of heat, but developed into a major
domain of inquiry within physics called thermodynamics (Briggs & Peat, 1989; Coveney &
8

Highfield, 1990; Gleick, 1987; Prigogine & Stengers, 1984). Thermodynamics focused
primarily on complex systems and the macroscopic features of those systems at or close to
equilibrium (Briggs & Peat, 1989; Coveney & Highfield, 1990; Gleick, 1987; Prigogine &
Stengers, 1984).
Two laws emerged from the study of thermodynamics. The first law states that total
energy in a system cannot be created or destroyed and the second law states that in any
conversion between heat and work some energy is lost (Briggs & Peat, 1989; Coveney &
Highfield, 1990; Gleick, 1987; Prigogine & Stengers, 1984). In 1865, Clausius re-formulated the
second law using a new concept he dubbed entropy, defined as the degree to which a complex
system has the capacity for change (Briggs & Peat, 1989; Coveney & Highfield, 1990; Gleick,
1987; Prigogine & Stengers, 1984). A complex system that has a considerable capacity for
change is said to have low entropy, whereas a complex system that has a minimal capacity for
change is said to have high entropy (Briggs & Peat, 1989; Coveney & Highfield, 1990; Gleick,
1987; Prigogine & Stengers, 1984). In a high entropy condition, the system has reached a state
of equilibrium in which no exchange of energy occurs, therefore, it is not likely that the system’s
behavior will change. Conversely, a complex system that has reached low entropy or a non-
equilibrium condition is more likely to change (Briggs & Peat, 1989; Coveney & Highfield,
1990; Gleick, 1987; Prigogine & Stengers, 1984). Additionally, if a system is exposed to outside
energy sources or control parameters, the system will be pushed to high or low entropy
conditions depending upon the type and degree of the control parameter (Haken, 1984, 1988).
A complex system, however, is usually attracted to high entropy or equilibrium (Briggs
& Peat, 1989; Coveney & Highfield, 1990; Gleick, 1987; Prigogine & Stengers, 1984). For
example, a ball pushed down a hill will eventually end up at the bottom of the hill in a state of
9
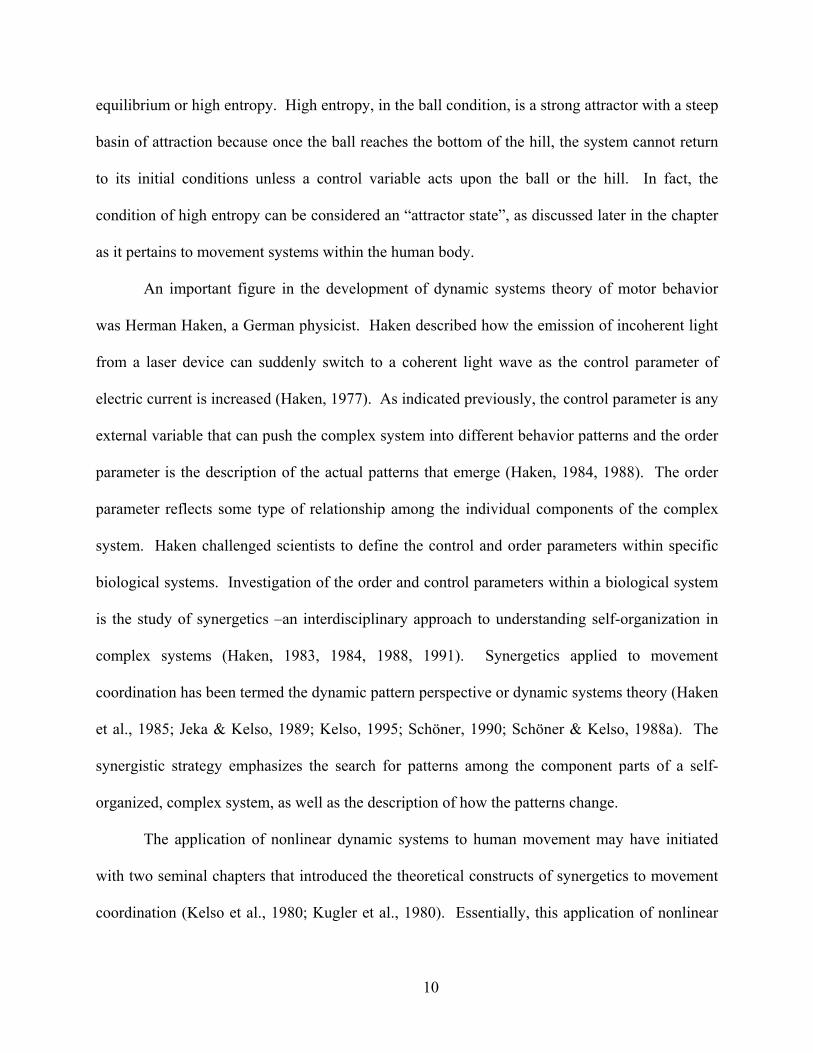
equilibrium or high entropy. High entropy, in the ball condition, is a strong attractor with a steep
basin of attraction because once the ball reaches the bottom of the hill, the system cannot return
to its initial conditions unless a control variable acts upon the ball or the hill. In fact, the
condition of high entropy can be considered an “attractor state”, as discussed later in the chapter
as it pertains to movement systems within the human body.
An important figure in the development of dynamic systems theory of motor behavior
was Herman Haken, a German physicist. Haken described how the emission of incoherent light
from a laser device can suddenly switch to a coherent light wave as the control parameter of
electric current is increased (Haken, 1977). As indicated previously, the control parameter is any
external variable that can push the complex system into different behavior patterns and the order
parameter is the description of the actual patterns that emerge (Haken, 1984, 1988). The order
parameter reflects some type of relationship among the individual components of the complex
system. Haken challenged scientists to define the control and order parameters within specific
biological systems. Investigation of the order and control parameters within a biological system
is the study of synergetics –an interdisciplinary approach to understanding self-organization in
complex systems (Haken, 1983, 1984, 1988, 1991). Synergetics applied to movement
coordination has been termed the dynamic pattern perspective or dynamic systems theory (Haken
et al., 1985; Jeka & Kelso, 1989; Kelso, 1995; Schöner, 1990; Schöner & Kelso, 1988a). The
synergistic strategy emphasizes the search for patterns among the component parts of a self-
organized, complex system, as well as the description of how the patterns change.
The application of nonlinear dynamic systems to human movement may have initiated
with two seminal chapters that introduced the theoretical constructs of synergetics to movement
coordination (Kelso et al., 1980; Kugler et al., 1980). Essentially, this application of nonlinear
10

dynamic systems and synergetics to human movement was formulated to solve Bernstein’s
(1967) degrees of freedom problem. Bernstein’s degrees of freedom problem refers to the
problem of how the body can control the many independent parts of a movement system without
“too much” regulation from central command processes. Bernstein (1967) theorized that control
of an action in a complex system was possible only because of functional synergies between the
muscles and joints, thus limiting the need for central command functions. This is not to say that
Bernstein did away with a central command function in its entirety. Rather, he emphasized
functional synergies that release some of the burden from hypothetical central command
functions. Dynamic systems theorists, however, essentially followed a line of thinking that the
functional synergies proposed by Bernstein (1967) left the action system independent from a
central control (Haken et al., 1985; Kelso et al., 1980; Kugler et al., 1980).
According to Turvey (1990), the degrees of freedom problem postulated by Bernstein
prompted two rounds of theorizing. The first round of theorizing in the 1960s and 1970s
attempted to identify coordinative components of dynamic, biological systems (Gelfand,
Gurfinkel, Tsetlin, &Shik, 1971; Greene, 1972). Early research on identification of dynamic
structures followed Bernstein’s (1967) functional synergies approach. Functional synergies were
discovered that underlie coordinative patterns such as locomotion (Shik & Orlovski, 1976),
aiming at a target (Arutyunyan, Gurfinkel & Mirsky, 1969), and maintaining an upright posture
during breathing (Gurfinkel, Kots, Paltsev & Feldman, 1971). The first principle of dynamic
systems theory of motor behavior, therefore, involves the identification of coordinative structures
within a nonlinear dynamic system (Easton, 1972; Turvey, 1977).
The second round of theorizing in the 1980s and 1990s focused on the self-organization
within a dynamic, coordinative system responsible for rhythmic movement. In line with this
11

second round of theorizing, Kelso (1981, 1984) explored the nonlinear dynamics of rhythmic
movement with two bimanual experiments in humans. The first experiment was conducted
around bimanual finger movements (Kelso, 1981) and the second was related to bimanual wrist
movements (Kelso, 1984). Across the series, subjects were required to produce simultaneous
and cyclical (oscillatory) movements with the left and right index fingers or the left and right
wrists. Independent variables included relational patterning of the movements and frequency of
oscillations.
Relative to movement patterning, subjects were required to start a trial in one of two
movement patterns: the in-phase pattern or the anti-phase pattern. In the in-phase or 0º relative
phase pattern, the fingers or the wrists moved toward each other and then away from each other
continuously using the same homologous muscle groups contracting at the same time (Kelso,
1981, 1984). In the anti-phase or 180º relative phase pattern, the fingers or wrists moved
together in a parallel fashion with the homologous muscle groups contracting in an alternating
fashion (Kelso, 1981, 1984).
The second independent variable was frequency of oscillations. The target frequency
was provided by the pacing of an auditory metronome. Subjects were required to keep pace with
the metronome by performing oscillations in time with the beat in Hertz (Hz). At the beginning
of the trial, the metronome started at 1Hz and beeped 15 times at that frequency before being
increased at steady increments of .25 Hz until a final oscillatory frequency of 3Hz was reached.
Each set of 15 beeps at a given frequency was called a plateau. From this experimental
paradigm, Kelso (1981, 1984) was able to calculate two dependent variables: mean relative
phase error and the standard deviation around the mean within each oscillatory frequency
plateau.
12

The results of the experiment indicated that subjects who initially performed the in-phase
or 0º pattern stayed in the pattern as the oscillatory frequency increased from 1 Hz to 3HZ.
Subjects who initially performed the anti-phase or 180º pattern maintained the pattern for
oscillatory frequencies ranging from 1Hz to 2.25 Hz, however, standard deviations were greater
than standard deviations for the 0º pattern (Kelso, 1981). At oscillatory frequencies ranging
from 1-2.25 Hz, Kelso (1981) identified the 0º pattern and the 180º pattern as conditions of
attractor states because of their stability as evidenced by limited variability. As the oscillatory
frequency or control parameter was increased beyond 2.25 Hz, the 180º pattern lost stability and
performance switched to the 0º pattern (i.e., the more stable of the two).
The switch in performance from the 180º to 0º pattern beyond the frequency of 2.25 HZ
is called a phase transition (Kelso, 1981, 1984). After the phase transition was made to the 0º
pattern, subjects did not switch back to the 180º even when the oscillatory frequency was slowed.
According to dynamic systems theory, the effect of resistance to change once the 0º relative
phase pattern was achieved is consistent with a condition of high entropy or an attractor state.
The 180º pattern was also classified as an attractor state for frequencies ranging from 1 Hz to
2.25 Hz.
Based on the results of Kelso’s (1981, 1984) experiments, Haken, Kelso, and Bunz
(1985) developed a theoretical model to describe the coordinated behavior exhibited in a simple
two-finger and two-wrist system (Haken et al., 1985). That model became known as the HKB
model (after the authors) and in retrospect became the fundamental formal construct for the
dynamic systems theory of coordination proposed by Kugler and colleagues (1980) and Kelso
and colleagues (1980). To describe nonlinear dynamics of the bimanual upper limbs, Haken and
colleagues (1985) had to accomplish the following: (1) define a control and an order parameter;
13

(2) identify the presence of high entropy or an attractor state; and (3) define a coupled oscillator
with two degrees of freedom for the two component parts (e.g., bimanual fingers or bimanual
wrists).
The relative phase patterns of 0º and 180º were good candidates for the order parameter
because relative phase reflected the coordination among the component parts with two degrees of
freedom (e.g., bimanual fingers or bimanual wrists). The control parameter was the oscillatory
frequency. The oscillatory frequency was an external variable imposed on the bimanual finger
or wrist system. Haken and colleagues (1985) modeled the in-phase (0º) and the anti-phase
(180º) targets as attractor states, considering variations of the control parameter. According to
the HKB model (1985), when the complex, self-organizing system was in a less stable pattern
and the control parameter was changed, the system was attracted to the more stable pattern.
Furthermore, the change in the control parameter altered the potential attractor landscape to
induce a phase transition from the less stable 180º pattern to the more stable 0º pattern. The
HKB model (1985), therefore, was able to describe the results of Kelso’s (1981, 1984)
experiments.
In summary, Newtonian mechanics are adequate for describing predictable, linear
trajectories of single bodies when initial conditions (i.e., position and velocity) are known.
These Newtonian trajectory approximations, however, begin to break down when initial
conditions of single bodies are unknown and when the behavior of interconnected parts of a
dynamic system is studied. Thermodynamic principles, therefore, more adequately describe the
macroscopic features of dynamic systems with many coordinative components. According to
Clausius’s second law of thermodynamics, a dynamic system is gradually drawn to an attractor
state or a state of high entropy. External energy sources or control parameters acting upon the
14

complex system, however, can induce a variety of behavior patterns or order parameters.
Bernstein’s (1967) degrees of freedom problem prompted investigation into the identification of
functional synergies within the human body (Arutyunyan et al., 1969; Gurfinkel et al., 1971;
Shik & Orlovski, 1976) and the self-organization of such functional synergies for movement
output (Haken et al., 1985; Kelso, 1981, 1984).
Kelso (1981, 1984) subsequently applied nonlinear dynamic concepts to the motor
behavior of bimanual finger and wrist movements. From the experiments, results indicated that a
0º relative phase pattern and a 180º relative phase pattern are attractor states. The 180º pattern,
however, became unstable at higher oscillatory frequencies due to a change in the control
parameter. This instability led to a phase transition from the 180º pattern to the more stable 0º
pattern. Once the phase transition was achieved, the subjects failed to return to the 180º pattern
indicating a change in the attractor landscape due to the control parameter (Kelso, 1981). The
theoretical HKB model (1985) was developed by Haken, Kelso, and Bunz to describe and
replicate the behavioral results of the Kelso (1981, 1984) experiments. This model offered a way
of describing emerging patterns of coordination within a complex system as the patterns of
coordination are pushed into non-equilibrium conditions by the control parameter.
1.1.7 Nonlinear Mathematical and Physical Dynamics Applied to Voice Production
As noted, dynamic systems theory of motor behavior involves the study of synergetics
using the HKB model (1985) as the formal underlying framework. The study of non-linear
dynamics, however, is a massive field with research in other biological systems grounded in non-
linear dynamic principles of mathematics and physics rather than the HKB (1985) model (Ding,
Tuller & Kelso, 1995; Lipsitz, 1995; Smith & Neale, 1994). Of interest for the present work is
15

the use of nonlinear dynamics in voice science. Research on non-linear dynamics applied to
voice production has primarily focused on mathematics and physics as the framework for such
investigation as opposed to dynamic systems theory of motor behavior or the HKB (1985) model
(Behrman, 1999; Behrman & Baken, 1997; Berry, Herzel, Titze, Story, 1996; Herzel, Berry,
Titze & Saleh, 1994; Kelman, 1981; Mergell, Fitch & Herzel, 1999; Steinecke & Herzel, 1995;
Tokuda, Riede, Neubauer, Owren & Herzel, 2002). Recently, nonlinear dynamics have been
used to challenge traditional linear models of speech and voice production, according to which
acoustic filter functions from the vocal tract are simply added to vocal fold output acoustics to
produce the acoustic output at the mouth (Fant, 1960). Challenges to the linear model have come
in the form of data indicating interactive and thus nonlinear relations between subglottal
acoustics and vocal fold behavior (Austin & Titze, 1997) and between vocal tract acoustics and
vocal fold behavior (Titze, 2002). One scientist, however, investigated voice production from
the foundation of the dynamic systems theory of motor behavior and her work will be discussed
in a later section (Steinhauer, 2001).
Even without dynamic systems theory of motor behavior or the HKB (1985) model as the
framework, the non-linear, mathematical and physical investigation of voice production
emphasizes the concept of stability. For the movement scientist with the HKB (1985) model as a
theoretical foundation, stability or lack of stability of a dynamic system is demonstrated through
behavioral data (Kelso, 1981, 1984). In contrast, the scientist studying voice production from a
non-linear mathematical and physical framework superimposes behavioral data onto
mathematical equations for a measure of stability (Behrman, 1999; Behrman & Baken, 1997).
The method of stability analysis is different between the two frameworks; however, the goal of
determining the stability properties of a dynamic system remains the same.
16

The application of non-linear dynamics to voice production was intended to
mathematically characterize normal and abnormal vocal fold vibration from data obtained by
laryngeal stroboscopy, excised larynges, and human subjects. Laryngeal stroboscopy revealed
that various voice pathologies produced irregular vibratory patterns of the vocal folds resulting in
a rough voice quality (Hirano, 1989). Researchers, therefore, have performed experiments with
excised human and animal larynges to observe vocal fold movement by a strobe light during
different adduction and elongation patterns of the vocal folds (Berry et al., 1996; Kelman, 1981;
Tokuda et al., 2002). Observations of vocal fold vibration were made for various subglottal
pressures during asymmetric adduction and elongation of the vocal folds. Human subject data
involved microphone and electroglottography (EGG) signals during sustained /a/ phonations
(Behrman, 1999; Behrman & Baken, 1997) and narrow-band spectrograms for the sustained
vowels /e/ and /i/ (Herzel et al., 1994). Both healthy subjects with no laryngeal pathology and
subjects with laryngeal pathology were used in data collection. From the experimental data
obtained by laryngeal stroboscopy, excised larynges, and human subjects, researchers analyzed
the data within a mathematical, non-linear dynamic framework (Behrman, 1999; Behrman &
Baken, 1997) or devised computational models to represent normal and abnormal vocal fold
vibration (Herzel et al., 1994; Mergell et al., 1999; Steinecke & Herzel, 1995).
A focus of the mathematical, non-linear dynamic framework involves the identification
of possible states of a dynamic system called phase space. The phase space specifies the system
completely by knowing how the system will function in the immediate future. The patterns of
behavior that exist in the phase space can be finite (e.g., two states for the ideal coin toss, head or
tails) or infinite (e.g., all real numbers as possible states) (Coveney & Highfield, 1990; Gleick,
1987; Hale & Kocak, 1991). For example, Behrman and Baken (1997) embedded EGG data
17

within the infinite phase space for production of the sustained /a/ vowel at a comfortable pitch
and loudness level. The embedding of the EGG data followed methods by Takens (1981), in
which reconstruction of the attractor was accomplished using the method of lag variables. Once
the EGG data were embedded, the correlation dimension was estimated (Behrman & Baken,
1997). The correlation dimension is an estimate of the complexity or irregularity of a system in
space or time, which provides information about the number of dimensions required to describe
the attractor (Barnsley, 1988; Grassberger & Procaccia, 1983; Mandelbrot, 1983). The
estimation of the correlation dimension from the embedded EGG data was used for an ultimate
goal of approximating the minimum degrees of freedom required to describe healthy and
dysphonic phonation (Behrman & Baken, 1997). Although the correlation dimension appeared
generally consistent for the healthy subjects, results indicated that the correlation dimension for
the subjects with vocal fold pathologies was highly variable and should be interpreted with
caution when approximating system dynamics for dysphonic behaviors of the phonatory system.
The term “degree of freedom”, used in mathematical and physical investigations of
dynamic systems, usually refers to a single coordinate dimension of the phase space. For
example, Titze (1994, 1976) modeled healthy vibration as a coupled 11 mode oscillator with two
degrees of freedom for each coordinate dimension of the phase space, which corresponded to one
degree of freedom in the antero-posterior plane and one degree of freedom in the inferior-
superior plane. Conversely, Bernstein’s (1967) definition for “degree of freedom” involves the
number of component parts within a dynamic system contributing to the synergistic production
of a functional gesture. For example, Kelso (1981, 1984) identified two degrees of freedom for
the production of bimanual relative phase patterns (i.e., one degree of freedom for the right hand
and one degree of freedom for the left hand). This discrepancy in definitions can lead to
18

confusion and it is advisable to check which meaning of the term is intended in a particular
context.
In a subsequent study, Behrman (1999) did not investigate the correlation dimension for
healthy subjects and subjects with laryngeal pathology. Instead, the global embedding
dimension and local dynamical dimension were calculated from both microphone and EGG
signals during sustained phonation of /a/ for 5 healthy subjects and 7 subjects with laryngeal
pathology. The calculation of the global embedding dimension was used to unfold the attractor
in a multi-dimensional phase space. The calculation of the local dynamical dimension was used
to approximate the dominant degrees of freedom of the unfolded attractor. The purpose of the
Behrman (1999) study was to initially classify different vibratory modes of the vocal folds by the
calculation of the global embedding dimension and the local dynamical dimension. The data,
however, did not reveal consistent differences in degrees of freedom between healthy and
pathologic phonation or between different vibratory modes of pathologic phonation. The local
dynamical dimension suggested that the pathologic vocal fold vibration was governed by a low
number of dominant degrees of freedom.
In conclusion, the non-linear, mathematical investigations into the stability properties of
the voice production system for healthy subjects and subjects with laryngeal pathology appear to
be inconclusive (Behrman, 1999; Behrman & Baken, 1997). The calculation of the correlation
dimension from EGG signals during sustained /a/ productions was highly variable in subjects
with laryngeal pathology (Behrman & Baken, 1997). Consequently, Behrman (1999) attempted
to distinguish normal phonation from pathologic phonation by calculating global embedding and
local dynamical dimensions during microphone and EGG signals of sustained /a/ productions.
The data indicated no significant difference between normal and pathologic phonation (Behrman,
19

1999). The application of non-linear, mathematical and physical dynamics to voice production
by superimposing behavioral data onto mathematical equations has not consistently produced
distinctions between normal and pathologic phonation (Behrman, 1999; Behrman & Baken,
1997). This inability to distinguish between normal and pathologic phonations may be due to the
method of analysis by superimposing behavioral data onto mathematical equations for
determining the stability properties of the dynamic system. Perhaps the stability properties of a
dynamic, biological system should be investigated by real-time behavioral data with the possible
attractor landscape identified before beginning the analysis and collecting the data. The
proposed studies outlined in a later section will attempt to investigate the stability properties of
the limb system and the voice production system by real-time behavioral data with a known
potential attractor landscape.
1.2 DYNAMIC SYSTEMS THEORY APPLIED TO MOTOR BEHAVIOR
AND THE HKB (1985) MODEL: PREDICTIONS AND LIMITATIONS
As previously discussed, the application of nonlinear dynamics to motor behavior
originally involved a theory of motor coordination (Haken et al., 1985; Kelso, 1981, 1984;
Schmidt & Fitzpatrick, 1996). According to dynamic systems theory, control of a motor
behavior involves the coupling of relevant coordinative movement structures so that synergy is
attained among the component parts (Schmidt & Fitzpatrick, 1996). The concept of a motor
program or central executive, which is central to schema theory, an alternative theory of motor
control and motor learning (Schmidt, 1975; 1976; 2003), plays no clearly discernible role in the
dynamic systems theory of motor behavior. Rather, emphasis is placed on solving the “degrees
20

of freedom” problem of how the motor system organizes itself to perform complex movements
without control from a central executive (Bernstein, 1967). According to Bernstein (1967), when
two or more independent moving degrees of freedom combine to produce one functional gesture,
the independent parts are coupled to form a coordinative structure. This coupling, hypothesized
by Bernstein (1967) to solve the degrees of freedom problem, occurs at the biomechanical
system with no influence from the central executive. Dynamic systems theory only later
addressed motor learning. For example, Zanone and Kelso (1992) suggested that improvement
in the production of an action is achieved by optimization of the synergy between the component
parts of a complex moving system.
In more recent years, Haken, Kelso, and Bunz (1985) formulated the “HKB” model to
provide a systematic foundation for theoretical constructs of dynamic systems theory in motor
behavior. As noted, this model linked the concepts of thermodynamics (Briggs & Peat, 1989;
Coveney & Highfield, 1990; Gleick, 1987; Prigogine & Stengers, 1984), pattern formation in
complex systems far from equilibrium (Haken, 1977, 1984, 1988), and coordinative structures of
human movement (Kelso, 1981, 1984) to a theory of motor control involving nonlinear dynamic
system principles and concepts. To apply the dynamic systems theory to motor behavior, the
HKB model (1985) had to combine elements of nonlinear dynamic systems as they relate to
human movement. The elements included: non-linear behavior, dynamic systems, control and
order parameters, and stability properties. The HKB model (1985), therefore, has two levels: (1)
a potential, which describes the stability properties of relative phase between two limbs and (2) a
nonlinear system of coupled or synergistic oscillators, which relates these potentials to individual
limb movements and their interactions.
21

Within the potential level, control and order parameters are defined for a coordinated
movement system. The control parameter is any external variable that may influence the system
or push it towards a change in behavior pattern that is not inherent within the complex system
(e.g., increasing speed of oscillation is a control parameter; Haken, 1984, 1988). The order
parameter is the index along which behavior patterns emerge out of a dynamic system (e.g.
relative phase between the two limbs; Haken, 1984, 1988). A behavior pattern that occurs
spontaneously is said to function as an intrinsic dynamic if it is inherent to the system without
the need for a control parameter to influence its pattern of behavior (Kelso, 1995). Intrinsic
dynamics correspond to the attractor landscape of the order parameters. The HKB model (1985)
specifically addressed the moving nonlinear system as bimanual finger or wrist gestures. The
order parameters, therefore, are the relative phase patterns between the bimanual effectors.
The stability properties of the relative phase patterns are identified by the potential
movement pattern landscape and the amount of variability inherent to the movement pattern
landscape (Haken et al., 1985). For example, a stable attractor state or a state of high entropy
would be characterized by a small region in the potential movement landscape with limited
variability. Conversely, an unstable pattern of low entropy or a non-attractor state would be
characterized by a large region in the potential movement landscape with greater variability. In
summary, the potential level of the HKB model has the ability to describe the stability properties
of relative phase with influences from a control parameter.
The second level of the HKB model (1985) is the nonlinear system of coupled oscillators.
This coupled oscillator level relates the potential level to individual limb movements and their
interactions. The limbs were modeled as self-organized oscillators with two degrees of freedom;
one degree of freedom for one limb and the other degree of freedom for the other limb. The
22

HKB (1985) model coupled the two limbs through their changing amplitudes as the control
parameter (e.g., frequency or oscillatory changes) was varied. It was important that the model
include coupling of the two limbs because the experiments by Kelso demonstrated phase
transitions from a less stable pattern (e.g., 180° relative phase,) to a more stable pattern (e.g., 0°
relative phase) based on amplitude changes between bimanual finger and bimanual wrist gestures
(Kelso, 1981, 1984). For example, the phase transition and loss of stability at oscillatory
frequencies above 2.25 Hz for the 180º pattern was characterized by a decrease in amplitude
between the coupled limbs (Kelso, 1981, 1984).
Learning, within the context of the HKB model (1985), is viewed as a pattern formation
process in which the learner acquires new coordination patterns on the background of already
existing patterns. Existing patterns refer to the intrinsic dynamics of a complex system that are
inherent to the individual without the need for environmental influences. In Kelso’s experiments
(1981, 1984), subjects were asked to perform 0° and 180° patterns with no guidance or with
special instructions provided once the task began. In the in-phase or 0º relative phase pattern, the
fingers or the wrists moved toward each other and then away from each other continuously with
the same homologous muscle groups contracting at the same time (Kelso, 1981, 1984). In the
anti-phase or 180º relative phase pattern, the fingers or wrists moved together in a parallel
fashion with the homologous muscle groups contracting in an alternating fashion (Kelso, 1981,
1984). Kelso (1981, 1984) concluded that the behavior exhibited by the subjects was primarily
due to each subject’s intrinsic dynamics. Visual feedback, however, was present in the
experiment. The subjects were able to visualize their finger and wrist movements and to know
the positioning of the fingers and wrists in space from visual feedback. With the presence of the
23

visual feedback, it is difficult to conclude that the 0° and 180° patterns were inherently produced
as intrinsic dynamics without influences external to the moving limbs.
The HKB model (1985) considered only two degrees of freedom representing the two
limbs. No other additional external influences were included that could potentially influence
movement output. Additional external influences for the production of movement might have
included feedback from the periphery. The control parameter within the potential level of the
HKB model (1985) accounts for all necessary external or environmental influences, thereby
rendering top-down allowances to the dynamic system unnecessary. The original HKB (1985)
model has been expanded to include influences from external variables (Peper, Beek &
Daffertshofer, 2000; Schöner & Kelso, 1988a, 1988b); however, intrinsic dynamics are still
considered to be spontaneous to a moving system without the need for external influences
(Kelso, 1995, Wallace, 1996).
In summary, dynamic systems theory positions itself as a theory of motor coordination
(Haken et al., 1985; Jeka & Kelso, 1989; Wallace, 1996). Applied to many domains within
contemporary science (Camazine, Deneubourg & Franks, 2001), this theory describes human
beings as self-organizing systems capable of stability and coordination in the production of
movement. Movement patterns are seen as an emergent set of relations among the coordinated
movement system. What is organized, therefore, is a set of physically encoded intrinsic
dynamics of a coordinated movement system rather than a motor program governing movement
output (Haken et al., 1985; Jeka & Kelso, 1989). A movement pattern may change temporarily
or permanently depending upon the dynamic interaction between the component body parts and
the control parameter influencing the system. Inherently stable patterns that emerge out of
coordinative structures are called attractor states. Motor learning is seen to involve a breakaway
24

from existing, intrinsic attractor states towards novel, learned patterns (Schöner, Zanone &
Kelso, 1992; Wallace, 1996; Zanone & Kelso, 1992, 1997). The movement process is
characterized by a temporary increase of within- and between-trial variability until a new
attractor state is established (Kelso, 1995; Wallace, 1996).
1.2.1 Predictions of Dynamic Systems Theory of Motor Behavior
One prediction of dynamic systems theory of motor control and learning is that attractor
and non-attractor states can be identified in coordinated, self-organizing complex movement
systems. According to the second law of thermodynamics, a complex system may evolve from a
state of energy exchange or low entropy among its component parts to a state of no energy
exchange or high entropy condition (Briggs & Peat, 1989; Coveney & Highfield, 1990; Gleick,
1987; Prigogine & Stengers, 1984). The high entropy condition is often referred to as
equilibrium or an attractor state. Two types of attractor states are discussed in the motor
behavior literature: a point attractor, in which all behavior patterns of a complex system are
drawn to a single point, and a periodic or limit cycle, in which all behavior patterns of a complex
system are drawn to an area of attraction (Schmidt & Fitzpatrick, 1996; Turvey, 1990).
Support for the prediction that attractor states exist in coordinated, self-organized
movement systems comes primarily from literature on two classes of coordinated limb
movement; rhythmic and discrete. Using the measurement tools for the identification of attractor
states, motor behavior researchers have identified coordinated interlimb rhythmic movements as
a movement class in which dynamic principles of self-organization are operating. This
movement class has been characterized to possess two point attractors corresponding to the in-
phase (0º) and anti-phase (180º) relative phase patterns (Amazeen, Sternard & Turvey, 1996;
25
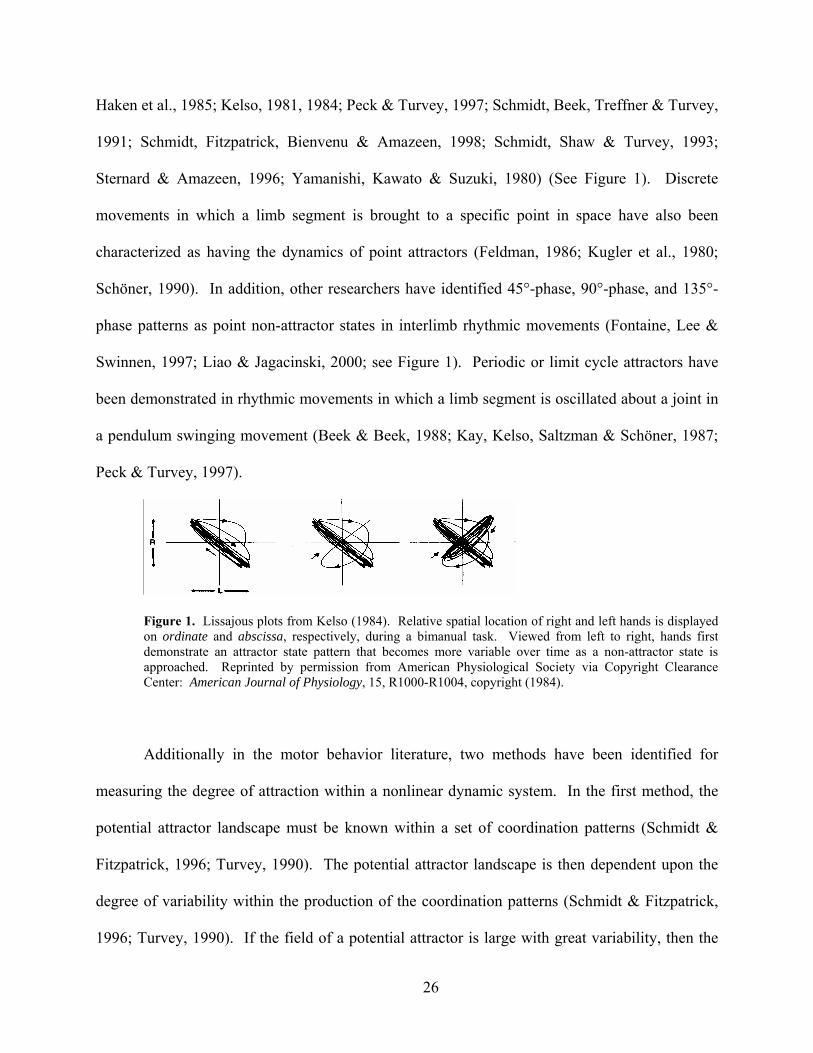
Haken et al., 1985; Kelso, 1981, 1984; Peck & Turvey, 1997; Schmidt, Beek, Treffner & Turvey,
1991; Schmidt, Fitzpatrick, Bienvenu & Amazeen, 1998; Schmidt, Shaw & Turvey, 1993;
Sternard & Amazeen, 1996; Yamanishi, Kawato & Suzuki, 1980) (See Figure 1). Discrete
movements in which a limb segment is brought to a specific point in space have also been
characterized as having the dynamics of point attractors (Feldman, 1986; Kugler et al., 1980;
Schöner, 1990). In addition, other researchers have identified 45°-phase, 90°-phase, and 135°-
phase patterns as point non-attractor states in interlimb rhythmic movements (Fontaine, Lee &
Swinnen, 1997; Liao & Jagacinski, 2000; see Figure 1). Periodic or limit cycle attractors have
been demonstrated in rhythmic movements in which a limb segment is oscillated about a joint in
a pendulum swinging movement (Beek & Beek, 1988; Kay, Kelso, Saltzman & Schöner, 1987;
Peck & Turvey, 1997).
Figure 1. Lissajous plots from Kelso (1984). Relative spatial location of right and left hands is displayed on ordinate and abscissa, respectively, during a bimanual task. Viewed from left to right, hands first demonstrate an attractor state pattern that becomes more variable over time as a non-attractor state is approached. Reprinted by permission from American Physiological Society via Copyright Clearance Center: American Journal of Physiology, 15, R1000-R1004, copyright (1984).
Additionally in the motor behavior literature, two methods have been identified for
measuring the degree of attraction within a nonlinear dynamic system. In the first method, the
potential attractor landscape must be known within a set of coordination patterns (Schmidt &
Fitzpatrick, 1996; Turvey, 1990). The potential attractor landscape is then dependent upon the
degree of variability within the production of the coordination patterns (Schmidt & Fitzpatrick,
1996; Turvey, 1990). If the field of a potential attractor is large with great variability, then the
26

dynamics of the coordination patterns will have a relatively weak attractor region. In contrast, if
the field of a potential attractor is small with minimal variability, then the dynamics of the
coordination patterns will have a strong attractor region. In the second method, attractor states
can be measured by the relaxation time of the system –that it, the time it takes the system to
return to equilibrium following the influence from a control parameter (Schmidt & Fitzpatrick,
1996; Turvey, 1990).
A second prediction in the dynamic systems theory of motor behavior is that the learning
of movement patterns involves a period of instability among the order parameters as an existing
behavior pattern is escaped and another is approached (Kelso, 1995; Schöner et al., 1992;
Wallace, 1996; Zanone & Kelso, 1992, 1997). The initial behavior patterns are likely to include
conditions of high entropy or attractor states and conditions of low entropy or non-attractor states
(Haken et al., 1985). In studies supporting this prediction, subjects were asked to perform
several cyclic patterns across bimanual fingers or wrists (Schöner et. al., 1992; Zanone & Kelso,
1992, 1997). In a study by Schöner and colleagues (1992), the cyclic patterns included 3 relative
phase patterns; a 0° in-phase pattern (e.g. the fingers move toward and then away from each
other), a 180° anti-phase pattern (e.g. the fingers move in a parallel motion), and a 90° phase
pattern intermediate to the in-phase and anti-phase patterns. During practice, the 90° pattern was
unstable with increased variability and characterized as a non-attractor state, whereas the 0°
pattern and the 180° pattern were identified as attractor states. After practice, however, the 90°
pattern achieved greater stability, whereas the 180° pattern destabilized and the 0° pattern
remained unchanged.
A modification of the attractor states occurred by a strengthening of the dynamics for the
90° pattern while weakening the strength—or “pull” of the 180° pattern (Schöner et al., 1992).
27
Subjects learned how to escape from existing attractor states to approach the novel 90° pattern.
This effect was seen in the destabilization of the 180° pattern, while performance improved on
the novel 90° pattern. Increases in pattern stability are taken to indicate learning of a task,
formulations of new attractor landscapes, and also transfer of learning to novel conditions
(Schöner et. al., 1992; Zanone & Kelso, 1992, 1997).
In conclusion, dynamic systems theory of motor behavior predicts the existence of
attractor states among the components of a complex moving system. These attractor states
correspond to the intrinsic dynamics that a learner brings to a given motor task. Learning of new
movement behaviors occurs on the foundation of already existing patterns. The learning process
is characterized by phase transitions due to a loss of stability in one pattern and a strengthening
of stability in another. The HKB model (1985) of dynamic systems theory has brought the self-
organizing properties of the neuromuscular system to the forefront of motor control and motor
learning.
1.2.2 A Limitation of Dynamic Systems Theory of Motor Behavior addressed by
Expansion of the Original HKB (1985) Model
A limitation of the original HKB (1985) model and dynamic systems theory applied to
motor behavior is the limited consideration of cognitive influences in motor control and
behavior. In recent years, however, researchers have investigated the cognitive influences of
intention, attention, perception, and sensory feedback on bimanual coordination. The most
recent investigations are discussed in the following sections.
The HKB model (1985), in its rudimentary form, did not directly address the role of
cognitive influences in motor control. The obvious challenge is that cognition does play a role in
28
motor performance and learning. The clearest evidence to this effect arises from findings about
the role of intention on motor performance and learning (Amazeen, Amazeen, Treffner &
Turvey, 1997; Carson, Byblow, Abernathy & Summers, 1996; Carson, Goodman, Kelso &
Elliott, 1994; Fontaine et al., 1997; Lee, Blandin & Proteau, 1996; Riley, Amazeen, Amazeen,
Treffner & Turvey, 1997; Scholz & Kelso, 1990; Swinnen, Dounsakaia, Walter & Serrien, 1997,
Swinnen, Jardin & Meulenbrock, 1996; Swinnen, Lee, Verschueren, Serrien & Bogaerts, 1997;
Wuyts, Summers, Carson, Byblow & Semjen, 1996; Zanone & Kelso, 1992, 1997). To adapt the
HKB model (1985) to account for both intentional influences and learning, Schöner and Kelso
(1988a, 1988b) proposed an additional term or degree of freedom to the original HKB equation.
Specifically, they added an attractor force called “behavioral information” to the model.
Behavioral information refers to influences of intention, the environment, and learning. Such
information may influence the order parameters of a complex moving system.
Another group of researchers identified the absence of cognitive influences in the control
of movement as a shortcoming of the original HKB (1985) model (Peper, Beek & Daffertshofer,
2000). To account for cognitive influences on movement output in the original HKB (1985)
model, Peper and colleagues (2000) incorporated a 4-oscillator model with 4 degrees of freedom.
The 4 degrees of freedom included the 2 limbs as 2 degrees of freedom with an additional 2
degrees of freedom to account for cognitive influences. The limbs communicate with cognition
via a feedback function. Adaptations, therefore, have been made to include cognitive influences
in the original HKB (1985) model. The specific role of cognition, however, remains vague in the
model.
29

1.2.3 Limitations of Dynamic Systems Theory of Motor Behavior: Support from
Neurophysiological and Behavioral Research
1.2.3.1 Recent neurophysiological research pointing to a dynamic heterarchy of nervous
system organization and function.
The classical, early 20th century views that sensory input is necessary for motor output
(Sherrington, 1906) and that the nervous system is controlled by a top-down hierarchy (Jackson,
1870s; for review, Walsh, 1961) represent a stark contrast to current views of nervous system
organization and function. By the second half of the 20th century, modern views of nervous
system function fueled a conceptual transition. This transition to modern theories and concepts
was characterized by views around a distributed heterarchy of nervous system function in which
neurons may have differing functions depending upon dynamic changes in the neuronal network
(Davis, 1976), hierarchical and horizontal organization of information-processing (Guillery &
Sherman, 2002; Jones, 2001; Mountcastle, 1979), selective enhancement of neurons through
interactions with the environment (Edelman, 1987), and transient binding of neuronal activity
that underlies human perceptions and behaviors (Crick & Koch, 1990).
Considering current views of nervous system organization and function, both the
relatively top-down model of schema theory (Schmidt, 1975, 1976) and the relatively bottom-up
model of dynamic systems theory (Haken et al., 1985; Jeka & Kelso, 1989; Wallace, 1996) fail
to account for the complexity and sophistication of mammalian behavior. One alternative
approach to motor control and learning based on neurological foundations was described by
Crick and Koch (2003) in their “framework of consciousness” model. It is widely known that
rather than operating according to a strict hierarchical processing structure, neuronal coalitions
are distributed in a heterarchical network with both horizontal and hierarchical projections
formed by past associations and expected consequences of movements (Crick & Koch, 2003).
30

These neuronal coalitions are shaped by both motor and sensory operations. Stated differently,
the neuronal system is not strictly dedicated to a hierarchical organization or a horizontal
organization, but rather both sensory and motor functions play an integral role in a heterarchical
distribution of neuronal coalitions.
An example from visual processes is as follows. The visual sensory cortex is arranged in
a semi-hierarchical fashion with influences from both hierarchical and horizontal neuronal
coalitions (Crick & Koch, 2003). A stimulus travels up the visual cortex without emerging in
consciousness through the dorsal and ventral stream, where it then moves back down through the
visual cortex and is expressed in consciousness (Crick & Koch, 2003). Top-down processing is
suggested behaviorally by evidence of people “seeing” missing portions of incomplete images
such as faces or other objects (Crick & Koch, 2003). There are, however, many horizontal
projections within the visual system suggesting a semi-hierarchical function with influences from
horizontal neuronal connections (Crick & Koch, 2003).
Additional support against a strict bottom-up or top-down processing of the central
nervous system comes from data from the thalamus where motor and sensory functions converge
in the brain. According to Jones (2001), the matrix and core cells within the thalamus have a
variety of cortical projections that provide both columnar activation (i.e., hierarchy) and
horizontal spreading activation. The matrix cells project to the superficial layers of cortex in a
horizontal, spreading activation fashion, whereas the core cells project to the middle layers of
cortex in a topographic fashion (Jones, 2001). According to Guillery and Sherman (2002), past
theories of the thalamus as only a mediator of sensory input to cortex is an oversimplification.
Evidence from rats suggests that axons that originate in motor, somatosensory, and visual cortex
and terminate in the thalamus are branches of long descending axons that go to or through the
31

brainstem. Messages that the thalamus relays to the cortex are also going to brainstem and,
therefore, relate directly or indirectly to motor function. The thalamus-cortex-brainstem
connections represent the dynamic relationship of sensory messages to ongoing motor circuitry.
This dynamic relationship between sensory and motor function points to a distributed
heterarchical network among neuronal coalitions. Neuronal coalitions are linked together by a
synchrony of firing among the summed action potentials. Crick and Koch (1990, 2003)
postulated that the binding of neuronal coalitions occurs by the spread of rhythmicity (i.e., 40 Hz
oscillations) or synchrony within neuronal firing rates. The binding of neuronal coalitions at 40
Hz oscillations assists in the selection and control of information that underlie perceptions and
behaviors. One theory proposes that the neural activity that represents the stimuli or events to be
selected for attentional allocation is selected through modification of its synchrony (Crick &
Koch, 2003). In the neural mechanism of selective attention, information that is selected for
attention is made more prominent by synchrony of neuronal firing rates, whereas information
that is ignored is made less prominent by asynchrony of neuronal firing rates. Action potentials
that arrive synchronously at a neuron summate to evoke larger postsynaptic potentials than do
action potential that arrive asynchronously (Crick & Koch, 2003; Hsiao, O’Shaughnessy &
Johnson, 1993; Niebur, Hsiao & Johnson, 2002). Synchronous action potentials, therefore, have
a greater effect at the next processing stage than do asynchronous action potentials.
Evidence relating synchrony of firing to selective attention comes from
neurophysiological studies of neurons in the somatosensory cortex of macaque monkeys
receiving single- and multi-unit recordings. In one study (Hsiao et al., 1993), two monkeys were
trained to switch their attentional focus between visual and tactile stimuli in discrimination tasks.
In the tactile task, the animals were required to identify embossed letters of the alphabet with
32

constantly changing letter targets. In the visual task, the animals received the same tactile
stimulation while detecting the dimming of a square on a screen. When the monkeys performed
the identification task under tactile conditions, 70% of the neurons were in synchrony.
Conversely, with the addition of the visual task to the tactile task, only 43% of the neurons
remained in synchrony. Coalitions of neurons, therefore, were more synchronous when the
monkeys only had to perform the tactile task. With the addition of the visual task to the tactile
task, synchrony of firing decreased due to competition with other neuronal coalitions for the
perception of the visual stimuli. Changes in attentional focus may increase the synchrony of
firing in some neuronal coalitions and may decrease it in other neuronal coalitions.
In a heterarchy of motor and sensory dynamics, there is no fixed chain of command or
informational flow; instead the flow is flexible and dependent upon the context of an event,
allowing different cortical areas to take priority under different behavioral constraints (Kalaska
& Crammond, 1992). Moreover, representations of various movements can occur concurrently
in a heterarchy thereby illustrating the difficulty of determining functionality among component
parts within the distributed system (Kalaska & Crammond, 1992).
Even though net information flow can exist across the cortical and subcortical areas,
differences in the timing of movement-related activity are routinely observed depending upon
task demands and behavioral circumstances (Kalaska & Crammond, 1992). Such subtle timing
difference within a distributed heterarchy may be relevant for the production of varying types of
skilled movements. It has been hypothesized that 40 Hz oscillations are evident among neuronal
networks during conscious sensorimotor transformations and other cognitive processes (Crick &
Koch, 1990, 2003). Neurons in a distributed network are transiently coupled by synchronous
discharge that binds the population together relative to the sensorimotor task at hand (Crick &
33

Koch, 1990, 2003). The 40 Hz oscillations within local sensory networks and global networks
across motor, sensory, and association areas have been correlated with perceptual and behavioral
performance (Crick & Koch, 1990, 2003). Without timing of neuronal discharge relevant to
movement constraints and behavioral circumstances, the distributed heterarchy of the
sensorimotor system would fail to perform as an optimal controller and processor (Crick &
Koch, 1990, 2003).
In summary, neuronal coalitions distributed in a heterarchical fashion with both vertical
and horizontal projections point to a dynamic relationship between sensory and motor function in
the human nervous system. The historical notion of a clear division between sensory and motor
function in a purely hierarchical fashion cannot explain current neurophysiological evidence.
Clear examples relate to the thalamus, which is not just a sensory mediator to cortex, but a
dynamic sensory and motor mediator to cortex and ongoing motor activity (Jones, 2001; Guillery
& Sherman, 2002). Additionally, the core and matrix cells of the thalamus bind together in a
vertical and horizontal fashion across the cortex, suggesting a distributed function of motor and
sensory dynamics (Jones, 2001). The binding of neuronal coalitions at 40 Hz oscillations
enables synchrony of firing among action potentials which correlates with selective attention and
also a distributed, heterarchical network of motor and sensory system dynamics (Crick & Koch,
1990, 2003; Hsiao et al., 1993; Niebur et al., 2002).
1.2.3.2 Recent evidence for the role of attention in bimanual coordination.
The foregoing studies demonstrate that although dynamic systems theory of motor
behavior has traditionally focused on biomechanical synergistic influences in movement,
increased interest has been seen in recent years on cognition and its impact on dynamic moving
systems. Particular attention has been given to the role of attention for bimanual coordination
34

performance and learning (Carson, 1996; Fuchs & Kelso, 1994; Jirsa, Fuchs & Kelso, 1998;
Kelso, 1997; Monno, Chardenon, Temprado, Zanone & Laurent, 2000; Schöner & Kelso, 1988a,
1988b; see also Schmidt, 2003; Temprado, Zanone, Monno & Kelso, 2002; Temprado, Zanone,
Monno & Laurent, 1999; Zanone, Monno, Temprado & Laurent, 2001; Zanone, Temprado &
Monno, 1999).
In a series of studies, Temprado and colleagues investigated the attention or cognitive
effort involved in the in-phase pattern or attractor state versus the anti-phase pattern or near-
attractor state for bilateral limb movements (Monno et al., 2000; Temprado et al., 2002;
Temprado et al., 1999; Zanone et al., 2001; Zanone et al., 1999). Across the studies, attention
was measured using a dual-task paradigm, in which subjects were instructed to attend to either
the bimanual coordination task or a simultaneous secondary task, or both. Reaction time results
from an initial study showed that the anti-phase or near-attractor state was dependent on
cognitive effort, whereas little cognitive effort was seen for the in-phase or attractor state
(Temprado et al., 1999). Similar findings were reported for two studies showing that cognitive
resource allocation for attention was directly related to the degree of stability of a relative phase
pattern in a bimanual task (Zanone et al., 2001, 1999). For example, the highly stable in-phase
pattern or attractor state consumed less cognitive resources than the somewhat stable anti-phase
pattern or near-attractor state (Zanone et al., 2001, 1999). According to another study, when
cognitive resources for attention were allocated to a bimanual task, transitions from one pattern
to another were delayed (Monno et al., 2000). Finally, in another study, attentional resources
associated with an anti-phase pattern or near-attractor state decreased following bimanual
training (Temprado et al., 2002).
35

The general point made from these studies on attention and bimanual coordination is that
the allocation of attentional resources to motor performance depends upon the inherent stability
of the task; unstable tasks require resources, whereas stable tasks appear to require little if any
resources. The studies are important because they are among the first to address and specifically
pursue specific cognitive mechanisms within a dynamic systems framework of motor
performance and learning.
1.2.3.3 Recent evidence for the role of perception in bimanual coordination.
Another group of researchers challenged the lack of cognitive influences in the original
HKB (1985) model by investigating the role of perception in the organization of voluntary
movement (Mechsner, Kerzel, Knoblich & Prinz, 2001). Based on results from a series of three
experiments, Mechsner and colleagues (2001) suggested that the more stable 0° in-phase pattern
during bimanual finger oscillations, bimanual four-finger tapping, and bimanual circling patterns
is related to perceptual rather than motoric movement goals. That is, the bias towards the 0° in-
phase pattern is actually oriented towards spatial, perceptual goals without regard to the muscles
involved. The perceptual goals are shaped by visual and proprioceptive feedback. This switch
in emphasis to perceptual movement goals stands in direct contrast to the traditional view that
the tendency towards the 0° in-phase pattern is due to a bias in co-activation of homologous
muscles (Kelso, 1984; Johnson, Cunnington, Bradshaw, Phillips, Iansek & Rogers, 1998).
In the first experiment involving bimanual finger oscillation, the 0° in-phase pattern and
the 180° anti-phase pattern were produced with congruous and incongruous hand positions
(Mechsner et al., 2001; see Figure 2). In the congruous hand position, the perceptual goal of the
0° in-phase pattern (i.e., fingers moving toward and away from each other) was paired with the
motoric goal of co-activation of homologous muscles. In the incongruous hand position, the
36

perceptual goal of the 180° anti-phase pattern (i.e., fingers moving in parallel) was paired with
the same motoric goal of co-activation of homologous muscles. If evidence was found to
support the perceptual view of movement, then the perceived 0° in-phase action should always
be more stable regardless of hand position. Conversely, if evidence was found to support the
motoric view of movement, then the hand position with the co-activation of homologous muscles
would be more stable regardless of the perceived relative phase pattern.
Figure 2. Hand positions and relative phase patterns. a, 0º in-phase pattern. b, 180º anti-phase pattern. c, d, Congruous positions with both palms up or both palms down. e, f, Incongruous positions with one palm up and the other palm down (Mechsner et al., 2001). Reprinted by permission from Macmillan Publishers Ltd: Nature, 414(1), 69-73, copyright (2001).
Eight, healthy subjects were asked to perform the movements with increasing frequency
of oscillation from 1.4 Hz up to 3.6 Hz with visual feedback of the hands and without visual
feedback of the hands. Results indicated that the perceived 0° in-phase pattern was always more
stable regardless of the hand position, whereas the perceived 180° anti-phase pattern tended to
disintegrate and performance switched to the 0° in-phase pattern at higher frequencies of
oscillation. Evidence, therefore, was found to support the view that bimanual movements are
37

least partly guided by perceptual goals rather than motoric goals involving the co-activation of
homologous muscles. The pattern of results did not change when visual feedback of the hands
was blocked.
In the second experiment with bimanual finger tapping, 10 healthy subjects were asked to
perform 0° in-phase patterns and 180° anti-phase patterns with the index and middle fingers of
both hands (Mechsner et al., 2001). The finger tapping was congruous when the finger
combinations were identical for both hands and incongruous when the finger combinations were
not identical for both hands. In the congruous finger tapping, the co-activation of the
homologous muscles occurred for the 0° in-phase pattern, whereas, in the incongruous finger
tapping, the co-activation of the homologous muscles occurred for the 180° anti-phase pattern.
Subjects produced the patterns at increasing frequency of oscillations from 1 Hz up to 3 Hz with
and without visual feedback of the hands. The results for the second experiment matched the
results of the bimanual finger oscillation experiment. The 0° in-phase pattern was always the
most stable regardless of the co-activation of homologous muscles, whereas the performance of
the 180° anti-phase pattern switched to the more stable pattern at higher frequencies of
oscillation. The authors, therefore, concluded that the more stable 0° in-phase pattern in
bimanual finger tapping was not related to the motoric goal of co-activation of homologous
muscles, but rather to perceptual goals.
In a third experiment, subjects were asked to perform bimanual circling patterns with two
visible flags that were moved by two cranks hidden under a table (Mechsner et al, 2001; see
Figure 3). The left flag circled directly above the left crank and hand, while the right flag circled
in a 4:3 frequency ratio to the right crank and hand. The rationale for the frequency
transformation in the right flag and right hand was that the 0° in-phase pattern and the 180° anti-
38
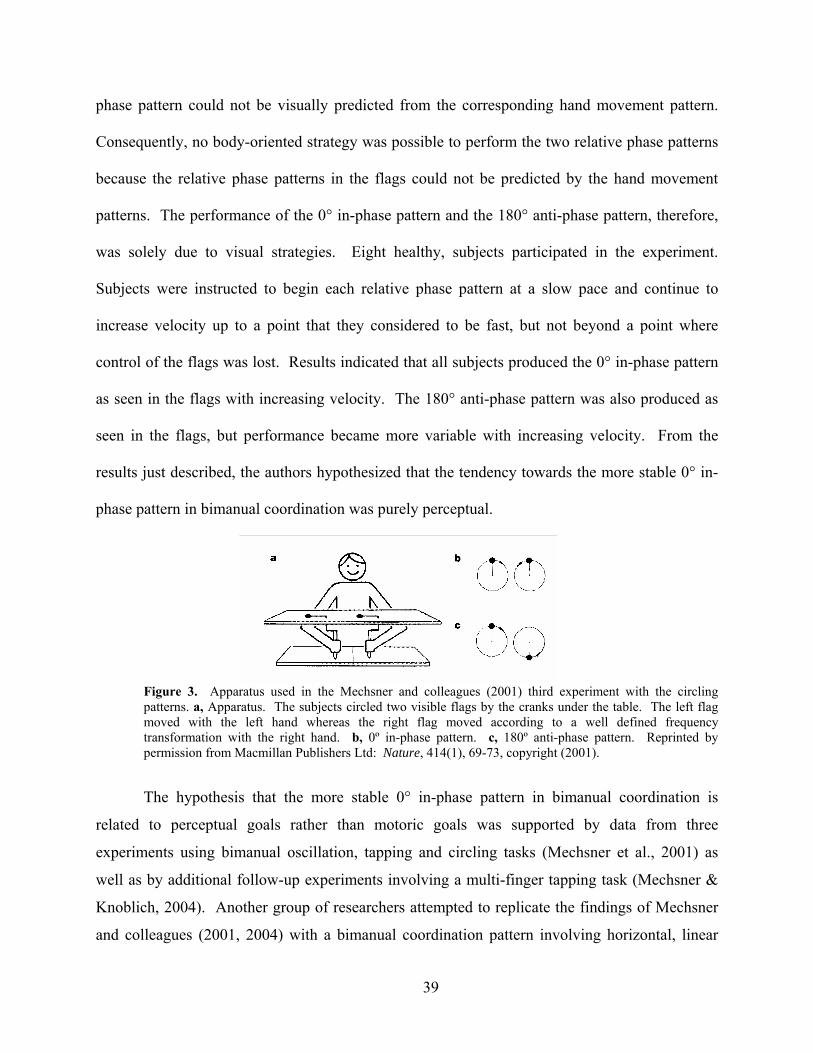
phase pattern could not be visually predicted from the corresponding hand movement pattern.
Consequently, no body-oriented strategy was possible to perform the two relative phase patterns
because the relative phase patterns in the flags could not be predicted by the hand movement
patterns. The performance of the 0° in-phase pattern and the 180° anti-phase pattern, therefore,
was solely due to visual strategies. Eight healthy, subjects participated in the experiment.
Subjects were instructed to begin each relative phase pattern at a slow pace and continue to
increase velocity up to a point that they considered to be fast, but not beyond a point where
control of the flags was lost. Results indicated that all subjects produced the 0° in-phase pattern
as seen in the flags with increasing velocity. The 180° anti-phase pattern was also produced as
seen in the flags, but performance became more variable with increasing velocity. From the
results just described, the authors hypothesized that the tendency towards the more stable 0° in-
phase pattern in bimanual coordination was purely perceptual.
Figure 3. Apparatus used in the Mechsner and colleagues (2001) third experiment with the circling patterns. a, Apparatus. The subjects circled two visible flags by the cranks under the table. The left flag moved with the left hand whereas the right flag moved according to a well defined frequency transformation with the right hand. b, 0º in-phase pattern. c, 180º anti-phase pattern. Reprinted by permission from Macmillan Publishers Ltd: Nature, 414(1), 69-73, copyright (2001).
The hypothesis that the more stable 0° in-phase pattern in bimanual coordination is
related to perceptual goals rather than motoric goals was supported by data from three
experiments using bimanual oscillation, tapping and circling tasks (Mechsner et al., 2001) as
well as by additional follow-up experiments involving a multi-finger tapping task (Mechsner &
Knoblich, 2004). Another group of researchers attempted to replicate the findings of Mechsner
and colleagues (2001, 2004) with a bimanual coordination pattern involving horizontal, linear
39

movements at frequencies of 1.5 Hz and 2.0 Hz (Salter, Wishart, Lee & Simon, 2004). A
congruent and an incongruent condition were used. In the congruent condition, the movement of
the flags matched the movement of the arms. In the incongruent condition, the movement of the
flags was opposite to the movement of the arms. Regardless of the condition, the subjects
always performed the 0° in-phase with more stability than the 180° anti-phase pattern.
Salter and colleagues (2004) suggested that the stability of the 0° in-phase pattern across
the congruent and the incongruent conditions provided support for a motor view of bimanual
coordination rather than a perceptual view. The authors, however, suggested that task specificity
provides some support for the perceptual view of motor coordination (Salter et al., 2004). For
example, the bimanual circling patterns in the Mechsner and colleagues (2001) study were more
dependent on visual feedback, whereas the linear bimanual patterns in the Salter and colleagues
(2004) study were more dependent on proprioceptive feedback. This task-related difference
between the availability of visual and proprioceptive feedback suggests that the perceptual and
motor determination of coordination may be task specific. Future research is warranted to
investigate the role of sensory feedback in the performance of coordination patterns as a function
of task demands.
1.2.3.4 Recent evidence for the role of visual feedback in bimanual coordination.
It is generally acknowledged that one requires proprioceptive and visual information to
fine tune motor patterns. Proprioceptive information from the periphery allows the central
nervous system to monitor the moving limbs and to adjust the movement pattern if necessary.
There is evidence that the coordination of ongoing movements uses proprioception in healthy
subjects (see Cordo, Bevan, Gurfinkel, Carlton, Carlton & Kerr, 1995), while deafferentiated
patients exhibit clear coordination deficits (Bonnard & Pailhous, 1999; Ghez & Sainburg, 1995;
Jackson, Jackson, Husain, Harvey, Kramer & Dow, 2000; Jackson, Jackson, Newport & Harvey,
40

2002; Sainburg, Poizner & Ghez, 1993). Proprioception, however, cannot fully account for all
motor coordination phenomena. Coordination deficits in deafferentiated patients become
apparent only if vision is absent (Bonnard & Pailhous, 1999; Ghez & Sainburg, 1995; Jackson et
al., 2002; Sainburg et al., 1993). The literature clearly suggests that visual feedback also plays a
substantial role in motor coordination.
Positive evidence for the assumption that visual feedback does play a role in motor
coordination comes from cyclical bimanual movements and discrete bimanual movements.
Serrien and Teasdale (1996) asked young (i.e., age range 20-30 years) and older (i.e., age range
66-77 years) subjects to perform two cyclical bimanual coordination movements in the 0° in-
phase and the 180° anti-phase mode with and without vision of the arms at a frequency of 1 Hz.
Each trial lasted 15 seconds and 3 trials were conducted per condition. Results indicated that
absence or presence of the visual feedback influenced the performance of the young subjects
more than the older subjects (Serrien & Teasdale, 1996). That is, the stability of the young
subjects’ 0° in-phase pattern deteriorated when vision of the limbs was not available, whereas the
young subjects’ 180° anti-phase pattern became more stabile when visual information was absent
(Serrien & Teasdale, 1996). It is interesting that the 0° pattern, the more stable of the two
patterns, had greater stability with visual feedback, whereas the 180° pattern had greater stability
without visual feedback. Since the 180° pattern is less stable than the 0° pattern, one would
expect that increased sensory information would help to stabilize the pattern, but in fact the 180º
pattern was destabilized. Regardless of the findings, the results suggest a role for sensory
feedback in the control of the intrinsic dynamic for in-phase and anti-phase bimanual
coordination patterns produced at a frequency of 1Hz.
41

Swinnen and colleagues (2000) investigated motor learning across practice in healthy
adults and adults diagnosed with Parkinson’s disease. Subjects were asked to trace triangles with
both upper limbs at the same time across 22 practice trials lasting 20 seconds for each trail. An
auditory metronome provided the pacing for completion of each side of the triangle at 500 ms.
Vision was allowed at the start of practice; however, at the middle (i.e., after 10 trials) and at the
end of practice (i.e., after 18 trials) two trials were completed in a blindfolded condition
(Swinnen, Steyvers, Van Den Bergh & Stelmach, 2000). Feedback about movement speed and
triangle accuracy was provided following every fifth trial. At initiation of practice, the typical
signs associated with Parkinson’s disease became evident, such as slower then normal movement
productions. Moreover, reduced synchronization between the force-time specifications of both
limbs was observed. When vision of the arms was withdrawn, subjects with Parkinson’s disease
showed a larger drift of tracing performance across the workspace. In spite of the difficulties
just mentioned, the performance of subjects with Parkinson’s disease did improve with the
speed, consistency, and synchronization of movements as practiced continued. The subjects with
Parkinson’s disease, however, never reached the performance levels obtained in the age-matched
control subjects.
In a study by Kazennikov and colleagues (2002), 16 healthy adult subjects performed a
drawer-pull task with one hand opening the drawer while the other hand picked up a small peg in
the drawer. All 16 subjects performed the task with visual feedback and without visual feedback
in a blindfolded condition. In 12 of the 16 subjects, the task was performed easily after a few
trials in the blindfolded condition; however, the task was slowed in comparison to the visual
feedback condition (Kazennikov, Perrig & Wiesendanger, 2002). In 3 of the 12 subjects, the
visual condition was performed with simultaneous movement of both the pull-hand for opening
42

the drawer and the pick-hand for picking up the peg, whereas without vision the subjects delayed
moving the pick-hand until the pull-hand grasped the drawer (Kazennikov et al., 2002). For 3 of
the subjects, changing the sensory feedback constraints of a dynamic, moving system by
withdrawing vision of the limbs changed the coordination pattern.
Cardoso de Oliveira and Barthelemy (2005) investigated the extent to which visual
feedback shapes the coordination between the upper limbs in a discrete bimanual movement
which involved hitting a small target with both index fingers in fast goal-directed movements.
Subjects participated in a control condition that allowed visual feedback of both limbs and 3
subsequent experimental conditions that involved visual feedback of one of the limbs and a no
visual feedback condition. Absence of visual feedback for one or both arms significantly
increased reaction times for both arms and movement amplitudes for the occluded arm. When
no feedback for either arm was available, trial-by-trial amplitude standard deviations were
significantly higher than when feedback for one or both arms was present. From the results, the
authors concluded that online visual feedback is used to shape the coordination between the two
arms.
In conclusion, the preceding review provides evidence for the role of visual feedback in
the control of bimanual coordination patterns. For example, the more stable 0° relative phase
pattern had greater stability in the visual feedback condition, whereas the 180° relative phase
pattern had greater stability without visual feedback (Serrien & Teasdale, 1996). Without vision
of the arms, subjects with Parkinson’s disease showed a drift in tracing performance as compared
to healthy age-matched control subjects (Swinnen et al., 2000). In a drawer-pull task, a no vision
condition resulted in a slower movement production with some subjects completely changing the
coordination pattern to adapt to the lack of sensory information (Kazennikov et al., 2002).
43

Absence of visual feedback significantly reduced the reaction time of the upper limbs as well as
the bimanual coupling of movement amplitudes (Cardoso de Oliveira & Barthelemy, 2005).
Although the noted studies do suggest a role for visual feedback in bimanual coordination, the
contribution of such feedback to the coordination dynamics of a bimanual limb task and a voice
task has not been fully evaluated. Experiment 1 of the proposed series will investigate the role of
visual and auditory feedback in the coordination dynamics for the bimanual coordination patterns
of 0° and 180° at increasing frequency of oscillations. Experiment 2 of the proposed series will
extend the investigation beyond the limb system to the voice production system to assess the
generality of findings.
1.2.3.5 Limitations in methodology question preliminary evidence for attractor states in
voice production.
To subscribe to a theoretical model of movement behavior, that theoretical model must
have predictive abilities across a wide variety of movement behaviors. With the dynamic
systems theory of motor behavior as a framework, Steinhauer (2001) hypothesized that attractor
states exist in voice production, but due to limitations in methodology, the results of such
experimentation must be analyzed with caution. The study presented below highlights the need
for further investigation into the identification of attractor states outside the limb system.
Preliminary evidence for attractor states (i.e., inherently stable patterns) in voice
production was provided in Steinhauer (2001). In her study, subjects with no singing
background were asked to manipulate voice onset, voice quality, and fundamental frequency
(Fo) while sustaining the vowel /i/. Subjects produced the 3 voice qualities of modal speech,
mixed register, and falsetto across 3 voice onset conditions and 3 Fo conditions. The voice onset
conditions were glottal, simultaneous, and breathy. The 3 Fo conditions were low, mid, and high
44

frequencies. From these manipulations, evidence was expected to emerge for the existence of
three attractor states: (1) glottal onset/speech quality/low Fo, (2) simultaneous onset/mixed
quality/mid Fo, and (3) breathy onset/falsetto quality/high Fo. Trial stability was measured by
percent correct productions across 72 acquisition trials, based on perceptual estimates from
blinded listeners, and self-report of error for the trials. After adjusting for intensity, results
confirmed that the first and third predicted patterns were consistent with attractor states (i.e., (1)
glottal onset/speech quality/low Fo and (3) breathy onset/falsetto quality/high Fo) based on 94%
correct production for triad (1) and 90% correct production for triad (3) (Steinhauer, 2001). The
second predicted pattern (i.e., (2) simultaneous onset/mixed quality/mid Fo) was correctly
produced 75% of the time and was thus not identified as an attractor state (Steinhauer, 2001).
Steinhauer’s findings (2001) were the first to shed light on possible vocal attractor states
in healthy adults with dynamic systems theory of motor behavior as the theoretical foundation.
The identification of possible attractor states for voice, therefore, contributed an important
addition to the literature, which has primarily focused on limb behavior in the dynamic systems
theory approach to motor behavior. Some limitations, however, in the methodology of
Steinhauer’s (2001) methodology raise some questions. Subjects had access to auditory
feedback of their voice productions during the experiment. In addition, the experimenter also
demonstrated the target voice production before each trial. The presence of auditory feedback
with vocal modeling by the experimenter arguably provided support for learning, enabling
subjects’ cognitive resources to interact with the tissue and muscle coordinative dynamics of the
voice production system. According to Kelso (1995) and Wallace (1996), stable motor patterns
have been identified without the involvement of sensory feedback and modeling of correct
45

productions. In other words, the subject does not need the subordinate function of sensory
feedback to produce a synergistic attractor state if it exists within that coordinative system.
From Steinhauer’s results (2001), it is difficult to determine if the identified “attractor
states” were influenced by the external variables of modeling and sensory feedback. Posed in
terms of a question, were stable patterns truly intrinsically stable, or did external factors
influence their emergence? Steinhauer’s rationale for providing the correct vocal model was that
it should limit “subject fatigue” during attempts to approach target voice patterns (Steinhauer,
2001). If the subject was fatigued and searching for a target, then perhaps the pattern was not an
intrinsic attractor state, but was something different than that.
A second limitation in the study by Steinhauer (2001) was that the dependent variable,
percent correct of acquisition trials, was determined perceptually by the experimenter during
subject testing and two independent raters after data collection. Interjudge and intrajudge
evaluation of the examiner’s rating of correct production during data collection was performed
on 20% of the total stimuli (507 tokens) by the examiner and two independent raters. The
intraclass correlation coefficienct (ICC) comparing interjudge reliability for the independent
raters during the listening session and the examiner during subject testing was .83. The ICC
comparing intrajudge reliability of the examiner during data collection and the examiner during
the listening session was .89. The interjudge and intrajudge agreement between the examiner
and the two independent raters was highly correlated; however, the interjudge and intrajudge
evaluation was performed on only 20% of the total stimuli. Would the agreement between the
examiner and the two independent raters be highly correlated with 100% of the total stimuli used
for interjudge and intrajudge evaluations? Although the agreement between the experimenter
and the 2 independent raters was relatively well correlated, the dependent variable was
46

perceptually determined. Thus, Steinhauer’s results may have been confounded by the use of
inherently unstable perceptual measures, and also by the potential influence of 100% knowledge
of results (KR) with modeling of target behaviors in the experiment.
In summary, to assess the presence of attractor states in voice production with dynamic
systems theory of motor behavior and the HKB (1985) model as a theoretical foundation, three
requirements must be met that have not yet been satisfied in the literature: (1) emphasis must be
placed on identifying component parts of the dynamic vocalization system that may couple or act
synergistically to produce voice, (2) the coordination dynamics of a voice task must be evaluated
with and without auditory feedback and (3) stable dependent variables must be identified that
reflect synergistic interactions across two coordinated movement subsystems. A broader point
for the present discussion is the possible generality of the HKB (1985) model of motor behavior
to movement systems outside the limbs using voice production as the case in point.
In conclusion, two limitations of the dynamic systems theory of motor behavior are
relevant to the present investigation: (1) limited consideration of the role of sensory feedback in
classic dynamic systems models, and (2) limitations in the methodology for identifying attractor
states for voice production in previous work. Accordingly, to bring the dynamic systems
approach closer to the training arena in both physical and voice therapy, future investigations
should focus on (1) exploring the role of visual feedback and auditory feedback in the
coordination dynamics of a limb and voice task, and (2) identifying attractor states in voice
production with sound methodology that does not depend on unstable perceptual judgments. The
relevance of this work for theory has to do with expanded understanding of interactions between
the synergistic moving system and sensory feedback in motor control with the goal of gaining
increased descriptions of human motor behavior outside the limb system. The relevance of this
47

work for a specific practice arena has to do with the sensory feedback component of the
candidate’s developing Global Voice Therapy Program, which includes auditory and kinesthetic
recognition of “old” voice behaviors versus “new” voice behaviors in vocal rehabilitation.
1.3 GAPS IN THE LITERATURE ADDRESSED IN THE PRESENT STUDIES
As previously noted at the outset of this chapter, schema theory is an approach to motor
control and learning that emphasizes top-down command functions in control and learning.
Although a role of sensory feedback is suggested in schema theory, a central feature in schema
theory has to with a hypothetical, generalized motor program that regulates movement. Recent
views of nervous systems organization and function (Crick & Koch, 1990, 2003; Guillery &
Sherman, 2002; Hsiao et al., 1993; Jones, 2001; Niebur et al., 2002) suggest the need for a view
of motor control and learning that incorporates a dynamic heterarchy of operations. From a
neurophysiological perspective, dynamic systems theory’s strength can be seen in its emphasis
on emergent system interactions. Although recent adaptations of dynamic systems theory and
the HKB (1985) model consider external sensory influences in motor control and learning, they
are underemphasized and heterarchical influences are underrepresented (Schöner & Kelso,
1988a, 1988b; Peper et al., 2000).
Specifically, in dynamic systems theory, intrinsic dynamics or the stability properties of a
potential attractor landscape are inherent to the system with no need for external variables to
influence the patterns of behavior that emerge (Kelso, 1995; Wallace, 1996). Such external
variables may include the influences of attention, perception, and visual and auditory feedback.
In fact, recent evidence suggests that the stability of a 0° in-phase pattern in bimanual
48

coordination may be more related to perceptual factors rather than motoric movement goals
(Mechsner et al., 2001, 2004). In addition, recent evidence also exists for the role of attention
(Monno et al., 2000; Temprado et al., 2002; Temprado et al., 1999; Zanone et al., 2001; Zanone
et al., 1999) and feedback (Cardoso de Oliveira & Barthelemy, 2005; Kazennikov et al., 2002;
Serrien & Teasdale, 1996; Swinnen et al., 2000) on the coordination dynamics of bimanual tasks.
To address this gap, further research meeting the requirements of the original HKB (1985) model
is warranted to investigate the nature and existence of coordination dynamics for a limb and a
voice task with and without sensory feedback.
More broadly, greater advances are needed in the understanding of how sensory feedback
and motor mechanisms interact in adaptive, biological systems. Such advances are important for
theoretical reasons, as outlined, and they are also important for more pragmatic reasons related to
the development of physical training and rehabilitation programs that emphasize a heterarchical
perspective. Specifically, (1) information is needed about the effects of sensory feedback on the
coordination dynamics and stability properties of a dynamic, moving system; and (2) information
is needed about the generalization of findings across limb and other motor tasks. The present
studies addressed these gaps by assessing the effect of sensory feedback on coordination
dynamics for performance of an upper limb and a voice task.
1.4 FURTHER EXTENSION OF DYNAMIC SYSTEMS THEORY PERSPECTIVE
TO THE CASE OF VOICE PRODUCTION
To extend the investigation of coordination dynamics beyond the typical limb task to a
voice task, an order parameter (i.e., the index along which coordinative patterns emerge) of the
49

dynamic voice production system was identified. The respiratory and laryngeal subsystems must
coordinate to maintain a constant subglottic pressure, a constant airflow, and a relatively constant
upper airway constriction for production of a steady state utterance, sustained vowel, and
repetition of a single syllable (Hixon, 1973). These physiological requirements for production of
steady-state utterances, sustained vowels, and repetitions of single syllables are accomplished by
interactions among hard tissues, soft tissues, and aerodynamic factors across the respiratory and
laryngeal subsystems. A combined measurement variable that captures relations among
respiratory and laryngeal functions, therefore, would reflect one aspect of the coordinative nature
of voice production. Laryngeal resistance (i.e., subglottic pressure divided by average airflow,
Smithern & Hixon, 1981) representing the respiratory and laryngeal subsystems by subglottic
pressure (cmH2O) and average airflow (l/s), respectively, is such a measure that could be
classified as an order parameter of the dynamic voice production system.
According to Bernstein’s (1967) degrees of freedom hypothesis, independent moving
systems synergistically couple for the production of functional gestures. Within this framework
for a bimanual coordination task, relative phase has 2 degrees of freedom; one for the right limb
and the other for the left limb. Relative phase reflects the synergistic coupling of the 2 upper
limbs. Similarly for a voice coordination task, laryngeal resistance has two degrees of freedom;
one for the respiratory subsystem (i.e., subglottic pressure) and the other for the laryngeal
subsystem (i.e., average airflow). The respiratory and laryngeal subsystems function
independently from one another for basic life functions, such as, breathing and swallowing;
however, the two subsystems couple to act synergistically in speech and voice production. In the
following section, the component measurement variables of laryngeal resistance will be
50

discussed relative to their ability to reflect changes in the respiratory and laryngeal subsystems of
voice production.
1.4.1 Subglottic Pressure
To better understand subglottal pressure as a reflection of muscular force changes within
the respiratory system during voice production, a brief explanation of the mechanical events for
quiet breathing is relevant. At initiation of inhalation, the dimensions of the chest wall are
increased by thoracic muscle contraction and possibly lowering of the diaphragm. The lungs are
attached to the chest wall by pleural linkage (Kent, 1997; Zemlin, 1998). As the dimensions of
the chest wall are increased, the lungs are also expanded. This increase in lung volume creates a
negative pressure relative to atmospheric, causing air to flow from the atmosphere into the lungs
until atmospheric and alveolar pressure with the lungs are equalized (Kent, 1997; Zemlin, 1998).
At this point, the muscles of inhalation cease to contract, and the thorax-lung complex rebounds
slightly to create a positive pressure within the lungs, relative to atmospheric (Kent, 1997;
Zemlin, 1998). Once positive pressure is achieved within the lungs, the air is then exhaled. In
quiet, resting breathy, the expiratory phase occurs by passive forces alone rather than by any
active, muscular forces. Simply stated, quiet breathing requires muscle contraction for the
inspiratory phase, whereas the expiratory phase may be passive or nonmuscular (Kent, 1997;
Zemlin, 1998). Pressures that are generated by passive or nonmuscular forces of respiration are
called relaxation pressures (Hixon, 1973).
With the discussion of quiet breathing, it is assumed that the vocal tract is neutral and the
vocal folds are abducted creating no additional resistance to airflow. During voice production of
a steady state utterance, however, the vocal folds and the vocal tract introduce a resistance to the
51

flow of air. The respiratory system handles this additional resistance to the flow of air by
regulating muscular and nonmuscular forces to achieve the desired subglottal pressure (Kent,
1997; Hixon, 1973). Subglottal pressure (i.e., cmH2O) is the measurement of pressure within
the lungs at any given lung volume (Kent, 1997; Zemlin, 1998). During the production of steady
state utterances, constant pressures are achieved by a combination of active muscular and passive
recoil forces. Somewhat paradoxically, muscular actions during speech exhalation may be
expiratory, inspiratory, or both, depending on the task. For example, a steady state utterance of
normal loudness (e.g., 7 cmH2O), produced at high lung volumes between 100-70% Vital
Capacity, will activate inspiratory muscle force at the outset of the utterance to oppose the
excessive positive relaxation pressures for exhalation (Hixon, 1973; Kent, 1997). This
inspiratory muscle effort in such circumstances is referred to as “checking action” against the
spring-like background force of excessive relaxation pressures (Hixon, 1973; Kent, 1997). In
contrast to high lung volumes, intermediate lung volumes of 60-35% Vital Capacity necessary
for conversational speech at a normal loudness will activate expiratory and inspiratory muscular
force to meet the demands of the utterance at 7 cmH2O (Hixon & Weismer, 1995).
The amount of inspiratory and expiratory muscle effort will vary depending upon the
subglottal pressure demands for a particular utterance at a given lung volume. For example, a
loud utterance produced at 55% Vital Capacity with a high subglottal pressure of 20 cmH2O will
have increased expiratory and inspiratory muscular activity to counteract relaxation pressure
(Hixon & Weismer, 1995). In contrast, a quiet utterance produced at 55% Vital Capacity with a
lower subglottal pressure of 5 cmH2O will require less activation of expiratory and inspiratory
muscular force to counteract relaxation pressure (Hixon & Weismer, 1995). The respiratory
pump, therefore, achieves the demands of voice production by supplying the required inspiratory
52

and expiratory muscular force to achieve the desired subglottal pressure (Hixon, 1973; Hixon &
Weismer, 1995; Kent, 1997). The important implication is that each subglottal pressure
produced in voice production demands a different inspiratory and expiratory muscular force at
any given lung volume.
1.4.2 Average Airflow
The other measurement variable of interest in the present context is average airflow
through the glottis (i.e., liters/second). During voice production, airflow from the lungs is
modulated at the larynx and specifically, by the vocal folds. The contraction of the posterior
cricoarytenoid (PCA) muscle abducts the vocal folds, lowering resistance to the flow of air,
whereas contraction of the thyroarytenoid (TA) and other vocal fold adductors narrows the
glottic opening and raises the resistance to the flow (Stevens, 1981). Resistance to the flow of
air changes by modulating glottal closure; therefore, the average airflow through the vocal folds
will vary.
For phonation, the vocal folds are adducted and at a certain point, when subglottic
pressure exceeds the pressure of closure, a combination of aerodynamic and myoelastic factors
cause the vocal fold mucosa to vibrate passively. The mucosa opens and closes in rapid
succession (e.g., about 100 times per second in typical adult male phonation and about twice that
rate in typical adult female phonation). An average amount of airflow through the glottis can be
calculated, that reflects the amount of persistent glottal gap across the cycle (Alku & Vilkman,
1996; Stevens, 1981). Thus, average glottal airflow typically varies across different glottal
configurations such as those involving (1) spread arytenoid cartilages or relative vocal fold
abduction, (2) intermediate cartilage positioning, and (3) constricted glottis or “pressed” vocal
53

folds (Alku & Vilkman, 1996; Stevens, 1981). Those three glottal configurations essentially
define “boundary” configurations and tend to correspond perceptually to (1) breathy voice, (2)
normal voice, and (3) pressed voice, respectively (Alku & Vilkman, 1996; Stevens, 1981).
Breathy voice is produced with the vocal folds partially abducted, usually in the region of the
arytenoid cartilages (Alku & Vilkman, 1996; Stevens, 1981). Decreased laryngeal resistance due
to the separated arytenoid cartilages or relative vocal fold abduction in breathy voice allows for
increased average airflow. In contrast, pressed voice is produced by forcing the vocal folds
together, so that during a cycle of vibration the glottis opens only along a portion of the vocal
fold length (Alku & Vilkman, 1996; Stevens, 1981). Increased laryngeal resistance due to the
constricted glottal configuration allows for decreased average airflow.
In summary, the laryngeal system functions as a variable resistor to the flow of air from
the respiratory system. The degree of resistance produced by the vocal folds to the flow of air is
regulated by adduction and abduction force changes in the muscles and tissues of the larynx.
Measurement of average airflow, therefore, is an indirect measure of the degree of resistance and
specifically, the muscle and tissue force changes of the vocal folds during different glottal
configurations. Subglottal pressure and average airflow have been demonstrated to estimate
tissue and muscular force changes across the respiratory and laryngeal systems, respectively.
Laryngeal resistance (i.e., subglottic pressure divided by average airflow, Smitheran & Hixon,
1981), therefore, is an order parameter (i.e., the index along which coordinative patterns emerge)
of the dynamic voice production system that reflects the coordination among the respiratory and
laryngeal subsystems with two degrees of freedom. Within a given individual during a given
measurement session, a steady-state phonation with unchanging fundamental frequency,
intensity, and vowel quality should reflect constant force relations across the sum of passive and
54
active respiratory forces, and the sum of passive and active laryngeal forces contributing to
adduction (Smitheran & Hixon, 1981). The next sections provide information about data relative
to laryngeal resistance in phonation.
1.4.3 Normative Studies Involving Laryngeal Resistance
The basic paradigm for the collection of laryngeal resistance was established by
Smitheran and Hixon (1981). Prerequisite to the calculation of laryngeal resistance is a
methodology for non-invasively estimating both subglottic pressures and glottal flows during
phonation. A landmark study was published in that regard by Smitheran and Hixon (1981). A
key issue in their work was the ability to estimate phonatory subglottic pressures non-invasively
from oral pressures during strings of repeated /pi/ utterances. Estimates of subglottal pressure
were taken from the peaks of intraoral pressure recorded during the voiceless portion of the
bilabial consonant /p/. During the /p/ sound, the lips and the velopharynx are closed while the
vocal folds are apart. Assuming sufficient time during the occlusion phase, the pressures
throughout the vocal tract, larynx, and subglottis should equalize. Thus, pressures obtained from
the oral cavity during /p/ occlusion should reflect pressures in the subglottis. The pressures
throughout the vocal tract, larynx and subglottis, therefore, are uniform.
Fifteen adult males produced the utterance /pi/ at a repetition rate of 1.5 syllables/sec
(i.e., 92 beats per minute). Subjects were asked to take a breath before the utterance and to
produce the utterance on a single, continuous expiration at a normal loudness and pitch level to
approximate normal conversational speech. Airflow was channeled through a large, hard-rubber,
anesthesia mask positioned over the mouth and nose. Flow from the mask was channeled
through a pneumotachometer. Intraoral pressure was recorded by a small-diameter polyethylene
55

tube passed through the face mask with the proximal end positioned in the oral cavity on top of
the tongue. The resulting flow-analog and pressure-analog signals were monitored and recorded
on an oscilloscope. The mean laryngeal resistance for the 15 male subjects was 35.7
cmH2O/l/sec (Smitheran & Hixon, 1981).
Comparison of mean laryngeal resistance values from the non-invasive methodology
(Smitheran & Hixon, 1981) to the combined weighted mean of three invasive studies which used
tracheal puncture to obtain subglottic pressure for the laryngeal resistance ratio (Kunze, 1962;
Sant & Logemann, 1970; Shipp & McGlone, 1971) indicated a difference of 1.5 cmH2O/l/s
between the two sets of data. No statistical tests were reported to compare the two sets of data.
Based on descriptive analyses, the closeness in values between the non-invasive methodology
(Smitheran & Hixon, 1981) and the invasive tracheal punctures (Kunze, 1962; Sant &
Logemann, 1970; Shipp & McGlone, 1971) suggested that the method presented by Smitheran
and Hixon (1981) was adequate in estimating laryngeal resistance during production of the /pi/
utterance.
Once the method of noninvasive aerodynamic evaluation had been established by
Smitheran and Hixon (1981), researchers in the 1980s and 1990s established normative data on
pressure and airflow. The relevant investigations focused on the effects of variations in pitch and
loudness on pressure and airflow (Holmberg et al., 1988, 1989; Stathopoulos & Sapienza, 1993;
Tang & Stathopoulos, 1995), and the effects of age and gender on pressure and airflow (Goozee,
Murdoch, Theodoros & Thompson, 1998; Stathopoulos & Weismer, 1985, Tang & Stathopoulos,
1995).
Relative to combined measures reflecting synergistic relations between pressure and
airflow, other studies have also assessed another measure reflecting phonation synergies, vocal
56
efficiency. Vocal efficiency is defined as voice output intensity divided by subglottic pressure
times average airflow (Schutte, 1981). Vocal efficiency as well as laryngeal resistance increased
as intensity increased (Holmberg et al., 1988; Ishiki, 1981; Schutte, 1981; Stathopoulos &
Sapienza, 1993; Tang & Stathopoulos, 1995). Vocal efficiency and laryngeal resistance
measures may be more directly related to vocal fold mechanisms controlling intensity rather than
vocal fold mechanisms controlling pitch (Holmberg et al., 1989). In addition, vocal efficiency
and subglottal pressures were lower in children than adults (Tang & Stathopouls, 1995) possibly
due to the differences in laryngeal structure as a function of age. Discrepancies between average
airflow and sound pressure levels (SPL) across gender and age were seen in the literature
(Goozee et al., 1998; Higgins & Saxman, 1991; Ludlow, Bassich & Connor, 1985; Stathopoulos
& Weismer, 1985). For example, two studies reported that males have increased average airflow
rates as compared to females during consonant-vowel-consonant productions (Higgins &
Saxman, 1991; Stathopoulos & Weismer, 1985), while another study reported the opposite effect
(Goozee et al., 1998). Finally, Holmberg and colleagues (1994) demonstrated that laryngeal
resistance and average airflow had a high degree of variability and should not be used as
measures to quantify subtle changes in vocal fold function related to intensity level.
1.4.4 The Capability of Laryngeal Resistance to Distinguish Pathological from Normal
Voice Production
In addition to normative studies on variations of loudness and pitch and age and gender
effects on pressure and airflow, researchers have also investigated the capabilities of pressure
and airflow to distinguish pathological from normal voice production and some pathological
conditions from one another (Grillo & Verdolini, in preparation; Hillman, Holmberg, Perkell,
57

Walsh & Vaughan, 1989, 1990; Laukkanen, Lindholm & Vilkman, 1995; Netsell, Lotz &
Shaughnessy, 1984; Rammage, Peppard & Bless, 1992).
Hillman and colleagues (1989) established a theoretical framework for vocal
hyperfunction. Vocal hyperfunction was divided into two groups; adducted hyperfunction and
nonadducted hyperfunction. Adducted hyperfunction included organic lesions (e.g., nodules,
polyps, and contact ulcers), while nonadducted hyperfunction included nonorganic conditions
(e.g., Muscle Tension Dysphonia or Muscle Tension Aphonia). Data collection of pressure and
airflow were similar to the normative study discussed previously (see, Smitheran & Hixon,
1981). Fifteen subjects with visual-perceptual diagnosis of adducted hyperfunction and
nonadducted hyperfunction produced 5 productions of the /pae/ syllable at a rate of 1.5
syllables/second. Subjects were asked to produce this syllable string using each of the following
kinds of voice: 1) normal pitch and loudness, 2) softer than normal, 3) louder than normal, 4)
lower pitched than normal, and 5) higher pitched than normal. Results indicated that neither the
ratios of laryngeal resistance nor vocal efficiency detected voice dysfunction relative to norms in
either of the patient groups. The authors attributed this finding to the large variability in the
average flow rates and the elevated values of subglottic pressure, which made the ratios
involving these parameters (i.e., laryngeal resistance and vocal efficiency) fall within the normal
range. Hillman and colleagues (1989), therefore, questioned the utility of these ratios for clinical
evaluation purposes. In a study a year later, Hillman and colleagues (1990), elected not to report
laryngeal resistance and vocal efficiency due to the ratios’ insensitivity in detecting phonatory
hyperfunction (Hillman et al., 1989).
Using the noninvasive technique to acquire subglottic pressure estimates and average
airflow as described in Smitheran and Hixon (1981), Netsell and colleagues (1984) attempted to
58
correlate laryngeal resistance values to voice quality. Eighteen subjects with a diagnosed voice
disorder provided a speaking voice sample for expert rating and participated in the aerodynamic
assessment similar to the methods described in Smitheran and Hixon (1981). The content of the
speaking voice sample was not specified. Three experienced speech-language pathologists rated
each sample on a scale from 0-7 with 0 representing normal limits and 7 representing severe
deviation for each dimension of breathy, rough, and strained. The following definitions were
used for the 3 voice qualities: 1) breathy, perception of excessive laryngeal airflow; 2) rough,
perception of aperiodic perturbations in frequency, intensity, or both; and 3) strained, perception
of hyperadduction in the laryngeal airway, excessive subglottal pressure or both (Netsell et al.,
1984). Intralistener agreement was 47% for exact scaler agreement, while the interlistener
agreement was generally within one scale point of each other.
Several trends were evident from the foregoing data (Netsell et al., 1984). When pressure
was normal and flow exceeded 400 ml/sec, patients’ voices were perceived as breathy. The
combination of low flow and excessive pressure, or pressures greater than 10 cmH2O, resulted in
the perception of a strained voice. Combinations of high flows and high pressures generally
resulted in the perception of a rough voice. No statistical analysis was completed to determine if
the laryngeal resistance values were significantly different from one another and if the voice
quality ratings accurately predicted the laryngeal resistance values. The results of the study are
purely descriptive in nature. The data, however, provided a valuable antecedent to later work
that attempted to address relations between voice quality and measures of functional synergies in
phonation.
In fact, the voice qualities of pressed, normal, resonant, and breathy were used in two
studies that attempted to distinguish their distinct adduction patterns by acoustic and high-
59

bandwidth aerodynamic measures, visual inspection, and electroglottography (EGG), but not by
relational measures (Alku & Vilkman, 1996; Peterson, Verdolini-Marston, Barkmeier &
Hoffman, 1994). The four voice qualities of pressed, normal, resonant, and breathy were defined
by their equivalent vocal fold adduction patterns: (1) constricted glottis, (2) neutral glottis, (3)
slightly more abducted or adducted than neutral glottis, and (4) separated arytenoid cartilages or
relative vocal fold abduction, respectively (Verdolini et al., 1998; Stevens, 1981).
In the first study, Alku and Vilkman (1996) described breathy and pressed voice as the
extreme vocal fold closure patterns to normal closure patterns. In the study by Alku and
Vilkman (1996), breathy, pressed, and normal voice qualities were used to find a quantification
technique that most clearly distinguished the three voice types. Five female and 5 male subjects
were asked to sustain /a/ for two seconds at a comfortable pitch and loudness level across all
three voice qualities. Quantification techniques of the voice source involved: three time-based
quotients extracted from the glottal flow waveforms, two time-based parameters that were
extracted from the flow and its first derivative, one amplitude-based parameter that was defined
as both the flow and its first derivative, and one frequency-domain parameter that was computed
from the flow signal. The results indicated that the voice qualities were distinguished from each
other most effectively by using the parameters that were extracted from the instant of maximum
glottal opening to the minimum peak of the flow derivative as well as the frequency-domain
parameterization.
In the second study, Peterson and colleagues (1994) used breathy, pressed, normal, and
resonant voice qualities to determine the most effective measurement tool in distinguishing the
four critical voice productions. The measurement tools included: 1) aerodynamic measures;
minimum flow, alternating current (AC flow), and maximum flow declaration rate (MFDR), 2)
60

electroglottography (EGG), and 3) videostroboscopic images. Minimum flow is the amount of
airflow through the glottis when the vocal folds are at their maximum closure (Holmberg et al.,
1988, 1989). AC flow is the amount of airflow modulated by vocal fold vibration and MFDR is
the greatest rate at which airflow is decelerated during vocal fold closure (Holmberg et al., 1988,
1989).
The closed quotient from the EGG signal of vowels /a/ and /i/ distinguished the four
voice qualities from one another (Peterson et al., 1994). The videostroboscopic images
distinguished pressed voice from the other voice types in terms of laryngeal adduction ratings.
Aerodynamic measures of minimum flow, AC flow, and MFDR yielded differences between the
voice qualities, but nothing significant. Both Alku and Vilkman (1996) and Peterson and
colleagues (1994) were successful in distinguishing the voice types. Alku and Vilkman (1996)
distinguished the voice types by using the glottal flow waveform and the frequency-domain
parameterization, while Peterson and colleagues (1994) distinguished the voice types by EGG
and videostroboscopic images.
The literature clearly indicates that the four voice qualities have been discussed and even
tested for distinguishing characteristics; however, the distinguishing characteristics did not
involve relational measures between the sub-systems of the voice production system. Grillo and
Verdolini (in preparation) tested whether or not four different adduction patterns of the vocal
folds were distinguishable from one another by relational measures of laryngeal resistance and/or
vocal efficiency. Laryngeal resistance and vocal efficiency are two aerodynamic and acoustic
dependent variables that reflect muscular and tissue force measurement of the laryngeal system
and the respiratory drive necessary for voice production.
61

In the study by Grillo and Verdolini (in preparation), 13 trained voice professionals
produced 5 sequential /pi/s across three trials at a production rate of 88 beats per minute in a
normal, resonant, pressed, and breathy voice quality (Grillo & Verdolini, in preparation).
Perceptual procedures were used to verify voice quality for each utterance. Fundamental
frequency was held constant at 220 Hz and intensity level was produced at a comfortable average
(+/- 1 dB) based on each subjects’ conversational speech. After a brief training phase, subjects
produced the target utterance for each voice quality into a Rothenberg (1973) circumferentially
vented pneumotachograph face mask attached to the Aerophone II software program. A pressure
transducer was attached to the mask at one end and the other end was placed in the subject’s
mouth between the lips on top of the tongue. Custom software was used to compute average
airflow, average dB, and average intraoral pressure for each trial, where pressures were
computed using methodology described by Holmberg and colleagues (1988). Laryngeal
resistance and vocal efficiency were then calculated (i.e., laryngeal resistance = average
subglottic pressure divided by average airflow, Smitheran & Hixon, 1981; vocal efficiency =
average dB divided by average subglottic pressure times average airflow, Schutte, 1981).
Results showed that laryngeal resistance distinguished all the voice qualities from one
another except normal and resonant, while vocal efficiency only distinguished breathy from
normal, resonant, and pressed (Grillo & Verdolini, in preparation; see Tables 1-3). The point for
the present discussion is that laryngeal resistance – but not vocal efficiency – was shown to be a
useful measure to capture synergistic relations across respiratory and laryngeal subsystems of
phonation, failing to distinguish only normal and resonant voice. It is likely that the difference
between normal and resonant voice qualities does not reside with differences in respiratory-
laryngeal relations, but rather with changes in the vocal tract.
62

Laryngeal Resistance Significance 95% CI R=N .347 -24.23, 4.87 R≠ B .000 * 11.06, 29.86 R≠ P .004 * -729.78, -133.29 N≠ B .000 * 18.32, 41.96 N≠ P .004 * -714.78, -128.93 B≠ P .003 * -748.47, -155.52
Table 1. Laryngeal resistance (cm H2O/l/s) pairwise comparisons for R=Resonant, N=Normal, P=Pressed, and B=Breathy with 95% confidence intervals. (Asterisk indicates a significant difference for the pairwise comparisons, p= .05).
Vocal Efficiency Significance 95% CI R=N 1.0 -31.23, 32.96 R≠ B .000 * 38.51, 101.38 R=P .108 -236.19, 16.65 N≠ B .000 * -88.78, -49.37 N=P .152 -247.29, 26.00 B≠ P .006 * -311.26, -48.17
Table 2. Vocal efficiency (dB/cmH2O/ l/s) pairwise comparisons for R=Resonant, N=Normal, P=Pressed, and B=Breathy with 95% confidence intervals. (Asterisk indicates a significant difference for pairwise comparisons, p= .05).
Sample Mean 95% Confidence Intervals Laryngeal Resistance, breathy 11.84 10.35, 13.33 Laryngeal Resistance, normal 41.98 33.04, 50.93 Laryngeal Resistance, pressed 463.83 258.31, 669.35
Table 3. Sample mean and 95% confidence intervals that could cover the population parameter of µ for breathy, normal, and pressed voice qualities by laryngeal resistance (cm H2O/l/s).
In summary, Hillman and colleagues (1989, 1990) found that laryngeal resistance and
vocal efficiency were unable to distinguish voice hyperfunction from normal voice. Netsell and
colleagues (1984) descriptively correlated laryngeal resistance to voice quality. Even though
Netsell and colleagues (1984) did not statistically test for a direct correlation between laryngeal
resistance and voice quality, a rationale based on descriptive trends in the data was established
for future direct tests. Grillo and Verdolini (in preparation) provided direct evidence that
laryngeal resistance distinguished the pairwise combinations of pressed, normal, resonant, and
breathy voice qualities, except normal and resonant voice, which are likely distinguished by
63

vocal tract characteristics. Based on those data, laryngeal resistance is a valid measure that
reflects an order parameter of the dynamic voice production system and specifically, a functional
synergy across respiratory and laryngeal subsystems.
1.5 STATEMENT OF PURPOSE, SPECIFIC AIMS, EXPERIMENTAL QUESTIONS,
AND HYPOTHESES
The general goal of the proposed studies was to address theoretical issues exploring the
intersection of sensory feedback and coordinative dynamics in an emerging theoretical
framework that emphasizes heterarchical influences in motor control. A bimanual coordination
task was selected for study because (a) the task was associated with a well-established
experimental paradigm, and thus results from the present series can be compared and verified
against findings from previous work; (b) the task established the validity of the experimental
design; and (c) the task involved upper limb coordination, which is ultimately relevant for a wide
range of occupational and physical therapy targets. Examples include upper limb mobility
exercises for individuals with decreased limb function (Mulder, 1991; Mulder et al., 2004;
Steenbergen et al., 2000) and functional exercises relevant to repetitive motions such as
assembly line factory work and piano playing (Haslinger, Erhard, Altenmuller, Hennenlotter,
Schwaiger, von Einsiedel, Rummeny, Conrad & Ceballos-Bauman, 2004; Parlitz, Peschel &
Altenmuller, 2004; Ragert, Schmidt, Altenmuller & Dinse, 2004).
A voice task was selected for study because (a) the task represented a functional gesture
based on communication rather than movement; (b) the task required expertise in manipulating
the voice production system; (c) the task represented an actual training activity that is directly
64

relevant to behavioral therapy for a broad range of conditions affecting voice (Berry, Verdolini,
Montequin, Hess, Chan, & Titze, 2001; Grillo & Verdolini, in preparation); (d) the sensory
feedback condition was a relevant component of the candidate’s developing Global Voice
Therapy Program; and (e) the task extended the inquiry of motor control beyond the typical
bimanual coordination domain (i.e., bimanual upper limb movement) to a task that required
biomechanical coupling of the respiratory and laryngeal subsystems for the production of voice.
In the literature, studies involving biomechanical coupling for motor coordination were
investigated in finger tapping, finger-wrist, and lower jaw-lower lip paradigms; therefore, the
voice task was consistent with investigations extending beyond the typical bimanual limb
movements (Liao & Jagacinski, 2000; Mechsner et al., 2001; Mechsner & Knoblich, 2004;
Kelso & Bateson, 1983; Kelso & Tuller, 1984). Specific aims, rationale, experimental
questions, and hypotheses are as follows:
#1) (Experiment 1):
Specific aim: To assess the influence of (i) visual and auditory sensory feedback; (ii)
relative phase pattern; (iii) increasing oscillation frequency, and (iv) their interaction on motor
performance for a bimanual coordination task.
Rationale: The rationale for the sensory feedback condition was to challenge
coordination dynamics where sensory feedback influences are underemphasized in the
performance of movement output. A second rationale for assessing the role of sensory feedback
in bimanual coordination was to seek replication of previous research indicating relevance of
feedback for such tasks (Cardoso de Oliveira & Barthelemy, 2005; Kazennikov et al., 2002;
Serrien & Teasdale, 1996; Swinnen et al., 2000). In addition, evaluating the role of increasing
frequency on relative phase was pursued to seek replication of previous research demonstrating
65

that the 0º in-phase pattern is more stable than the 180º anti-phase pattern (Kelso, 1984; Scholz
& Kelso, 1989, 1990; Tuller & Kelso, 1989).
Based on the literature, two potential attractor states of relative phase were targeted for
investigation: 0° in-phase and 180° anti-phase patterns. Those relative phase patterns were
produced at increasing frequencies of 1 Hz, 2 Hz, and 3 Hz, corresponding to slow, medium, and
fast speeds, respectively, to assess the influence of sensory feedback as a function of task
difficulty.
Experimental questions and hypotheses:
1) Will there be a significant interaction among the effects of 4 sensory feedback conditions,
2 relative phase patterns, and increasing frequency of oscillation for a bimanual
coordination task?
Ho¹: There is no significant interaction among the effects of 4 sensory feedback conditions (i.e.,
visual + auditory feedback; visual feedback only; auditory feedback only; no visual and no
auditory feedback), 2 relative phase patterns (i.e., 0º and 180º), and increasing frequency of
oscillation or speed (i.e., 1Hz, 2Hz, and 3Hz) on the mean error of relative phase and/or the
standard deviation of relative phase.
2) Will there be a significant interaction among the effects of 2 relative phase patterns and
the increasing frequency of oscillation for a bimanual coordination task?
Ho²: There is no significant interaction among the effects of 2 relative phase patterns (i.e., 0º
and 180º) and increasing frequency of oscillation or speed (i.e., 1Hz, 2Hz, and 3Hz) on the mean
error of relative phase and/or the standard deviation of relative phase.
#2) (Experiment 2):
66
Specific aim: To assess the influence of (i) auditory sensory feedback, (ii) voice quality;
(iii) increasing fundamental frequency (Fo); and (iv) their interaction on motor performance for a
voice coordination task.
Rationale: The rationale for assessing the role of sensory feedback in a coordinative
voice task was to explore the generality of results from the limb study. Consistent results across
limb and voice tasks would speak to general principles of motor control rather than domain-
specific principles, and would thus contribute to general models of motor control. The
dependent variable was laryngeal resistance (cmH2O/l/s), which has been shown to reflect
functional synergies across respiratory and laryngeal subsystems in voice production (Grillo &
Verdolini, in preparation). Specifically, three potential attractor states for laryngeal resistance
were identified for study that previous research has shown to generally correspond to breathy
voice quality (i.e., 10.35-13.33 cmH20/l/s), pressed voice (i.e., 258.31-669.35 cmH20/l/s), and
normal voice (i.e., 33.04-50.93 cmH20/l/s). Each target voice quality was produced at a series of
fundamental frequencies ranging from 220 Hz to 880 Hz in major third increments (i.e., 220Hz,
277Hz, 349Hz, 440Hz, 554Hz, 698Hz, and 880Hz). Increasing fundamental frequency or pitch
is related to the speed of vocal fold vibration located in the laryngeal subsystem and not in the
respiratory system; however; biomechanical coupling between the respiratory and laryngeal
subsystems helps to achieve the increase in pitch. To make the limb study and the voice study
consistent across the two tasks, the increasing fundamental frequency component was
determined to be as close as possible to the increasing frequency of oscillation component in the
limb study. Thus, fundamental frequency changes were incorporated in the present experiment
as a way of influencing task difficulty.
Experimental questions and hypotheses:
67

1) Will there be a significant interaction among the effects of 2 sensory feedback
conditions, 3 voice qualities, and increasing fundamental frequency or pitch for a voice
coordination task?
Ho¹: There is no significant interaction among the effects of 2 sensory feedback conditions (i.e.,
normal auditory feedback and masked auditory feedback by speech noise), 3 voice qualities (i.e.,
breathy, normal, and pressed), and increasing fundamental frequency or pitch (i.e., 220Hz,
277Hz, 349Hz, 440Hz, 554Hz, 698Hz, and 880Hz) on the mean of laryngeal resistance and/or
the standard deviation of laryngeal resistance.
2) Will there be a significant interaction among the effects of 2 sensory feedback conditions
and 3 voice qualities for a voice coordination task?
Ho²: There is no significant interaction among the effects of 2 sensory feedback conditions (i.e.,
normal auditory feedback and masked auditory feedback by speech noise) and 3 voice qualities
(i.e., breathy, normal, and pressed) on the mean if laryngeal resistance and/or the standard
deviation of laryngeal resistance.
68

2.0 CHAPTER 2: EXPERIMENT 1
2.1 RESEARCH METHODS
2.1.1 Purpose
The purpose of Experiment 1 was to assess the influence of (i) visual and auditory
sensory feedback (i.e., (a) visual + auditory feedback, (b) visual feedback only, (c) auditory
feedback only, and (d) no visual and no auditory feedback); (ii) bimanual coordination pattern
(i.e., 0° and 180° relative phase patterns); (iii) increasing frequency of oscillation or speed (i.e.,
1Hz, 2Hz, and 3 Hz), and (iv) their interactions on motor performance for a bimanual
coordination task.
2.1.2 Participants
Participants were 15 females, ages 18-35 years with a mean age of 21 years. Sample size
was derived from prior work indicating that this subject number is sufficient to detect group
differences in stability across bimanual coordination tasks (Hodges & Lee, 1999; Lee, Almeida
& Chua, 2002; Mechsner et al., 2001; Serrien & Teasdale, 1996). The study was limited to
females due to the emphasis on females in Experiment 2 for clinical reasons (see description of
Experiment 2). Thus, for purposes of comparing results across studies, gender was kept constant
throughout the series. Participants were recruited among undergraduate and graduate students at
69
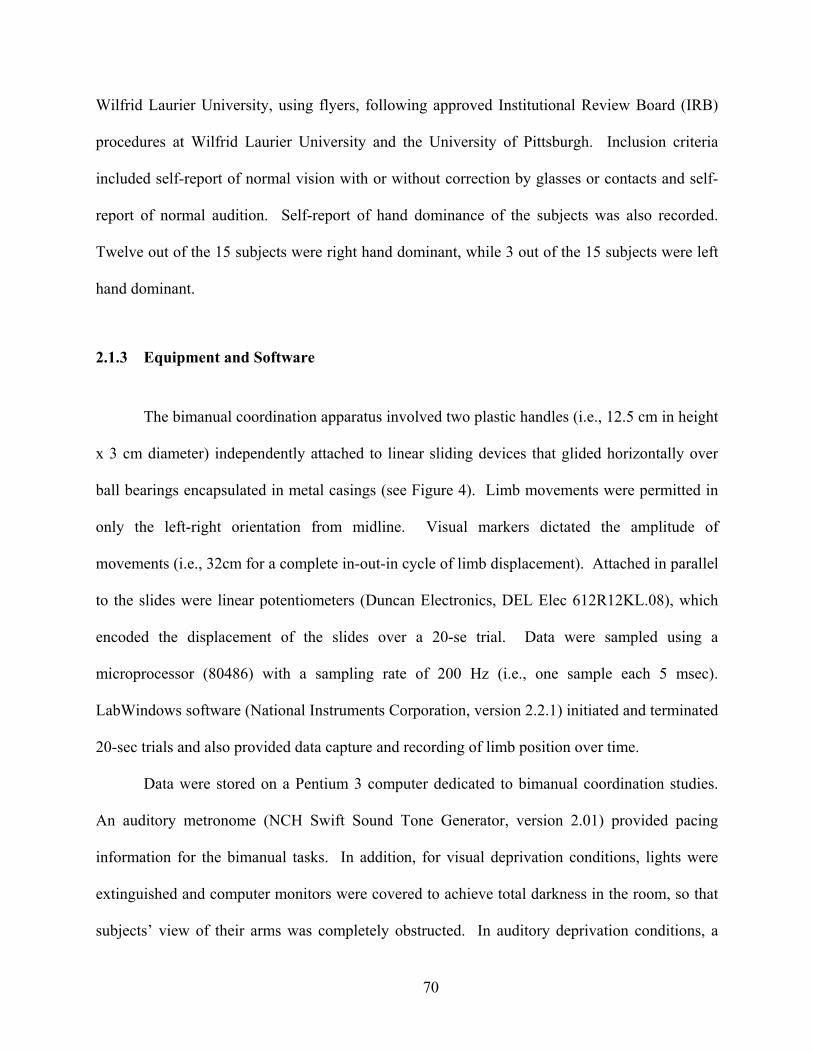
Wilfrid Laurier University, using flyers, following approved Institutional Review Board (IRB)
procedures at Wilfrid Laurier University and the University of Pittsburgh. Inclusion criteria
included self-report of normal vision with or without correction by glasses or contacts and self-
report of normal audition. Self-report of hand dominance of the subjects was also recorded.
Twelve out of the 15 subjects were right hand dominant, while 3 out of the 15 subjects were left
hand dominant.
2.1.3 Equipment and Software
The bimanual coordination apparatus involved two plastic handles (i.e., 12.5 cm in height
x 3 cm diameter) independently attached to linear sliding devices that glided horizontally over
ball bearings encapsulated in metal casings (see Figure 4). Limb movements were permitted in
only the left-right orientation from midline. Visual markers dictated the amplitude of
movements (i.e., 32cm for a complete in-out-in cycle of limb displacement). Attached in parallel
to the slides were linear potentiometers (Duncan Electronics, DEL Elec 612R12KL.08), which
encoded the displacement of the slides over a 20-se trial. Data were sampled using a
microprocessor (80486) with a sampling rate of 200 Hz (i.e., one sample each 5 msec).
LabWindows software (National Instruments Corporation, version 2.2.1) initiated and terminated
20-sec trials and also provided data capture and recording of limb position over time.
Data were stored on a Pentium 3 computer dedicated to bimanual coordination studies.
An auditory metronome (NCH Swift Sound Tone Generator, version 2.01) provided pacing
information for the bimanual tasks. In addition, for visual deprivation conditions, lights were
extinguished and computer monitors were covered to achieve total darkness in the room, so that
subjects’ view of their arms was completely obstructed. In auditory deprivation conditions, a
70

white-noise masking stimulus (NCH Swift Sound Tone Generator, version 2.01) was delivered to
the subject’s ears via supra-aural headphones (Optimum Pro-155 stereo headphones) so that
auditory feedback about performance from the linear slides was blocked. The intensity of
masking was determined individually for each subject, so that complete masking of the linear
slide sounds was blocked, but intensity of masking was within comfortable limits and the
metronome signal could still be perceived.
Figure 4: Bimanual Linear Slide.
2.1.4 Experimental Design
The experiment used a three-way, within-subjects repeated measures design. The three
independent variables were: (1) relative phase patterns for a bimanual coordination task (i.e., 0º
and 180º), (2) frequency of arm oscillation or speed (i.e., 1 Hz, 2 Hz, and 3 Hz), and (3) sensory
feedback conditions (i.e., visual and auditory feedback, visual feedback only, auditory feedback
71
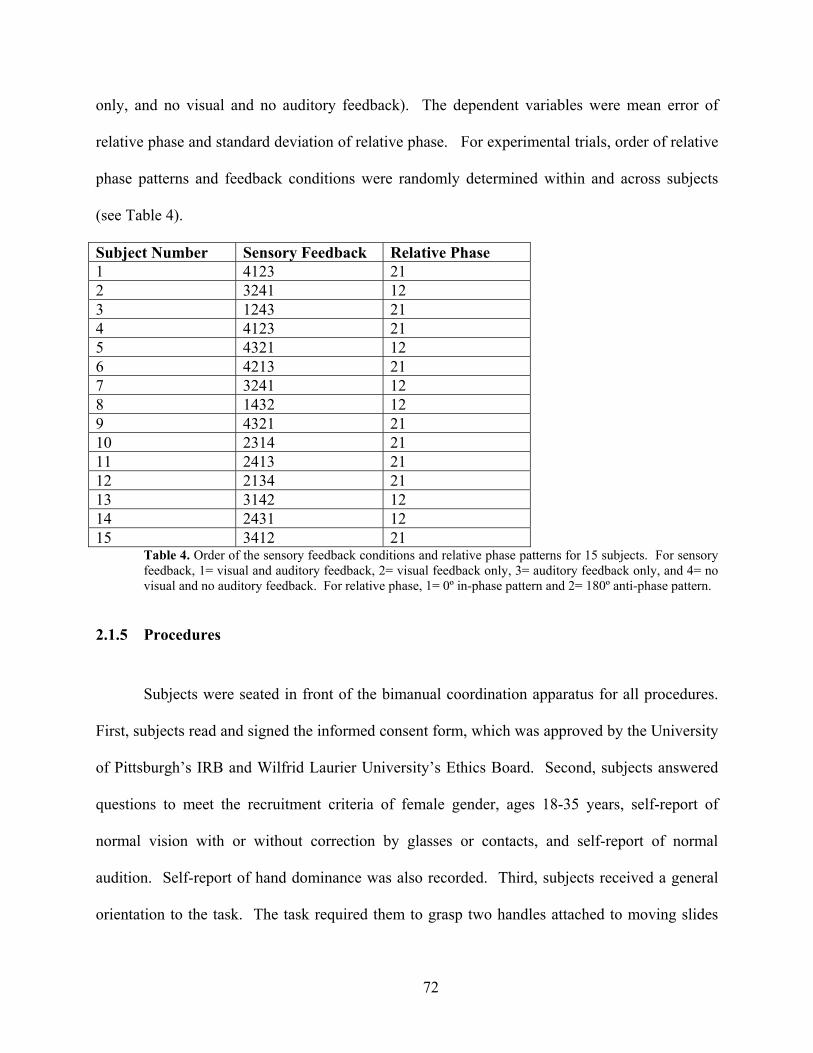
only, and no visual and no auditory feedback). The dependent variables were mean error of
relative phase and standard deviation of relative phase. For experimental trials, order of relative
phase patterns and feedback conditions were randomly determined within and across subjects
(see Table 4).
Subject Number Sensory Feedback Relative Phase 1 4123 21 2 3241 12 3 1243 21 4 4123 21 5 4321 12 6 4213 21 7 3241 12 8 1432 12 9 4321 21 10 2314 21 11 2413 21 12 2134 21 13 3142 12 14 2431 12 15 3412 21
Table 4. Order of the sensory feedback conditions and relative phase patterns for 15 subjects. For sensory feedback, 1= visual and auditory feedback, 2= visual feedback only, 3= auditory feedback only, and 4= no visual and no auditory feedback. For relative phase, 1= 0º in-phase pattern and 2= 180º anti-phase pattern.
2.1.5 Procedures
Subjects were seated in front of the bimanual coordination apparatus for all procedures.
First, subjects read and signed the informed consent form, which was approved by the University
of Pittsburgh’s IRB and Wilfrid Laurier University’s Ethics Board. Second, subjects answered
questions to meet the recruitment criteria of female gender, ages 18-35 years, self-report of
normal vision with or without correction by glasses or contacts, and self-report of normal
audition. Self-report of hand dominance was also recorded. Third, subjects received a general
orientation to the task. The task required them to grasp two handles attached to moving slides
72

and displace them horizontally in the left-right dimension. In the 0º in-phase pattern, the limbs
moved toward each other and then away from each other continuously with the same
homologous muscle groups contracting at the same time (Kelso, 1981, 1984). In the 180º anti-
phase pattern, the limbs moved together in a parallel fashion with the homologous muscle groups
contracting in an alternating fashion (Kelso, 1981, 1984).
Subjects received instructions to keep pace with a metronome by performing a complete
cycle of in-out-in handle displacement in time with the beat and to keep the moving slides within
the visual markers. The metronome paced the required speed or frequency of limb movement
beginning at a slow speed equivalent to a frequency of 1 Hz for 20-seconds. After completion of
the 20-second trial at 1 Hz, the same required coordination task was repeated at a medium speed
equivalent to a frequency of 2 Hz and subsequently a fast speed equivalent to a frequency of 3
Hz as paced by the metronome. A brief 5-second pause occurred between each speed. Each
paced trial lasted for 20-seconds.
Subjects were also encouraged to maintain the required coordination pattern as best as
possible throughout all trials. If the pattern destabilized, subjects were instructed to attempt a
recapture of the required coordination pattern even mid-trial. Then, after verbal descriptions and
demonstrations, subjects produced the 0º and the 180º relative phase patterns under a variety of
feedback conditions (i.e., normal visual and auditory feedback, visual feedback only, auditory
feedback only, and no visual and no auditory feedback of the arms at each of the 3 pacing
frequencies (i.e., 1 Hz, 2 Hz, and 3 Hz). All 3 frequencies or speeds for one relative phase
pattern were completed before switching to a new relative phase pattern, in a blocked design. In
addition, subjects repeated each speed 3 times to increase the sample of data points so there was
73

less chance of outlier performance. Order of the relative phase patterns and sensory feedback
conditions were randomized within and across subjects (see Table 4).
For the normal feedback condition, subjects had a clear view of their arms and hands
during the production of the relative phase patterns, and they could hear noises from the linear
slides as they were displaced. As noted, in the no visual feedback condition, total visual
deprivation was achieved by extinguishing all lights and covering the computer monitors so that
visual access to the limbs was completely blocked. In the auditory deprivation condition,
subjects received white noise presented to their ears via supra-aural headphones at an intensity
level that was adequate to mask the sound produced by the bimanual slides without causing
discomfort to the subject, as determined individually for subjects during the orientation phase of
the experiment. Auditory pacing from the metronome, however, could be perceived above the
white noise through the headphones. During the experiment, subjects received no feedback
about their performance from the computer or otherwise, because such feedback might have
influenced learning for the task and the focus of the present study was motor control, not motor
learning.
2.1.6 Data Reduction
The dependent variables for Experiment 1 were mean error of relative phase and
standard deviation of relative phase as a function of bimanual coordination task (i.e., 0º and
180°), at 3 increasing frequencies under 4 sensory feedback conditions. Data collection involved
a continuous estimate methodology (Hodges & Lee, 1999), in which limb position was sampled
at a rate of 200 Hz (every 5 ms). This method allowed for finer-grained information about
movement accuracy as compared with point estimates, which typically focus on two time-points
74

per cycle (Scholz & Kelso, 1990). Relative phase difference for each time point was determined
in the following way. For each time point sampled, the relative phase of the right limb in space
was captured, relative to the left limb, where a reference of 0º indicated that both limbs were at
the midline position. In addition, the 3 repetitions of each speed were averaged for calculation of
mean error of relative phase and standard deviation of the relative phase.
Mean error of relative phase was calculated for the 0º in-phase pattern and for the 180º
anti-phase pattern. Specifically, the final mean error term for the 0º in-phase pattern was simply
the mean relative phase because the mean relative phase error subtracted from 0 is equal to the
mean relative phase. To compute the final error term for the 180º anti-phase pattern, the
performed mean relative phase from each trial was subtracted from 180, so that values could be
compared to those for the 0º trials. In addition to mean error of relative phase, also the standard
deviation of the relative phase was computed for each experimental condition. Both values were
used in statistical analyses.
2.1.7 Statistical Analysis
Statistical analyses were guided by the study’s purpose. As noted elsewhere, the purpose
of Experiment 1 was to examine how sensory feedback contributes to bimanual coordination
dynamics and to replicate previous results demonstrating that the 0º in-phase pattern is more
stable than the 180º anti-phase pattern at increasing speeds (Kelso, 1984; Scholz & Kelso, 1989,
1990; Tuller & Kelso, 1989).
A three-way, repeated measures analysis of variance (ANOVA) was conducted on each
of the dependent variables. The dependent variables were mean error of relative phase and
standard deviation of relative phase. The independent variables were sensory feedback condition
75

(i.e., visual + auditory feedback, visual feedback only, auditory feedback only, and no visual and
no auditory feedback), bimanual coordination task (i.e., 0º and 180º), and movement frequency
(i.e., 1, 2, and 3 Hz). Significance level was set at α = .05 and post hoc simple main effects were
analyzed using the Bonferroni correction. The ANOVAs were used to test the following two
statistical hypotheses (Ho):
1. Ho¹: There is no significant interaction among the effects of 4 sensory feedback
conditions (i.e., visual + auditory feedback, visual feedback only, auditory
feedback only, and no visual and no auditory feedback), 2 relative phase patterns
(i.e., 0º and 180º), and increasing frequency of oscillation or speed (i.e., 1Hz, 2Hz,
and 3Hz) on mean error of relative phase and/or standard deviation of relative
phase.
2. Ho²: There is no significant interaction among the effects of 2 relative phase
patterns (i.e., 0º and 180º) and increasing frequency of oscillation or speed (i.e.,
1Hz, 2Hz, and 3Hz) on mean error of relative phase and/or standard deviation of
relative phase.
76

2.2 RESULTS
The following assumptions were applied to the within-subjects repeated measures design:
(1) sphericity, (2) normality, and (3) independence by random order of the design. Relative to
the first point, Huynh and Feldt (1970) demonstrated that the assumption of sphericity (i.e.,
variances of differences for all levels of the repeated measures factor are equal) is sufficient to
obtain central F-distributions with nominal degrees of freedom. The assumption of sphericity
was met for some, but not all of the within subjects effects. To correct for sphericity, the Huynh-
Feldt (1970) correction was used for all tests. The normality assumption was met for some of the
mean error and standard deviation values, but not all. Non-normality, however, has very little
effect on the level of significance and the power of the F-test in the analysis of variance
(ANOVA) when considering non-directional tests (Glass and Hopkins, 1996). Thus, the data
were not adjusted for normality. It is more important to meet the assumption of independence
within by random order of the design as its violation may seriously affect the level of
significance and the power of the F-test (Glass and Hopkins, 1996). The assumption of
independence within by random order of the design was met by the random order of the sensory
feedback conditions and the relative phase patterns. Alpha was set at .05 for all analyses and
adjusted appropriately for the number of post hoc comparisons.
2.2.1 Dependent Variable: Mean Error of Relative Phase
Results for mean error of relative phase are shown in Tables 5-8 and in Figures 5-7.
Overall, mean error of relative phase was greater for the 180º condition than for the 0º condition,
and was also greater for the 180º pattern at higher frequencies as compared to lower frequencies
77

of limb oscillation. The performance of the 0º in-phase pattern was not influenced by the
increasing frequencies. The accuracy in performance of the relative phase patterns, however, did
not systematically vary with feedback condition.
The ANOVA for mean error of relative phase revealed significant main effects for phase
[F(1,14)=73.36, p<.000] and frequency (indicated as “speed” in the Figure legends)
[F(1.36,19)=48.95, p<.000] (see Table 5 and Figures 5 and 6). The main effect of feedback
[F(2.24,31.39)=1.13, p=.342], however, was not significant. A significant two-way interaction
was shown for phase x speed [F(1.49,21)=41.69, p<.000] (see Table 5 and Figure 7). The three-
way interaction for phase x speed x feedback [F(3.43,48)=.363, p=.806] was not significant. Eta
squared, an indicator of effect size, was .840 and .778 for the significant main effects of phase
and speed, respectively and .749 for the significant two-way interaction. The significant two-
way interaction among the effects of relative phase and increasing speed on mean error of
relative phase warrants the rejection of Ho²; therefore, a relationship was demonstrated among
relative phase and increasing frequency for a bimanual coordination task. In contrast, the three-
way interaction among the effects of sensory feedback, relative phase, and frequency on mean
error of relative phase does not warrant the rejection of Ho¹. In contrast to previous findings
(Cardoso de Oliveira & Barthelemy, 2005; Kazennikov et al., 2002; Serrien & Teasdale, 1996;
Swinnen et al., 2000), the present study failed to reveal a clear role of sensory feedback for the
bimanual coordination task or an interaction among sensory feedback, relative phase, and
increasing frequency for the task.
78
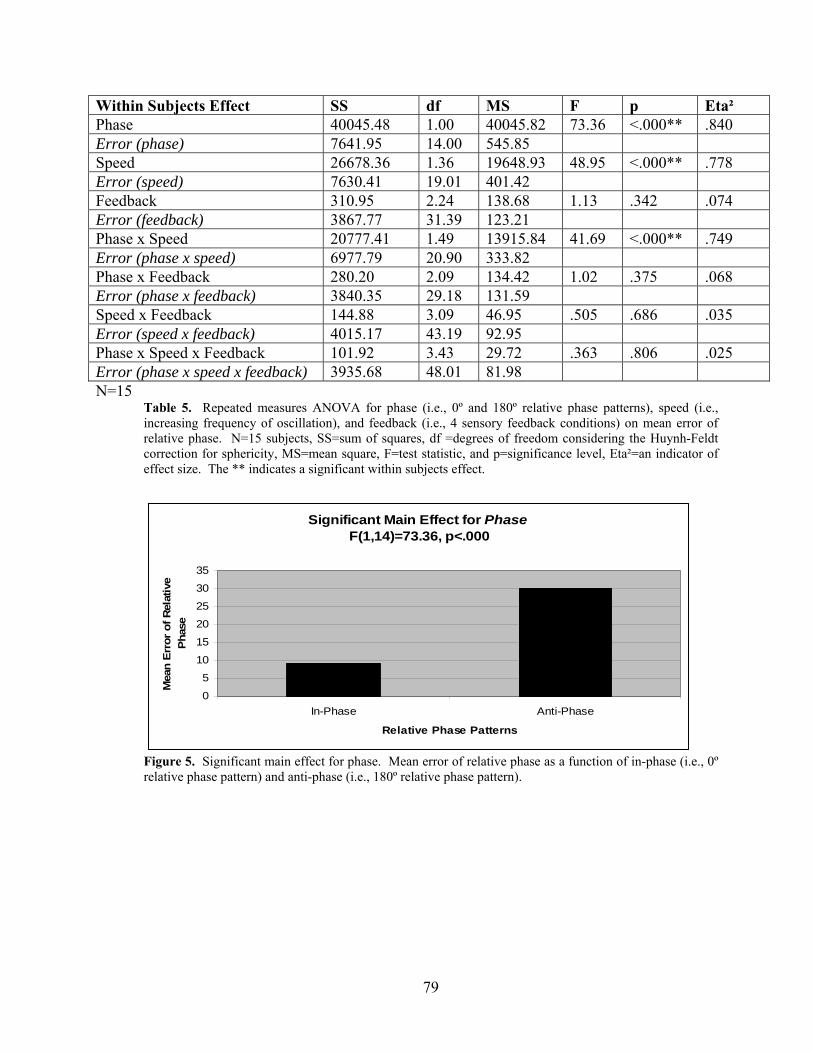
Within Subjects Effect SS df MS F p Eta² Phase 40045.48 1.00 40045.82 73.36 <.000** .840 Error (phase) 7641.95 14.00 545.85 Speed 26678.36 1.36 19648.93 48.95 <.000** .778 Error (speed) 7630.41 19.01 401.42 Feedback 310.95 2.24 138.68 1.13 .342 .074 Error (feedback) 3867.77 31.39 123.21 Phase x Speed 20777.41 1.49 13915.84 41.69 <.000** .749 Error (phase x speed) 6977.79 20.90 333.82 Phase x Feedback 280.20 2.09 134.42 1.02 .375 .068 Error (phase x feedback) 3840.35 29.18 131.59 Speed x Feedback 144.88 3.09 46.95 .505 .686 .035 Error (speed x feedback) 4015.17 43.19 92.95 Phase x Speed x Feedback 101.92 3.43 29.72 .363 .806 .025 Error (phase x speed x feedback) 3935.68 48.01 81.98 N=15
Table 5. Repeated measures ANOVA for phase (i.e., 0º and 180º relative phase patterns), speed (i.e., increasing frequency of oscillation), and feedback (i.e., 4 sensory feedback conditions) on mean error of relative phase. N=15 subjects, SS=sum of squares, df =degrees of freedom considering the Huynh-Feldt correction for sphericity, MS=mean square, F=test statistic, and p=significance level, Eta²=an indicator of effect size. The ** indicates a significant within subjects effect.
Significant Main Effect for Phase F(1,14)=73.36, p<.000
0
5
10
15
20
25
30
35
In-Phase Anti-Phase
Relative Phase Patterns
Mea
n E
rror
of R
elat
ive
Pha
se
Figure 5. Significant main effect for phase. Mean error of relative phase as a function of in-phase (i.e., 0º relative phase pattern) and anti-phase (i.e., 180º relative phase pattern).
79

Significant Main Effect for Speed F(1.36,19)=48.94, p<.000
0
5
10
15
20
25
30
35
Slow 1Hz Medium 2Hz Fast 3Hz
Three Movement Frequencies (Hz) or Speeds
Mea
n Er
ror o
f Rel
ativ
e Ph
ase
Figure 6. Significant main effect for speed. Mean error of relative phase as a function of speed or frequency of oscillation (i.e., slow (1Hz), medium (2Hz), and fast (3 Hz)).
Significant Two-Way Interaction for Phase x Speed F(1.49,21)=41.69, p<.000
0
10
20
30
40
50
60
Slow 1Hz Medium 2Hz Fast 3 Hz
Three Movement Frequencies (Hz) or Speeds
Mea
n Er
ror o
f Rel
ativ
e Ph
ase In-Phase
Anti-Phase
Figure 7. Significant two-way interaction for phase x speed. Mean error of relative phase as a function of speed or frequency of oscillation (i.e., slow (1Hz), medium (2Hz), and fast (3 Hz)) for the 0º in-phase pattern and the 180º anti-phase pattern.
The significant two-way interaction for phase x speed was further analyzed utilizing post
hoc analysis of simple main effects using the Bonferroni correction, thereby determining the
effects of one independent variable while holding the other independent variable constant.
Determining the effects of the frequency of oscillation or speed (i.e., 1Hz, 2Hz, 3Hz) at a single
relative phase pattern (i.e., 0º or 180º) is an example of a simple main effect. Considering the
80

significant two-way interaction for phase x speed, 9 total pairings were tested to compare the 3
speeds within a single relative phase pattern (i.e., 3 speeds x 2 relative phase patterns = 6) and to
compare the 2 phases within a single speed (i.e., 2 phases within 3 speeds = 3). Because 18
overall tests were performed, including 9 post hoc comparisons for mean error of relative phase
and 9 post hoc comparisons for standard deviation of relative phase (further discussed in the next
section), the critical p-value was adjusted to account for the 18 tests (.05/18=.0027, p-
value=.0027).
Comparing slow (1Hz), medium (2Hz), and fast (3Hz) speeds within the 0º and 180º
relative phase patterns, 3 pairwise comparisons were performed: slow versus medium, slow
versus fast, and medium versus fast (see Tables 6 and 7).
Pairwise Comparisons for 0º In-phase Pattern df t p slow versus medium 32 .171 .865
slow versus fast 32 .685 .498 medium versus fast 32 .514 .611
Table 6. Pairwise comparisons for 0º in-phase pattern at slow (1Hz), medium (2Hz), and fast (3Hz) speeds. df=degrees of freedom for the t-distribution, t=test statistic, and p=significance level.
Pairwise Comparisons for 180º Anti-phase Pattern df t p slow versus medium 32 4.09 <.000**
slow versus fast 32 11.20 <.000** medium versus fast 32 7.11 <.000**
Table 7. Pairwise comparisons for 180º anti-phase pattern at slow (1Hz), medium (2Hz), and fast (3Hz) speeds. df=degrees of freedom for the t-distribution, t=test statistic, and p=significance level. The ** indicates a significant pairwise comparison.
For the 0º in-phase pattern, the slow versus medium [t(32)=.171, p=.865], slow versus
fast [t(32)=.685, p=.498], and medium versus fast [t(32)=.514, p=.611] pairwise comparisons
were not significant suggesting that the 0º in-phase pattern was produced with the same amount
of error across the slow, medium, and fast speeds (see Table 6 and Figure 7). For the 180º anti-
phase pattern, the slow versus medium [t(32)=4.09, p<.000], slow versus fast [t(32)=11.20,
p<.000], and medium versus fast [t(32)=7.11, p<.000] pairwise comparisons were all significant
81
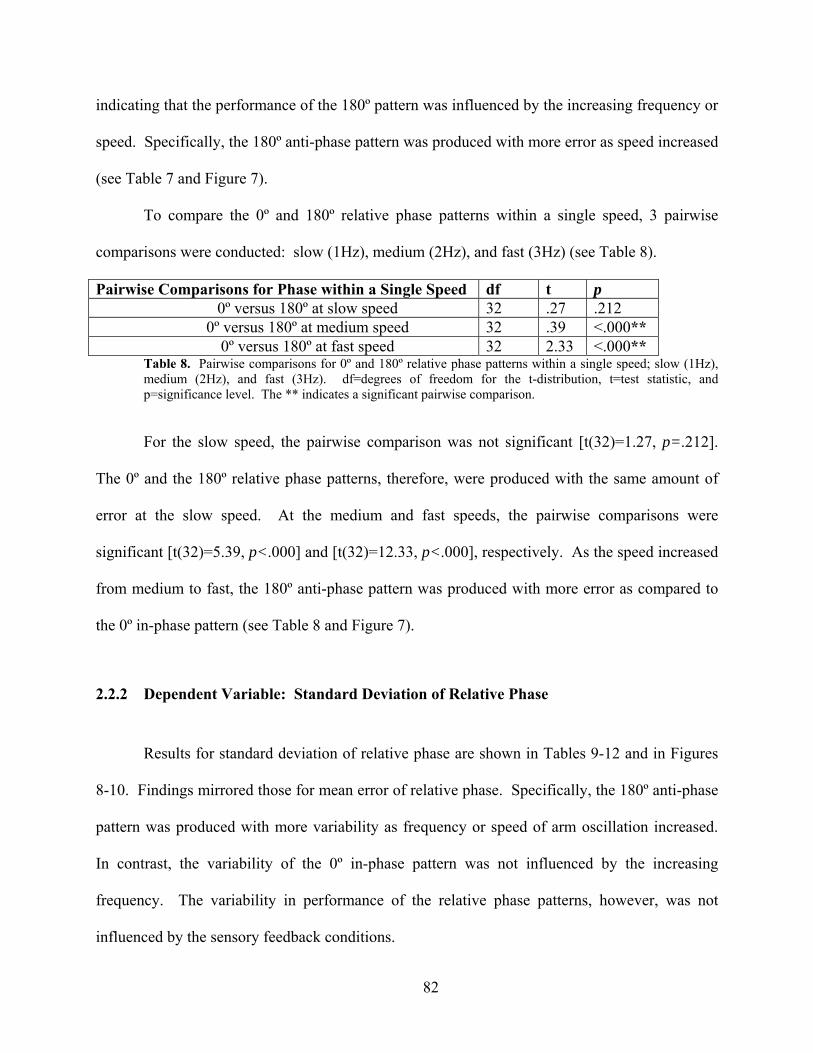
indicating that the performance of the 180º pattern was influenced by the increasing frequency or
speed. Specifically, the 180º anti-phase pattern was produced with more error as speed increased
(see Table 7 and Figure 7).
To compare the 0º and 180º relative phase patterns within a single speed, 3 pairwise
comparisons were conducted: slow (1Hz), medium (2Hz), and fast (3Hz) (see Table 8).
Pairwise Comparisons for Phase within a Single Speed df t p 0º versus 180º at slow speed 32 .27 .212
0º versus 180º at medium speed 32 .39 <.000** 0º versus 180º at fast speed 32 2.33 <.000**
Table 8. Pairwise comparisons for 0º and 180º relative phase patterns within a single speed; slow (1Hz), medium (2Hz), and fast (3Hz). df=degrees of freedom for the t-distribution, t=test statistic, and p=significance level. The ** indicates a significant pairwise comparison.
For the slow speed, the pairwise comparison was not significant [t(32)=1.27, p=.212].
The 0º and the 180º relative phase patterns, therefore, were produced with the same amount of
error at the slow speed. At the medium and fast speeds, the pairwise comparisons were
significant [t(32)=5.39, p<.000] and [t(32)=12.33, p<.000], respectively. As the speed increased
from medium to fast, the 180º anti-phase pattern was produced with more error as compared to
the 0º in-phase pattern (see Table 8 and Figure 7).
2.2.2 Dependent Variable: Standard Deviation of Relative Phase
Results for standard deviation of relative phase are shown in Tables 9-12 and in Figures
8-10. Findings mirrored those for mean error of relative phase. Specifically, the 180º anti-phase
pattern was produced with more variability as frequency or speed of arm oscillation increased.
In contrast, the variability of the 0º in-phase pattern was not influenced by the increasing
frequency. The variability in performance of the relative phase patterns, however, was not
influenced by the sensory feedback conditions.
82

The ANOVA for standard deviation of relative phase revealed significant main effects for
phase [F(1,14)=292.69, p<.000] and frequency (indicated as “speed” in the Figure legends)
[F(2,28)=135.25, p<.000] (see Table 9 and Figures 8 and 9). The main effect for feedback was
not significant [F(3,42)=.418, p=.741]. A significant two-way interaction was shown for phase x
speed [F(1.85,25.87)=122.79, p<.000] (see Table 9 and Figure 10). The three-way interaction
for phase x speed x feedback [F(4.06,56.88)=.366, p=.835] was not significant. Eta squared, an
indicator of effect size, was .954 and .906 for the significant main effects of phase and speed,
respectively and .898 for the significant two-way interaction. The significant two-way
interaction among the effects of relative phase and increasing speed on standard deviation of
relative phase warrants the rejection of Ho²; therefore, a relationship was shown among relative
phase and increasing frequency or speed for a bimanual coordination task. In contrast, the three-
way interaction among the effects of sensory feedback, relative phase, and speed on standard of
relative phase does not warrant the rejection of Ho¹; therefore, no evidence was shown of a
relationship among sensory feedback, relative phase, and increasing speed for a bimanual
coordination task.
83

Within Subjects Effect SS df MS F p Eta² Phase 12480.68 1.00 12480.68 292.69 <.000** .954 Error (phase) 596.97 14.00 42.64 Speed 9499.16 2.00 4749.58 135.25 <.000** .906 Error (speed) 983.29 28.00 35.12 Feedback 15.59 3.00 5.19 .418 .741 .029 Error (feedback) 522.49 42.00 12.44 Phase x Speed 6250.54 1.85 3382.89 122.79 <.000** .898 Error (phase x speed) 712.62 25.87 27.55 Phase x Feedback .054 3.00 .018 .002 1.00 .000 Error (phase x feedback) 490.94 42.00 11.69 Speed x Feedback 14.95 4.01 3.73 .252 .908 .018 Error (speed x feedback) 830.73 56.13 14.79 Phase x Speed x Feedback 19.54 4.06 4.81 .366 .835 .025 Error (phase x speed x feedback) 747.12 56.88 13.14 N=15
Table 9. Repeated measures ANOVA for phase (i.e., 0º and 180º relative phase patterns), speed (i.e., increasing frequency of oscillation), and feedback (i.e., 4 sensory feedback conditions) on standard deviation of relative phase. N=15 subjects, SS=sum of squares, df =degrees of freedom considering the Huynh-Feldt correction for sphericity, MS=mean square, F=test statistic, and p=significance level, Eta²=an indicator of effect size. The ** indicates a significant within subjects effect.
Significant Main Effect for Phase F(1,14)=292.69, p<.000
0
5
10
15
20
In-Phase Anti-Phase
Relative Phase Patterns
Stan
dard
Dev
iatio
n of
Re
lativ
e Ph
ase
Figure 8. Significant main effect for phase. Standard deviation of relative phase as a function of in-phase (i.e., 0º relative phase pattern) and anti-phase (i.e., 180º relative phase pattern).
84

Significant Main Effect for Speed F(2,28)=135.25, p< .000
0
5
10
15
20
25
Slow 1Hz Medium 2Hz Fast 3Hz
Three Movement Frequencies (Hz) or Speeds
Sta
ndar
d De
viat
ion
of
Rel
ativ
e Ph
ase
Figure 9. Significant main effect for speed. Standard deviation of relative phase as a function of speed or frequency of oscillation (i.e., slow (1Hz), medium (2Hz), and fast (3 Hz)).
Significant Two-Way Interaction for Phase x Speed F(1.85,25.87)=122.79, p< .000
0
5
10
15
20
25
30
35
Slow 1Hz Medium 2Hz Fast 3Hz
Three Movement Frequencies (Hz) or Speeds
Stan
dard
Dev
iatio
n of
Re
lativ
e Ph
ase
In-PhaseAnti-Phase
Figure 10. Significant two-way interaction for phase x speed. Standard deviation of relative phase as a function of speed or frequency of oscillation (i.e., slow (1Hz), medium (2Hz), and fast (3 Hz)) for the 0º in-phase pattern and the 180º anti-phase pattern.
The significant two-way interaction for phase x speed was further analyzed utilizing post
hoc analysis of simple main effects using the Bonferroni correction. Similar, to the post hoc
comparisons for mean error of relative phase, nine total pairings were tested (see Tables 10, 11,
12). Because 18 overall tests were performed, including the 9 post hoc comparisons for mean
error of relative phase and 9 post hoc comparisons for standard deviation of relative phase, the
critical p-value was adjusted to account for the 18 tests (.05/18=.0027, p-value=.0027).
85

Pairwise Comparisons for 0º In-phase Pattern df t p slow versus medium 32 .635 .529
Slow versus fast 32 2.27 .030 medium versus fast 32 1.64 .111
Table 10. Pairwise comparisons for 0º in-phase pattern at slow (1Hz), medium (2Hz), and fast (3Hz) speeds. df=degrees of freedom for the t-distribution, t=test statistic, and p=significance level.
Pairwise Comparisons for 180º Anti-phase Pattern df t p slow versus medium 32 8.64 <.000**
slow versus fast 32 22.12 <.000** medium versus fast 32 13.48 <.000**
Table 11. Pairwise comparisons for 180º anti-phase pattern at slow (1Hz), medium (2Hz), and fast (3Hz) speeds. df=degrees of freedom for the t-distribution, t=test statistic, and p=significance level. The ** indicates a significant pairwise comparison.
Pairwise Comparisons for Phase within a Single Speed df t p 0º versus 180º at slow speed 32 2.19 .035
0º versus 180º at medium speed 32 10.04 <.000** 0º versus 180º at fast speed 32 21.66 <.000**
Table 12. Pairwise comparisons for 0º and 180º relative phase patterns within a single speed; slow (1Hz), medium (2Hz), and fast (3Hz) speeds. df=degrees of freedom for the t-distribution, t=test statistic, and p=significance level. The ** indicates a significant pairwise comparison.
For the 0º in-phase pattern, all pairwise comparisons were not significant suggesting that
the 0º in-phase pattern was produced with the same amount of variability across the slow,
medium, and fast speeds (see Table 10 and Figure 10). For the 180º anti-phase pattern, all the
pairwise comparisons were significant indicating that the variability in performance of the 180º
pattern was influenced by the increasing speed. Specifically, the 180º anti-phase pattern was
produced with more variability as the speed increased (see Table 11 and Figure 10).
For the comparison between 0º and 180º at the slow speed, the pairwise comparison was
not significant [t(32)=2.19, p=.035] (see Table 12). The 0º and the 180º relative phase patterns,
therefore, were produced with the same amount of variability at the slow speed. At the medium
and fast speeds, the pairwise comparisons were significant [t(32)=10.04, p<.000] and
[t(32)=21.66, p<.000], respectively. As the speed increased from medium to fast, the 180º anti-
86

phase pattern was produced with more variability as compared to the 0º in-phase pattern (see
Table 12 and Figure 10).
2.2.3 Summary
In conclusion, data for both mean error of relative phase and standard deviation of
relative phase error failed to provide evidence that Ho¹ should be rejected. Thus, no evidence
was obtained pointing to an interaction among sensory feedback condition, relative phase
pattern, and frequency of bimanual oscillation. Moreover, no evidence was seen of an influence
of feedback condition on bimanual coordination task performance in the present study. This
finding is conceptually at odds with those reported by previous authors, who indicated a role of
feedback in bimanual coordination control (Cardoso de Oliveira & Barthelemy, 2005;
Kazennikov et al., 2002; Serrien & Teasdale, 1996; Swinnen et al., 2000).
In contrast, Ho² was rejected based on the present data set, suggesting that a relationship
does exist between relative phase pattern and frequency of bimanual oscillation. Specifically,
the 180º anti-phase pattern became less accurate and more variable when speed increased. The
0º in-phase pattern was not influenced by the increasing speed and was produced with the same
accuracy and variability at all the speeds. The 0º in-phase pattern, therefore, was more accurate
and more stable than the 180º anti-phase pattern. This finding replicates earlier ones indicating
greater stability associated with the 0º pattern as compared to the 180º pattern (Kelso, 1984;
Scholz & Kelso, 1989, 1990; Tuller & Kelso, 1989).
87
2.3 DISCUSSION
The purpose of Experiment 1 was to investigate the influence of sensory feedback on the
coordination dynamics for an upper limb bimanual coordination task. Although it is generally
acknowledged that sensory feedback is required to fine tune movement patterns (Bonnard &
Pailhous, 1999; Cordo et al., 1995; Ghez & Sainburg, 1995; Jackson et al., 2002; Sainburg et al.,
1993), its role in coordinative dynamics has received less attention. Moreover, recent evidence
has raised the question that dynamic coordinative patterns may be fundamentally influenced by
attention (Monno et al., 2000; Temprado et al., 2002; Temprado et al., 1999; Zanone et al., 2001;
Zanone et al., 1999), perception (Mechsner et al., 2001; Mechsner & Knoblich, 2004) and
sensory feedback (Cardoso de Oliveira & Barthelemy, 2005; Kazennikov et al., 2002; Serrien &
Teasdale, 1996; Swinnen et al., 2000). The visual and auditory feedback conditions, therefore,
were selected to investigate the role of sensory feedback connections on the coordinative
dynamics of the 0º in-phase and the 180º anti-phase patterns.
Overall, results failed to indicate any clear role of visual or auditory feedback for
performance on either the 0º in-phase or the 180º anti-phase movement patterns. One possibility
for that failure is that the study was not adequately conducted to capture such effects. Although
that possibility cannot be excluded, clear results in another corner of the study –regarding effects
of frequency of bimanual oscillation– would seem to dampen the likelihood of it. Increasing
speed of oscillation clearly influenced the performance of the 180º anti-phase pattern, but not the
0º in-phase pattern. As speed increased from slow to fast, the previously stable 180º anti-phase
pattern destabilized, and was performed with increased variability and decreased accuracy. The
0º in-phase pattern, however, remained stable across frequency conditions. These findings
88

replicate those from previous research (Kelso, 1984; Scholz & Kelso, 1989, 1990; Tuller &
Kelso, 1989).
If the equipment and experimental procedures were not responsible for the acceptance of
the null hypothesis for Ho¹, then perhaps an uncontrolled sensory feedback variable influenced
the results. Although visual and auditory feedback was controlled in the present study,
proprioceptive sensory feedback was not controlled. The influence of proprioceptive feedback,
therefore, cannot be ruled out. In fact, the bimanual coordination task using the bimanual linear
slide may not be governed by auditory and visual feedback, but rather by proprioceptive
feedback. Salter and colleagues (2004) suggested that the friction of the bimanual linear slide
and the reversal of movements in the horizontal plane may direct subjects’ attention towards
proprioceptive feedback from the upper limbs rather than visual and auditory feedback (Salter et
al., 2004). In addition, Verschueren and colleagues (1999) suggested that proprioceptive
feedback plays a role in the online monitoring of interlimb coupling for 0º and 180º relative
phase patterns during cyclical bimanual movements in the horizontal plane (Verschueren,
Swinnen, Cordo & Dounskaia, 1999). In contrast, a different bimanual task involving
unidirectional circling movements may rely more on visual feedback rather than proprioceptive
feedback (Mechsner et al., 2001). It seems possible that such discrepancies across studies may
account for the difference in findings
Stated differently, the reliance on visual, auditory, and/or proprioceptive feedback in the
performance of the 0º in-phase and the 180º anti-phase patterns may be task-specific.
Consequently, if the correct feedback mechanism is identified for a given bimanual coordination
task, then its perturbation should affect the performance of the relative phase patterns. Relative
89

to the present study, the question can be asked whether relative phase would have been affected
if proprioceptive feedback had been perturbed.
A study speaking to this possibility was conducted by Serrien and colleagues (1996). In
that study, visual and proprioceptive feedback was varied for a bimanual coordination task
involving the bimanual linear slide. Specifically, those authors manipulated visual and
proprioceptive feedback during the production of 0º in-phase and 180º anti-phase patterns for
young adult subjects (i.e., age rage 20-30 years) and elderly subjects (i.e., age range 66-77 years)
at a slow speed (1 Hz) (Serrien, Teasdale, Bard & Fleury, 1996). To study the reliance on vision,
the researchers manipulated the presence and absence of visual information with translucent
liquid crystal glasses. The control of the opacity of the glasses was manipulated by computer
and nearly instantaneous at the start of each trial. Proprioceptive feedback was varied by 2
electromagnetic vibrators that were secured to the lower arms. Vibratory stimulation was only
provided to the right arm. The vibrators on the left arm served to provide similar weight
conditions for both limbs. The vibratory stimulation activated the primary sensory endings of
the muscle spindles to elicit proprioceptive messages that the central nervous system interpreted
as real movement (Serrien et al., 1996). All of the subjects participated in 4 sensory feedback
conditions: (a) vision and no vibration, (b) vision and vibration, (c) no vision and no vibration,
and (d) no vision and vibration.
Results indicated that the young adult subjects demonstrated a decrease in pattern
stability for the in-phase coordination mode during the no vibration conditions, whereas the in-
phase patterns during the no vibration conditions were not affected for the elderly subjects. Even
though young adults demonstrated a decrease in pattern stability during 0º in-phase coordination
whereas older subjects did not, both groups were sensitive to proprioceptive influences during
90

the 180º anti-phase coordination as demonstrated by decreased pattern stability. This finding led
to the suggestion that the integration of afferent information may have a more prominent
influence in the anti-phase pattern than in the in-phase pattern.
This suggestion was also consistent with a study by Kots and colleagues (1971), who
investigated two-joint arm movements of patients with deafferented distal joints. The authors
observed that with practice the subjects were able to perform the 0º in-phase pattern, whereas the
180º anti-phase pattern was difficult to execute even after practice.
In the study by Serrien and colleagues (Serrien et al., 1996), in addition to proprioceptive
feedback, the role of visual feedback was also evaluated. With no visual feedback of the limbs,
the young subjects produced destabilized in-phase movements, whereas with no visual feedback
the young subjects produced more stable anti-phase patterns. The availability of visual feedback
did not influence the performance of the elderly subjects. This finding from the Serrien and
colleagues (1996) study that no visual feedback destabilized the in-phase pattern and stabilized
the anti-phase pattern in young subjects, stands in direct contrast to findings of the current study
where visual and auditory feedback did not influence the performance of the in- and anti-phase
bimanual coordination patterns. In addition, the 0º in-phase and the 180º anti-phase patterns
were produced with the same stability at the slow speed in the current study, but the Serrien and
colleagues (1996) study reported that the in-phase and anti-phase patterns were produced with
different stability measures at the slow speed. Findings from the present study, however, were
more consistent with widely reported effects demonstrating stability of both the 0º in-phase and
the 180º anti-phase patterns at the slow speed (Kelso, 1984; Scholz & Kelso, 1989, 1990; Tuller
& Kelso, 1989).
91

The discrepancy in findings across the present study and the one reported by Serrien and
colleagues (1996) may be related to two factors. First, in the study by Serrien and colleagues
(1996), the combination of the proprioceptive and the visual feedback may have influenced the
subjects’ ability to integrate sensory information in a much different way as compared to the
auditory and visual feedback combination in the present study. In fact, auditory feedback was
not controlled in the study by Serrien and colleagues (1996). Second, visual feedback in the
study by Serrien and colleagues (1996) was controlled by the opacity of glasses worn by the
subject, whereas the visual feedback in the current study was manipulated by controlling the
lights in the room and thus absolute visibility. The opacity of the glasses could have provided an
additional distraction that influenced performance rather than visual feedback. Specifically, the
opaque glasses only masked visual input in the study by Serrien and colleagues (1996), and
based on the write-up, it cannot be excluded that subjects were able to see clearly above and
below the glasses. In contrast, vision was totally obscured by the control of all light sources in
the present study.
These discrepancies between the study by Serrien and colleagues (1996) and the current
study could be pursued with appropriately designed studies. Of equal or greater interest is the
pursuit of questions regarding the role of proprioceptive feedback on the coordination dynamics
of a bimanual linear slide task. Future studies should be conducted to further explore such
questions. Proprioceptive feedback could be disrupted by adding vibratory stimulation to one or
both of limbs, and perhaps healthy subjects as well as age-matched subjects with disordered
proprioceptive feedback loops could be evaluated for the task. Another option would be to
identify a methodology for achieving a complete block of limb proprioception for the duration of
the experiment. In sum, although the present study failed to show any clear role of sensory
92

feedback on the bimanual coordination task, the role of visual, auditory, and proprioceptive
feedback on the performance of coordination dynamics, as a function of specific task, remains an
important question for continued research.
2.3.1 Limitations
The major limitation of the current study was that proprioceptive feedback was not
considered in the experimental design. It is not clear if the results of the study were related to
real findings or if they were influenced by uncontrolled proprioceptive feedback. The study
should be performed again with control of visual, auditory, and proprioceptive feedback.
A second limitation concerns the ability to generalize to other populations beyond those
studies. As was noted, the subject pool consisted of young females. Thus, results cannot be
generalized to children, males, or geriatric females. Clearly, the study should be replicated with
other populations.
A third limitation is that the study of sensory feedback in coordinative tasks should be
extended to other domains, beyond bimanual limb coordination. Such extension is the focus of
the second study described next.
93

3.0 CHAPTER 3: EXPERIMENT 2
3.1 RESEARCH METHODS
3.1.1 Purpose
The purpose of Experiment 2 was to assess the influence of (i) auditory feedback (i.e.,
normal auditory feedback versus masked auditory feedback by speech noise), (ii) voice quality
(i.e., breathy, normal, and pressed voice qualities), (iii) increasing fundamental frequency (i.e.,
220Hz, 277Hz, 349Hz, 440Hz, 554Hz, 698Hz, and 880Hz), and (iv) their interactions on motor
performance for a voice coordination task.
3.1.2 Participants
Subjects were 21 vocally trained adult females, ages 18-35 years. Three of the 18
subjects had a mean age of 29 years and had 15 years or more of singing of experience that
included private, classical voice training, choral singing, and solo singing on the stage. The rest
of the 18 subjects had a mean age of 20 years and had at least 3 years of choral singing only.
The sample size of 21 subjects was based on an anticipated large main effect between the
“normal auditory feedback” and the “masked auditory feedback by speech noise” sensory
feedback conditions at a 0.6 between conditions correlation coefficient. One rationale for
limiting the study to females was to minimize the variability in the data for the voice task, as
94

voicing characteristics including aerodynamic ones used in the present study may differ sharply
across the genders (Holmberg, Hillman & Perkell, 1988). In addition, the laryngeal resistance
values perceptually equivalent to breathy, normal, and pressed voice qualities used in the current
voice study were based on vocally, trained females and it was unknown if the laryngeal
resistance values would be maintained across genders and even across trained and untrained
voice users (Grillo & Verdolini, in preparation). A further rationale for using females was
clinical. Females are generally more susceptible to voice problems (for example; Russell, Oates
& Greenwood, 1998; Miller & Verdolini, 1995). If the present research leads to investigations
of clinical populations, the recruitment of females was most sensible.
Subjects were in general good health with self-report of normal hearing, with no current
history of a voice disorder by their report and no evidence of voice abnormality on the day of
testing, as judged by a licensed speech-language pathologist specialized in voice. Subjects
matched the pitches of 220Hz, 277Hz, 349Hz, 440Hz, 554Hz, 698Hz, and 880Hz while
sustaining an /a/ for 2 seconds as assessed by the speech-language pathologist. In addition,
subjects enrolled in the study said they felt comfortable producing the target voice qualities over
several trials at 880Hz. Pregnant females were excluded from the study because pregnancy may
alter the coordination dynamics of the voice production system. Following appropriate
Institutional Review Board approved procedures, subjects were recruited within the greater
Pittsburgh community using flyers distributed through voice teachers and coaches as well as the
Heinz Chapel Choir and the Greater Pittsburgh Bach Festival Choir.
95

3.1.3 Equipment and Software
The experimental set-up for Experiment 2 is presented in Figure 11. Aerodynamic data
was captured using a Rothenberg (1973) circumferentially vented face mask manufactured by
Glottal Enterprises with attached airflow and pressure transducers designed by Neil Szuminsky,
Engineering Consultant. A microphone (Audio-Technica, ATR35s with a frequency response of
50-18,000 Hz) was inserted and secured by a plastic stopper into the open end of the face mask
to record fundamental frequency and intensity. The microphone communicated to a Compaq
Presario R3000 laptop computer via a Sound Blaster Audigy 2 ZS sound card with
192kHz/104dB signal-to-noise clarity. The pressure and flow transducers communicated via the
data translation device (DT BNC Box USB 9800 series) to the laptop computer with a custom
software program called Pressure Feedback that ran the experiment. A Casio CTK-491
keyboard was used to provide the specific pitch before each trial. Attached to the laptop running
the experiment was a Dell flat screen monitor, which provided online feedback of fundamental
frequency and intensity. The speech noise, low passed filtered with a frequency spectrum equal
to the long-term average spectrum of speech (-12 dB per octave with cut-off frequency at 1
kHz), was used for the masked auditory feedback condition. The speech noise was delivered by
a GSI Clinical Audiometer manufactured by WelchAllyn via Optimus Pro-155 stereo supra-
aural headphones at an intensity of 95 dBSPL.
The software program that ran the experiment featured a calibration function and an
experiment function. Relative to calibration, the equipment was calibrated for aerodynamic
functions prior to each day’s data collection using a Micro Tronics U2 manometer for pressure
calibration and a Glottal Enterprises pneumotach calibration unit for airflow. Acoustic
calibration was completed before data collection began using a sound level calibrator (General
96

Radio Company Type 1562A) at 500Hz. Acoustic calibration of the microphone was set at 114
dBSPL considering the close proximity of the microphone to the subjects’ mouth. The pressure
transducer’s plastic, intraoral tubing used to capture intraoral pressure signals was changed
before every subject after the flow head was cleaned with alcohol. The experiment function of
the software program guided the experiment’s timing, provided subjects online feedback of
fundamental frequency and intensity, and calculated laryngeal resistance (i.e., subglottic pressure
divided by average airflow cmH20/l/s), fundamental frequency, and intensity for use in later data
analysis.
Figure 11. The experimental set-up for Experiment 2, the voice study.
97

3.1.4 Experimental Design
The experiment used a three-way, within-subjects repeated measures design. The 3
independent variables were: (1) voice quality (i.e., breathy, normal, and pressed), (2) increasing
fundamental frequency (i.e., 220Hz, 277Hz, 349Hz, 440Hz, 554Hz, 698Hz, and 880Hz), and (3)
sensory feedback conditions (i.e., normal auditory feedback versus masked auditory feedback by
speech noise). The dependent variables were mean of laryngeal resistance (cmH2O/l/s) and
standard deviation of laryngeal resistance (cmH2O/l/s) at each fundamental frequency. For
experimental trials, order of voice coordination pattern and feedback condition was randomly
determined within and across subjects (see Table 13).
98

Subject Number Sensory Feedback Voice Quality 1 12 123 2 21 231 3 21 312 4 12 123 5 12 132 6 12 231 7 21 321 8 12 132 9 21 321 10 21 132 11 12 123 12 12 132 13 21 312 14 21 213 15 21 312 16 12 321 17 21 312 18 12 213 19 21 312 20 21 132 21 21 231
Table 13. Order of the sensory feedback conditions and voice coordination patterns for the 21 subjects. For sensory feedback, 1= normal auditory feedback and 2= masked auditory feedback only. For voice quality, 1= normal voice, 2= breathy voice, and 3= pressed voice.
3.1.5 Procedures
Following informed consent, subjects completed screening procedures. For screening,
subjects answered questions pertaining to age, years and type of vocal training, hearing acuity,
and the possibility of being pregnant. In addition, subjects matched pitches while sustaining an
/a/ for 2 seconds across the target fundamental frequencies; 220Hz, 277Hz, 349Hz, 440Hz,
554Hz, 698Hz, and 880Hz. Twenty-one subjects participated in screening procedures and all
were enrolled in the study.
After passing the screening, subjects were oriented to the voice qualities and the target
utterance for approximately 5 minutes. Subjects were introduced to the 3 different voice
99

qualities, breathy, normal, and pressed by way of a brief verbal description and demonstration by
the experimenter on the target consonant-vowel syllable string (/pi pi pi pi pi/). The
experimenter provided exemplars and verbal descriptions of pressed, normal, and breathy voice
qualities on the /i/ vowel, based on published descriptions of the voice types (Alku & Vilkman,
1996; Peterson et al., 1994) and extensive personal experience. Briefly, pressed voice was
demonstrated and described as an extremely high effort phonation mode, with the perception of
an almost completely closed airway, as if pushing. Normal voice was demonstrated and
described as a spontaneous voicing mode without any attempts to manipulate usual voice
production. Breathy voice was demonstrated and described as easy phonation, characterized by
auditory air escapage during phonation, with the vocal folds more abducted than adducted.
Subjects were then asked to practice producing the voice qualities on the target consonant-vowel
syllable string /pi pi pi pi pi/ at 277Hz and at 554Hz. Although subjects had been provided with
exemplars of each of the voice qualities, subjects were instructed to produce their own versions
of the qualities for each utterance.
Following introduction of the voice qualities and the target utterance, subjects were
oriented to the task. The task involved placing a vented mask firmly over the mouth and nose,
and positioning plastic tubing connected to the pressure transducer intraorally, avoiding
blockage of the tube by the tongue. A strap was placed around the subject’s head and tightened
to secure a tight seal with the subject’s face. After the experimenter checked the mask
positioning to verify the seal, the subject was trained to produce a five-syllable consonant-vowel
syllable string (/pi pi pi pi pi/) at an approximate rate of 88 beats per minute (Holmberg et al.,
1988). Output intensity, in dB, was intended to be held constant within subjects, based on initial
calibrating trials to identify spontaneous comfortable intensity for each individual (Grillo &
100

Verdolini, in preparation). Fundamental frequency began at 220 Hz and increased in Major 3rd
increments until 880 Hz was achieved for each voice quality. The fundamental frequency
plateaus were 220 Hz, 277 Hz, 349 Hz, 440 Hz, 554 Hz, 698 Hz, and 880 Hz.
Frequency and intensity were monitored by the experimenter from computer screen
displays. Fundamental frequency targets (+/- 10Hz from the intended frequency) were met for
all frequencies except 880Hz under normal auditory feedback and 698Hz and 880Hz under
masked auditory feedback. Intensity targets (i.e., +/-1dB from a comfortable intensity),
however, were not met. The challenge of maintaining a constant, predetermined comfortable
intensity that was based on a conversational pitch was simply too challenging for subjects, and it
is moreover reasonable that this part of the task should have been challenging, given the known
covariance of fundamental frequency and intensity (Debruyne & Buekers, 1998; Klingholz,
1992; Titze, 2000; Titze & Sundberg, 1992). The challenge around maintaining a comfortable
intensity level for all trials was further increased by the introduction of masking, due to the
Lombard effect (Ferrand, 2005; Garbe, Siegel & Pick, 1976). In light of these difficulties,
subjects were encouraged to focus more on pitch (i.e., fundamental frequency) criteria as
opposed to intensity targets during task production.
When subjects were finished being oriented to the task, they proceeded to experimental
trials which involved repeated /pi pi pi pi pi/ trials. Each experimental trial involved 3 /pi pi pi pi
pi/ sequences. Each of the 3 repetitions was separated by a 1-sec rest for a total time of 12-13
seconds for a complete trial. The first fundamental frequency of 220Hz was played on the
keyboard and then the subject screen indicated “GO” for the initiation of the trial. After
completion of the trial at 220Hz, the same required voice quality was repeated at 277Hz and
101

subsequently 349Hz and so on until 880Hz was reached. Subjects received a 15-second rest
between successive trials, and a 2-min rest before switching to the next voice quality target.
Subjects were encouraged to maintain the target pattern as best as possible throughout all
trials. If the pattern destabilized, subjects were instructed to recapture it even mid-trial. Voice
quality targets were randomized within and across subjects with the constraint that all subjects
performed one voice quality target from 220 Hz to 880 Hz before moving to the next voice
quality target (see Table 13). Subjects received online feedback from the computer regarding
their ability to satisfy fundamental frequency and intensity criteria (+/-10 Hz for fundamental
frequency, +/-1 dB for intensity). Feedback was presented in the form of a bar graph indicating
the fundamental frequency and the intensity level target with the subject’s actual production
superimposed on the target. During the experiment, subjects did not receive computer-generated
feedback related to the voice qualities and laryngeal resistance because the performance
feedback may have influenced learning and confounded the results of the sensory feedback
condition.
In addition to experimental trials just described, subjects also participated in two sensory
feedback conditions: “auditory feedback” and “masked auditory feedback”. The order of the
sensory feedback condition was randomized within and across subjects (see Table 13). In the
normal auditory feedback condition, subjects heard their voice productions with no interference.
In the masked auditory feedback condition, subjects received speech noise presented to their ears
via supra-aural headphones at 95 dBSPL in an effort to block out the subject’s ability to hear
their own voice. As determined during piloting of the experimental set-up, the intensity level of
the speech noise masker was effective in masking voice without causing discomfort to the
subjects. The speech noise was low passed filtered with a frequency spectrum equal to the long-
102

term average spectrum of speech (-12 dB per octave with cut-off frequency at 1 kHz) and was
equivalent to the standardized noise typically used for masking speech (IEC, 1979). In brief,
low-pass filtered speech noise effectively masks bone conduction because bone conduction
predominantly transmits low frequencies (Natke & Kalveram, 2001). There was no simple way
of physically measuring the effectiveness of bone conduction; therefore, the experimenter relied
on the subjects’ observations as to whether or not they could hear their voice productions (Natke
& Kalveram, 2001). In addition, large, cup-like supra-aural headphones were used to minimize
transmission of the air-conducted signal (Kiran & Larson, 2001).
3.1.6 Data Reduction
Data reduction involved several steps, which were automatized using custom-made
software (Szuminsky, Engineering Consultant). Subglottic pressures were estimated from oral
pressures for each trial using custom software that obtained the interpolated pressure between
pressure peaks 2 and 3, 3 and 4, and 4 and 5 for each /pi pi pi pi pi/ string, as well as the time-
locked average flow for those syllables, fundamental frequency, and intensity level. Laryngeal
resistance (i.e., subglottic pressure divided by average airflow, cmH20/l/s) was calculated from
the combination of the estimated subglottic pressure value and subsequent average airflow value
between peaks 2 and 3, 3 and 4, 4 and 5 for each /pi pi pi pi pi/ string. Summary files were
generated by the software program that indicated means and standard deviations of laryngeal
resistance, fundamental frequency, and intensity. Similar to the data reduction approach in
Experiment 1 on bimanual coordination, the mean of laryngeal resistance and standard deviation
of laryngeal resistance were calculated for each fundamental frequency trial. Mean of laryngeal
resistance and standard deviation of laryngeal resistance were used in statistical analyses.
103

For Experiment 1, mean error of relative phase was used as a dependent variable because
subjects were required to produce 2 numeric standards of 0º relative phase and 180º relative
phase. For Experiment 2, subjects were required to produce perceptual standards of laryngeal
resistance not numeric standards of laryngeal resistance, so mean error of laryngeal resistance
could not be calculated. Thus, mean of laryngeal resistance and standard deviation of laryngeal
resistance were used in data analysis.
3.1.7 Statistical Analysis
Statistical analyses were guided by the study’s purpose. The purpose of Experiment 2
was to extend the inquiry of motor control beyond the typical bimanual coordination domain, as
demonstrated in Experiment 1, to a task that required respiratory and laryngeal coordination for
the production of voice. Specifically, Experiment 2 investigated the role of sensory feedback
(i.e., audition) on the coordination dynamics of a voice task involving laryngeal resistance (i.e.,
subglottic pressure divided by average airflow, cmH20/l/sec).
A three-way, repeated measures analysis of variance (ANOVA) was conducted on each
of the dependent variables. The independent variables were the sensory feedback conditions
(i.e., normal auditory feedback versus masked auditory feedback by speech noise), voice
qualities (i.e., breathy, normal, and pressed), and increasing fundamental frequency or pitch (i.e.,
220Hz, 277Hz, 349Hz, 440Hz, 554Hz, 698Hz, and 880Hz). The dependent variables were the
mean laryngeal resistance and the standard deviation of laryngeal resistance. Significance level
was set at α = .05 and post hoc simple main effects were analyzed using the Bonferroni
correction. The ANOVAs were used to test the following two statistical hypotheses (Ho):
104

1. Ho¹: There is no significant interaction among the effects of 2 sensory feedback
conditions (i.e., normal auditory feedback versus masked auditory feedback by
speech noise), 3 voice qualities (i.e., breathy, normal, and pressed), and increasing
fundamental frequency or pitch (i.e., 220Hz, 277Hz, 349Hz, 440Hz, 554Hz,
698Hz, and 880Hz) on mean laryngeal resistance and/or standard deviation of
laryngeal resistance.
2. Ho²: There is no significant interaction among the effects of 2 sensory feedback
conditions (i.e., normal auditory feedback versus masked auditory feedback by
speech noise) and 3 voice qualities (i.e., breathy, normal, and pressed) on mean
laryngeal resistance and/or standard deviation of laryngeal resistance.
105
3.2 RESULTS
Similar to Experiment 1, the following assumptions were applied to the within-subjects
repeated measures design: (1) sphericity, (2) normality, and (3) independence by random order
of the design. To correct for sphericity, the Huynh-Feldt (1970) correction was used for all tests.
The normality assumption was met for some of the mean and standard deviation values, but not
for all. Non-normality, however, has very little effect on the level of significance and the power
of the F-test in the analysis of variance (ANOVA) when considering non-directional tests (Glass
and Hopkins, 1996). Thus, the data were not adjusted for normality. It is more important to
meet the assumption of independence by random order of the design as its violation may
seriously affect the level of significance and the power of the F-test (Glass and Hopkins, 1996).
(3) The assumption of independence by random order of the design was met by the random order
of the 2 sensory feedback conditions and the 3 voice patterns. Alpha was set at .05 for all
analyses and adjusted appropriately for the number of post hoc comparisons.
Data from 18 out of the total 21 subjects were used in the ANOVAs. Stem and leaf plots
of the data indicated that subjects 17, 19, and 20 (i.e., 3 total) had mean and standard deviation
values that were extreme outliers as a function of all 3 independent variables. The consistent
extreme outliers for the 3 subjects may be explained by their level of vocal expertise and also by
their age. Subjects 17, 19, and 20 all had 15 years and more of vocal experience which involved
private, classical vocal training, singing in choirs, and solo singing on the stage. Conversely, the
rest of the 18 subjects had at least 3 years of choral singing experience with no private, vocal
training. The 3 subjects were older (e.g., mean age of 29) as compared to the 18 subjects (e.g.,
mean age of 20) and arguably had more time to focus on vocal training. In addition, subject 17
had a difficult time achieving a tight seal between the airflow mask and the arch of the nose. The
106

extremely elevated mean and standard deviation values for subject 17, therefore, may also be
related to airflow escaping around the mask causing invalid airflow data. Even with a tight seal
between the arch of the nose and the airflow mask, subjects 19 and 20 had elevated means and
standard deviations of laryngeal resistance that were consistent with subject 17. After analysis of
the data, subjects 17, 19, and 20 performed extremely differently from the other 18 subjects;
therefore, data from subjects 17, 19, and 20 were excluded from the ANOVAs. Mean and
standard deviation values of the 3 subjects excluded from the ANOVAs will be analyzed
descriptively later on in the results section.
The results that follow indicate findings for (1) analysis of laryngeal resistance values
compared to previous data, (2) analysis of fundamental frequency and intensity targets, (3)
standard deviation of laryngeal resistance, (4) mean of laryngeal resistance, and (5) descriptive
analysis of subjects 17, 19, and 20.
3.2.1 Analysis of Laryngeal Resistance Values Compared to Previous Data
In a prior study, Grillo and Verdolini (in preparation) demonstrated that laryngeal
resistance (i.e., subglottic pressure divided by average airflow cmH20/l/sec) was able to
distinguish the voice qualities of breathy, normal, and pressed in a cohort of trained adult female
vocalists. The conclusion was that laryngeal resistance was a valid measure that reflected the
synergistic relations among the respiratory and laryngeal subsystems of voice production.
Results from the study by Grillo and Verdolini (in preparation) established sample means and
95% confidence intervals that could cover the population parameter of µ for breathy, normal, and
pressed voice qualities by laryngeal resistance (cmH20/l/sec) (see Table 14). In the current
study, the means and the 95% confidence intervals for each voice quality were similar to the
107
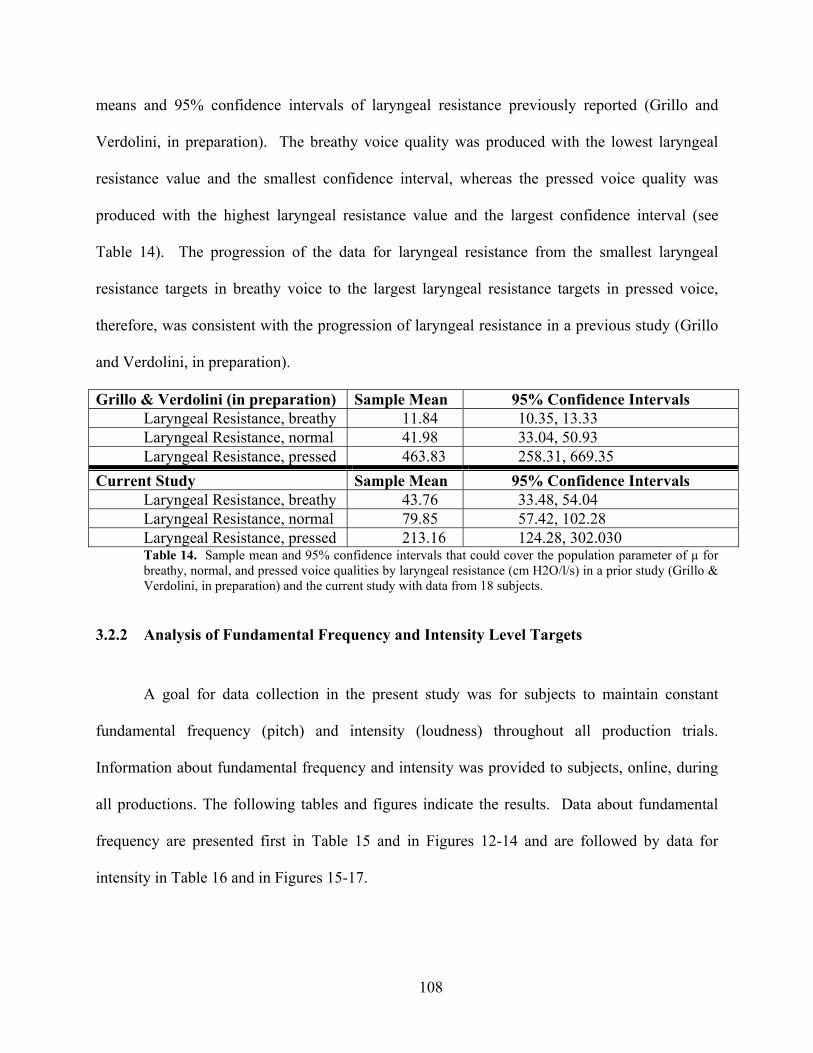
means and 95% confidence intervals of laryngeal resistance previously reported (Grillo and
Verdolini, in preparation). The breathy voice quality was produced with the lowest laryngeal
resistance value and the smallest confidence interval, whereas the pressed voice quality was
produced with the highest laryngeal resistance value and the largest confidence interval (see
Table 14). The progression of the data for laryngeal resistance from the smallest laryngeal
resistance targets in breathy voice to the largest laryngeal resistance targets in pressed voice,
therefore, was consistent with the progression of laryngeal resistance in a previous study (Grillo
and Verdolini, in preparation).
Grillo & Verdolini (in preparation) Sample Mean 95% Confidence Intervals Laryngeal Resistance, breathy 11.84 10.35, 13.33 Laryngeal Resistance, normal 41.98 33.04, 50.93 Laryngeal Resistance, pressed 463.83 258.31, 669.35
Current Study Sample Mean 95% Confidence Intervals Laryngeal Resistance, breathy 43.76 33.48, 54.04 Laryngeal Resistance, normal 79.85 57.42, 102.28 Laryngeal Resistance, pressed 213.16 124.28, 302.030 Table 14. Sample mean and 95% confidence intervals that could cover the population parameter of µ for breathy, normal, and pressed voice qualities by laryngeal resistance (cm H2O/l/s) in a prior study (Grillo & Verdolini, in preparation) and the current study with data from 18 subjects.
3.2.2 Analysis of Fundamental Frequency and Intensity Level Targets
A goal for data collection in the present study was for subjects to maintain constant
fundamental frequency (pitch) and intensity (loudness) throughout all production trials.
Information about fundamental frequency and intensity was provided to subjects, online, during
all productions. The following tables and figures indicate the results. Data about fundamental
frequency are presented first in Table 15 and in Figures 12-14 and are followed by data for
intensity in Table 16 and in Figures 15-17.
108

As demonstrated in Table 15 and Figures 12-14, subjects met the target fundamental
frequency criteria (i.e., +/-10Hz from the target Fo) across the 3 voice qualities for frequencies
220Hz, 277Hz, 349Hz, 440Hz, 554Hz, and 698Hz –but not for 880Hz– under the normal
auditory feedback condition. In the masked auditory feedback condition, subjects met the
fundamental frequency criteria across the 3 voice qualities for all the frequencies except 698Hz
and 880Hz. Considering the semitone pitch range, however, frequency targets were met for all
frequencies across both of the sensory feedback conditions. For the two highest frequency
targets, the semitone pitch range is 830.6-932.3Hz for 880Hz and 659.3-740.0Hz for 698Hz.
Thus, the 2 highest frequencies produced by the subjects across normal and masked auditory
feedback were within the semitone pitch range (see Table 15).
Target Pitch & Normal Feedback
Breathy Normal Pressed Target Pitch & Masked Feedback
Breathy Normal Pressed
220 220.88 219.76 221.43 220 220.01 224.39 223.29 277 277.26 277.96 274.82 277 276.05 277.51 275.22 349 348.89 347.93 350.08 349 347.19 350.11 350.49 440 440.39 439.62 438.70 440 442.67 437.16 436.97 554 554.97 557.06 557.14 554 554.77 552.62 548.23 698 688.07 696.82 699.11 698 683.07 684.76 672.93 880 866.64 867.78 856.76 880 837.30 843.22 841.36
Table 15. Means of fundamental frequency (Hz) for each voice coordination pattern at the target 7 fundamental frequencies (Hz) under normal auditory feedback and masked auditory feedback for 18 subjects.
109

Breathy Voice
0
200
400
600
800
1000
220Hz 277Hz 349Hz 440Hz 554Hz 698Hz 880Hz
Seven Target Fundamental Frequencies or Pitches
Mea
n Fu
ndam
enta
l Fr
eque
ncie
s
Normal Auditory FeedbackMasked Auditory Feedback
Figure 12. Breathy voice produced at the seven target fundamental frequencies (Hz) under normal and masked auditory feedback conditions. Mean fundamental frequencies (Hz) produced by the 18 subjects as a function of the seven target fundamental frequencies (Hz) for normal and masked auditory feedback.
Normal Voice
0
200
400
600
800
1000
220Hz 277Hz 349Hz 440Hz 554Hz 698Hz 880Hz
Seven Target Fundamental Frequencies or Pitches
Mea
n Fu
ndam
enta
l Fr
eque
ncie
s
Normal Auditory FeedbackMasked Auditory Feedback
Figure 13. Normal voice produced at the seven target fundamental frequencies (Hz) under normal and masked auditory feedback conditions. Mean fundamental frequencies (Hz) produced by the 18 subjects as a function of the seven target fundamental frequencies (Hz) for normal and masked auditory feedback.
110

Pressed Voice
0100200300400500600700800900
220Hz 277Hz 349Hz 440Hz 554Hz 698Hz 880Hz
Seven Target Fundamental Frequencies or Pitches
Mea
n Fu
ndam
enta
l Fr
eque
ncie
s
Normal Auditory FeedbackMasked Auditory Feedback
Figure 14. Pressed voice produced at the seven target fundamental frequencies (Hz) under normal and masked auditory feedback conditions. Mean fundamental frequencies (Hz) produced by the 18 subjects as a function of the seven target fundamental frequencies (Hz) for normal and masked auditory feedback.
Regarding results for intensity, a well-known effect is that as fundamental frequency
increases, intensity level also increases (Debruyne & Buekers, 1998; Klingholz, 1992; Titze,
2000; Titze & Sundberg, 1992). In addition, the Lombard effect describes the familiar
phenomenon that voice intensity tends to increase under noise conditions – or masking (Ferrand,
2005; Garbe, Siegel & Pick, 1976). In the present study, subjects produced utterances over a
two-octave fundamental frequency range. If the target intensity had been established for each
subject at the outset of the study as a high intensity, there might have been some chance that
subjects could have maintained a constant intensity across trials. The fact that a “comfortable”
intensity was established as the target; however, virtually guaranteed that subjects would fail to
consistently produce that intensity at higher frequencies. In fact, phonetogram data show that
both minimum and maximum intensities tend to be considerably larger for high as compared to
low fundamental frequencies (Klingholz, 1992). This feature of the experiment is admittedly a
design flaw, which was aggravated by the Lombard effect as 95 dBSPL speech noise masking
was introduced.
111

Even though subjects were unable to hold intensity level constant (i.e., +/-1dB around a
comfortable intensity level), the mean intensity level appeared to remain consistent across the 3
voice qualities with a gradual increase in intensity as fundamental frequency increased (see
Table 16). In addition, the masked auditory feedback condition for all 3 voice qualities
facilitated an increase in intensity level as compared to the normal auditory feedback condition
(see Figures 15-17). The changes in intensity level across each of the voice qualities, therefore,
appeared to be related to the increase in fundamental frequency and the specific sensory
feedback condition rather than the voice qualities themselves.
Target Pitch & Normal Feedback
Breathy Normal Pressed Target Pitch & Masked Feedback
Breathy Normal Pressed
220 104.40 102.53 99.45 220 107.06 108.28 105.35 277 105.98 105.53 103.57 277 109.53 109.08 107.22 349 109.74 112.71 111.20 349 113.31 115.86 113.19 440 114.24 118.23 117.78 440 117.78 116.51 119.55 554 119.41 123.58 120.98 554 125.81 129.62 123.71 698 121.11 127.37 123.44 698 131.36 136.74 130.83 880 125.82 129.44 124.64 880 137.68 140.28 133.81
Table 16. Means of intensity level (dBSPL) for each voice coordination pattern at the target 7 fundamental frequencies (Hz) under normal auditory feedback and masked auditory feedback for 18 subjects.
112
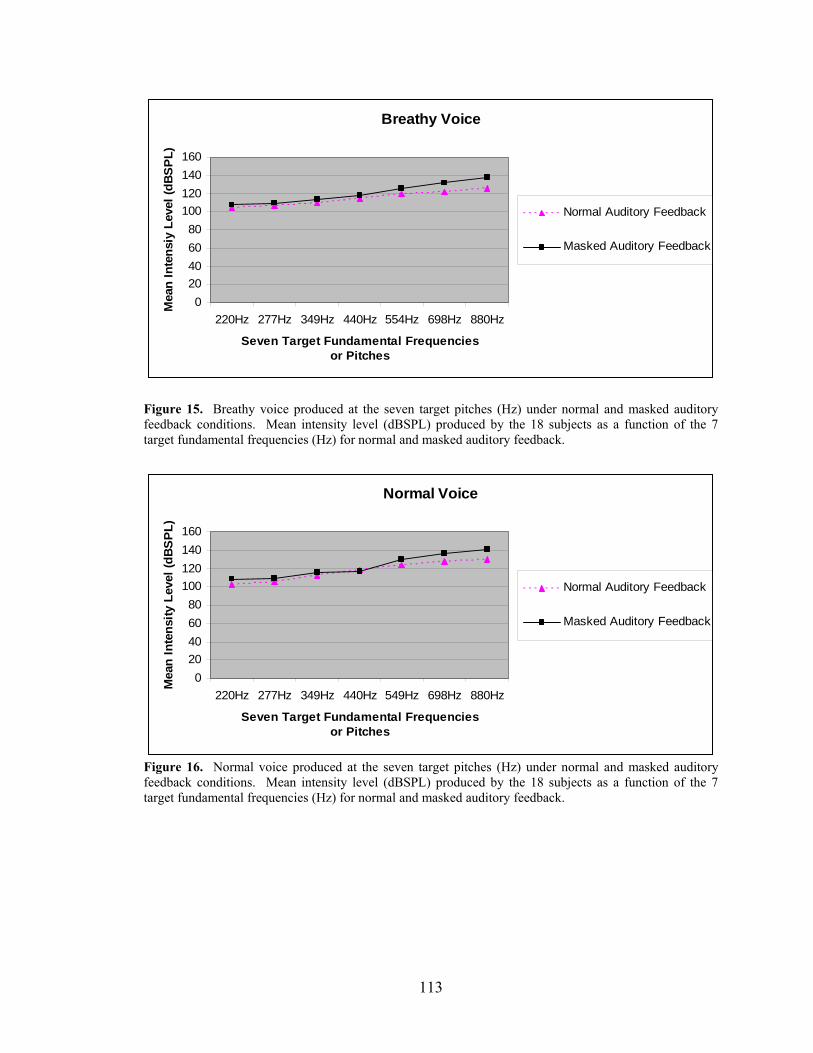
Breathy Voice
020406080
100120140160
220Hz 277Hz 349Hz 440Hz 554Hz 698Hz 880Hz
Seven Target Fundamental Frequencies or Pitches
Mea
n In
tens
iy L
evel
(dBS
PL)
Normal Auditory Feedback
Masked Auditory Feedback
Figure 15. Breathy voice produced at the seven target pitches (Hz) under normal and masked auditory feedback conditions. Mean intensity level (dBSPL) produced by the 18 subjects as a function of the 7 target fundamental frequencies (Hz) for normal and masked auditory feedback.
Normal Voice
020406080
100120140160
220Hz 277Hz 349Hz 440Hz 549Hz 698Hz 880Hz
Seven Target Fundamental Frequencies or Pitches
Mea
n In
tens
ity L
evel
(dBS
PL)
Normal Auditory Feedback
Masked Auditory Feedback
Figure 16. Normal voice produced at the seven target pitches (Hz) under normal and masked auditory feedback conditions. Mean intensity level (dBSPL) produced by the 18 subjects as a function of the 7 target fundamental frequencies (Hz) for normal and masked auditory feedback.
113

Pressed Voice
020406080
100120140160
220Hz 277Hz 349Hz 440Hz 549Hz 698Hz 880HzSeven Target Fundamental Frequencies
or Pitches
Mea
n In
tens
ity L
evel
(dBS
PL)
Normal Auditory Feedback
Masked Auditory Feedback
Figure 17. Pressed voice produced at the seven target pitches (Hz) under normal and masked auditory feedback conditions. Mean intensity level (dBSPL) produced by the 18 subjects as a function of the 7 target fundamental frequencies for normal and masked auditory feedback.
3.2.3 Dependent Variable: Standard Deviation of Laryngeal Resistance
Results for standard deviation of laryngeal resistance are shown in Table 17 and in
Figures 18-22. Overall, standard deviation of laryngeal resistance was greatest for the pressed
voice quality as compared to the breathy and normal voice qualities suggesting that the pressed
voice quality is inherently unstable. In addition, standard deviation of laryngeal resistance was
increased in the masked auditory feedback condition as compared to the normal auditory
feedback condition. The variability in performance of the 3 voice qualities, therefore, did vary
with feedback condition.
The ANOVA for standard deviation of laryngeal resistance revealed significant main
effects for quality [F(1.03,17.50)=6.98, p=.016] and feedback [F(1,17)=6.04, p=.025] (see Table
17 and Figures 18 and 19). The main effect for pitch [F(1.79,30.44)=.869, p=.419] was not
significant. Neither the two-way interaction for quality x feedback [F(1.07,18.19)=3.59, p=.072]
114
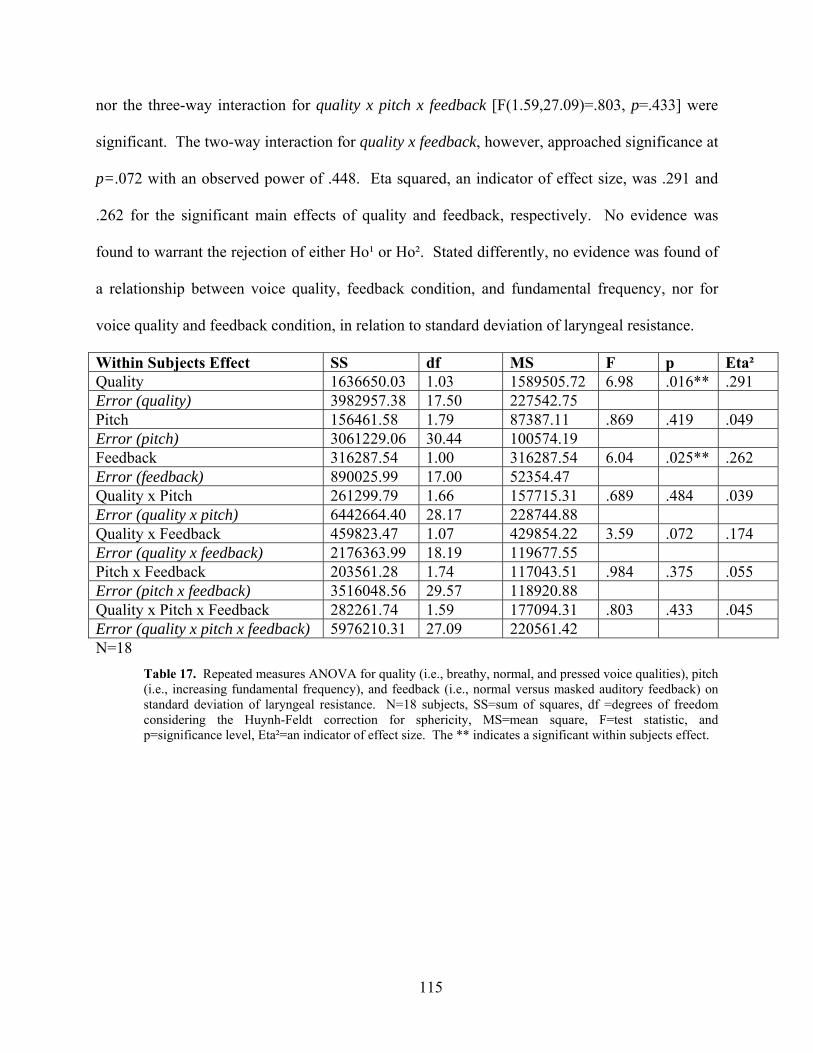
nor the three-way interaction for quality x pitch x feedback [F(1.59,27.09)=.803, p=.433] were
significant. The two-way interaction for quality x feedback, however, approached significance at
p=.072 with an observed power of .448. Eta squared, an indicator of effect size, was .291 and
.262 for the significant main effects of quality and feedback, respectively. No evidence was
found to warrant the rejection of either Ho¹ or Ho². Stated differently, no evidence was found of
a relationship between voice quality, feedback condition, and fundamental frequency, nor for
voice quality and feedback condition, in relation to standard deviation of laryngeal resistance.
Within Subjects Effect SS df MS F p Eta² Quality 1636650.03 1.03 1589505.72 6.98 .016** .291 Error (quality) 3982957.38 17.50 227542.75 Pitch 156461.58 1.79 87387.11 .869 .419 .049 Error (pitch) 3061229.06 30.44 100574.19 Feedback 316287.54 1.00 316287.54 6.04 .025** .262 Error (feedback) 890025.99 17.00 52354.47 Quality x Pitch 261299.79 1.66 157715.31 .689 .484 .039 Error (quality x pitch) 6442664.40 28.17 228744.88 Quality x Feedback 459823.47 1.07 429854.22 3.59 .072 .174 Error (quality x feedback) 2176363.99 18.19 119677.55 Pitch x Feedback 203561.28 1.74 117043.51 .984 .375 .055 Error (pitch x feedback) 3516048.56 29.57 118920.88 Quality x Pitch x Feedback 282261.74 1.59 177094.31 .803 .433 .045 Error (quality x pitch x feedback) 5976210.31 27.09 220561.42 N=18
Table 17. Repeated measures ANOVA for quality (i.e., breathy, normal, and pressed voice qualities), pitch (i.e., increasing fundamental frequency), and feedback (i.e., normal versus masked auditory feedback) on standard deviation of laryngeal resistance. N=18 subjects, SS=sum of squares, df =degrees of freedom considering the Huynh-Feldt correction for sphericity, MS=mean square, F=test statistic, and p=significance level, Eta²=an indicator of effect size. The ** indicates a significant within subjects effect.
115

In Figure 18, the pressed voice pattern had the largest standard deviation in performance
as compared to the breathy and normal voice patterns perhaps indicative of its inherent
instability. The breathy and the normal voice qualities appeared to be more stable with smaller
standard deviations.
Significant Main Effect for Quality F(1.03,17.50)=6.98, p=.016
0
20
40
60
80
100
120
140
Breathy Normal Pressed
Three Voice Coordination Patterns
Stan
dard
Dev
iatio
n of
La
ryng
eal R
esis
tanc
e (c
mH2
0/l/s
)
Figure 18. Significant main effect for quality. Standard deviation of laryngeal resistance (cmH2O/l/s) as a function of voice coordination pattern (i.e., breathy, normal, and pressed).
In Figure 19, the masked auditory feedback condition facilitated larger standard
deviations of laryngeal resistance as compared to the normal auditory feedback condition. When
auditory feedback was masked by speech noise, subjects’ productions of the voice qualities were
more variable. Thus, in contrast to Experiment 1 that assessed bimanual coordination,
Experiment 2 demonstrated that sensory feedback influenced coordinative performance for a
different task (i.e., voice coordination).
116

Significant Main Effect for Feedback F(1,17)=6.04, p=.025
0102030405060708090
Normal Auditory Feedback Masked Auditory Feedback
Two Sensory Feedback Conditions
Stan
dard
Dev
iatio
n of
La
ryng
eal R
esis
tanc
e (c
mH2
0/l/s
)
Figure 19. Significant main effect for feedback. Standard deviation of laryngeal resistance (cmH2O/l/s) as a function of sensory feedback condition (i.e., normal auditory feedback versus masked auditory feedback by speech noise).
Even though the quality x feedback two-way interaction was not significant for standard
deviation of laryngeal resistance, the results for laryngeal resistance under the feedback
conditions looked similar to the significant results of the quality x feedback interaction for mean
of laryngeal resistance presented shortly. Specifically, the pressed voice quality was produced
with more variability in the masked auditory feedback condition than in the normal auditory
feedback condition (see Figure 20). In contrast, the variability of performance between the
masked and normal auditory feedback conditions for the breathy and normal voice qualities
appeared similar (see Figures 21 and 22). The masked auditory feedback condition, therefore,
only influenced the variability in performance of the pressed voice quality, which was generally
less stable than the other qualities. The breathy and normal voice qualities remained stable
regardless of the sensory feedback condition.
117

Pressed Voice under Normal and Masked Auditory Feedback
0
50
100
150
200
250
300
350
220Hz 277Hz 349Hz 440Hz 554Hz 698Hz 880Hz
Seven Fundamental Frequencies
Stan
dard
Dev
iatio
n of
La
ryng
eal R
esis
tanc
e (c
mH2
0/l/s
)
Normal Auditory FeedbackMasked Auditory Feedback
Figure 20. Pressed voice under normal and masked auditory feedback. Standard deviation of laryngeal resistance (cmH2O/l/s) as a function of seven fundamental frequencies (Hz) or pitches for pressed voice under normal and masked auditory feedback.
Breathy Voice under Normal and Masked Auditory Feedback
0
10
20
3040
50
60
70
80
220Hz 277Hz 349Hz 440Hz 554Hz 698Hz 880Hz
Seven Fundamental Frequencies
Sta
ndar
d De
viat
ion
of
Lary
ngea
l Res
ista
nce
(cm
H20/
l/s)
Normal Auditory Feedback
Masked AuditoryFeedback
Figure 21. Breathy voice under normal and masked auditory feedback. Standard deviation of laryngeal resistance (cmH2O/l/s) as a function of seven fundamental frequencies (Hz) or pitches for breathy voice under normal and masked auditory feedback.
118
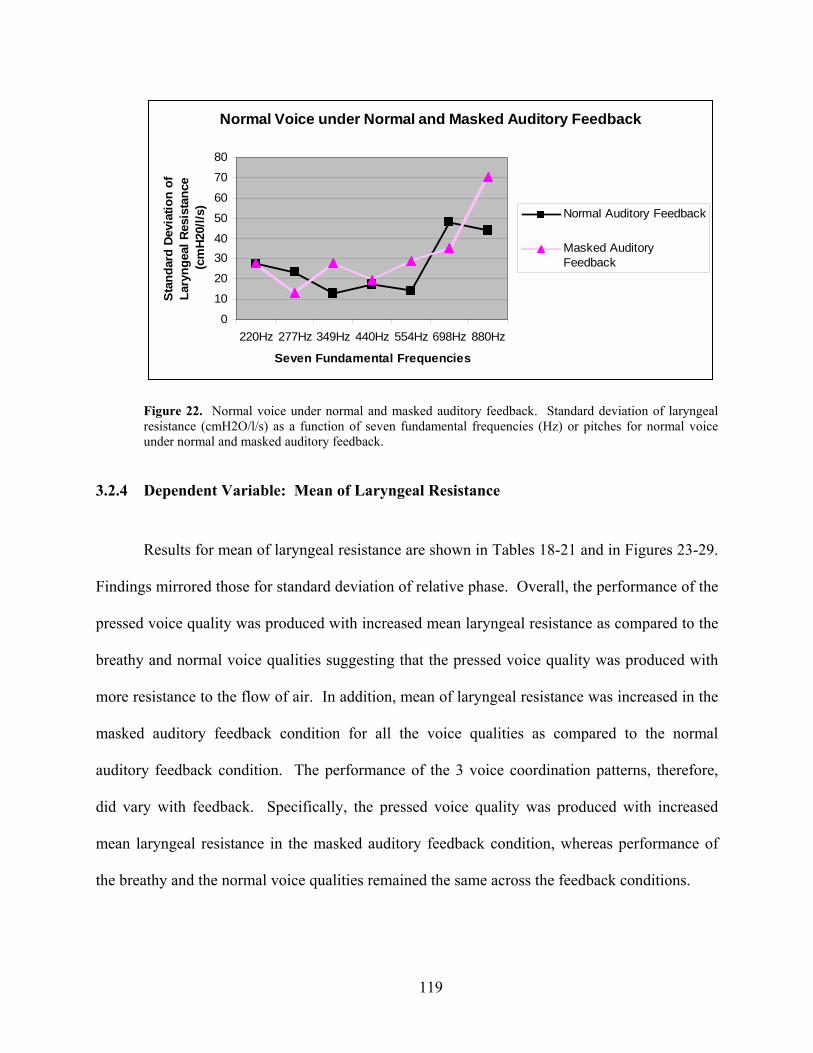
Normal Voice under Normal and Masked Auditory Feedback
0
10
20
3040
50
60
70
80
220Hz 277Hz 349Hz 440Hz 554Hz 698Hz 880Hz
Seven Fundamental Frequencies
Stan
dard
Dev
iatio
n of
La
ryng
eal R
esis
tanc
e (c
mH
20/l/
s) Normal Auditory Feedback
Masked AuditoryFeedback
Figure 22. Normal voice under normal and masked auditory feedback. Standard deviation of laryngeal resistance (cmH2O/l/s) as a function of seven fundamental frequencies (Hz) or pitches for normal voice under normal and masked auditory feedback.
3.2.4 Dependent Variable: Mean of Laryngeal Resistance
Results for mean of laryngeal resistance are shown in Tables 18-21 and in Figures 23-29.
Findings mirrored those for standard deviation of relative phase. Overall, the performance of the
pressed voice quality was produced with increased mean laryngeal resistance as compared to the
breathy and normal voice qualities suggesting that the pressed voice quality was produced with
more resistance to the flow of air. In addition, mean of laryngeal resistance was increased in the
masked auditory feedback condition for all the voice qualities as compared to the normal
auditory feedback condition. The performance of the 3 voice coordination patterns, therefore,
did vary with feedback. Specifically, the pressed voice quality was produced with increased
mean laryngeal resistance in the masked auditory feedback condition, whereas performance of
the breathy and the normal voice qualities remained the same across the feedback conditions.
119

The ANOVA for mean of laryngeal resistance revealed significant main effects for
quality [F(1.08,18.43)=15.66, p=.001] and feedback [F(1,17)=10.63, p=.005] and a significant
two-way interaction for quality x feedback [F(1.33,22.56)=5.95, p=.016] (see Table 18 and
Figures 24, 25, and 26). Neither the main effect for pitch [F(2.42,41.14)=1.16, p=.330] nor the
three-way interaction for quality x pitch x feedback [F(2.49,42.48)=.662, p=.553] were
significant. Eta squared, an indicator of effect size, was .479 and .385 for the significant main
effects of quality and feedback, respectively and .259 for the significant two-way interaction.
The significant quality x feedback interaction points to a rejection of Ho². That is, evidence was
found for a relationship between voice quality and sensory feedback, relative to mean laryngeal
resistance. In contrast, the failure to detect a three-way interaction among the effects of quality,
pitch, and feedback on mean laryngeal resistance suggests that no evidence is provided to
warrant the rejection of Ho¹. Evidence, therefore, was not found for a relationship among voice
quality, fundamental frequency, and sensory feedback relative to mean laryngeal resistance.
120

Within Subjects Effect SS df MS F p Eta² Quality 4012738.09 1.08 3701976.79 15.66 .001** .479 Error (quality) 4357419.95 18.43 236468.54 Pitch 81974.97 2.42 33874.34 1.16 .330 .064 Error (pitch) 1200841.24 41.14 29189.47 Feedback 150250.33 1.00 150250.33 10.63 .005** .385 Error (feedback) 240219.48 17.00 14130.56 Quality x Pitch 245020.67 1.63 150057.95 1.66 .211 .089 Error (quality x pitch) 2513356.26 27.76 90544.36 Quality x Feedback 172332.45 1.33 129838.43 5.95 .016** .259 Error (quality x feedback) 492336.69 22.56 21819.74 Pitch x Feedback 66269.81 2.59 25626.13 .945 .416 .053 Error (pitch x feedback) 1192302.56 43.96 27120.95 Quality x Pitch x Feedback 82262.01 2.49 32920.13 .662 .553 .038 Error (quality x pitch x feedback) 2110981.84 42.48 49693.30 N=18
Table 18. Repeated measures ANOVA for quality (i.e., breathy, normal, and pressed), pitch (i.e., increasing fundamental frequency), and feedback (i.e., normal versus masked auditory feedback) on mean of laryngeal resistance. N=18 subjects, SS=sum of squares, df =degrees of freedom considering the Huynh-Feldt correction for sphericity, MS=mean square, F=test statistic, and p=significance level, Eta²=an indicator of effect size. The ** indicates a significant within subjects effect.
Interestingly, the main effects for pitch and all interactions involving pitch were not
significant indicating that the subjects were able to maintain the voice qualities regardless of
pitch. In Figure 23, the 3 voice qualities were consistently maintained at each of the 7
fundamental frequencies with the highest mean laryngeal resistance for pressed voice and the
lowest mean laryngeal resistance for breathy voice.
121

Voice Qualities Maintained at Each Fundamental Frequency
050
100150200250300350400450
220Hz 277Hz 349Hz 440Hz 549Hz 698Hz 880Hz
Seven Fundamental Frequencies from 220Hz to 880Hz
Mea
n of
Lar
ynge
al R
esis
tanc
e(c
mH
20/l/
s)
PressedNormalBreathy
Figure 23. Voice qualities were maintained at each of the 7 fundamental frequencies. Mean of laryngeal resistance (cmH2O/l/s) as a function of fundamental frequency for pressed, normal, and breathy voice qualities.
For the significant main effect of quality, the pressed voice quality was produced with the
highest mean laryngeal resistance value, whereas the breathy voice quality was produced with
the lowest mean laryngeal resistance value (see Figure 24). Consequently, the pressed voice
pattern was produced with more resistance to the flow of air presumably due to a constricted
glottis as compared to less resistance to the flow of air as seen in breathy voice, presumably due
to relative vocal fold abduction.
122

Significant Main Effect for Quality F(1.08,18.43)=15.66, p=.oo1
0
50
100
150
200
250
Breathy Normal Pressed
Three Voice Coordination Patterns
Mea
n of
Lar
ynge
al R
esis
tanc
e
(cm
H20
/l/s)
Figure 24. Significant main effect for quality. Mean of laryngeal resistance (cmH20/l/s) as a function of voice coordination pattern (i.e., breathy, normal, and pressed).
Similar to results for standard deviation of laryngeal resistance, subjects produced
elevated means values of laryngeal resistance in the masked auditory feedback condition as
compared to the normal auditory feedback condition (see Figure 25). Again, this finding implies
that in contrast to results for the bimanual coordination task, auditory feedback influenced
performance for the voice coordination task.
Significant Main Effect for Feedback F(1,17)=10.63, p =.005
0
20
40
60
80
100
120
140
Normal Masked
Two Sensory Feedback Conditions
Mea
n of
Lar
ynge
al R
esis
tanc
e
(cm
H20
/l/s)
Figure 25. Significant main effect for feedback. Mean of laryngeal resistance (cmH2O/l/s) as a function of sensory feedback (i.e., normal versus masked auditory feedback).
123

The significant two-way interaction for quality x feedback indicated that not only did the
masked auditory feedback produce elevated mean laryngeal resistance values, but the influence
of the masked auditory feedback condition was dependent upon the specific voice quality.
Figure 26 demonstrates that the increase in mean laryngeal resistance was substantially larger for
pressed voice in the masked condition, as compared to increases seen in the other voice quality
conditions, for which laryngeal resistance increases were trivial.
Signifcant Two-Way Interaction for Quality x Feedback F(1.33,22.56)=5.95, p =.016
0
50
100
150
200
250
300
350
Breathy Normal Pressed
Three Voice Coordination Patterns
Mea
n of
Lar
ynge
al R
esis
tanc
e (c
mH
20/l/
s)
Normal FeedbackMasked Feedback
Figure 26. Significant two-way interaction for quality x feedback. Mean of laryngeal resistance (cmH2O/l/s) as a function of voice coordination pattern (i.e., breathy, normal, and pressed) for normal and masked auditory feedback.
The significant two-way interaction for quality x feedback allowed for further post hoc
analysis of simple main effects using the Bonferroni correction, thereby determining the effects
of one independent variable while holding the other independent variable constant. For example,
determining the effects of the 3 voice patterns (i.e., breathy, normal, and pressed) at a single
sensory feedback condition (i.e., normal auditory feedback versus masked auditory feedback by
speech noise). Considering the significant two-way interaction for quality x feedback, 9 total
pairings were tested to compare the 3 voice patterns within a single sensory feedback condition
124

(i.e., 3 voice patterns x 2 sensory feedback conditions = 6) and to compare the 2 sensory
feedback conditions within a single voice pattern (i.e., 2 sensory feedback conditions within 3
voice patterns = 3). Because 9 overall tests were performed, the critical p-value was adjusted to
account for the 9 tests (.05/9=.005, p-value=.005).
To assess the results for the 3 voice patterns within the normal and masked auditory
feedback conditions, 3 pairwise comparisons were conducted: breathy versus normal, breathy
versus pressed, and pressed versus normal. For both feedback conditions, all pairwise
comparisons were significant (see Tables 19 and 20). Subjects, therefore, maintained
distinctions in mean laryngeal resistance values regardless of sensory feedback condition.
Pairwise Comparisons for Normal Auditory Feedback df t p breathy versus normal 35 3.05 .004** breathy versus pressed 35 8.55 .000** pressed versus normal 35 5.49 .000**
Table 19. Pairwise comparisons for normal auditory feedback at breathy, normal, and pressed voice coordination patterns. df=degrees of freedom for the t-distribution, t=test statistic, and p=significance level. The ** indicates a significant pairwise comparison.
Pairwise Comparisons for Masked Auditory Feedback df t p breathy versus normal 35 3.35 .001** breathy versus pressed 35 15.66 .000** pressed versus normal 35 12.31 .000**
Table 20. Pairwise comparisons for masked auditory feedback at breathy, normal, and pressed voice coordination patterns. df=degrees of freedom for the t-distribution, t=test statistic, and p=significance level. The ** indicates a significant pairwise comparison.
To assess results for the 2 sensory feedback conditions within a singe voice pattern, 3
pairwise comparisons were conducted: breathy, normal and pressed (see Table 21). Results
showed that laryngeal resistance values were different for normal versus masked conditions, for
pressed voice [t(35)=3.51, p=.001] (see Table 21). Specifically, pressed voice was produced
with larger mean laryngeal resistance values in the masked auditory feedback condition as
compared to the normal auditory feedback condition (see Figure 27). In contrast, mean laryngeal
125

resistance values were not different across normal and masked conditions for breathy and normal
voice ([t(35)=.177, p=.859] and [t(35)=.318, p=.752], respectively) (see Table 21). Thus,
sensory feedback condition did not influence mean laryngeal resistance values for breathy and
normal voice qualities (Figures 28 and 29).
Pairwise Comparisons for Feedback within a Single Voice Pattern df t p normal versus masked feedback at breathy voice 35 .177 .859 normal versus masked feedback at normal voice 35 .318 .752 normal versus masked feedback at pressed voice 35 3.51 .001**
Table 21. Pairwise comparisons for normal and masked feedback within a single voice coordination pattern; breathy, normal, and pressed. df=degrees of freedom for the t-distribution, t=test statistic, and p=significance level. The ** indicates a significant pairwise comparison.
Pressed Voice under Normal and Masked Auditory Feedback
0
50
100
150
200
250
300
350
220Hz 277Hz 349Hz 440Hz 554Hz 698Hz 880Hz
Seven Fundamental Frequencies
Mea
n of
Lar
ynge
al R
esis
tanc
e (c
mH
20/l/
s) Normal Auditory Feedback
Masked AuditoryFeedback
Figure 27. Pressed voice under normal and masked auditory feedback. Mean of laryngeal resistance (cmH2O/l/s) as a function of seven fundamental frequencies (Hz) or pitches for pressed voice under normal and masked auditory feedback.
126
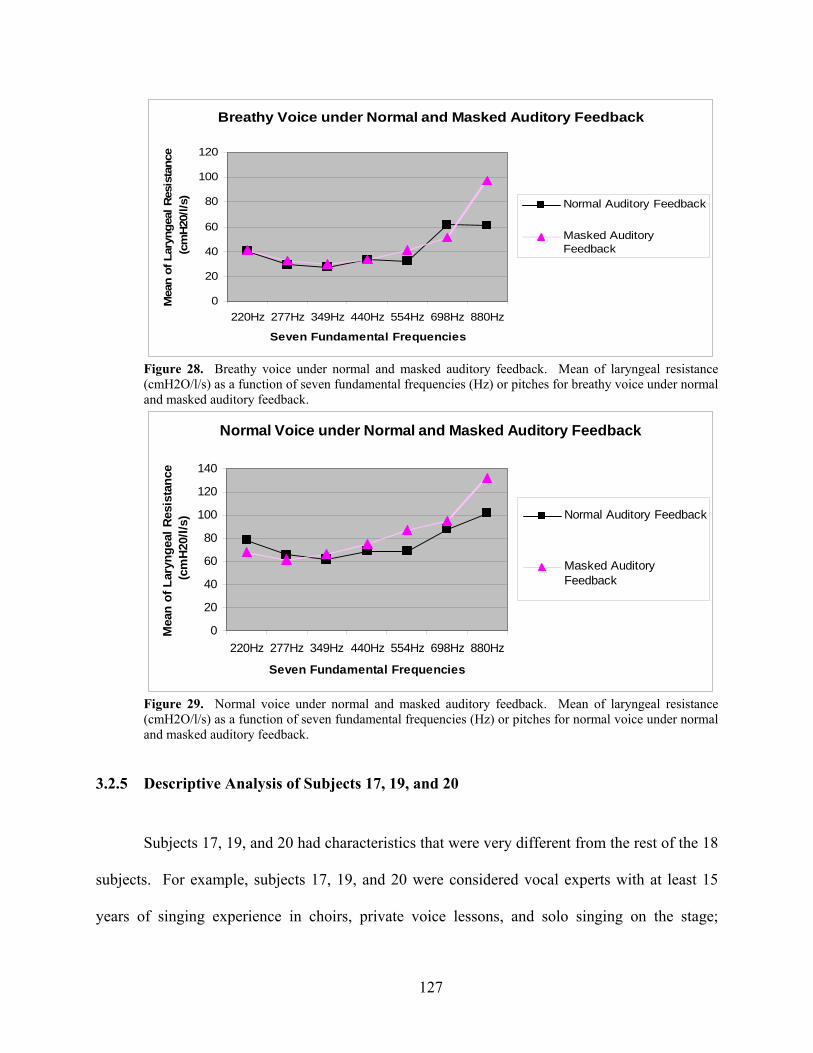
Breathy Voice under Normal and Masked Auditory Feedback
0
20
40
60
80
100
120
220Hz 277Hz 349Hz 440Hz 554Hz 698Hz 880Hz
Seven Fundamental Frequencies
Mea
n of
Lar
ynge
al R
esis
tanc
e (c
mH2
0/l/s
)
Normal Auditory Feedback
Masked AuditoryFeedback
Figure 28. Breathy voice under normal and masked auditory feedback. Mean of laryngeal resistance (cmH2O/l/s) as a function of seven fundamental frequencies (Hz) or pitches for breathy voice under normal and masked auditory feedback.
Normal Voice under Normal and Masked Auditory Feedback
0
20
40
60
80
100
120
140
220Hz 277Hz 349Hz 440Hz 554Hz 698Hz 880Hz
Seven Fundamental Frequencies
Mea
n of
Lar
ynge
al R
esis
tanc
e (c
mH
20/l/
s) Normal Auditory Feedback
Masked AuditoryFeedback
Figure 29. Normal voice under normal and masked auditory feedback. Mean of laryngeal resistance (cmH2O/l/s) as a function of seven fundamental frequencies (Hz) or pitches for normal voice under normal and masked auditory feedback.
3.2.5 Descriptive Analysis of Subjects 17, 19, and 20
Subjects 17, 19, and 20 had characteristics that were very different from the rest of the 18
subjects. For example, subjects 17, 19, and 20 were considered vocal experts with at least 15
years of singing experience in choirs, private voice lessons, and solo singing on the stage;
127
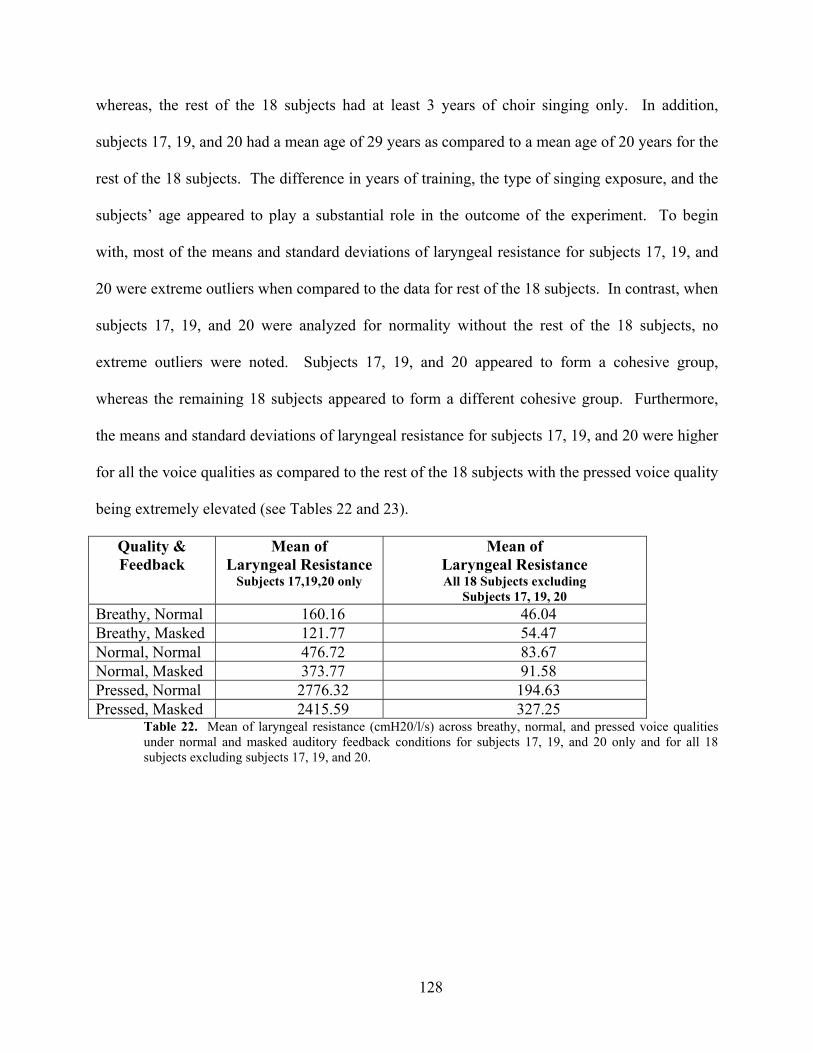
whereas, the rest of the 18 subjects had at least 3 years of choir singing only. In addition,
subjects 17, 19, and 20 had a mean age of 29 years as compared to a mean age of 20 years for the
rest of the 18 subjects. The difference in years of training, the type of singing exposure, and the
subjects’ age appeared to play a substantial role in the outcome of the experiment. To begin
with, most of the means and standard deviations of laryngeal resistance for subjects 17, 19, and
20 were extreme outliers when compared to the data for rest of the 18 subjects. In contrast, when
subjects 17, 19, and 20 were analyzed for normality without the rest of the 18 subjects, no
extreme outliers were noted. Subjects 17, 19, and 20 appeared to form a cohesive group,
whereas the remaining 18 subjects appeared to form a different cohesive group. Furthermore,
the means and standard deviations of laryngeal resistance for subjects 17, 19, and 20 were higher
for all the voice qualities as compared to the rest of the 18 subjects with the pressed voice quality
being extremely elevated (see Tables 22 and 23).
Quality & Feedback
Mean of Laryngeal Resistance
Subjects 17,19,20 only
Mean of Laryngeal Resistance All 18 Subjects excluding
Subjects 17, 19, 20 Breathy, Normal 160.16 46.04 Breathy, Masked 121.77 54.47 Normal, Normal 476.72 83.67 Normal, Masked 373.77 91.58 Pressed, Normal 2776.32 194.63 Pressed, Masked 2415.59 327.25
Table 22. Mean of laryngeal resistance (cmH20/l/s) across breathy, normal, and pressed voice qualities under normal and masked auditory feedback conditions for subjects 17, 19, and 20 only and for all 18 subjects excluding subjects 17, 19, and 20.
128
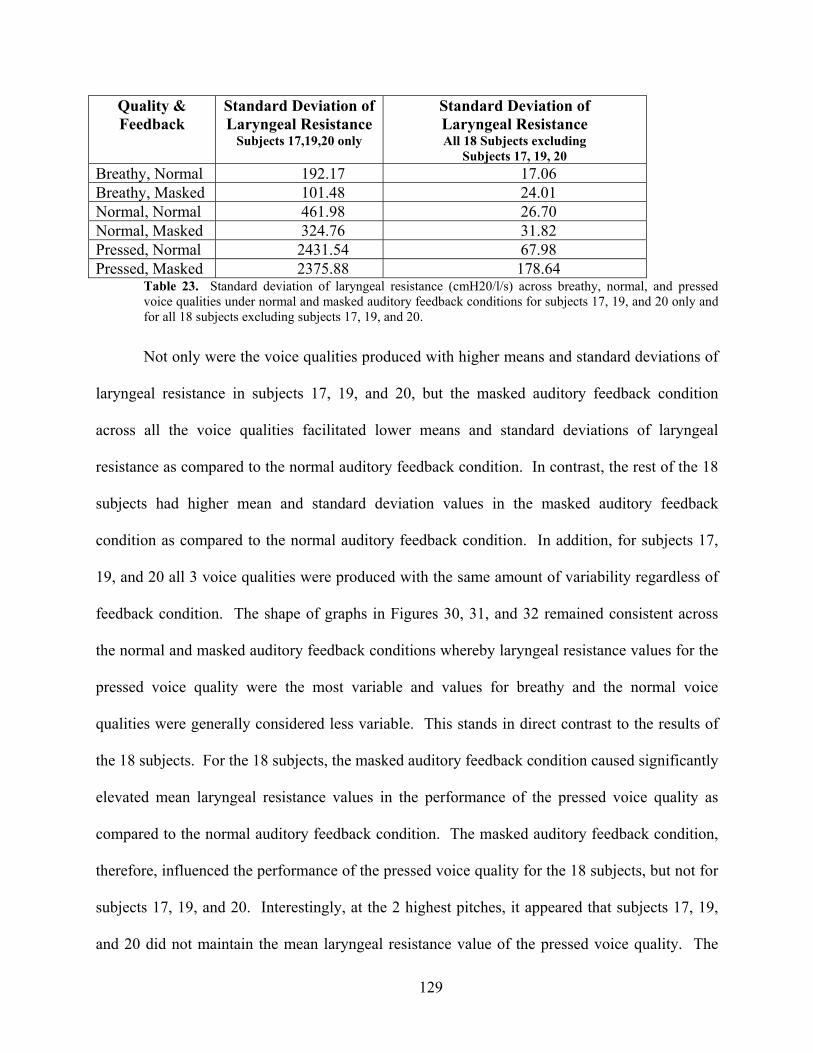
Quality & Feedback
Standard Deviation ofLaryngeal Resistance
Subjects 17,19,20 only
Standard Deviation of Laryngeal Resistance All 18 Subjects excluding
Subjects 17, 19, 20 Breathy, Normal 192.17 17.06 Breathy, Masked 101.48 24.01 Normal, Normal 461.98 26.70 Normal, Masked 324.76 31.82 Pressed, Normal 2431.54 67.98 Pressed, Masked 2375.88 178.64
Table 23. Standard deviation of laryngeal resistance (cmH20/l/s) across breathy, normal, and pressed voice qualities under normal and masked auditory feedback conditions for subjects 17, 19, and 20 only and for all 18 subjects excluding subjects 17, 19, and 20.
Not only were the voice qualities produced with higher means and standard deviations of
laryngeal resistance in subjects 17, 19, and 20, but the masked auditory feedback condition
across all the voice qualities facilitated lower means and standard deviations of laryngeal
resistance as compared to the normal auditory feedback condition. In contrast, the rest of the 18
subjects had higher mean and standard deviation values in the masked auditory feedback
condition as compared to the normal auditory feedback condition. In addition, for subjects 17,
19, and 20 all 3 voice qualities were produced with the same amount of variability regardless of
feedback condition. The shape of graphs in Figures 30, 31, and 32 remained consistent across
the normal and masked auditory feedback conditions whereby laryngeal resistance values for the
pressed voice quality were the most variable and values for breathy and the normal voice
qualities were generally considered less variable. This stands in direct contrast to the results of
the 18 subjects. For the 18 subjects, the masked auditory feedback condition caused significantly
elevated mean laryngeal resistance values in the performance of the pressed voice quality as
compared to the normal auditory feedback condition. The masked auditory feedback condition,
therefore, influenced the performance of the pressed voice quality for the 18 subjects, but not for
subjects 17, 19, and 20. Interestingly, at the 2 highest pitches, it appeared that subjects 17, 19,
and 20 did not maintain the mean laryngeal resistance value of the pressed voice quality. The
129

pressed voice quality appeared to morph into the normal and the breathy voice qualities at 698Hz
and 880Hz across both of the sensory feedback conditions (see Figures 33 and 34).
Pressed Voice under Normal and Masked Auditory Feedback
0
1000
2000
3000
4000
5000
6000
220Hz 277Hz 349Hz 440Hz 554Hz 698Hz 880Hz
Seven Fundamental Frequencies
Mea
n of
Lar
ynge
al R
esis
tanc
e (c
mH
2O/l/
s) Normal Auditory Feedback
Masked AuditoryFeedback
Figure 30. Pressed voice under normal and masked auditor feedback for subjects 17, 19, and 20. Mean of laryngeal resistance (cmH2O/l/s) as a function of the 7 fundamental frequencies (Hz) for normal and masked auditory feedback.
Normal Voice under Normal and Masked Auditory Feedback
0
10
20
3040
50
60
70
80
220Hz 277Hz 349Hz 440Hz 554Hz 698Hz 880Hz
Seven Fundamental Frequencies
Stan
dard
Dev
iatio
n of
La
ryng
eal R
esis
tanc
e (c
mH20
/l/s) Normal Auditory Feedback
Masked AuditoryFeedback
Figure 31. Normal voice under normal and masked auditory feedback for subjects 17, 19, and 20. Mean of laryngeal resistance (cmH2O/l/s) as a function of the 7 fundamental frequencies (Hz) for normal and masked auditory feedback.
130
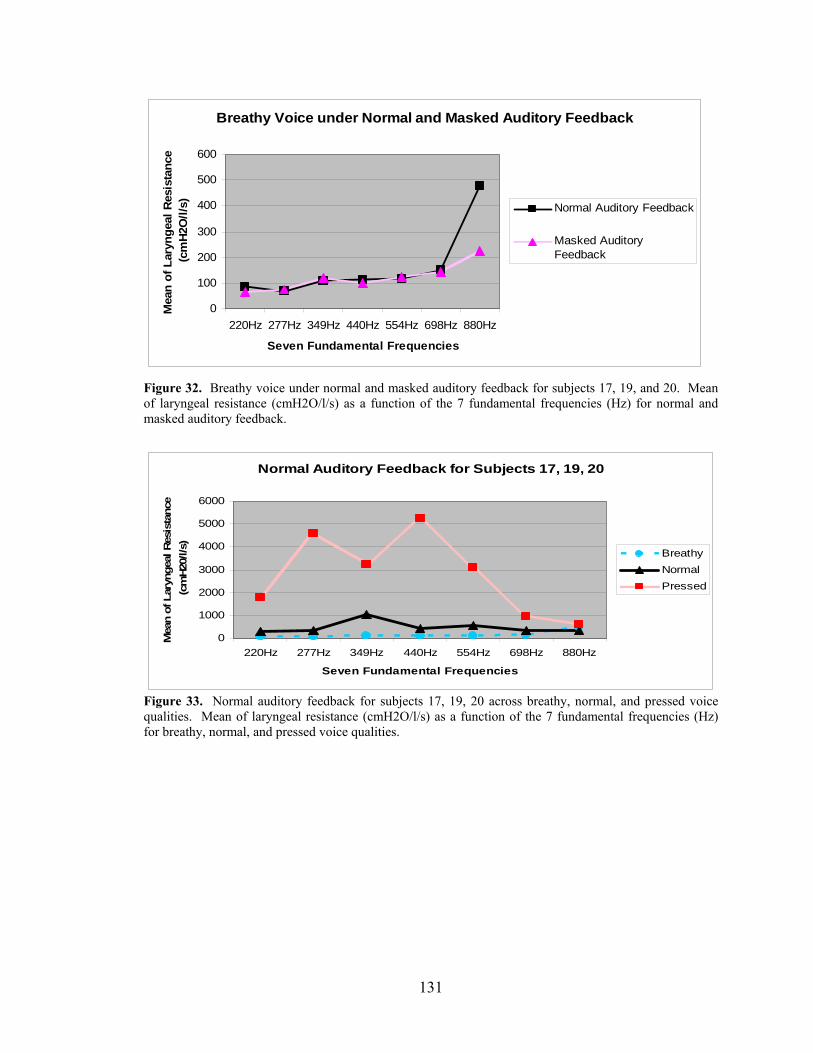
Breathy Voice under Normal and Masked Auditory Feedback
0
100
200
300
400
500
600
220Hz 277Hz 349Hz 440Hz 554Hz 698Hz 880Hz
Seven Fundamental Frequencies
Mea
n of
Lar
ynge
al R
esis
tanc
e (c
mH2
O/l/
s) Normal Auditory Feedback
Masked AuditoryFeedback
Figure 32. Breathy voice under normal and masked auditory feedback for subjects 17, 19, and 20. Mean of laryngeal resistance (cmH2O/l/s) as a function of the 7 fundamental frequencies (Hz) for normal and masked auditory feedback.
Normal Auditory Feedback for Subjects 17, 19, 20
0
1000
2000
3000
4000
5000
6000
220Hz 277Hz 349Hz 440Hz 554Hz 698Hz 880Hz
Seven Fundamental Frequencies
Mea
n of
Lar
ynge
al R
esis
tanc
e (c
mH2
0/l/s
)
BreathyNormalPressed
Figure 33. Normal auditory feedback for subjects 17, 19, 20 across breathy, normal, and pressed voice qualities. Mean of laryngeal resistance (cmH2O/l/s) as a function of the 7 fundamental frequencies (Hz) for breathy, normal, and pressed voice qualities.
131

Masked Auditory Feedback for Subjects 17, 19, 20
0500
100015002000250030003500400045005000
220Hz 277Hz 349Hz 440Hz 554Hz 689Hz 880Hz
Seven Fundamental Frequencies
Mea
n of
Lar
ynge
al R
esis
tanc
e (c
mH2
0/l/s
)
Breathy VoiceNormal VoicePressed Voice
Figure 34. Masked auditory feedback for subjects 17, 19, 20 across breathy, normal, and pressed voice qualities. Mean of laryngeal resistance (cmH2O/l/s) as a function of the 7 fundamental frequencies (Hz) for breathy, normal, and pressed voice qualities.
In summary, “expert” subjects 17, 19, and 20 performed differently from the rest of the
18 subjects. Overall mean and standard deviations of laryngeal resistance were higher for
subjects 17, 19, and 20 as compared to the other 18 subjects. The masked auditory feedback
condition facilitated a general decrease in mean and standard deviations as compared to the
normal auditory feedback condition for subjects 17, 19, and 20. In contrast, the rest of the 18
subjects had an opposite effect of performance where the masked auditory feedback condition
facilitated an increase in means and standard deviations of laryngeal resistance. The feedback
conditions did not appear to influence the performance of 3 voice coordination patterns in
subjects 17, 19, and 20; however, the masked auditory feedback condition did significantly
influence the performance of the pressed voice quality in the rest of the 18 subjects. In addition,
subjects 17, 19, and 20 failed to maintain the mean laryngeal resistance value reflecting pressed
voice at 698Hz and 880Hz, whereas, the rest of the 18 subjects were able to maintain laryngeal
resistance values reflecting all the voice qualities across the fundamental frequency range. The
difference in performance between “expert” subjects 17, 19, and 20 and the rest of the “less-
132

than-expert” 18 subjects may be related to different subject characteristics involving years of
vocal training, type of vocal training, performance history, and age.
3.3 DISCUSSION
The purpose of Experiment 2 was to investigate the effect of sensory feedback
conditions, voice quality, and increasing fundamental frequency on mean and standard deviation
of laryngeal resistance. A central theoretical construct in the investigation regarded the role of
sensory information in the coordination dynamics for a voice task. Examination of the data
indicated that data for three of the total 21 subjects were qualitatively different from data for the
remaining 18 subjects, based on descriptive stem and leaf plots indicating extreme outliers.
Statistical consideration involved the data set from the 18 subjects, which will be the focus of the
present discussion. Data for the three remaining subjects were considered descriptively and will
be discussed later on in the discussion section.
Results showed that both voice quality and feedback condition influenced the stability of
the laryngeal resistance data. Relative to voice quality, subjects produced pressed voice with the
greatest variability, whereas breathy voice was produced with the least variability. Variability for
normal voice landed in the middle, but was closest to the variability for breathy voice. The
pressed voice quality appeared to have an inherent instability as compared to the breathy and the
normal voice qualities. The increased variability of the pressed voice quality may be explained
by the heightened muscle activation of the constricted glottis enabling a highly variable
relationship between the airflow through the glottis and the build up of air below the glottis. In
contrast, the relative stability of the normal voice quality, produced with an average muscle
133

activation enabling a neutral glottis, promoted a stable and balanced relationship between the
airflow through the glottis and the build up of air below the glottis. For the breathy voice
quality, the most stable relationship occurred between airflow through the glottis and build up of
air below the glottis possibly due to the minimal muscle activation of the abducted glottis. In
sum, as muscle activation increases toward heightened glottal constriction, the relationship
between airflow through the glottis and build up of air below the glottis becomes more variable.
Conversely, as muscle activation decreases toward minimal glottal constriction or an abducted
glottis, the relationship between airflow through the glottis and build up of air below the glottis
becomes less variable.
Relative to the effect of feedback on the stability of laryngeal resistance measures for the
18 subjects, the standard deviation of laryngeal resistance increased under masked listening
conditions. That is, when auditory feedback about subjects’ performance was effectively
eliminated, variability in laryngeal resistance values for the voice qualities increased
significantly. In contrast to findings for the bimanual limb coordination task, sensory feedback
was found to influence dynamic coordinative behavior for a voice task. This finding is loosely
consistent with prior reports indicating a relevance of sensory information for coordinative motor
behavior (Cardoso de Oliveira & Barthelemy, 2005; Kazennikov et al., 2002; Mechsner et al.,
2001, 2004; Serrien & Teasdale, 1996; Swinnen et al., 2000). Considering an expanded view of
dynamics systems theory including the influence of auditory feedback in the coordination
dynamics of a voice task, the rationale for including the auditory feedback component in the
candidate’s developing Global Voice Therapy Program is supported by the current theoretical
investigation (Grillo, in preparation).
134

Although there are potential implications for dynamic systems theory of motor control, in
fact, evidence supporting a role of sensory feedback on motor control fits squarely with most
other theoretical approaches to motor control and learning. Examples include a closed-loop
theory of motor control (Adams, 1971) and schema theory (Schmidt, 1975, 1976, 2003). Based
on such theories (Adams, 1971; Schmidt, 1975, 1976, 2003) supporting a role of sensory
feedback, the finding that auditory feedback played a role in motor control for a voice task is not
surprising at all. Further evidence regarding such a role of sensory feedback comes from data on
speech deterioration in individuals with post-lingual onset of deafness, which typically appear
after a period of some years (Anderson & Lyxell, 1998; Lane & Webster, 1991).
Regarding measures of average laryngeal resistance, two significant main effects and one
two-way significant interaction were demonstrated in the data. Specifically, voice quality,
feedback condition, and the interaction of voice quality and feedback influenced average
laryngeal resistance. Addressing these findings in turn, pressed voice was produced with the
highest average laryngeal resistance, whereas breathy voice quality was produced with the
lowest average laryngeal resistance. Average laryngeal resistance was intermediate for normal
quality, but was closer to values for breathy than for pressed voice. These findings are consistent
with those that would be predicted for the respective voice qualities. Pressed voice is typically
produced with a small glottis, which would limit airflow through the glottis and cause a
corresponding back-up of pressure in the trachea (i.e., subglottis). Thus, laryngeal resistance,
which reflects subglottic pressure divided by glottal airflow, should be high. In contrast, breathy
voice is typically produced with a relatively wide glottis. Thus, phonatory airflow through the
glottis should be high and pressure back-up in the subglottis should be comparatively low. The
result would be low values for laryngeal resistance. Values for normal voice should be
135

intermediate due to an intermediate glottal size and thus intermediate glottal airflows and
subglottal pressures (e.g., , Gauffin & Sundberg, 1989). The mean laryngeal resistance values in
the current study, therefore, were consistent with aerodynamic and laryngeal properties of the
specific voice quality.
Conceptually more interesting are findings for mean laryngeal resistance as a function of
feedback condition. Across both the normal and masked auditory feedback conditions, the mean
laryngeal resistance was significantly different for all the voice qualities. All 3 voice qualities as
they relate to one another, therefore, were maintained regardless of changing auditory feedback.
Even though all 3 voice qualities were distinct from one another within each sensory feedback
condition, the pressed voice quality was produced with significantly higher mean laryngeal
resistance in the masked auditory feedback condition as compared to the normal auditory
feedback condition. The breathy and the normal voice qualities were produced with the same
mean laryngeal resistance across the normal and masked auditory feedback conditions. The
inherent stability of the breathy and normal voice qualities was not affected by the feedback
conditions. In contrast, the performance of the pressed voice quality was affected by the masked
auditory feedback condition. That is, the mean laryngeal resistance for the pressed voice quality
increased in the masked auditory feedback condition as compared to the normal auditory
feedback condition.
Although constant intensity levels were encouraged across all trials, in fact subjects failed
to achieve the target intensity level (i.e., +/-1dB from a “comfortable” intensity). Thus, the
results may reflect subjects’ tendency to increase intensity under masking (e.g., “Lombard
effect”), but not to increase laryngeal resistance. All 3 voice qualities had an increase in
intensity level in the masked condition. Interestingly, the normal voice was produced with the
136

highest intensity levels in the masked auditory feedback condition as compared to breathy and
pressed voice. If average laryngeal resistance was affected by the increased intensity in the
masked condition, then the average laryngeal resistance values for the normal voice quality
would have been affected. This was not the case. In fact, the breathy and the normal voice
qualities were performed with the same average laryngeal resistance across both the normal and
masked auditory feedback conditions, even though intensity levels were higher in the masked
condition. Conversely, the pressed voice quality was performed with elevated average laryngeal
resistance values in the masked auditory feedback condition. The increase in intensity under
masking, therefore, did not influence laryngeal resistance.
The main point to pursue for theoretical purposes is that pressed voice quality was
produced with significantly higher mean laryngeal resistance values under masking, but values
for breathy and normal voice did not vary across normal and masked feedback conditions. The
implication is that sensory feedback is necessary for some but not all laryngeal resistance targets.
That is, sensory feedback appeared largely relevant for the pressed voice condition but not for
breathy and normal voice conditions. Together with the observation that pressed voice was less
stable than breathy and normal voice qualities, the implication is that sensory feedback may be
relevant for voice patterns that have a shallow basin of attraction (i.e., pressed), but less
relevant or even wholly irrelevant for voice patterns that have a steep basin of attraction (i.e.,
breathy and normal).
Stated in theoretical terms pertinent to dynamic systems theory, perhaps the steep basins
of attraction for breathy and normal voice qualities were driven by coordination dynamics,
whereas the shallow basin of attraction for pressed voice production was at least partly
influenced by auditory feedback processes. Evidence from the present study of a role of both
137

coordinative dynamics, as seen in breathy voice and normal voice, and sensory feedback
processes, as seen in pressed voice, suggests that further theorizing in motor control should seek
to handle both coordinative dynamics and sensory feedback. The influence of auditory feedback
on a voice coordination task also supports the importance of auditory feedback in vocal
rehabilitation.
3.3.1 Subjects 17, 19, and 20
Subjects 17, 19, and 20 had different personal and performance characteristics from the
rest of the subjects. Subjects 17, 19, and 20 (mean age 29 years) had 15 or more years of singing
experience that included private classical vocal training, choral singing, and solo singing on the
stage, which labeled them as “expert” subjects. The rest of the subjects (mean age 20 years) had
a history of at least 3 years of choral singing only. This difference in type of training, years of
training, and age appeared to promote a different outcome in performance for the subset of
“experts” in comparison to other subjects. For example, all the voice qualities were produced
with increased laryngeal resistance to the flow of air and with increased variability in the
“expert” group as compared to the other subjects. It was almost as if subjects 17, 19, and 20
produced extreme exemplars of each of the voice qualities. Moreover, both means and standard
deviations of laryngeal resistance decreased slightly in the masked auditory feedback condition
as compared to the normal feedback condition in the “expert” group. The other 18 subjects had
the opposite effect with the means and standard deviations of laryngeal resistance slightly
increased in the masked auditory feedback condition as compared to the normal auditory
feedback condition.
138

Additionally, the performance of the voice qualities for the “expert” subjects did not
appear to be influenced by the auditory feedback conditions, whereas the performance of the
pressed voice quality in the other subjects was affected by the masked auditory feedback
condition. One obvious explanation is that the “expert” subjects relied more on proprioceptive
feedback rather than auditory feedback to maintain the breathy, normal, and pressed voice
qualities. This is a plausible explanation and should be pursued with further study. At high
pitches greater than 698Hz, the coordination dynamics for the pressed voice quality were not
maintained in the “expert” subjects. Perhaps through extensive vocal training, voice teachers
and coaches emphasized the importance of maintaining an open and relaxed larynx especially at
high pitches above 698Hz. The pressed voice quality at 698Hz and 880Hz went against the
teaching of voice teachers and coaches and therefore, the “expert” subjects morphed the pressed
voice quality into breathy and normal voice qualities at the 2 highest pitches.
The difference in performance outcome between the 3 subjects with extensive vocal
training and the 18 subjects with minimal vocal training presents an interesting qualifier to
interpretation of results from the current study. That is, not only sensory information, but also
years and type of vocal training appeared to play a role in the coordination dynamics of a voice
task. The use of auditory and perhaps proprioceptive feedback on the coordination dynamics of
a voice task, therefore, may also be related to the level and type of vocal expertise of the
performer.
3.3.2 Limitations
A limitation of the study involved a perceptual goal of voice quality measured by
laryngeal resistance rather than a numeric standard of laryngeal resistance measured by laryngeal
139
resistance. Although laryngeal resistance is a valid measure of breathy, normal, and pressed
voice qualities (Grillo & Verodlini, in preparation), a 1:1 relationship does not exist. In
Experiment 1, the goal was a numeric standard of relative phase and performance was measured
by relative phase. In an effort to extend investigation beyond the typical bimanual domain, it
was determined that at this early stage on investigation perceptual goals would better reflect the
coordination dynamic of a voice task rather than numeric standards. Future investigation should
determine if numeric standards of laryngeal resistance are feasible. If the numeric standards are
feasible, then investigation should attempt to compare results across a numeric goal of laryngeal
resistance versus a perceptual goal of voice quality.
A second limitation of the study involved the subject characteristic of years and type of
vocal training. An inclusion criterion of at least 3 years of choral singing experience was set for
subject enrollment with no limit on type and years of vocal training. This lack of control for
subject characteristics facilitated the performance differences between the 3 subjects with
extensive vocal expertise and the 18 subjects with comparatively minimal vocal expertise. Data
for 18 out of the total 21 subjects were used in data analysis. A close to significant 2-way
interaction between quality and feedback was demonstrated for standard deviation of laryngeal
resistance (p=.072). The findings for the quality and feedback interaction on standard deviation
of laryngeal resistance appeared to be consistent with findings from the significant 2-way
interaction for quality and feedback on mean of laryngeal resistance. Perhaps the loss of power
by excluding the 3 “expert” subjects influenced the non-significant finding for the quality and
feedback interaction on standard deviation of laryngeal resistance.
A third limitation concerns the ability to generalize the findings to other populations and
other tasks within the voice domain and beyond. As noted, the subject pool consisted of young,
140

trained adult female singers. Thus, results cannot be easily generalized to children, adult males,
elderly females, or non-singers. The findings that were obtained appeared rather robust and
should be generalizable to the population of females (average age of 20 years) with three or more
years of choral singing experience only.
141

4.0 CHAPTER 4: CONCLUSIONS AND AVENUES FOR FUTURE RESEARCH
Experiment 1 assessed performance on a bimanual coordination task for a 0º in-phase and
a 180º anti-phase coordination pattern at slow (1 Hz), medium (2 Hz), and fast (3 Hz) speeds
under different conditions of visual and auditory feedback. Results showed that increasing speed
of bimanual oscillations deteriorated performance for the 180º anti-phase pattern, but did not
affect the 0º in-phase pattern. The continuous stability of the 0º in-phase pattern at increasing
speeds, the mutual stability of both the 0º in-phase and the 180º anti-phase patterns at the slow
speed, and the destabilization of the 180º anti-phase pattern at increasing speeds represents a
replication of findings previously reported in the literature (Kelso, 1984; Scholz & Kelso, 1989,
1990; Tuller & Kelso, 1989).
In contrast, previous findings of a relevance of sensory information for performance on a
bimanual coordination task (Cardoso de Oliveira & Barthelemy, 2005; Kazennikov et al., 2002;
Mechsner et al., 2001, 2004; Serrien & Teasdale, 1996; Swinnen et al., 2000) were not replicated
in Experiment 1. In Experiment 1, performance stability was not affected by either visual or
auditory feedback pertinent to the bimanual coordination task. In difference to that finding,
Experiment 2, which assessed performance on a voice coordination task, showed that sensory
feedback was relevant to task performance. Auditory deprivation produced an increase in
variability and an increase in mean laryngeal resistance under masking as compared to normal
feedback conditions, for minimally trained adult female vocalists. Specifically, pressed voice
142

quality was produced with increased mean laryngeal resistance in the masked auditory feedback
condition as compared to the normal auditory feedback condition, whereas resistance values
remained constant for breathy and normal voice qualities across feedback conditions. The
pressed voice quality may be more susceptible to auditory feedback influence because it was
more variable than the breathy and the normal voice qualities. Thus, sensory processes were
relevant to performance for some but not all of the voice tasks.
A question regards the difference in results across the studies. In order for results to
contribute to theoretical developments pertinent to motor control, consistent results should be
seen across domains. In the present study, findings regarding the relevance of sensory feedback
for motor control were inconsistent as a function of task domain; limb versus voice. As noted,
evidence of a role for feedback was not obtained for the limb task, but was seen for the voice
task. Several possible explanations can be conceived. First, perhaps a difference in task domain
affected the results. The limb study dealt with a physical movement having little applicability to
everyday use, whereas the voice study appealed to a system that is used daily for
communication.
Second, perhaps the difference in results was related to the requirements of the specific
task, more than to task domain. Perhaps bimanual coordination is shaped at least as much by
proprioception as it is by vision (or audition). Proprioception was not controlled in the present
study. Thus, feedback may indeed be relevant for the limb task, but the task-appropriate type of
feedback was not modulated in the study.
Third, perhaps a difference in subject type played a role in the results. In the limb study,
novices were enrolled who had no prior experience with the bimanual coordination task. In the
voice study, experienced vocalists were enrolled. Thus, it is conceivable that experience plays a
143

role in the relevance of sensory feedback for motor control. Some evidence consistent with that
possibility was seen in the voice experiment. Subjects with greater vocal experience and
presumably more expertise did not show much of an influence of auditory feedback on motor
control, whereas subjects with relatively less experience did show an influence.
Fourth, a more interesting hypothesis again has to do with the potential relevance of task
specificity for the results, but in a different direction than the one already introduced. In
Experiment 2, sensory feedback was shown to be pertinent for a voice coordination task that
appeared generally unstable (i.e., pressed voice), but not for tasks that were inherently more
stable (i.e., breathy and normal voice). Although the 180º pattern was shown to be less stable
than the 0º pattern for the limb task, perhaps the 180º pattern was not sufficiently unstable for a
role of sensory feedback to emerge. This possibility is an interesting one that would be of
particular interest to pursue with further, appropriately designed studies.
Another discrepancy in findings across the study was the role of “frequency of
oscillation” for task performance. Frequency played a clear role for performance accuracy in the
limb study, but did not play any discernible role for results in the voice study. In the limb study,
frequency was regulated by the striated, voluntary muscle system. In the voice study, frequency
was largely regulated by passive aerodynamic, myoelastic features of vocal fold tissue once the
laryngeal system achieved a stable posture (Titze, 1980). This difference in motor control for
frequency changes across the limb and the voice tasks may explain the discrepancy in findings.
In the meantime, it is interesting to consider how the results relate to existing theories of
motor control, and what theoretical adjustments, if any might be required to accommodate the
results. The results of the voice study showed that sensory feedback may be relevant for voice
patterns with a shallow basin of attraction, but irrelevant for voice patterns with a steep basin of
144

attraction. From the prospective of schema theory (Schmidt, 1975, 1976, 2003), the more stable
voice patterns may be governed by feedforward mechanisms specified by a recall schema,
whereas the less stable voice pattern may be influenced by the activation of the recognition
schema in the evaluation of sensory feedback. From the prospective of dynamic systems theory
and the original HKB (1985) model, the more stable voice patterns (i.e., breathy and normal)
were governed by coordinative dynamics. The change in performance of the pressed voice
quality across feedback conditions cannot be explained by coordinative dynamics alone.
Sensory feedback connections influenced the performance of the coordination dynamics for the
pressed voice quality. What is needed, therefore, is an expanded view of dynamic systems
theory that considers sensory feedback influences on coordinative dynamics.
Investigation should continue around this expanded view of dynamic systems theory in
an effort to generalize findings across 2 or more movement domains; such as a limb and a voice
task. To limit the differences between a limb and a voice task, future research should focus on
the identification of all sensory feedback conditions that influence the demands of a limb and a
voice task. In a limb task involving the bimanual linear slide, visual, auditory, and
proprioceptive feedback should be controlled. In a voice task involving aerodynamic measures,
auditory and proprioceptive feedback should be controlled. Future research should also focus on
the identification of similar movement goals between a limb and a voice task that require the
same level of expertise. For example, to be consistent with the goal of the voice study, the goal
of the limb study should include a level of expertise as seen in touch typing skills or piano
playing. Finding a way to merge bimanual coordination dynamics with voice coordination
dynamics in one ultimate movement and communication goal may also be an option for
improving generalization of findings across the 2 domains.
145

Turning to practical considerations, the question arises about the potential applicability of
the results for clinical or other physical training practice. If the findings from the present series
are real, the implication is that physical training programs should emphasize sensory feedback
processes, perhaps more than is commonly considered in practice. In fact, a newly developing
Global Voice Therapy Program emphasizes the relevance of both auditory and kinesthetic
feedback for the performance of newly learned behaviors, and also for generalization and
maintenance of those behaviors (Grillo, in preparation). Once developed, such models should be
subjected to the scrutiny of evaluation in the field, to determine the relevance of sensory factors
in training at the applied level.
In sum, the current studies provide further impetus for continued research regarding the
role of sensory feedback influences in the coordination dynamics of limb, voice, and other tasks.
Facilitation of the basic knowledge regarding greater advances in the understanding of how
sensory feedback and motor mechanisms interact in adaptive, biological systems is critical to the
development of physical training and rehabilitation programs and an emerging theoretical
framework founded in a heterarchical perspective with consideration of sensory feedback
influences on coordinative dynamics. With continued investigations, physical therapists,
occupational therapists, speech-language pathologists, voice therapists, and other rehabilitation
specialists, as well as athletic trainers will hopefully be more equipped to base assessment and
treatment plans on theoretical investigations exploring the intersection of sensory feedback and
motor mechanisms.
146

5.0 CHAPTER 5: BIBLIOGRAPHY
Alku, P. & Vilkman, E. (1996). A comparison of glottal voice source quantification parameters in breathy, normal, and pressed phonation of female and male
speakers. Folia Phoniatrica et Logopaedica, 48, 240-254. Amazeen, E.L., Amazeen, P.G., Treffner, P.J. & Turvey, M.T. (1997). Attention and
handedness in bimanual coordination dynamics. Journal of Experimental Psychology: Human Perception and Performance, 23(5), 1552-1560.
Amazeen, E.L., Sternard, D. & Turvey, M.T. (1996). Predicting the nonlinear shift of stable equilibria in interlimb rhythmic coordination. Human Movement Science, 15, 521-542. Anderson, U. & Lyxell, B. (1998). Phonological deterioration in adults with an acquired severe hearing impairment. Scandanavian Audiology Supplementun, 49, 93-100 Arutyunyan, G.H., Gurfinkel, V.S. & Mirsky, M.L. (1969). Investigation of aiming at a target. Biophysics, 13, 536-538. Austin, S.F. & Titze, I.R. (1997). The effect of subglottal resonance upon vocal fold vibration. Journal of Voice, 11(4), 391-402. Barnsley, M.F. (1988). Fractals everywhere. Boston: Academic. Beek, P.J. & Beek, W.J. (1988). Tools for constructing dynamical models of rhythmic movement. Human Movement Science, 7, 301-342. Beek, P.J., Peper, C.E. & Daffertshofer, A. (2002). Modeling rhythmic interlimb coordination: Beyond the Haken-Kelso-Bunz model. Brain and Cognition, 48, 149-165. Behrman, A. (1999). Global and local dimensions of vocal dynamics. Journal of the Acoustical Society of America, 105(1), 432-443. Behrman, A. & Baken, R.J. (1997). Correlation dimensions of electroglottographic data from healthy and pathologic subjects. Journal of the Acoustical Society of America, 102(4), 2371-2379. Bernstein, N. (1967). The coordination and regulation of movements. NewYork: Pergamon Press. Berry, D.A., Herzel, H., Titze, I.R. & Story, B.H. (1996). Bifurcations in excised
larynx experiments. Journal of Voice, 10(2), 129-138. Berry, D.A., Verdolini, K., Montequin, D.W., Hess, M.M., Chan, R.W. & Titze, I.
(2001). A quantitative output-cost ratio in voice production. Journal of Speech, Language, and Hearing Research, 44, 29-37.
Bonnard, M. & Pailhous, J. (1999). Contribution of proprioceptive information to preferred versus constrained space-tome behavior in rhythmical movements. Experimental Brain Research, 128, 568-572.
147

Briggs, J. & Peat, F.D. (1989). Turbulent mirror: An illustrated guide to chaos theory and the science of wholeness. NewYork: Harper and Row. Buchanan, P.A. & Ulrich, B.D. (2001). The Feldenkrais Method: A dynamic approach
to changing motor behavior. Research Quarterly for Exercise and Sport, 72(4), 315-323. Camazine, S., Deneubourg, J.L. & Franks, N. (2001). Self-organization in biological
systems. Princeton, NJ: Princeton University Press. Campbell, D.K. (1987). Nonlinear science: From paradigms to practicalities. Los Alamos Science, Special Issue: 218-262. Cardoso de Oliveira, S. & Barthelemy, S. (2005). Visual feedback reduces bimanual
coupling of movement amplitudes, but not directors. Experimental Brain Research, 162, 78-88.
Carson, R.G. (1996). Neuromuscular-skeletal constraints upon the dynamics of perception action coupling. Experimental Brain Research, 110, 99-110.
Carson, R.G., Byblow, W.D., Abernathy, B. & Summers, J.J. (1996). The contribution of inherent and incidental constraints to intentional switching between patterns of bimanual coordination. Human Movement Science, 15, 565-589.
Carson, R.G., Goodman, D., Kelso, J.A.S. & Elliot, D. (1994). Intentional switching between patterns of interlimb coordination. Journal of Human Movement Studies, 27, 201-218.
Cordo, P., Bevan, L., Gurfinkel, V., Carlton, L., Carlton, M. & Kerr, G. (1995). Proprioceptive coordination of discrete movement sequences: Mechanism and generality. Canadian Journal of Physiology and Pharmacology, 73, 305-315.
Crick, F. & Koch, C. (1990). Towards a neurobiological theory of consciousness. Seminars in the Neurosciences, 2, 263-275. Crick, F. & Koch, C. (2003). A framework for consciousness. Nature Neuroscience, 6, 119-126. Coveney, P. & Highfield, R. (1990). The arrow of time: A voyage through science to solve time’s greatest mystery. New York: Columbine. Davis, W.J. (1976). Organizational concepts in the central motor networks of
invertebrates. In P.M. Herman, P.S.G. Stein & D. Stuart (Eds.), Neural control of locomotion. Advances in Behavioral Biology, 18, 265-292.
Ding, M., Tuller, B. & Kelso, S. (1995). Characterizing the dynamics of auditory perception. Chaos, 5, 70-75. Easton, T.A. (1972). On the normal use of reflexes. American Scientist, 60, 591-599. Edelman, G.M. (1987). Neural darwinism: The theory of neuronal group selection. New York: Basic Books Incorporated. Fant, G. (1960). Acoustic theory of speech production. The Hague: Mouton. Farin, G. & Hansford, D. (2005). Practical linear algebra: A geometry toolbox. Wellesley, MA: AK Peters Limited. Fauvel, J., Flood, R., Shortland, M. & Wilson, R. (1988). Let Newton be: A new perspective on his Life and works. New York: Oxford University Press. Feldman, A.G. (1986). Once more on the equilibrium-point hypothesis (lambda model) for motor control. Journal of Motor Behavior, 18, 17-54. Ferrand, C.T. (2006). Relationship between masking levels and phonatory stability in normal- speaking women. Journal of Voice, 20(2), 223-228.
148

Fontaine, R.J., Lee, T.D., & Swinnen, S.P. (1997). Learning a new bimanual coordination pattern: Reciprocal influences of intrinsic and to-be-learned patterns. Canadian Journal of Experimental Psychology, 51, 1-9.
Forrest, K., Abbas, P.J. & Zimmerman, G.N. (1986). Effects of white noise masking and low pass filtering on speech kinematics. Journal of Speech and Hearing
Research, 29(4), 549-562. Fowler, C.A. & Turvey, M.T. (1978). Skill acquisition: An event approach with special references to searching for the optimum of a function of several variables. In G.E. Stelmach (Ed.), Information processing in motor control and learning. New York: Academic Press. Fuchs, A., Kelso, J.A.S. (1994). A theoretical note on models of interlimb coordination.
Journal of Experimental Psychology: Human Perception and Performance, 20(5), 1088-1097.
Garbe, S.F., Siegel, G.M. & Pick, H.L. (1976). The influence of selected masking noises on Lombard and sidetone amplification effects. Journal of Speech and Hearing Research, 19(3), 523-535. Gauffin, J. & Sundberg, J. (1989). Spectral correlates of glottal voice source waveform
characteristics. Journal of Speech and Hearing Research, 32(3), 556-565. Gelfand, I.M., Gurfinkel, V.S., Tsetlin, M.L. & Shik, M.L. (1971). Some problems in the analysis of movements. In I.M. Gelfand, V.S. Gurfinkel, S.V. Fomin & M.L. Tsetlin (Eds.), Models of the structural-functional organization of certain biological systems (pp. 329-345). Cambridge, MA: MIT Press. Ghez, C. & Sanburg, R. (1995). Proprioceptive control of interjoint coordination.
Canadian Journal of Physiology and Pharmacology, 73, 273-284. Gleick, J. (1987). Chaos: Making a new science. New York: Viking. Gonnella, C., Hale, G., Ionta, M. & Perry, J.C. (1981). Self-instruction in a
perceptual motor skill. Physical Therapy,61(2), 177-184. Goozee, J.V., Murdoch, B.E., Theodoros, D.G. & Thompson, E.C. (1998). The effects
of age and gender on laryngeal aerodynamics. International Journal of Language and Communication Disorders, 33(2), 221-238. Grassberger, P. & Procaccia, I. (1983). Measuring strangeness of a strange attractor. Physica D, 9, 189-208. Greene, P.H. (1972). Problems of organization of motor systems. In R. Rosen & F.M.
Snell (Eds.), Progress in theoretical biology (Vol. 2). New York: Academic Press. Grillo, E.U. (in preparation). Global Voice Therapy Program. Grillo, E.U. & Verdolini, K. (in preparation). Evidence for distinguishing the voice
qualities of normal, resonant, pressed, and breathy by the aerodynamic ratios of laryngeal resistance and vocal efficiency.
Guillery, R.W. & Sherman, M. (2002). The thalamus as a monitor of motor outputs. Phil Trans Royal Society London B, 357, 1809-1821. Gurfinkel, V.S., Kots, Y.M., Paltsev, Y.I & Feldman, A.G. (1971). The compensation
of respiratory disturbances of the organization of interarticular interaction. In I.M. Gelfand, V.S. Gurfinkel, S.V. Fomin & M.L. Tsetlin (Eds.), Models of the structural-functional organization of certain biological systems. Cambridge, MA: MIT Press.
Haken, H. (1977). Synergetics: An introduction. Heidelberg: Springer-Verlag. Haken, H. (1983). Synergetics: An introduction. 3rd Edition. New York: Springer.
149

Haken, H. (1984). Synergetics: The science of structure. New York: Van Nostrand. Haken, H. (1988). Synergetics. IEEE circuits and devices magazine. November: 3-7. Haken, H. (1991). Synergetics—Can it help physiology. In H.Haken & H.P.Koepchen
(Eds.), Rhythms in physiological systems, Springer Series in Synergetics (Vol. 55). Berlin: Springer-Verlag.
Haken, H., Kelso, J.A.S., & Bunz, H. (1985). A theoretical model of phase transitions in human hand movements. Biological Cybernetics, 51, 347-356.
Hale, J. & Kocak, H. (1991). Dynamics and bifurcations. New York: Springer-Verlag. Haslinger, B., Erhard, P., Altemnuller, E., Hennenlotter, A., Schwaiger, M., von
Einsiedel, H., Rummeny, E., Conrad, B. & Ceballos-Bauman, A.O. (2004). Reduced recruitment of motor association areas during bimanual coordination of concert pianists. Human Brain Mapping, 22(3), 206-215.
Herzel, H., Berry, D., Titze, I.R. & Saleh, M. (1994). Analysis of voice disorders with methods from nonlinear dynamics. Journal of Speech and Hearing Disorders, 37, 1008-1019. Higgins, M.B. & Saxman, J.H. (1991). A comparison of selected phonatory behaviors of healthy aged and young adults. Journal of Speech and Hearing Research, 34, 1000-1010. Hillman, R.E., Holmberg, E.B., Perkell, J.S., Walsh, M. & Vaughan, C. (1989).
Objective assessment of vocal hyperfunction: An experimental framework and initial results. Journal of Speech and Hearing Research, 32, 373-392.
Hillman, R.E., Holmberg, E.B., Perkell, J.S., Walsh, M. & Vaughan, C. (1990). Phonatory function associated with hyperfunctionally related vocal fold lesions. Journal of Voice, 4(1), 52-63. Hirano, M. (1989). Objective evaluation of the human voice: Clinical aspects. Folia Phoniatrica, 41, 89-144. Hixon, T.J. (1973). Respiratory function in speech. In F.D. Minifie, T.J. Hixon & F. Williams (Eds.), Normal aspects of speech, hearing, and language (pp. 73- 125). Englewood Cliffs, NJ: Prentice Hall. Hixon, T.J. & Weismer, G. (1995). Perspectives on the Edinburgh Study of speech
breathing. Journal of Speech and Hearing Research, 38, 42-60. Hochstenbach, J. & Mulder, T. (1999). Neuropsychology and the relearning
of motor skills following stroke. International Journal of Rehabilitation Research, 22 (1), 11-19.
Hodges, N.J., & Lee, T.D. (1999). The role of augmented information prior to learning a bimanual visual-motor coordination task: Do instructions of the movement pattern facilitate learning relative to discovery learning? British Journal of Psychology, 90, 389-403.
Holmberg, E.B., Hillman, R.E. & Perkell, J.S. (1988). Glottal airflow and transglottal air pressure measurements for male and female speakers in soft, normal, and loud voice. Journal of the Acoustical Society of America, 84 (2), 511-529.
Holmberg, E.B., Hillman, R.E. & Perkell, J.S. (1989). Glottal airflow and transglottal air pressure measurements for male and female speakers in low, normal, and high pitch. Journal of Voice, 3, 294-305.
150

Holmberg, E.B., Hillman, R.E., Perkell, J.S. & Gress, C. (1994). Relationships between intra-speaker variation in aerodynamic measures of voice production and
variation in SPL across repeated recordings. Journal of Speech and Hearing Research, 37, 484-495. Hsiao, S.S., O’Shaughnessy, D.M. & Johnson, K.O. (1993). Effects of selective attention on spatial form processing in monkey primary and secondary somatosensory cortex. Journal of Neurophysiology, 70, 444-447. International Electrotechnical Commission. (1979). Audiometers (IEC 645)
Geneva: IEC. Ishizaka, K. & Flanagan, J.L. (1972). Synthesis of voice sounds from a two-mass model of the vocal cords. Journal of Bell System Technology, 51, 1233-1268. Ishizaka, K. & Isshiki, N. (1976). Computer simulation of pathological vocal cord vibration. Journal of the Acoustical Society of America, 60, 1194-1198. Isshiki, N. (1981). Vocal efficiency index. In K.N. Stevens & M. Hirano (Eds.), Vocal fold physiology (pp. 193-203). Japan: University of Tokyo Press. Jackson, G.M., Jackson, S.R., Husain, M., Harvey, M., Kramer, T. & Dow, L. (2000). The coordination of bimanual prehension movements in a centrally deafferented patient. Brain, 123, 380-393. Jackson, G.M., Jackson, S.R., Newport, R. & Harvey, M. (2002). Coordination of
bimanual movements in centrally deafferented patient executing open loop reach-to-grasp movements. Acta Psychologica, 110, 231-246.
Jeka, J.J. & Kelso, J.A.S. (1989). The dynamic pattern approach to coordinated behavior: A tutorial review. In S.A. Wallace (Ed.), Perspectives on the coordination of movement (pp. 3-45). Amsterdam: Elsevier. Jirsa, V.K., Fuchs, A. & Kelso, J.A.S. (1998). Connecting cortical and behavioral
dynamics: Bimanual coordination. Neural Computation, 10(8), 2019-2045. Johnson, K., Cunnington, R., Bradshaw, J., Phillips, J., Iansek, R. & Rogers, M. (1998). Bimanual co-ordination in Parkinson’s disease. Brain, 121(4), 743-753. Jones, E.G. (2001). The thalamic matrix and thalamocortical synchrony. Trends in Neurosciences, 24, 595-601. Kalaska, J.F. & Crammond, D.J. (1992). Cerebral cortical mechanisms of reaching movements. Science, 255, 1512-1523. Kay, B.A., Kelso, J.A.S., Saltzman, E.L. & Schöner, G. (1987). Space-time behavior
of single and bimanual rhythmical movements: Data and limit cycle model. Journal of Experimental Psychology: Human Perception and Performance, 13, 178-192.
Kazennikov, O., Perrig, S. & Wiesendanger, M. (2002). Kinematics of coordinated goal-directed behavior. Behavioural Brain Research, 134, 83-91.
Kelman, A.W. (1981). Vibratory pattern of the vocal folds. Folia Phoniatrica, 33, 73-99. Kelso, J.A.S. (1981). On the oscillatory basis of movement. Bulletin of the Psychonomic Society, 18, 63. Kelso, J.A.S. (1984). Phase transitions and critical behavior in human bimanual coordination. American Journal of Physiology, 15, R1000-R1004.
151
Kelso, J.A.S. (1995). Dynamic patterns: The self-organization of brain and behavior. Cambridge, MA: MIT Press. Kelso, J.A.S. (1997). Relative timing in brain and behavior: Some observations about the
generalized motor program and self-organized coordination dynamics. Human Movement Science, 16, 453-460.
Kelso, J.A.S. & Bateson, E.V. (1983). On the cyclical basis of speech production. Journal of the Acoustical Society of America, 73 (suppl. 1), S67. Kelso, J.A.S., Holt, K.G., Kugler, P.N. & Turvey, M.T. (1980). On the concept of coordinative structures: II. Empirical lines of convergence. In G.E. Stelmach & J. Requin (Eds.), Tutorials in motor behavior (pp. 49-70). Amsterdam:
New Holland. Kelso, J.A.S. & Tuller, B. (1984). Converging evidence in support of common
dynamical principles for speech and movement coordination. American Journal of Physiology, 246, R928-R935.
Kent, R.D. (1997). The Speech Sciences. San Diego, CA and London, England: Singular Publishing Group, Inc. Kiran, S. & Larson, C.R. (2001). Effect of duration of pitch-shifted feedback on vocal
responses in patients with Parkinson’s disease. Journal of Speech, Language, and Hearing Research, 44(5), 975-987.
Klingholz, F. (1992). Computer aided evaluation of phonetograms. Computer Methods and Programs in Biomedicine, 37(2), 127-135. Kugler, P.N., Kelso, J.A.S. & Turvey, M.T. (1980). On the concept of coordinative structures: I. Theoretical lines of convergence. In G.E. Stelmach & J. Requin (Eds.), Tutorials in motor behavior (pp. 3-47). Amsterdam: New Holland. Kugler, P.N. & Turvey, M.T. (1987). Information, natural law, and the self-assembly of rhythmic movement. Hillsdale, NJ: Erlbaum. Kunze, L. An investigation of the changes in subglottal air pressure and rate of air flow accompanying changes in the fundamental frequency, intensity, vowels, and voice registers in adult male speakers. Doctoral dissertation, University of Iowa. Lane, H. & Webster, J.W. (1991). Speech deterioration in postlingually deafened adults. Journal of the Acoustical Society of America, 89(2), 859-866. Laskar, J. (1989). A numerical experiment on the chaotic behavior of the solar system. Nature, 338, 237. Latash, M.L. & Anson, J.G. (1996). What are “normal movements” in atypical
populations? Behavioral and Brain Sciences, 19(1), 55-67. Laukkanen, A.M., Lindholm, P. & Vilkman, E. (1995). On the effects of various vocal training methods on glottal resistance and efficiency: A preliminary report.
Folia Phoniatrica et Logopaedica, 47(6), 324-330. Lee, T.D., Almeida, Q.J. & Chua, R. (2002). Spatial constraints in bimanual coordination: Influences of effector orientation. Experimental Brain Research,
146(2), 205-212. Lee, T.D., Blandin, Y. & Proteau, L. (1996). Effects of task instructions and oscillation
frequency on bimanual coordination. Psychological Research, 59, 100-106. Liao, M.J. & Jagacinski, R.J. (2000). A dynamical systems approach to manual tracking performance. Journal of Motor Behavior, 32 (4), 361-378.
152

Lipsitz, L.A. (1995). Age-related changes in the complexity of cardiovascular dynamics: A potential marker of vulnerability to disease. Chaos, 5, 102-109. Lorenz, E.N. (1963). Deterministic nonperiodic flow. Journal of Atmospheric Sciences, 20, 130-141. Ludlow, C.L., Bassich, C.J. & Connor, N.P. (1985). An objective system for assessment and analysis of dysarthric speech. In J.K. Darby (Ed.), Speech and language evaluation in neurology: Adult disorders (pp. 393-428). Orlando: Grune &
Stratton. Mandelbrot, B.B. (1983). The fractal geometry of nature. San Francisco: Freeman. Mechsner, F., Kerzel, D., Knoblich, G. & Prinz, W. (2001). Perceptual basis of bimanual coordination. Nature, 414 (1), 69-73. Mechsner, F. & Knoblich, G. (2004). Do muscles matter for coordinated action? Journal of Experimental Psychology: Human, Perception and Performance, 30(3), 490-503. Mergell, P., Fitch, W.T. & Herzel, H. (1999). Modeling the role of nonhuman vocal membranes in phonation. Journal of the Acoustical Society of America, 105(3), 2020-2028. Miller, M.K. & Verdolini, K. (1995). Frequency and risk factors for voice problems in teachers of singing and control subjects. Journal of Voice, 9(4), 348-362. Monno, A., Chardenon, A., Temprado, J.J., Zanone, P.G. & Laurent, M. (2000). Effects
of attention on phase transitions between bimanual coordination patterns: A behavioral and cost analysis in humans. Neuroscience Letters, 283(2), 93-96.
Mountcastle, V.B. (1979). An organizing principle of cerebral function: The unit module and the distributed system. In F.O. Schmitt & F.G. Worden (Eds.) The neurosciences: Fourth study program (pp. 21-42). Cambridge, MA:
The MIT Press. Mulder, T. (1991). A process-oriented model of human motor behavior: Toward a
theory-based rehabilitation approach. Physical Therapy, 71(2), 157-168. Mulder, T., Zijlstra, S., Zijlstra, W. & Hochstenbach, J. (2004). The role of mental
imagery in learning a totally novel movement . Experimental Brain Research, 154, 211-217.
Natke, U. & Kalveram, K.T. (2001). Effects of frequency-shifted auditory feedback on fundamental frequency of long stressed and unstressed syllables. Journal of
Speech, Language, and Hearing Research, 44(3), 577-584. Netsell, R., Lotz, W. & Shaughnessy, A.L. (1984). Laryngeal aerodynamics associated with selected voice disorders. American Journal of Otolaryngology, 5, 397-403. Newell, K.M., Kugler, P.N., van Emmerik, R.E.A. & McDonald, P.V. (1989). Search strategies and the acquisition of coordination. In S.A. Wallace (Ed.), Perspectives on the coordination of movement (pp. 85-122). Amsterdam: North-Holland. Niebur, E., Hsiao, S.S. & Johnson, K.O. (2002). Synchrony: A neuronal mechanism for attentional selection? Current Opinion in Neuroscience, 12, 190-194. Parlitz, D., Peschel, T. & Altenmuller, E. (1998). Assessment of dynamic finger forces
in pianists: Effects of training and experience. Journal of Biomechanics, 31(11), 1063-1070.
153

Peck, A.J. & Turvey, M.T. (1997). Coordination dynamics of the bipedal galloping pattern. Journal of Motor Behavior, 29 (4), 311-326. Peper, C.E., Beek, P.J. & Daffertshofer, A. (2000). Considerations regarding a comprehensive model of (poly)rhythmic movements. In P.Desain & L.Windsor (Eds.), Rhythm perception and production (pp. 35-49). Lisse: Swets &
Zeitlinger. Peterson, K.L., Verdolini-Marston, K., Barkmeier, J.M. & Hoffman, H.T. (1994). Comparison of aerodynamic and electroglottographic parameters in evaluating clinically relevant voicing patterns. Annals of Otology, Rhinology, and Laryngology, 103, 335-346. Prigogine, I. & Stengers, I. (1984). Order out of chaos: Man’s new dialogue with nature. New York: Bantam Books. Ragert, P., Schmidt, A., Altenmuller, E. & Dinse, H.R. (2004). Superior tactile
performance and learning in professional pianists: Evidence for meta-plasticity in musicians. European Journal of Neuroscience, 19(2), 473-480.
Rammage, L.A., Peppard, R.C. & Bless, D.M. (1992). Aerodynamic, laryngoscopic, and perceptual-acoustic characteristics in dysphonic females with posterior glottal chinks: A retrospective study. Journal of Voice, 6(1), 64-78. Riley, M.A., Amazeen, E.L., Amazeen, P.G., Treffner, P.J. & Turvey, M.T. (1997).
Effects of temporal scaling and attention on the asymmetrical dynamics of bimanual coordination. Motor Control, 1, 263-283.
Rosenbaum, D.A. & Gregory, R.W. (2002). Development of a method for measuring movement-related effort: Biomechanical considerations and implications for Fitt’s Law. Experimental Brain Research, 142, 365-373.
Rothenberg, M.R. (1973). A new inverse-filtering technique for deriving the glottal airflow waveform during voicing. Journal of the Acoustical Society of America, 53, 1632-1645. Rousselle, C. & Wolff, P.H. (1991). The dynamics of bimanual coordination in
developmental dyslexia. Neuropsychologia, 29(9), 907-924. Russell, A., Oates, J. & Greenwood, K.M. (1998). Prevalence of voice disorders in
teachers. Journal of Voice, 12(4), 467-497. Sainburg, R.L., Poizner, H. & Ghez, C. (1993). Loss of proprioception produces deficits in interjoint coordination. Journal of Neurophysiology, 70, 2136-2147. Salter, J., Wishart, L., Lee, T. & Simon, D. (2004). Perceptual and motor contributions to bimanual coordination. Neuroscience Letters, 363, 102-107. Sant, L. Logemann, J. (1970). An investigation of the variations in air flow and
subglottal pressure with changes in pitch and intensity of phonation. Paper presented to the Annual Convention of the American Speech-Language-Hearing
Association, New York. Serrien, D.J. & Teasdale, N. (1996). Age-related differences in the integration of
sensory information during the execution of a bimanual coordination task. Journal of Motor Behavior, 28 (4), 337-348.
Schmidt, R.A. (1975). A schema theory of discrete motor skill learning. Psychological Review, 82, 225-260. Schmidt, R.A. (1976). Control processes in motor skills. Exercise and Sports Sciences
Reviews, 4, 229-261.
154

Schmidt, R.A. (2003). Motor schema theory after 27 years: reflections and implications for a new theory. Research Quarterly for Exercise and Sport, 74(4), 366-375.
Schmidt, R.C., Beek, P.J., Treffner, P.J. & Turvey, M.T. (1991). Dynamical substructure of coordinated rhythmic movement. Journal of Experimental Psychology: Human Perception and Performance, 17, 635-651.
Schmidt, R.C. & Fitzpatrick, P. (1996). Dynamical perspective on motor learning. In H.N. Zelaznik (Ed.) Advances in motor learning and control (pp. 195-223). Champaign, IL: Human Kinetics.
Schmidt, R.C., Fitzpatrick, P., Bienvenu, M. & Amazeen, P.G. (1998). A comparison of intra- and interpersonal interlimb coordination: Coordination breakdowns
and coupling strength. Journal of Experimental Psychology: Human Perception and Performance, 24 (3), 884-900.
Schmidt, R.C., Shaw, B.K. & Turvey, M.T. (1993). Coupling dynamics in interlimb coordination. Journal of Experimental Psychology:Human Perception and Performance, 19 (2), 397-415.
Scholz, J.P. (1990). Dynamic pattern theory – some implications for therapeutics. Physical Therapy, 70(12), 827-917.
Scholz, J.P. & Kelso, J.A.S. (1990). Intentional switching between patterns of bimanual coordination depends on the intrinsic dynamics of the patterns. Journal of Motor Behavior, 22, 98-124.
Schöner, G. (1990). A dynamic theory of coordination of discrete movement. Biological Cybernetics, 63, 257-270. Schöner, G. & Kelso, J.A.S. (1988a). A dynamic theory of behavioral change.
Journal of Theoretical Biology, 135, 501-524. Schöner, G. & Kelso, J.A.S. (1988b). A synergetic theory of environmentally-specified
and learned patterns of movement coordination. Biological Cybernetics, 58, 71- 80.
Schöner, G., Zanone, P.G. & Kelso, J.A.S. (1992). Learning as change of coordination dynamics: Theory and experiment. Journal of Motor Behavior, 24, 29-48.
Scott, T., Green, W.B. & Stuart, A. (2001). Interactive effects of low-pass filtering and masking noise on word recognition. Journal of the American Academy of Audiology, 12(9), 437-444.
Schutte, H.K. (1981). The efficiency of voice production (Kemper, Groningen), 192. Sherrington, C.S. (1906). The integrative action of the nervous system. New Haven, CT: Yale University Press. Shik, M.L. & Orlovski, G.N. (1976). Neurophysiology of locomotor automation. Psychological Reviews, 56, 465-501. Shipp, T. & McGlone, R. (1971). Laryngeal dynamics associated with voice frequency change. Journal of Speech and Hearing Research, 14, 761-768. Slotine, J.J.E. & Li, W. (1991). Applied nonlinear control. New Jersey: Prentice Hall. Smethurst, C.J. & Carson, R.G. (2001). The acquisition of movement skills: Practice
enhances the dynamic stability of bimanual coordination. Human Movement Science, 20(4-5), 499-529.
155

Smith, T.G. & Neale, E.A. (1994). A fractal analysis of morphological differentiation of spinal cord neurons in cell culture. In T.F. Nonnemacher, G.A. Losa & E.R. Weibel (Eds.), Fractals in biology and medicine (pp. 10-220). Basel: Birhauser
Verlag. Smitheran, J.R. & Hixon, T.J. (1981). A clinical method for estimating laryngeal airway
resistance during vowel production. Journal of Speech and Hearing Research, 46, 138-146.
Stathopoulos, E.T. & Sapienza, C. (1993). Respiratory and laryngeal function of women and men during vocal intensity variation. Journal of Speech and Hearing Research, 36, 64-75. Stathopoulos, E.T. & Weismer, G. (1985). Oral airflow pressure during speech production: A comparative study of children, youths, and adults. Folia Phoniatrica, 37, 152-159. Steinecke, I. & Herzel, H. (1995). Bifurcations in an asymmetric vocal fold model. Journal of the Acoustical Society of America, 97, 1874-1884. Steinhauer, K. (2001). The relationship among voice onset, voice quality,
and fundamental frequency: A dynamical perspective (Doctoral dissertation, University of Pittsburgh, 2001). UMI’s Dissertation Abstracts Database. (University Microfilms No. 9998609).
Sternard, D. & Amazeen, E.L. (1996). Diffusive, synaptic, and synergetic coupling: An evaluation through in-phase and anti-phase. Journal of Motor Behavior, 28 (3), 255-270. Stevens, K.N. (1981). Vibration modes in relation to model parameters. In K.N. Stevens & M. Hirano (Eds.), Vocal fold physiology (pp. 291-301). Japan: University of Tokyo Press. Swinnen, S.P., Dounsakaia, N., Walter, C.B., & Serrien, D.J. (1997). Preferred and
induced coordination modes during the acquisition of bimanual movements with a 2:1 frequency ratio. Journal of Experimental Psychology: Human Perception and Performance, 23, 1087-1110.
Swinnen, S.P., Jardin, K. & Meulenbroek, R. (1996). Between-limb asynchronies during bimanual coordination: Effects of manual dominance and attentional cueing. Neuropsychologia, 34(12), 1203-1213.
Swinnen, S.P., Lee, T.D., Verschueren, S., Serrien, D.J., & Bogaerds, H. (1997). Interlimb coordination: Learning and transfer under different feedback conditions. Human Movement Science, 16, 749-785.
Swinnen, S.P., Steyvers, M., Van Der Bergh, L. & Stelmach, G.E. (2000). Motor learning and Parkinson’s disease: Refinement of within-limb and between-limb coordination as a result of practice. Behavioural Brain Research, 111, 45-59. Takens, F. (1981). Detecting strange attractors in turbulence. In D. Rand & L. Young (Eds.), Lecture notes in mathematics, 898, (pp. 366). Berlin: Springer-Verlag. Tang, J. & Stathopoulos, E.T. (1995). Vocal efficiency as a function of vocal intensity: A study of children, women, and men. Journal of the Acoustical Society of America, 97(3), 1885-1892. Temprado, J.J., Monno, A., Zanone, P.G. & Kelso, J.A.S. (2002).
Attentional demands reflect learning-induced alterations of bimanual coordination dynamics. European Journal of Neuroscience, 16(7), 1390-4.
156

Temprado, J.J., Zanone, P.G., Monno, A., Laurent, M. (1999). Attentional load associated with performing and stabilizing preferred bimanual patterns. Journal of Experimental Psychology: Human Perception and Performance, 25(6), 1579- 1594.
Titze, I.R. (1976). On the mechanics of vocal fold vibration. Journal of the Acoustical Society of America, 60, 1366-1380. Titze, I.R. (1980). Comments on the myoelastic aerodynamic theory of phonation. Journal of Speech and Hearing Research, 23(3), 495-510. Titze, I.R. (1994). Principles of Voice Production (pp. 97-100). Englewood NJ: Prentice Hall. Titze, I.R. (2000). Principles of Voice Production. Iowa City, IA: Prentice-Hall. Titze, I.R. (2002). Regulating glottal airflow in phonation: Application of the maximum power transfer theorem to a low-dimensional phonation model. Journal of the Acoustical Society of America, 111, 367-376. Titze, I.R. & Sundberg, J. (1992). Vocal intensity in speakers and singers. Journal of the Acoustical Society of America, 91(5), 2936-2946. Tokuda, I., Riede, T., Neubauer, J., Owren, M.J. & Herzel, H. (2002). Nonlinear analysis of irregular animal vocalizations. Journal of the Acoustical Society of America, 111(6), 2908-2919. Turvey, M.T. (1977). Preliminaries to a theory of action with reference to vision. In R. Shaw & J. Bransford (Eds.), Perceiving, acting, and knowing: Toward an ecological psychology. Hillsdale, NJ: Erlbaum. Turvey, M.T. (1990). Coordination. American Psychologist, 45 (8), 938-953. Turvey, M.T., Rosenblum, L.D., Schmidt, R.C. & Kugler, P.N. (1986). Fluctuations and phase symmetry in coordinated rhythmic movements. Journal of Experimental Psychology: Human Perception and Performance, 12, 564-583. Verdolini, K., Druker, D.G., Palmer, P.M., Samawi, H. (1998). Laryngeal adduction in
resonant voice. Journal of Voice, 12(3), 315-327. Wallace, S.A. (1996). Dynamic pattern perspective of rhythmic movement: An
introduction. In H.N. Zelaznik (Ed.) Advances in motor learning and control (pp. 155-194). Champaign, IL: Human Kinetics.
Walsh, F.M.R. (1961). Contributions of John Hughlings Jackson to neurology. Archives of Neurology, 5, 119-131. Winstein, C.J. (1991). Knowledge of results and motor learning: Implications for
physical therapy. Physical Therapy, 71(2), 140-149. Wooldridge, C.P. & McLaurin, C.A. (1976). Biofeedback: Background and applications
to physical rehabilitation. Bulletin of Prosthetic Research, 10-25, 25-37. Wuyts, I.J., Summers, J.J., Carson, R.G., Byblow, W.D. & Semjen, A. (1996). Attention
as mediating variable in the dynamics of bimanual coordination. Human Movement Science, 15, 877-897.
Yamanishi, J., Kawato, M. & Suzuki, R. (1980). Two coupled oscillators as a model for the coordinated finger tapping by both hands. Biological Cybernetics, 37, 219-225.
Zanone, P.G. & Kelso, J.A.S. (1992). Evolution of behavioral attractors with learning: Nonequilibrium phase transitions. Journal of Experimental Psychology: Human Perception and Performance, 18, 403-421.
157

Zanone, P.G. & Kelso, J.A.S. (1997). The dynamics of learning and transfer: Collective and component levels. Journal of Experimental Psychology: Human Perception and Performance, 23(5), 1454-1480.
Zanone, P.G., Monno, A., Temprado, J.J. & Laurent, M. (2001). Shared dynamic of attentional cost and pattern stability in the control of bimanual coordination. Human Movement Science, 20, 765-789.
Zanone, P.G., Temprado, J.J. & Monno, A. (1999). Attentional load covaries with pattern stability in the control of bimanual coordination. In M.A. Grealy, & J.A. Thomson (Eds.), Studies in event perception and action V (pp. 297-300). Hillsdale, NJ: LEA.
Zemlin, W.R. (1998). Speech and hearing science: Anatomy and physiology (4th Edition). Needham Heights, MA: Allyn and Bacon.
158


![On the Role of Wearable Haptics for Force Feedback in ... · virtual environments [8], or sensory substitution. The sensory substitution method is a promising approach that relies](https://img.dokumen.tips/doc/110x75/5f4be8715e4f383f6e2989d7/on-the-role-of-wearable-haptics-for-force-feedback-in-virtual-environments-8.jpg)


