Embed Size (px)
Citation preview
The Role of Offender Managers in Community Orders Results from the Offender Manager Community Cohort Study
Chris Lord, Tom Kenny and Martin Wood NatCen Social Research and GtD
Ministry of Justice Analytical Series 2014

Analytical Services exists to improve policy making, decision taking and practice by
the Ministry of Justice. It does this by providing robust, timely and relevant data and
advice drawn from research and analysis undertaken by the department’s analysts
and by the wider research community.
Disclaimer
The views expressed are those of the authors and are not necessarily shared by the Ministry
of Justice (nor do they represent Government policy).
First published 2014
© Crown copyright 2014
You may re-use this information (excluding logos) free of charge in any format or medium,
under the terms of the Open Government Licence. To view this licence, visit
http://www.nationalarchives.gov.uk/doc/open-government-licence/ or email:
Where we have identified any third party copyright material you will need to
obtain permission from the copyright holders concerned.
Any enquiries regarding this publication should be sent to us at
This publication is available for download at
https://www.gov.uk/government/organisations/ministry-of-justice/about/research
ISBN 978-1-84099-636-4

Acknowledgements
We would like to thank Anna Upson, James Riley, Simon Keogh and Clare Lyne at the
Ministry of Justice, as well as the project steering group, for their support and guidance
throughout the study.
Thanks also go to Jack Cattell (Get the Data), Alan Mackie (Get the Data) and Matt Hopkins
(formerly of Matrix Knowledge Group), our collaborators in the design and implementation of
the study.
We are also indebted to NOMS not only for assisting in the collection of a vast amount of
local and national administrative data, but also for their support and cooperation in recruiting
respondents.
A final thanks to all the respondents who participated in the research. Without their
contributions, this work would not have been possible.
The authors
Chris Lord is a Research Analyst at NatCen.
Tom Kenny is a Researcher at NatCen.
Martin Wood is a Research Director at NatCen.

Contents
List of tables
List of figures
1. Summary 1
1.1 Context 1
1.2 Approach 2
1.3 Key findings 2
2. Introduction 4
2.1 Context 4
2.2 Aims 6
2.3 Approach 6
3. Nature of contact 10
3.1 Frequency and duration of meetings 10
3.2 Contact outside meetings 12
3.3 Consistency of staffing 13
4. Discussions between Offender Managers and offenders 14
4.1 Topics discussed with Offender Managers 14
4.2 How useful did offenders find the discussions? 16
4.3 Offender needs and discussions with Offender Managers 17
4.4 Attitudes towards Offender Managers 21
5. Offender management and sentence outcomes 23
5.1 Use of warnings 23
5.2 Breaches 25
5.3 Offender Managers and motivation 27
6. Conclusions 30
References 32
Appendix A 35
Additional tables 35
List of tables
Table 3.1 Frequency and duration of meetings with Offender Manager, at the Wave 1 survey (as reported by offender) 12
Table 3.2 Number of probation staff the offender talked to between the beginning of the Community Order and the Wave 1 survey 13
Table 4.1 Percentage of offenders discussing topics with Offender Managers 15
Table 4.2 Offenders’ attitudes to their Offender Managers, at Wave 1 survey 22
Table 5.1 Relationship with Offender Manager by whether offenders received warnings (as reported by the offender) 24
Table 5.2 Percentage of offenders reporting receiving a warning and offenders’ perception of fairness by attendance at probation meetings, at the Wave 1 survey 24
Table 5.3 Relationship with Offender Manager by whether offenders breached (as reported by the offender) 26
Table 5.4 Percentage of offenders who said that their Offender Manager motivated them to avoid crime by duration of meetings with Offender Manager, at the Wave 1 survey 28
Table 5.5 Percentage of offenders who said that their Offender Manager motivated them to avoid crime by number of topics discussed with Offender Manager, at the Wave 1 survey 29
Table A.1 Frequency of meetings offenders reported having with their Offender Manager 35
Table A.2 Duration of meetings offenders reported having with their Offender Manager 35
Table A.3 Percentage of offenders who reported contacting their Offender Manager outside of meetings 35
Table A.4 Number of probation staff offenders reported talking to between the beginning of the Community Order and the Wave 1 survey by tier, risk and sentence length 36
Table A.5 Number of topics offenders reported discussing with Offender Manager 36
Table A.6 Number of topics offenders reported discussing with Offender Manager by risk of reoffending 36
Table A.7 Offenders’ views of the usefulness of discussions with Offender Manager, by topic of discussion 37
Table A.8 Percentage of offenders who had discussions with Offender Manager on each topic, by whether they had a related OASys identified need 37
Table A.9 Percentage of offenders with an OASys identified need who discussed the topic related to that need with Offender Manager and who found those discussions useful 38
Table A.10 Offenders’ views of the usefulness of discussions with Offender Manager, by topic of discussion and whether they had an OASys identified need related to that topic 38
Table A.11 Percentage of offenders with OASys identified needs who discussed topics related to those needs with Offender Manager 39

Table A.12 Offender’s views of whether they needed help with each OASys identified need, by whether topics related to need were discussed with Offender Manager 39
Table A.13 Percentage of offenders who reported behaviours that indicated each need and who had that need identified in OASys, by whether topics related to that OASys need were discussed with Offender Manager 40
Table A.14 Percentage of offenders with OASys identified needs who discussed topics related to that need, by whether Offender Manager perceived each need to be related to offending 40
Table A.15 Percentage of offenders with a drug or alcohol requirement in their Community Order, by whether they had an OASys need or the offender reported a need for help in that area 41
Table A.16 Percentage of offenders with each requirement in their Community Order who had discussed topics related to that requirement with Offender Manager 41
Table A.17 Offenders’ views of the usefulness of discussions with Offender Manager by whether they had a treatment requirement for that need 41
Table A.18 Offenders’ views of their relationship with their Offender Manager 41
Table A.19 Change over time in offenders’ views of relationship with Offender Manager 42
Table A.20 Offenders’ views of relationship with Offender Manager by risk of reoffending (OGRS) 42
Table A.21 Offenders’ attitudes to their Offender Managers at the latest available survey 42
Table A.22 Percentage of offenders who said that their Offender Manager understood their needs well, by risk of reoffending (OGRS) 43
Table A.23 Sentence outcomes reported by offenders1 43
Table A.24 Percentage of offenders who reported that they had been breached, by whether they also reported being given a warning 43
Table A.25 Logistic regression of offender-reported breach during the Community Order 44
Table A.26 Percentage of offenders who said their Offender Manager motivated them to avoid crime, by frequency of meetings with Offender Manager 46
Table A.27 Percentage of offenders who said their Offender Manager motivated them to avoid crime, by number of potential needs discussed with Offender Manager 46
Table A.28 Percentage of offenders who said their Offender Manager motivated them to avoid crime, by number of OASys identified needs discussed 46

List of figures
Figure 3.1 Frequency of meetings with Offender Manager (as reported by offender) 10
Figure 3.2 Duration of meetings with Offender Manager (as reported by offender) 11
Figure 4.1 Offenders’ views of the amount Offender Managers asked how each requirement was going, by type of requirement, at the Wave 1 survey 16
Figure 4.2 Offenders’ views of the usefulness of discussions with Offender Manager, by topic of discussion, at the Wave 1 survey 17
Figure 4.3 Offenders’ views of usefulness of discussions with Offender Managers related to each OASys identified need, by the Wave 1 survey 19
Figure 5.1 Percentage of offenders reporting breach by frequency and duration of meetings with Offender Managers 26

1. Summary
This report is one of a series that summarises findings from the Ministry of Justice’s (MoJ’s)
Offender Manager Community Cohort Study (OMCCS), a longitudinal cohort study of
offenders, aged 18 and over, who started Community Orders between October 2009 and
December 2010.
The aim of this report is to look at the role of the Offender Manager in implementing and
managing Community Orders, the quality of the relationship between offenders and Offender
Managers and the impact these elements have on sentence outcomes of Community Orders.
The role of the Offender Manager is important in achieving successful rehabilitation. This
report will be of interest to those involved in the development of policy and practice in the
implementation of Community Orders and supervision in the community.
1.1 Context The Criminal Justice Act 2003 introduced Community Orders in England and Wales for
offenders aged 18 and over, enabling judges and magistrates to tailor sentences according
to the particular nature of the offence and the offender. Community Orders are made up of a
‘menu’ of possible requirements, such as unpaid work or treatment for drug problems, which
can be imposed by the courts individually or in combination.
The Government is making changes to the way offenders are managed in the community,
including offenders on Community Orders, to reduce reoffending. The Crime and Courts Act
2013 has brought into legislative effect proposals to ensure that every Community Order
includes an element of punishment. Proposals have been made to reform the provision of
services in the community by opening up the market to a diverse range of new rehabilitation
providers, incentivised through payment by results to reduce reoffending.1 Under these
proposals, a minimum of 12 months’ supervision will be extended to nearly all those leaving
custody, including those who receive a sentence length of less than two years. Under this
approach a new, public sector National Probation Service will be created, which will carry out
risk assessments of all offenders and have responsibility for directly managing offenders who
pose a high risk of serious harm to the public. Market-owned Community Rehabilitation
Companies will manage low and medium risk offenders which are allocated to them.
1 See Transforming Rehabilitation – A revolution in the way we manage offenders (MoJ, 2013a) and the
response to the consultation (MoJ, 2013b).
1

1.2 Approach The OMCCS uses three sources of data: a longitudinal survey of a representative sample of
2,919 offenders starting Community Orders between October 2009 and December 2010,
central administrative records for all offenders starting a Community Order in this time
(144,407 offenders) and local administrative records from 10 Probation Trusts over the same
period (covering 50,935 offenders).
This report uses all three sources of data but focuses on offenders in the survey who were
interviewed at more than one point in time to investigate the implementation of Community
Orders.2
1.3 Key findings
Offenders had high levels of contact with Offender Managers at the beginning of
the Community Order. The frequency and duration of meetings, and the number
of topics discussed related to specific needs fell over time.3
The average number of topics discussed by offenders and their Offender
Managers was three. The most common topics of discussion were: family or
children (51 per cent), living arrangements (51 per cent) and employment (50 per
cent).
Topics of discussion between offenders and Offender Managers were often
linked to ‘criminogenic’ needs identified in the formal Offender Assessment
System (OASys)4 process, such as alcohol or drug misuse. Discussions on these
topics were more common where offenders had a need in that area.
The offenders’ own assessment of their needs, their related behaviour (such as
whether they reported taking drugs in the survey) and their sentence
requirements influenced which topics were discussed.
The majority of offenders found all topics of discussion either ‘very useful’ or
‘fairly useful’:
2 The survey included offenders in management Tiers 2 to 4. A tier is allocated to an offender based on a
number of factors, including their risk of reoffending. Tier 1 is the lowest tier; these offenders were excluded from the survey as they have minimal levels of interventions in their sentence.
3 This was a reduction in contact reported by offenders who completed the survey at Wave 1 and Wave 2, and was not a result of offenders leaving the supervision of Probation Trusts, e.g. due to breach.
4 The Offender Assessment System (OASys) is a risk assessment and management system used by Offender Managers. It uses static factors (e.g. criminal history, demographics), dynamic factors (e.g. accommodation, drug use), risk of serious harm, sentence and risk management planning and an offender questionnaire to ensure that resources are allocated effectively. The full OASys assessment scores eight ‘criminogenic needs’. An offender has an OASys identified need if their score for that need exceeds a designated cut-off point.
2

The discussions most frequently reported as useful were those on alcohol
and drug use; 83 per cent of offenders found discussions on alcohol useful
and 80 per cent found discussions on drugs useful.
Discussions about work, drug use and alcohol use were more likely to be
found useful by offenders if they had an OASys identified need or sentence
requirement in the area that was discussed.
The majority of offenders (80 per cent) described their relationship with their
Offender Manager as ‘excellent’ or ‘good’.
Ninety-five per cent of offenders agreed that their Offender Manager listened
carefully to what they told them, while 88 per cent agreed that their Offender
Manager understood their needs well.
Offenders who reported that they had received warnings or that they had been
taken to court for breaching their Community Order at some point during their
sentence were less likely to have had an ‘excellent’ relationship with their
Offender Manager in the early months of their Community Order.
However, those who believed any warnings received were fair were more likely to
have had an excellent relationship. The analysis in this report cannot establish
whether poorer relationships led to non-compliance and warnings, or whether it
was warnings or breaches for non-compliance that led to poorer relationships.
Offenders who had meetings once a week with Offender Managers were more
likely to report that they had breached their Community Order, even after
controlling for factors such as pre-existing risk of reoffending. One explanation
could be that Offender Managers are skilled at identifying offenders who are
likely to breach, and set up more meetings with those at risk of breach to manage
them more closely.
Around three-fifths of offenders (59 per cent) felt their Offender Manager had
motivated them to avoid crime. Meetings of a longer duration, where more topics
were discussed, appeared to be more effective in motivating offenders to avoid
crime.
3
2. Introduction
This report is one of a series that summarises findings from the Ministry of Justice’s (MoJ’s)
Offender Manager Community Cohort Study (OMCCS), a longitudinal cohort study of
offenders, aged 18 and over, who started Community Orders between October 2009 and
December 2010. The aim of this report is to describe the nature of offender management, the
role of the Offender Manager in implementing and managing Community Orders, the
relationship they have with offenders and how these elements impact on breaches of
Community Orders.
2.1 Context Community Orders, for offenders aged 18 and over, replaced several different community
sentences in England and Wales in 2005 to enable judges and magistrates to tailor
sentences according to the particular nature of the offence and the offender. Community
Orders are comprised of a ‘menu’ of possible requirements, such as unpaid work or
treatment for drug problems, which can be imposed by the courts individually or in
combination.5 The type and number of requirements, as well as the sentence length (up to a
maximum of 36 months), are decided upon by the court, and are tailored according to: the
seriousness of the offence, the risk of serious harm,6 the risk of reoffending and the
offender’s individual circumstances (Sentencing Council Guidelines, 2011).
Probation staff in the role of ‘Offender Managers’ play a central role in the delivery of
Community Orders under the National Offender Management Model (NOMM), which was
implemented in 2006.7 The NOMM is an ‘end to end’ process of offender management which
expects Offender Managers to complete tasks summarised by the ASPIRE acronym:
Assess, Sentence Plan, Implement, Review and Evaluate. Key aspects of the role of
Offender Manager are to implement the requirements of the sentence, monitor compliance of
the offender, take enforcement action and assess the risk of harm that offenders may
present (National Offender Management Service (NOMS), 2006). At the time the OMCCS
5 At the time the OMCCS was carried out there were 12 requirements. This has been increased to 13 under the Legal Aid, Sentencing and Punishment of Offenders (LASPO) Act 2012, with the introduction of a foreign travel prohibition requirement. Requirements that have been added to statute but not yet enacted are: the electronic location monitoring requirement (Crime and Courts Act 2012) and the alcohol abstinence and monitoring requirement (LASPO, 2012). At the time of writing, only the foreign travel prohibition requirement had been commenced.
6 The risk of serious harm to the public is assessed as the relative likelihood that an offence or harmful act will occur, and the relative impact or harm of the offence (NOMS, 2009).
7 Offender Managers may be Probation Officers (POs) or Probation Service Officers (PSOs). POs are fully qualified to protect the public, manage offenders who pose a high risk of harm to others and influence
4

was carried out, the National Standards for the Management of Offenders (MoJ, 2007)8
required supervision meetings to be held more frequently for the first 16 weeks and
encouraged Offender Managers to be guided in their approach by what was needed to
implement the sentence plan and protect the public.9
Rehabilitation of the offender is an important aim of these sentences, and Offender
Managers undertake a systematic assessment and reassessment process of offenders,
assisted by the Offender Assessment System (OASys). OASys is a risk assessment and
management system used by Offender Managers to assess offenders’ risk of reoffending,
risk of serious harm, and their needs, for example accommodation or drug misuse. The
OASys assessment enables the Offender Manager to consider ‘static’ risk factors, such as
gender and criminal histories as well as identify ‘dynamic’ criminogenic needs10 that can be
addressed by effective and well-targeted interventions, and through regular meetings with
the Offender Manager to discuss the offender’s needs and the requirements of the sentence.
This is in line with the ‘Risk–Needs–Responsivity’ (RNR) approach, the dominant model for
offender management, which emphasises a positive Offender Manager–client relationship to
encourage moves towards positive outcomes (see, for instance, Bonta and Andrews, 2007).
The Government plans to make changes to the way offenders are managed in the
community, including offenders on Community Orders, to reduce reoffending. The MoJ
consultation ‘Punishment and Reform: Effective Community Sentences’ (MoJ, 2012a) and
the response to the consultation (MoJ, 2012b) proposed that every Community Order should
include an element designed to fulfil the purpose of punishment. The Crime and Courts Act
2013 brought these proposals into legislative effect, introducing more punitive elements in
Community Orders, such as longer unpaid work hours and longer curfews.
offenders to change harmful behaviour. PSOs are not trained to manage high risk offenders, but are able to assess the risk of harm to others, the need for intervention and to support offenders to change.
8 National Standards were revised in 2011 and are now much less prescriptive – they do not set frequency of contact in most cases with the exception of Tier 4 cases. www.justice.gov.uk/publications/corporate-reports/moj/2011/noms-standards
9 These guidelines advise on frequency of contact for offenders with supervision requirements, and they advise Offender Managers to vary frequency of meetings by tier.
10 Criminogenic needs are associated with an individual’s criminal behaviour and may be associated with their risk of reoffending. The OASys system identifies whether an offender has criminogenic needs that have been found to be predictive of reoffending across a population.
5

Proposals have been made to reform the provision of services in the community by opening
up the market to a diverse range of new rehabilitation providers, incentivised through
payment by results to reduce reoffending.11 Under these proposals, a minimum of 12
months’ supervision will be extended to nearly all those leaving custody, including those who
receive a sentence of less than two years. Under this approach a new, public sector N
Probation Service will be created, which will carry out risk assessments of all offenders and
have responsibility for directly managing offenders who pose a high risk of serious harm to
the public. Market-owned Community Rehabilitation Companies will manage low and
medium risk offenders which are allocated to them. Against this backdrop, understanding the
role of the Offender Manager and the impact that aspects of the offender management
process can have upon offenders’ level of breach will provide a useful insight.
ational
2.2 Aims This report aims to describe Offender Management in Community Orders; how an Offender
Manager implements and manages the Community Order, and the relationship between
Offender Managers and the offenders they work with, and the impact that aspects of the
offender management process has on offender breach rates. The relationship between the
Offender Manager and offender has been shown to be important in the identification of
needs, ongoing engagement with the sentence and ultimately for rehabilitation (Burnett and
McNeill, 2005). Offenders feeling that they were listened to, and having a good relationship
with their Offender Manager are both essential components of a rehabilitative approach
(Turley et al., 2011). This report provides evidence to support the development of practice in
the implementation of sentences and supervision in the community.
2.3 Approach The OMCCS follows a cohort of offenders who started Community Orders between October
2009 and December 2010 in England and Wales. The study provides insight into the
application and outcomes of Community Orders and looks at how Community Orders
operate and their effectiveness.
11 See Transforming Rehabilitation – A revolution in the way we manage offenders (MoJ, 2013a) and the
response to the consultation (MoJ, 2013b).
6

The OMCCS uses a dataset based on a cohort of offenders, aged 18 and over, given
Community Orders between October 2009 and December 2010, drawing on three sources:
1. A longitudinal survey of a representative sample of 2,919 offenders, drawn from 10
Probation Trusts, that provides information on their perceptions and experiences of
Community Orders. The first wave of the survey (Wave 1) was carried out around
three months after the start of the offender’s Community Order, with a subsequent
survey (Wave 2) on average at seven months and a third survey following the
expected end of the sentence (not all offenders were included in Wave 3 fieldwork,
but among those who were, the interview was on average ten months after the start
of the offender’s Community Order). Those offenders who were classified as Tier 1
were excluded from the survey.12
2. Central administrative records for all offenders starting a Community Order during the
period (144,407 offenders) describing the sentence received, offences and the risks
and needs of offenders as assessed by practitioners. This includes: FORM20 data
that describe Community Order commencements and terminations; OASys data,
containing the needs and risks that offenders present with; and Interim Accredited
Programmes System (IAPS) data on accredited programmes.
3. Local administrative records from the 10 Probation Trusts selected for the survey
(covering 50,935 offenders) which describe how offender management operates and
how offenders complete or breach their sentences.
Individual offenders’ records have been linked across these three sources to form a
‘Universal Dataset’. Further details of the methodology, are published in the reports ‘Offender
Management Community Cohort Study (OMCCS): Baseline Technical Report’ (Wood et al.,
2013) and ‘Offender Management Community Cohort Study: Waves 2 and 3 Technical
Report’ (Wood and Hussey, 2014).
This report uses all three sources of data and focuses on the 1,640 offenders in the survey
who responded to both the first survey and a subsequent survey (Wave 2, Wave 3, or both)
and who gave permission to link their survey responses to the administrative data sources.13
12 Offenders are assigned to one of four ‘tiers’ during their management by NOMS, based on a number of factors
including their risk of reoffending, with the aim of directing appropriate resource towards them. Tier 1 is the lowest level, where the aim is largely punishment, whilst substantial management is required of Tier 4 offenders with the aim of controlling risk.
13 Referred to as ‘Wave 2/3 survey respondents’ in the tables and figures in this report.
7
Not all offenders who responded to the first survey took part in subsequent surveys, and the
Wave 3 survey was stopped part way through due to concerns about high levels of attrition.
The response rate for the baseline survey was 44 per cent; at Wave 2 the response rate was
67 per cent and at Wave 3 the response rate was 57 per cent. Attrition such as this is
common in longitudinal surveys; however this may impact on how representative the later
survey samples are compared with the original sample and the general population of
offenders on Community Orders during the period. The data were weighted to take account
of this and selection bias.14 Further details on the Wave 2 and Wave 3 surveys are published
in Wood and Hussey (2013).
The majority of the analysis in this report focuses on Wave 1, or compares Wave 1 and
Wave 2 survey responses. For some analysis in this report, the ‘latest’ available survey
response is used; this is the Wave 3 survey response for those offenders who were
interviewed at this point, while the Wave 2 survey response is used for those offenders who
did not complete the Wave 3 survey. Finally, in chapter 4 some analysis combines responses
from all waves to determine whether outcomes such as offender reported breaches have
occurred at any point.
The analysis presented in this report focuses on offenders at Tier 2 or above; Tier 1
offenders were excluded from the OMCCS survey as they have minimal levels of
interventions in their sentence. However, Tier 1 offenders are included in the administrative
data collected for the Universal Dataset, and data on this group is presented in other
OMCCS reports in the series.
The findings discussed in the report are statistically significant at the 95 per cent level unless
stated otherwise.
Percentages within the tables may not sum to 100 per cent due to rounding. In some cases
multiple responses to survey questions were possible and the tables will not sum to 100 per
cent. This is noted in the footnotes to the table or figure.
14 The fieldwork design for the three waves of the OMCCS accounted for different sentence lengths and early
terminations of Community Orders. In addition the survey data has been weighted to the population profile of Tier 2–4 offenders beginning Community Orders in October 2009 to December 2010 (see Wood and Hussey, 2013 for further details).
8

Limitations of data
There are some limitations to the data:
The offenders were interviewed at different time points in each survey wave. The
Wave 1 data were collected on average three months after the start of the
sentence, the Wave 2 data were collected on average seven months after the
start of the sentence; and Wave 3 data were collected when the Community
Order ended. This means the analysis refers to different time points. As Wave 3
interviews were not completed for all offenders, some offenders will have had
more opportunity to complete the requirements of their Community Order than
others in analysis.
Although the overall sample in the OMCCS survey is large, the numbers of some
subgroups are relatively small. For example, due to the higher percentage of
males compared with females it is difficult to make comparisons between those
groups.
The local administrative data were not consistently recorded in the 10 Probation
Trusts. Work was done to produce standardised measures across the 10 Trusts,
but not all the data could be made comparable.
This report presents associations and relationships between implementation and
level of breach, and this analysis cannot establish causation. There may be
unobserved variables that impact on the level of breach.
This report uses offenders’ own reporting of warnings and breach. Recall of
warnings and breach may not be complete, but offenders are taken to court
where they are breached, so it is likely that these events will be recalled in the
majority of cases. For more information on the administrative breach data see
Appendix C in Cattell et al. (2014b).
9

3. Nature of contact
This chapter describes offenders’ contact with their Offender Manager. It looks at the typical
frequency and duration of meetings, and also examines whether there is evidence of
offenders contacting their Offender Manager outside of compulsory meetings. The number of
different members of staff that an offender saw is also explored.
3.1 Frequency and duration of meetings Offenders’ meetings with Offender Managers were typically longer and more frequent at the
start of the Community Order, and became less frequent and shorter as the Community
Orders progressed, reflecting the National Standards for the Management of Offenders (MoJ,
2007). At the Wave 1 survey (on average three months into the sentence) two-thirds (66 per
cent) of offenders said they met their Offender Manager once a week or more, with 21 per
cent meeting once a fortnight and nine per cent meeting once every three weeks to a month
(Figure 3.1).15 By the time of the Wave 2 survey (on average seven months into the
sentence), meetings took place less frequently; half (50 per cent) of offenders met with their
Offender Manager once every three weeks to a month, with one-quarter (25 per cent)
meeting once a week or more.
Figure 3.1 Frequency of meetings with Offender Manager (as reported by offender)
66
21
91 3
2517
50
3 4
0
10
20
30
40
50
60
70
Once a week ormore
Once a fortnight Once every 3weeks to a
month
Less than oncea month
Do not meetwith Offender
Manager
Wave 1 Wave 2
Per cent
Base: Survey respondents at Wave 1 and Wave 2, offenders on Tiers 2 to 4. Unweighted base: 1,530
Source: Survey data (Wave 1 and Wave 2)
15 Further analysis of the pattern of meetings based on the administrative data collected as part of the OMCCS is
provided in the report ‘Implementation of Community Orders: Results from the Offender Management Community Cohort Study’ (Cattell et al., 2014b).
10
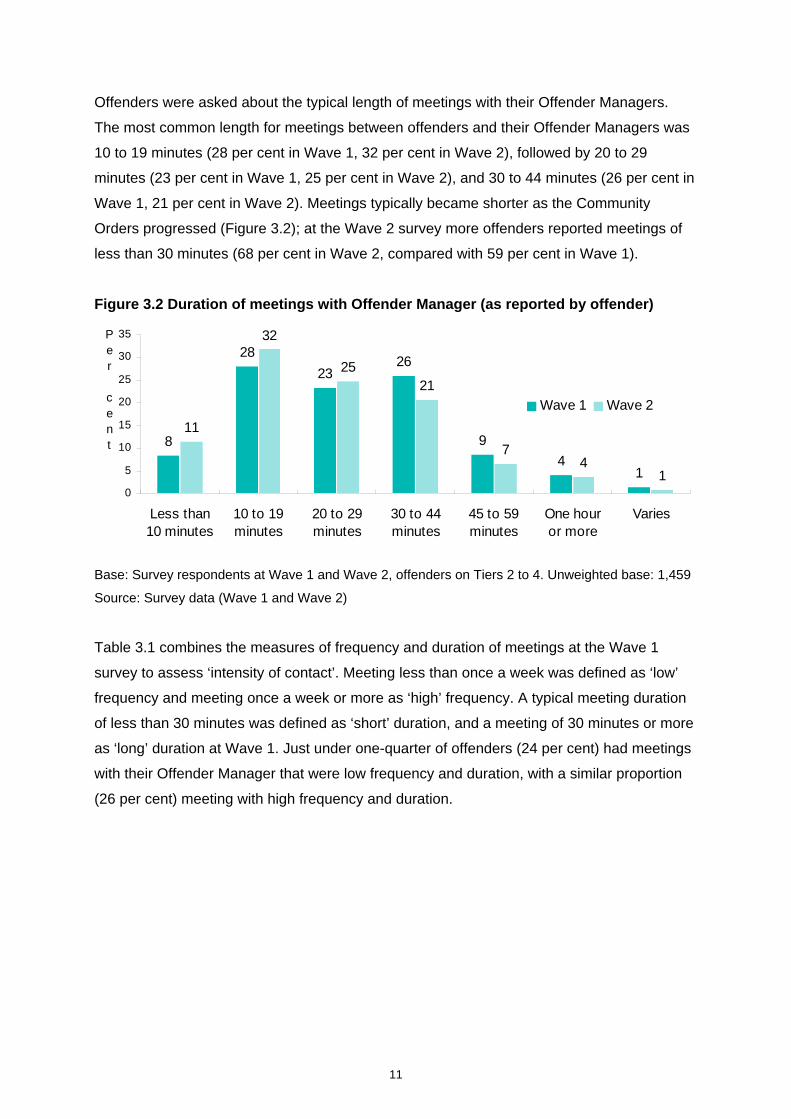
Offenders were asked about the typical length of meetings with their Offender Managers.
The most common length for meetings between offenders and their Offender Managers was
10 to 19 minutes (28 per cent in Wave 1, 32 per cent in Wave 2), followed by 20 to 29
minutes (23 per cent in Wave 1, 25 per cent in Wave 2), and 30 to 44 minutes (26 per cent in
Wave 1, 21 per cent in Wave 2). Meetings typically became shorter as the Community
Orders progressed (Figure 3.2); at the Wave 2 survey more offenders reported meetings of
less than 30 minutes (68 per cent in Wave 2, compared with 59 per cent in Wave 1).
Figure 3.2 Duration of meetings with Offender Manager (as reported by offender)
8
28
2326
9
41
11
32
2521
74
10
5
10
15
20
25
30
35
Less than10 minutes
10 to 19minutes
20 to 29minutes
30 to 44minutes
45 to 59minutes
One houror more
Varies
Wave 1 Wave 2
Per cent
Base: Survey respondents at Wave 1 and Wave 2, offenders on Tiers 2 to 4. Unweighted base: 1,459
Source: Survey data (Wave 1 and Wave 2)
Table 3.1 combines the measures of frequency and duration of meetings at the Wave 1
survey to assess ‘intensity of contact’. Meeting less than once a week was defined as ‘low’
frequency and meeting once a week or more as ‘high’ frequency. A typical meeting duration
of less than 30 minutes was defined as ‘short’ duration, and a meeting of 30 minutes or more
as ‘long’ duration at Wave 1. Just under one-quarter of offenders (24 per cent) had meetings
with their Offender Manager that were low frequency and duration, with a similar proportion
(26 per cent) meeting with high frequency and duration.
11

Table 3.1 Frequency and duration of meetings with Offender Manager, at the Wave 1 survey (as reported by offender)
Short duration (less than 30 minutes)
%
Long duration (30 minutes or more)
% Total
% Low frequency (less than once a week) % 24 14 38 High frequency (once a week or more) % 36 26 62 Total % 60 40 100 Unweighted base 1,632
Base: All Wave 2/3 survey respondents at Wave 1, offenders on Tiers 2 to 4
Source: Survey data (Wave 1)
Higher tier offenders (those intended to be more intensively managed)16 were more likely to
meet more frequently with their Offender Manager (99 per cent of Tier 4 offenders met once
a week or more, compared with 83 per cent of Tier 3 offenders, and 39 per cent of Tier 2
offenders).17 Although a higher proportion of Tier 4 offenders also reported longer duration of
meetings, this was not statistically significant. Offenders who reported to the survey that they
had four or more needs did have longer duration of meetings, suggesting that Offender
Managers were spending more time with those with the greatest need.
3.2 Contact outside meetings Supervision meetings are compulsory for offenders, but there was evidence that Offender
Managers were also providing support beyond this requirement. The majority of offenders
contacted their Offender Manager outside these meetings, and this continued as Community
Orders progressed. Fifty-four per cent of offenders reported contacting their Offender
Manager outside of meetings at the Wave 1 survey, and at the Wave 2 survey 59 per cent of
offenders reported that they had contacted their Offender Manager outside of a regular
meeting between the Wave 1 and Wave 2 surveys (see Appendix Table A.3). The most
common method was to do this by phone (93 per cent); with 15 per cent going to their office
and one per cent contacting their Offender Manager by text message.18 Offenders contacted
their Offender Managers for a range of reasons including: letting the Offender Manager know
what they were doing, discussing problems with the Community Order, discussing personal
problems, asking for information or advice, and making or changing an appointment.
16 For more information on tiers please see definition in chapter 2. 17 Tier 1 offenders were excluded from the OMCCS survey as they have minimal levels of intervention in their
sentence. 18 Multiple responses were possible for this question, so percentages may not sum to 100. Other options
included: email, letter, and other; less than 1% of offenders reported each of these options.
12

3.3 Consistency of staffing Consistency of staffing is a central aim of offender management within the NOMM (NOMS,
2006). Changes in the staff overseeing a case increases the risk that information is missed
or opportunities are not taken to form strong relationships based on a good understanding of
needs and experiences. The survey showed that staffing was quite consistent. Four-fifths (81
per cent) of offenders said that their Offender Manager did not change between the Wave 1
and the latest survey available and two-fifths (41 per cent) reported speaking to only one
member of probation staff19 between the commencement of their Community Order and the
Wave 1 survey. Only 26 per cent of offenders saw more than two members of probation staff
(Table 3.2). This supports findings from previous research (Turley et al., 2011) which also
found evidence of staffing consistency.
Table 3.2 Number of probation staff the offender talked to between the beginning of the Community Order and the Wave 1 survey
Number of staff talked to % of offenders One 41 Two 34 Three 15 Four 7 Five or more 4 Unweighted base 1,640
Base: All Wave 2/3 survey respondents at Wave 1, offenders on Tiers 2 to 4
Source: Survey data (Wave 1)
There was no relationship between the number of probation staff seen and a number of
offender characteristics; there was no difference by the offender’s tier, risk of reoffending,20
risk of serious harm,21 or sentence length (see Appendix Table A.4). Staffing consistency
appeared to be relatively high across all tiers and risks of reoffending.
19 Probation staff includes the Offender Manager and any other member of staff at the Probation Trust who the
offender might have had contact with. 20 Risk of reoffending was measured by the Offender Group Reconviction Scale (OGRS). This uses static factors
(such as age at sentence, gender, offence committed and criminal history) to predict the likelihood of proven reoffending within a given time (usually one or two years after starting their Community Order).
21 The risk of serious harm to the public is assessed as the relative likelihood that an offence or harmful act will occur, and the relative impact or harm of the offence (NOMS, 2009).
13

4. Discussions between Offender Managers and offenders
The OASys assessment process is used by probation staff to assess the risk of reoffending,
the needs of an offender and any risks of serious harm. Previous analysis of the OMCCS has
shown that sentence plans do not always address the needs identified in OASys explicitly,
for instance through planned requirements, but these needs may be addressed in the
supervision discussions (Cattell et al., 2014a). In addition, offenders may have needs beyond
those identified in OASys. This chapter describes the extent to which Offender Managers
discuss needs with offenders and looks at the offenders’ views of their Offender Manager.
4.1 Topics discussed with Offender Managers Of the topics offenders mentioned discussing at least once with their Offender Managers at
the Wave 1 survey, the most common were: family or children (51 per cent), living
arrangements (51 per cent) and employment (50 per cent) (Table 4.1).22 The topic discussed
by the fewest offenders was managing finances, which was discussed by one-quarter (25 per
cent) of offenders.
A lower proportion of offenders reported discussing each topic as the Community Orders
progressed, suggesting that discussions became more targeted as the sentence progressed.
At the Wave 2 survey, offenders were again most likely to mention having discussed family
or children, living arrangements, or employment, however at Wave 2 these were each
mentioned by around two-fifths of offenders, compared with around half at Wave 1.
22 The topics covered by the survey were identified by the offender from a set list, compiled to be in line with the
needs from the OASys assessment, for example the topic of living arrangements was considered to be related to the OASys identified need of accommodation. These are distinct from the needs identified in the OASys assessment, or the self-reported needs of the offender.
14

Table 4.1 Percentage of offenders discussing topics with Offender Managers23
Topic of discussion Wave 1
% Wave 2
% At Wave 1 or Wave 2
% Living arrangements 51 41 63 Family or children 51 41 60 Work or getting work 50 40 62 Alcohol use 45 35 51 Skills, education and training 43 29 52 Drug use 39 31 43 Mental health 29 23 37 Physical health or disability 27 22 36 Managing finances 25 19 34 Unweighted base 1,541 1,541 1,541
Base: Survey respondents at Wave 1 and Wave 2, offenders on Tiers 2 to 4
Source: Survey data (Wave 1 and Wave 2)
The average number of topics discussed with each offender by the Wave 1 survey was
three;24 however there was a broad range either side of this (see Appendix Table A.5).
Offenders who were at high risk of reoffending (measured by OGRS) were more likely to
report discussing more than three topics (53 per cent) than those judged to be at a low risk of
reoffending (43 per cent) (see Appendix Table A.6).
Offenders and Offender Managers also discussed the sentence requirements. The majority
of offenders on each requirement described their Offender Manager as asking ‘a lot’ about
how that requirement was going at the Wave 1 survey; offenders with a drug treatment
requirement were most likely to say this (86 per cent), perhaps reflecting the fact that there is
often a requirement to report to the probation office as part of testing (Figure 4.1).
23 A similar table to this appears in Cattell et al. (2014b). The difference between the tables is that the analysis in
this report is for all offenders who reported discussing topics at both Wave 1 and Wave 2, whilst in the table in Cattell et al. (2014b), the base is restricted to those with a supervision requirement.
24 Both the mean and median number of topics discussed was three.
15
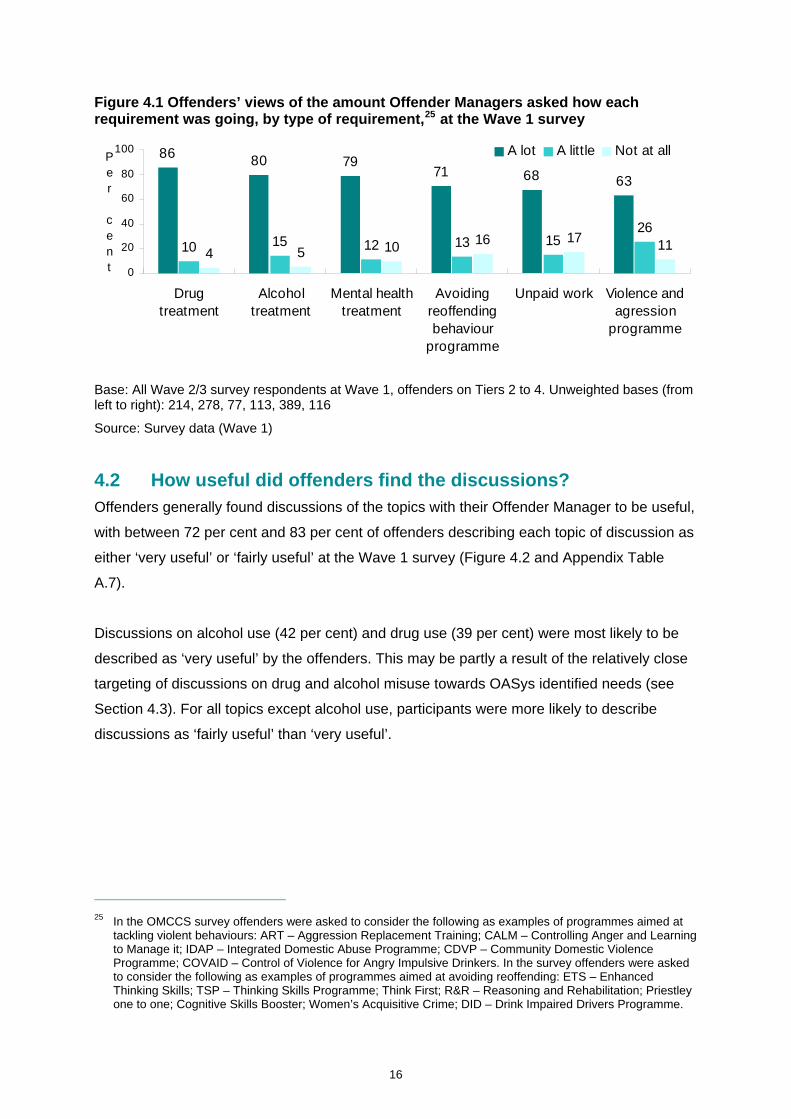
Figure 4.1 Offenders’ views of the amount Offender Managers asked how each requirement was going, by type of requirement,25 at the Wave 1 survey
86 80 7971 68 63
10 15 12 13 1526
4 5 10 16 17 11
0
20
40
60
80
100
Drugtreatment
Alcoholtreatment
Mental healthtreatment
Avoidingreoffendingbehaviour
programme
Unpaid work Violence andagression
programme
A lot A little Not at allPer cent
Base: All Wave 2/3 survey respondents at Wave 1, offenders on Tiers 2 to 4. Unweighted bases (from left to right): 214, 278, 77, 113, 389, 116
Source: Survey data (Wave 1)
4.2 How useful did offenders find the discussions? Offenders generally found discussions of the topics with their Offender Manager to be useful,
with between 72 per cent and 83 per cent of offenders describing each topic of discussion as
either ‘very useful’ or ‘fairly useful’ at the Wave 1 survey (Figure 4.2 and Appendix Table
A.7).
Discussions on alcohol use (42 per cent) and drug use (39 per cent) were most likely to be
described as ‘very useful’ by the offenders. This may be partly a result of the relatively close
targeting of discussions on drug and alcohol misuse towards OASys identified needs (see
Section 4.3). For all topics except alcohol use, participants were more likely to describe
discussions as ‘fairly useful’ than ‘very useful’.
25 In the OMCCS survey offenders were asked to consider the following as examples of programmes aimed at
tackling violent behaviours: ART – Aggression Replacement Training; CALM – Controlling Anger and Learning to Manage it; IDAP – Integrated Domestic Abuse Programme; CDVP – Community Domestic Violence Programme; COVAID – Control of Violence for Angry Impulsive Drinkers. In the survey offenders were asked to consider the following as examples of programmes aimed at avoiding reoffending: ETS – Enhanced Thinking Skills; TSP – Thinking Skills Programme; Think First; R&R – Reasoning and Rehabilitation; Priestley one to one; Cognitive Skills Booster; Women’s Acquisitive Crime; DID – Drink Impaired Drivers Programme.
16

Figure 4.2 Offenders’ views of the usefulness of discussions with Offender Manager, by topic of discussion, at the Wave 1 survey
5 5 5 5 6 5 7 7 712 15 16 13 13 13 17 18 21
41 41 43 46 46 50 46 49 48
42 39 36 35 35 33 30 25 24
0
20
40
60
80
100
Alcohol use Drug Use Mental Health Livingarrangements
Family orchildren
Skills,education& training
Physicalhealth ordisability
Work orgetting w ork
Managingfinances
Veryuseful
Fairlyuseful
Not veryuseful
Not atall useful
Per cent
Base: All Wave 2/3 survey respondents at Wave 1, offenders on Tiers 2 to 4. Unweighted bases (from left to right): 707, 578, 505, 830, 859, 671, 448, 772, 432
Source: Survey data (Wave 1)
4.3 Offender needs and discussions with Offender Managers
Targeting of discussions
This section considers offenders’ needs as identified in OASys in relation to accommodation,
Education, Training and/or Employment (ETE), relationships, drug and alcohol misuse, and
assesses the extent to which the topics of discussion were targeted to these needs. For
example, topics related to an ETE need were ‘skills, education and training’ and ‘work or
getting work’, while discussions on the topic of ‘living arrangements’ were considered to be
related to an OASys identified accommodation need.
Discussions reported at the Wave 1 survey were more common on topics where offenders
had a related OASys identified need (see Appendix Table A.8), with the exception of
discussions on work and ETE needs.26 This may reflect previous findings from the OMCCS
which suggested that Offender Managers tended to under-assess levels of ETE need in
relation to offending behaviour compared with OASys identified levels of ETE need (Cattell
et al., 2014a). Where there was an OASys identified alcohol or drug misuse need, Offender
Managers were particularly likely to discuss that need with the offender. Around three-
quarters of offenders with these needs discussed topics related to them, compared to 19 per
17

cent of offenders without an identified drug misuse need, and 28 per cent of those without an
identified alcohol need.
Discussing topics related to OASys identified needs
Discussions related to OASys identified needs were generally described as useful by
offenders at the Wave 1 survey. Over half (51 per cent) of those who had an OASys
identified alcohol misuse need and who discussed the topic of alcohol use with their Offender
Manager found those discussions ‘very useful’ (see Appendix Table A.9). Work and skills
discussions were less likely to be described as ‘very useful’, but offenders were still positive,
for example 32 per cent of offenders who had an OASys identified ETE need and who
discussed skills with their Offender Manager found the discussions ‘very useful’. Discussions
about work, drug use and alcohol use were found to be more useful for offenders if they had
a corresponding OASys identified need compared with those who did not (Appendix Table
A.10). Discussions on topics related to other needs were not found to be more useful if the
offender had a corresponding need in this area.
Figure 4.3 shows how useful offenders with an OASys identified need found discussions on
each topic related to that need, as well as the proportions with a need that did not discuss
each topic by the Wave 1 survey. For example, of those with an OASys identified alcohol
misuse need, 27 per cent did not discuss alcohol use with their Offender Manager, 38 per
cent discussed alcohol use and found this ‘very useful’ and 24 per cent discussed alcohol
use and found it ‘fairly useful’.
26 While a higher proportion of offenders with an OASys identified ETE need had discussions on work the
difference was not statistically significant.
18

Figure 4.3 Offenders’ views of usefulness of discussions with Offender Managers related to each OASys identified need, by the Wave 1 survey
27 2536 44 54 49
11 1212
127 12
24 3029
25 24 2538 30
23 18 15 14
0
20
40
60
80
100
Alcohol use Drug Use Livingarrangements
Family orchildren
Skills,education& training
Work orgettingwork
Very useful
Fairly useful
Discussedbut notuseful
Didn'tdiscuss
Per cent
Base: All Wave 2/3 survey respondents at Wave 1, offenders on Tiers 2 to 4. Unweighted bases (from left to right): 459, 404, 410, 734, 694, 694
Source: Survey data (Wave 1)
For the six OASys identified needs discussed in this section,27 44 per cent of offenders had
discussed topics related to all of the needs they had with their Offender Managers by the
Wave 1 survey and a further 42 per cent discussed topics related to at least one need, but
not all of them (Appendix Table A.11). A total of 14 per cent of offenders with one or more of
these six OASys identified needs did not discuss topics related to any of them with their
Offender Managers. These offenders had an average (mean) of 2.5 of the six needs, and
over half of them were Tier 3 offenders. When discussions at the Wave 2 and Wave 3 survey
were taken into account, a total of 12 per cent of offenders with one or more of the OASys
identified needs had not discussed topics related to any of them with their Offender
Managers.28
Why might an offender and Offender Manager not discuss an OASys
need?
There are several possible reasons why topics related to OASys identified needs were not
discussed for some individuals. Recall during the survey may be one issue; discussions on
27 The OASys identified needs of ‘thinking and behaviour’ and ‘lifestyle and associates’ were not included in this
section as questions relating to discussion of these needs were not asked of offenders. 28 Offenders who reported discussing ‘none’ of these needs may have discussed needs with their Offender
Manager that were not asked about in the survey, for example the OASys identified needs ‘thinking and behaviour’ and ‘lifestyle and associates’.
19

topics that were less pertinent or useful to the offender may be less likely to be recalled by
them.
Another explanation may be that the individuals did not consider themselves to have such
needs. Offender Managers may decide that the topics of discussions should be at least partly
responsive to the offender’s views in order to be worthwhile and generate engagement. The
OMCCS survey showed that offenders were more likely to have discussions on topics related
to each OASys identified need by the Wave 1 survey if offenders reported that they needed
help in those areas (see Appendix Table A.12). This effect was particularly marked for drug
and alcohol misuse needs and relationship needs; for example, 91 per cent of offenders who
had an OASys identified alcohol misuse need but who did not discuss alcohol use with their
Offender Manager said that they did not need help with alcohol misuse at the Wave 1 survey.
Similarly, offenders who had OASys identified drug or alcohol misuse need and who reported
behaviours to the survey that indicated that they had needs in these areas,29 were more
likely to talk about alcohol or drug use in discussions with their Offender Manager (Appendix
Table A.13).
Another possible reason why topics related to OASys identified needs would not be
discussed is if the Offender Manager did not consider them to be linked to the individual’s
offending behaviour. In such cases, offenders were significantly less likely to have discussed
topics related to these needs by the Wave 1 survey (see Appendix Table A.14). However,
this was not the case for the topics of accommodation, skills, work or alcohol use.
A further reason why Offender Managers may not discuss certain topics with the offender
might be where needs in those areas are addressed via a requirement of the Community
Order. However, discussions on drug use, alcohol use and mental health were very likely to
overlap with requirements; 90 per cent or more of offenders on each of drug, alcohol or
mental health treatment requirements discussed the topic related to that requirement with
their Offender Managers by the Wave 1 survey (Appendix Table A.16).
29 Behaviours reported in the survey that were categorised as indicating a serious drug use need were using
heroin, crack cocaine, cocaine, methadone, other opiates or ‘Benzos’, weekly or more in the four weeks before the survey interview, or injecting any drug. As outlined in the 2007 Alcohol Strategy, behaviours that were categorised as indicating a serious alcohol use need were: for women, regularly drinking 35 units a week; and for men, regularly drinking over 50 units a week (Department of Health, 2007).
20

4.4 Attitudes towards Offender Managers Good relationships between offenders and Offender Managers are recognised as being
important for the identification of needs, ongoing engagement of the offender with the
sentence and ultimately for rehabilitation (Burnett and McNeill, 2005).
Four-fifths of offenders (82 per cent) described having an ‘excellent’ or ‘good’ relationship
with their Offender Manager at the Wave 1 survey, while only two per cent described it as
‘not very good’ or ‘bad’ (Appendix Table A.18). Over half of offenders (53 per cent)30
described their relationship with their Offender Manager as ‘excellent’ in at least one survey
(Appendix Table A.19) and one-quarter (25 per cent) described the relationship as ‘excellent’
in both the Wave 1 and 2 surveys.
Offenders who were at low risk of reoffending (as measured by OGRS) were more likely to
describe their relationships with their Offender Managers as ‘excellent’ at the Wave 1 survey
(44 per cent) than those at medium risk (31 per cent), high risk (33 per cent), or very high risk
of reoffending (27 per cent) (Appendix Table A.20).
Ninety-five per cent of offenders ‘agreed’ or ‘strongly agreed’ at the Wave 1 survey that their
Offender Manager listened carefully to what they told them, while 88 per cent agreed or
‘strongly agreed’ that they understood their needs well (Table 4.2). A lower proportion of
offenders (59 per cent) agreed that their Offender Manager supported them in their daily life,
though this was still the majority of offenders. These are positive findings given that previous
research has shown the benefits of good relationships (e.g. Burnett and McNeill, 2005, and
Turley et al., 2011) and that poor experiences ‘may not just be neutral, but may harm
desistance’ (Shapland et al., 2012b: 1).
30 This has been calculated by summing the percentage of offenders who said they had: an excellent
relationship in Wave 1, but not Wave 2; an excellent relationship in Wave 2, but not Wave 1; and an excellent relationship in both waves. See Appendix Table A.19.
21

Table 4.2 Offenders’ attitudes to their Offender Managers, at Wave 1 survey
Strongly agree Agree
Neither agree nor disagree Disagree
Strongly disagree
Unweighted base
My Offender Manager listens carefully to what I tell him/her % 55 40 3 1 1 1,639 I believe my Offender Manager understands my needs well % 46 42 7 4 1 1,640 My Offender Manager supports me in my daily life % 24 35 20 16 5 1,636 My Offender Manager motivates me to make improvements to my life % 31 48 12 8 2 1,638 By offending again I would let my Offender Manager down % 34 44 10 9 2 1,636
Base: All Wave 2/3 survey respondents at Wave 1, offenders on Tiers 2 to 4
Source: Survey data (Wave 1)
Offenders’ attitudes towards their Offender Managers remained largely positive at the latest
available survey. However, there was a shift from ‘strongly agree’ to ‘agree’ in each of the
measures; for example 46 per cent strongly agreed that their Offender Manager understood
their needs in Wave 1 compared with 37 per cent in the latest available survey. It may have
been expected that Offender Managers’ understanding of offenders’ needs would improve
over time as relationships develop, but this fall may simply reflect a lower level of contact
between the offender and Offender Manager towards the end of the sentence (Appendix
Table A.21).
22

5. Offender management and sentence outcomes
This chapter looks at the associations between offender management and sentence
outcomes, in terms of warnings and breach as reported by the offenders.31 It also considers
offenders’ perceptions of warnings and breach and how these sanctions were used by
Offender Managers, and their views of the impact that their Offender Manager had on their
offending behaviour.
Warnings are discretionary measures available to Offender Managers to address an
offender’s failure to comply with the requirements of the Community Order. Up to two
warnings may be given before a ‘breach’. A breach may result in changes to the Community
Order, a fine or resentencing.32 Sentence changes following breach may mean some
offenders receive additional support, for example in relation to their drug use, and this may
help to encourage future compliance with the Community Order. However, additions to a
sentence following breach may also present offenders with further opportunities to breach
their sentence, potentially leading to more severe sentencing consequences.
5.1 Use of warnings By the latest available survey, almost half (49 per cent) of offenders said they had received
no warnings or breaches during their Community Order, and 29 per cent reported that they
had received one or more warnings but had not been breached. Offenders who said they
received warnings at some point during their sentence were less likely to report that they had
an ‘excellent’ relationship with their Offender Manager at the Wave 1 survey compared with
those who did not (31 per cent compared with 42 per cent). Offenders were more likely to
have viewed this relationship as ‘excellent’ where they thought warnings were fair compared
with those who did not (33 per cent compared with 19 per cent) (Table 5.1).
31 Levels of breach and the characteristics associated with breach are explored in more detail in Cattell et al.
(2014b), using Form 20 administrative data and local administrative data. However, there were inconsistencies in the administrative data, data from one Trust was missing, and warnings were not recorded. Given these limitations, this report uses offenders’ own reporting of warnings and breach. Recall of warnings and breach may not be complete, but offenders are taken to court where they are breached, so it is likely that these events will be recalled in the majority of cases. For more information on the administrative breach data see Appendix C in Cattell et al. (2014b).
32 At the time of the OMCCS it was not possible for a court to impose fines in relation to breach (as per the provisions in the Legal Aid, Sentencing and Punishment of Offenders Act 2012, Section 67); therefore most of this cohort of offenders were likely to have additions or changes to their sentences following breach. However, a small proportion of offenders who received longer sentences may have been affected by the new provisions.
23

It is not possible from this analysis to establish whether poorer relationships led to
non-compliance and warnings, or whether it was warnings for non-compliance that led to
poorer relationships.
Table 5.1 Relationship with Offender Manager by whether offenders received warnings (as reported by the offender)
Relationship with Offender Manager at Wave 1
Excellent Good OK Not very
good Bad Unweighted
base Whether offender reported receiving a warning by the latest survey interview
Had received at least one warning % 31 43 23 2 1 668 Not received any warnings % 42 44 12 1 1 964
For offenders reported receiving a warning at Wave 1, whether they perceived them as fair
Warning(s) considered fair % 33 42 21 3 1 339 Warning(s) considered unfair % 19 41 33 4 2 167 Some warnings were fair, some not % 6 48 32 0 13 31
Base: All Wave 2/3 survey respondents, offenders on Tiers 2 to 4
Source: Survey data (Waves 1, 2 and 3)
Around two-thirds (67 per cent) of the offenders reported missing at least one appointment at
the probation office by the time of their latest survey. Some of these will have been allowed
absences, for example absence due to illness. There was also some evidence of the use of
discretion among Offender Managers faced with non-compliance by the offenders. At the
Wave 1 survey, half (50 per cent) of those who reported missing meetings also reported
receiving a warning by that point (Table 5.2).
Table 5.2 Percentage of offenders reporting receiving a warning and offenders’ perception of fairness by attendance at probation meetings, at the Wave 1 survey
Whether offender missed any probation meetings Yes %
No %
Whether offender reported receiving a warning Has received at least one warning 50 16 Not received any warnings 50 84
Unweighted base 798 841 For offenders reporting receiving a warning, whether they perceived them as fair
Yes 67 52 No 27 44 Some were fair, some not 6 5
Unweighted base 340 101
Base: All Wave 2/3 survey respondents at Wave 1, offenders on Tiers 2 to 4
Source: Survey data (Wave 1)
24

About two-thirds (67 per cent) of those who reported missing meetings and who said they
were given warnings agreed the warnings were fair, compared with around half (52 per cent)
of those who said they received warnings but did not report missing any meetings. This
suggests that fewer offenders felt warnings were fair when they were received for types of
non-compliance other than missing meetings with their Offender Manager, such as missing
any days of unpaid work.
5.2 Breaches This section focuses on breach as reported by the offender. Breach represents a lack of
compliance with the Community Order and can result in additional requirements. In some
instances, additions to sentences may result in more opportunities for Offender Managers to
support the offender towards rehabilitation. Overall, 17 per cent of offenders said that they
had been taken to court for a breach of their Community Orders and it had been amended,
while three per cent of offenders said that they had breached their Community Order and it
had been ended (Appendix Table A.23).
Offenders who reported meeting frequently with their Offender Managers at the Wave 1
survey were more likely to report that they had breached their Community Order by their
latest available survey. Twenty-five per cent of those offenders meeting with their Offender
Manager at a high intensity (once a week or more, typically for 30 minutes or more) reported
that they breached their Community Order compared with 14 per cent of those meeting at a
lower intensity (less than once a week, and typically for less than 30 minutes) (Figure 5.1).33
33 Intensity of contact refers to the frequency and duration of meetings, with high frequency and high duration
being considered the most intense, and low frequency and low duration the least.
25
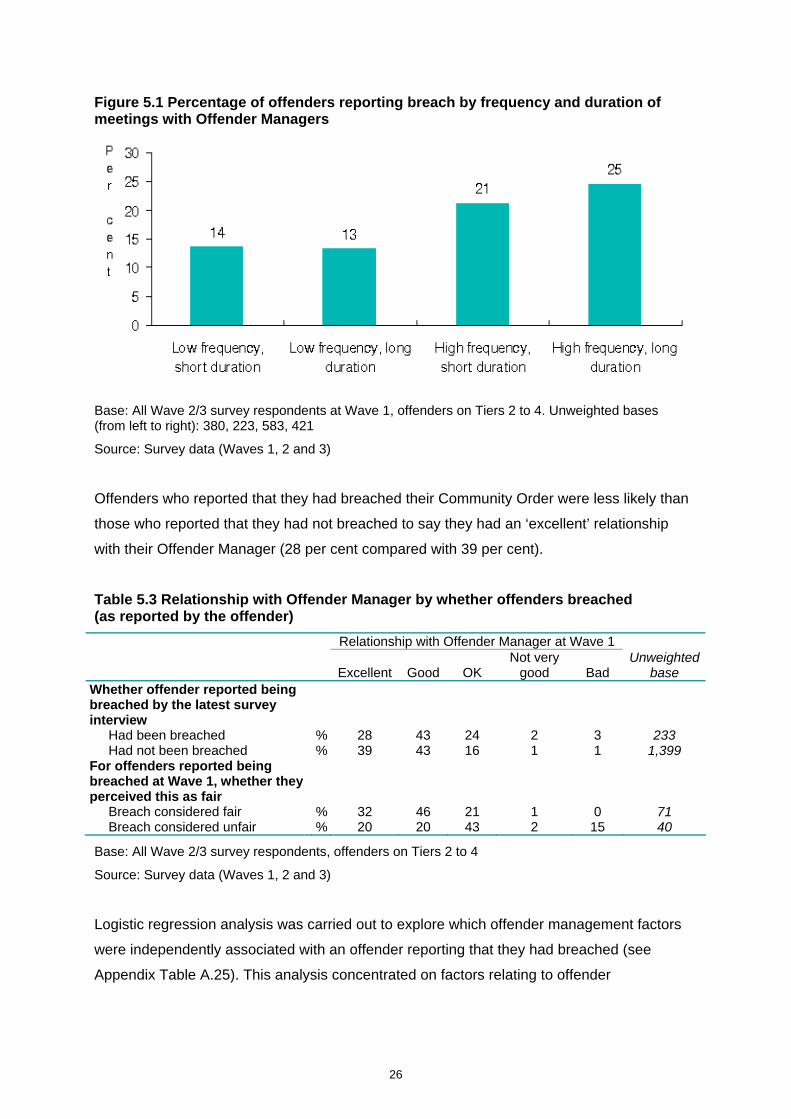
Figure 5.1 Percentage of offenders reporting breach by frequency and duration of meetings with Offender Managers
Base: All Wave 2/3 survey respondents at Wave 1, offenders on Tiers 2 to 4. Unweighted bases (from left to right): 380, 223, 583, 421
Source: Survey data (Waves 1, 2 and 3)
Offenders who reported that they had breached their Community Order were less likely than
those who reported that they had not breached to say they had an ‘excellent’ relationship
with their Offender Manager (28 per cent compared with 39 per cent).
Table 5.3 Relationship with Offender Manager by whether offenders breached (as reported by the offender)
Relationship with Offender Manager at Wave 1
Excellent Good OK Not very
good Bad Unweighted
base Whether offender reported being breached by the latest survey interview
Had been breached % 28 43 24 2 3 233 Had not been breached % 39 43 16 1 1 1,399
For offenders reported being breached at Wave 1, whether they perceived this as fair
Breach considered fair % 32 46 21 1 0 71 Breach considered unfair % 20 20 43 2 15 40
Base: All Wave 2/3 survey respondents, offenders on Tiers 2 to 4
Source: Survey data (Waves 1, 2 and 3)
Logistic regression analysis was carried out to explore which offender management factors
were independently associated with an offender reporting that they had breached (see
Appendix Table A.25). This analysis concentrated on factors relating to offender
26

management, and factors relating to the offender, such as risk of reoffending and age,34
were included in the model only to control for their influence on likelihood of offender-
reported breach.35
This analysis found that:
Meeting once a week was associated with a higher level of offender-reported
breach (regardless of risk of reoffending, age and criminal history) than meeting
more or less frequently than once a week.
Duration of meetings was not found to be significantly associated with
offender-reported breach when other factors were controlled for.
The proportion of offender’s OASys needs that were discussed was not
significantly associated with offender-reported breach.
The number of meetings that the offender had with their Offender Manager by the
second month of the Community Order was also not significantly associated with
offender-reported breach.
An explanation for the increase in offender-reported breach for those offenders who met
once a week with their Offender Manager is that Offender Managers are skilled at identifying
offenders who are likely to breach. Offender Managers could be setting up weekly meetings
with those at risk of breach in order to manage them more closely. This suggests that the
requirement to meet weekly leads to a higher likelihood of breach, although there may be
other factors involved.
5.3 Offender Managers and motivation When asked if anyone in particular had motivated them to avoid crime, three-fifths (59 per
cent) of offenders specified, at the Wave 1 survey, that their Offender Manager had been
particularly influential;36 how this relates to actual reoffending will be explored in a future
OMCCS report.
34 Offender and offence characteristics that were included in the regression and were significantly associated
with offender-reported breach were: age (younger offenders were more likely to breach); OGRS (offenders at a higher risk of reoffending were more likely to breach); having a specified activity, drug treatment, or unpaid work requirement in the sentence; and tier after sentence commencement (Tier 1 offenders were more likely to breach than Tier 4 offenders). Offender and offence characteristics which were not significantly associated with offender-reported breach were: having a drug use problem; length of the sentence; and gender. See Appendix Table A.25 for more details.
35 A model of breach that includes a wider range of variables, beyond those relating to the offender management process, is included in Cattell et al. (2014a).
36 The other people that were mentioned by offenders included their partner or a family member.
27

Longer meetings were associated with offenders feeling the Offender Manager motivated
them to avoid crime. Offenders who typically had meetings of a longer duration (30 minutes
or more) were more likely to say their Offender Managers had helped them avoid crime; 68
per cent of those who met for longer said that their Offender Manager had motivated them to
avoid crime at the Wave 1 survey, compared with 54 per cent among those who met for a
short duration (Table 5.3). The frequency of meetings did not affect whether offenders felt
that their Offender Manager had motivated them to avoid crime (Appendix Table A.26).
Table 5.4 Percentage of offenders who said that their Offender Manager motivated them to avoid crime by duration of meetings with Offender Manager, at the Wave 1 survey
Typical duration of meetings with Offender Manager37
Offender Manager motivated them to avoid crime %
Short duration 54 Long duration 68 Unweighted base 1,607
Base: All Wave 2/3 survey respondents at Wave 1, offenders on Tiers 2 to 4
Source: Survey data (Waves 1, 2 and 3)
The more topics discussed with offenders, the more likely offenders were to report the
Offender Manager motivated them. Offenders were more likely to report feeling motivated to
avoid crime in cases where they said they had discussed areas of potential need at meetings
with their Offender Managers. Offenders who said they had not discussed any of the
potential needs were less likely to say that their Offender Manager had motivated them to
avoid crime (34 per cent) compared with those who said they had discussed at least one
topic (62 per cent) (see Appendix Table A.27). This relationship generally became more
pronounced the more potential needs the offender had discussed with the Offender Manager
during their meetings: offenders who had discussed more topics were more likely to say their
Offender Manager motivated them to avoid crime (Table 5.4).
37 Short duration was defined as ‘less than 30 minutes’; long duration was ‘30 minutes or more’.
28

Table 5.5 Percentage of offenders who said that their Offender Manager motivated them to avoid crime by number of topics discussed with Offender Manager, at the Wave 1 survey
Number of topics discussed with Offender Manager
Offender Manager motivated them to avoid crime %
Unweighted base
None 34 150 One 43 211 Two 54 249 Three 62 268 Four 67 251 Five 64 174 Six or more 73 337
Base: All Wave 2/3 survey respondents at Wave 1, offenders on Tiers 2 to 4
Source: Survey data (Wave 1)
Offenders were also more likely to report that their Offender Managers helped them avoid
crime when Offender Managers and offenders discussed topics related to specific needs
identified in OASys (Appendix Table A.28). Sixty-eight per cent of those who had discussed
topics related to all their OASys identified needs reported this, compared with 58 per cent
who discussed topics related to some, but not all, their needs, and 48 per cent who did not
discuss any topics related to their needs.
29

6. Conclusions
This report describes the level of contact between offenders and Offender Managers, the
relationship this had with needs, the quality of the relationships and associations with breach
of the Community Order.
At the time this study was carried out, the National Standards for the Management of
Offenders (MoJ, 2007)38 required supervisions to be held more frequently for the first 16
weeks and encouraged Offender Managers to be guided by what was needed to implement
the sentence plan and protect the public.39 In line with this, contact with Offender Managers
was generally higher at the start of the Community Orders; frequency of meetings, their
duration, and the number of specific needs discussed all fell over time.40 Discretion was
apparent, especially in the association of intensity of contact and offender tier, with Offender
Managers increasing the time spent with offenders in line with their survey reported level of
need, in addition to directions based on the offender’s tier.
The content of discussions between offenders and Offender Managers was often in line with
criminogenic needs identified in the formal OASys assessment process. This was particularly
evident for drug and alcohol use. However, not all these needs were covered by topics
discussed, in particular, discussions on topics related to needs other than drug and alcohol
problems were less frequent. The Offender Manager’s own perception of whether the needs
were related to the offending behaviour for that offender and the offender’s own perception of
their needs could account for some topics being less likely to be discussed.
These results support the suggestion made in Cattell et al. (2013) that Offender Managers
may address needs not identified in OASys in their attempts to engage offenders and
motivate them to make changes in their lives. This is in line with a RNR approach which
emphasises the central place of Offender Manager–offender relationships (Bonta and
Andrews, 2007) and ‘Good Lives’ models (Maruna, 2001) which emphasise reinforcing
individuals’ positive characteristics as a means of moving towards desistance.
38 National Standards were revised in 2011 and are now much less prescriptive – they do not set frequency of
contact in most cases with the exception of Tier 4 cases. 39 These guidelines advise on frequency of contact for offenders with supervision requirements, and they advise
Offender Managers to vary frequency of meetings by tier. 40 This is an evidence-based strategy: survival analysis of reoffending has shown that the rate at which offenders
reoffend is at its height in the early period after sentencing (Howard, 2011).
30

Offenders generally found the discussions they had with their Offender Manager valuable,
with the large majority of offenders finding them ‘very’ or ‘fairly’ useful. The topics of
discussion found most useful were those on alcohol and drug use, and this may reflect the
targeting of these conversations in line with OASys assessments. The majority of offenders
described having an ‘excellent’ or ‘good’ relationship with their Offender Manager and felt
they were listened to and understood; both considered essential components of a
rehabilitative approach (Turley et al., 2011).
Less frequent meetings of longer duration were associated with a lower level of offender-
reported breach. Furthermore, longer meetings where more topics were discussed were
associated with bringing about a self-reported commitment to avoid crime than frequent
shorter meetings, as these offenders were more likely to say that their Offender Manager
helped them avoid crime. This was particularly the case where discussion topics were in line
with OASys identified needs. Therefore, a focus on fewer, longer meetings between
offenders and Offender Managers may be beneficial in encouraging offenders towards a
pathway of desistence.41
41 See Shapland et al. (2012a and 2012b) for further discussion on quality.
31

References
Bonta, J. and Andrews, D. A. (2007) Risk–Need–Responsivity Model for Offender
Assessment and Rehabilitation. Public Safety Canada 2007-06. Available at:
http://www.publicsafety.gc.ca/cnt/rsrcs/pblctns/rsk-nd-rspnsvty/rsk-nd-rspnsvty-eng.pdf
(accessed 18th February 2014)
Bonta, J. and Andrews, D. A. (2010) ‘Viewing Offender Assessment and Rehabilitation
through the Lens of the Risk-Need-Responsivity Model’ In McNeil, F., Raynor, P. and Trotter,
C. (eds) Offender Supervision; New Directions in Theory, Research and Practice. Abingdon:
Willan.
Burnett, R. and McNeill, F. (2005) The place of the officer-offender relationship in assisting
offenders to desist from crime. Probation Journal 52.3 221-242.
Cattell, J., Kenny, T., Lord, C. and Wood, M. (2014a) Community Orders with Punitive
Requirements: Results from the Offender Management Community Cohort Study (OMCCS).
London: MoJ Analytical Series.
Cattell, J., Mackie, A., Capes, T., Lord, C. and Wood, M. (2014b) Implementation of
Community Orders: Results from the Offender Management Community Cohort Study
(OMCCS). London: MoJ Analytical Series.
Cattell, J., Mackie, A., Prestage, Y. and Wood, M. (2013) Results from the Offender
Management Community Cohort Study (OMCCS): Assessment and Sentence Planning.
London: MoJ Analytical Series.
Crime and Courts Act 2013. Available at: http://services.parliament.uk/bills/2012-
13/crimeandcourts/documents.html (accessed 18th February 2014).
Department of Health (2007) Safe. Sensible. Social. The Next Steps in the National Alcohol
Strategy. London: Department of Health.
Howard, P. (2011) Hazards of Different Types of Reoffending. Ministry of Justice Research
Series 3/11. London: Ministry of Justice.
32

Maruna, S. (2001) Making Good: How Ex-Convicts Reform and Rebuild their Lives.
Washington: American Psychological Association.
Ministry of Justice (2007) National Standards for the Management of Offenders, Standards
and Implementation Guidance. Available at:
http://warwickshireprobation.orangeleaf.com/assets/userfiles/warwickshire/OM_National_Sta
ndards_2007.pdf (accessed 18th February 2014).
Ministry of Justice (2012a) Punishment and Reform: Effective Community Sentences.
Available at: https://consult.justice.gov.uk/digital-communications/effective-community-
services-1 (accessed 18th February 2014).
Ministry of Justice (2012b) Punishment and Reform: Effective Community Sentences,
Government Response. Response to Consultation Paper CP(R) 20/2012. London: Ministry of
Justice.
Ministry of Justice (2013a) Transforming Rehabilitation – A revolution in the way we
manage offenders. Consultation Paper CP1/2013. London: Ministry of Justice.
Ministry of Justice (2013b) Transforming Rehabilitation – A Strategy for Reform. Response
to Consultation CP16/2013. London: Ministry of Justice.
National Offender Management Service (2006) The NOMS Offender Management Model.
Available at: http://www.swmprobation.gov.uk/wp-
content/uploads/2013/03/offender_management_model_1.pdf (accessed 18th February
2014).
National Offender Management Service (2009) NOMS Risk of Serious Harm Guidance.
Available at http://hlsweb.dmu.ac.uk/pgcpd/roh436/official-
documents/NOMS%20RoSH%20June%2009.pdf (accessed 18th February).
Legal Aid, Sentencing and Punishment of Offenders Act 2012. Available at
http://www.legislation.gov.uk/ukpga/2012/10/pdfs/ukpga_20120010_en.pdf (accessed 18th
February 2014).
33

Sentencing Council Guidelines (2011) Types of Sentence: Community Orders. Available
at: http://sentencingcouncil.judiciary.gov.uk/sentencing/community-sentences.htm (accessed
18th February 2014).
Shapland, J., Bottoms, A., Farrall, S., McNeill, F., Priede, C. and Robinson, G. (2012a)
The Quality of Probation Supervision – a Literature Review. Occasional Paper 3. Sheffield:
University of Sheffield Centre for Criminological Research.
Shapland, J., Bottoms, A., Farrall, S., McNeill, F., Priede, C. and Robinson, G. (2012b)
The Quality of Probation Supervision – a Literature Review: Summary of Key Messages.
Research Summary 2/12. London: Ministry of Justice.
Turley, C., Ludford, H., Callanan, M. and Barnard, M. (2011) Delivering the NOMS
Offender Management Model. Ministry of Justice Research Series 7/11. Available at:
http://www.justice.gov.uk/downloads/publications/research-and-analysis/moj-
research/delivering-noms-offender-management-model.pdf (accessed 18th February 2014).
Wood, M., Hussey, D. and Cattell, J. (2013) Offender Management Community Cohort
Study (OMCCS): Baseline Technical Report. London: Ministry of Justice.
Wood, M. and Hussey, D. (2014) Offender Management Community Cohort Study: Waves
2 and 3 Technical Report. MoJ Analytical Series.
34

Appendix A
Additional tables
Table A.1 Frequency of meetings offenders reported having with their Offender Manager
Wave 1
% Wave 2
% Once a week or more 66 25 Once a fortnight 21 17 Once every 3 weeks to a month 9 50 Less than once a month 1 3 Do not meet with probation officer 3 4 Unweighted base 1,530 1,530
Base: Survey respondents at Wave 1 and Wave 2, offenders on Tier 2 to 4
Source: Survey data (Wave 1 and Wave 2)
Table A.2 Duration of meetings offenders reported having with their Offender Manager
Typical duration of meetings Wave 1
% Wave 2
% Less than 10 minutes 8 11 10 to 19 minutes 28 32 20 to 29 minutes 23 25 30 to 44 minutes 26 21 45 to 59 minutes 9 7 One hour or more 4 4 Varies too much to give typical 1 1 Unweighted base 1,459 1,459
Base: Survey respondents at Wave 1 and Wave 2, offenders on Tier 2 to 4
Source: Survey data (Wave 1 and Wave 2)
Table A.3 Percentage of offenders who reported contacting their Offender Manager outside of meetings
Made contact outside meetings
% Up to Wave 1 54 Between Wave 1 and Wave 2 59 Unweighted base 1,530
Base: Survey respondents at Wave 1 and Wave 2, offenders on Tier 2 to 4
Source: Survey data (Wave 1 and Wave 2)
35

Table A.4 Number of probation staff offenders reported talking to between the beginning of the Community Order and the Wave 1 survey by tier, risk and sentence length
Number of probation staff talked to One Two Three Four Five or more
Unweighted base
Tier 2 % 42 35 14 5 4 768 3 % 40 33 15 7 4 779 4 % 37 33 18 10 2 92
OGRS band Low % 39 36 16 6 4 876 Medium % 40 33 16 7 4 428 High % 47 32 12 6 3 269 Very high % 35 35 11 14 5 66
Sentence length 6 months or less % 49 29 12 8 2 187 7–12 months % 40 35 14 6 4 1094 13–18 months % 41 29 18 10 2 172 19–24 months % 41 31 20 4 4 136 25–36 months % 30 43 18 7 2 50
Risk of serious harm Low % 38 40 14 5 4 563 Medium % 38 40 14 5 4 882 High or very high % 42 32 15 7 4 58
Base: All survey respondents at Wave 1, offenders on Tiers 2 to 4
Source: Survey data (Wave 1)
Table A.5 Number of topics offenders reported discussing with Offender Manager
% of offenders 0 10 1 12 2 15 3 16 4 15 5 11 6 or more 21 Mean (number of topics) 3.3 Unweighted base 1,640
Base: All Wave 2/3 survey respondents at Wave 1, offenders on Tier 2 to 4
Source: Survey data (Wave 1)
Table A.6 Number of topics offenders reported discussing with Offender Manager by risk of reoffending
Number of topics discussed Risk of reoffending (OGRS) None to three Four or more
Unweighted base
Low risk % 57 43 876 Medium risk % 51 49 429 High risk % 47 53 269 Very high risk % 51 49 66
Base: All Wave 2/3 survey respondents at Wave 1, offenders on Tier 2 to 4
Source: Survey data (Wave 1)
36

Table A.7 Offenders’ views of the usefulness of discussions with Offender Manager, by topic of discussion
Topic of discussion Very usefulFairly useful
Not very useful
Not at all useful
Unweighted base
Alcohol use % 42 41 12 5 707 Drug use % 39 41 15 5 578 Mental health % 36 43 16 5 505 Living arrangements % 35 46 13 5 830 Family or children % 35 46 13 6 859 Skills, education and training % 33 50 13 5 671 Physical health or disability % 30 46 17 7 448 Work or getting work % 25 49 18 7 772 Managing finances % 24 48 21 7 432
Base: All survey respondents at Wave 1 (average of 3 months into the Order), Tier 2 to 4 offenders
Source: Survey data (Wave 1, average of 3 months into the Order)
Table A.8 Percentage of offenders who had discussions with Offender Manager on each topic, by whether they had a related OASys identified need
Topic of discussion Discussed by Wave 1 Living arrangements
No accommodation need % 47 Accommodation need % 64
Skills, education and training No ETE need % 34 ETE need1 % 46
Work or getting work No ETE need % 43 ETE need1 % 51
Family or children No relationship need % 47 Relationship need % 56
Drug use No drug misuse need % 19 Drug misuse need % 75
Alcohol use No alcohol misuse need % 28 Alcohol misuse need % 73
Unweighted base 1,640
Base: Wave 2/3 survey respondents with OASys assessments at Wave 1, offenders on Tier 2 to 4
Source: Survey data (Wave 1), matched with OASys administrative data 1 ETE need means OASys has identified a need for Education, Training and Employment support
37
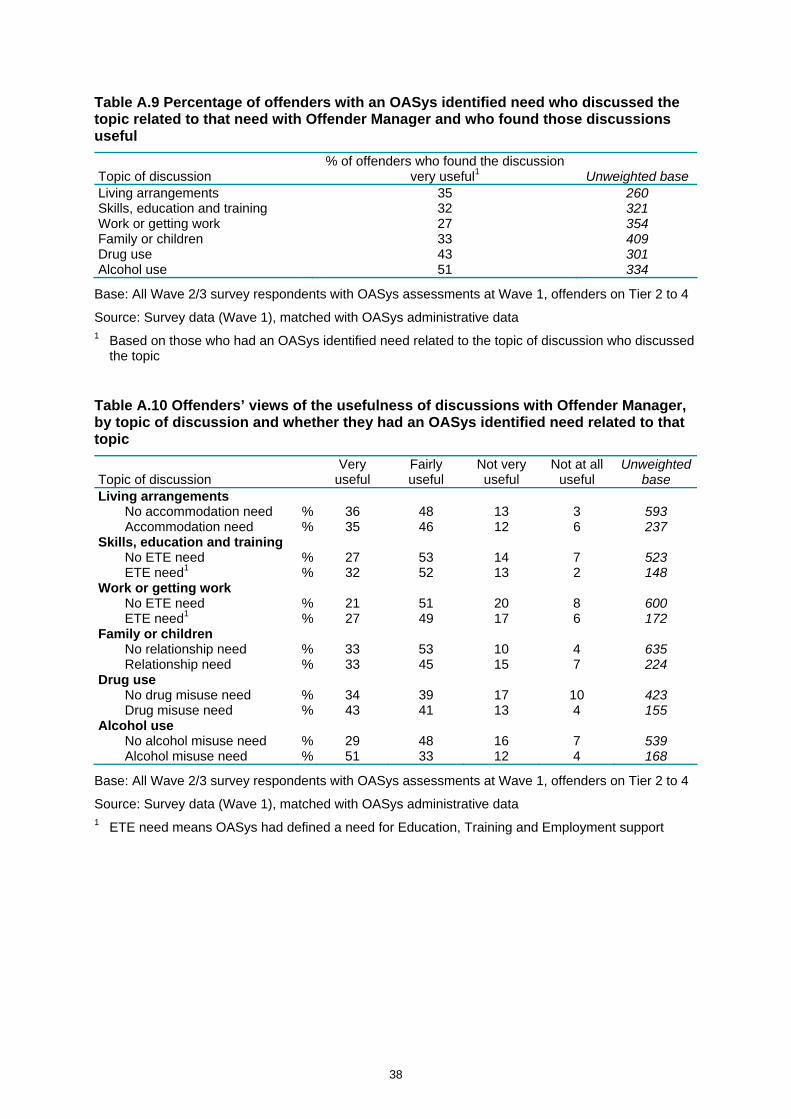
Table A.9 Percentage of offenders with an OASys identified need who discussed the topic related to that need with Offender Manager and who found those discussions useful
Topic of discussion % of offenders who found the discussion
very useful1 Unweighted base Living arrangements 35 260 Skills, education and training 32 321 Work or getting work 27 354 Family or children 33 409 Drug use 43 301 Alcohol use 51 334
Base: All Wave 2/3 survey respondents with OASys assessments at Wave 1, offenders on Tier 2 to 4
Source: Survey data (Wave 1), matched with OASys administrative data 1 Based on those who had an OASys identified need related to the topic of discussion who discussed
the topic
Table A.10 Offenders’ views of the usefulness of discussions with Offender Manager, by topic of discussion and whether they had an OASys identified need related to that topic
Topic of discussion Very
useful Fairly useful
Not very useful
Not at all useful
Unweighted base
Living arrangements No accommodation need % 36 48 13 3 593 Accommodation need % 35 46 12 6 237
Skills, education and training No ETE need % 27 53 14 7 523 ETE need1 % 32 52 13 2 148
Work or getting work No ETE need % 21 51 20 8 600 ETE need1 % 27 49 17 6 172
Family or children No relationship need % 33 53 10 4 635 Relationship need % 33 45 15 7 224
Drug use No drug misuse need % 34 39 17 10 423 Drug misuse need % 43 41 13 4 155
Alcohol use No alcohol misuse need % 29 48 16 7 539 Alcohol misuse need % 51 33 12 4 168
Base: All Wave 2/3 survey respondents with OASys assessments at Wave 1, offenders on Tier 2 to 4
Source: Survey data (Wave 1), matched with OASys administrative data 1 ETE need means OASys had defined a need for Education, Training and Employment support
38

Table A.11 Percentage of offenders with OASys identified needs who discussed topics related to those needs with Offender Manager
% of offenders Topics related to all needs discussed 44 Topics related to at least one need, but not all needs, discussed 42 No topics related to needs discussed 14 Unweighted base 1,007
Base: All Wave 2/3 survey respondents with OASys assessments at Wave 1, offenders on Tier 2 to 4
Source: Survey data (Wave 1), matched with OASys administrative data
Table A.12 Offender’s views of whether they needed help with each OASys identified need, by whether topics related to need were discussed with Offender Manager
Offender’s views of needs
OASys need No help needed
Need a little help
Need a lot of help
Unweighted base
Accommodation Living arrangements discussed % 47 12 41 238 Living arrangements not discussed % 70 8 22 134
ETE1 Skills discussed % 53 20 28 273 Skills not discussed1 % 69 15 16 336
ETE1 Work discussed % 36 24 41 314 Work not discussed1 % 59 15 26 295
Relationships Family or children discussed % 78 12 11 406 Family or children not discussed % 88 4 7 292
Drug misuse Drug use discussed % 43 17 41 253 Drug use not discussed % 85 11 4 80
Alcohol misuse Alcohol use discussed % 47 20 33 315 Alcohol use not discussed % 91 2 7 107
Base: All Wave 2/3 survey respondents with OASys assessments at Wave 1, offenders on Tier 2 to 4
Source: Survey data (Wave 1), matched with OASys administrative data 1 ETE need means OASys had defined a need for Education, Training and Employment support
39
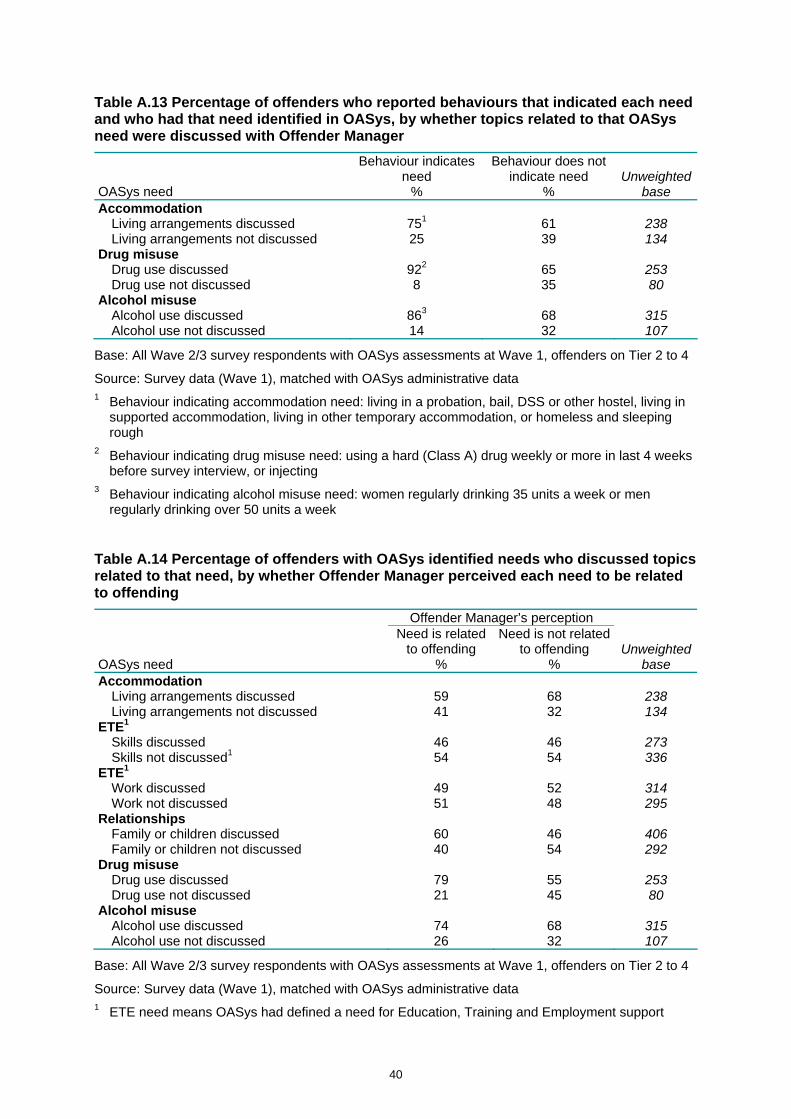
Table A.13 Percentage of offenders who reported behaviours that indicated each need and who had that need identified in OASys, by whether topics related to that OASys need were discussed with Offender Manager
OASys need
Behaviour indicates need
%
Behaviour does not indicate need
% Unweighted
base Accommodation
Living arrangements discussed 751 61 238 Living arrangements not discussed 25 39 134
Drug misuse Drug use discussed 922 65 253 Drug use not discussed 8 35 80
Alcohol misuse Alcohol use discussed 863 68 315 Alcohol use not discussed 14 32 107
Base: All Wave 2/3 survey respondents with OASys assessments at Wave 1, offenders on Tier 2 to 4
Source: Survey data (Wave 1), matched with OASys administrative data 1 Behaviour indicating accommodation need: living in a probation, bail, DSS or other hostel, living in
supported accommodation, living in other temporary accommodation, or homeless and sleeping rough
2 Behaviour indicating drug misuse need: using a hard (Class A) drug weekly or more in last 4 weeks before survey interview, or injecting
3 Behaviour indicating alcohol misuse need: women regularly drinking 35 units a week or men regularly drinking over 50 units a week
Table A.14 Percentage of offenders with OASys identified needs who discussed topics related to that need, by whether Offender Manager perceived each need to be related to offending
Offender Manager’s perception
OASys need
Need is related to offending
%
Need is not related to offending
% Unweighted
base Accommodation
Living arrangements discussed 59 68 238 Living arrangements not discussed 41 32 134
ETE1 Skills discussed 46 46 273 Skills not discussed1 54 54 336
ETE1 Work discussed 49 52 314 Work not discussed 51 48 295
Relationships Family or children discussed 60 46 406 Family or children not discussed 40 54 292
Drug misuse Drug use discussed 79 55 253 Drug use not discussed 21 45 80
Alcohol misuse Alcohol use discussed 74 68 315 Alcohol use not discussed 26 32 107
Base: All Wave 2/3 survey respondents with OASys assessments at Wave 1, offenders on Tier 2 to 4
Source: Survey data (Wave 1), matched with OASys administrative data 1 ETE need means OASys had defined a need for Education, Training and Employment support
40

Table A.15 Percentage of offenders with a drug or alcohol requirement in their Community Order, by whether they had an OASys need or the offender reported a need for help in that area
% of offenders with requirement Unweighted base Drug requirement
OASys need 43 404 Self-reported need for a lot of help 75 196
Alcohol requirement OASys need 42 668 Self-reported need for a lot of help 55 179
Base: All Wave 2/3 survey respondents with OASys assessments at Wave 1, offenders on Tier 2 to 4
Source: Survey data (Wave 1), matched with OASys administrative data
Table A.16 Percentage of offenders with each requirement in their Community Order who had discussed topics related to that requirement with Offender Manager
Community Order requirement % of offenders who discussed
related topics Unweighted base Drug treatment 94 264 Alcohol treatment 90 305 Mental health treatment 90 77
Base: All Wave 2/3 survey respondents with OASys assessments at Wave 1, offenders on Tier 2 to 4
Source: Survey data (Wave 1), matched with OASys administrative data
Table A.17 Offenders’ views of the usefulness of discussions with Offender Manager by whether they had a treatment requirement for that need
Usefulness of discussions
OASys need Very
useful Fairly useful
Not very useful
Not at all useful
Unweighted base
Drug misuse Has drug treatment requirement % 58 33 7 1 248 No drug treatment requirement % 26 46 20 8 389
Alcohol misuse Has alcohol treatment requirement % 59 28 11 1 275 No alcohol treatment requirement % 31 48 13 7 451
Mental health Has mental health treatment requirement
% 52 28 16 4 69
No mental health treatment requirement
% 33 45 16 5 403
Base: All Wave 2/3 survey respondents with OASys assessments at Wave 1, offenders on Tier 2 to 4
Source: Survey data (Wave 1), matched with OASys administrative data
Table A.18 Offenders’ views of their relationship with their Offender Manager
Excellent Good OK Not very
good Bad Unweighted
base Response at Wave 1 % 37 43 18 1 1 1,632 Latest response (Wave 2 or Wave 3) % 41 37 17 3 2 1,603
Base: All Wave 2/3 survey respondents at Wave 1 and latest survey, offenders on Tier 2 to 4
Source: Survey data (Waves 1, 2 and 3)
41

Table A.19 Change over time in offenders’ views of relationship with Offender Manager
% Excellent relationship in Wave 1 and Wave 2 25 Excellent relationship in Wave 1 but not Wave 2 12 Not excellent relationship in Wave 1 but excellent relationship in Wave 2 16 Excellent relationship in neither Wave 1 nor Wave 2 47 Unweighted base 1,520
Base: All Wave 2 survey respondents, offenders on Tier 2 to 4
Source: Survey data (Wave 1 and Wave 2)
Table A.20 Offenders’ views of relationship with Offender Manager by risk of reoffending (OGRS)
Relationship with Offender Manager Risk of reoffending (OGRS) Excellent Good OK Not very good Bad
Unweighted base
Low % 44 41 14 1 1 700 Medium % 31 45 21 2 1 499 High % 33 47 18 1 1 350 Very high % 27 41 26 5 1 81
Base: All Wave 2/3 survey respondents at Wave 1, offenders on Tier 2 to 4
Source: Survey data (Wave 1)
Table A.21 Offenders’ attitudes to their Offender Managers at the latest available survey
Strongly agree Agree
Neither agree nor disagree Disagree
Strongly disagree
Unweighted base
My Offender Manager listens carefully to what I tell him/her
% 45 47 4 3 2 1,640
I believe my Offender Manager understands my needs well
% 37 49 7 5 2 1,640
My Offender Manager supports me in my daily life
% 21 34 20 21 4 1,638
My Offender Manager motivates me to make improvements to my life
% 26 47 14 10 3 1,638
By offending again I would let my Offender Manager down
% 31 44 10 10 4 1,640
Base: All Wave 2/3 survey respondents latest response, offenders on Tiers 2 to 4
Source: Survey data (Wave 2/3)
42

43
Table A.22 Percentage of offenders who said that their Offender Manager understood their needs well, by risk of reoffending (OGRS)
Offender Manager understands needs well Risk of reoffending (OGRS)
Strongly agree Agree
Neither agree nor disagree Disagree
Strongly disagree
Unweighted base
Low % 50 39 6 3 1 705 Medium % 40 48 7 5 0 501 High % 44 41 9 5 1 354 Very high % 51 37 5 6 1 81
Base: All Wave 2/3 survey respondents at Wave 1, offenders on Tier 2 to 4
Source: Survey data (Wave 1)
Table A.23 Sentence outcomes reported by offenders1
% of offenders No warnings, breach or conviction 49 One or more warnings but no breach 29 Breach – order amended 17 Breach – order ended 3 Convicted for another offence 3 Unweighted base 1,640
Base: All Wave 2/3 survey respondents at latest survey, offenders on Tier 2 to 4
Source: Survey data (Waves 1, 2 and 3) 1 Categories are mutually exclusive, e.g. if an offender received one or more warnings and was
breached they would not be included in the category of ‘One or more warnings’
Table A.24 Percentage of offenders who reported that they had been breached, by whether they also reported being given a warning
One or more warnings
% No warnings
% Offender-reported breach
Yes 37 4 No 63 96
Unweighted base 670 970
Base: All Wave 2/3 survey respondents at latest survey, offenders on Tier 2 to 4
Source: Survey data (Waves 1, 2 and 3)

Table A.25 Logistic regression of offender-reported breach during the Community Order
Confidence interval Variable Category Significance Odds ratio Lower Upper Age Age (entered as continuous variable)* 0.000 0.962 0.946 0.978
More than once a week* 0.003 0.418 0.237 0.739 Once a week (reference) Once a fortnight* 0.000 0.229 0.117 0.449 3 weeks to a month* 0.000 0.193 0.088 0.423
Frequency of meetings with Offender Manager (Wave 1)
Less frequent* 0.011 0.328 0.138 0.778 No (reference) Specified activity Yes* 0.001 1.766 1.280 2.436 No (reference) Drug treatment Yes* 0.002 1.823 1.255 2.650 No (reference) Unpaid work Yes* 0.000 1.954 1.434 2.662
OGRS (risk of reoffending) OGRS (entered as continuous variable: higher = higher risk)* 0.050 1.006 1.000 1.012 Tier 1* 0.032 2.314 1.074 4.985 Tier 2 0.855 1.059 0.573 1.955 Tier 3 0.842 0.942 0.520 1.704
Tier1
Tier 4 (reference) Constant 0.827 0.893
44
Base: all survey respondents at Wave 2/3, Tier 1 to 4 offenders (n = 1,527)
Source: Survey data
SPSS logistic regression using enter method following forward stepwise to assess effect of wider group of variables
Variables found not to be significant and not included in this model: Duration of meetings, gender; proportion of offender’s OASys needs that were discussed; number of meetings with Offender Manager in second month of Community Order, drug use problem (survey definition), length of sentence
Dependent variable: breach proceedings according to offender reports to survey (at any wave)
Odds ratios of greater than one indicate relatively higher odds of an adverse outcome for the Community Order than the reference category in that variable; less than one indicate relatively lower odds
A significance level of 0.05 was used, indicating a statistically significant impact of that variable on the dependent variable (at the five per cent level)

45
* Indicates a statistically significant difference in the odds ratio compared with the reference category or for the variable in the case of continuous variables. Categories found to be more likely to breach in this analysis: a) Younger offenders b) Those who met with their Offender Manager once a week c) Those with a specified activity requirement d) Those with a drug treatment requirement e) Those with an unpaid work requirement f) Those with higher risk of reoffending scores based on OGRS g) Those in Tier 1, compared with Tier 4
1 The OMCCS survey included offenders who were defined as Tier 2 to 4 at the start of their sentence, and excluded those defined as Tier 1 at the start of their sentence. This analysis uses tier after Community Order commencement. Some offenders who were defined as Tier 2 to 4 at the start of their sentence subsequently changed to Tier 1.

Table A.26 Percentage of offenders who said their Offender Manager motivated them to avoid crime, by frequency of meetings with Offender Manager
Frequency of meetings (at Wave 1) % of offenders who said their Offender Manager motivated
them to avoid crime Low frequency (less than once a week) 53 High frequency (once a week or more) 62 Unweighted base 1,640
Base: All Wave 2/3 survey respondents, offenders on Tier 2 to 4
Source: Survey data (Waves 1, and 2/3) 1 Frequency of meetings was reported at Wave 1, while the percentage of offenders who reported
that the Offender Manager motivated them to avoid crime uses the latest survey available
Table A.27 Percentage of offenders who said their Offender Manager motivated them to avoid crime, by number of potential needs discussed with Offender Manager
Number of needs discussed (at Wave 1)% of offenders who said their Offender Manager motivated
them to avoid crime Did not discuss any needs 34 Discussed at least one need 62 Unweighted base 1,640
Base: All Wave 2/3 survey respondents, offenders on Tier 2 to 4
Source: Survey data (Waves 1, and 2/3) 1 Number of potential needs discussed with Offender Manager was reported at Wave 1, while the
percentage of offenders who reported that the Offender Manager motivated them to avoid crime uses the latest survey available
Table A.28 Percentage of offenders who said their Offender Manager motivated them to avoid crime, by number of OASys identified needs discussed
Number of needs discussed (at Wave 1)% of offenders who said their Offender Manager motivated
them to avoid crime Topics related to all OASys identified needs were discussed
68
Topics related to at least one, but not all OASys identified needs were discussed
58
No topics related to OASys identified needs were discussed
48
Unweighted base 1,007
Base: Wave 2/3 survey respondents with OASys assessments by Wave 1, offenders on Tier 2 to 4
Source: Survey data (Waves 1, and 2/3) 1 Number of OASys reported needs discussed with Offender Manager was reported at Wave 1, while
the percentage of offenders who reported that the Offender Manager motivated them to avoid crime uses the latest survey available
46