Embed Size (px)
Citation preview

T 13
The Role of Military, Leisure Time and Work Noise Exposure in the
Evaluation of Total Noise Exposure
©Esko Toppila, Jukka Starck
Finnish Institute of Occupational Health
Ilmari Pyykkö
Karolinska Institute,Sweden
T 13Introduction
• Current situation– Work exposure decreasing
» Use of HPDs increasing
» Noise levels at work decreasing
– Free time exposure increasing
» Music (Discos, concerts, portable cassette players, shooting)
» Power tools ( chainsaws, electronic tools …)
» Snow mobiles …
– Military noise exposure
» Mainly impulsive
» Increased use of HPDs

T 13Exposure of young people (1)
• Youngsters in Nottingham (Smith,Davis, Ferguson,Lutman Noise and Health, 2000)
• Major sources of exposure
6.7
18.8
8.9
3.53.1 2.9
0
5
10
15
20
Social Occupational Gunfire
1980
1999

T 13Work exposure
• Facts about Finnish industry– Typical noise levels 90-95 dB
– Number of exposed 250 000 -300 000
– NIHL prevalence 0.03 (~1000 cases/y)
• Exposure depends highly on the use of hearing protectors (HPDs)
– How they are used
– Usage rates

T 13Shooting noise
• Free time– Number of hunters 300 000
– 5 dB lower hearing at 4 kHz than other worker in noisy workplaces
• Military service– Mandatory over 90 % of mail population
– About 200 hearing losses annually

T 13Purpose of the study
• Evaluate the factors contributing to the total exposure for people working in noisy occupations
– Use of hearing protectors
– Free time noise and use of of HPDs in free time
– Military service

T 13Material
• Work histories were collected for years 1950-1993, for workers with mean age 41 years
Industry N Noise level LocationShipyard 176 93-95 dB Helsinki, South FinlandForestry 100 95-97 dB Rural Northern FinlandPapermill 406 93 dB Rural South Finland

T 13Methods
• Work exposure– Sound level measurements inside and outside HPDs
– Use and type of HPDs with questionnaire
• Free time exposure– Noisy activities with questionnaire
– Use of HPDs with questionnaire
• Military service exposure– Shots and type of weapon with questionnaire
– Use of HPDs with questionnaire

T 13Results
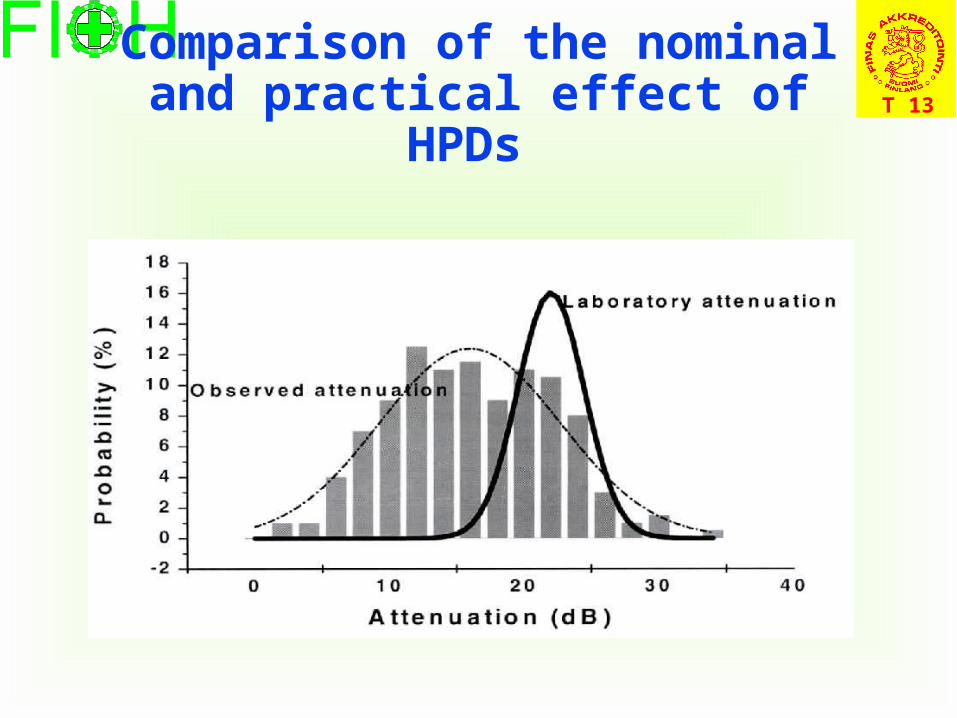
T 13Comparison of the nominal and
practical effect of HPDs

T 13
Exposure inside and outside the HPDs
70 80 90 100 1100
500
1000
Exposure inside the protector L'Ex
(dB)
Exposure outside the protector L Ex (dB)
70 80 90 100 110
0
200
400
600
Count
(N)
B
LEx=SPL+10*log(TEx)

T 13The attenuation of HPDs at work
0 5 10 15 200
500
1000
Difference L Ex-L'
Ex (dB)
Count (N)
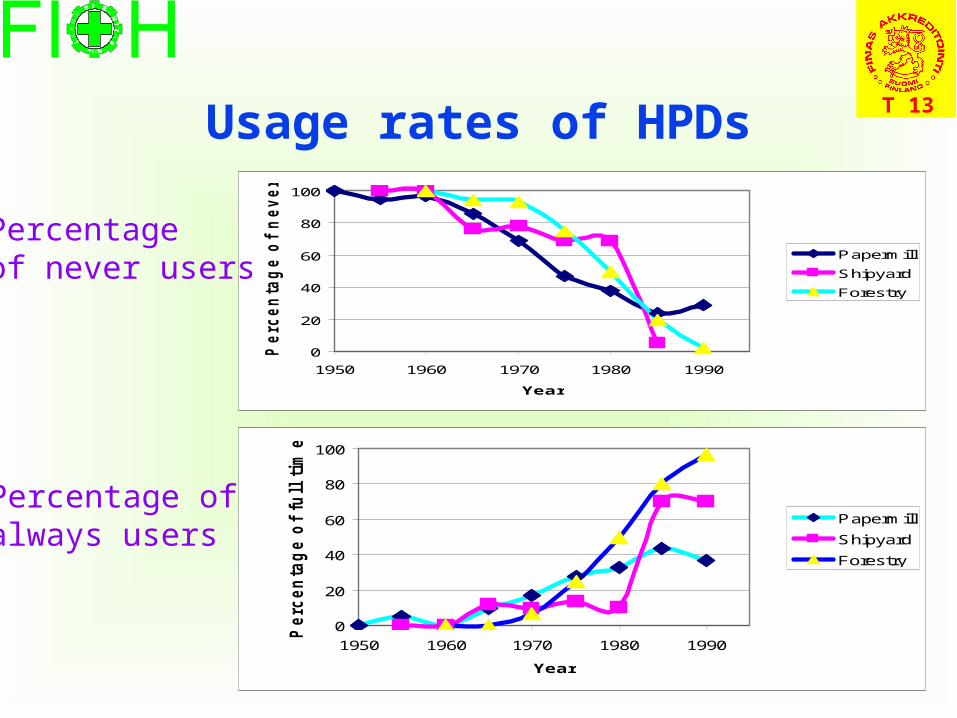
T 13Usage rates of HPDs
0
20
40
60
80
100
1950 1960 1970 1980 1990
Year
Percen
tag
e o
f n
ever u
sers (
%)
Papermill
Shipyard
Forestry
0
20
40
60
80
100
1950 1960 1970 1980 1990
Year
Perc
en
tag
e o
f fu
ll t
ime u
sers
(%
)
Papermill
Shipyard
Forestry
Percentageof never users
Percentage ofalways users
T 13Results free time exposure
• Shooting
• Noisy tools
• music exposure

T 13Free-time shooting
53 % of the subjects53 % of the subjects

T 13Other free-time exposure
• 16 % considerable exposure to power tools and snow scooters
– 13 % were using hearing protectors
• No music exposure reported

T 13Exposure during military service
68 % of the subjects 40 % of the subjects
Number of shots with handgunNumber of shots with artillery

T 13Use of HPDs during military shooting
Always
Often
Half oftime
Occationally
Never
T 13Discussion
• Small music exposure– Age
– Time period
• Usage rates of HPDs increased in mid-eighties
– Due to integrated working clothes ?
• Free time exposure considerable– Low usage rates of HPDs
• Shooting– Typically hundreds of shots
– High occurrence due to rural areas

T 13Comparison of the role of
different noise sources in total exposure
20 30 40 50 60
80
100
120
Work exposure with use of hearing protectors
Exposure in concerts and discos
Estimate of work exposure without hearing protectors
Cu
mu
lati
ve e
xpo
sure
(dB
(A))
Age
10 20 30 40 50 60
14
16
18
20
22
24
26
28
30
32Shooting
Sh
oo
tin
g n
ois
e (d
B)
wh
ich
can
no
t b
e co
mb
ined

T 13Conclusions
• Music exposure is a problem of young people
• Older workers may have other noisy hobbies– The usage rates of HPDs is low
• For older workers the exposure in the past without HPDs may be the dominant exposure


![Noise Exposure (46.162) [Enmienda]](https://img.dokumen.tips/doc/110x75/5695cf101a28ab9b028c6f1f/noise-exposure-46162-enmienda.jpg)


