Embed Size (px)
Citation preview
U.S. GOVERNMENT PRINTING OFFICE
WASHINGTON :
For sale by the Superintendent of Documents, U.S. Government Printing OfficeInternet: bookstore.gpo.gov Phone: toll free (866) 512–1800; DC area (202) 512–1800
Fax: (202) 512–2250 Mail: Stop SSOP, Washington, DC 20402–0001
1
28–640
SENATE " ! 109th Congress
2nd Session S. PRT.
2006
109–65
THE ROLE OF MARKET SPECULATION IN RISING OIL AND GAS PRICES: A NEED TO PUT THE COP BACK ON THE BEAT
STAFF REPORT
PREPARED BY THE
PERMANENT SUBCOMMITTEE ON INVESTIGATIONS
OF THE
COMMITTEE ON HOMELAND SECURITY AND GOVERNMENTAL AFFAIRS UNITED STATES SENATE
JUNE 27, 2006
VerDate 0ct 09 2002 09:54 Aug 01, 2006 Jkt 028640 PO 00000 Frm 00001 Fmt 5012 Sfmt 5012 C:\DOCS\28640.TXT SAFFAIRS PsN: PAT cong
ress
.#13

(II)
COMMITTEE ON HOMELAND SECURITY AND GOVERNMENTAL AFFAIRS
SUSAN M. COLLINS, Maine, Chairman TED STEVENS, Alaska GEORGE V. VOINOVICH, Ohio NORM COLEMAN, Minnesota TOM COBURN, Oklahoma LINCOLN D. CHAFEE, Rhode Island ROBERT F. BENNETT, Utah PETE V. DOMENICI, New Mexico JOHN W. WARNER, Virginia
JOSEPH I. LIEBERMAN, Connecticut CARL LEVIN, Michigan DANIEL K. AKAKA, Hawaii THOMAS R. CARPER, Delaware MARK DAYTON, Minnesota FRANK LAUTENBERG, New Jersey MARK PRYOR, Arkansas
MICHAEL D. BOPP, Staff Director and Chief Counsel JOYCE A. RECHTSCHAFFEN, Minority Staff Director and Chief Counsel
TRINA DRIESSNACK TYRER, Chief Clerk
PERMANENT SUBCOMMITTEE ON INVESTIGATIONS
NORM COLEMAN, Minnesota, Chairman TED STEVENS, Alaska TOM COBURN, Oklahoma LINCOLN D. CHAFEE, Rhode Island ROBERT F. BENNETT, Utah PETE V. DOMENICI, New Mexico JOHN W. WARNER, Virginia
CARL LEVIN, Michigan DANIEL K. AKAKA, Hawaii THOMAS R. CARPER, Delaware MARK DAYTON, Minnesota FRANK LAUTENBERG, New Jersey MARK PRYOR, Arkansas
RAYMOND V. SHEPHERD, III, Staff Director and Chief Counsel LELAND B. ERICKSON, Counsel
ELISE J. BEAN, Minority Staff Director and Chief Counsel DAN M. BERKOVITZ, Minority Counsel
MARY D. ROBERTSON, Chief Clerk
VerDate 0ct 09 2002 09:54 Aug 01, 2006 Jkt 028640 PO 00000 Frm 00002 Fmt 5904 Sfmt 5904 C:\DOCS\28640.TXT SAFFAIRS PsN: PAT
(III)
C O N T E N T S
Page
I. EXECUTIVE SUMMARY ................................................................................. 1II. FINDINGS AND RECOMMENDATIONS ................................................... 6
A. Findings ........................................................................................................ 61. Rise in Speculation ................................................................................. 62. Speculation Has Increased Prices ......................................................... 63. Price-Inventory Relationship Altered ................................................... 74. Large Trader Reports Essential ............................................................ 75. ICE Impact on Energy Prices ................................................................ 7
B. Recommendations ........................................................................................ 71. Eliminate Enron Loophole ..................................................................... 72. Require Large Trader Reports .............................................................. 73. Monitor U.S. Energy Trades on Foreign Exchanges ........................... 74. Increase U.S.-U.K. Cooperation ............................................................ 75. Make ICE Determination ...................................................................... 7
III. RECENT TRENDS IN ENERGY MARKETS ............................................ 8A. Increasing Prices .......................................................................................... 8B. Increasing Amounts of Crude Oil in Storage ............................................ 12C. Increased Speculation in Energy Commodities ......................................... 16
1. Increased Investments in Energy Commodities .................................. 162. The Effect of Speculation on Prices ...................................................... 173. Large Profits from Speculation in Energy Commodities ..................... 23
IV. NO COP ON THE BEAT FOR OVER-THE-COUNTER ENERGY MARKETS ........................................................................................................... 28
A. Development of OTC Electronic Markets .................................................. 29B. No Oversight of OTC Electronic Markets .................................................. 32C. No Large Trader Reporting in OTC Electronic Markets .......................... 35D. No Public Dissemination of Trading Data by OTC Electronic Markets . 37
V. THE COP’S BLIND EYE: U.S. ENERGY TRADES ON FOREIGN EXCHANGES ...................................................................................................... 40
A. U.S. Energy Commodities Traded on Foreign Exchanges ........................ 40B. ICE Futures Trading of U.S. Energy Commodities .................................. 41C. Implications for Oversight of U.S. Commodity Markets .......................... 42
APPENDIX: MEASURING THE INCREASE IN SPECULATIVE TRAD-ING ....................................................................................................................... 44
A. CFTC Commitment of Traders Report ....................................................... 44B. Increased Speculative Trading on the NYMEX ........................................ 45C. Increased Speculative Trading on ICE ...................................................... 48
VerDate 0ct 09 2002 09:54 Aug 01, 2006 Jkt 028640 PO 00000 Frm 00003 Fmt 5904 Sfmt 5904 C:\DOCS\28640.TXT SAFFAIRS PsN: PAT

VerDate 0ct 09 2002 09:54 Aug 01, 2006 Jkt 028640 PO 00000 Frm 00004 Fmt 5904 Sfmt 5904 C:\DOCS\28640.TXT SAFFAIRS PsN: PAT

(1)
1 See, e.g., Minority Staff, U.S. Senate Permanent Subcommittee on Investigations, U.S. Stra-tegic Petroleum Reserve: Recent Policy Has Increased Costs to Consumers But Not Overall U.S. Energy Security, S. Prt. 108–18 (March 5, 2003); Majority Staff, U.S. Senate Permanent Sub-committee on Investigations, Gas Prices: How Are They Really Set?, reprinted in Gas Prices: How Are They Really Set, Hearings before the U.S. Senate Permanent Subcommittee on Inves-tigations (S. Hrg. 107–509) (April 30 and May 2, 2002), at p. 322; U.S. General Accounting Of-fice, Effects of Mergers and Market Concentration in the U.S. Petroleum Industry, Report to the Ranking Minority Member, U.S. Senate Permanent Subcommittee on Investigations, GAO–04–96 (May 2004); Volatility in the Natural Gas Market: The Impact of High Natural Gas Prices on American Consumers, Hearing before the U.S. Senate Permanent Subcommittee on Investiga-tions (S. Hrg. 109–398) (February 13, 2006).
THE ROLE OF MARKET SPECULATION IN RIS-ING OIL AND GAS PRICES: A NEED TO PUT THE COP BACK ON THE BEAT
I. EXECUTIVE SUMMARY For the past 5 years, the U.S. Senate Permanent Subcommittee
on Investigations has conducted a number of investigations into the pricing of energy commodities, including gasoline, crude oil, and natural gas.1 These investigations reflect a continuing concern over the sustained increases in the price and price volatility of these es-sential commodities, and, in light of these increases, the adequacy of governmental oversight of the markets that set these prices.
Over the past 6 years, crude oil, gasoline, and natural gas prices have risen significantly. Crude oil has risen from a range of $25–$30 per barrel in 2000, to a range of $60–$75 per barrel in 2006. High crude oil prices are a major reason for the record or near-record highs of the prices of a variety of petroleum products, in-cluding gasoline, heating oil, diesel fuel, and jet fuel. The average price for a gallon of regular unleaded gasoline has jumped from $1.46 per gallon in 2000 to $2.36 per gallon over the past 12 months, with peaks at $3.14 per gallon in September 2005, and $2.93 per gallon in May 2006. Rising crude oil prices have helped push up natural gas prices as well: the price of natural gas has risen from $2–$3 per million BTU (British Thermal Unit) in 2000 to a typical range of $6–$8 per million BTU during the past year.
The traditional forces of supply and demand cannot fully account for these increases. While global demand for oil has been increas-ing—led by the rapid industrialization of China, growth in India, and a continued increase in appetite for refined petroleum prod-ucts, particularly gasoline, in the United States—global oil supplies have increased by an even greater amount. As a result, global in-ventories have increased as well. Today, U.S. oil inventories are at an 8-year high, and OECD oil inventories are at a 20-year high. Ac-cordingly, factors other than basic supply and demand must be ex-amined. For example, political instability and hostility to the United States in key producer countries, such as Nigeria, Ven-
VerDate 0ct 09 2002 09:54 Aug 01, 2006 Jkt 028640 PO 00000 Frm 00005 Fmt 6633 Sfmt 6633 C:\DOCS\28640.TXT SAFFAIRS PsN: PAT

2
2 See, e.g., Statement of Daniel Yergin, World Crude Oil Pricing, Hearing before the U.S. House of Representatives Committee on Energy and Commerce, May 4, 2006.
ezuela, Iraq, and Iran, threaten the security and reliability of these supplies. Furthermore, in each of the past 2 years hurricanes have disrupted U.S. oil and gas production in the Gulf of Mexico. As Saudi Arabia has increased its rate of production to meet increas-ing demand, its ability to pump additional oil in the event of a shortfall has declined, thereby providing less of a cushion in the event of a supply disruption. It is often asserted that these fears over the adequacy of supply have built a ‘‘risk premium’’ into crude oil prices.2
In addition, over the past few years, large financial institutions, hedge funds, pension funds, and other investment funds have been pouring billions of dollars into the energy commodities markets—perhaps as much as $60 billion in the regulated U.S. oil futures market alone—to try to take advantage of price changes or to hedge against them. Because much of this additional investment has come from financial institutions and investment funds that do not use the commodity as part of their business, it is defined as ‘‘speculation’’ by the Commodity Futures Trading Commission (CFTC). According to the CFTC, a speculator ‘‘does not produce or use the commodity, but risks his or her own capital trading futures in that commodity in hopes of making a profit on price changes.’’ Reports indicate that, in the past couple of years, some speculators have made tens and perhaps hundreds of millions of dollars in profits trading in energy commodities. This speculative trading has occurred both on the regulated New York Mercantile Exchange (NYMEX) and on the over-the-counter (OTC) markets.
The large purchases of crude oil futures contracts by speculators have, in effect, created an additional demand for oil, driving up the price of oil to be delivered in the future in the same manner that additional demand for the immediate delivery of a physical barrel of oil drives up the price on the spot market. As far as the market is concerned, the demand for a barrel of oil that results from the purchase of a futures contract by a speculator is just as real as the demand for a barrel that results from the purchase of a futures contract by a refiner or other user of petroleum.
Although it is difficult to quantify the effect of speculation on prices, there is substantial evidence that the large amount of spec-ulation in the current market has significantly increased prices. Several analysts have estimated that speculative purchases of oil futures have added as much as $20–$25 per barrel to the current price of crude oil, thereby pushing up the price of oil from $50 to approximately $70 per barrel. Additionally, by purchasing large numbers of futures contracts, and thereby pushing up futures prices to even higher levels than current prices, speculators have provided a financial incentive for oil companies to buy even more oil and place it in storage. A refiner will purchase extra oil today, even if it costs $70 per barrel, if the futures price is even higher.
As a result, over the past 2 years, crude oil inventories have been steadily growing, resulting in U.S. crude oil inventories that are now higher than at any time in the previous 8 years. The last time crude oil inventories were this high, in May 1998—at about 347
VerDate 0ct 09 2002 09:54 Aug 01, 2006 Jkt 028640 PO 00000 Frm 00006 Fmt 6633 Sfmt 6633 C:\DOCS\28640.TXT SAFFAIRS PsN: PAT

3
3 Statement of Alan Greenspan, Oil Depends on Economic Risks, Hearing before the Com-mittee on Foreign Relations, U.S. Senate, June 7, 2006.
4 Id.5 Id. 6 7 U.S.C. § 5(b), 7 7 U.S.C. § 6a(a). 8 Id.9 Id.
million barrels—the price of crude oil was about $15 per barrel. By contrast, the price of crude oil is now about $70 per barrel. The large influx of speculative investment into oil futures has led to a situation where we have high crude oil prices despite high levels of oil in inventory.
As former Federal Reserve Chairman Alan Greenspan recently explained in testimony before the Congress, over the past few years ‘‘there has been a major upsurge in over-the-counter trading of oil futures and other commodity derivatives.’’ 3 Hedge funds and other institutional investors have accumulated ‘‘substantial net long posi-tions in crude oil futures, largely in the over-the-counter market.’’ 4 According to Mr. Greenspan, these futures positions have created an additional demand for oil for future delivery, and ‘‘with the de-mand from the investment community, oil prices have moved up sooner than they would have otherwise.’’ Mr. Greenspan states these price increases have stimulated additional oil production, a large increase in oil inventories, and a partial scale-back of con-sumption.5
In general, speculative trading brings greater liquidity to the fu-tures market, so that companies seeking to hedge their exposure to commodity prices can find counterparties willing to take on those price risks. Speculative purchases of futures contracts can also, in effect, finance the production and storage of the underlying com-modity to meet future demand. On the other hand, large specula-tive buying or selling of futures contracts can distort the market signals regarding supply and demand in the physical market or lead to excessive price volatility, either of which can cause a cas-cade of consequences detrimental to the overall economy.
A key responsibility of the CFTC is to ensure that prices on the futures market reflect the laws of supply and demand rather than manipulative practices 6 or excessive speculation.7 The Commodity Exchange Act (CEA) states, ‘‘Excessive speculation in any com-modity under contracts of sale of such commodity for future deliv-ery . . . causing sudden or unreasonable fluctuations or unwar-ranted changes in the price of such commodity, is an undue and unnecessary burden on interstate commerce in such commodity.’’ 8 The CEA directs the CFTC to establish such trading limits ‘‘as the Commission finds are necessary to diminish, eliminate, or prevent such burden.’’ 9
At the same time that there has been a huge influx of specula-tive dollars in energy commodities, the CFTC’s ability to monitor the nature, extent, and effect of this speculation has been dimin-ishing. Most significantly, there has been an explosion of trading of U.S. energy commodities on exchanges that are not regulated by the CFTC. Available data on the nature and extent of this specula-tion is limited, so it is not possible for anyone, including the CFTC,
VerDate 0ct 09 2002 09:54 Aug 01, 2006 Jkt 028640 PO 00000 Frm 00007 Fmt 6633 Sfmt 6633 C:\DOCS\28640.TXT SAFFAIRS PsN: PAT

4
10 Robert J. Shiller, Irrational Exuberance (Princeton University Press, 2000), at p. 5. 11 Id., at pp. 203–204.
to make a final determination about the current level of specula-tion.
In Irrational Exuberance, which forecasted the collapse of stock market prices in 2000–2001, Professor Robert Shiller wrote of the importance of understanding the role of speculation in setting mar-ket prices. ‘‘We need to know confidently whether the increase that brought us here is indeed a speculative bubble—an unsustainable increase in prices brought on by investors’’ buying behavior rather than by genuine, fundamental information about value. In short, we need to know if the value investors have imputed to the market is not really there, so that we can readjust our planning and think-ing.’’ 10
To a certain extent, whether any level of speculation is ‘‘exces-sive’’ lies within the eye of the beholder. In the absence of data, however, it is impossible to begin the analysis or engage in an in-formed debate over whether our energy markets are functioning properly or are in the midst of a speculative bubble. Again, Pro-fessor Shiller has warned, ‘‘It is a serious mistake for public figures to acquiesce in the stock market valuations we have seen recently, to remain silent about the implications of such high valuations, and to leave all commentary to the market analysts. . . . The valuation of the stock market is an important national—indeed international issue.’’ 11 This advice would appear to be as relevant to the energy markets as to the stock market.
Until recently, U.S. energy futures were traded exclusively on regulated exchanges within the United States, like the NYMEX, which are subject to extensive oversight by the CFTC, including on-going monitoring to detect and prevent price manipulation or fraud. In recent years, however, there has been a tremendous growth in the trading of contracts that look and are structured just like futures contracts, but which are traded on unregulated OTC electronic markets. Because of their similarity to futures contracts they are often called ‘‘futures look-alikes.’’ The only practical dif-ference between futures look-alike contracts and futures contracts is that the look-alikes are traded in unregulated markets whereas futures are traded on regulated exchanges. The trading of energy commodities by large firms on OTC electronic exchanges was ex-empted from CFTC oversight by a provision inserted at the behest of Enron and other large energy traders into the Commodity Fu-tures Modernization Act of 2000 in the waning hours of the 106th Congress.
The impact on market oversight has been substantial. NYMEX traders, for example, are required to keep records of all trades and report large trades to the CFTC. These Large Trader Reports (LTR), together with daily trading data providing price and volume information, are the CFTC’s primary tools to gauge the extent of speculation in the markets and to detect, prevent, and prosecute price manipulation. CFTC Chairman Reuben Jeffery recently stat-ed: ‘‘The Commission’s Large Trader information system is one of the cornerstones of our surveillance program and enables detection
VerDate 0ct 09 2002 09:54 Aug 01, 2006 Jkt 028640 PO 00000 Frm 00008 Fmt 6633 Sfmt 6633 C:\DOCS\28640.TXT SAFFAIRS PsN: PAT

5
12 Letter from Reuben Jeffery III, Chairman, Commodity Futures Trading Commission, to Michigan Governor Jennifer Granholm, August 22, 2005.
of concentrated and coordinated positions that might be used by one or more traders to attempt manipulation.’’ 12
In contrast to trades conducted on the NYMEX, traders on un-regulated OTC electronic exchanges are not required to keep records or file Large Trader Reports with the CFTC, and these trades are exempt from routine CFTC oversight. In contrast to trades conducted on regulated futures exchanges, there is no limit on the number of contracts a speculator may hold on an unregu-lated OTC electronic exchange, no monitoring of trading by the ex-change itself, and no reporting of the amount of outstanding con-tracts (‘‘open interest’’) at the end of each day.
The CFTC’s ability to monitor the U.S. energy commodity mar-kets was further eroded when, in January of this year, the CFTC permitted the Intercontinental Exchange (ICE), the leading oper-ator of electronic energy exchanges, to use its trading terminals in the United States for the trading of U.S. crude oil futures on the ICE futures exchange in London—called ‘‘ICE Futures.’’ Previously, the ICE Futures exchange in London had traded only in European energy commodities—Brent crude oil and United Kingdom natural gas. As a United Kingdom futures market, the ICE Futures ex-change is regulated solely by the United Kingdom Financial Serv-ices Authority. In 1999, the London exchange obtained the CFTC’s permission to install computer terminals in the United States to permit traders here to trade European energy commodities through that exchange.
Then, in January of this year, ICE Futures in London began trading a futures contract for West Texas Intermediate (WTI) crude oil, a type of crude oil that is produced and delivered in the United States. ICE Futures also notified the CFTC that it would be per-mitting traders in the United States to use ICE terminals in the United States to trade its new WTI contract on the ICE Futures London exchange. Beginning in April, ICE Futures similarly al-lowed traders in the United States to trade U.S. gasoline and heat-ing oil futures on the ICE Futures exchange in London.
Despite the use by U.S. traders of trading terminals within the United States to trade U.S. oil, gasoline, and heating oil futures contracts, the CFTC has not asserted any jurisdiction over the trading of these contracts. Persons within the United States seek-ing to trade key U.S. energy commodities—U.S. crude oil, gasoline, and heating oil futures—now can avoid all U.S. market oversight or reporting requirements by routing their trades through the ICE Futures exchange in London instead of the NYMEX in New York.
As an increasing number of U.S. energy trades occurs on unregu-lated, OTC electronic exchanges or through foreign exchanges, the CFTC’s large trading reporting system becomes less and less accu-rate, the trading data becomes less and less useful, and its market oversight program becomes less comprehensive. The absence of large trader information from the electronic exchanges makes it more difficult for the CFTC to monitor speculative activity and to
VerDate 0ct 09 2002 09:54 Aug 01, 2006 Jkt 028640 PO 00000 Frm 00009 Fmt 6633 Sfmt 6633 C:\DOCS\28640.TXT SAFFAIRS PsN: PAT

6
13 Enron’s manipulation of prices on its unregulated electronic trading platform demonstrates the widespread economic harm that may result from abuses in unregulated markets. In 2002, for example, the Federal Energy Regulatory Commission (FERC) found that 174 trades between Enron and one other party in the last hour of trading in Enron’s electronic market on January 31, 2001, resulted in a steep increase in the price of natural gas on that date. The report ten-tatively concluded that Enron OnLine price data was susceptible to price manipulation and may have affected not only Enron trades, but also increased natural gas prices industrywide. See, e.g., August 2002 report prepared by the FERC staff, Docket No. PA–02–000.
detect and prevent price manipulation.13 The absence of this infor-mation not only obscures the CFTC’s view of that portion of the energy commodity markets, but it also degrades the quality of in-formation that is reported. A trader may take a position on an un-regulated electronic exchange or on a foreign exchange that is either in addition to or opposite from the positions the trader has taken on the NYMEX, and thereby avoid and distort the large trad-er reporting system. Not only can the CFTC be misled by these trading practices, but these trading practices could render the CFTC weekly publication of energy market trading data, intended to be used by the public, as incomplete and misleading.
It is critical for U.S. policymakers, analysts, regulators, investors and the public to understand the true reasons for skyrocketing en-ergy prices. If price increases are due to supply and demand imbal-ances, economic policies can be developed to encourage investments in new energy sources and conservation of existing supplies. If price increases are due to geopolitical factors in producer countries, foreign policies can be developed to mitigate those factors. If price increases are due to hurricane damage, investments to protect pro-ducing and refining facilities from natural disasters may become a priority. To the extent that energy prices are the result of market manipulation or excessive speculation, only a cop on the beat with both oversight and enforcement authority will be effective.
Extending the CFTC’s Large Trader Reporting system to require all U.S. traders of energy futures or futures-like contracts to keep records and report large trades to the CFTC, regardless of where the trade takes place—on the NYMEX, on an unregulated OTC electronic exchange, or on a foreign exchange—will eliminate the gaps in large trader reporting requirements. This action is nec-essary to preserve the CFTC’s ability to oversee energy futures markets in order to detect and prevent price manipulation and ex-cessive speculation.
II. FINDINGS AND RECOMMENDATIONS Based upon its investigation into the role of market speculation
in rising oil and gas prices, the Subcommittee staff makes the fol-lowing findings and recommendations.
A. Findings 1. Rise in Speculation. Over the past few years speculators
have expended tens of billions of dollars in U.S. energy commodity markets.
2. Speculation Has Increased Prices. Speculation has contrib-uted to rising U.S. energy prices, but gaps in available market data currently impede analysis of the specific amount of speculation, the commodity trades involved, the markets affected, and the extent of price impacts.
VerDate 0ct 09 2002 09:54 Aug 01, 2006 Jkt 028640 PO 00000 Frm 00010 Fmt 6633 Sfmt 6633 C:\DOCS\28640.TXT SAFFAIRS PsN: PAT

7
3. Price-Inventory Relationship Altered. With respect to crude oil, the influx of speculative dollars appears to have altered the historical relationship between price and inventory, leading the current oil market to be characterized by both large inventories and high prices.
4. Large Trader Reports Essential. CFTC access to daily re-ports of large trades of energy commodities is essential to its ability to detect and deter price manipulation. The CFTC’s ability to de-tect and deter energy price manipulation is suffering from critical information gaps, because traders on OTC electronic exchanges and the London ICE Futures are currently exempt from CFTC report-ing requirements. Large trader reporting is also essential to ana-lyze the effect of speculation on energy prices.
5. ICE Impact on Energy Prices. ICE’s filings with the Securi-ties and Exchange Commission and other evidence indicate that its over-the-counter electronic exchange performs a price discovery function—and thereby affects U.S. energy prices—in the cash mar-ket for the energy commodities traded on that exchange.
B. Recommendations 1. Eliminate Enron Loophole. Congress should eliminate the
Enron loophole that currently limits CFTC oversight of key U.S. energy commodity markets and put the CFTC back on the beat po-licing these markets.
2. Require Large Trader Reports. Congress should enact leg-islation to provide that persons trading energy futures ‘‘look-alike’’ contracts on over-the-counter electronic exchanges are subject to the CFTC’s large trader reporting requirements.
3. Monitor U.S. Energy Trades on Foreign Exchanges. Con-gress should enact legislation to ensure that U.S. persons trading U.S. energy commodities on foreign exchanges are subject to the CFTC’s large trader reporting requirements.
4. Increase U.S.-U.K. Cooperation. The CFTC should work with the United Kingdom Financial Services Authority to ensure it has information about all large trades in U.S. energy commodities on the ICE Futures exchange in London.
5. Make ICE Determination. The CFTC should immediately conduct the hearing required by its regulations to examine the price discovery function of the ICE OTC electronic exchange and the need for ICE to publish daily trading data as required by the Commodity Exchange Act.
VerDate 0ct 09 2002 09:54 Aug 01, 2006 Jkt 028640 PO 00000 Frm 00011 Fmt 6633 Sfmt 6633 C:\DOCS\28640.TXT SAFFAIRS PsN: PAT

8
14 Melanie Feisst, ‘‘Joseph was a speculator too,’’ Hedge funds draw on the Bible to defend themselves against accusations that they have destablised the markets, The Daily Telegraph, U.K., May 6, 2006.
15 Engergy Pricing and Profits, Joint Hearing before the Senate Committee on Commerce, Science and Transportation and the Senate Committee and Energy and Natural Resources, No-vember 9, 2005.
III. RECENT TRENDS IN ENERGY MARKETS ‘‘There has been no shortage and inventories of crude oil and
products have continued to rise. The increase in prices has not been driven by supply and demand.’’
—Lord Browne, Group Chief Executive of BP 14 ‘‘Senator, the facts are—and I’ve said this publicly for a long
time—the oil prices have been moving steadily up for the last 2 years. And I think I have been very clear in saying that I don’t think that the fundamentals of supply and demand—at least as we have traditionally looked at it—have supported the price structure that’s there.’’
—Lee Raymond, Chairman and CEO, ExxonMobil 15
A. Increasing Prices In what has become an all-too-familiar refrain over the past sev-
eral years, energy prices have recently reached record highs. Oil prices in the spring of 2006 surpassed the record highs reached last summer in the days after Hurricane Katrina rampaged through the Gulf of Mexico and shut down over a million barrels per day of U.S. oil production. Figure 1 shows the steep climb and recent record highs in crude oil prices.
Figure 1. Since January 2002, crude oil prices have steadily risen; oil prices reached record high levels in spring of 2006. Prices reflect spot month NYMEX futures contract prices. Data source: U.S. Department of Energy, Energy Informa-tion Administration (EIA), NYMEX data.
VerDate 0ct 09 2002 09:54 Aug 01, 2006 Jkt 028640 PO 00000 Frm 00012 Fmt 6633 Sfmt 6633 C:\DOCS\28640.TXT SAFFAIRS PsN: PAT 2864
0.00
1

9
Because gasoline and other petroleum-based energy commodities are produced by refining crude oil, the rising price of crude oil has been a major cause of rising gasoline and petroleum product prices. Figure 2 illustrates how U.S. gasoline prices have increased in re-cent years.
Figure 2. The average price of gasoline in the United States has risen from an average of $1.10 cents per gallon in the late 1990s to an average of over $2.20 per gallon over the past 12 months, and nearly $3 per gallon in the spring of 2006. Prices reflect the weekly average retail price for all grades of gasoline. Data source: EIA.
Natural gas prices also have jumped higher over the past several years. Because several industries, such as electric power genera-tion, can use natural gas as a substitute for crude oil, and vice versa, natural gas prices are significantly affected by crude oil prices. Natural gas prices also are highly correlated with the prices of several petroleum products, such as diesel fuel and heating oil. Figure 3 illustrates the recent rise in natural gas prices.
VerDate 0ct 09 2002 09:54 Aug 01, 2006 Jkt 028640 PO 00000 Frm 00013 Fmt 6633 Sfmt 6633 C:\DOCS\28640.TXT SAFFAIRS PsN: PAT 2864
0.00
2

10
16 See, e.g., U.S. Department of Energy, Energy Information Administration (EIA), Short-Term Energy Outlook and Summer Fuels Outlook, April 2006 (2006 Summer Fuels Outlook), at pp. 2–3; Jeffrey H. Birnbaum and Steven Mufson, Cost of Gas Puts Pressure on GOP, The Wash-ington Post, April 25, 2006; BBC News, What is driving oil prices so high?, http://news.bbc.co.uk/go/pr/fr/-/1/hi/business/4922172.stm (April 20, 2006); Peg Mackey and Janet McBride, Reuters, Oil’s top brass talk prices at summit, Saturday, April 22, 2006, 9:33 a.m.; Steven Mufson, The Battle Over the Blame for Gas Prices, The Washington Post, Friday, April 21, 2006, at p. A01.
17 See, e.g., Philip K. Verleger, Jr., A Primer on Oil Prices: I, The Petroleum Economics Month-ly, December 2005; International Energy Agency (IEA), Oil Market Report, May 12, 2006, at p. 3.
18 For example, from 2002 through 2005 global demand increased from 77.8 to 83.6 million barrels per day (bpd), while global supply increased from 76.9 to 84 million bpd. This represents an increase in demand of 5.8 million bpd, and an increase in supply of 7.1 million bpd. As a result, OECD inventories grew by 300,000 bpd in 2003 and 200,000 bpd in 2004 and 2005. Id., at p. 43.
Figure 3. Natural gas prices have risen from an average of $2 per million BTU in the late 1990s to a current range of $6–$8 per million BTU in the spring of 2006. At times, price spikes have doubled the price of natural gas. Prices reflect spot month NYMEX futures contract prices. Data source: EIA, NYMEX data.
A number of factors are often cited as contributing to these in-creasing prices.16 Generally, the rising prices are attributed to an increasingly precarious balance between supply and demand. Glob-al demand for oil has been increasing, led by the rapid industrial-ization of China, growth in India, and a continued increase in appe-tite for refined products, particularly gasoline, in the United States.17 Although supplies have been increasing to keep pace with this increased demand, 18 these supplies are perceived to be in-creasingly vulnerable to disruption. Political instability and hos-tility to U.S. interests in the key producer countries of Iran, Iraq,
VerDate 0ct 09 2002 09:54 Aug 01, 2006 Jkt 028640 PO 00000 Frm 00014 Fmt 6633 Sfmt 6633 C:\DOCS\28640.TXT SAFFAIRS PsN: PAT 2864
0.00
3

11
19 Monte Reel, Chavez Stokes Confrontation Over U.S. Role in Venezuela, The Washington Post, July 19, 2005.
20 See, e.g., Matt Piotrowski, Nigerian Shut-Ins Fail to Stimulate Oversupplied US Cash Crude Market, Oil Daily, March 6, 2006. This spring, however, despite several well-publicized disrup-tions to Nigerian supplies, no shortfalls resulted. ‘‘ ‘Physical traders have taken the Nigerian outage totally in stride,’ [one trader] said. ‘Without the Nigerian troubles, there would be even more oversupply.’ ’’ Id.
21 Between August 26, 2005 and April 19, 2006, the cumulative loss of production in the Gulf of Mexico due to Hurricane Katrina was approximately 149 million barrels, or approximately 1 million barrels per day (bpd). U.S. Department of Interior Materials and Management Service (MMS), Hurricane Katrina/Hurricane Rita, Evacuation and Production Shut-in Statistics Report, Wednesday, April 19, 2006, at http://www.mms.gov/ooc/press0419.htm. Nearly 90 percent of total Gulf of Mexico oil production, which normally is about 1.5 million bpd, was shut down in the first few days after landfall on August 29; nearly 56 percent, or about 840,000 bpd, was still shut-in (i.e., unable to be produced) on September 15, 2 weeks after landfall. U.S. Department of Energy, Office of Electricity Delivery and Energy Reliability, Energy Assurance Daily, Sep-tember 15, 2005, at pp. 2–3.
In the 6-month period between September 11, 2004 and February 14, 2005, Hurricane Ivan caused a cumulative loss of nearly 44 million barrels of crude oil production in the Gulf of Mex-ico, which was equivalent to about 7.2 percent of the annual production of oil in the Gulf. MMS, Hurricane Ivan Evacuation and Production Shut-in Statistics as of Monday, February 14, 2005, Final Report, at http://www.mms.gov/ooc/press/2005/press0214.htm.
The International Energy Agency (IEA) states that ‘‘random events,’’ such as accidents, labor unrest, ‘‘guerilla activity,’’ unplanned maintenance, and weather-related events, including hurricanes in North America, ‘‘may cause supply losses of between 300 kb/d [thousand barrels per day] and 400 kb/d for non-OPEC supply each year.’’ IEA, Oil Market Report, May 12, 2006, at p. 14.
22 2006 Summer Fuels Outlook, at p. 3. On the other hand, government-controlled strategic stocks, including the U.S. Strategic Petroleum Reserve, are at historically high levels. 2006 Summer Fuels Outlook, Summer Fuel Charts, at p.3 and at Summer Fuel Charts, p. 9; IEA, Oil Market Report, March 14, 2006, at p. 59. In the event of a disruption in supply, these stra-tegic stocks can be just as effective as using spare production capacity to make up for production shortfalls. For example, in 2005, the United States released 30 million barrels of oil from the U.S. Strategic Petroleum Reserve, and other IEA members released another 30 million barrels to compensate for the loss of production caused by Hurricanes Katrina and Rita. H. Josef Hebert, Nations to Release 60M Barrels of Oil, Gas, Associated Press Financial Wire, September 2, 2005, 10:51 p.m. GMT. In 2003, Saudi Arabia and other OPEC members increased their pro-duction to compensate for the temporary loss of about 1.7 million barrels per day of Iraq oil due to the American invasion. David Ivanovich, OPEC strives to prevent world oil-supply short-age, Houston Chronicle, March 10, 2003; Producers Expect Minimal War Diruption, Oil Daily, March 19, 2003.
23 See, e.g., Daniel Yergin, Testimony Before the U.S. House of Representatives Committee on Energy and Commerce, May 4, 2006, at www.cera.com/news (last visited May 22, 2006).
24 CFTC, The Economic Purpose of Futures Markets, at http://www.cftc.gov/opa/brochures/opaeconpurp. htm.
Venezuela, 19 and Nigeria 20 are among the most frequently cited threats to supplies. Additionally, in each of the past 2 years hurri-canes have disrupted U.S. oil and gas production in the Gulf of Mexico.21 As Saudi Arabia has increased its rate of production to meet increasing demand, its ability to pump additional oil in the event of a shortfall elsewhere has declined, thereby providing less of a cushion in the event of such a supply disruption.22 It is often asserted that these and other fears over the adequacy of supply have built a ‘‘risk premium’’ into crude oil prices.23
These factors, however, do not tell the whole story. Concurrent with the most recent sustained run-up in energy prices, large fi-nancial institutions, hedge funds, pension funds, and other inves-tors have been pouring billions of dollars into the energy commod-ities markets to try to take advantage of price changes or hedge against them. Most of this additional investment has not come from producers or consumers of these commodities, but from specu-lators seeking to take advantage of these price changes. The CFTC defines a speculator as a person who ‘‘does not produce or use the commodity, but risks his or her own capital trading futures in that commodity in hopes of making a profit on price changes.’’ 24 Reports indicate that in the past year a few speculators have made tens
VerDate 0ct 09 2002 09:54 Aug 01, 2006 Jkt 028640 PO 00000 Frm 00015 Fmt 6633 Sfmt 6633 C:\DOCS\28640.TXT SAFFAIRS PsN: PAT

12
25 See Section III.C.3 in this report, below. 26 As explained in two previous reports issued by the Subcommittee staff, U.S. gasoline prices
are also influenced by the overall gasoline supply and demand balance within the U.S. gasoline market, which in turn depends on a variety of other factors, including the profitability of refin-ery operations, domestic refinery capacity and availability, the level of imports, competition within the industry at the national and local level, and fuel specifications resulting from envi-ronmental requirements that affect the fungibility of gasoline supplies. This year, uncertainty within the market regarding whether there would be an adequate supply of gasoline blended with ethanol to replace the supply of gasoline blended with MTBE also contributed to some of the increases in gasoline prices.
27 See, e.g., Falling oil prices would help stem rise in copper prices: trader, Platts Metals Week, May 19, 2006, at http://www.platts.com/Metals/highlights/2006/mp—mw—051906.xml (last vis-ited May 26, 2006).
28 Bhusan Bahree and Ann Davis, Oil Settles Above $70 a Barrel, Despite Inventories at 8-Year High, The Wall Street Journal, April 18, 2006.
and perhaps hundreds of millions of dollars trading in oil and gas.25
The large purchases of crude oil futures contracts by speculators have, in effect, created an additional demand for oil, driving up the price of oil for future delivery in the same manner that additional demand for contracts for the delivery of a physical barrel today drives up the price for oil on the spot market. As far as the market is concerned, the demand for a barrel of oil that results from the purchase of a futures contract by a speculator is just as real as the demand for a barrel that results from the purchase of a futures contract by a refiner or other user of petroleum.
Although it is difficult to quantify the effect of speculation on prices, there is substantial evidence supporting the conclusion that the large amount of speculation in the current market has signifi-cantly increased prices; several analysts have estimated that specu-lative purchases of oil futures have added as much as $20–$25 per barrel to the current price of crude oil. Additionally, by purchasing large numbers of futures contracts, and thereby pushing up futures prices to even higher levels than current prices, speculators have provided a financial incentive for oil companies to buy even more oil and place it in storage. A refiner will purchase extra oil today, even if it costs $70 per barrel, if the futures price is even higher.
As a result, over the past 2 years, crude oil inventories have been steadily growing, resulting in U.S. crude oil inventories that are now higher than at any time in the previous 8 years. The last time crude oil inventories were this high, in May 1998—at about 347 million barrels—the price of crude oil was about $15 per barrel. By contrast, the price of crude oil today is about $70 per barrel. The large influx of speculative investment into oil futures has led to a situation where we have both high supplies of crude oil and high crude oil prices.
High crude oil prices are a major reason for the record or near-record highs of the prices of a variety of petroleum products, in-cluding gasoline, heating oil, diesel fuel, and jet fuel.26 There also is evidence that the skyrocketing prices of metal commodities can partially be attributed to these skyrocketing oil prices.27 B. Increasing Amounts of Crude Oil in Storage
‘‘What’s been happening since 2004 is very high prices without record-low stocks. The relationship between U.S. [oil] inventory lev-els and prices has been shredded, has become irrelevant.’’
—Jan Stuart, Global Oil Economist, UBS Securities 28
VerDate 0ct 09 2002 09:54 Aug 01, 2006 Jkt 028640 PO 00000 Frm 00016 Fmt 6633 Sfmt 6633 C:\DOCS\28640.TXT SAFFAIRS PsN: PAT

13
29 2006 Summer Fuels Outlook, at p. 3.30 IEA, Oil Market Report, March 14, 2006, at p. 3. See also, 2006 Summer Fuels Outlook, at
p. 3. 31 EIA, Energy Assurance Daily, May 4, 2006. The EIA reported the current spare capacity
to be between 1 and 1.5 million barrels per day (bpd). Id. The International Energy Agency re-ports the spare capacity at 1.7 million bpd. IEA, Oil Market Report, May 12, 2006, at p. 14.
Compelling evidence that the oft-cited geopolitical, economic, and natural factors do not fully explain the recent rise in energy prices can be seen in the actual data on crude oil supply and demand. Al-though demand has significantly increased over the past few years, so have supplies. As Figure 4 indicates, over the past couple of years global crude oil production has increased along with the in-creases in demand; in fact, during this period global supplies have exceeded demand.29
Figure 4. In 2004 and 2005 the supply of crude oil exceeded demand. Data source: EIA, International Petroleum Monthly, March 2006.
Projections for the future indicate that, for the near term, supply will continue to keep pace with demand. In its monthly report for March 2006, the International Energy Agency (IEA), stated, ‘‘Addi-tions to OPEC and non-OPEC capacity are forecast to keep global supply trends broadly in line with global demand in 2007 and 2008.’’ 30 The U.S. Department of Energy’s Energy Information Ad-ministration (EIA) recently forecast that in the next few years glob-al surplus production capacity will continue to grow to between 3 and 5 million barrels per day by 2010, thereby ‘‘substantially thick-ening the surplus capacity cushion.’’ 31
Because supplies have been rising along with demand, commer-cial crude oil inventories have been rising as well. As can be seen in Figure 5, the amount of crude oil in U.S. commercial inventories
VerDate 0ct 09 2002 09:54 Aug 01, 2006 Jkt 028640 PO 00000 Frm 00017 Fmt 6633 Sfmt 6633 C:\DOCS\28640.TXT SAFFAIRS PsN: PAT 2864
0.00
4

14
32 2006 Summer Fuels Outlook, at Table 3. In Europe, crude oil in inventories also were higher in 2005 than in either 2003 or 2004. IEA, Oil Market Report, March 14, 2006, at p. 29. Not only are the absolute levels of U.S. and European inventories above average, inventories are also higher when measured by days-of-supply those inventories could provide at current consumption levels. Id. In June, the IEA reported that OECD crude stocks had risen to their highest level in 20 years. IEA, Oil Market Report Highlights, June 13, 2006.
33 EIA, Short-Term Energy Outlook and Summer Fuels Outlook, April 2006, Summer Fuel Charts, at p.11.
34 2006 Summer Fuels Outlook, at Table 3. In mid-May of this year, however, natural gas spot month futures fell below $6 per million BTU.
is higher today than at any other time in the current decade. The EIA forecasts that U.S. inventories will increase again in 2006.32
Figure 5. The amount of crude oil in storage in commercial inventories has risen to higher-than-average levels over the past year. Data source: EIA.
The amount of natural gas in storage also has been increasing over the past couple of years. From mid-2004 to the present, except for the period shortly following the landfall of Hurricane Katrina, the amount of natural gas in storage has exceeded the previous 5-year average.33 Yet during this entire period natural gas prices were higher than the previous 5-year average. These trends are ex-pected to continue. Despite a projected increase in the amount of natural gas available in storage for next winter, the EIA states that ‘‘concerns about potential future supply tightness and con-tinuing pressure from high oil markets are keeping expected spot natural gas prices for the next heating season at high levels.’’ 34
Figure 6 shows the relationship between U.S. crude oil inven-tories and prices over the past 8 years, and how the relationship between physical supply and price has fundamentally changed since 2004. For the period from 1998 through 2003, the chart
VerDate 0ct 09 2002 09:54 Aug 01, 2006 Jkt 028640 PO 00000 Frm 00018 Fmt 6633 Sfmt 6633 C:\DOCS\28640.TXT SAFFAIRS PsN: PAT 2864
0.00
5

15
35 Philip Verleger, Commodity Investors: A Stabilizing Force?, The Petroleum Economics Monthly, March 2006.
shows that the price-inventory relationship generally centered around a line sloping from the middle-left of the chart down to the lower right, meaning that low inventories were accompanied by high prices, and high inventories were accompanied by low prices. For 2004, 2005, and through May 2006, which is the most recently available data, the inventory-price relationships fall nowhere near this downward sloping line; if anything, the points seem to go in the opposite direction, such that higher inventories seem to be cor-related with higher prices. Figure 6 clearly indicates that there has been a fundamental change in the oil industry, such that the pre-vious relationship between price and inventory no longer applies.
Figure 6. Since 2004, crude oil prices have risen as inventories have risen. Data source: EIA.
As will be discussed in the next section, one reason underlying this change is the influx of billions of dollars of speculative invest-ment in the crude oil and natural gas futures markets. As energy prices have not only increased but become more volatile, energy commodities have become an attractive investment for financial in-stitutions, hedge funds, pension funds, commodity pools, and other large investors. One oil economist has calculated that over the past few years more than $60 billion has been spent on oil futures in the NYMEX market alone.35 As explained below, this frenzy of speculative buying has created additional demand for oil futures, thereby pushing up the price of those futures. The increases in the
VerDate 0ct 09 2002 09:54 Aug 01, 2006 Jkt 028640 PO 00000 Frm 00019 Fmt 6633 Sfmt 6633 C:\DOCS\28640.TXT SAFFAIRS PsN: PAT 2864
0.00
6

16
36 Some traders contend that the high inventories have lowered spot prices. ‘‘The physical mar-ket is pretty relaxed,’’ one trader said this spring, as prices rose over $60 per barrel. ‘‘There’s been downward pressure on WTI [West Texas Intermediate] because of inventories.’’ Matt Piotrowski, Nigerian Shut-Ins Fail to Stimulate Oversupplied US Cash Crude Market, Oil Daily, March 6, 2006. ‘‘What the high stock levels are doing, along with unsold spot cargoes and stor-age capacity constraints, is driving down the spot and front month prices relative to the outer months. In effect, a chunk of the fear premium is being taken out of the market.’’ Receding Fear Premium, Petroleum Intelligence Weekly, March 13, 2006.
On the other hand, by creating a financial incentive to purchase oil for storage, the steep rise in futures prices may also have stimulated current demand, thereby pushing up current prices. Although some of this increased demand for oil—for present consumption plus for future con-sumption—has been met by increase in supply, any increase in production necessary to meet this additional demand has come at a time of low excess global excess production capacity. The recent decline in global excess production capacity has been one of the major factors supporting current price levels. See, e.g., Verleger, A Primer on Oil Prices: I, at p. 22. (‘‘This process of in-ventory building [due to speculative purchases of futures contracts] reduces the supply of certain crudes and products available to the current spot market when current supply cannot be in-creased, as has been the case in 2005. This promotion of inventory holding raises current spot prices.’’).
Using the IEA estimate of 1.7 million bpd for OPEC’s surplus production capacity, an amount of oil equivalent to between 10 and 15 percent of OPEC’s surplus capacity has been placed into commercial inventories. It is not apparent why these increases in commercial inventories, to-gether with the high level of strategic reserves in OECD countries, including the U.S. Strategic Petroleum Reserve, have not had a greater effect in alleviating the ‘‘fear premium’’ regarding potential supply disruptions.
37 International Research Center for Energy and Economic Development, 2005.38 Alexei Barrionuevo and Simon Romero, Energy Trading, Without a Certain ‘‘E’’, The New
York Times, January 15, 2006. 39 Michael R. Sesit, Commodities Enter Investment Mainstream, Pension Funds, Universities
Jump Into the Asset Class; High Returns, Low Risk, Wall Street Journal, September 9, 2004; Philip Verleger, Commodity Investors: A Stabilizing Force?, The Petroleum Economics Monthly, March 2006. The most frequently cited research papers are Thomas Schneeweis, Georgi Georgiev, The Benefits of Managed Futures, June 10, 2002; and Gary Gorton and K. Geert Rouwenhorst, Facts and Fantasies about Commodity Futures, Yale International Center for Fi-nance, Working Paper No. 04–20, June 14, 2004.
price of oil futures have provided financial incentives for companies to buy even more oil and put it into storage for future use, result-ing in high prices despite ample inventories.36
C. Increased Speculation in Energy Commodities ‘‘Ironically, hedge funds trading oil are not doing anything very
different than the large investment banks such as Goldman Sachs, Bank of America, or Morgan Stanley already do. The proprietary trading desks of these and other large investment banks are actually ‘‘hedge funds in drag,’’ just as Enron was.’’
—Peter C. Fusaro and Gary M. Vasey, Hedge Funds Change Energy Trading 37
1. Increased Investments in Energy CommoditiesAt the same time energy commodity prices have been increasing,
there has been a large increase in the amount of money expended on energy commodities futures and other derivative instruments. ‘‘Volatile energy markets and record-high commodity prices are prompting renewed interest from investors eager to play in the sec-tor,’’ The New York Times reported earlier this year. ‘‘That has pushed banks and a growing number of hedge funds to hire more energy traders and brainy quantitative minds to back their bets on energy prices.’’ 38 Recent academic research indicating that com-modity futures have performed as well as stocks and better than bonds, with less risk, also has boosted expenditures on energy com-modity futures.39
Because the over-the-counter energy markets are unregulated, there are no precise or reliable figures as to the total dollar value of recent spending on investments in energy commodities, but the
VerDate 0ct 09 2002 09:54 Aug 01, 2006 Jkt 028640 PO 00000 Frm 00020 Fmt 6633 Sfmt 6633 C:\DOCS\28640.TXT SAFFAIRS PsN: PAT

17
40 Pelin Berkma, Sam Ouliaris, and Hossein Samiei, The Structure of the Oil Market and Causes of High Prices, International Monetary Fund, September 21, 2005.
41 Alexei Barrionuevo, Energy Trading, Without a Certain ‘‘E’’, The New York Times, January 15, 2006 (citing Mr. Peter Fusaro of the Energy Hedge Fund Center).
42 Jad Mouawad and Heather Timmons, Trading Frenzy Adding to Rise in Price of Oil, The New York Times, April 29, 2006.
43 Philip Verleger, Commodity Investors: A Stabilizing Force?, The Petroleum Economics Monthly, March 2006.
44 Philip Verleger, A Primer on Oil Prices II: The Role of Inventories, The Petroleum Economics Monthly, February 2006, at p. 20.
45 Verleger, March 2006. 46 See the Appendix to this Report for a more detailed discussion of open interest. 47 See the Appendix to this Report for a more detailed discussion of this CFTC data.48 Behind Runaway Prices: Supply Issues are Real, But Hype Sets Bar, Natural Gas Week,
September 5, 2005.
estimates are consistently in the range of tens of billions of dollars. Last fall, the International Monetary Fund reported, ‘‘Industry es-timates suggest that approximately $100–$120 billion of new in-vestment in the past 3 years has been in active and passive energy investment vehicles.’’ 40 The New York Times cited an estimate that there were ‘‘at least 450 hedge funds with an estimated $60 billion in assets focused on energy and the environment, including 200 de-voted exclusively to various energy strategies.’’ 41
The increased speculative interest in commodities is also seen in the increasing popularity of commodity index funds, which are funds whose price is tied to the price of a basket of various com-modity futures. Goldman Sachs estimates that pension funds and mutual funds have invested a total of approximately $85 billion in commodity index funds, and that investments in its own index, the Goldman Sachs Commodity Index (GSCI), has tripled over the past few years to $55 billion.42 In March of this year, petroleum econo-mist Philip Verleger calculated that the amount of money invested in commodity index funds ‘‘jumped from $15 billion in 2003 to $56 billion in 2004 and on to $80 billion today.’’ 43
With respect to crude oil in particular, Verleger estimates that, during 2005, $25 billion was ‘‘injected’’ into the West Texas Inter-mediate (WTI) crude oil futures contract traded on the NYMEX, mostly coming from pension funds and other managed money. Verleger states ‘‘another $20 billion or so’’ was invested in NYMEX WTI contracts in the first few months of this year.44 Overall, Verleger estimates that between July 2004 and mid-March 2006, a total of approximately $60 billion has been invested in the NYMEX WTI contract.45
The increase in speculative trading is directly observable in the CFTC weekly reports on trading activity in the CFTC-regulated fu-tures markets. Over the past 2 years, the CFTC data shows more than a doubling in the ‘‘open interest’’ in both crude oil and natural gas contracts—essentially the number of outstanding futures con-tracts at the end of a trading day.46 The CFTC data indicates that much of the increase is due to ‘‘non-commercial’’ trading—namely, trading by speculators.47
2. The Effect of Speculation on Prices‘‘There is little doubt that Katrina only exacerbated a troubling
trend in energy prices that already seemed to ignore basic funda-mental drivers to thrive instead on hype.’’
—A futures trader, September 2005.48
VerDate 0ct 09 2002 09:54 Aug 01, 2006 Jkt 028640 PO 00000 Frm 00021 Fmt 6633 Sfmt 6633 C:\DOCS\28640.TXT SAFFAIRS PsN: PAT

18
49 7 U.S.C. § 5(b), 50 7 U.S.C. § 6a(a). 51 Id.52 Id.53 Jad Mouawad and Heather Timmons, Trading Frenzy Adding to Rise in Price of Oil, The
New York Times, April 29, 2006 (quoting Roger Diwan, partner, PFC Energy). 54 Bhusan Bahree and Ann Davis, Oil Settles Above $70 a Barrel, Despite Inventories at 8-Year
High, The Wall Street Journal, April 18, 2006. 55 Behind Runaway Prices: Supply Issues are Real, But Hype Sets Bar, Natural Gas Week,
September 5, 2005. 56 Oil: A Bubble, not a Spike? BusinessWeek online, April 27, 2005.
One of the benefits of speculative trading is that it brings needed liquidity to the futures market so that companies seeking to hedge their exposure to commodity prices can find counterparties willing to take on those price risks. Also, as previously discussed, specula-tion can help finance the build-up of inventories when prices are expected to increase. On the other hand, large speculative buying or selling of futures contracts can distort the price signals influ-encing supply and demand in the physical market or lead to exces-sive price volatility, either of which can cause a cascade of con-sequences detrimental to the supply and price of the commodity and the overall economy.
A key responsibility of the CFTC is to ensure that prices on the futures market reflect the laws of supply and demand rather than manipulative practices 49 or excessive speculation.50 The Com-modity Exchange Act (CEA) states, ‘‘Excessive speculation in any commodity under contracts of sale of such commodity for future de-livery . . . causing sudden or unreasonable fluctuations or unwar-ranted changes in the price of such commodity, is an undue and unnecessary burden on interstate commerce in such commodity.’’ 51 The CEA directs the CFTC to establish such trading limits ‘‘as the Commission finds are necessary to diminish, eliminate, or prevent such burden.’’ 52
A number of energy industry participants and analysts have noted the divergence between the ample supplies of crude oil and natural gas, and record-high prices for those commodities, and have attributed some of this disconnect to the presence of specu-lators in the market. ‘‘Gold prices don’t go up just because jewelers need more gold, they go up because gold is an investment,’’ one consultant said. ‘‘The same has happened to oil.’’ 53
‘‘The answer to the puzzle posed by rising prices and inventories, industry analysts say, lies not only in supply constraints such as the war in Iraq and civil unrest in Nigeria and the broad upswing in demand caused by industrialization of China and India. Increas-ingly, they say, prices also are being guided by a continuing rush of investor funds in commodities investments.’’ 54 Another gas trad-er said: ‘‘It’s all about futures speculators shooting for irrational price objectives, as well as trying to out-think other players—sort of like a twisted game of chess.’’ ‘‘[T]he basic facts are clear,’’ he added, ‘‘this market is purely and simply being controlled by over-speculation.’’ 55 Tim Evans, senior analyst at IFR Energy Services, stated, ‘‘What you have on the financial side is a bunch of money being thrown at the energy futures market. It’s just pulling in more and more cash. That’s the side of the market where we have runaway demand, not on the physical side.’’ 56
VerDate 0ct 09 2002 09:54 Aug 01, 2006 Jkt 028640 PO 00000 Frm 00022 Fmt 6633 Sfmt 6633 C:\DOCS\28640.TXT SAFFAIRS PsN: PAT
19
57 Natural Gas Week, September 5, 2005. 58 See, e.g., Jad Mouawad and Heather Timmons, Trading Frenzy Adding to Rise in Price of
Oil, The New York Times, April 29, 2006 (‘‘by some estimates 10 percent to 20 percent’’ of cur-rent prices); Goldman Sachs, Natural Gas Weekly, December 10, 2004 ($7 per barrel in spring, 2004); John M. Berry, Speculation plays a role in high oil prices, Alexander’s Gas & Oil Connec-tions, August 17, 2005 (‘‘ ‘Current US oil inventory levels suggest WTI crude prices should be around $25 a barrel,’ [oil analyst Mike Rothman of International Strategy and Investment] cal-culated. ‘Given underlying issues and concerns about OPEC capacity and demand growth, we certainly are not prepared to argue that the price spread between the $25 model value and near $60 actual is all speculation, but we do feel that a portion is.’ ’’); Oil Pricing: Don’t Underestimate the Fear Factor, BusinessWeek online, March 13, 2006 (Sarah Emerson, director of petroleum market analysis and research at Energy Security Analysis estimates an additional $15 per bar-rel is due to ‘‘fear;’’ Tim Evans, senior energy analyst for IFR Markets, estimates $25–$30 per barrel.).
59 Bhusan Bahree and Ann Davis, Oil Settles Above $70 a Barrel, Despite Inventories at 8-Year High, The Wall Street Journal, April 18, 2006.
60 Platts, OPEC has no option but to maintain output at current prices: Libya, June 15, 2006. Similarly, Saudi Arabian Oil Minister Ali Naimi has stated, ‘‘World oil supply is currently ex-ceeding demand, and there is no lack of spare capacity.’’ Kate Dourian, Naimi says producers can’t be assured robust demand will continue, Platts Oilgram News, May 16, 2006. U.S. Energy Secretary Samuel Bodman agreed with Minister Naimi’s assessment: ‘‘[Secretary] Bodman, meeting with reporters after a speech at an electricity forum, suggested that there seems to be plenty of oil available.’’ H. Josef Hebert, Energy secretary says U.S. can weather Iranian oil dis-ruption, Associated Press Worldstream, June 6, 2006.
61 Bears Predict Bullish Crude, Gas Bubble to Burst Sooner Than Later, Natural Gas Week, June 27, 2005.
62 See the Appendix for an explanation of these reports.
Some traders charge that certain hedge fund managers have pur-posefully contributed to a misperception that there is a shortage of supply. ‘‘There’s a few hedge fund managers out there who are masters at knowing how to exploit the peak theories [that the world is running out of oil] and hot buttons of supply and demand, (and) by making bold predictions of shocking price advancements to come (they) only add more fuel to the bullish fire in a sort of self-fulfilling prophecy.’’ 57
Several analysts have estimated that the influx of speculative money has tacked on anywhere from about $7 to about $30 per bar-rel to the price of crude oil.58 Even OPEC officials are concerned that a shift in the market from high futures prices relative to cur-rent prices, to lower futures prices relative to current prices (i.e. from contango to backwardation) could precipitate a ‘‘quick drop of $20 a barrel or more.’’ 59 Noting that ‘‘fundamentals are in balance and stock levels are comfortable,’’ the president of the OPEC cartel, Edmund Daukoru, recently attributed the current price levels to ‘‘refinery tightness, geopolitical developments and speculative activ-ity.’’ 60 Other traders have pointed out the possibility of a sharp drop in price. ‘‘At some point, this oversupplied market has to begin to break down this house of cards which is dominated by speculative entities,’’ one futures trader noted, ‘‘and when those en-tities decide to start liquidating their futures positions in crude and gas, look out below.’’ 61
Generally, economists struggle to quantify the effect of specu-lators on market prices. Part of the difficulty is due to the absence of specific data about the strategies of particular traders or classes of traders. The CFTC’s weekly Commitment of Trader Reports are not specific or precise enough to provide the basis for rigorous quantitative analysis, 62 and commodity traders are, as a rule, re-luctant to distribute their data for such purposes. Another dif-ficulty is separating cause from effect: are high prices caused by an increase in speculation, or do more speculators enter the market
VerDate 0ct 09 2002 09:54 Aug 01, 2006 Jkt 028640 PO 00000 Frm 00023 Fmt 6633 Sfmt 6633 C:\DOCS\28640.TXT SAFFAIRS PsN: PAT

20
63 Statement of Alan Greenspan Oil Depends on Economic Risks, Hearing before the Senate Committee on Foreign Relations, June 7, 2006.
64 Id.65 Goldman Sachs, Natural Gas Weekly, December 10, 2004.
when prices become more volatile because that is when the profit opportunities arise?
Several recent analyses have concluded that speculation has sig-nificantly increased energy prices; others have concluded otherwise.
Former Federal Reserve Chairman Alan Greenspan. In tes-timony before the Senate Committee on Foreign Relations, former Chairman Greenspan stated that, in the last couple of years, ‘‘in-creasing numbers of hedge funds and other institutional investors began bidding for oil [and] accumulated it in substantial net long positions in crude oil futures, largely in the over-the-counter mar-ket. These net long futures contracts, in effect, constituted a bet that oil prices would rise.’’ 63 The former Chairman observed that these purchases of oil futures have had a cascade of effects on prices, production, inventories, and consumption:
With the demand from the investment community, oil prices have moved up sooner than they would have other-wise. In addition, there has been a large increase in oil in-ventories. In response to higher prices, producers have in-creased production dramatically and some consumption has been scaled back. Even though crude oil productive ca-pacity is still inadequate, it, too, has risen significantly over the past 2 years in response to price.64
Citgroup. In a May 5, 2006 report on prices of U.S. commod-ities, Citigroup reported that the monthly average value of specula-tive positions held in all U.S. commodity markets rose to over $120 billion, just under the record of $128 billion set the previous Octo-ber. Of the 36 agricultural, energy, and metal commodities ana-lyzed, Citigroup found the largest speculative positions were in nat-ural gas ($30.3 billion) and crude oil ($30.1 billion), followed by gold ($13.3 billion). The report stated, ‘‘We believe the hike in spec-ulative positions has been a key driver for the latest surge in com-modity prices.’’
Goldman Sachs. In a report on the natural gas markets issued in late 2004, Goldman Sachs determined that the rising natural gas prices—which were then near $7 per million BTU—were ‘‘root-ed in tightening fundamentals.’’ 65 Goldman Sachs also stated, ‘‘Our analysis indicates that speculative money does have some impact on natural gas prices and the shape of the forward curve.’’ Gold-man Sachs reported that the net-speculative positions had de-pressed the next-month natural gas futures contract price by $0.28 per million BTU in early December 2004, but the previous spring it had increased the ‘‘prompt’’ NYMEX natural gas futures contract (i.e., the futures contract that is next to expire) by $0.60 per million BTU—an increase of slightly greater than 10 percent.
The Goldman Sachs report also noted that natural gas prices were directly affected by crude oil prices, and ‘‘we believe that spec-ulators also impact the price of crude oil and petroleum products, with the impact of speculators peaking at roughly $7 [per barrel]
VerDate 0ct 09 2002 09:54 Aug 01, 2006 Jkt 028640 PO 00000 Frm 00024 Fmt 6633 Sfmt 6633 C:\DOCS\28640.TXT SAFFAIRS PsN: PAT

21
66 Philip K. Verleger, Jr., The Petroleum Economics Monthly, July 2005, at p. 1. 67 Id., at p. 2. 68 Id., at p. 10. 69 Id., at p. 12. 70 Id., at p. 15.
in the spring of 2004.’’ At that time, crude oil prices ranged from $35–$40 per barrel; hence, according to the Goldman Sachs anal-ysis, speculators at that time were boosting the price of oil by about 20 percent. ‘‘Unlike natural gas,’’ Goldman Sachs wrote, ‘‘we esti-mate that the impact of speculators on oil prices is roughly equiva-lent in magnitude to the impact of shifts in supply and demand fundamentals (as reflected in stocks).’’ In other words, shifts in speculative positions could affect crude oil to the same degree as actual changes in the supply of or demand for crude oil.
Philip Verleger: A New Era for Energy. In a series of anal-yses in his publication, The Petroleum Economics Monthly, Philip Verleger contends that the recent increase in speculative activity has altered the nature of the crude oil markets and boosted futures prices. Verleger believes that the recent infusion of tens of billions of dollars from pension funds, speculators, and other investors into crude oil and natural gas futures markets has ushered in a ‘‘new era’’ for energy producers and refiners. ‘‘The current new era is marked by the entry of long-term investors, who have pushed for-ward crude prices to record levels,’’ Verleger writes. ‘‘Consumers, no doubt, will have another term for it.’’ 66 During this era ‘‘prices will likely be quite high for several years,’’ but ‘‘will be followed by a period of very low prices.’’ 67
A key indicator of this new era, according to Verleger, is the emergence of a ‘‘ ‘disconnect’ between the cash price behavior and the fundamentals, as measured by supply-and-demand balances or stocks.’’ 68 The reason for this divergence, in Verleger’s analysis, is that purchases of long-term crude oil futures contracts have pushed up the longer-term futures prices by so much that it is more profit-able for oil companies to store the oil and then sell it at a later date than sell it today, even at record-high spot prices. Even if oil is at $70 per barrel today, suppliers will hold their inventories if they can sell it for $75 for delivery a year from now.
Since 2001 there has been a dramatic growth in the open interest in very long-term futures contracts (30 months or longer). At the end of July 2001, there was an open interest of 19,624 in very long-term contracts, representing about 4.5 percent of all open interest; at the end of July 2005, there was an open interest of 125,546 in very long-term contracts, representing about 15 percent of all open interest. According to Verleger, nearly all of the buying of these very long-term crude oil futures contracts reflects speculative buy-ing, since commercial firms typically don’t enter into contracts for delivery so far into the future, and therefore have no need to use such long-term futures contracts for hedging purposes.69
‘‘In summary,’’ Verleger writes, ‘‘increased purchases of long-dated crude lift the forward price curve. The rise in prices is re-flected back to contracts maturing in a few months.’’ 70 Quan-titatively, ‘‘the impact of increasing stocks has been overwhelmed
VerDate 0ct 09 2002 09:54 Aug 01, 2006 Jkt 028640 PO 00000 Frm 00025 Fmt 6633 Sfmt 6633 C:\DOCS\28640.TXT SAFFAIRS PsN: PAT

22
71 Id., at p. 19. 72 Michael S. Haigh, Jana Hranaiova and James A. Overdahl, Office of the Chief Economist,
U.S. Commodity Futures Trading Commission, Price Dynamics, Price Discovery and Large Fu-tures Trader Interactions in the Energy Complex, Working Paper, First Draft: April 28, 2005.
73 New York Mercantile Exchange, A Review of Recent Hedge Fund Participation in NYMEX Natural Gas and Crude Oil Futures Markets, March 1, 2005.
74 Bears Predict Bullish Crude, Gas Bubble to Burst Sooner Than Later, Natural Gas Week, June 27, 2005. See, e.g., Oil Market Control Passes From OPEC to Speculators, Jet Fuel Intel-ligence, August 29, 2005 (‘‘ ‘The amount of paper barrels being traded is extraordinary and this has had an extraordinary effect on prices,’ said one industry veteran.’’); Commodity Strategists: Oil to Fall, Toronto Bank Says, Bloomberg.com, April 25, 2005 (the speculative rally has ‘‘ ‘decou-pled’’ prices from the reality of supply and demand.’’) .
75 Alexei Barrionuevo, Energy Trading, Without a Certain ‘‘E’’, The New York Times, January 15, 2006.
by the strong demand for forward crude, which has added as much as $24 per barrel to prices.’’ 71
CFTC staff study. In contrast to the studies that have found a relationship between speculative activity and price, a CFTC staff study released in April 2005 found, in general, ‘‘no evidence of a link between price changes and MMT [managed money trader] po-sitions’’ in the natural gas markets and ‘‘a significantly negative re-lationship between MMT positions and price changes (conditional on other participants trading) in the crude oil market.’’ 72 The CFTC staff found, generally, that these managed money funds tended to follow what the commercial participants in the market were doing, and tended to trade less frequently than commercial traders.
NYMEX study. A second study that found no relationship be-tween hedge fund activity and volatility was conducted by the NYMEX. Overall, the NYMEX found that during 2004, ‘‘hedge fund trading activity comprised a modest share of trading volume in both crude oil and natural gas futures markets,’’ and comprised ‘‘a relatively modest share of open interest.’’ It also found that hedge fund participation during this period tended to decrease volatility. ‘‘In short,’’ the NYMEX stated, ‘‘it appears that Hedge Funds have been unfairly maligned by certain quarters who are seeking simple answers to the problem of substantial price volatility in energy markets, simple answers that are not supported by the available evidence.’’ 73
A number of industry participants have expressed skepticism about the accuracy of the NYMEX and CFTC analyses. Neither the NYMEX study nor the CFTC study addressed the effects of hedge fund and other speculative investments on the price of longer-term futures contracts. Rather, both the CFTC study and the NYMEX focused on the near-term effects of trading by hedge funds, particu-larly with respect to volatility. ‘‘[D]espite those [NYMEX and CFTC] reports,’’ one trade publication reported, ‘‘a majority of in-dustry professionals still contend that there are too many large speculative entities actively engaged in the market—with fund ac-counts taking on massive equity positions in the commodities.’’ 74 Another article reported that many traders have ‘‘scoffed’’ at these two studies, ‘‘saying that they focused only on certain months, missing price run-ups.’’ 75
In sum, while industry and regulatory economists and analysts do not agree on the extent to which market speculation has af-fected energy prices, it is beyond dispute that speculation has in-creased. CFTC data as well as numerous industry reports indicate
VerDate 0ct 09 2002 09:54 Aug 01, 2006 Jkt 028640 PO 00000 Frm 00026 Fmt 6633 Sfmt 6633 C:\DOCS\28640.TXT SAFFAIRS PsN: PAT

23
76 Robert J. Shiller, Irrational Exuberance (Princeton University Press, 2000), at p. 5.
that speculators have injected tens of billions of dollars into the en-ergy commodities markets. Although the absence of data makes it impossible to precisely quantify the effect of these speculative in-vestments on prices, it appears from the CFTC data, market data, and the comments of a number of well-respected analysts that this increased speculation has fundamentally altered the relationship between crude oil inventories and prices. The purchase of long-term futures by speculators has provided a financial incentive for oil purchasers to build inventories and store oil for future use; this has resulted in a market characterized both by large amounts of oil in inventory and high prices.
Whether the current level of speculation has provided needed li-quidity, encouraged the building of inventories, or created a specu-lative bubble in energy prices is impossible to determine without additional data. It is clear that better tools are needed to under-stand how much is being spent, by whom, in which markets and instruments, and the effect of increasing speculation on the price and affordability of energy in the United States.
The importance of understanding the effect of speculation on market prices cannot be understated. Professor Robert Shiller, in his prescient book Irrational Exuberance, which warned that the U.S. stock market was in the midst of a speculative bubble just prior to the price collapse of 2000–2001, wrote as follows:
The extraordinary recent levels of U.S. stock prices, and associated expectations that these levels will be sustained or surpassed in the near future, present some important questions. We need to know whether the current period of high stock market pricing is like the other historical peri-ods of high pricing, that is, whether it will be followed by poor or negative performance in coming years. We need to know confidently whether the increase that brought us here is indeed a speculative bubble—an unsustainable in-crease in prices brought on by investors’ buying behavior rather than by genuine, fundamental information about value. In short, we need to know if the value investors have imputed to the market is not really there, so that we can readjust our planning and thinking.76
In light of the vital importance of energy to our national economy and security, the need to better understand the role of speculation in price formation is just as important for the energy market as for the stock market.
3. Large Profits from Speculation in Energy Commodities Accurate information about the profits and losses of market par-
ticipants is difficult to obtain. Nonetheless, reports indicate that a number of firms, funds, and traders have reaped enormous profits from the recent increases in energy prices, energy price volatility, and trading volume. These large profits provide an indication of one of the incentives for speculation in today’s energy commodity markets.
VerDate 0ct 09 2002 09:54 Aug 01, 2006 Jkt 028640 PO 00000 Frm 00027 Fmt 6633 Sfmt 6633 C:\DOCS\28640.TXT SAFFAIRS PsN: PAT

24
77 Alexei Barrionuevo, Energy Trading, Without a Certain ‘‘E’’, The New York Times, January 15, 2006.
78 Wall Street firms reshape power trading, add liquidity in physical and paper markets, Platts Power Markets Week, January 16, 2006; See also, Ann Davis, Morgan Stanley trades energy in barrels, Pittsburgh post-gazette.com, March 3, 2005.
79 Rich Blake and Andrew Barber with Robert LaFranco, The Trader Monthly 100; Earn, Baby, Earn, Trader Monthly, April/May 2006 (hereinafter cited as ‘‘The Trader Monthly 100’’), at p. 69.
80 The Subcommittee staff has not verified the information contained in the Trader Monthly article.
81 The Trader Monthly 100,, at p. 71. 82 Stephen Taub, Really Big Bucks, Alpha, May 2006, at p. 19. Mr. Pickens ranked second on
the Alpha list. Mr. James Simons, who Trader Monthly ranked third with an estimated $900 million–$1 billion in earnings, was ranked first by Alpha, with an estimated $1.5 billion in earn-ings. The two rankings identify many of the same individuals as the top hedge fund traders, although the estimates of earnings vary by significant amounts—hundreds of millions of dollars in some instances. The Alpha rankings only list the top 25 traders; with the exception of Mr. Pickens, the energy traders identified in the Trader Monthly rankings did not earn enough to qualify for this list. See also Alistair Barr, Hedge-fund giants Simon, Pickens made more than $1 bln in 2005, MarketWatch, May 26, 2006, at http://www.marketwatch.com (last visited May 26, 2006).
83 Brad Foss, AP Interview; Riding high on oil prices, Boone Pickens sees prices going even higher, Associated Press, June 22, 2005.
For example, it has been reported that in 2004, Goldman Sachs and Morgan Stanley, the two leading energy trading firms in the United States, earned a total of about $2.6 billion in net revenues from commodities trading, mostly from energy commodities.77 For 2005, Goldman Sachs and Morgan Stanley each reportedly earned about $1.5 billion in net revenue from energy transactions.78
A recent article in Trader Monthly magazine included short pro-files of the ‘‘100 Highest Earning Traders’’ for 2005, as ranked by the magazine. Overall, Trader Monthly reported, ‘‘On Wall Street, some of the scores were gargantuan, as bulge-bracket banks en-joyed one of the most profitable years in the history of the markets, from asset-backed to credit and crude to crack spreads.’’ 79 Although the rankings are based on estimates and anecdotal information, and the article does not explain how the profiled traders generated their income, it nonetheless provides some information regarding the magnitude of some of the earnings of leading energy commodity traders in 2005.80 The Trader Monthly rankings group these trad-ers into several categories: hedge fund managers, Wall Street Trad-ers, and ‘‘the rest,’’ which includes traders working for brokerage firms that own seats on the NYMEX.
At the top of the Trader Monthly list, T. Boone Pickens was re-ported to have earned between $1 and $1.5 billion in energy trad-ing in 2005. The magazine reports that Mr. Pickens’ main commod-ities fund earned a return of approximately 700 percent in 2005, which it ‘‘believes is the largest one-year sum ever earned.’’ 81 An-other hedge fund magazine, Alpha, estimated that Mr. Pickens’ trading strategies earned $1.4 billion in 2005, largely due to his bets on crude oil.82
Following an interview with Mr. Pickens, the Associated Press re-ported, ‘‘Oil tycoon Boone Pickens’ bet that energy prices would rise made him more money in the past 5 years than he earned in the preceding half century hunting for riches in petroleum deposits and companies.’’ 83 During this interview, which occurred in mid-2005, when the price of oil was approaching a then-record $60 per barrel, Mr. Pickens stated, ‘‘I can’t tell for sure where [prices are] going,
VerDate 0ct 09 2002 09:54 Aug 01, 2006 Jkt 028640 PO 00000 Frm 00028 Fmt 6633 Sfmt 6633 C:\DOCS\28640.TXT SAFFAIRS PsN: PAT

25
84 Id. It was long before this 2005 interview, however, that Mr. Pickens began betting that the price of oil would rise, based on a belief that the rapid increase in demand had used up all of the global spare production capacity. In May 2004, for example, when oil was trading at about $40 per barrel, and most analysts were predicting prices would fall, Mr. Pickens publicly predicted prices would keep increasing: ‘‘I think you’ll see $50 before you see $30 again.’’ Darrell Preston, Bloomberg News, T. Boone is Back; The Corporate Raider Who Brought Down Gulf Oil is Cashing in on Oil Price Spike, Pittsburgh Post-Gazette, October 10, 2004. Opinions vary as to the reason Mr. Pickens has been so successful recently. ‘‘He understands the industry and business like no one else,’’ commented billionaire Harold Simmons, one of the original investors in Mr. Pickens’ hedge funds. Id. On the other hand, Peter Fusaro, chairman of Global Change Associates, a consulting firm, commented, ‘‘He just got lucky.’’ Id.
85 Behind Runaway Prices: Supply Issues are Real, But Hype Sets Bar, Natural Gas Week, September 5, 2005.
86 See Barrionuevo, Energy Trading, Without a Certain ‘‘E’’, The New York Times, January 15 2006.
87 Id.; See also, Peter Elkind, Bethany McLean, The Luckiest People in Houston, Fortune, April 17, 2006. Among those now working for Mr. Arnold is Greg Whalley, who, as head of wholesale trading at Enron, once was Mr. Arnold’s boss. In August 2001, following the resignation of Jef-frey Skilling, Mr. Whalley was appointed Enron’s president. Id.
88 Two former Enron trading experts share dais and ideas on energy market evolution, Platts Power Markets Week, February 13, 2006.
89 Id.90 Id.
other than up.’’ 84 Mr. Pickens’ success in predicting price increases may have even created its own momentum for further price in-creases—according to Natural Gas Week, ‘‘[Mr. Pickens] regularly talks up crude oil and natural gas prices on financial market cable TV. Traders and futures brokers report that each time this hap-pens, more speculative interest is drawn to energy futures mar-kets.’’ 85
Also at the top of the list of energy traders is John Arnold, a former Enron trader who left Enron in 2002 to start his own hedge fund, Centaurus Energy, with three employees and $8 million of his own money.86 As of January of this year, Centaurus employed 36 people and had about $1.5 billion in assets.87 At a recent energy conference, Mr. Arnold said he ‘‘looks to place bets on a market that he determines is ‘biased,’ ’’ meaning that the market is not re-flecting the fair value for a product.88 ‘‘We ask ourselves can we identify what is forcing a market to price a product at an unfair value, and then, what will push it back to fair value.’’ 89 Mr. Arnold also stated how a significant amount of speculative trading was taking place on the unregulated over-the-counter Intercontinental Exchange (ICE). ‘‘ ‘Trading never went away,’ Arnold said, ‘What has changed is the non-commercial type of interest.’ Interconti-nental Exchange, he said, has provided huge new opportunities, as has NYMEX’s Clearport trading. ‘Because of this, there has never been as much investor interest . . . as there is today.’ ’’ 90
Table 1 lists the traders who Trader Monthly reported to have obtained a significant portion of their profits from trading energy commodities. Inclusion on this list is not meant to imply that any of the traders derived their profits from any improper trading ac-tivity.
VerDate 0ct 09 2002 09:54 Aug 01, 2006 Jkt 028640 PO 00000 Frm 00029 Fmt 6633 Sfmt 6633 C:\DOCS\28640.TXT SAFFAIRS PsN: PAT

26
Table 1Selected Top Energy Traders in 2005
Trader Firm Type of Trader 2005 Estimated Earnings Trader Monthly Comments
T. Boone Pickens BP Capital (hedge fund)
$1.5 billion + ‘‘ ‘Long Crude’ doesn’t even begin to describe T. Boone Pickens’ position. With $5 billion and growing in assets under management, his fund company, BP Capital, is throwing off a small national economy via an unshakable bet that the world’s oil supply can’t keep up with demand. . . . Returns on Pickens’ main com-modities pool were over 700 percent in 2005. . . . [This] translates into what Trader Monthly believes is the largest one-year sum ever earned. . . .’’
Brian Hunter Amaranth Advisors (hedge fund)
$75–$100 million ‘‘In 2005, Hunter was certainly among the top natural gas traders in the world. . . . Rumor is that Hunter made Amaranth an estimated $800 million off his book, mainly [natural] gas derivatives positions but also some other en-ergy dabblings.’’
John Arnold Centaurus Energy (hedge fund)
$75–$100 million ‘‘Starting 4 years ago with $8 million of his own dough, John D. Arnold, former star Enron en-ergy trader, has since amassed more than $1 billion in assets. Most of the 16 other traders at his Centaurus Energy fund operation came from Enron.’’
Jim Pulaski Tudor Investment (hedge fund)
$50–$75 million ‘‘[T]his Tudor energy trader is commander in chief when it comes to natural gas.’’
Steven Berkson Trader (NYMEX)
$25–$30 million ‘‘Readers of Trader Monthly will remember the legend of natural-gas-futures stalwart Steve Berkson and Hurricane Katrina. One of the tallest versions of the tale has Berkson mak-ing $40 million off the opening bell the day Katrina made landfall (we heard he ended up tallying around $20 million for the week). Lesser known is how much of that score Berky ultimately slid to relief efforts (reportedly a sizable portion).’’
Mark Fisher MBF Clearing oper-ator (NYMEX)
$25–$30 million ‘‘Few people have more at stake in the future of the NYMEX than Fisher, who runs MBF Clear-ing, the primary market-making operation for the exchange’s top-grossing crude-oil futures contract.’’
Simon Greenshields Morgan Stanley $20–$25 million ‘‘Morgan Stanley’s head of gas and power, Greenshields is part of the bank’s elite energy crew. His specialties are natural gas and elec-tricity. . . .’’
Olav Refvik Morgan Stanley $20–$25 million ‘‘Refvik is a key part of one of the most profit-able energy-trading operations in the world. He has helped the bank dominate the heating oil market by locking up New Jersey storage-tank farms adjacent to New York Harbor. . . .’’
VerDate 0ct 09 2002 09:54 Aug 01, 2006 Jkt 028640 PO 00000 Frm 00030 Fmt 6633 Sfmt 6621 C:\DOCS\28640.TXT SAFFAIRS PsN: PAT

27
Table 1—ContinuedSelected Top Energy Traders in 2005
Trader Firm Type of Trader 2005 Estimated Earnings Trader Monthly Comments
John Shapiro Morgan Stanley $20–$25 million ‘‘Shapiro has been a vital part of Morgan’s en-ergy effort, working [to help] oversee the 200-plus-person profit center.’’
John Bertuzzi Goldman Sachs $15–$20 million ‘‘A star trader on one of the most powerful en-ergy desks on earth. . . .’’
George ‘‘Beau’’ Taylor J.P. Morgan $15–$20 million ‘‘[Taylor] . . . switched over to J.P. Morgan, where he now helps oversee the firm’s 80-per-son energy-trading unit.’’
Jeffrey Wolfson Trader (NYMEX) $15–$20 million ‘‘Crude oil traders don’t come much bigger than the man whose badge reads GEOF. A one-man volume-generation machine. . . .’’
Vincent Kaminski Citigroup $10–$15 million ‘‘Kaminski is a revered energy trader considered among the foremost authorities on measuring and analyzing market risk. . . .’’
Todd Applebaum Trader (NYMEX) $10–$15 million ‘‘Applebaum is another natural gas guy who lit it up in 2005. ‘Great trader, huge volume,’ says one NYMEX insider.’’
Eric Bolling Trader (NYMEX) $10–$15 million ‘‘Among the most famous natural gas traders on the floor today . . . [Bolling] is said to ac-count for as much as 5 percent of total vol-ume in [natural gas]. . . .’’
Sandy Goldfarb Trader (NYMEX) $10–$15 million ‘‘. . . [Goldfarb] knocked his [natural gas] book out of the ozone layer last year amid one hur-ricane after another and some of the most treacherous volatility ever recorded in the dec-ade and a half since natural gas futures were created. . . .’’
Robert Halper Trader (NYMEX) $10–$15 million ‘‘When it comes to [arbitraging] crude oil against gasoline, Bob Halper wrote the book. According to some, he will go down as one of the big-gest crack-spread traders the NYMEX has ever seen.’’
Daniel Lirtzman Trader (NYMEX) $10–$15 million ‘‘A natural gas ‘natural.’. . .’’
Kevin McDonnell Trader (NYMEX) $10–$15 million ‘‘Chalk up yet another blowout year. . . .’’
Simon Posen Trader (NYMEX) $10–$15 million ‘‘Last year’s natural gas swings produced a sig-nificant surge in Posen’s trading profits.’’
Mitchell Stern Trader (NYMEX) $10–$15 million ‘‘Stern had a huge year, sources say.’’
Table 1. Large trader profits are an indicator of increased speculation in energy commodity markets. Data source: Trader Monthly, April/May 2006.
Not only are the top traders for investment banks and funds earning record incomes, but in-house corporate traders are earning record amounts as well. According to a recent article in Bloomberg news, at Sempra Energy, the owner of the biggest U.S. natural gas utility, ‘‘as many as 30 commodity traders [make] more than the $2 million earned last year by Chief Executive Officer Don Felsinger. ‘That’s what it costs to be in this business,’ Felsinger
VerDate 0ct 09 2002 09:54 Aug 01, 2006 Jkt 028640 PO 00000 Frm 00031 Fmt 6633 Sfmt 6601 C:\DOCS\28640.TXT SAFFAIRS PsN: PAT

28
91 What’s a Top Commodity Trader Worth? Quintuple 2000 Salaries, Bloomberg.com, June 1, 2006.
92 Id.93 7 U.S.C. § 5. 94 The provisions of the CFMA that provide exclusions and exemptions for energy and metal
commodities were included in the version of the legislation that passed the House on October 19, 2000 (H.R. 4541, 106th Cong., 2nd Sess.), but were omitted from the version placed on the Senate calendar after passage by the Senate Committee on Agriculture in late August (S. Rept. 106–390). Following negotiations between members of the House and Senate Agriculture com-mittees, the legislation that became the Commodity Futures Modernization Act—with the exclu-sions for energy and metal commodities—was introduced in the House on December 14 and in the Senate on December 15, 2000. The CFMA was passed by both the House and Senate on December 15, the last day of the 106th Congress, as part of an omnibus legislative package in-volving 13 appropriations bills and several authorization bills. There was no opportunity for de-bate on any of the specific provisions in the CFMA; the Senate passed this entire omnibus pack-age by unanimous consent. A history of the regulation of the trading of energy commodities is presented in Appendix 2 of the Report prepared by the Minority Staff of the Permanent Sub-committee on Investigations, U.S. Strategic Petroleum Reserve: Recent Policy Has Increased Costs to Consumers But Not Overall U.S. Energy Security, S. Prt. 108–18, 108th Cong., 1st Sess. (March 5, 2003).
95 7 U.S.C. § 2(h)(3).
[said] in a May 17 interview.’’ 91 Bloomberg also reported that divi-sion managers for commodities trading were also the most highly paid employees at Constellation Energy, earning approximately $5 million in bonuses, compared to a total compensation package of about $4 million for the chief executive officer.92
IV. NO COP ON THE BEAT FOR OVER-THE-COUNTER ENERGY MARKETS
Until recently, the trading of U.S. energy futures was conducted exclusively on regulated exchanges within the United States, like the NYMEX, and subject to extensive oversight by the CFTC and the exchanges themselves in order to detect and prevent price ma-nipulation. Under the Commodity Exchange Act, the purpose of CFTC regulation is to deter and prevent price manipulation, en-sure the ‘‘financial integrity’’ of transactions, maintain market in-tegrity, prevent fraud, and promote fair competition.93 This regula-tion and the resulting transparency has bolstered investor con-fidence in the integrity of the regulated U.S. commodity markets and helped propel U.S. exchanges into the leading marketplace for many commodities.
Pursuant to its statutory mandate to detect and prevent price manipulation, the CFTC has imposed a variety of reporting re-quirements and regulations on the trading of commodity futures and options. NYMEX traders, for example, are required to keep records of all trades and report large trades to the CFTC. The CFTC uses these Large Trader Reports, together with daily trading data providing price and volume information, to monitor exchange activity and detect unusual price movements or trading.
None of this oversight to prevent price manipulation, however, applies to any of the energy trading conducted on OTC electronic exchanges. As a result of a provision inserted by House and Senate negotiators during the waning hours of the 106th Congress into legislation that became the Commodity Futures Modernization Act of 2000 (CFMA), 94 the Commodity Exchange Act exempts from CFTC oversight all trading of energy commodities by large firms on OTC electronic exchanges.95
In recent years, there has been a tremendous growth in the trad-ing of energy commodity contracts that are virtually identical to fu-
VerDate 0ct 09 2002 09:54 Aug 01, 2006 Jkt 028640 PO 00000 Frm 00032 Fmt 6633 Sfmt 6601 C:\DOCS\28640.TXT SAFFAIRS PsN: PAT

29
96 Gerelyn Terzo, A Battle Royal; A sleek upstart and an entrenched giant are waging all-out war for the soul of the energy trading market, Investment Dealers Digest, May 1, 2006.
97 Initially, the most prominent of these electronic exchanges was operated by Enron. On Enron’s electronic trading platform, called ‘‘Enron OnLine,’’ Enron became the counterparty to all of the trades. Enron’s position as a party to all trades provided Enron with superior market information and created a non-level playing field. Following Enron’s collapse and the subsequent revelations of how Enron abused its superior knowledge and market position, see, e.g., note 117, the Enron ‘‘one to many’’ trading model was discredited. Today, all of the electronic exchanges are ‘‘many to many’’ exchanges, meaning that the parties trade with each other rather than the operator of the exchange.
tures contracts, but which are traded on OTC electronic exchanges rather than the regulated futures exchanges. These contracts are so similar to futures contracts that they are often called ‘‘futures look-alike contracts.’’ Although the trading of futures contracts on futures markets is subject to extensive oversight, as a result of the CFMA exemptions the trading of futures look-alikes on an OTC electronic exchange is not subject to any CFTC oversight. The growth of these OTC electronic markets, therefore, has been cre-ating an increasing ‘‘blind spot’’ in the CFTC’s oversight of the trading of energy commodity futures. This increasing blind spot significantly impairs the CFTC’s ability to carry out its statutory mandate to detect and prevent price manipulation.
A. Development of OTC Electronic Markets ‘‘Enron did two things for us. It validated our model, and in
2000, 13 big market makers agreed to support the ICE’s efforts.’’ —Jeffrey Sprecher, Chairman and CEO, Intercontinental Exchange 96
Initially, the OTC market was not an actual place or facility where trading occurred, but rather a general term that referred to instances in which two parties would come together to reach agree-ment on a contract between them to protect against or assume price risks that could not be adequately addressed by the trading of standardized futures contracts on the regulated futures ex-changes. Until the advent of electronic trading in the late 1990s, the terms of most OTC contracts were customized through negotia-tions between the two parties, either face-to-face or through bro-kers over the telephone. Because the terms of these customized, bi-lateral deals were unique, and the contracts generally could not be traded or assigned to third parties, these OTC contracts were con-sidered simply as bilateral contracts, outside the CFTC’s jurisdic-tion.
In the 1990s, as energy deregulation gained momentum, and en-ergy was increasingly being considered as another commodity priced on an open market, energy producers and suppliers desired additional protections against market price risks. OTC contracts became more popular, and the increasing number of energy pro-viders, merchants and traders holding these contracts desired to trade these OTC instruments to third parties to help reduce, diver-sify or spread the risks they had assumed. In response, the OTC market began to develop standardized OTC contracts that could be traded to multiple parties. Following rapid developments in com-puter and internet technology in the 1990s, a number of companies and groups developed electronic exchanges to facilitate these OTC trades.97
VerDate 0ct 09 2002 09:54 Aug 01, 2006 Jkt 028640 PO 00000 Frm 00033 Fmt 6633 Sfmt 6601 C:\DOCS\28640.TXT SAFFAIRS PsN: PAT

30
98 The founding partners of ICE are BP Amoco, Deutsche Bank AG, Goldman Sachs, Dean Witter, Royal Dutch/Shell Group, SG Investment Bank, and Totalfina Elf Group. In November 2005, ICE became a publicly traded corporation. Many of these original founders are major shareholders: Morgan Stanley owns nearly 15 percent of ICE shares, Goldman Sachs owns about 14 percent, Total owns about 9.5 percent, and BP owns about 9 percent. Market Forces: Big Oil increases market reach, Energy Compass, March 24, 2006.
99 Participation is restricted to parties that quality as an ‘‘eligible commercial entity’’ under Section 1a(11) of the CEA. Generally, these entities are large financial institutions, insurance companies, investment companies, corporations and individuals with significant assets, em-ployee benefit plans, government agencies, and registered securities brokers and futures com-mission merchants.
100 Intercontinental Exchange Inc, Form 10–K, filed March 10, 2006 (‘‘ICE 10–K’’), at p. 14. There does not appear to be any mechanism to ensure that only eligible commercial entities ac-tually trade on ICE. The CFTC does not monitor or oversee participation; ICE declined to an-swer the Subcommittee staff’s questions as to whether or how it monitors trader qualifications.
101 ICE 10–K, at p. 14. 102 ICE 10–K, at p. 6. As explained in Section V, in 2001, ICE purchased the International
Petroleum Exchange, a London-based futures exchange that traded North Sea Brent crude oil and natural gas delivered in Europe. In 2005, ICE renamed the London exchange as ‘‘ICE Fu-tures’’ and converted its open-outcry pit trading system into an all-electronic exchange. Hence, ICE now operates two major electronic markets: ICE Futures and ICE OTC. ICE Futures is a futures market in London, regulated by the U.K. Financial Services Authority, and ICE OTC operates as an ‘‘exempt commercial market’’ under Section 2(h)(3) of the U.S. Commodity Ex-change Act. Both markets operate outside of the CFTC’s oversight.
103 In contrast, on NYMEX and other regulated futures exchanges, the exchange clearinghouse acts as the buyer for all sellers and the seller for all buyers. Persons that are not members of the exchange must trade through a clearing member. Clearing members accept all financial re-sponsibility for the trades they conduct on behalf of the customer initiating the trade.
In 2000, a half dozen investment banks and oil companies formed the Intercontinental Exchange (ICE) for OTC electronic trading in energy and metals commodities.98 The Atlanta-based ICE is an electronic exchange open only to large commercial traders that meet the definition of an ‘‘eligible commercial entity’’ under the Commodity Exchange Act.99 According to ICE, its market partici-pants ‘‘must satisfy certain asset-holding and other criteria and include[] entities that, in connection with their business, incur risks relating to a particular commodity or have a demonstrable ability to make or take delivery of that commodity, as well as fi-nancial institutions that provide risk-management or hedging serv-ices to those entities.’’ 100
Today, ICE operates the leading OTC electronic exchange for en-ergy commodities. ICE describes its participants as ‘‘some of the world’s largest energy companies, financial institutions and other active contributors to trading volume in global commodity markets. They include oil and gas producers and refiners, power stations and utilities, chemical companies, transportation companies, banks, hedge funds and other energy industry participants.’’ 101 According to ICE, its electronic markets now constitute ‘‘a significant global presence with over 9,300 active screens at over 1,000 OTC partici-pant firms and over 440 futures participant firms as of December 31, 2005.’’ 102
Unlike NYMEX, ICE does not require its participants to become formal members of its exchange or to join a clearinghouse.103 Any large commercial company qualifying as an eligible commercial en-tity can trade through ICE’s OTC electronic exchange without hav-ing to employ a broker or pay a fee to a member of the Exchange.
Although ICE’s OTC exchange does not operate its own clearing-house, ICE has contracted with a third party, the LCH.Clearnet, to offer clearing services for traders who desire to trade only with other cleared traders. By trading only with other cleared traders, a party trading on ICE can eliminate the risk of default by the
VerDate 0ct 09 2002 09:54 Aug 01, 2006 Jkt 028640 PO 00000 Frm 00034 Fmt 6633 Sfmt 6601 C:\DOCS\28640.TXT SAFFAIRS PsN: PAT

31
104 NYMEX also offers an electronic trading platform for the trading of standardized OTC in-struments, and provides clearinghouse services, called ‘‘NYMEX ClearPort,’’ for traders using the NYMEX OTC electronic trading platform. NYMEX states that its OTC clearing service ‘‘lets market participants take advantage of the financial depth and security of the Exchange clear-inghouse along with round-the-clock access to more than 60 energy futures contracts including natural gas location differentials; electricity, crude oil spreads and outright transactions; refined product crack and location spreads and outright transactions; and coal.’’ NYMEX, NYMEX ClearPort Services, on NYMEX website, at http://www.nymex.com/cp—overview.aspx (last vis-ited May 19, 2006).
105 Intercontinental Exchange Inc., Form 10–Q, filed May 2, 2006 (‘‘ICE 10–Q’’), at p. 16. In 2005, ICE also contracted with North American Energy Credit and Clearing, LLC, to provide clearing for trades in physically-settled OTC natural gas and power contracts. Id.
106 ICE 10–Q, at p. 17. 107 ICE 10–K, at p. 5. 108 ICE 10–K, at p. 5. ICE states, ‘‘both physically-delivered and cash-settled gas products can
be traded at a fixed price or differential to recognized published indices.’’ ICE website, at https://www.theice.com/naturalgas.jhtml. See also, e.g., ICE, OTC Natural Gas Clearing and Credit, Product Specifications, March 24, 2006; ICE, OTC Natural Gas and Financial Power Clearing and Credit, Product Specifications for products to be launched on April 7, 2006. ICE further am-plifies: ‘‘A substantial portion of the trading volume in our OTC markets relates to approxi-mately 15-20 highly liquid contracts in natural gas, power, and oil. For these contracts, the highest degree of market liquidity resides in the prompt, or front month, whereas that liquidity is reduced for contracts with settlement dates further out, or in the back months.’’ ICE 10–K, at p. 9.
other party just as if he or she were trading on a futures exchange, thereby avoiding one of the traditional disadvantages of OTC trad-ing.104 ICE describes the advantages of OTC trading through a clearinghouse:
The use of OTC clearing serves to reduce the credit risk associated with bilateral OTC trading by interposing an independent clearinghouse as a counterparty to trades in these contracts. The use of a central clearinghouse rather than the reliance on bilateral trading agreements [has] re-sulted in more participants becoming active in the OTC markets. In addition, clearing through a central clearing-house typically offers market participants the ability to re-duce the amount of capital required to trade as well as the ability to cross-margin positions in various commodities.105
ICE claims that its OTC markets ‘‘offer trading in hundreds of natural gas, power and refined oil products on a bilateral basis. At the end of first quarter 2006, we also offered over 50 cleared OTC contracts, which account for the majority of our commission rev-enue. In March 2006, we began the introduction of more than 50 planned additional cleared OTC contracts, with the first 34 cleared contracts launched through the end of April this year.’’ 106 Accord-ing to ICE, its natural gas contracts are its most heavily traded contracts. ICE states it traded nearly 43 million cleared OTC Henry Hub natural gas contracts in 2005, ‘‘compared to 10.4 mil-lion cleared OTC Henry Hub natural gas contracts traded by our nearest competitor during the same period.’’ 107
ICE claims that its ‘‘introduction of cleared OTC products has en-abled us to attract significant liquidity in the OTC markets we op-erate.’’ 108 Others agree. ‘‘[C]learing is paving the way for greater growth of the energy market as a whole,’’ one futures industry pub-lication reported. ‘‘Clearing not only helped restore liquidity post-Enron, it opened the door to an influx of hedge funds and other professional traders, many of whom come from the financial world.’’ Moreover, OTC clearing has ‘‘created a new linkage’’ between the futures markets and the OTC markets. ‘‘On one level this is simple
VerDate 0ct 09 2002 09:54 Aug 01, 2006 Jkt 028640 PO 00000 Frm 00035 Fmt 6633 Sfmt 6601 C:\DOCS\28640.TXT SAFFAIRS PsN: PAT

32
109 Will Acworth, The Tipping Point: OTC Energy Clearing Takes Off, Futures Industry Maga-zine, January/February 2005.
110 Id. Although NYMEX’s ClearPort offers a similar OTC trading opportunities, ICE currently has approximately 80 percent of the market for cleared OTC Henry Hub natural gas contracts and 85 percent of the cleared OTC PJM financial power contracts. ICE 10–Q, at p. 28.
111 Generally, futures contracts for key energy commodities can be settled through physical de-livery of the commodity, whereas OTC futures look-alikes are financially settled. Since only a small percentage of futures contracts actually result in physical delivery of the commodity, this distinction does not make a practical difference in the economic function or utility of the two types of contracts. Moreover, many of the financially-settled OTC contracts reference the NYMEX price for settlement; in this respect the two markets are intertwined.
112 ICE 10–K, at p. 25. 113 7 U.S.C. Sec. 2(h)(3). 114 7 U.S.C. Sec. 1a(11).
arbitrage between two sets of similar contracts. On another level it is a cross-fertilization of people and ideas, as each side seeks out better opportunities in newly accessible markets.’’ 109 ‘‘If you want to participate in all the information of the market,’’ said Bo Collins, former President of NYMEX, and now the operator of his own hedge fund, ‘‘you have to participate electronically and OTC.’’ 110
Today, there are few, if any, practical differences between the en-ergy commodities traded on the regulated futures markets and the standardized, cleared contracts traded on the unregulated OTC electronic exchanges. From an economic perspective, there is no distinction between trading a standardized, cleared OTC contract for future delivery on ICE and trading a standardized, cleared fu-tures contract on NYMEX.111 Both types of contracts allow buyers and sellers to hedge against price risks and to speculate on price changes. In each market counterparty risk is eliminated by use of a clearinghouse. In each market, contracts are put on the market and bought and sold many times.
From a practical perspective, the only real difference between the two markets is the degree of regulation. ICE distinguishes its OTC market from the regulated futures exchanges primarily by the ab-sence of regulation.112 Trading on the futures market is subject to CFTC oversight, while trading on the unregulated OTC exchanges is not.
B. No Oversight of OTC Electronic Markets Section 2(h)(3) of the Commodity Exchange Act, which became
law as part of the CFMA, exempts from CFTC oversight all agree-ments, contracts, and transactions in energy and metals (‘‘exempt commodities’’) that are traded on electronic trading facilities be-tween ‘‘eligible commercial entities.’’ 113 Generally, an eligible com-mercial entity must be either a large financial institution, insur-ance company, investment company, corporation or individuals with significant assets, employee benefit plan, government agency, registered securities broker, or futures commission merchant. Mar-kets operating under Section 2(h)(3) are referred to as ‘‘exempt commercial markets.’’ 114
An exempt commercial market (ECM) is subject to the CEA’s statutory prohibitions on fraud and price manipulation and, if the CFTC determines that the market performs a significant price dis-covery function, the ECM must provide pricing information to the public, but otherwise it is fully exempt from the CFTC’s regulatory oversight. The CFTC describes its authority over these ECMs as follows:
VerDate 0ct 09 2002 09:54 Aug 01, 2006 Jkt 028640 PO 00000 Frm 00036 Fmt 6633 Sfmt 6601 C:\DOCS\28640.TXT SAFFAIRS PsN: PAT
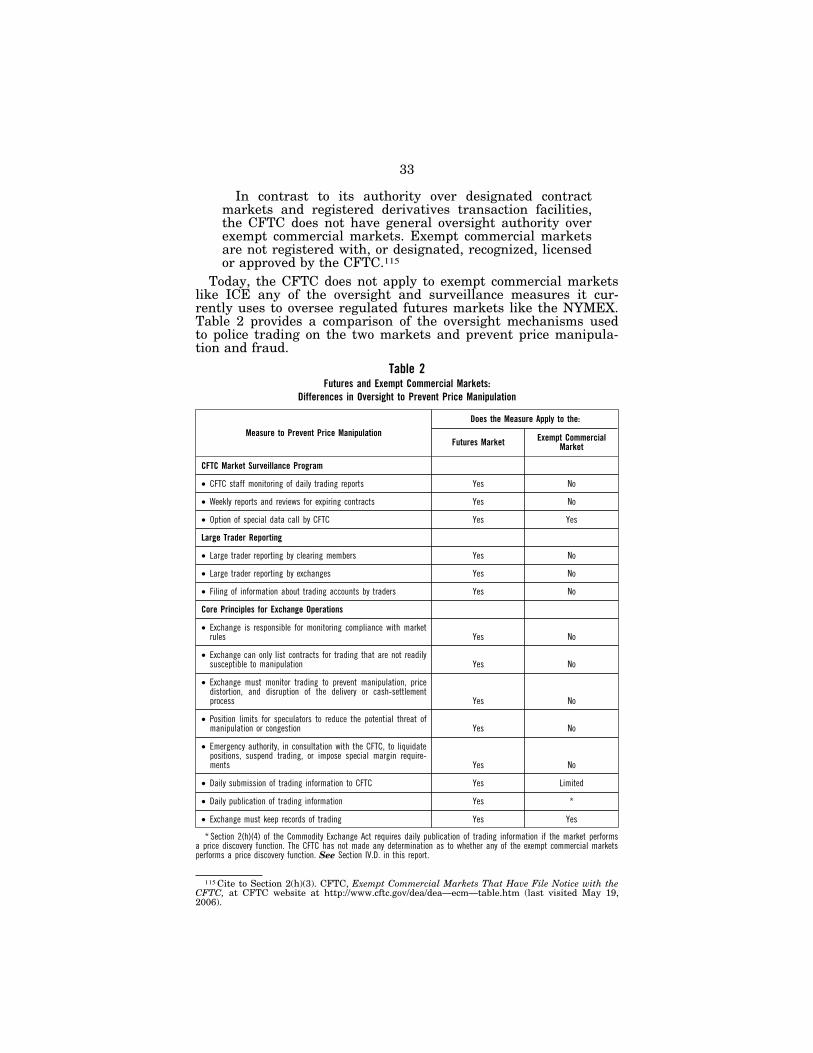
33
115 Cite to Section 2(h)(3). CFTC, Exempt Commercial Markets That Have File Notice with the CFTC, at CFTC website at http://www.cftc.gov/dea/dea—ecm—table.htm (last visited May 19, 2006).
In contrast to its authority over designated contract markets and registered derivatives transaction facilities, the CFTC does not have general oversight authority over exempt commercial markets. Exempt commercial markets are not registered with, or designated, recognized, licensed or approved by the CFTC.115
Today, the CFTC does not apply to exempt commercial markets like ICE any of the oversight and surveillance measures it cur-rently uses to oversee regulated futures markets like the NYMEX. Table 2 provides a comparison of the oversight mechanisms used to police trading on the two markets and prevent price manipula-tion and fraud.
Table 2Futures and Exempt Commercial Markets:
Differences in Oversight to Prevent Price Manipulation
Measure to Prevent Price Manipulation Does the Measure Apply to the:
Futures Market Exempt Commercial Market
CFTC Market Surveillance Program
• CFTC staff monitoring of daily trading reports Yes No
• Weekly reports and reviews for expiring contracts Yes No
• Option of special data call by CFTC Yes Yes
Large Trader Reporting
• Large trader reporting by clearing members Yes No
• Large trader reporting by exchanges Yes No
• Filing of information about trading accounts by traders Yes No
Core Principles for Exchange Operations
• Exchange is responsible for monitoring compliance with market rules Yes No
• Exchange can only list contracts for trading that are not readily susceptible to manipulation Yes No
• Exchange must monitor trading to prevent manipulation, price distortion, and disruption of the delivery or cash-settlement process Yes No
• Position limits for speculators to reduce the potential threat of manipulation or congestion Yes No
• Emergency authority, in consultation with the CFTC, to liquidate positions, suspend trading, or impose special margin require-ments Yes No
• Daily submission of trading information to CFTC Yes Limited
• Daily publication of trading information Yes *
• Exchange must keep records of trading Yes Yes
* Section 2(h)(4) of the Commodity Exchange Act requires daily publication of trading information if the market performs a price discovery function. The CFTC has not made any determination as to whether any of the exempt commercial markets performs a price discovery function. See Section IV.D. in this report.
VerDate 0ct 09 2002 09:54 Aug 01, 2006 Jkt 028640 PO 00000 Frm 00037 Fmt 6633 Sfmt 6621 C:\DOCS\28640.TXT SAFFAIRS PsN: PAT

34
116 7 U.S.C. § 5. This statement of purpose in the CEA was revised to read in its current form as part of the CFMA of 2000.
117 See, e.g., August 2002 report prepared by the Federal Energy Regulatory Commission (FERC) staff, Docket No. PA–02–000, which found significant evidence of price manipulation and deceptive practices by Enron in connection with its OTC electronic trading platform, known as Enron OnLine. The report includes a detailed analysis of natural gas trades made on Enron OnLine for next-day delivery into California over the course of a single day, January 31, 2001. The report found that of a total of 227 trades on that day, 174 involved Enron and a single unnamed party; these 174 trades took place primarily during the last hour of trading, and by using ‘‘higher prices,’’ these trades resulted in a steep price increase over the last hour of trad-ing. The report also noted that price information displayed electronically on Enron OnLine was a ‘‘significant, even dominant’’ source of price information used by reporting firms publishing
These differences are substantial. For example, unlike the regu-lated exchanges, on OTC electronic exchanges, neither the CFTC nor the OTC trading facility itself monitors trading activity to de-tect and deter fraud and price manipulation. Key trading informa-tion is not disclosed to the CFTC or the public. Although ICE dis-closes to the CFTC and subscribers of its data services certain in-formation about posted bids, offers, and completed trades, other critical data routinely reported by the regulated exchanges to the CFTC and the public, such as open interest, is not reported by ICE. Large trader reports do not have to be filed with the CFTC. Unlike trading on the NYMEX, there are no position limits or price change limits.
The most frequently asserted justification for this disparity in regulatory coverage is that only large institutions that are sophisti-cated traders with less need for governmental protection are per-mitted to trade on these electronic trading facilities. But federal regulation of commodity markets is not designed solely to protect commodity traders; it is also intended to protect commodity pur-chasers and the public at large, including consumers who ulti-mately bear the costs of energy products such as gasoline, heating oil, diesel fuel, and natural gas.
The Commodity Exchange Act articulates the national interest in preventing price manipulation and excessive speculation:
The transactions and prices of commodities on such boards of trades are susceptible to excessive speculation and can be manipulated, controlled, cornered or squeezed to the detriment of the producer or the consumer and the persons handling commodities and the products and by-products thereof in interstate commerce, rendering regula-tion imperative for the protection of such commerce and the national public interest therein.116
The history of commodity markets demonstrates it is unrealistic to rely on the self-interest of a few large traders as a substitute for dedicated, independent oversight to protect the public interest. Commodity traders have no responsibility or obligation to look out for public rather than private interests. In some cases, it could be a breach of fiduciary duty for officers of a private corporation to look out for interests other than those of the corporation’s share-holders. Most recently, the Enron scandal, which involved mis-conduct by a number of traders at large energy and trading compa-nies active in OTC trading, is clear evidence of how a few sophisti-cated, unscrupulous traders can harm not only other market par-ticipants, but also the public at large by artificially increasing prices.117 Consumers paying artificially high energy prices suffer
VerDate 0ct 09 2002 09:54 Aug 01, 2006 Jkt 028640 PO 00000 Frm 00038 Fmt 6633 Sfmt 6601 C:\DOCS\28640.TXT SAFFAIRS PsN: PAT

35
natural gas pricing data. The report tentatively concluded that Enron OnLine price data was susceptible to price manipulation and may have affected not only Enron trades, but also in-creased natural gas prices industrywide.
118 Letter from Reuben Jeffery III, Chairman, Commodity Futures Trading Commission, to Governor Jennifer Granholm, August 22, 2005.
119 CFTC Backgrounder, The CFTC Market Surveillance Program, June 2001, at CFTC website, at http://www.cftc.gov/opa/backgrounder/opasurveill.htm?from=home&page=mktsurveil-content.
120 Letter from Reuben Jeffery III, Chairman, Commodity Futures Trading Commission, to Governor Jennifer Granholm, August 22, 2005.
121 CFTC, The CFTC Market Surveillance Program. 122 Letter from Reuben Jeffery III, Chairman, Commodity Futures Trading Commission, to
Governor Jennifer Granholm, August 22, 2005. 123 Id.124 Statement of Dr. James Overdahl, Global Oil Demand/Gasoline Prices, Hearing before the
Senate Committee on Energy and Natural Resources, September 6, 2005.
the same harm regardless of whether the price was manipulated on an OTC electronic exchange or on a regulated futures market.
C. No Large Trader Reporting in OTC Electronic Markets As indicated in Table 2, Large Trader Reports are not required
in OTC electronic markets. The absence of information about large trades increases the vulnerability of these markets to price manip-ulation and excessive speculation.
CFTC Chairman Reuben Jeffery III, recently stated, ‘‘One of the core themes of the Commodity Exchange Act . . . is that the com-modity markets operate free of manipulation and the Commission’s most basic responsibility is to detect and deter such behavior so that markets operate in an open and competitive manner, free of price distortions.’’ 118 To fulfill this responsibility, the Commission has established a market surveillance program, whose primary mission is ‘‘to identify situations that could pose a threat of manip-ulation and to initiate appropriate preventive actions.’’ 119 ‘‘[T]he Commission attempts to proactively combat potential manipula-tion,’’ Chairman Jeffery explains, ‘‘rather than simply waiting until someone has attempted to manipulate prices.’’ 120 The CFTC staff monitors the daily trading on the regulated exchanges, with par-ticular focus on ‘‘the daily activities of large traders, key price rela-tionships, and relevant supply and demand factors.’’ 121
The ‘‘cornerstone’’ of the surveillance program is the Commis-sion’s Large Trader Reporting (LTR) system.122 Chairman Jeffery states the LTR system ‘‘enables detection of concentrated and co-ordinated positions that might be used by one or more traders to attempt manipulation. This transparency is also well known to market participants, providing yet another element of deter-rence.’’ 123 The CFTC’s Chief Economist, Dr. James Overdahl, re-cently told Congress that the LTR system ‘‘is a powerful tool for de-tecting the types of concentrated and coordinated positions required by a trader or group of traders attempting to manipulate the mar-ket.’’ 124
Under the LTR system, clearing members of futures exchanges (the entities that actually do the trading on behalf of customers) must file daily reports with the CFTC identifying the futures and options positions held by its customers above specific threshholds established by the Commission. To enable the CFTC to aggregate trader positions that may have been established through more than one clearing member, traders themselves are required to inform the CFTC of each account that acquires a reportable position.
VerDate 0ct 09 2002 09:54 Aug 01, 2006 Jkt 028640 PO 00000 Frm 00039 Fmt 6633 Sfmt 6601 C:\DOCS\28640.TXT SAFFAIRS PsN: PAT

36
125 CFTC Backgrounder, The CFTC’s Large-Trader Reporting System, at CFTC website, at http://www.cftc.gov/opa/backgrounder/opa-ltrs.htm.
126 Id.127 CFTC, The CFTC Market Surveillance Program.128 There are anecdotal reports that some traders prefer trading on the OTC energy markets
in the United States because of the lack of regulation. Natural Gas Week recently quoted one trader:
When volumes all of a sudden begin to increase in one market and begin to erode in an-other, you have to ask yourself where the real market is? Since there’s not the same sort of mandatory reporting requirements in the OTC world, it’s very likely the funds have had their fill of being scrutinized and spot-lighted as the culprits, so they are moving into an-other market area that is not so easily tracked and doesn’t have as much attention drawn to it.
Funds Increasing OTC Volumes, Sidestepping Nymex Oversight, Natural Gas Week, April 25, 2005. Natural Gas Week also reported that hedge funds ‘‘benefit from the OTC traded futures market because they are not as transparent as NYMEX traded futures, and the non-commercial reporting requirements such as the CFTC mandated Commitment of Traders Report is not as stringent.’’ Id. The article explained how speculators can influence the futures markets through their activity in the OTC market, or vice versa, and capture a profit through the difference in price between the two markets that may result from trading in one of the markets.
‘‘Last week, there was a lot of arbitrage going on between the OTC gas futures markets and the NYMEX futures markets, because at times the OTC markets were as much as 5 cents in back of the futures screen,’’ another gas futures trader said. ‘‘The OTC futures mar-kets usually trade nearly in tandem with the NYMEX futures screen, but it’s not uncommon to be able to capture a spread between the two markets. Still, it’s amazing that the specula-tive entities in the OTC market can move the NYMEX down by 5 cents or more in about 30 seconds. But they could just as easily position themselves in the OTC market to influ-ence the NYMEX futures market to the upside as well,’’ the trader added.
‘‘Only by properly identifying and aggregating accounts can the surveillance staff make a thorough assessment of a trader’s poten-tial market impact and a trader’s compliance with speculative posi-tion limits.’’ 125 The exchanges themselves are required to report similar data to the CFTC. According to the CFTC, ‘‘The aggregate of all large-traders’’ positions reported to the Commission usually represents 70 to 90 percent of the total open interest in any given market.’’ 126
The Commission describes how it uses this data to take appro-priate action to detect and deter price manipulation:
Surveillance economists prepare weekly summary re-ports for futures and options contracts that are approach-ing their critical expiration periods. Regional surveillance supervisors immediately review these reports. Surveillance staff advise the Commission and senior staff of potential problems and significant market developments at weekly surveillance meetings so that they will be prepared to take prompt action when necessary.127
The LTR system also provides critical information for the weekly Commitment of Traders Reports that the CFTC provides to the public. The CFTC’s Chief Economist stated, ‘‘Data from the CFTC’s Large Trader Reporting System can help answer questions about the role of non-commercial traders in U.S. energy futures markets.’’ This data can be used to help determine the relative participation of commercial participants (firms that buy or sell the traded com-modity as part of their business and use the futures markets for hedging) and of speculators (who are not using the market for hedging physical commodities). Without a Large Trader Reporting system, it is impossible to determine the composition of the futures markets and analyze the influence of speculation on market prices.128
VerDate 0ct 09 2002 09:54 Aug 01, 2006 Jkt 028640 PO 00000 Frm 00040 Fmt 6633 Sfmt 6601 C:\DOCS\28640.TXT SAFFAIRS PsN: PAT

37
Id. The article also noted that funds can take large positions in the OTC market without hav-ing to report those positions to any regulatory agency, thereby circumventing any position limits that apply to their trading on the futures market.
129 7 U.S.C. Sec. 7(d). 130 Under the CEA, electronic trading facilities that trade energy commodities are subject to
‘‘such rules and regulations as the Commission may prescribe if necessary to ensure timely dis-semination by the electronic trading facility of price, trading, volume, and other trading data to the extent appropriate, if the Commission determines that the electronic trading facility per-forms a significant price discovery function for transactions in the cash market for the com-modity underlying any agreement, contract, or transaction executed or traded on the electronic trading facility.’’ 7 U.S.C. Sec. 2(h)(4)(D).
131 69 Fed. Reg. 43285 (July 20, 2004).132 17 C.F.R. § 36.3(c)(2).133 17 C.F.R. § 36.3(c)(2)(C).
D. No Public Dissemination of Trading Data by OTC Elec-tronic Markets
Under the Commodity Exchange Act, regulated markets are required to publish daily information about settlement prices, vol-ume, open interest, and opening and closing price ranges for all ac-tively traded contracts.129 Under the Commodity Futures Mod-ernization Act, OTC electronic markets must publish similar infor-mation if the CFTC determines that the market ‘‘performs a sig-nificant price discovery function’’ for the underlying cash market.130 Although there is substantial evidence that the ICE OTC electronic exchange performs such a price discovery function, the CFTC has not undertaken any effort to make this determination. The failure to even attempt to make this determination ignores the Congres-sional mandate expressed in the law that the OTC electronic ex-changes that perform a price discovery function be as transparent to the public as the regulated futures exchanges.
In 2004, the CFTC issued a rule setting forth the process and cri-teria it would use to determine whether an electronic exchange per-formed a price discovery function.131 However, the CFTC has not taken any action in the 2 years since that rule was issued to actu-ally determine whether ICE or any other OTC electronic market meets these criteria. Under the 2004 rule, an ECM performs a price discovery function when it meets one of two specified criteria:
(A) Cash market bids, offers or transactions are directly based on, or quoted at a differential to, the prices gen-erated on the market on a more than occasional basis; or
(B) The market’s prices are routinely disseminated in a widely distributed industry publication and are rou-tinely consulted by industry participants in pricing cash market transactions.132
An ECM operating under the Section 2(h)(3) exemption must no-tify the CFTC when ‘‘it has reason to believe’’ either of these cri-teria are met, or if the ‘‘market holds itself out to the public as per-forming a price discovery function for the cash market for the com-modity.’’ 133
If an ECM notifies the CFTC that it has reason to believe that it meets any of these criteria for performing a price discovery func-tion, or the CFTC itself determines that an ECM appears to meet one of these criterion, then the CFTC must provide the ECM ‘‘with an opportunity for a hearing through the submission of written
VerDate 0ct 09 2002 09:54 Aug 01, 2006 Jkt 028640 PO 00000 Frm 00041 Fmt 6633 Sfmt 6601 C:\DOCS\28640.TXT SAFFAIRS PsN: PAT

38
134 17 C.F.R. § 36.3(c)(2)(C)(iii). 135 Id.136 17 C.F.R. § 36.3(c)(2)(C)(iv)(A). The information must be publicly disseminated no later
than the business day following the day to which the information applies. Id. at Section 36.3(c)(2)(C)(iv)(B).
The 2004 rule also requires an exempt commercial market to inform the CFTC of those com-modity contracts it is trading in reliance on the exemption set forth in Section 2(h)(3). Id. at Sec. 36.3(b)(1)(ii). The ECM must provide the CFTC with a description of the contract and week-ly reports on the price, quantity, and other information the CFTC determines is appropriate for each trade in that commodity contract during the previous week. The facility may either provide this information in weekly reports or provide the CFTC with electronic access to the same infor-mation. Id. at Section 36.3(b)(1)(ii)(A) and (B). Additionally, the ECM must maintain records of complaints or allegations of fraud or manipulation, and forward any such complaints to the CFTC. Id. at Section 36.3(b)(1)(iii) and (iv). There is no requirement that the CFTC or an ECM provide this data to the public.
In comments filed on the proposed rule, ICE contended that the CFMA did not give the CFTC authority to conduct regulatory oversight of trading on electronic trading facilities or to require electronic trading facilities to submit reports. The CFTC rejected this argument, noting that Congress expressly stated ECMs were still subject to the anti-fraud and anti-manipulation provisions of the CEA. ‘‘If the Commission is to have the ability to enforce those provisions, it must have access to meaningful information concerning transactions on ECMs.’’ 69 Fed. Reg. 43287. The CFTC also dismissed the contention that allowing the CFTC staff to monitor trading through the installation of a view-only trading screen at the CFTC was sufficient to enable the CFTC to monitor those markets for fraud and manipulation. ‘‘The Commission has found that the information provided under the current electronic access option is neither as relevant, nor as useful, as anticipated.’’ Id. 69 Fed. Reg. 43286. It stated that the view-only access to com-puter screens provided to the CFTC by ICE ‘‘is not, in fact, equivalent to the large trader infor-mation received with respect to designated contract markets.’’ Id. The CFTC, however, has not used this section to require information on open interest or large trades. Hence, the information that is provided to the CFTC under this section does not serve to provide the CFTC with the type of large trader information necessary to detect and prevent manipulation.
137 ICE 10–K, at p. 4.
data, views and arguments.’’ 134 After conducting such a hearing, and ‘‘consideration of all relevant matters,’’ the Commission ‘‘shall issue an order containing its determination whether the electronic trading facility performs a significant price discovery function’’ under this section.135
If the CFTC determines that an electronic trading facility per-forms a significant price discovery function, then the regulations require the facility to disseminate to the public, on a daily basis, the following information:
(1) Contract terms and conditions, or a product descrip-tion, and trading conventions, mechanisms and prac-tices;
(2) Trading volume by commodity and, if available, open interest; [and]
(3) The opening and closing prices or price ranges, the daily high and low prices, a volume-weighted price . . . or such other daily price information as proposed by the facility and approved by the Commission.136
Despite the 2004 regulations, to date, neither ICE—nor any other ECM—has informed the CFTC that it has reason to believe that its electronic exchange performs a price discovery function. Yet at the same time, ICE appears to have made that very claim to the Securities and Exchange Commission (SEC). In the Form 10–K that ICE filed with the SEC on March 10, 2006, ICE identi-fied price discovery as a core function of its over-the-counter mar-kets: ‘‘Our participants, representing many of the world’s largest energy companies, leading financial institutions and proprietary trading firms, as well as natural gas distribution companies and utilities, rely on our platform for price discovery, hedging and risk management.’’ 137
VerDate 0ct 09 2002 09:54 Aug 01, 2006 Jkt 028640 PO 00000 Frm 00042 Fmt 6633 Sfmt 6601 C:\DOCS\28640.TXT SAFFAIRS PsN: PAT

39
138 ICE 10–K, at p. 13.139 See, e.g., ICE. The Energy Marketplace, at https://www.theice.com/profile.jhtml (last visited
June 9, 2006) (‘‘IntercontinentalExchange is the world’s leading electronic marketplace for en-ergy trading and price discovery. . . . ICE’s electronic trading platform offers direct, centralized access to trade execution and real-time price discovery through over 7,000 active screens at more than 1000 OTC and futures participant firms.’’); A Global Community of Energy Market Partici-pants, at https://www.theice.com/customers.jhtml (last visited June 9, 2006) (‘‘Through ICE’s markets, participants have direct access to trade execution, real-time price information, market activity and unparallelled transparency in both futures and OTC energy markets. From the world’s leading oil majors, to funds, utilities and financial institutions, energy market partici-pants rely on ICE.’’); Clearing, at https://www.theice.com/futures—clearing.jhtml (last visited June 9, 2006) (‘‘As the world’s leading electronic energy exchange, ICE provides an unsurpassed forum for price discovery and risk management.’’); ICE Platform, https://www.theice.com/ice—platform.jhtml (last visited June 9, 2006) (ICE’s electronic platform is the gateway to an open marketplace—one in which each participant has access to real-time price discovery and trading functionality.’’).
140 See, e.g., Statement of Jeffrey Sprecher, ICE Chairman and Chief Executive Officer, Inter-continental Announces 2003 Results, March 4, 2004, (‘‘ICE’s investment in the development of cleared OTC products was beneficial to a growing number of market participants who relied on clearing to ease credit constraints while managing risk. As a result, Intercontinental is well po-sitioned to participate in the stabilizing OTC energy markets, and to facilitate the migration to electronic price discovery.’’), at https://www.theice.com/showpr.jhtml?id=558; Statement of Jef-
Continued
ICE’s 10–K filing also describes its sale of a daily report con-taining price data about OTC transactions as a core business activ-ity. ICE described its ‘‘OTC End of Day Report’’ as follows:
The OTC ICE Data end of day report is a comprehensive electronic summary of trading activity in our OTC mar-kets. The report is published daily at 3:00 p.m. Eastern time and features indicative price statistics, such as last price, high price, low price, total volume-weighted average price, best bid, best offer, closing bid and closing offer, for all natural gas and power contracts that are traded or quoted on our platform. The end of day report also pro-vides a summary of every transaction, which includes the price [and] the time stamp. . . .138
It is not apparent why traders and energy firms would pay for ICE Data’s End of Day Trader Reports if those reports did not pro-vide valuable information about the data that is most useful to market participants—prices. Such price reports would appear to be useless or not worth the cost if the ICE trades did not perform a price discovery function. By generating valuable daily price data to industry participants, trading on ICE now performs a price dis-covery function.
It is difficult to reconcile ICE’s daily trading reports and its statements to the SEC with its failure to notify the CFTC that its natural gas and electricity markets perform a price discovery func-tion. As ICE states, most of the natural gas and power contracts traded in its OTC markets relate to ‘‘the prompt, or front month,’’—meaning the futures contract that is closest to the spot or cash market. Hence, the prices of these contracts as traded on ICE have a direct influence on the prices of these commodities in the cash market.
Although the CFTC’s 2004 rulemaking requires an ECM that has reason to believe it is performing a price discovery function to no-tify the CFTC, the CFTC has retained authority to initiate a hear-ing to determine whether an ECM meets the criteria for per-forming a price discovery function. Despite numerous unqualified statements by ICE on its website, 139 in press releases, 140 and in
VerDate 0ct 09 2002 09:54 Aug 01, 2006 Jkt 028640 PO 00000 Frm 00043 Fmt 6633 Sfmt 6601 C:\DOCS\28640.TXT SAFFAIRS PsN: PAT

40
frey Sprecher, Trading Technologies to Connect to ICE Energy Markets, March 17, 2004 (‘‘We look forward to together delivering alternatives to the markeplace for electronic price discovery and expanded market access to a diverse group of participants.’’), at https://www.theice.com/showpr.jhtml?id=557.
141 Comments at a conference, May 9, 2006. An audio replay of Mr. Sprecher’s presentation can be downloaded from the ICE website, at https://www.theice.com/showpr.jhtml?id=2321 (last visited June 9, 2006).
142 Letter from IPE to CFTC, May 14, 1999.
filings with the SEC that its OTC electronic trading facility per-forms a price discovery function, the CFTC has failed to initiate any type of inquiry to evaluate this issue. In light of the substan-tial evidence that the ICE electronic exchange is performing a price discovery function, the CFTC appears to have failed to carry out its statutory mandate to require ICE to publicly disseminate trading data.
V. THE COP’S BLIND EYE: U.S. ENERGY TRADES ON FOR-EIGN EXCHANGES
‘‘Growth in our industry is certainly exceeding the ability of the regulators to get their heads around it.’’
—Jeffrey Sprecher, ICE Chairman and CEO 141 ICE now operates two types of electronic energy exchanges. One
is the ICE OTC exchange, which is registered in the United States. The other is ICE Futures, which is a futures exchange registered in London and regulated by the United Kingdom Financial Services Authority (FSA). Until January of this year, ICE Futures traded solely in European-based energy commodities. Within the past few months, however, the CFTC has permitted ICE Futures in London to use its trading terminals within the United States for the trad-ing of U.S. energy commodities, including U.S. crude oil, U.S. gaso-line, and U.S. home heating oil. The result is that persons located in the United States seeking to trade key U.S. energy commodities now can avoid all U.S. market oversight and reporting require-ments simply by routing their trades through the ICE Futures ex-change in London instead of the NYMEX in New York.
A. U.S. Energy Commodities Traded on Foreign Exchanges In May 1999, the London International Petroleum Exchange
(IPE) petitioned the CFTC to permit the IPE to make its electronic trading system available to IPE members in the United States. Specifically, the IPE desired that its members who were registered with the CFTC be able to electronically place orders from within the United States, or to electronically submit the orders of cus-tomers within the United States, to the IPE in London, without re-quiring the IPE to be fully regulated as a U.S. futures market under the CEA. The IPE’s petition contained general information about the IPE’s operations, the contracts traded on the IPE, its floor and trading procedures, a description of the United Kingdom regulatory structure applicable to the IPE, the IPE’s procedures for compliance with the U.K. regulations, and procedures for sharing information with the CFTC.142
In November 1999, the CFTC granted the IPE’s request by re-leasing a ‘‘no-action’’ determination, permitting the IPE to allow its members to electronically trade from within the United States without having to designate the IPE as a U.S. futures exchange
VerDate 0ct 09 2002 09:54 Aug 01, 2006 Jkt 028640 PO 00000 Frm 00044 Fmt 6633 Sfmt 6601 C:\DOCS\28640.TXT SAFFAIRS PsN: PAT

41
143 Notice of Statement of Commission Policy Regarding the Listing of New Futures and Op-tions Contracts by Foreign Boards of Trade that Have Received Staff No-Action Relief to Place Electronic Trading Devices in the United States, 65 Fed. Reg. 41641 (July 6, 2000). On April 14, 2006, the CFTC revised its policy to require a foreign board of trade to provide the CFTC with at least ten days’ notice prior to the commencement of trading from within the United States of any product on such board of trade. 71 Fed. Reg. 19877 (April 18, 2006).
144 Prior to the listing of a WTI contract on the ICE Futures exchange, ICE offered a WTI contract for trading on its OTC electronic exchange. In a recent interview, ICE Chairman and CEO Jeffrey Sprecher described how ICE’s development of a successful OTC contract for WTI paved the way for the introduction of the WTI contract on ICE Futures:
To the outside world, we launched WTI and it came out with a very high adoption rate. But the reality is ICE was working on that contract for a year and a half prior to its launch. One unique thing about ICE is that we can take a product and launch it as a bilateral OTC contract allowing the energy trading community to trade it. While they trade it we can work out many of the details, such as the size of the contract, delivery aspects, tick size and those things. Then we can add clearing to it and bring in more of the funds and speculators—if we get that going, then we can make it a futures contract. That’s the process we went through with the WTI con-tract. It went from a bilateral swap to a cleared OTC contract to a futures contract.
And we’re bringing other contracts through that conveyor belt process. In the first half of this year, we’re bringing clearing to 50 bilateral contracts that we already offered.
ICE: ‘‘The market has spoken,’’ Futures & Options Week, April 24, 2006. As previously dis-cussed, quantitative data on the WTI contract traded on the ICE OTC electronic exchange is not readily available. According to former Federal Reserve Chairman Greenspan’s recent testi-
Continued
under the CEA. The CFTC wrote that its position was ‘‘restricted to providing relief from the requirement that IPE obtain contract market designation pursuant to [the CEA] and regulatory require-ments that flow specifically from the contract market designation requirement in the event that the above-reference contracts are made available in the United States.’’ The CFTC stated its ‘‘no-ac-tion position does not affect the Commission’s ability to bring ap-propriate action for fraud or manipulation.’’ It also stated that it retained the authority to ‘‘condition further, modify, suspend, ter-minate, or otherwise restrict the terms of the no-action relief pro-vided herein, in its discretion.’’ The initial no-action letter per-mitted the trading of IPE’s natural gas, fuel oil, gas oil, and Brent crude oil contracts through IPE terminals in the United States. Subsequently, in 2002 and 2003, following the purchase of the IPE by ICE, the IPE received permission from the CFTC, through sev-eral amendments to the initial no-action letter, to trade U.K. nat-ural gas, gas oil, and Brent crude oil contracts through the ICE electronic trading platform.
B. ICE Futures Trading of U.S. Energy Commodities In mid-January 2006, ICE notified the CFTC that on February
3, 2006, it would begin trading a U.S. energy commodity—West Texas Intermediate crude oil, a crude oil that is produced in the United States—on its ICE Futures exchange in London, and that it would offer this contract for trading on its electronic trading de-vices that were operating in the United States under the no-action letters the CFTC had previously issued. Under CFTC policy in ef-fect at the time, ICE Futures did not need an additional no-action letter to make this new contract available for trading in the United States; rather, ICE Futures needed only to provide prior notice to the CFTC.143 This marked the first time that futures contracts for crude oil produced in the United States was traded on an exchange outside of the United States.
Since ICE began trading WTI crude oil futures on its London ex-change, it has steadily increased its share of the WTI crude oil furtures market.144 According to CFTC data, as of the end of April
VerDate 0ct 09 2002 09:54 Aug 01, 2006 Jkt 028640 PO 00000 Frm 00045 Fmt 6633 Sfmt 6601 C:\DOCS\28640.TXT SAFFAIRS PsN: PAT

42
mony, during this period hedge funds and other institutional investors conducted a substantial amount of trading in crude oil in this market.
145 CFTC data provided to the Subcommittee. 146 Market Forces: Big Oil increases market reach, Energy Compass, March 24, 2006.
2006, nearly 30 percent of WTI crude oil futures were traded on ICE Futures.145 According to one energy trade publication, several of the large ICE stakeholders—BP, Total, and Morgan Stanley—were ‘‘doing their best to support the ICE WTI contract, with Gold-man Sachs directing its traders to use the ICE platform rather than Nymex.’’ 146
ICE Futures has further expanded its reach into the U.S. energy commodities market. In addition to trading WTI crude oil futures on its London exchange, in April 2006, ICE Futures began trading futures in U.S. gasoline and home heating oil.
C. Implications for Oversight of U.S. Commodity Markets The trading of U.S. energy commodities on the ICE Futures ex-
change in London from terminals within the United States permits traders within the United States to trade U.S. energy commodities without any U.S. oversight or regulation. This type of unregulated trading of a U.S. commodity from within the United States under-mines the very purpose of the Commodity Exchange Act and the central mission of the CFTC—to prevent manipulation or excessive speculation of commodity prices ‘‘to the detriment of the producer or the consumer and the persons handling commodities.’’ Without information about the trading of U.S. energy commodities, the CFTC cannot undertake, let alone accomplish, its mission.
Furthermore, the trading of U.S. energy commodities on foreign or unregulated OTC exchanges without any reporting to the CFTC undermines the reporting system for commodities traded on CFTC-regulated exchanges. With respect to traders that trade on both ex-changes, the CFTC will be provided only partial data regarding the extent of their trades, thereby affecting the accuracy of the data to the CFTC.
For example, a trader wishing to disguise its position on the reg-ulated market, or give the regulated market a false impression of its trading, could buy and sell an identical number of futures in dif-ferent months; this would then be reported to the CFTC as a spread position. That same trader then could offset one of those po-sitions, say, for example, the short position, on the unregulated ex-change. In this example, the trader would have a net long position, but it would appear to the CFTC and the public, through the Com-mitment of Traders Report, as a spread position. Hence, both the CFTC and the public would have an inaccurate view of the com-position of the market. Only the trader would know the correct po-sition. It is not difficult to imagine other schemes to distort the CFTC’s market data.
For the CFTC to be able to carry out its fundamental mission to protect the integrity of the U.S. commodity futures markets, all U.S. traders of U.S. energy futures or futures-like contracts must keep records and report large trades to the CFTC, regardless of where the trade takes place—on the NYMEX, an electronic ex-change, or a foreign exchange. To continue the present situation, in which the CFTC does not police two of three major markets
VerDate 0ct 09 2002 09:54 Aug 01, 2006 Jkt 028640 PO 00000 Frm 00046 Fmt 6633 Sfmt 6601 C:\DOCS\28640.TXT SAFFAIRS PsN: PAT

43
trading U.S. energy futures, is to turn a blind eye to an increas-ingly large segment of these markets, thereby impairing the ability to detect, prevent, and prosecute market manipulation and fraud. The United States needs to put the cop back on the beat in all of these key energy markets.
VerDate 0ct 09 2002 09:54 Aug 01, 2006 Jkt 028640 PO 00000 Frm 00047 Fmt 6633 Sfmt 6601 C:\DOCS\28640.TXT SAFFAIRS PsN: PAT

44
147 Matthew R. Simmons, Oil Prices, Volatility and Speculation, Presentation at the IEA/NYMEX Conference, New York, New York, November 23, 2004.
148 Id. 149 In some cases, a hedge fund or other type of managed money fund may purchase futures
for portfolio diversification to limit the fund’s financial exposure to energy prices fluctuations. 150 The CFTC defines ‘‘open interest’’ as ‘‘the total of all futures and/or option contracts en-
tered into and not yet offset by a transaction, by delivery, by exercise, etc.’’ Open interest held or controlled by a trader is referred to as that trader’s position. For the CFTC’s Commitment of Traders Futures and Options Combined Report, the open interest in options is calculated by mathematically computing the futures-equivalent of the unexercised option contracts. CFTC Backgrounder, The Commitment of Traders Report, at CFTC website, at http://www.cftc.gov/opa/backgrouder/opacot596.htm.
APPENDIX
MEASURING THE INCREASE IN SPECULATIVE TRADING
A. CFTC Commitment of Traders Report One of the few direct, quantitative measures of the increased
trading activity by speculative money managers in energy futures trading is provided by the Commodity Futures Trading Commis-sion (CFTC) weekly report on futures trading activity. The CFTC publishes, on a weekly basis, a ‘‘Commitment of Traders’’ (COT) Report, providing, for each commodity traded on a U.S. futures ex-change, statistical information regarding the extent and nature of trading in that commodity in the previous week. Oil industry con-sultant and analyst Matthew R. Simmons characterizes the COT Report as, ‘‘In the Land of the Blind, it is the ‘One-Eyed King.’ ’’ 147 The report ‘‘tells who the players are,’’ provides a ‘‘snapshot of Tuesday market close,’’ and can ‘‘spot some long-term trends (after the fact).’’ 148
For trades conducted on the regulated futures markets, the CFTC regulations require clearing houses and brokers to report, on a daily basis, futures positions on their books for traders that hold positions exceeding certain levels established by the CFTC (‘‘report-able positions’’). Traders holding futures positions are also required to file a report with the CFTC describing the nature of their busi-ness; the CFTC uses this data to classify each trader as ‘‘commer-cial’’ or ‘‘non-commercial.’’ Commercial traders are those entities that use the commodity as part of their business, and hence use the futures markets for hedging; non-commercial traders are all other traders. The non-commercial category includes commodity pools, pension funds, hedge funds, and other types of managed money funds. Generally, non-commercial traders do not use the commodity in their normal course of business or purchase futures to hedge their exposure to changes in the price of those commod-ities; they are instead engaged in market speculation to profit from price changes.149
The COT Report provides, for each commodity: the total amount of open interest in that commodity, meaning the total of all futures and option contracts entered into and not yet offset by another transaction or delivery of the commodity.150 The COT Report also provides the number of outstanding short and long positions held by commercial and non-commercial traders, respectively; and the number of ‘‘spreading’’ positions held by non-commercial traders. Spreading includes each trader’s reported long and short positions
VerDate 0ct 09 2002 09:54 Aug 01, 2006 Jkt 028640 PO 00000 Frm 00048 Fmt 6633 Sfmt 6601 C:\DOCS\28640.TXT SAFFAIRS PsN: PAT

45
151 For example, a trader might purchase a contract in the near-future, and, at the same time, sell a longer-term futures contract. This would be reported to the CFTC as a spread position. If the trader purchased two long futures contracts, and sold one short contract, it would be re-ported as one spread contract and one long contract.
152 Haigh, Hranaiova and Overdahl, at pp. 3–4.
in the same commodity, to the extent they are balanced.151 The re-port also identifies the number of long and short non-reportable po-sitions, which is derived from the total open interest and the data on the reportable positions. Generally, reportable positions rep-resent from 70–90 percent of the particular market.152 The COT Report also provides data on the percentage of open interest and various other positions held by the largest four and largest eight traders. This data provides a gauge on how much of the market is dominated by the largest traders.
B. Increased Speculative Trading on the NYMEX The increase in trading in oil and natural gas futures and op-
tions by money managers and speculators is seen clearly in the trends in the CFTC trader data over the past several years. Figure A–1 shows the increasing amount of open interest in crude oil and natural gas contracts traded on the NYMEX since 1998.
Figure A–1. The open interest in both crude oil and natural gas contracts has doubled since 2004. Data source: CFTC COT data.
A breakdown of the crude oil and natural gas open interest by the various types of positions tracked by the CFTC shows how there has been a shift in the composition of trading on the NYMEX over the past couple of years. As Figure A–2 demonstrates for crude oil contracts, and Figure A–3 demonstrates for natural gas
VerDate 0ct 09 2002 09:54 Aug 01, 2006 Jkt 028640 PO 00000 Frm 00049 Fmt 6633 Sfmt 6601 C:\DOCS\28640.TXT SAFFAIRS PsN: PAT 2864
0.00
7

46
contracts, in the past few years there has been a significant in-crease in the amount of open interest held by non-commercial trad-ers. In both markets, there has been a large increase in the amount of spreading—i.e. holding of both long and short positions that do not offset each other—by non-commercial traders. In short, the amount of speculative trading in crude oil and natural contracts has increased significantly in the past 2 years.
Figure A–2. The amount of speculative trading in crude oil contracts has in-creased significantly in the past 2 years, as evidenced by the increase in the num-ber of non-commercial spread positions. Data source: CFTC.
Figure A–3. The amount of speculative trading in natural gas contracts has in-creased significantly in the past 2 years, as evidenced by the increase in the num-ber of non-commercial spread positions. Data source: CFTC.
VerDate 0ct 09 2002 09:54 Aug 01, 2006 Jkt 028640 PO 00000 Frm 00050 Fmt 6633 Sfmt 6601 C:\DOCS\28640.TXT SAFFAIRS PsN: PAT 2864
0.00
828
640.
009

47
Table A–1 presents similar information in tabular format. Addi-tionally, Table A–1 shows the increase in the number of non-com-mercial traders over this same period. Although the number of commercial traders holding short and long positions has not varied by more than about 20 percent during this period, the number of non-commercial traders holding spread positions has quadrupled, so that there are now more non-commercial traders than commer-cial traders.
Table A–1. CFTC data shows a significant increase in the number of non-com-mercial traders and the percentage of open interest held by non-commercial trad-ers in the past few years. Data source: CFTC.
Figure A–4 shows how the influx of investment into longer-term futures has raised the prices of futures contracts above the price of the nearer-term futures contracts (‘‘contango’’). The relative in-crease in the price of longer-term futures contracts has provided a financial incentive for oil companies and refiners to purchase addi-tional oil and put it into inventory.
VerDate 0ct 09 2002 09:54 Aug 01, 2006 Jkt 028640 PO 00000 Frm 00051 Fmt 6633 Sfmt 6601 C:\DOCS\28640.TXT SAFFAIRS PsN: PAT 2864
0.01
1
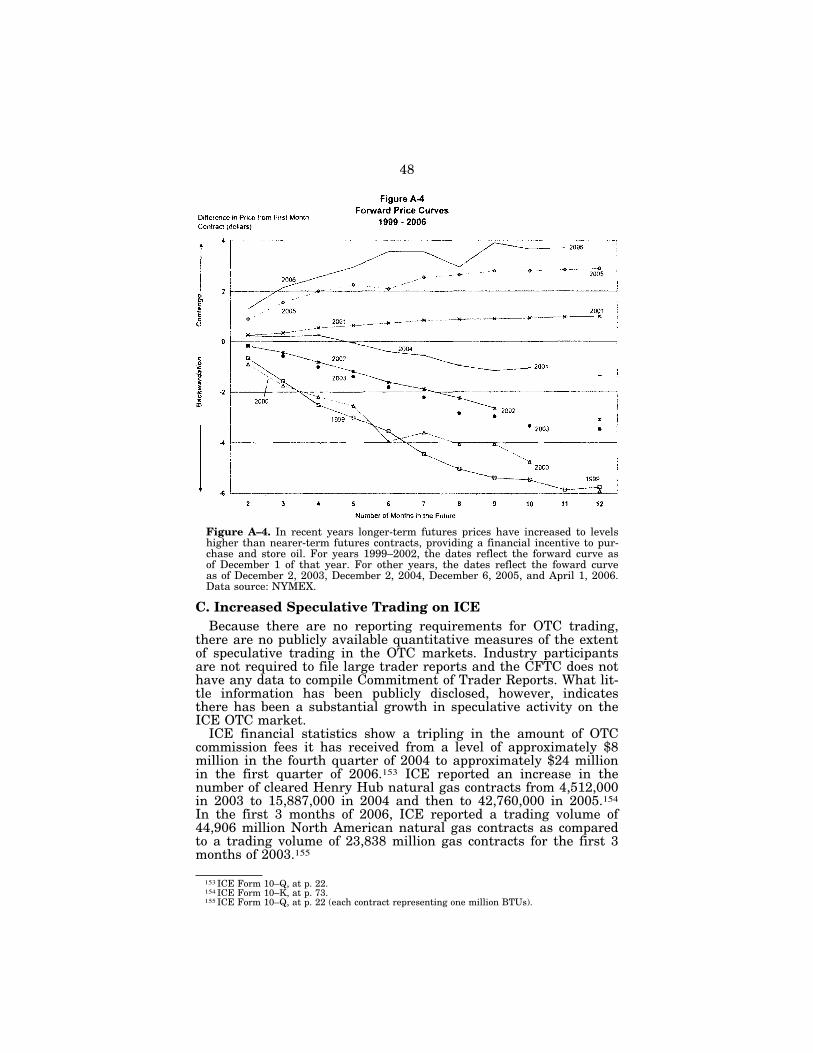
48
153 ICE Form 10–Q, at p. 22. 154 ICE Form 10–K, at p. 73. 155 ICE Form 10–Q, at p. 22 (each contract representing one million BTUs).
Figure A–4. In recent years longer-term futures prices have increased to levels higher than nearer-term futures contracts, providing a financial incentive to pur-chase and store oil. For years 1999–2002, the dates reflect the forward curve as of December 1 of that year. For other years, the dates reflect the foward curve as of December 2, 2003, December 2, 2004, December 6, 2005, and April 1, 2006. Data source: NYMEX.
C. Increased Speculative Trading on ICE Because there are no reporting requirements for OTC trading,
there are no publicly available quantitative measures of the extent of speculative trading in the OTC markets. Industry participants are not required to file large trader reports and the CFTC does not have any data to compile Commitment of Trader Reports. What lit-tle information has been publicly disclosed, however, indicates there has been a substantial growth in speculative activity on the ICE OTC market.
ICE financial statistics show a tripling in the amount of OTC commission fees it has received from a level of approximately $8 million in the fourth quarter of 2004 to approximately $24 million in the first quarter of 2006.153 ICE reported an increase in the number of cleared Henry Hub natural gas contracts from 4,512,000 in 2003 to 15,887,000 in 2004 and then to 42,760,000 in 2005.154 In the first 3 months of 2006, ICE reported a trading volume of 44,906 million North American natural gas contracts as compared to a trading volume of 23,838 million gas contracts for the first 3 months of 2003.155
VerDate 0ct 09 2002 09:54 Aug 01, 2006 Jkt 028640 PO 00000 Frm 00052 Fmt 6633 Sfmt 6601 C:\DOCS\28640.TXT SAFFAIRS PsN: PAT 2864
0.01
0

49
156 The term ‘‘local’’ refers to an individual who commits his or her own capital for speculative trading on an electronic exchange. A ‘‘proprietary trader’’ is a professional trader hired by a firm to trade that firm’s money. See, e.g., Jim Kharouf, Prop Shops and Trading Schools Raise the Bar, Stocks, Futures & Options Magazine, January 2004.
The ICE financial statistics indicate that a large part of this growth can be attributed to increased trading by hedge funds, man-aged money, and individual speculators. Table A–2 provides the most recent breakdown provided by ICE of the composition of ICE participants.
Table A–2ICE OTC Participants
OTC Participants Trading(as % of total commissions)
Year ended December 31,
2003 2004 2005
Commercial companies (including merchant energy) 64.1 56.5 48.8
Banks and financial institutions 31.3 22.4 20.5
Hedge funds, locals and proprietary trading shops 156 4.6 21.1 30.7
Table A–2. Hedge funds and other speculators have significantly increased their use of OTC electronic markets. Data source: ICE Form 10–K, at p. 73.
Æ
VerDate 0ct 09 2002 09:54 Aug 01, 2006 Jkt 028640 PO 00000 Frm 00053 Fmt 6633 Sfmt 6011 C:\DOCS\28640.TXT SAFFAIRS PsN: PAT