Embed Size (px)
Citation preview
T
Project: B7-6201/99-034-/DEV/FT-
THE UNDERLYING CAUSES AND IMPACTS OF FIRES IN INDONESIA
THE ROLE OF FIRE IN CHANGING LAND USE AND LIVELIHOOD IN PETAPAHAN AREA, RIAU PROVINCE
S. Suyanto1, Rizki Pandu Permana1, Noviana Khususiyah1, Iwan Kurniawan2 and Grahame Applegate2
1 World Agroforestry Centre (ICRAF) 2 Centre for International Forestry Research (CIFOR)
November 2001
This study is being conducted with the financial contribution of the European Commission SCR Common Service for External Relation Budget Line (B7-6201) as well as the Centre for International Research and the World Agroforestry Centre (ICRAF). The authors are solely for all the opinions in this document that does not necessarily reflect the opinions of the European Commission and CIFOR/ICRAF.
Corresponding author and contact address:
Dr. SUYANTO
World Agroforestry Centre
ICRAF Southeast Asia Regional Office
Jl. CIFOR, Situ Gede, Sindang Barang, Bogor, 16680
Map design: Rizki Pandu Permana and Danan P. Hadi
Layout design: Rizki Pandu Permana

The Underlying Causes and Impacts of Fire in Indonesia i
TABLE OF CONTENTS
ABBREVIATIONS AND TERMS ....................................................................... IV
ACKNOWLEDGMENTS.......................................................................................V
SUMMARY........................................................................................................... VI
1. INTRODUCTION ............................................................................................1
2. SITE DESCRIPTION ......................................................................................3
3. METHODOLOGY.........................................................................................12
3.1 SOCIO-ECONOMIC STUDY METHODS ..........................................................12 3.2 REMOTE SENSING AND GIS........................................................................12
3.2.1 Landscape level mapping and change analysis..................................12 3.2.2 Derivation of fire hot spots................................................................14 3.2.3 Integration of social science and remote sensing using GIS...............14
4. RESULTS .......................................................................................................15
4.1 LAND COVER AND LAND USE CHANGES.....................................................15 4.2 QUANTITATIVE LANDSCAPE MAPPING AND CHANGES ANALYSIS ..................18 4.3 FIRE HOTSPOTS ANALYSIS ..........................................................................21 4.4 FIRES INFORMATION FROM FIELD SURVEYS.................................................23
4.4.1 Fires as a tool in land preparation by oil palm companies. ...............23 4.4.2 Fires as a tool in land preparation for industrial timber plantations .26 4.4.3 Fire as a tool in land preparation by smallholders ............................29
4.5 LAND TENURE CONFLICTS .........................................................................31
5. UNDERLYING CAUSES OF FIRE..............................................................37
6. POLICY IMPLICATIONS............................................................................38
7. REFERENCES ...............................................................................................39
APPENDICES........................................................................................................40
APPENDIX I: OVERVIEW OF OIL PALM DEVELOPMENT IN INDONESIA...........................................................................................................40
APPENDIX II: OVERVIEW OF INDUSTRIAL TIMBER PLANTATION IN INDONESIA...........................................................................................................43
APPENDIX III: CHANGE TRAJECTORY MATRICES ...................................49
The Underlying Causes and Impacts of Fire in Indonesia ii
LIST OF FIGURE
Figure 2-1. Map of Riau Province, the red box is Petapahan site research. ..................3
Figure 2-2. Map of Petapahan Site..............................................................................4
Figure 2-3. Batu Gajah Settlement..............................................................................6
Figure 2-4. Spontaneous migrants developed oil palm along the CALTEX road.........7
Figure 2-5. PT Sawit 1 established oil palm plantation for Petapahan Community......9
Figure 2-6. Timber Plantation of PT Akasia. ............................................................10
Figure 2-7. Landscape level sketch map of Petapahan site. .......................................11
Figure 3-1. Satellite imagery selected for the Riau site .............................................13
Figure 4-1. Sketch map of logging company (HPH) concession in site research. ......16
Figure 4-2. Land cover classifications 1992-1998-2000............................................19
Figure 4-3. Hotspot 1997 over 1998 land cover map.................................................22
Figure 4-4. Heavy equipments usually used for land preparation in mechanical system and those machines significantly increased the cost of land preparation. .............................................................................................27
Figure 4-5. Sketch map of land tenure conflict and encroachment problem in PT Akasia.....................................................................................................34
Figure 4-6. Farmer perception about their refusing for helping fire fighting at timber plantation.....................................................................................36
Figure I-1. Oil palm plantation area in Indonesia ......................................................40
Figure I-2. Distribution of oil palm plantation area by island in 1999. ......................41
Figure II-1. Distribution of establishment timber plantation in Indonesia by Island....44

The Underlying Causes and Impacts of Fire in Indonesia iii
LIST OF TABLE
Table 3-1. Imagery used for the analysis ..................................................................12
Table 4-1. Logging companies (HPH) who had operated in site research..................15
Table 4-2. Establishment years of regular transmigration in site research..................17
Table 4-3. Planted area of PT Sawit 4 for each regular transmigration. .....................17
Table 4-4. Establishment and released years of NES transmigration in site research...................................................................................................18
Table 4-5. Cumulative land cover change estimates 1992–1998 ...............................20
Table 4-6. Cumulative land cover change estimates 1998-2000................................21
Table 4-7. Result on overlapping the 1997 hotspot on 1998 land cover map .............22
Table 4-8. Planted area of Oil Palm Plantation in study site. .....................................24
Table 4-9. Cost comparison of land preparation techniques in PT Sawit 1. ...............25
Table 4-10. Cleared and planted areas of PT Akasia. .................................................26
Table 4-11. Cost comparison of land preparation techniques in PT Akasia. ...............27
Table 4-12. Average area of land holding by different land use (ha) ..........................29
Table 4-13. Percentage of trees planted of communities. ...........................................29
Table 4-14. Percentage of farmer’s perception about sanction if fire is spreading ......30
Table 4-15. Percentage of community’s perception about zero burning techniques ....30
Table 4-16. Percentage of community’s perceptions about fires at different land use type...................................................................................................36
Table I-1. Oil Palm Plantation by Province In Sumatra for the last ten years............42
Table II-1. Allocated areas for timber plantation (until 1998). ...................................43
Table II-2. Development of Timber Plantation in Indonesia ......................................45
Table II-3. Timber Plantation Concession and Establishment Area in Riau Province..................................................................................................46
Table II-4. Timber plantation areas in Riau that claimed by surrounding communities ...........................................................................................47

The Underlying Causes and Impacts of Fire in Indonesia iv
ABBREVIATIONS AND TERMS
Adat rights Customary ownership or use rights recognized by local customary law
AVHRR Advanced Very High Resolution Radiometer
EU European Union
EC European Commission
EU-JRC Joint Research Centre of the European Union
HH Household
ha Hectare
KKPA Credit system from the government for the member of cooperative. In this case, the cooperative lend money from the bank for built the oil palm plantation, and they choose a company for being their partner to built and managed the estate. The company will give the whole area and its management to the cooperative member after the first harvest.
km Kilometre
LAPAN Lembaga Penerbangan dan Antariksa
m Meters
MDF Medium Density Fibreboard
NES Nucleus Estate Smallholder project, a government-sponsored plantation development program in which transmigrant receive title to a portion of the developed plantation project
NOAA National Oceanic and Atmospheric Administration, USA
RTRWP Provincial land use plan
Stakeholders People or groups of people interested or responsible for forest management, including landowners, local communities, industry and government organizations.
TRFIC Tropical Rain Forest Information Center

The Underlying Causes and Impacts of Fire in Indonesia v
ACKNOWLEDGMENTS
The support of the European Commission through a research grant to determine the
underlying causes and impacts of fire in Indonesia is gratefully acknowledged. The
research results reported here is part of that study. The scientists at CIFOR and
ICRAF would like to thank the Tropical Research Information Centre and the
Michigan State University, NOAA and LAPAN in Indonesia for facilitating the
purchase of the necessary satellite imagery used in the research. Thanks go to the EU
funded Forest Fire Prevention and Control Project in Palembang for providing fire
hotspot data. We thank M. Harir Khodari and Pedi Nopialdi for their excellent
assistance in the field along with staff from oil palm and plantation companies and
Forestry Officials in Riau for their cooperation during our interviews. We are also
grateful to the respondents in all villages in Petapahan for their cooperation and
patience during the interviews.

The Underlying Causes and Impacts of Fire in Indonesia vi
SUMMARY
This report describes an analysis of the underlying causes of fire in Petapahan, Riau
Province, Sumatra, Indonesia. The site is located in an expired logging concession
and consists mostly of oil palm plantations, industrial timber plantations and
transmigration and local community settlements. Socio-economic research and hot-
spot analysis suggest that fires used in land clearing for oil palm and timber
plantations and the development of transmigration settlements were the most common
cause of vegetation fires in the site. The development of timber plantation and oil
palm plantation has also created land tenure conflicts between communities and
companies. In many cases, tenure conflict often become a trigger for forest and land
fire as fire is often used to destabilize livelihoods as a means of forcing the vacation
of an area. The nature of partnerships between communities and companies in the
development of oil palm and timber plantations is also a very important factor in
reducing the incidence of fire as communities with partnerships have a vested interest
in protecting their assets.
The Underlying Causes and Impacts of Fire in Indonesia 1
1. INTRODUCTION
The focus of this report is the study site of Petapahan in Riau Province, Sumatra. The
site represents a case study of the use of fire for industrial timber and oil palm
plantation development, transmigration and local communities as a tool for land
preparation. Many institutions including government agencies and environmental
NGOs believe that large-scale land clearing for plantations of fast growing trees for
pulpwood and oil palm were a major cause of fire in 1997 and 1998.
The development of industrial timber plantations was planned in the Five Year Plan
(Repelita IV) in 1984. By the end of October 1998, 5.6 million ha land had been
allocated for establishing timber plantations. By 1999/2000, only 2.4 million ha or
less than 50 percent of the total area of land allocated had been planted. Appendix I
show an overview of industrial timber plantations in Indonesia. Similarly, there was
rapid development of oil palm plantations in Indonesia (Casson, 2000), which has
increased from 120,000 ha in 1969 to almost 3.0 million ha in 1999 as shown in
Appendix II.
Fire is commonly used in land clearing for oil palm and timber plantation, because it
is cheap and effective (Tomich et al. 1998b). Previous studies have shown that the
development of oil palm and timber plantations contributed significantly to fire and
smoke problems in Indonesia, (Barber and Schweithelm 2000, ADB/Bappenas 1999;
Applegate et al. 2001).
The allocation of land for the plantation developments has often been undertaken
without recognising the rights of local people who already occupy and cultivate the
land. Fires are often used to force local communities from their land (Tomich et al.,
1998a). The feeling of perceived injustice by small holders decreases their incentive
to control the spread of fire to large-scale tree plantations (Suyanto et al. 2000). As a
consequence of land tenure conflicts, local communities frequently burn plantation
grown trees that have been established by large companies (Suyanto et al. 2000).
Since the start of the political reformation period in Indonesia in mid-1998, the
manifestation of land tenure conflicts between local communities and large companies
has increased (Suyanto et al. 2000). There are increasing visual signs of violence and

The Underlying Causes and Impacts of Fire in Indonesia 2
burning of property, as companies can no longer rely on armed security to quell the
unrest.
The objective of the research is to study the impact of fire on the development
industrial timber and oil plantation and transmigration areas and its role in land tenure
conflicts with the communities that live around the timber and oil palm plantation
areas.
Two approaches to the study have been developed; the landscape level and site wide
level. The landscape level (Landsat TM-level) study concentrates on general land
cover type and change over time and compares this pattern with the site wide level
findings. At the site wide level, the study focuses on the relationship between fire and
land cover change, while the location of the fires came from hotspot analysis and
fieldwork. A general level analysis was also carried out to determine fire density
from the hotspot number comparisons for the whole of Sumatra Island and those in
the province and the site.
The site was chosen for a number of reasons. For the last ten years, the rate of
deforestation on this site has been high. Land use and land cover has changed
dramatically. Those changes have triggered the fire issue in this site.
The Underlying Causes and Impacts of Fire in Indonesia 3
2. SITE DESCRIPTION
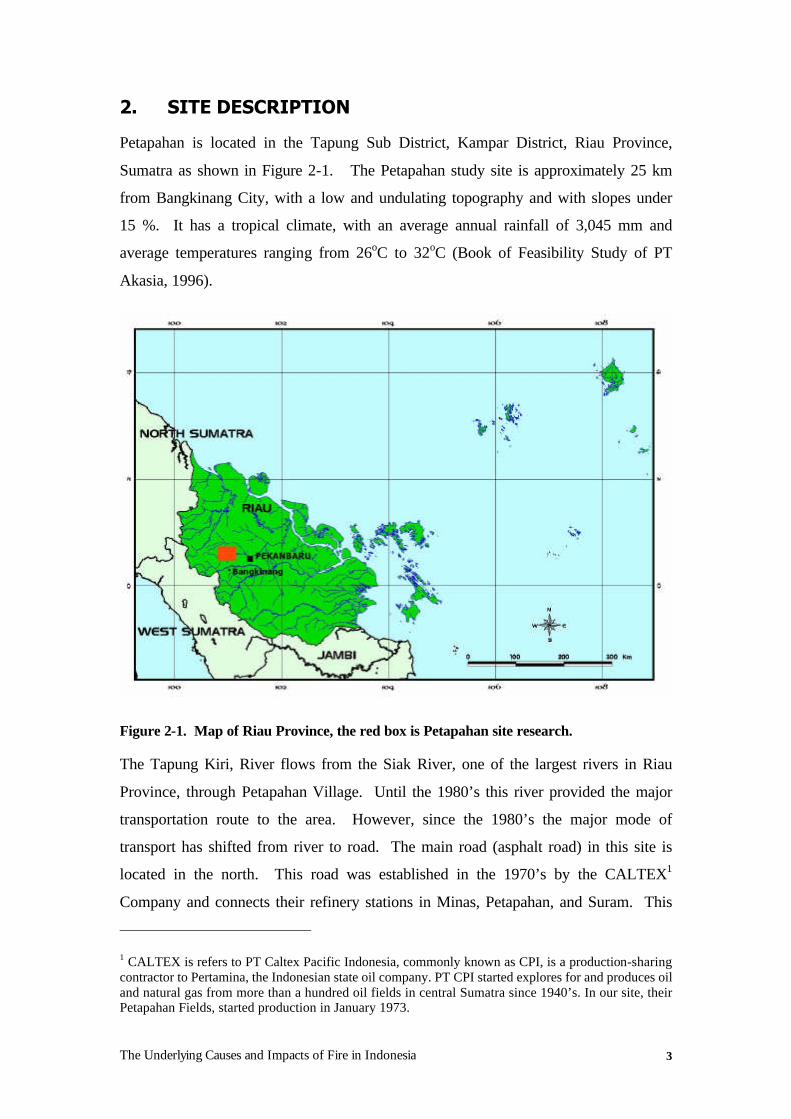
Petapahan is located in the Tapung Sub District, Kampar District, Riau Province,
Sumatra as shown in Figure 2-1. The Petapahan study site is approximately 25 km
from Bangkinang City, with a low and undulating topography and with slopes under
15 %. It has a tropical climate, with an average annual rainfall of 3,045 mm and
average temperatures ranging from 26oC to 32oC (Book of Feasibility Study of PT
Akasia, 1996).
Figure 2-1. Map of Riau Province, the red box is Petapahan site research.
The Tapung Kiri, River flows from the Siak River, one of the largest rivers in Riau
Province, through Petapahan Village. Until the 1980’s this river provided the major
transportation route to the area. However, since the 1980’s the major mode of
transport has shifted from river to road. The main road (asphalt road) in this site is
located in the north. This road was established in the 1970’s by the CALTEX1
Company and connects their refinery stations in Minas, Petapahan, and Suram. This
1 CALTEX is refers to PT Caltex Pacific Indonesia, commonly known as CPI, is a production-sharing contractor to Pertamina, the Indonesian state oil company. PT CPI started explores for and produces oil and natural gas from more than a hundred oil fields in central Sumatra since 1940’s. In our site, their Petapahan Fields, started production in January 1973.
The Underlying Causes and Impacts of Fire in Indonesia 4
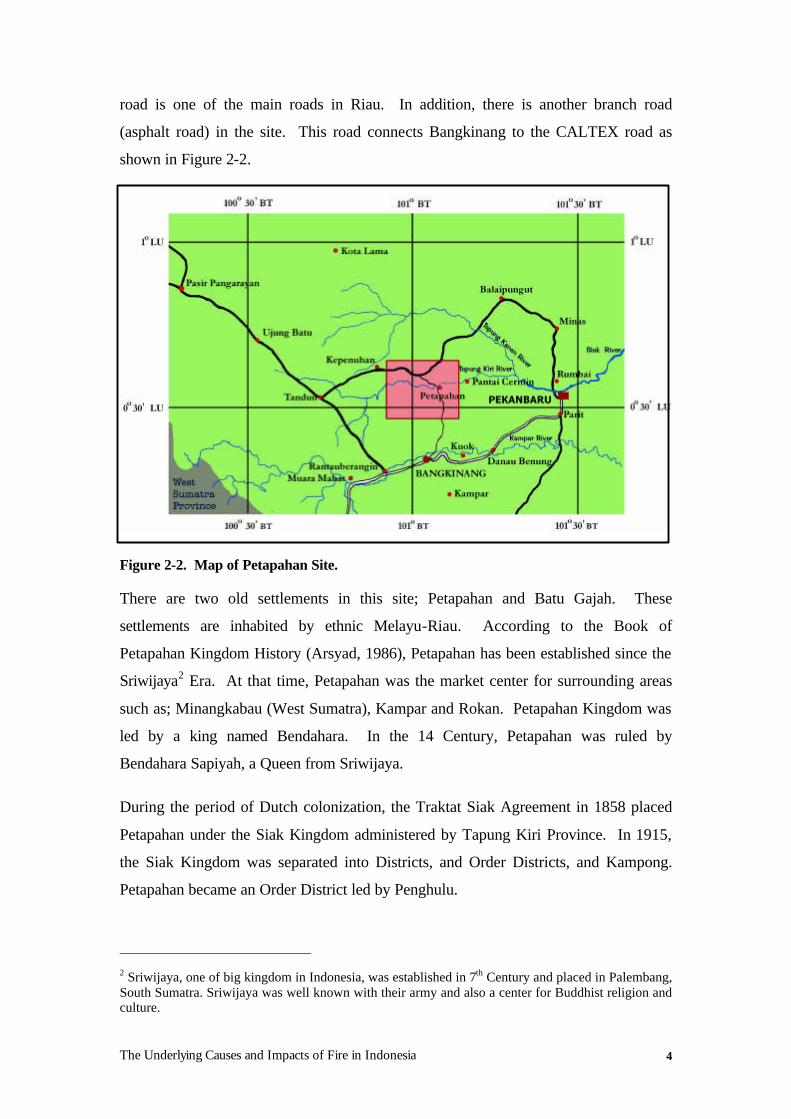
road is one of the main roads in Riau. In addition, there is another branch road
(asphalt road) in the site. This road connects Bangkinang to the CALTEX road as
shown in Figure 2-2.
Figure 2-2. Map of Petapahan Site.
There are two old settlements in this site; Petapahan and Batu Gajah. These
settlements are inhabited by ethnic Melayu-Riau. According to the Book of
Petapahan Kingdom History (Arsyad, 1986), Petapahan has been established since the
Sriwijaya2 Era. At that time, Petapahan was the market center for surrounding areas
such as; Minangkabau (West Sumatra), Kampar and Rokan. Petapahan Kingdom was
led by a king named Bendahara. In the 14 Century, Petapahan was ruled by
Bendahara Sapiyah, a Queen from Sriwijaya.
During the period of Dutch colonization, the Traktat Siak Agreement in 1858 placed
Petapahan under the Siak Kingdom administered by Tapung Kiri Province. In 1915,
the Siak Kingdom was separated into Districts, and Order Districts, and Kampong.
Petapahan became an Order District led by Penghulu.
2 Sriwijaya, one of big kingdom in Indonesia, was established in 7th Century and placed in Palembang, South Sumatra. Sriwijaya was well known with their army and also a center for Buddhist religion and culture.
The Underlying Causes and Impacts of Fire in Indonesia 5
The Japanese removed the kingdom system in Riau during their occupation, and the
kingdom was renamed Riau Syu Cokan. The District changed to Gun and was led by
Gunco. The Order District changed into Ku and was led by Kuco, and in each
kampong, a penghulu was appointed. Petapahan became the capital of Tapung Kiri
Kuco in 1977.
Under the Bupati Kampar Agreement No. 17/Kpts/1/2/1977, Petapahan became a
village and was led by a Wali Desa. The village consisted of 2 hamlets, Kampung
Asli and RK Petapahan Pillial (near the Caltex Oil Refinery Station). Recently,
Petapahan was divided into 3 sub-villages; sub-village 1st, 2nd, and 3rd.
Local communities have undertaken shifting cultivation for a long time in this area.
Most of the Petapahan communities cultivated areas along the Tapung Kiri River and
established upland rice fields. During the Japanese colonisation period in the 1940s,
120 ha of wet rice fields were established, but these stopped production in 1972 due to
pest attacks. Some villagers obtained private land and planted tree crops (mostly
rubber trees) under communal ownership. At present, rubber gardens are mainly
located along the Tapung Kiri River.
The second largest settlement is Batu Gajah, which has existed since the Dutch
colonised Indonesia. The name of Batu Gajah came from the community's oral
history, and the belief that there was a group of elephants, which ate the Kapau plant,
and they became so thirsty, they drank water from the Tapung Kiri River. After that,
they became intoxicated. Communities believe, if the Tapung Kiri River dries up,
they will see the elephant’s back and soon the river will flow again.
Formerly, Batu Gajah was an isolated settlement. The main transportation was via the
Tapung Kiri River. In the 1970’s, a logging company (HPH) improved the
accessibility by constructing a road for their logging activities. This accessibility also
increased migration from Batu Gajah to outside the area. In 1980’s, there were a
number of work projects such as road works, transmigration contracts and plantation
developments, and this caused the people to move away from their settlement to
worked abroad. As a result, in 1984, the Batu Gajah settlement was empty.

The Underlying Causes and Impacts of Fire in Indonesia 6
In 1996, PT Akasia3, obtained a concession to develop timber plantations. They
marked a 500 ha enclave for the Batu Gajah settlement and deleted this from their
concession area. Road establishment has now improved accessibility to the Batu
Gajah settlement. In 1996, 8 households (HH) of Batu Gajah returned and began to
rebuild the settlements (See Figure 2-3). Recently, the number of households has
grown to 45 HH. Five of these are not locals from Batu Gajah. These households are
primarily fishermen and farmers raising rice, chilly, and tomatoes. They also planted
oil palm, but the elephants destroyed these. Datuk (Communal Leader) provides the
regulation relating to land tenure. He allows anyone in this community who has the
ability and willingness to open and manage land. Commonly, each HH is able to
open 2-4 ha of land.
In 1998, the Batu Gajah communities invited Bupati Kampar to return to this area and
also announced to all the Batu Gajah communities to return to their settlement. Based
on the interview, one of reasons for their return was to claim their customary land
(tanah ulayat). They objected to the forest being cleared by PT Akasia and insisted
their customary land be returned.
Figure 2-3. Batu Gajah Settlement.
3 Pseudonyms are used throughout to protect the privacy of those interviewed (oil palm and timber plantation companies and transmigration settlements).
The Underlying Causes and Impacts of Fire in Indonesia 7
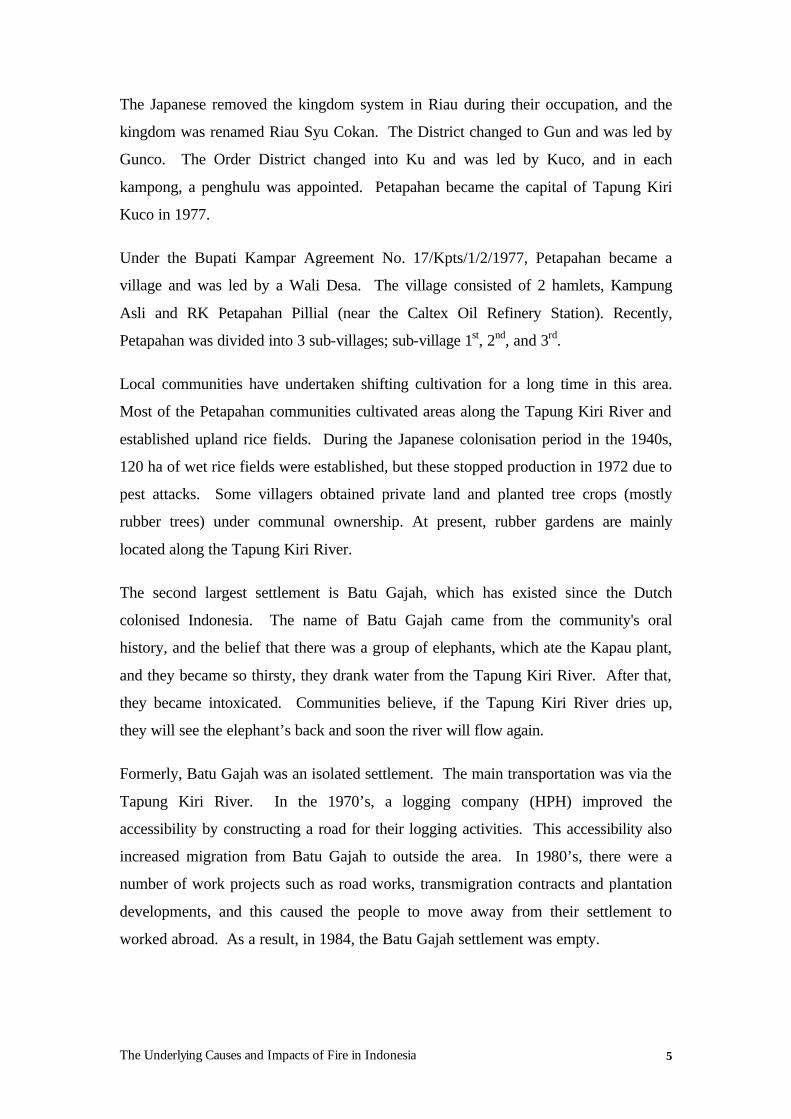
By 2001 the number of households in Petapahan was 812 and in Batu Gajah was 45.
The population of local ethnic groups in those two settlements in 2000 was
approximately 223 HH. Compared to other ethnic groups, the proportion of the local
ethnic population in the study site is very low (20 %). Following the establishment of
transmigration schemes in 1984, the ethnic Javanese and Sundanese have become the
major ethnic groups in this site. In addition, spontaneous migration from North
Sumatra (Batak and Javanese) occurred after 1984 and increased until the 1990’s.
These migrants live in 3rd sub-village of Petapahan, which is located along the
CALTEX road as shown in Figure 2-4.
Figure 2-4. Spontaneous migrants developed oil palm along the CALTEX road.
Transmigration areas were established in the 1980’s. There are two types of
transmigration schemes, which are the Regular Transmigration and the
Transmigration with NES4 (Nucleus Estate and Smallholders) scheme. The Regular
Transmigration settlement was established in 1985, and consists of five settlement
units. In 1991, those five settlements were converted into villages with a population
of 2,024 HH. The villages are SP1, SP2, SP3, SP4, and SP5. In 1997, they joined PT
Sawit 4 as a company partner to develop oil palm plantation using KKPA5 (Koperasi
Kredit Primer untuk Anggota - Primer Cooperative Credit for Member) scheme.
4 NES (Nucleus Estate for Smallholders) is a joint cooperation between a private company or state and the community/smallholders. The company built the plantation area for themselves (nucleus) and smallholders. The smallholders harvest the fruits and have to sell it for crushing to its company industries. 5 KKPA (Koperasi Kredit Primer untuk Anggota) is a credit system from the government for the member of cooperative. In this case, the cooperative lend money from the bank for built the oil palm plantation, and they choose a company for being their the partner to built and managed the estate. The company will give the whole area and its maintenance to the cooperative member after the first harvest.
The Underlying Causes and Impacts of Fire in Indonesia 8
The other transmigration scheme is transmigration with NES, and was established in
1991. There were five transmigration units and PT Sawit 1 was a partner company for
developing and managing their oil palm plantations. The villages are NES 1, NES 2,
NES 3, NES 4, and NES 5. Since 1996, the oil palm plantations have been transferred
to the farmers.
Currently, the major land use in this site is oil palm plantation owned both by large
corporations and smallholder farmers. There are four oil palm companies in this site;
PT Sawit 3, PT Sawit 2, PT Sawit 1 and PT Sawit 4. The first two companies, PT
Sawit 3 and PT Sawit 2 manage only their own private oil palm plantations. The last
two companies manage oil palm plantations through a partnership with farmers. The
partnership types, however, are different. PT Sawit 1 follows the NES schemes and
PT Sawit 4 follows the KKPA scheme. PT Sawit 1 was the first company to establish
oil palm plantations and has the largest area of oil palm plantation. They commenced
in 1990, through the NES scheme and built a partnership with five transmigration
settlements. As of March 2001 they had planted almost 8,500 ha
In the period 1991 to 1993, PT. Sawit 1 developed 4,461 ha of oil palm plantation
with the NES scheme involving five transmigration settlements; NES 1 Village, NES
2 Village, NES 3 Village, NES 4 Village and NES 5 Village. The company continues
to assist the transmigrants with advisory help on pest and disease problems, fertilizer
distribution and purchasing. Recently (March 2001), PT Sawit 1 also began another
partnership as a Farmer Cooperative for Petapahan Community (KOPTAMASTA-
Koperasi Tani Masyarakat Petapahan) to develop and manage oil palm plantation
under the KKPA scheme as shown in Figure 2-5.
The other company, PT Sawit 2, developed oil palm plantations based on Government
Degree for Released Area No. 486/Kpts-II/1991 dated August 1st, 1991, and has an
area of 1,753 ha. Most of the concession however, was cultivated land of Petapahan
community, who live in areas surrounding the concession. Thus, PT Sawit 2 has paid
compensation to the community for developing their oil palm plantation.
The establishment of oil palm started in 1990 and in 1999 all concession areas had
been planted. They added to the concession area in 1996 approximately 1,000 ha and
recently they’ve developed a further 2,571.17 ha. One of PT Sawit 3 concession areas

The Underlying Causes and Impacts of Fire in Indonesia 9
is in Petapahan. It is approximately 4,300 ha. This area was formerly developed and
managed by PT Sawit 6. PT Sawit 6 is in the same company group as PT Sawit 3.
The area was opened in 1991 and by 1995, the whole concession area had been
planted. In 1995, PT Sawit 3 took over the management of the estate. In 1995, PT
Sawit 3 began to replant some of the area, because elephants had destroyed much of
the young plantations. The re-planting continued until 1997.
Figure 2-5. PT Sawit 1 established oil palm plantation for Petapahan Community
In 1995, PT Sawit 4 offered a partnership under KKPA scheme to six regular
transmigration settlements (five of them were in the study site). Almost all the
transmigrants joined the KKPA scheme and gave their land to the company. PT Sawit
4 collaborated with KUD (Koperasi Unit Desa - Village Unit Cooperative) Sawit
Jaya, to establish oil palm plantation. KUD Sawit Jaya is a joint venture between six
KUD in those villages. The villages are: SP1, SP2, SP3, SP4, SP5, and SP6. By
2001, PT Sawit 4 had established 5,105 ha of oil palm plantation.
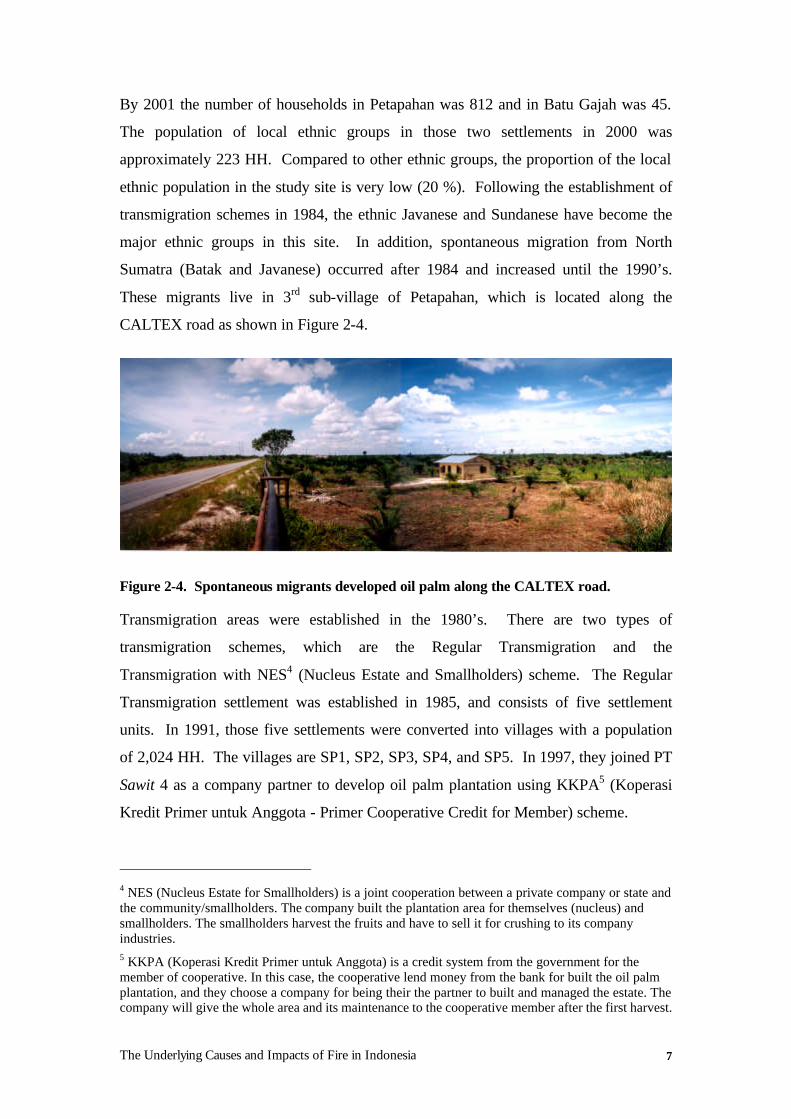
The second major land use is timber plantation as shown in Figure 2-6, which covers
almost 12,925 ha. The company commenced the development of timber plantations
in 1996. The timber plantation is owned by PT Akasia, who obtained 31,415 ha of
concession area. This area was formerly a logging concession belonging to PT
Tanjung Budi Sari and PT Indra Pusaka. However, based on the feasibility study that
was conducted in 1996, around one third of the concession was occupied by the local
community. In order to avoid conflict with local communities, PT Akasia reduced the
concession area to 19,095 ha. Around 6,000 ha were allocated for conservation,
The Underlying Causes and Impacts of Fire in Indonesia 10
infrastructure, and research. Unlike the oil palm development schemes, there was no
scheme for developing a partnership with farmers for this timber plantation. The
company hired only 5% of its workforce from the local community to work in their
company. This has caused continuing problems with the community.
Figure 2-6. Timber Plantation of PT Akasia.
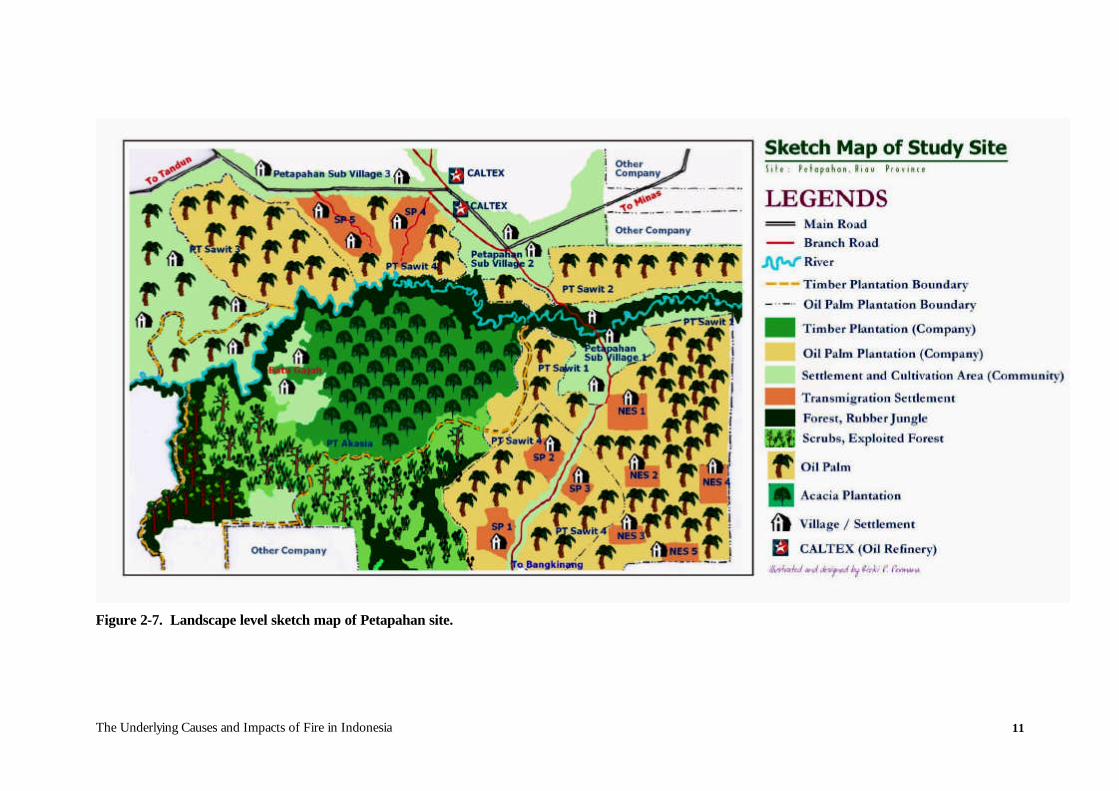
More detail site description focusing on land use characterisation can be seen in
sketch map of study site (Figure 2-7).
The Underlying Causes and Impacts of Fire in Indonesia 11
Figure 2-7. Landscape level sketch map of Petapahan site.
The Underlying Causes and Impacts of Fire in Indonesia 12
3. METHODOLOGY
3.1 Socio-Economic Study Methods
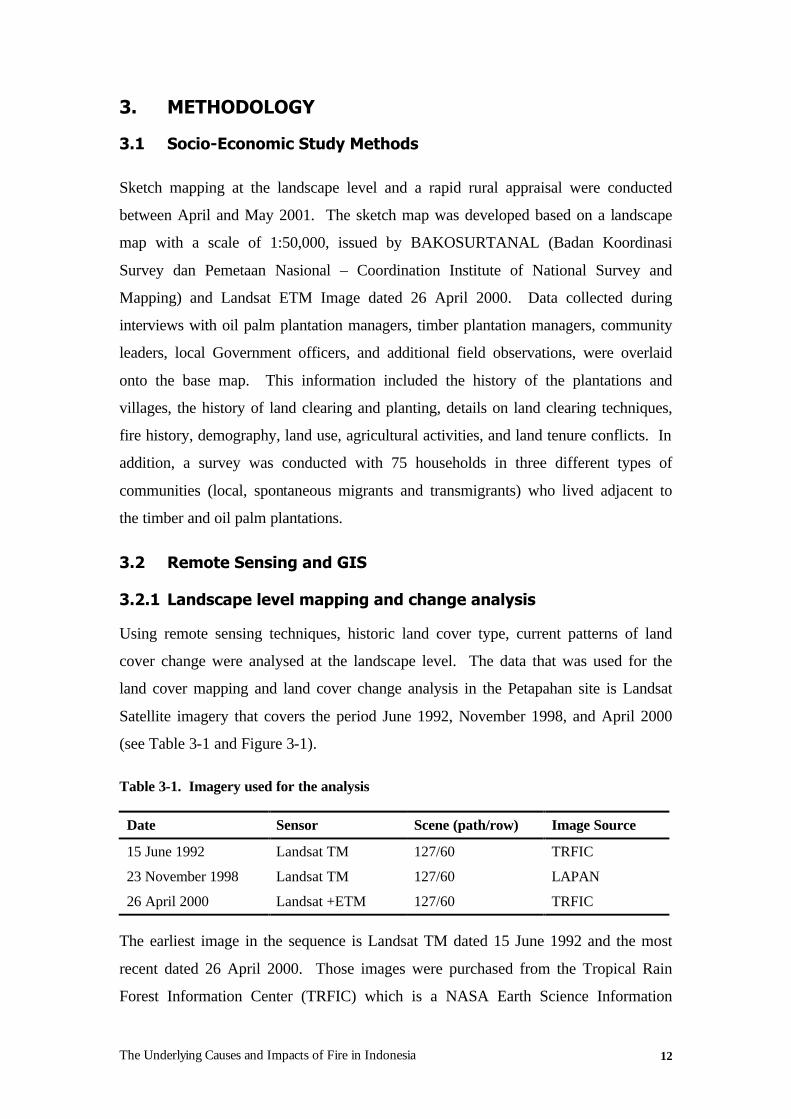
Sketch mapping at the landscape level and a rapid rural appraisal were conducted
between April and May 2001. The sketch map was developed based on a landscape
map with a scale of 1:50,000, issued by BAKOSURTANAL (Badan Koordinasi
Survey dan Pemetaan Nasional – Coordination Institute of National Survey and
Mapping) and Landsat ETM Image dated 26 April 2000. Data collected during
interviews with oil palm plantation managers, timber plantation managers, community
leaders, local Government officers, and additional field observations, were overlaid
onto the base map. This information included the history of the plantations and
villages, the history of land clearing and planting, details on land clearing techniques,
fire history, demography, land use, agricultural activities, and land tenure conflicts. In
addition, a survey was conducted with 75 households in three different types of
communities (local, spontaneous migrants and transmigrants) who lived adjacent to
the timber and oil palm plantations.
3.2 Remote Sensing and GIS
3.2.1 Landscape level mapping and change analysis
Using remote sensing techniques, historic land cover type, current patterns of land
cover change were analysed at the landscape level. The data that was used for the
land cover mapping and land cover change analysis in the Petapahan site is Landsat
Satellite imagery that covers the period June 1992, November 1998, and April 2000
(see Table 3-1 and Figure 3-1).
Table 3-1. Imagery used for the analysis
Date Sensor Scene (path/row) Image Source
15 June 1992 Landsat TM 127/60 TRFIC
23 November 1998 Landsat TM 127/60 LAPAN
26 April 2000 Landsat +ETM 127/60 TRFIC
The earliest image in the sequence is Landsat TM dated 15 June 1992 and the most
recent dated 26 April 2000. Those images were purchased from the Tropical Rain
Forest Information Center (TRFIC) which is a NASA Earth Science Information

The Underlying Causes and Impacts of Fire in Indonesia 13
Partner based in Michigan State University. The quality of both images is excellent
with no cloud cover that might causes problems with the interpretation process.
Another image in the sequence is dated 23 November 1998. This image was
purchased from Lembaga Penerbangan dan Antariksa (LAPAN) based in Jakarta-
Indonesia. The quality of the image is quite good; cloud cover and drop line error
appeared but are clear enough for accurate interpretation.
Figure 3-1. Satellite imagery selected for the Riau site
Pre-processing of the imagery involved geo-referencing using 1:50,000-scale
topographic map as the base. The map projection used for the imagery is Universal
Transverse Mercator (UTM) zone 47 North with Datum WGS 1984. The image
classification process was carried out digitally using Unsupervised Classification
method. A visual interpretation was used to merge, split and edit the class resulting
from the digital process. The land cover change analysis was undertaken after the
classification of all images was complete. The process was archived using PC ER-
Mapper 6.1. Vector based mapping and analysis for each class individually, including
burn scar mapping with the result processed in PC ArcView 3.2.

The Underlying Causes and Impacts of Fire in Indonesia 14
3.2.2 Derivation of fire hot spots
The 1997 hot-spot data was obtained from Forest Fire Prevention and Control Project
of the European Union based in Palembang, South Sumatera-Indonesia. To obtain a
better idea of the vulnerability of this site to fire, hot-spot densities at the landscape
level were compared to hot-spot densities for the entire Riau Province and Sumatra
Island. Furthermore, hotspot maps were overlaid onto land cover maps of the study
site to investigate the connection between land cover type in the study area and fire.
3.2.3 Integration of social science and remote sensing using GIS
In order to improve the analysis, a methodology was developed that integrates some
of the results of the socio-economic research with the results of the remote sensing-
based land cover mapping and change analysis. A Geographic Information System
(GIS) was used for this integration. Not all outputs from the socio-economic research
are compatible with remote sensing; so the types of output vary slightly. For the
Petapahan site, the focus was on integrating local people’s narratives and sketch
maps. The sketch map can provide additional land cover data that can’t be obtained
from remote sensing techniques due to its limited spatial resolution. Using the
functionality of the GIS, it was possible to calculate the types and more accurately the
size of the land cover changes in the study area rather than doing an individual
analysis with remote sensing or social research only. In addition, local people’s
narratives could be added to the land cover change results to provide an insight into
how and why these changes occurred.
The Underlying Causes and Impacts of Fire in Indonesia 15
4. RESULTS
4.1 Land Cover and Land Use Changes
World Bank (2001) stated that the main causes of deforestation (defined here as the
permanent loss of forest cover) can be grouped into three broad categories: large-scale
conversion to timber or estate crop plantations (in particular, oil palm), smallholder
conversion, and unsustainable and illegal logging. Over the Outer Islands as a whole,
well over 20 million ha of natural forest have been lost over the past twelve years.
This equates to an average overall deforestation rate of 1.7 million ha/yr for the
period. In Sumatra, the total forest area has decreased from 23 million ha to probably
less than 16 million ha (World Bank, 2001).
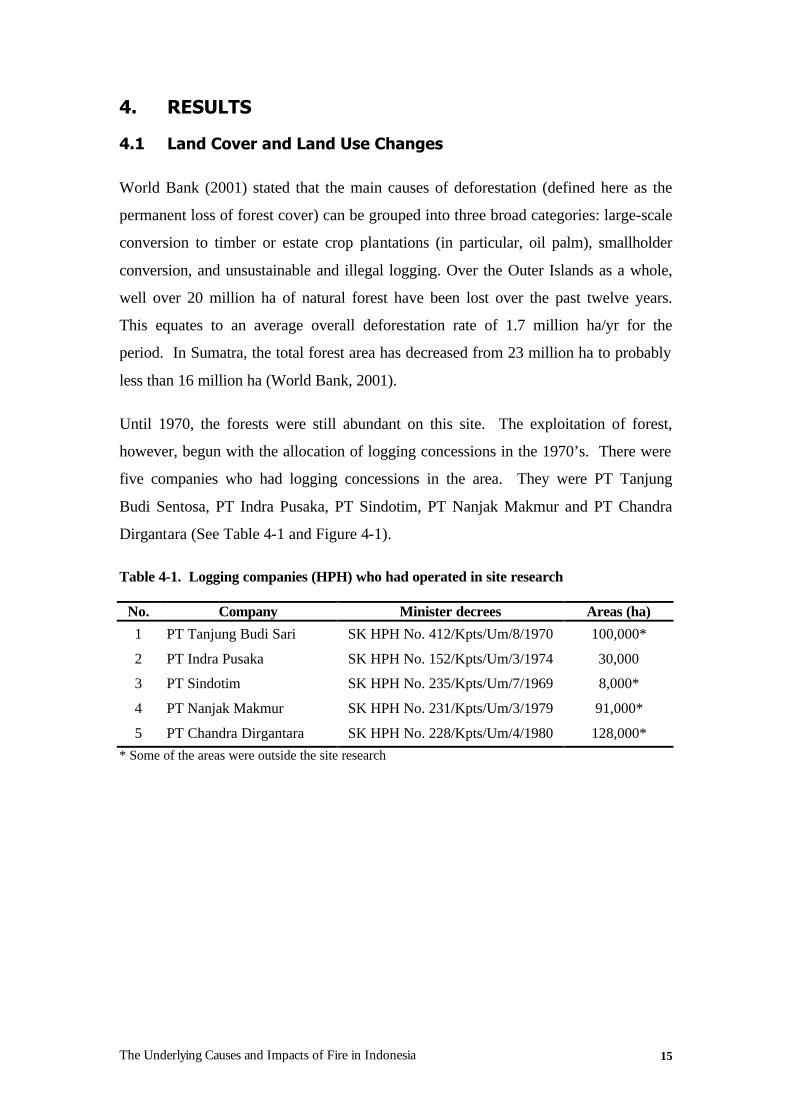
Until 1970, the forests were still abundant on this site. The exploitation of forest,
however, begun with the allocation of logging concessions in the 1970’s. There were
five companies who had logging concessions in the area. They were PT Tanjung
Budi Sentosa, PT Indra Pusaka, PT Sindotim, PT Nanjak Makmur and PT Chandra
Dirgantara (See Table 4-1 and Figure 4-1).
Table 4-1. Logging companies (HPH) who had operated in site research
No. Company Minister decrees Areas (ha)
1 PT Tanjung Budi Sari SK HPH No. 412/Kpts/Um/8/1970 100,000*
2 PT Indra Pusaka SK HPH No. 152/Kpts/Um/3/1974 30,000
3 PT Sindotim SK HPH No. 235/Kpts/Um/7/1969 8,000*
4 PT Nanjak Makmur SK HPH No. 231/Kpts/Um/3/1979 91,000*
5 PT Chandra Dirgantara SK HPH No. 228/Kpts/Um/4/1980 128,000* * Some of the areas were outside the site research
The Underlying Causes and Impacts of Fire in Indonesia 16
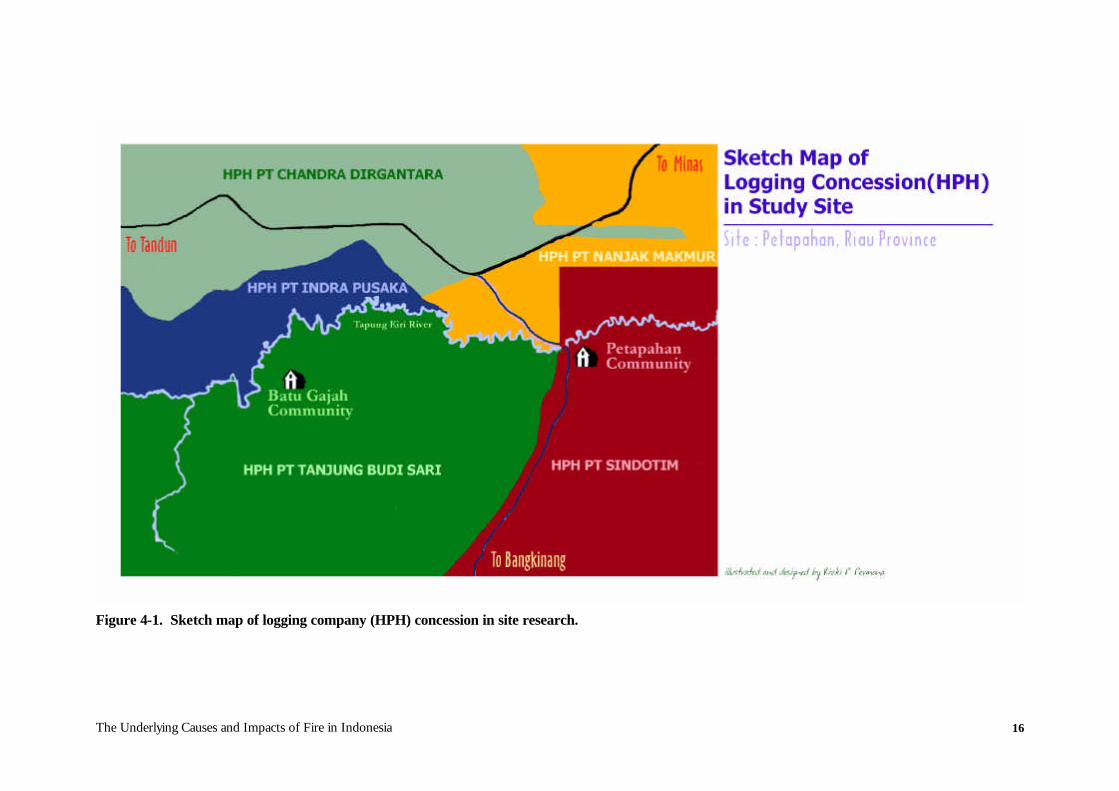
Figure 4-1. Sketch map of logging company (HPH) concession in site research.
The Underlying Causes and Impacts of Fire in Indonesia 17
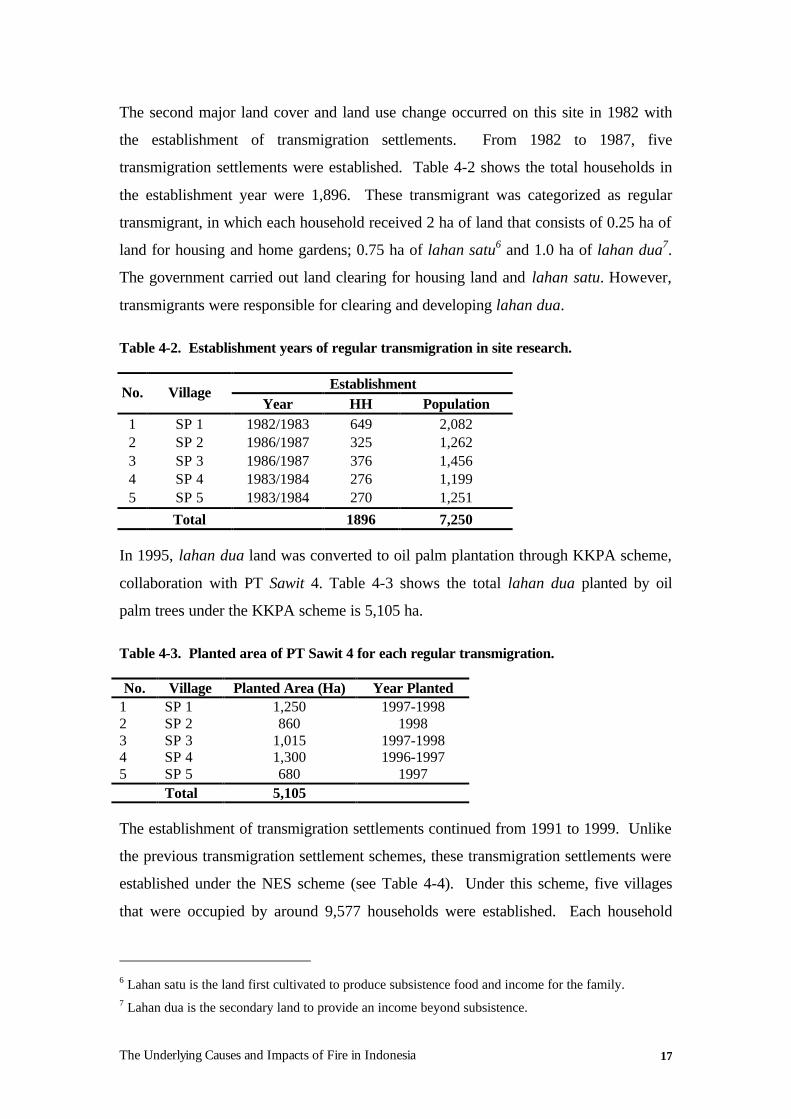
The second major land cover and land use change occurred on this site in 1982 with
the establishment of transmigration settlements. From 1982 to 1987, five
transmigration settlements were established. Table 4-2 shows the total households in
the establishment year were 1,896. These transmigrant was categorized as regular
transmigrant, in which each household received 2 ha of land that consists of 0.25 ha of
land for housing and home gardens; 0.75 ha of lahan satu6 and 1.0 ha of lahan dua7.
The government carried out land clearing for housing land and lahan satu. However,
transmigrants were responsible for clearing and developing lahan dua.
Table 4-2. Establishment years of regular transmigration in site research.
Establishment No. Village Year HH Population
1 SP 1 1982/1983 649 2,082 2 SP 2 1986/1987 325 1,262 3 SP 3 1986/1987 376 1,456 4 SP 4 1983/1984 276 1,199 5 SP 5 1983/1984 270 1,251 Total 1896 7,250
In 1995, lahan dua land was converted to oil palm plantation through KKPA scheme,
collaboration with PT Sawit 4. Table 4-3 shows the total lahan dua planted by oil
palm trees under the KKPA scheme is 5,105 ha.
Table 4-3. Planted area of PT Sawit 4 for each regular transmigration.
No. Village Planted Area (Ha) Year Planted 1 SP 1 1,250 1997-1998 2 SP 2 860 1998 3 SP 3 1,015 1997-1998 4 SP 4 1,300 1996-1997 5 SP 5 680 1997 Total 5,105
The establishment of transmigration settlements continued from 1991 to 1999. Unlike
the previous transmigration settlement schemes, these transmigration settlements were
established under the NES scheme (see Table 4-4). Under this scheme, five villages
that were occupied by around 9,577 households were established. Each household
6 Lahan satu is the land first cultivated to produce subsistence food and income for the family. 7 Lahan dua is the secondary land to provide an income beyond subsistence.

The Underlying Causes and Impacts of Fire in Indonesia 18
received 2.5 ha of land, consisting of 0.5 ha land for housing and home gardens and 2
ha land for oil palm plantations.
Table 4-4. Establishment and released years of NES transmigration in site research.
Establishment Released No.
Unit/Settlement Year HH Pop. Date HH Pop.
1 UPT I (NES 1) 1991/1994 500 2,030 19-01-1996 500 2,311
2 UPT II (NES 2) 1992/1993 540 2,230 26-02-1997 540 2,230
3 UPT III (NES 3) 1993/1994 447 2,119 17-02-1998 460 2,158
4 UPT IV (NES 4) 1994/1995 400 1,566 17-09-1998 400 1,566
5 UPT V (NES 5) 1995/1996/ 1998/1999
402 1,632 14-12-2000 402 1,783
Total 9,577 10,048
The third major land use change in this site is the development of oil palm and timber
plantations. Commencing from 1991 to 2001, around 21,000 ha of land have been
planted to oil palm under different schemes. The development of timber plantations
started in 1996. From 1996 to 1999, over 13,000 ha of acacia plantations were
established.
4.2 Quantitative landscape mapping and changes analysis
Quantitative assessment of land cover change at the landscape level was undertaken
for three different dates; 15 June 1992, 23 November 1998 and 26 April 2000. The
change analysis is reported for two time periods 1992–1998 and 1998–2000. Cloud
and shadow did not present problems for the interpretation, as the image quality was
good. The results of the classifications can be seen in Figure 4-2.
The analysis compared cumulative figures and percentages between years, thus giving
a general overview of changes. This type of analysis gives an insight into the
predominant land cover change processes. Change trajectory matrices were also
calculated. These matrices are provided in Appendix III.

The Underlying Causes and Impacts of Fire in Indonesia 19
Figure 4-2. Land cover classifications 1992-1998-2000
During 1992 to 1998, there were considerable changes in the extent and quality of the
forest. The total decrement over this six-year period was 86%, or 14.3% per annum
for high-density forest and 14.8% or 2.5% per annum for low-density forest (see
Table 4-5). Analysis of the change trajectory matrix table in Appendix III shows that
26% of the high-density forest in 1992 and 30% of low-density forest had become oil
palm plantation in 1998. Logging roads already accessed most of the forest area in
1992 as seen from the satellite imagery.
According to the information from the fieldwork in 2001 the area had been logged
since the 1970’s and then the logged over areas began to be used by the timber and oil
palm plantation companies in late 1980’s. Timber plantations appeared in 1998
classification and covered 2,616 ha or 1.5% of the study areas, with 95.1% of its area
previously under forest cover.
Other land cover types identified are mosaics of shrub land and smallholder plantation
and mosaics of grassland and cultivation. Fieldwork identified that this area was
comprised of transmigration areas, local people villages, and also unused area covered
The Underlying Causes and Impacts of Fire in Indonesia 20
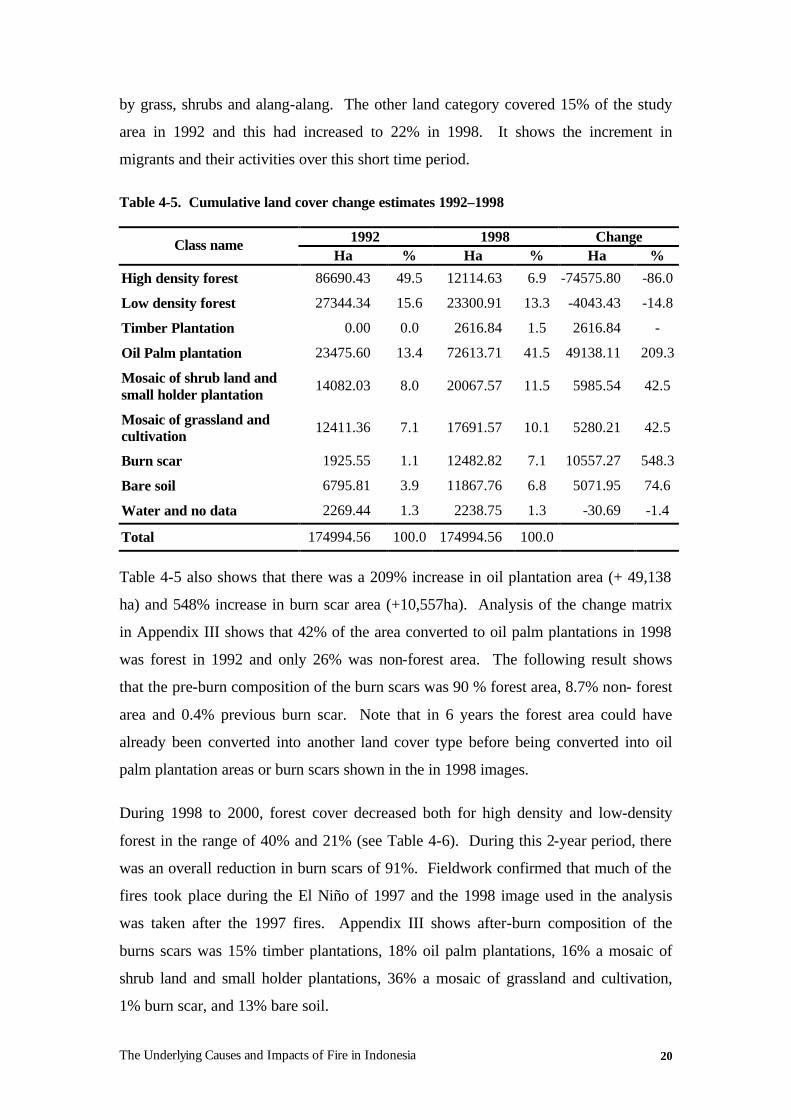
by grass, shrubs and alang-alang. The other land category covered 15% of the study
area in 1992 and this had increased to 22% in 1998. It shows the increment in
migrants and their activities over this short time period.
Table 4-5. Cumulative land cover change estimates 1992–1998
1992 1998 Change Class name Ha % Ha % Ha %
High density forest 86690.43 49.5 12114.63 6.9 -74575.80 -86.0
Low density forest 27344.34 15.6 23300.91 13.3 -4043.43 -14.8
Timber Plantation 0.00 0.0 2616.84 1.5 2616.84 -
Oil Palm plantation 23475.60 13.4 72613.71 41.5 49138.11 209.3
Mosaic of shrub land and small holder plantation
14082.03 8.0 20067.57 11.5 5985.54 42.5
Mosaic of grassland and cultivation
12411.36 7.1 17691.57 10.1 5280.21 42.5
Burn scar 1925.55 1.1 12482.82 7.1 10557.27 548.3
Bare soil 6795.81 3.9 11867.76 6.8 5071.95 74.6
Water and no data 2269.44 1.3 2238.75 1.3 -30.69 -1.4
Total 174994.56 100.0 174994.56 100.0
Table 4-5 also shows that there was a 209% increase in oil plantation area (+ 49,138
ha) and 548% increase in burn scar area (+10,557ha). Analysis of the change matrix
in Appendix III shows that 42% of the area converted to oil palm plantations in 1998
was forest in 1992 and only 26% was non-forest area. The following result shows
that the pre-burn composition of the burn scars was 90 % forest area, 8.7% non- forest
area and 0.4% previous burn scar. Note that in 6 years the forest area could have
already been converted into another land cover type before being converted into oil
palm plantation areas or burn scars shown in the in 1998 images.
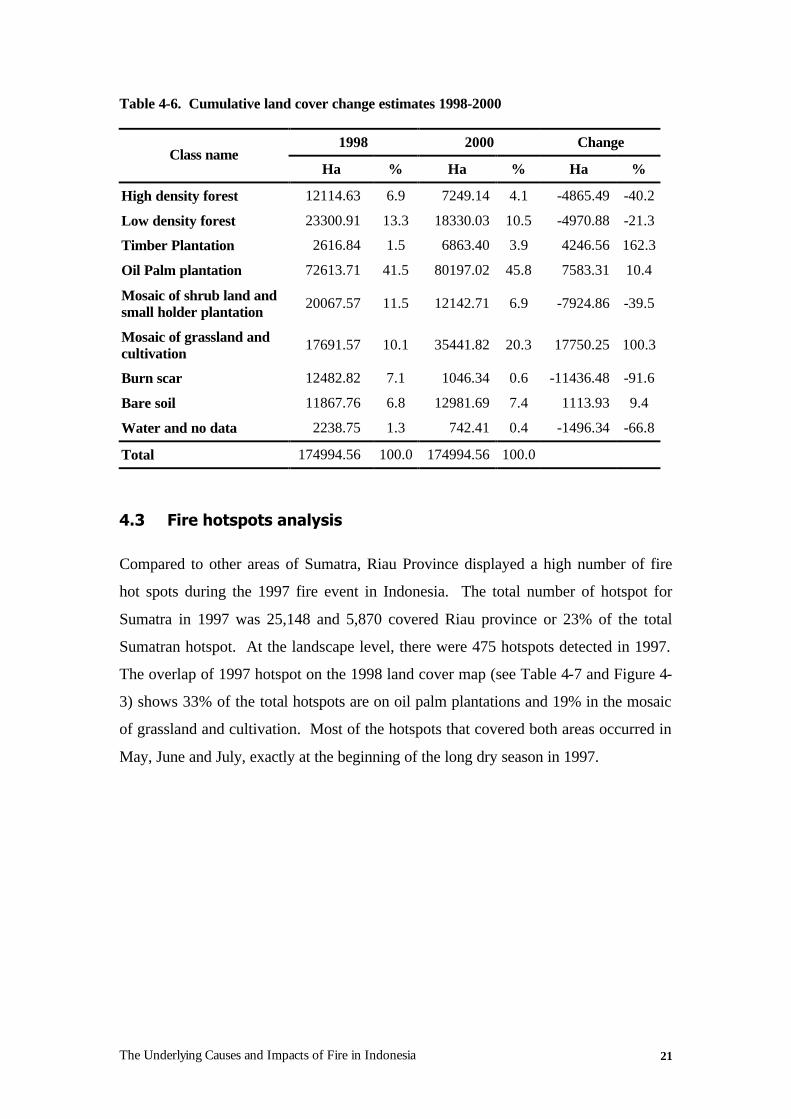
During 1998 to 2000, forest cover decreased both for high density and low-density
forest in the range of 40% and 21% (see Table 4-6). During this 2-year period, there
was an overall reduction in burn scars of 91%. Fieldwork confirmed that much of the
fires took place during the El Niño of 1997 and the 1998 image used in the analysis
was taken after the 1997 fires. Appendix III shows after-burn composition of the
burns scars was 15% timber plantations, 18% oil palm plantations, 16% a mosaic of
shrub land and small holder plantations, 36% a mosaic of grassland and cultivation,
1% burn scar, and 13% bare soil.
The Underlying Causes and Impacts of Fire in Indonesia 21
Table 4-6. Cumulative land cover change estimates 1998-2000
1998 2000 Change Class name
Ha % Ha % Ha %
High density forest 12114.63 6.9 7249.14 4.1 -4865.49 -40.2
Low density forest 23300.91 13.3 18330.03 10.5 -4970.88 -21.3
Timber Plantation 2616.84 1.5 6863.40 3.9 4246.56 162.3
Oil Palm plantation 72613.71 41.5 80197.02 45.8 7583.31 10.4
Mosaic of shrub land and small holder plantation
20067.57 11.5 12142.71 6.9 -7924.86 -39.5
Mosaic of grassland and cultivation
17691.57 10.1 35441.82 20.3 17750.25 100.3
Burn scar 12482.82 7.1 1046.34 0.6 -11436.48 -91.6
Bare soil 11867.76 6.8 12981.69 7.4 1113.93 9.4
Water and no data 2238.75 1.3 742.41 0.4 -1496.34 -66.8
Total 174994.56 100.0 174994.56 100.0
4.3 Fire hotspots analysis
Compared to other areas of Sumatra, Riau Province displayed a high number of fire
hot spots during the 1997 fire event in Indonesia. The total number of hotspot for
Sumatra in 1997 was 25,148 and 5,870 covered Riau province or 23% of the total
Sumatran hotspot. At the landscape level, there were 475 hotspots detected in 1997.
The overlap of 1997 hotspot on the 1998 land cover map (see Table 4-7 and Figure 4-
3) shows 33% of the total hotspots are on oil palm plantations and 19% in the mosaic
of grassland and cultivation. Most of the hotspots that covered both areas occurred in
May, June and July, exactly at the beginning of the long dry season in 1997.

The Underlying Causes and Impacts of Fire in Indonesia 22
Table 4-7. Result on overlapping the 1997 hotspot on 1998 land cover map
Land Cover Hot spot number (%)
High density forest 19 4.0
Low density forest 65 13.7
Timber plantation 8 1.7
Oil Palm plantation 157 33.1
Mosaic of shrub land and small holder plantation 50 10.5
Mosaic of grassland and cultivation area 91 19.2
Burn scar 42 8.8
Bare soil 30 6.3
Water and no data 13 2.7
Total 475 100.0
Figure 4-3. Hotspot 1997 over 1998 land cover map

The Underlying Causes and Impacts of Fire in Indonesia 23
4.4 Fires information from field surveys
Information from the socio economic surveys suggested that the cause of burning up
until 1998 was caused by land clearing, mostly for the establishment oil palm and
timber plantations.
From 1991 to March 2001, around 20,000 ha of land was planted to oil palm by large-
scale companies. Around 98% of the oil palm plantations were planted during 1991
to 1998, in which fire was used as a tool in land preparation. The remaining oil palm
plantations, (2%) was planted after 1998. The companies declared that they used
mechanical techniques and not fire in land preparation. The reason is because the
Government of Indonesia banned the use of fire for land clearing by large-scale
companies in 1988.
The second major cause of fire in this site was from burning debris during the
establishment of timber plantations. The total planted area of timber plantation in this
site is almost 13,000 ha. These areas were planted from 1997 to 1999, in which fire
was used in land preparation.
Fire, was also reported as a tool used in land preparation by smallholders. It is the
third major cause of fire. Smallholders are the local and migrant communities. These
migrants played an important part in causing the fire and smoke in this area.
Migration in this area has increased since the 1990’s along with the development of
transmigration and oil palm plantations. The highest migration occurred between
1996 and 1998 and most settled on land along the CALTEX road. Most of this land
belonged to the original Petapahan communities. The migrants purchased the land
and used fire for land preparation.
4.4.1 Fires as a tool in land preparation by oil palm companies.
In this study site, there are four oil palm plantation companies with three different
development schemes. One scheme is the nucleus estate and smallholders (NES).
One company, PT Sawit 1, developed oil palm plantation through this scheme. From
1991 to 2001, PT Sawit 1 established around 4,000 ha of nucleus plantation and
around 4,400 ha of plasma plantations (see Table 4-8).

The Underlying Causes and Impacts of Fire in Indonesia 24
Another scheme is based on private company investment without partnerships with
farmers. Two oil palm plantation companies, PT Sawit 2 and PT Sawit 3 adopted this
scheme. Between 1991 and 2001, both companies established around 6,800 ha of oil
palm plantation.
The third scheme is the Prime Cooperative Credit for Members (Koperasi Kredit
Primer Anggota = KKPA). Under this scheme, a private oil palm company should
establish oil palm plantations for the farmers under the credit scheme. The company
maintains the plantations until they are mature and then transfers them to the farmers
after the first harvest. The transmigrants should provide the credit for the
establishment. For paying the credit, each village established the Village Unit
Cooperative (KUD-Koperasi Unit Desa) to manage the credits and also as the
facilitator between the transmigrants and the company. PT Sawit 4, following the
KKPA scheme established 5,105 ha oil palm plantation in five transmigration villages
during 1996 to 1998. Table 4-8 shows the planted areas for each company since
1991. During 1996 to 1998, almost 10,000 ha were planted to oil palm, in which fire
was used in land preparation.
Table 4-8. Planted area of Oil Palm Plantation in study site.
PT Sawit 1 Years Private (ha) NES (ha)
PT Sawit 2 (ha)
PT Sawit 3 (ha)
PT Sawit 4 (ha)
Total (ha)
1991 636.00 400.00 382.53 0.00 0.00 1,418.53
1992 1,470.00 1,666.00 205.94 1,048.00 0.00 4,389.94
1993 50.00 2,351.00 598.35 866.00 0.00 3,865.35
1994 0.00 0.00 382.10 399.60 0.00 781.70
1995 0.00 0.00 78.73 376.60 0.00 455.33
1996 1,129.00 0.00 414.11 46.60 1,300.00 2,889.71
1997 376.00 0.00 389.41 1,523.90 2,945.00 5,234.31
1998 71.46 0.00 120.00 0.00 860.00 1,051.46
1999 171.54 0.00 0.00 0.00 0.00 171.54
2000 29.00 0.00 0.00 0.00 0.00 29.00
2001* 115.50 0.00 0.00 0.00 0.00 115.50
Total 4,048.5 4,417 2571.17 4,260.7 5,105 20,402.37 * Until March 2001

The Underlying Causes and Impacts of Fire in Indonesia 25
Based on interviews with the staff of PT Sawit 1, fire was used to clear areas from
1991 to 1998. This activity started by slashing and cutting the trees and shrubs. Once
dried, the cut material is burned. After the burning, the burned trash is stacked into
rows, called gawangan. If necessary, the burning is repeated until the land is clear
enough for planting. Gawangan is the name given to two kinds of rows. Gawangan,
can refer to live gawangan for planting rows or dead gawangan which are rows in
which the trash is stacked and burned.
Since 1998, the companies stated that they have not used fire in land preparation,
because the government banned the use of fire for land preparation more strictly. In
the study site, however, after 1998, only PT Sawit 1 opened and planted around 300
ha. of oil palm. The companies stated that now they used a fully mechanical system
to clear the land, but based on the investigation, the contractor they hired still used fire
to burn off the dead gawangan. The dead gawangan needs to be burned because if
too high impedes accessibility for planting the seedlings.
A common reason given for using fire in land preparation is economics. The cost of
mechanical techniques is higher than using fire. Table 4-9 shows a cost comparison
of establishing oil palm plantation by using fire and mechanical techniques. The cost
estimate is based on price in 1997 and physical unit in 2000 data. The economic
analysis shows the land preparation cost per hectare by using fire is 300 thousand
Rupiah cheaper than the cost of using mechanical techniques. This suggests a weak
incentive to implement zero burning techniques for land preparation.
Table 4-9. Cost comparison of land preparation techniques in PT Sawit 1.
Activity Using Fire (Rupiah/ha) Mechanical System (Rupiah/ha)
Slash 148,500 108,000
Cut 396,000 156,000
Slice 148,500 117,000
Burn 33,000 0
Mechanical Prone 0 663,000
TOTAL 726,000 1,044,000
The Underlying Causes and Impacts of Fire in Indonesia 26
4.4.2 Fires as a tool in land preparation for industrial timber plantations
The establishment of industrial timber plantation started in 1996 with Acacia
mangium and Acacia crassicarpa. However, the expansion of these plantations has
ceased since 1998, due to tenure conflicts with local communities who live around the
plantations.
The company obtained a logging license (IPK-Ijin Pemanfaatan Kayu) to clear the
concession area and establish timber plantations. They contracted the land clearing
activity to PT Meranti, a member of their company group. PT Meranti cut the trees
with diameters above 15 cm. They sold the logs to the pulp industry (chip wood), and
some of the high quality logs were sold to sawmills and plywood industries. The
contractor also cut the remaining logs and shrubs with diameters under 15 cm, and
stacked and burned them. The stacking and burning was repeated until the land was
clear enough to be planted. Planting was undertaken less than a month after the
burning was completed. Since 1998, the companies have stated they used mechanical
systems for land preparation.
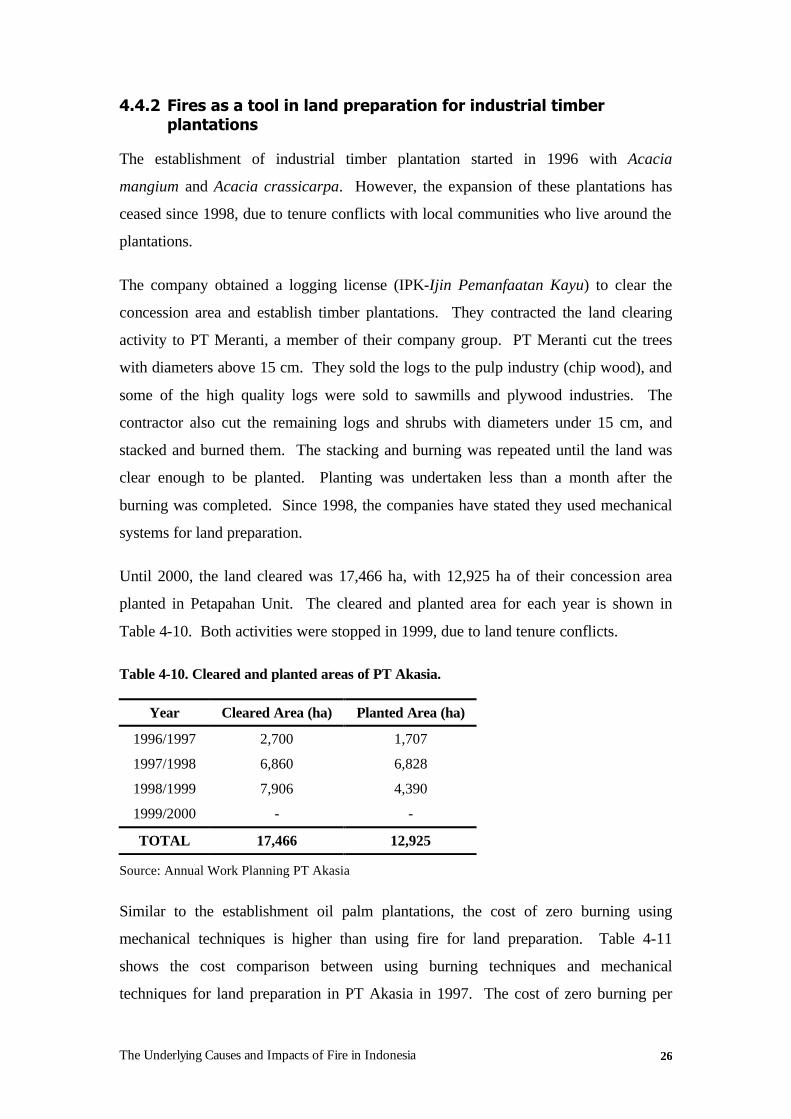
Until 2000, the land cleared was 17,466 ha, with 12,925 ha of their concession area
planted in Petapahan Unit. The cleared and planted area for each year is shown in
Table 4-10. Both activities were stopped in 1999, due to land tenure conflicts.
Table 4-10. Cleared and planted areas of PT Akasia.
Year Cleared Area (ha) Planted Area (ha)
1996/1997 2,700 1,707
1997/1998 6,860 6,828
1998/1999 7,906 4,390
1999/2000 - -
TOTAL 17,466 12,925
Source: Annual Work Planning PT Akasia
Similar to the establishment oil palm plantations, the cost of zero burning using
mechanical techniques is higher than using fire for land preparation. Table 4-11
shows the cost comparison between using burning techniques and mechanical
techniques for land preparation in PT Akasia in 1997. The cost of zero burning per

The Underlying Causes and Impacts of Fire in Indonesia 27
hectare is almost 200 thousand Rupiah higher that the cost of using fire. The cost of
the first three activities involving slashing, cutting and slicing is similar between the
two techniques. The difference is due to the cost of using heavy equipment (Figure 4-
4) such as bulldozers and excavators. The cost of mechanical spreading is 5 times
more expensive than the cost of burning.
Table 4-11. Cost comparison of land preparation techniques in PT Akasia.
Activity Used Fire (Rupiah/ha) Mechanical System (Rupiah/ha)
Slash 75,000 75,000
Cut 105,000 105,000
Slice 40,000 40,000
Burn 45,000 0
Mechanical Spreading 0 230,000
TOTAL 265,000 450,000
Figure 4-4. Heavy equipments usually used for land preparation in mechanical system and those machines significantly increased the cost of land preparation.

The Underlying Causes and Impacts of Fire in Indonesia 28
One of the large timber plantation companies in Riau also stated (see inbox below)
that the zero burning system has a high cost of implementation and requires some
incentives for applying it.
A staff member of a big industrial tree plantation company was interviewed about the organization’s land preparation system. The company stated that they have been practicing ‘zero burning’ in its land preparation activities since 1994. These are some considerations in the company’s applied system, i.e.:
Optimising Resources. All wood materials from 6 centimetres in diameter are utilized. The residual wood in the field after harvest is generally about 10 – 20 m3 per hectare and these are spread manually or mechanically in the harvesting compartment during the land preparation, allowing the wood materials to decompose for nutrient cycling. In most instances, the residual wood in the field is less than 15 m3 per hectare.
General Cost. Initially, the cost of land preparation without burning is high. But land preparation by burning will increase fertilizer needs during maintenance because of the loss of organic matter and nutrients. Growth of the plantations is also affected and in the long-term productivity is decreased resulting to higher production costs. .
Activity Items Cost (in USD) For ex Bushes Area Land Clearing 455 Infrastructure Improvement 9.9 Planting 183 Fertilization 67.4 Blanking/Sisipan 21.6 Weeding 126.2 Pruning/Singling 10.6 Pest and Disease 0.5 Fire Protection 1.5 Survey and Census 2.3 Total 878 Note: Above cost do not include infrastructure cost.
For ex Logged-over area Land clearing 230 (Other activities as above) 423 Total 653
Burning as a land preparation option is cheap and convenient. It is generally followed with a significant growth during the first few years after land preparation. However, in the long term the growth and productivity will radically decline due to the loss of soil nutrients and reduction of microorganism essential for sustained growth.

The Underlying Causes and Impacts of Fire in Indonesia 29
4.4.3 Fire as a tool in land preparation by smallholders
Based on household surveys, Table 4-12 shows average land holdings by different
types of farmers. Local farmers have the highest average area of land holding that is 8
ha per household. The average land holding per household of spontaneous migrant
farmers and transmigrant farmers is 3.6 ha and 2.4 ha respectively. None of the three
types of farmers have wet rice fields. The major land use is tree cropping. More than
69 % of the average land holdings of the three types of respondents have tree crops in
their fields, with the remainder being upland fields and bush-fallow.
Table 4-12. Average area of land holding by different land use (ha)
Type of farmers
Wet rice field
Upland field (Ladang)
Bush-fallows
Tree crops field Total
Local 0 0 1.8 6.2 8.0
Spontaneous migrants 0 0.4 0.7 2.5 3.6
Transmigrant 0 0 0 2.4 2.4
Oil palm is a major tree crop, with 64 % to 96 % of tree crops being oil palm (Table
4-13). Oil palm was attractive to farmers who came to this area, especially those that
were spontaneous migrants. The main objective of spontaneous migrants is to
establish oil palm plantation. Thus, spontaneous farmers have the biggest proportion
of oil palm plantation (96 % of total plantation).
The second most important tree crop is rubber. However, rubber is only important for
local farmers (24% of total tree plantation) and transmigrant farmers (36 % total tree
plantation). Spontaneous migrants are not interested in establishing rubber, as
indicated by the small proportion of rubber plantations they own (only 4 %).
Table 4-13. Percentage of trees planted of communities.
Type of farmers Oil palm (%) Rubber (%) Others Plant (%)
Local Spontaneous Migrants Transmigrant
71 96 64
24 4
16
6 0 0
Facilitated by the development of transmigration settlements in the early 1980’s and
the development of oil palm plantations in the early 1990’s, in-migration to this site

The Underlying Causes and Impacts of Fire in Indonesia 30
has been increasing. Mostly, the migrants from North Sumatra Province had
experience with growing oil palm. They obtained the land by purchasing it from local
communities. The increase in the establishment of smallholder oil palm plantings by
spontaneous migrants is the highest among the communities on this site.
Most farmers have experience with using fire in land preparation, 96 % of
respondents stated that they used fire for their land preparation. 72 % of the
respondents argued that cheap and easy are the main reasons for using fire in land
preparation, 7 % stated that accessibility to planted is more easier because the land is
clear, and 12 % stated that the land is become more fertile because they assumed that
the fire can provides ashes for fertilizer.
The survey also enquired about the sanction system in the case of a fire spreading and
destroying a neighbour’s field (Table 4-14). Most farmers (76%-84%) stated that
there are sanctions to cover fire spreading and destroying a neighbour’s field. The
sanctions however, were not rigid and not strictly enforced. The kind of
compensation can be discussed and negotiated amongst villagers such as money or
seed.
Table 4-14. Percentage of farmer’s perception about sanction if fire is spreading
Sanction Type of farmers
There is a sanction (%) No sanction (%)
Local 84 16
Spontaneous Migrant 80 20
Transmigrant 76 24
The survey also covered farmers perception of government bans on use of fire by
smallholders for land preparation and the government offering alternative techniques
to using fire (Table 4-15). The results vary among farmer types.
Table 4-15. Percentage of community’s perception about zero burning techniques
If the government apply the zero burning policy Type of farmers
Agree (%) Not Agree (%)
Local 8 92
Spontaneous Migrant 20 80
Transmigrant 56 44

The Underlying Causes and Impacts of Fire in Indonesia 31
4.5 Land Tenure Conflicts
The development of oil palm and industrial timber plantation has a strong potential to
create social conflict between companies and local communities who live surrounding
the plantations especially if there is not a clear land ownership status and a weak
partnership with farmers.
Clear land ownership is the most important variable in reducing the conflict between
communities and companies. Two examples in the study site show the importance of
clear land ownership. The first example shows that even if there is no partnership
with farmers, there is less land conflict because the status of land ownership is clear.
In this case, PT Sawit 2 obtained 2,574.17 ha of land for timber plantations.
However, local communities surrounding the concession had already cultivated more
than 90 percent of the concession. To reduce a potential land conflict in the future,
the company was willing to compensate the community. With a transparent
mechanism for ensuring all farmers received the correct compensation, a conflict was
eliminated.
On the other hand, one timber plantation company in our study site, which also does
not have any partnership with farmers and has serious land tenure conflict problems
on this site. Initially, this timber plantation company obtained 31,416 ha of
concession in 1996 (see Figure 4-5). However, local communities had cultivated
some of the concession area. To reduce the potential land tenure conflict, the
company released around one third of the concession to local communities. The
communities, however, still claimed the rest of the concession. They believe that all
of the concession belonged to communal land (ulayat). In addition, there was also
some land encroachment by migrants. As a result, some conflicts arose. The study
documented three of the conflicts as follows:
1. The first tenure conflict arose in the western part of the PT Akasia concession area
(See the blue area in Figure 4-5). Local communities claimed approximately
2,427 ha of land that had been planted with acacia trees (1996/1997 Annual
Plantation Area) and they demanded to establish oil palm plantations with a
partnership scheme. The company, however refused their claim. As a result, the
villagers destroyed the acacia plantation and replanted it with oil palm trees.

The Underlying Causes and Impacts of Fire in Indonesia 32
Then, the company cleared out the oil palm trees and re-planted the area with
acacia trees. As a consequence, the villagers burned the plantation camp and
destroyed the acacia plantation. The land is treated as a status quo, forbidden to
be cultivated either by villagers or by the company. However, recently, some
migrants and some local communities from surroundings areas have built houses
and opened the land for oil palm plantation.
2. The second tenure conflict arose in the Batu Gajah settlement, indicated by yellow
in Figure 4-5. The Batu Gajah Community returned to their settlement to reclaim
their customary land (tanah ulayat). They argued that PT Akasia had over cleared
their customary forest and claimed 6,000 ha of their customary land back. PT
Akasia refused to release the areas, because the government has already allocated
it to their concession area. Then the community burned 300 ha of 2.5 year old
acacia trees as a result. As a consequence, PT Akasia could not plant their
concession area for RKT 1999/2000. Recently, following an agreement between
the Batu Gajah Community and PT Akasia, the company released 5,400 ha of
concession land to the Batu Gajah community. However, since the status of the
land is still under Forest Production classification, they cannot invite investors to
develop oil palm plantation on this land.
3. The third example arose in the northern part of the PT Akasia concession (see the
red area in Figure 4-5). Because of the success of the NES Scheme of PT Sawit 1
with the transmigrants, the local community in Petapahan demanded PT Sawit 1 to
include them in their oil palm plantation scheme. Actually, in the beginning of the
NES program, PT Sawit 1 had invited the Petapahan community to join this
program. However, most of the Petapahan community were not interested and
refused it. They were asked to join in the partnership in 1996. In 2000, PT Sawit
1 agreed to build a partnership with the Petapahan community under KKPA
scheme. However, the area that was offered by the Petapahan community for this
partnership scheme was located in the timber plantation concession. PT Akasia,
had already planted the area with acacia trees. The Petapahan community argued
that the area belonged to their Ulayat Land, and they claimed it. After a meeting
between PT Akasia, Petapahan community, and State Government, on June 20th,
2000, based on Governor of Riau Province Agreement No. 525/EK/1458 about
The Underlying Causes and Impacts of Fire in Indonesia 33
preserving areas for partnership plantations for Farmers Cooperative of Petapahan
Community (KOPTAMASTA), PT Akasia released 1,500 ha of their concession
to the Petapahan community. It included some acacia plantation. The community
then gave the right to PT Sawit 1 to establish oil palm plantations. After about
400 ha area had been cleared, the community found that the rest of the area was
located in swampy areas, closed to the river. As a consequence, the cost of
establishment of the oil palm plantation was more expensive than planned. The
total credit for establishment of 2 ha oil palm plantation in swamp areas (20
million rupiah) is 30% higher than in non-swamp areas (16-17 million rupiah).
Because of that, the local community asked PT Akasia to substitute that land with
other land located further from the river. The land that local community
demanded is already acacia plantation (3 years old). PT Akasia again refused the
demand of the local community. The rejection caused the community to attack
the camp and threw out the employees. As a result, the plantation activities have
been stopped since March 2001. PT Sawit 1 itself, as a contractor, does not want
to clear the land until the conflict is resolved, even if the community asks and
guarantees the security of land clearing activity. Recently, following an
agreement between PT Akasia and KOPTAMASTA, the Petapahan Community
received 400 ha of the land requested.

The Underlying Causes and Impacts of Fire in Indonesia 34
Figure 4-5. Sketch map of land tenure conflict and encroachment problem in PT Akasia.
The Underlying Causes and Impacts of Fire in Indonesia 35
Many people believe that a good partnership between farmers and companies in
developing oil palm or timber plantations will reduce land tenure conflict. The result
of this study supported this popular belief. Two examples of companies who have a
partnership with farmer will be described. PT Sawit 1 has a good partnership with
farmers in establishing oil palm plantations. The company has good reputation
managing oil palm plantations, so farmers received a productive oil palm plantation
when the company transferred it to farmers.
On the other hand, PT Sawit 4 collaborates with KUD Sawit Jaya, in establishing oil
palm plantation for transmigrants. According to the agreement, PT Sawit 4 should
develop and care for the oil palm plantation for the members of KUD Sawit Jaya, and
market the fruit to the oil palm factory, and also help in administration, management,
and technical training for the cooperative members. For establishing oil palm
plantation, the credit is 7.5 million rupiah per hectare.
PT Sawit 4’s partnership with farmers is not good. The company shows less
commitment and a lower responsibility for developing oil palm plantations for
farmers. The company used low quality seedlings and inappropriate maintenance
techniques. As a result, the oil palm plantation is not developing well. Farmers have
refused to receive bad oil palm plantation. Farmers also realize with bad oil palm
plantation, they could not pay back the credit for establishing the plantation.
A good partnership between communities and companies for developing oil palm or
timber plantations is a key factor in successful resource management. As the
household surveys show, there is a weak incentive to help if there is fire in the
plantation company if no partnership scheme exists. On the other hand, the
willingness to fight fire in the plantations with good partnership schemes is high. This
is reflected in the result in Table 4-16, in which only 4 % of farmers are willing to
help if there is a fire in a company timber plantation and 68%-92 % are willing to help
to fight fire if it occurs in an oil palm plantation. In contrast, all of the farmers are
willing to help if there is fire in a farmer’s field. Mostly because of the social
relationship and to avoid fire spreading to their fields. The study found that the
willingness of local farmers to fight fire in forest areas is higher than the willingness
of spontaneous migrants and transmigrant. This shows that local farmers have a
higher affinity towards the forest than spontaneous migrants and transmigrant.

The Underlying Causes and Impacts of Fire in Indonesia 36
Table 4-16. Percentage of community’s perceptions about fires at different land use type
Willingness to help if there is a fire at Type of farmers
Number of sample Farmer’s
Fields Forest land
Timber plantation 1)
Oil palm plantation 2)
Local farmers 25 100 84 4 92
Spontaneous migrants
25 100 12 n.a 68
Transmigrant 25
100 48 n.a 76
1) No Farmer’s Partnership scheme 2) With Farmer’s Partnership scheme
One of the questions asked was why there is a weak willingness of local farmers to
fight fire in timber plantations. Most of farmers feel that existing timber plantations
do not provide benefits for them (52%). Another 35 % of local farmers argued that
timber plantation companies took their communal forestland (Table 4-17).
Figure 4-6. Farmer perception about their refusing for helping fire fighting at timber plantation
Fire suppression is their responsibility
8%
The presence of Timber Plantation Company (HTI) is
useless for community.
42%
Timber Plantation Company (HTI) deforested their
Communal Forest21%
The presence of Timber Plantation
Company (HTI) has damaged the road
8%
Timber Plantation Company (HTI) is
careless to community
development.21%
The Underlying Causes and Impacts of Fire in Indonesia 37
5. UNDERLYING CAUSES OF FIRE
In this study site the use of fire for large-scale oil palm and timber plantation
establishment was the main cause of fire. The establishment of transmigration
settlements through nucleus estate schemes has increased the area of oil palm
plantation. Therefore, it has significantly contributed to the fire and smoke problem
in Indonesia. Smallholders also use fire for establishing oil palm plantations. There
is also evidence that recent spontaneous migrants have established small-scale oil
palm plantations. The economic incentive to use fire in land clearing is very high
because it is cheap to use. Moreover, the establishments of oil palm and timber
plantations potentially create land tenure conflicts with communities surrounding the
plantations. In many cases, tenure conflicts often become a trigger for forest and land
fires. The nature of the partnership between communities and companies in the
development of oil palm and timber plantations is also a very important factor in
reducing the incidence of fire.
It is evident from image analysis undertaken at the landscape level of the study area
that from 1992 to 2000, 88,456 ha natural forest was lost, or about 9.7% per annum.
From the forest converted, the biggest part, 29,1% became oil palm and timber
plantations, with 23.2% converted for cultivation. The use of hotspots in detecting the
historic fires in 1997 also show that most of the fires occurred in areas-that were used
for oil palm and timber plantations. In excess of 204 hotspots or 43% of total hotspot
in 1997 were in this land use category.
The Underlying Causes and Impacts of Fire in Indonesia 38
6. POLICY IMPLICATIONS
Based on the analysis of the underlying causes of fire in the Petapahan site, some
policy implications for both the national and provincial level are outlined:
a. Review the zero burning policy.
A total ban on the use of fire in land clearing is currently impractical. An
alternative, intermediate-level regulation and policy change appears to be more
feasible, including the following policy alternative (1). Total bans on the use of
fire in land clearing only apply during El Nino years or at other critical times.
Fire in land clearing can still be allowed in normal years (2). Apply a technique
of using fire in land clearing that reduces smoke, and (3). Applied and adaptive
research on zero or less reduced burning technology.
b. Reduce the amount of timber that is burned:
(1) develop a method of selling the residual timber both from large and small
scale logging industries to medium density fibreboard (MDF) or pulp factories.
(2) Remove all policy barriers (tax and levy) at national and regional level in
marketing timber residue (3) Improve the infrastructure to increase the demand
for the residue.
c. Work in cooperation with large-scale operations to develop and implement
suitable forest and fire management plans. These efforts should include setting up
facilities to prevent and suppress accidental or escaped fires in plantations.
d. Build the rewards system for anyone who keeps their environmental clean. For
example: using no fire in land preparation can be accepted as positive
environment service that worth for reward, for the company, this can be a rule to
do their future activities.
e. Review and strengthen law-enforcement mechanisms that could help curb land
and forest fires.

The Underlying Causes and Impacts of Fire in Indonesia 39
7. REFERENCES
Arsyad, H. 1986. Sejarah Bekas Kerajaan Petapahan. Pekanbaru. Indonesia.
BAPPENAS. 1999. “Final report, Annex 1: Causes, Extent and Cost of the 1997/98 Fires and Drought: Summary of Phase 1.” Asian Development Bank TA 2999-INO July 98-March 1999. Planning for Fire Prevention and Drought Management Project. Jakarta. Indonesia.
Barber, C.V and Schweithelm, J. 2000. Trial by Fire. Forest Fire and Forestry Policy in Indonesia’s Era of Crisis and Reform. World Resources Institute in Collaboration with WWF Indonesia and Telapak Indonesia Foundation.
Dennis, R.A. 1999. A Review of Fire Projects in Indonesia 1982-1998. Center for International Forestry Research. Bogor. Indonesia.
Suyanto, S., Ruchiat, Y., Stolle, F. and Applegate, G. 2000. The Underlying Causes and Impacts of Fires in South-east Asia. Site 3. Tanah Tumbuh, Jambi, Indonesia. Site Report. CIFOR, ICRAF, USAID, and USFS. Bogor. Indonesia.
Tomich, T.P., Fagi, A.M., de Foresta, H., Michon, G., Murdiyarso, D., Stolle, F. and van Noorwijk, M. 1998. Indonesia’s Fires: Smoke as a Problem, Smoke as a Symptom. Agroforestry Today, 10 (1): 4 - 7.
Tomich, T.P. et al. 1998. Alternative to Slash and Burn in Indonesia, Summary Report and Synthesis of Phase II. ASB-Indonesia Report No.8. ICRAF. Bogor. Indonesia.
World Bank. 2001. INDONESIA Environment and Natural Resource Management in a Time of Transition. World Bank. Washington, USA.
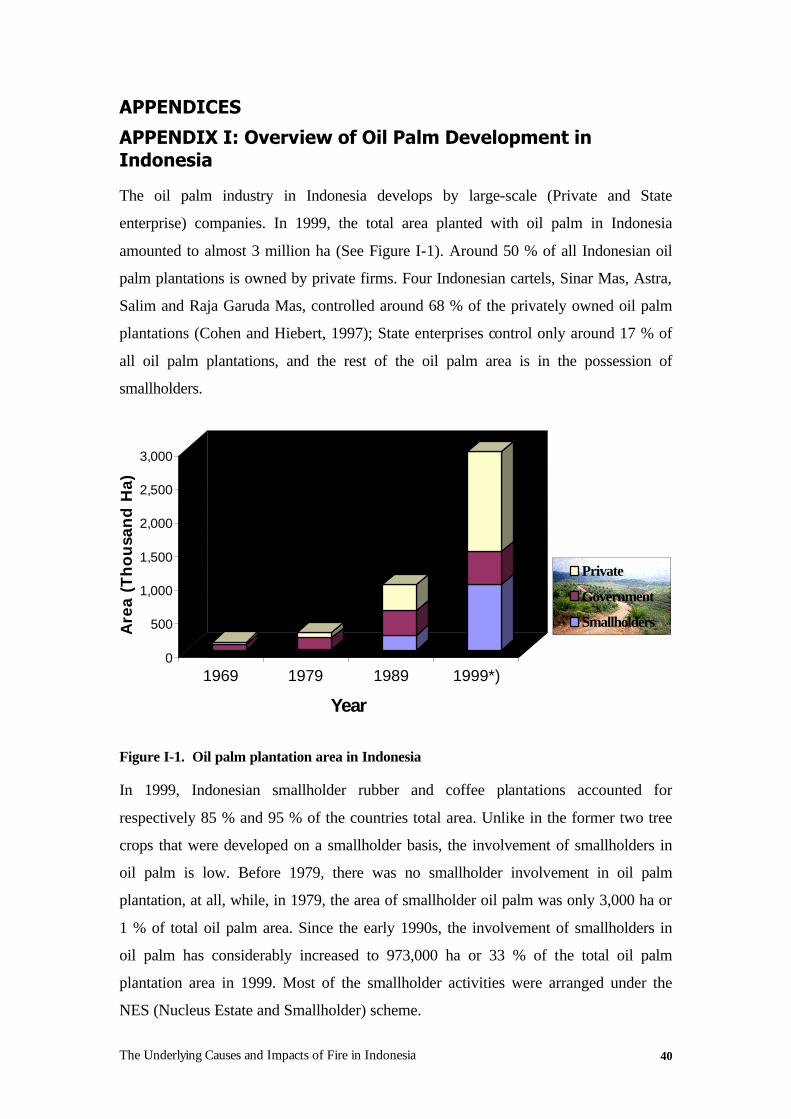
The Underlying Causes and Impacts of Fire in Indonesia 40
APPENDICES
APPENDIX I: Overview of Oil Palm Development in Indonesia
The oil palm industry in Indonesia develops by large-scale (Private and State
enterprise) companies. In 1999, the total area planted with oil palm in Indonesia
amounted to almost 3 million ha (See Figure I-1). Around 50 % of all Indonesian oil
palm plantations is owned by private firms. Four Indonesian cartels, Sinar Mas, Astra,
Salim and Raja Garuda Mas, controlled around 68 % of the privately owned oil palm
plantations (Cohen and Hiebert, 1997); State enterprises control only around 17 % of
all oil palm plantations, and the rest of the oil palm area is in the possession of
smallholders.
0
500
1,000
1,500
2,000
2,500
3,000
Area
(Tho
usan
d Ha
)
1969 1979 1989 1999*)Year
Private
Government
Smallholders
Figure I-1. Oil palm plantation area in Indonesia
In 1999, Indonesian smallholder rubber and coffee plantations accounted for
respectively 85 % and 95 % of the countries total area. Unlike in the former two tree
crops that were developed on a smallholder basis, the involvement of smallholders in
oil palm is low. Before 1979, there was no smallholder involvement in oil palm
plantation, at all, while, in 1979, the area of smallholder oil palm was only 3,000 ha or
1 % of total oil palm area. Since the early 1990s, the involvement of smallholders in
oil palm has considerably increased to 973,000 ha or 33 % of the total oil palm
plantation area in 1999. Most of the smallholder activities were arranged under the
NES (Nucleus Estate and Smallholder) scheme.
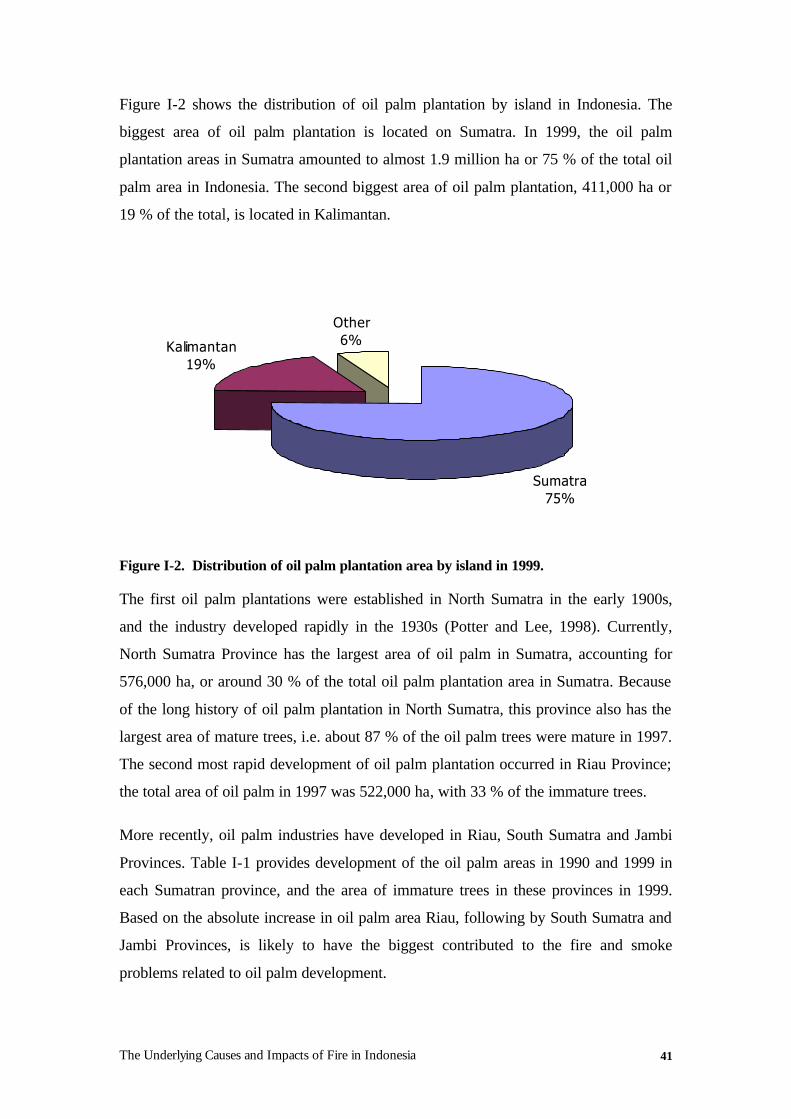
The Underlying Causes and Impacts of Fire in Indonesia 41
Figure I-2 shows the distribution of oil palm plantation by island in Indonesia. The
biggest area of oil palm plantation is located on Sumatra. In 1999, the oil palm
plantation areas in Sumatra amounted to almost 1.9 million ha or 75 % of the total oil
palm area in Indonesia. The second biggest area of oil palm plantation, 411,000 ha or
19 % of the total, is located in Kalimantan.
Sumatra75%
Kalimantan19%
Other6%
Figure I-2. Distribution of oil palm plantation area by island in 1999.
The first oil palm plantations were established in North Sumatra in the early 1900s,
and the industry developed rapidly in the 1930s (Potter and Lee, 1998). Currently,
North Sumatra Province has the largest area of oil palm in Sumatra, accounting for
576,000 ha, or around 30 % of the total oil palm plantation area in Sumatra. Because
of the long history of oil palm plantation in North Sumatra, this province also has the
largest area of mature trees, i.e. about 87 % of the oil palm trees were mature in 1997.
The second most rapid development of oil palm plantation occurred in Riau Province;
the total area of oil palm in 1997 was 522,000 ha, with 33 % of the immature trees.
More recently, oil palm industries have developed in Riau, South Sumatra and Jambi
Provinces. Table I-1 provides development of the oil palm areas in 1990 and 1999 in
each Sumatran province, and the area of immature trees in these provinces in 1999.
Based on the absolute increase in oil palm area Riau, following by South Sumatra and
Jambi Provinces, is likely to have the biggest contributed to the fire and smoke
problems related to oil palm development.
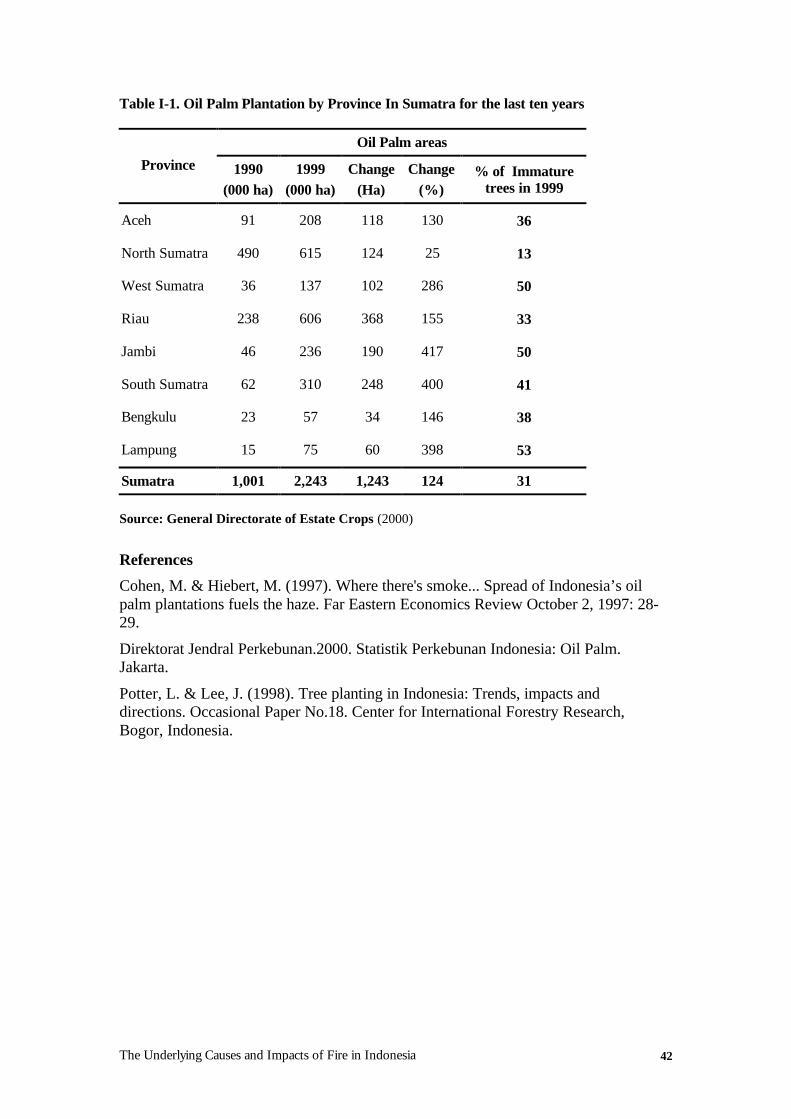
The Underlying Causes and Impacts of Fire in Indonesia 42
Table I-1. Oil Palm Plantation by Province In Sumatra for the last ten years
Oil Palm areas
Province 1990 (000 ha)
1999 (000 ha)
Change (Ha)
Change (%)
% of Immature trees in 1999
Aceh 91 208 118 130 36
North Sumatra 490 615 124 25 13
West Sumatra 36 137 102 286 50
Riau 238 606 368 155 33
Jambi 46 236 190 417 50
South Sumatra 62 310 248 400 41
Bengkulu 23 57 34 146 38
Lampung 15 75 60 398 53
Sumatra 1,001 2,243 1,243 124 31
Source: General Directorate of Estate Crops (2000)
References
Cohen, M. & Hiebert, M. (1997). Where there's smoke... Spread of Indonesia’s oil palm plantations fuels the haze. Far Eastern Economics Review October 2, 1997: 28-29.
Direktorat Jendral Perkebunan.2000. Statistik Perkebunan Indonesia: Oil Palm. Jakarta.
Potter, L. & Lee, J. (1998). Tree planting in Indonesia: Trends, impacts and directions. Occasional Paper No.18. Center for International Forestry Research, Bogor, Indonesia.

The Underlying Causes and Impacts of Fire in Indonesia 43
APPENDIX II: Overview of industrial timber plantation in Indonesia
Starting in the early of the Five-Year Development Plan (Repelita IV) in 1984, the
government of Indonesia targeted to establish 6.2 million ha timber plantation in
2000, in which 1.8 million ha was targeted to be planted in Java and 4.4 million ha to
be planted in outer Java (Manurung et.al, 1999). The reason of this policy is to
anticipate of a raw material deficit due to the expanding of wood demand and the
expanding of pulp and paper industry.
Until 1998, Government of Indonesia has been approved to allocate around 5.9
million ha land for establishing timber plantation (See Table II-1). To accelerate the
development of HTI, government of Indonesia provide a financial assistance, the
interest-free loans from the reforestation fund that collected from logging concession
(Barber and Schweithelm, 2000; Kartodjhardjo and Supriono, 2000).
Table II-1. Allocated areas for timber plantation (until 1998).
Islands Allocated/Concession Area (ha) Sumatra 2,148,964 Kalimantan 2,928,414 Sulawesi 255,791 Others 266,755 Total 5,599,924
Source: Barber and Schweithelm, 2000
According to Kartodiharjo and Supriono (2000) almost 2.2 million ha of timber
plantation or 47% of the total timber plantation area has designed to receive financial
fund from reforestation fund. From the total timber plantation under the reforestation
fund scheme, HTI for pulp is assigned to absorb 83% the reforestation fund, while
HTI for non-pulp only absorbs 17%. There is no financial assistance from
reforestation fund for establishment HTI-transmigration.
The number of planted area, however, is very slow, especially in the beginning of the
implementation HTI policy in 1989/1990 and 1990/1991. Table II-2 shows that the
realization of planted area until 1999/2000 was only 2,350,357 ha (MoFEC, 2000) or
less than 50 % of concession area.
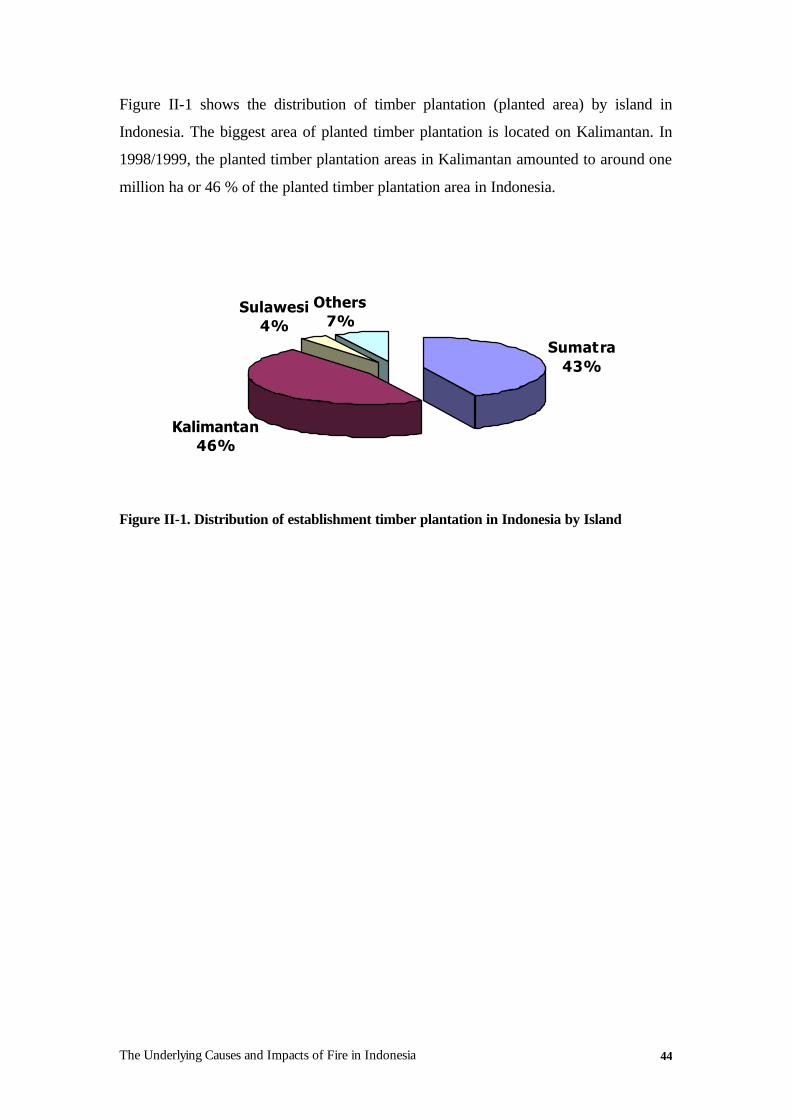
The Underlying Causes and Impacts of Fire in Indonesia 44
Figure II-1 shows the distribution of timber plantation (planted area) by island in
Indonesia. The biggest area of planted timber plantation is located on Kalimantan. In
1998/1999, the planted timber plantation areas in Kalimantan amounted to around one
million ha or 46 % of the planted timber plantation area in Indonesia.
Sumatra43%
Kalimantan46%
Sulawesi4%
Others7%
Figure II-1. Distribution of establishment timber plantation in Indonesia by Island

The Underlying Causes and Impacts of Fire in Indonesia 45
Table II-2. Development of Timber Plantation in Indonesia
Years ISLANDS 1989/1990 1990/1991 1991/1992 1992/1993 1993/1994 1994/1995 1995/1996 1996/1997 1997/1998 1998/1999 1999/2000
TOTAL(ha)
Sumatra 22,636 57,065 75,346 69,028 141,552 117,821 133,152 145,191 100,897 66,280 81,738 1,010,7061. DI Aceh 2,649 1,721 729 491 8,526 13,914 17,451 15,245 12,275 5,454 959 79,4142. North Sumatra 11,320 13,564 8,059 15,003 11,042 10,423 9,226 7,507 7,887 5,196 2,358 101,5853. West Sumatra 0 0 620 1,463 787 1,762 2,283 2,490 1,151 420 315 11,2914. Riau 3,101 5,766 6,252 13,179 69,154 39,928 51,606 69,216 52,613 34,199 51,014 396,0285. Jambi 1,000 1,880 1,014 5,170 8,399 12,100 18,038 21,017 19,027 13,260 23,007 123,9126. South Sumatra 500 31,007 52,177 28,556 35,778 31,308 26,372 21,290 6,144 4,994 4,085 242,2117. Bengkulu 0 0 0 0 265 450 0 825 300 13 0 1,8538. Lampung 4,066 3,127 6,495 5,166 7,601 7,936 8,176 7,601 1,500 2,744 0 54,412Kalimantan 24,613 16,075 50,395 56,555 137,433 144,603 173,508 206,512 127,756 95,229 51,126 1,083,8051. West Kalimantan 3,208 3 5,747 7,294 20,637 16,832 19,813 38,921 31,089 14,000 4,265 161,8092. Center Kalimantan 0 0 0 549 5,721 17,735 21,968 27,887 20,621 11,976 5,854 112,3113. South Kalimantan 8,402 7,551 16,850 21,627 15,827 33,839 55,027 44,145 4,010 7,465 3,762 218,5054. East Kalimantan 13,003 8,521 27,798 27,085 95,248 76,197 76,700 95,559 72,036 61,788 37,245 591,180Sulawesi 3,822 2,538 2,116 13,330 13,156 13,012 8,175 11,803 11,065 4,484 625 84,1261. South Sulawesi 2,622 2,070 667 3,321 7,565 3,619 3,196 2,253 1,518 605 10 27,4462. Center Sulawesi 0 0 0 2,361 4,150 6,923 2,548 5,100 4,646 2,721 72 28,5213. South East Sulawesi 1,200 468 1,449 7,648 1,441 580 1,233 2,235 2,702 400 543 19,8994. North Sulawesi 0 0 0 0 0 1,890 1,198 2,215 2,199 758 0 8,260Others 1,608 3,874 9,100 12,005 41,588 21,350 11,613 27,036 26,891 14,513 2,142 171,7201. West Nusa Tenggara 360 323 1,460 2,052 11,128 296 0 658 695 112 0 17,0842. East Nusa Tenggara 1,150 2,430 4,058 4,361 10,393 0 1,924 1,936 1,309 0 0 27,5613. Maluku 0 882 2,286 4,889 16,488 14,813 5,333 11,350 11,847 7,535 2,142 77,5654. Papua 0 0 0 0 0 6,241 2,356 12,460 12,698 6,866 0 40,6215. East Timor 98 239 1,296 703 3,579 0 2,000 632 342 0 0 8,889Total 52,679 79,552 136,957 150,918 333,729 296,786 326,448 390,542 266,609 180,506 135,631 2,350,357The total value is not including the number of local species plantation in 1993/1994 (71,895 ha) and Bali area in 1992/1993 (500 ha). Source: MoFEC, 1990-2000
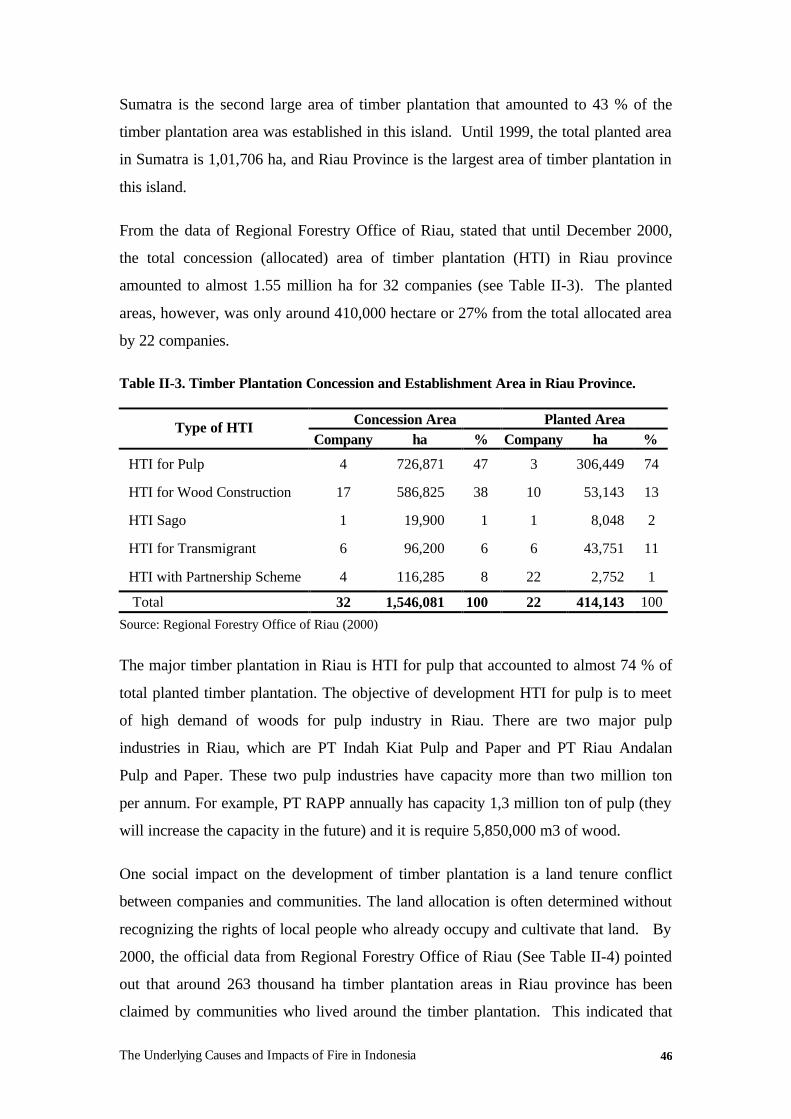
The Underlying Causes and Impacts of Fire in Indonesia 46
Sumatra is the second large area of timber plantation that amounted to 43 % of the
timber plantation area was established in this island. Until 1999, the total planted area
in Sumatra is 1,01,706 ha, and Riau Province is the largest area of timber plantation in
this island.
From the data of Regional Forestry Office of Riau, stated that until December 2000,
the total concession (allocated) area of timber plantation (HTI) in Riau province
amounted to almost 1.55 million ha for 32 companies (see Table II-3). The planted
areas, however, was only around 410,000 hectare or 27% from the total allocated area
by 22 companies.
Table II-3. Timber Plantation Concession and Establishment Area in Riau Province.
Concession Area Planted Area Type of HTI Company ha % Company ha %
HTI for Pulp 4 726,871 47 3 306,449 74
HTI for Wood Construction 17 586,825 38 10 53,143 13
HTI Sago 1 19,900 1 1 8,048 2
HTI for Transmigrant 6 96,200 6 6 43,751 11
HTI with Partnership Scheme 4 116,285 8 22 2,752 1
Total 32 1,546,081 100 22 414,143 100 Source: Regional Forestry Office of Riau (2000)
The major timber plantation in Riau is HTI for pulp that accounted to almost 74 % of
total planted timber plantation. The objective of development HTI for pulp is to meet
of high demand of woods for pulp industry in Riau. There are two major pulp
industries in Riau, which are PT Indah Kiat Pulp and Paper and PT Riau Andalan
Pulp and Paper. These two pulp industries have capacity more than two million ton
per annum. For example, PT RAPP annually has capacity 1,3 million ton of pulp (they
will increase the capacity in the future) and it is require 5,850,000 m3 of wood.
One social impact on the development of timber plantation is a land tenure conflict
between companies and communities. The land allocation is often determined without
recognizing the rights of local people who already occupy and cultivate that land. By
2000, the official data from Regional Forestry Office of Riau (See Table II-4) pointed
out that around 263 thousand ha timber plantation areas in Riau province has been
claimed by communities who lived around the timber plantation. This indicated that
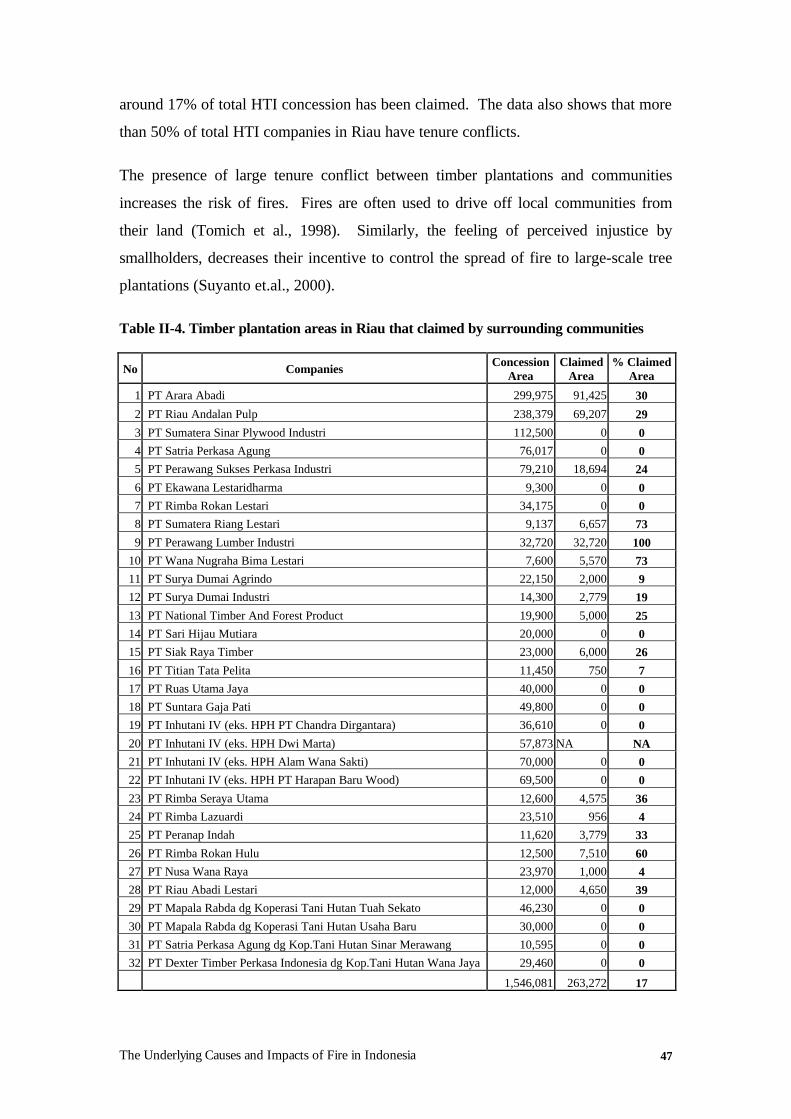
The Underlying Causes and Impacts of Fire in Indonesia 47
around 17% of total HTI concession has been claimed. The data also shows that more
than 50% of total HTI companies in Riau have tenure conflicts.
The presence of large tenure conflict between timber plantations and communities
increases the risk of fires. Fires are often used to drive off local communities from
their land (Tomich et al., 1998). Similarly, the feeling of perceived injustice by
smallholders, decreases their incentive to control the spread of fire to large-scale tree
plantations (Suyanto et.al., 2000).
Table II-4. Timber plantation areas in Riau that claimed by surrounding communities
No Companies Concession Area
Claimed Area
% Claimed Area
1 PT Arara Abadi 299,975 91,425 30
2 PT Riau Andalan Pulp 238,379 69,207 29 3 PT Sumatera Sinar Plywood Industri 112,500 0 0 4 PT Satria Perkasa Agung 76,017 0 0 5 PT Perawang Sukses Perkasa Industri 79,210 18,694 24 6 PT Ekawana Lestaridharma 9,300 0 0 7 PT Rimba Rokan Lestari 34,175 0 0 8 PT Sumatera Riang Lestari 9,137 6,657 73 9 PT Perawang Lumber Industri 32,720 32,720 100
10 PT Wana Nugraha Bima Lestari 7,600 5,570 73 11 PT Surya Dumai Agrindo 22,150 2,000 9 12 PT Surya Dumai Industri 14,300 2,779 19 13 PT National Timber And Forest Product 19,900 5,000 25 14 PT Sari Hijau Mutiara 20,000 0 0 15 PT Siak Raya Timber 23,000 6,000 26 16 PT Titian Tata Pelita 11,450 750 7 17 PT Ruas Utama Jaya 40,000 0 0 18 PT Suntara Gaja Pati 49,800 0 0 19 PT Inhutani IV (eks. HPH PT Chandra Dirgantara) 36,610 0 0 20 PT Inhutani IV (eks. HPH Dwi Marta) 57,873 NA NA 21 PT Inhutani IV (eks. HPH Alam Wana Sakti) 70,000 0 0 22 PT Inhutani IV (eks. HPH PT Harapan Baru Wood) 69,500 0 0 23 PT Rimba Seraya Utama 12,600 4,575 36 24 PT Rimba Lazuardi 23,510 956 4 25 PT Peranap Indah 11,620 3,779 33 26 PT Rimba Rokan Hulu 12,500 7,510 60 27 PT Nusa Wana Raya 23,970 1,000 4 28 PT Riau Abadi Lestari 12,000 4,650 39 29 PT Mapala Rabda dg Koperasi Tani Hutan Tuah Sekato 46,230 0 0 30 PT Mapala Rabda dg Koperasi Tani Hutan Usaha Baru 30,000 0 0 31 PT Satria Perkasa Agung dg Kop.Tani Hutan Sinar Merawang 10,595 0 0 32 PT Dexter Timber Perkasa Indonesia dg Kop.Tani Hutan Wana Jaya 29,460 0 0
1,546,081 263,272 17
The Underlying Causes and Impacts of Fire in Indonesia 48
References
Barber, C.V and Schweithelm, J. 2000. Trial by Fire. Forest Fire and Forestry Policy in Indonesia’s Era of Crisi and Reform. World Resources Institute in Collaboration with WWF Indonesia and Telapak Indonesia Foundation.
Kartodihardjo, H and Supriono, A. 2000. The Impacts of Sectoral Development on Natural Forest Conversion and Degradation: The Case of Timber and Tree Crop Plantations in Indonesia. Center for International Forestry Research (CIFOR). Occasional Paper No. 26(E). Bogor. Indonesia.
Suyanto, S., Ruchiat, Y., Stolle, F. and Applegate, G. 2000. The Underlying Causes and Impacts of Fires in South-east Asia. Site 3. Tanah Tumbuh, Jambi, Indonesia. Site Report. CIFOR, ICRAF, USAID, and USFS. Bogor. Indonesia.
Tomich, T.P., Fagi, A.M., de Foresta, H., Michon, G., Murdiyarso, D., Stolle, F. and van Noorwijk, M. 1998. Indonesia’s Fires: Smoke as a Problem, Smoke as a Symptom. Agroforestry Today, 10 (1): 4 - 7.
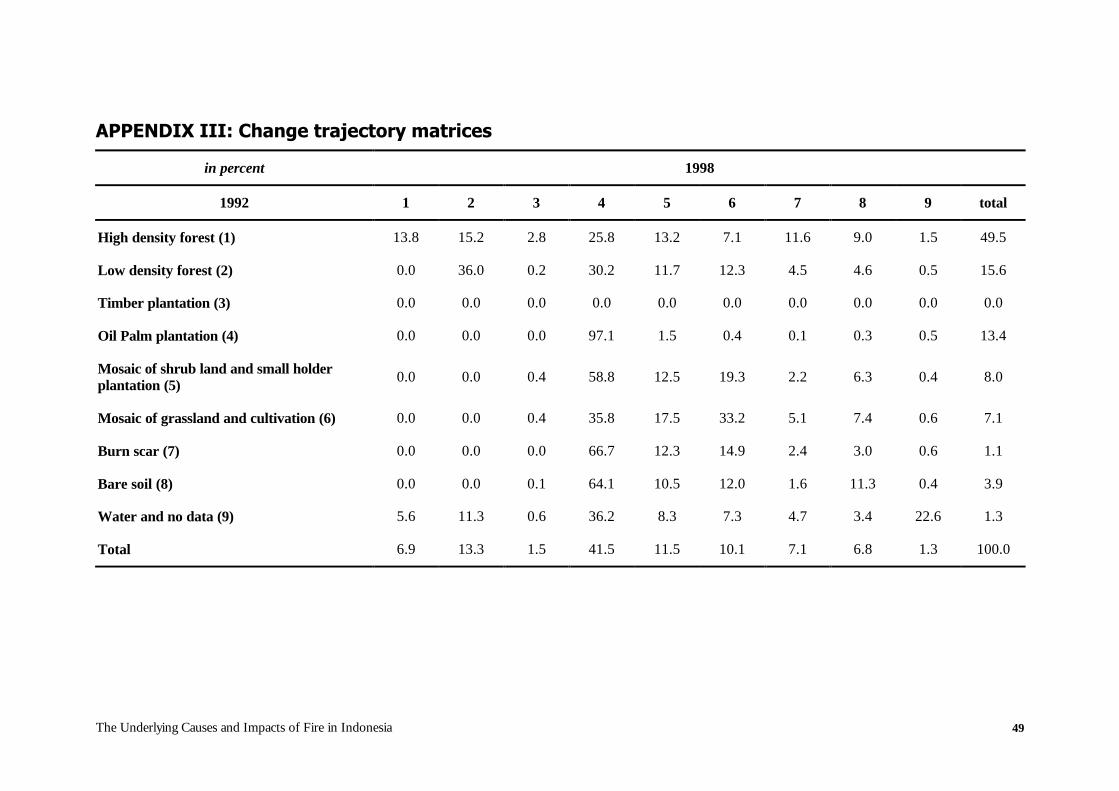
The Underlying Causes and Impacts of Fire in Indonesia 49
APPENDIX III: Change trajectory matrices
in percent 1998
1992 1 2 3 4 5 6 7 8 9 total
High density forest (1) 13.8 15.2 2.8 25.8 13.2 7.1 11.6 9.0 1.5 49.5
Low density forest (2) 0.0 36.0 0.2 30.2 11.7 12.3 4.5 4.6 0.5 15.6
Timber plantation (3) 0.0 0.0 0.0 0.0 0.0 0.0 0.0 0.0 0.0 0.0
Oil Palm plantation (4) 0.0 0.0 0.0 97.1 1.5 0.4 0.1 0.3 0.5 13.4
Mosaic of shrub land and small holder plantation (5) 0.0 0.0 0.4 58.8 12.5 19.3 2.2 6.3 0.4 8.0
Mosaic of grassland and cultivation (6) 0.0 0.0 0.4 35.8 17.5 33.2 5.1 7.4 0.6 7.1
Burn scar (7) 0.0 0.0 0.0 66.7 12.3 14.9 2.4 3.0 0.6 1.1
Bare soil (8) 0.0 0.0 0.1 64.1 10.5 12.0 1.6 11.3 0.4 3.9
Water and no data (9) 5.6 11.3 0.6 36.2 8.3 7.3 4.7 3.4 22.6 1.3
Total 6.9 13.3 1.5 41.5 11.5 10.1 7.1 6.8 1.3 100.0
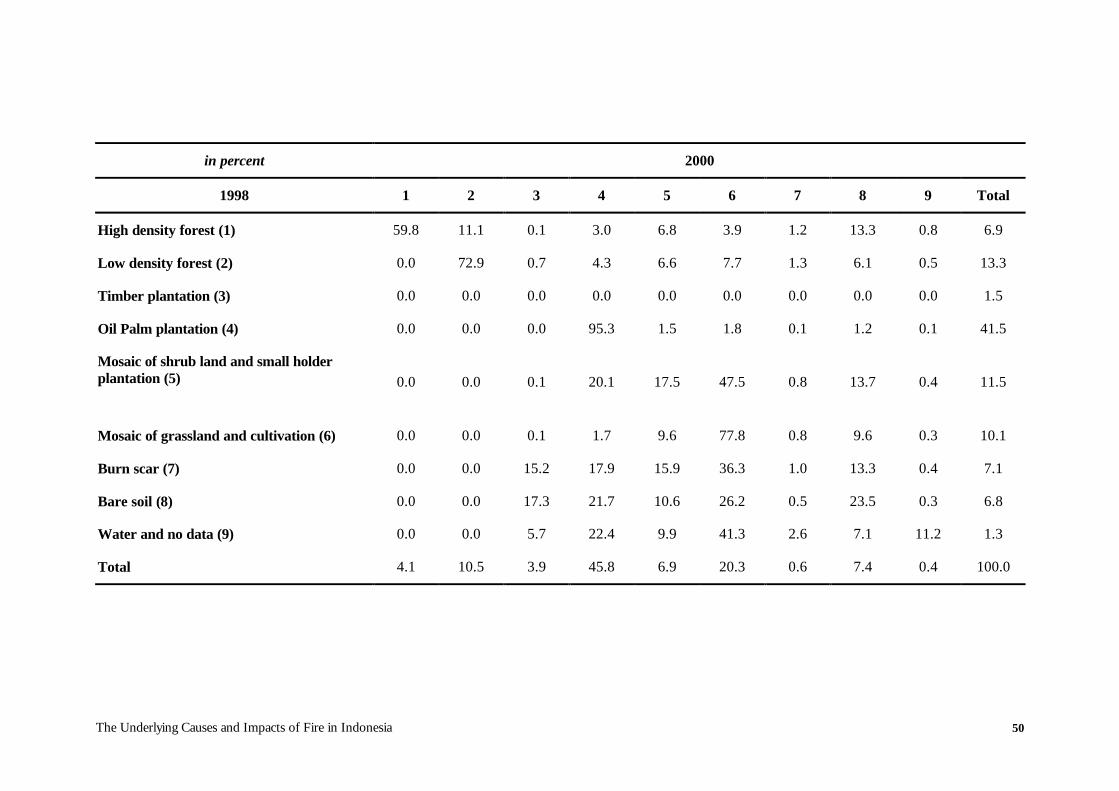
The Underlying Causes and Impacts of Fire in Indonesia 50
in percent 2000
1998 1 2 3 4 5 6 7 8 9 Total
High density forest (1) 59.8 11.1 0.1 3.0 6.8 3.9 1.2 13.3 0.8 6.9
Low density forest (2) 0.0 72.9 0.7 4.3 6.6 7.7 1.3 6.1 0.5 13.3
Timber plantation (3) 0.0 0.0 0.0 0.0 0.0 0.0 0.0 0.0 0.0 1.5
Oil Palm plantation (4) 0.0 0.0 0.0 95.3 1.5 1.8 0.1 1.2 0.1 41.5
Mosaic of shrub land and small holder plantation (5)
0.0 0.0 0.1 20.1 17.5 47.5 0.8 13.7 0.4 11.5
Mosaic of grassland and cultivation (6) 0.0 0.0 0.1 1.7 9.6 77.8 0.8 9.6 0.3 10.1
Burn scar (7) 0.0 0.0 15.2 17.9 15.9 36.3 1.0 13.3 0.4 7.1
Bare soil (8) 0.0 0.0 17.3 21.7 10.6 26.2 0.5 23.5 0.3 6.8
Water and no data (9) 0.0 0.0 5.7 22.4 9.9 41.3 2.6 7.1 11.2 1.3
Total 4.1 10.5 3.9 45.8 6.9 20.3 0.6 7.4 0.4 100.0