Embed Size (px)
Citation preview

Astronomy & Astrophysics manuscript no. Atek˙Lya˙astroph c© ESO 2008May 22, 2008
On the detectability of Lyα emission in star-forming galaxies ? ??
???
The role of dustHakim Atek1†, Daniel Kunth1, Matthew Hayes2‡ , Goran Ostlin2 and J. Miguel Mas-Hesse3
1 Institut d’Astrophysique de Paris (IAP), 98bis boulevard Arago, 75014 Paris, France†e-mail: [email protected]
2 Stockholm Observatory, AlbaNova University Centre, 106 91 Stockholm, Sweden‡ present address: Observatoire de Geneve, 51, Ch. des Maillettes, CH-1290, Sauverny, Switzerland
3 Centro de Astrobiologıa (CSIC–INTA), 28850 Torrejon de Ardoz, Spain
Received date; accepted date
ABSTRACT
Context. Lyman-alpha (Lyα) is now widely used to investigate the galaxy formation and evolution in the high redshift universe. .However, without a rigorous understanding of the processes which regulate the Lyα escape fraction, physical interpretations of high-zobservations remain questionable.Aims. To examine six nearby star-forming galaxies to disentangle the role of the dust from other parameters such as gas kinematics,geometry and ISM morphology in the obscuration of Lyα. Thereby we aim to understand the Lyα escape physics and infer theimplications for high-redshift studies.Methods. We use HST/ACS to produce continuum-subtracted Lyα maps, and ground-based observations (ESO/NTT and NOT) tomap the Hα emission and the extinction E(B-V) in the gas phase derived from the Balmer decrement Hα/Hβ.Results. When large outflows are present, the Lyα emission appears not to correlate with the dust content, confirming the role ofthe Hi kinematics in the escape of Lyα photons. In the case of a dense, static Hi covering, we observe a damped absorption with adeclining relationship between Lyα and E(B-V).We found that the Lyα escape fraction does not exceed 10% in all our galaxies and is mostly about 3% or below. Finally, because ofthe radiative transfer complexity of the Lyα line, star formation rate based on Lyα luminosity is underestimated with respect to thatderived from UV luminosity. Simple reddening correction does not reconcile SFR(Lyα) with the total star formation rate.Conclusions. The dust is not necessarily the main Lyα escape regulatory factor. ISM kinematics and geometry may play a moresignificant role.The failure of simple dust correction to recover the intrinsic Lyα/Hα ratio or the total star formation rate should prompt us to be morecautious when interpreting high-z observations and related properties, such as SFRs based on Lyα alone. To this end we propose amore realistic calibration for SFR(Lyα) which accounts for dust attenuation and resonant scattering effects via the Lyα escape fraction.
Key words. Galaxies: starburst – Galaxies: ISM – Ultraviolet: galaxies – ISM: dust, extinction – Galaxies: individual: (Haro 11,ESO 338-04, NGC 6090, IRAS 08339+6517, SBS 0335-052, Tololo 65)
1. Introduction
The Lyman-alpha emission (Lyα) has become the most pow-erful tracer of star-formation in the high-redshift universe. It be-comes the strongest emission line in the optical and near infrared(NIR) domain at redshift z ≥ 2.1, and is likely to remain a very
Send offprint requests to: H. Atek? This work was supported by the Centre National d’Etudes Spatiales
(CNES). It is based on observations made with the NASA/ESA HubbleSpace Telescope, obtained at the Space Telescope Science Institute,which is operated by the Association of Universities for Research inAstronomy, Incorporated under NASA contract NAS 5-26555. Theseobservations are associated with programs #GO 9470 and #GO 10575.?? Based on observations made with ESO Telescopes at the La SillaObservatories under programme IDs 073.B-0785 and 70.B-0639??? A part of data presented here have been taken using ALFOSC,which is owned by the Instituto de Astrofisica de Andalucia (IAA) andoperated at the Nordic Optical Telescope under agreement between IAAand the NBIfAFG of the Astronomical Observatory of Copenhagen
competitive tool, even with the advent of extremely large tele-scopes (ELTs) and the James Webb Space Telescope (JWST). Itis widely used as an efficient detection and redshift confirmationtool for distant galaxies, to derive star formation rates (SFRs), aswell as to probe the ionisation state of the intergalactic medium(IGM) at the final stage of the reionisation epoch. In this way, thelast decade has been the high-redshift era, in which the devel-opment of new techniques and facilities have allowed the explo-ration of the properties of galaxy population, resulting in a majorimprovement in our understanding of the distant Universe.
The importance of the Lyα emission line in the cosmologicalcontext was predicted very early by Partridge & Peebles (1967),who suggested that young high-z galaxies, undergoing their firststar formation events, should be detectable thanks to their strongLyα emission. Unfortunately, the first attempts to detect such ob-jects stand in contrast with those predictions. Indeed, initial sur-veys (e.g. Pritchet & Hartwick 1989; Djorgovski & Thompson1992; de Propris et al. 1993) failed to discover the predictedspace density of Lyα emitters. Unsuccessful campaigns and faint
arX
iv:0
805.
3501
v1 [
astr
o-ph
] 2
2 M
ay 2
008
2 H. Atek et al.: Lyα emission in star-forming galaxies
Lyα fluxes were attributed to the dust attenuation coupled tothe resonant scattering of the Lyα line (see Pritchet 1994, fora review). The first break-through came with the observationsof Cowie & Hu (1998) and Hu et al. (1998) which encouragedhigh-efficiency surveys for high-z LAEs detection. Most no-tably, two techniques are now used to detect high-z galaxies. TheLyman Break Technique (Steidel et al. 1996) uses the absorp-tion bluewards the Lyα absorption edge to detect the so-calledLyman Break Galaxies (LBGs). Narrow-band imaging surveysthat make use of the Lyα recombination line produced by thereprocessed absorbed radiation to target Lyman-Alpha Emitters(LAEs). The success that has been attributed to these techniqueshas given Lyα a key-role in the context of understanding the dis-tant universe. Besides its use in the identification of galaxies, itis used to put constraints on the cosmic reionisation (Malhotra &Rhoads 2004; Kashikawa et al. 2006; Dijkstra et al. 2007), andto study the clustering properties and morphology of galaxiesto the highest redshifts (Hamana et al. 2004; Ouchi et al. 2005;Murayama et al. 2007). Finally, it allows the estimation of thestar formation rates at high redshift (Kudritzki et al. 2000; Fujitaet al. 2003; Pirzkal et al. 2007).
The Lyα star formation rate is typically derived using theHα calibration relation (Kennicutt 1998) and assuming a caseB recombination theory for the Lyα/Hα line ratio. Nevertheless,SFRs inferred from the UV continuum are found to be incon-sistent with SFR(Lyα). It appears that SFR(Lyα) is typicallylower than SFR(UV) by a factor of several (Ajiki et al. 2003;Taniguchi et al. 2005; Tapken et al. 2007; Gronwall et al. 2007).Correction for internal reddening may, in principle, reconcilethese two indicators. Yet different extinctions experienced bythe continuum and the emission line may arise due to geomet-rical effects (Calzetti et al. 1994; Giavalisco et al. 1996), andradiative transfer effects of the Lyα line make this issue farfrom being resolved. This demonstrates that caution should betaken when using such a calibration. This need for caution isfurther demonstrated in cosmological studies where only a frac-tion of UV-selected galaxies show Lyα in emission (Shapleyet al. 2003). Furthermore some high-z studies have unveiled veryhigh rest frame Lyα equivalent widths (EWs, Rhoads et al. 2003;Finkelstein et al. 2007) and it seems unlikely that such high EWscan result from the ionising output of a normal stellar population.In the case of inhomogeneous ISM, where the dust is distributedin neutral clouds, with an ionised inter-could medium, Neufeld(1991), and later Hansen & Peng Oh (2006) have shown thatLyα photons could potentially escape easier than continuum ra-diation. In this scenario, intrinsic Lyα EWs are expected to beenhanced, resulting in the large values observed in those studies.
Many efforts have been devoted to understanding the physi-cal processes that govern the fraction of escaping Lyα photons,regarding its potential cosmological importance. Early observa-tions at low redshift (Meier & Terlevich 1981; Deharveng et al.1985; Terlevich et al. 1993) have shown Lyα to be much weakerthan predictions or even absent from starburst galaxies. Thisweakening was first attributed to the dust attenuation, confirmedby the correlation observed between EWLyα and the metallic-ity (Charlot & Fall 1993). These interpretations notwithstand-ing, Giavalisco et al. (1996) reached the opposite conclusion,finding no clear correlation between EWLyα or Lyα/Hβ and E(B-V). Furthermore, dust correction failed to recover the intrinsicLyα/Hβ ratio predicted by case B recombination theory. Recentspectroscopic studies have outlined the Lyα ”observational puz-zle”. Kunth et al. (1994) and Thuan & Izotov (1997), with theGoddard High Resolution Spectrograph (GHRS) and the SpaceTelescope Imaging Spectrograph (STIS), have found damped
Lyα absorption in IZw 18 and SBS 0335-052, the most metal-deficient galaxies known at low-z. In the purely dust-regulatedmodel, a prominent Lyα emission feature would be expected.On the other hand Lequeux et al. (1995) have found strong Lyαemission in a much more metal- and dust-rich starburst Haro 2.Further studies have shed light on the mechanisms by which Lyαphotons may escape their host. Kunth et al. (1998) observed Lyαmorphologies ranging from emission to absorption in 8 low-zstarbursts. They found systematic blueshifts between Lyα fea-ture and Low Ionisation State (LIS) metal absorption features inthe ISM when Lyα is seen in emission, indicative of an outflow-ing neutral medium. P-cygni profiles, with a redshifted emissionpeak with respect to the systemic velocity, were also found inthese spectra. Furthermore, Mas-Hesse et al. (2003) made use ofhydrodynamic models (Tenorio-Tagle et al. 1999) to propose aunified physical picture for the variety of observed Lyα profilesas a function of the evolution of the burst and the viewing ge-ometry. They found that the Lyα emission visibility and shapeare mostly driven by the kinematical configuration of the neutralgas. Likewise, over the past few years, theoretical works and nu-merical simulations have been developed with the same purpose.Ahn et al. (2003) and Verhamme et al. (2006) have shown howthe variety of Lyα profiles are mostly driven by the expansion ofa super-bubble of neutral gas and the properties of the ISM (Hicolumn density and dust content). Hansen & Peng Oh (2006) uti-lized the original idea of Neufeld (1991) to investigate the effectsof a multi-phase ISM. More cosmological-oriented simulations(Tasitsiomi 2006) have been carried out, although the effects ofdust remain to be treated. The simulations are currently able todeal with arbitrary intrinsic emission characteristics, hydrogendensity, velocity fields and dust distributions (Verhamme et al.2006), and to consistently reproduce the Lyα profiles observedin z ∼ 3 LBGs (Verhamme et al. 2007; Schaerer & Verhamme2008).
The complex nature of the Lyα escape probability revealedby low-z spectroscopic studies, gave a rise to additional issues.The resonant scattering phenomenon of Lyα line may cause Lyαphotons to travel and to be emitted far from their production siteshence to be spatially uncorrelated with non-resonant radiation(Hα or continuum photons). UV-targeted spectroscopic studiesmay therefore miss a significant fraction of the Lyα emissionif scattered away from the aperture. Ionised holes in the ISMmay also allow the escape of Lyα photons in a spatially lim-ited region, and transmission may vary greatly on small scalesacross the starburst region. These consideration are the motiva-tion for our Lyα imaging survey with the Advanced Camera forSurvey (ACS) on board the Hubble Space Telescope (HST). Wehave observed a hand-picked sample of six nearby star-forminggalaxies, with the aim of exploring a large range of relevant pa-rameters. Preliminary results have been presented in Kunth et al.(2003), and more detailed studies on ESO 338-04 (Hayes et al.2005) and Haro 11 (Hayes et al. 2007). Emission and absorp-tion were found on very small scales in central regions of thestarburst while absorption is observed in front of many of thebrightest UV sources.
In this article, besides the HST observations, we make useof ground-based observations from the ESO New TechnologyTelescope (NTT) and the Nordic Optical Telescope (NOT) tomap Hα and Hβ emission and derive the extinction from theBalmer decrement (Hα/Hβ). Investigating correlations betweenE(B-V) and Lyα emission enables us to disentangle the roleof the dust from other parameters in the Lyα escape mecha-nism, and investigate the implications of proper dust correctionon high-redshift studies. The paper is structured as follows: In

H. Atek et al.: Lyα emission in star-forming galaxies 3
Table 1. Targets general properties. E(B-V)MW is the Galactic extinction given by Schlegel et al. (1998) and MB magnitudes are inAB system. References: 1: Bergvall & Ostlin (2002), 2: Papaderos et al. (2006), 3: Gonzalez Delgado et al. (1998), 4: Izotov et al.(2001)
Target Other RA(2000) Dec(2000) E(B − V)MW z 12+ MB RefName Name log(O/H)
Haro 11 ESO 350-38 00:36:52.5 -33:33:19 0.049 0.020598 7.9 -20 1SBS 0335-052 SBS 0335-052E 03:37:44.0 -05:02:40 0.047 0.013486 7.3 -17 2IRAS 08339+6517 PGC 024283 08:38:23.2 +65:07:15 0.092 0.019113 8.7 -21 3Tololo 65 ESO 380-27 12:25:46.9 -36:14:01 0.074 0.009 7.6 -15 4NGC 6090 Mrk 496 16:11:40.7 +52:27:24 0.020 0.029304 8.8 -21 3ESO 338-04 Tol 1924-416 19:27:58.2 -41:34:32 0.087 0.009633 7.9 -19 1
Target Hα Hα continuum Hβ Hβ continuum
Camera/Filter Exp. Camera/Filter Exp. Camera/Filter Exp. Camera/Filter Exp.ESO/NTT observationsHaro 11 EMMI-R/598 900 EMMI-R/597 1200 SuSI2/549 2866 EMMI-R/770 1800SBS 0335-052 EMMI-R/598 1800 EMMI-R/596 4800 SuSI2/548 900 EMMI-R/771 4500ESO 338-04 EMMI-R/597 1800 SuSI2/778 3600 SuSI2/719 2400 EMMI-R/771 4500Tololo 65 SuSI2/709 1200 SuSI2/778 1200 SuSI2/719 3600 SuSI2/717 1800
NOT observationsIRAS 08339+6517 ALFOSC/70 2400 ALFOSC/78 3000 ALFOSC/113 5000 ALFOSC/17 3300NGC 6090 ALFOSC/53 4200 ALFOSC/78 2400 ALFOSC/40 3600 ALFOSC/17 2100
Table 2. Ground-based observations of our six targets. Northern targets have been observed with the Nordic Optical Telescopeand southern ones with ESO New Technology Telescope. Hα, Hβ online and respective continuum observations are listed withthe instrument and filter name and the exposure time (in seconds) in each band.
Section 2 we describe the observations and the data reduction,in Section 3 we present the results, Section 4 is dedicated to thediscussion of these results and finally in Section 5 we presentour conclusions. We assume throughout this paper a cosmologyof H0=72 km s−1 Mpc−1, ΩM=0.3 and ΩΛ=0.7.
2. OBSERVATIONS AND DATA REDUCTION
Our sample contains six local starburst galaxies that have beenhand-picked in order to cover a range of relevant intrinsic param-eters. Based upon UV-properties, the selection covers a rangeof dust content, luminosity and the variety of observed Lyαprofiles: firstly, the sample consists of four Lyα emitters fromCalzetti & Kinney (1992), among which candidates represent-ing a range in line profiles are selected (Kunth et al. 1998; Mas-Hesse et al. 2003). Two known Lyα absorbers are also includedfrom Thuan & Izotov (1997). General information and proper-ties are given in Table 1
2.1. HST observations
Two general observer programmes, with the Hubble SpaceTelescope (HST), have been devoted for the observations of thesix targets: GO9470 that makes use of the Solar Blind Channel(SBC) of the Advanced Camera for Surveys (ACS) in orderto observe Lyα online (F122M) and continuum (F140LP), andGO10575 using the High Resolution Camera (HRC) and WideField Camera (WFC) to obtain Hα, near-UV and optical con-
tinuum broad band observations. Detailed description of theseobservations is presented in Ostlin et al. (2008).
All images are ’drizzled’ using the MULTIDRIZZLE taskin STSDAS package under NOAO/IRAF onto the same pixelscale (0.025′′ pix−1) and the same orientation. Remaining shiftsare corrected with GEOMAP and GEOTRAN, and cosmic raysremoved using CREDIT task. The images for each target arethen convolved to the same Point Spread Function (PSF) usingDIGIPHOT/DAOPHOT, with the worse PSF image as reference.
The production of continuum subtracted Lyα images fromF122M (online) and F140LP (offline) is not trivial and needssophisticated techniques for many reasons. The effective wave-length of the continuum filter is rather far from the online filter(∆λ/λ ' 0.22) and the UV continuum between the two filters de-viates significantly from a power law ( fλ ∝ λβ) and is sensitive toage and E(B-V). Neglecting these considerations and describingthe behavior of the UV continuum near Lyα with a power lawyielded results ranging from absorption to strong emission ac-cording to the values set to β. Preliminary results, by Kunth et al.(2003), pointed out these limitations and the need for an elabo-rated subtraction method. Subsequently, Hayes et al. (2005) and,in more details, Hayes et al. (2008) presented a reliable extrap-olation from F140LP to F120M described by the ContinuumThroughput Normalization factor (CTN). To estimate the CTNin each pixel, all the images from F122M to F814W are used tofit the Starburst99 spectral evolutionary models (Leitherer et al.1999; Vazquez & Leitherer 2005). Summarily, the method uses

4 H. Atek et al.: Lyα emission in star-forming galaxies
filters that sample the UV continuum slope and the 4000Å breakto fit burst age and stellar E(B-V) using χ2 minimisation. Thenthe nebular contribution and the stellar components are treatedindependently. Indeed, Hα image is used to constrain the nebu-lar gas contribution to the total SED, while V and I images allowto estimate the stellar part. The gas spectrum is subtracted andage and mass are fitted in two stellar components.
To generate Starburst99 models, we set the metallicity as de-rived from observations of each object: for IRAS 08339+6517and NGC 6090 Z = 0.02, for Haro 11 and ESO 338-04
Z = 0.004, and for SBS 335-052 and Tololo 65 Z = 0.001.Though Hayes et al. (2008) show that an error below 50% onthe metallicity does not significantly affect the continuum sub-traction, the metallicity estimate remains the factor driving theaccuracy of the subtraction method.
A standard Salpeter (1955) IMF is used (α = 2.35, dN =M−αdM) in the range 0.1M to 120M. Multi-stellar componentfitting, used for continuum subtraction, is almost completely in-sensitive to the IMF slope and mass range. Finally, an instan-taneous burst scenario is adopted as it is more appropriate forindividual pixels but the choice of a constant star formation sce-nario would not affect global photometry of the galaxies or thecontribution of the underlying stellar population.
2.2. ground-based observations
The southern targets of our sample (cf. Table 2) have beenobserved using the New Technology Telescope (NTT) at LaSilla (ESO) during the nights of 18, 19 and 20 September 2004(apart from Tololo 65 which was observed in service mode on28 January 2003). Narrow-band imaging was performed for alltargets in Hα, Hβ and [Oiii]λ5007Å, and nearby continuum foreach line. The first night of the run, 18th Sept, the seeing wasconsistently below 1.2′′, yet the presence of thin cirrus preventsa direct calibration using standard stars. Observational condi-tions on the night of 19 Sept were excellent: photometric skyand sub-arcsec seeing. On the last night the seeing was worse,exceeding 2′′, although the photometric quality was still good.Spectrophotometric standard stars Feige110, LDS749B, GD50and GD108, selected from Oke (1990) catalog, were observedat regular intervals during each night and in each filter. Both theESO Multi-Mode Instrument (EMMI) (Dekker et al. 1986) andSuper Seeing Imager 2 (SuSI2) (D’Odorico et al. 1998) wereused interchangeably. A binning of 2×2 pixels was used, givingplate-scales of 0.332′′ pix−1 and 0.161′′ pix−1, and fields-of-viewof 9.1 × 9.9′ and 5.5 × 5.5′ for EMMI-R and SuSI2 respectively.NTT observations are summarized in table 2 together with ESOfilter codes. The good seeing observations of the night 18 Septare calibrated using secondary standard stars in the field fromthe photometric night 19 and/or 20 Sept.
The remaining northern targets (IRAS 08339+6517 andNGC 6090) were observed with the Nordic Optical Telescope(NOT) at La Palma during the nights of 14, 15 and 16February 2004, using the Andalucia Faint Object Spectrographand Camera (ALFOSC). Unfortunately, the observational condi-tions were not photometric during the observing run. For NGC6090, we used observations taken on March 28th 2006 underphotometric conditions. The calibration was performed usingBD33 standard star. Our science images were then calibrated us-ing field stars from 2006 observations in each filter. For IRAS08339+6517 , in the same purpose, we made use of HST im-ages. Firstly, calibrated Hα images are rescaled to the ALFOSCpixel-plate (0.19′′ pix−1). Aperture photometry is then obtained
and used for the calibration of the ground-based Hα observa-tions. The Hβ continuum images are calibrated using rescaledF435W images and Hβ online images are then calibrated with re-spect to the continuum images using photometry of several starsin the field of view. Global estimates for IRAS 08339+6517 arethe least accurate of the galaxy sample due to the less-than-idealcalibration of Hβ. However, pixel-to-pixel measurements sufferfrom similar uncertainties, therefore pixel-to-pixel trends are asreliable as they are in any other target, irrespective whether theexact E(B-V) is perfect.
Data were first reduced using the standard NOAO/IRAF proce-dures. Images were bias-subtracted, and flat-field corrected us-ing well exposed sky and dome flats. Images were registeredusing field stars and the GEOMAP and GEOTRAN tasks, andimages from the same bands were coadded with inverse vari-ance weighting. Finally, all reduced frames for each target weresmoothed to the PSF of the worst seeing image using GAUSS.
Hα images were corrected for [Nii] contamination and bothHα and Hβ images corrected for underlying stellar absorption.[Nii] contamination is estimated from Nii λ6583Å/Hα found inliterature (see Table 3) and the ratio Nii λ6584Å/Nii λ6548Å ' 3(Osterbrock 1989).
Stellar absorption is estimated using the best-fittingStarburst99 spectrum given by the procedure described in Sec.2.1. Latest stellar atmospheres models are used in Starburst99stellar libraries (Martins et al. 2005), including full line-blanketing, which allows the best estimate of equivalent widthof the Hα and Hβ stellar absorption features.
Finally, using the Balmer decrement Hα/Hβ, assuming a caseB intrinsic line ratio of 2.86 (Osterbrock 1989) at a temperatureof 10,000 K, we can derive the E(B-V) in the gas phase usingthe parameterization of Cardelli et al. (1989) and the equation:
E(B − V)Hα/Hβ =2.5 × log(2.86/Robs)
k(λα) − k(λβ)(1)
where Robs = fHα/ fHβ is the absolute observed flux ratio, andk(λα), k(λβ) are the extinction curves at Hα and Hβ wavelengthsrespectively. According to Cardelli et al. (1989), k(λα) ∼ 2.63and k(λβ) ∼ 3.71.
Target [NII] λ6583ÅHα Reference
Haro 11 0.189 Bergvall & Ostlin (2002)ESO 338-04 0.031 Bergvall & Ostlin (2002)NGC 6090 0.411 Moustakas & Kennicutt (2006)IRAS 08339+6517 0.25 Margon et al. (1988)SBS 0335-052 0.003 Izotov et al. (1997)Tololo 65 0.005 Izotov et al. (2004)
Table 3. Hα correction for Nii contamination with referenceswhere the ratio has been taken from.
2.3. Uncertainties
The calibration of individual images in Hα and Hβ lines aresubject to classical errors in the data reduction procedure. Theorigin of the uncertainty comes from the flux measurement of
H. Atek et al.: Lyα emission in star-forming galaxies 5
the calibration standard stars. This accounts for about 5% in ourobservations. Errors of the order of few percent may be producedby other effects, such as residuals in the flat-field corrections,residuals in the sky background and continuum subtraction. Wemake the assumption that all these effects will lead to an error onthe flux measurement of the order of 10%. Moreover, we are pro-ducing extinction maps by dividing Hα by Hβ images, and, forsome galaxies, these images are obtained with different instru-ments (i.e. different plate-scales and orientations), the errors onimages alignment and registration may lead to quite significantuncertainties, since we aim, in our science analysis, to investi-gate the Lyα and dust amount variations on a pixel scale. Theprocedure to estimate the impact of such misalignments was thefollowing:
The RMS of the alignment fit given by GEOMAP is about0.2 pixel. Consequently, to estimate the misalignment (and onlyto that purpose), we have rebinned Hα and Hβ images to a newpixel size (1/5 of the original pixel size). Then we have creatednew images with artificial shifts by +1,0 or -1 pixel in x andy directions. This gives us 9-image data cube for both Hα andHβ. Using all combinations of Hα and Hβ shifted images wederived the ratio Hα/Hβ and constructed an E(B-V) data cube.We eventually computed the standard deviation of the extinction,σE(B−V), at each pixel [x,y].
Misalignment errors are also a concern for the Lyα imagewith respect to Hα and online images with respect to contin-uum ones. This could result in errors on the Lyα/Hα ratio andthe equivalent widths. The estimation of these quantities takesinto account this uncertainty. Besides, we have accounted forthe uncertainties of the Lyα continuum subtraction procedure byassuming a statistical error of 10% of the Lyα flux. This uncer-tainty depends, in reality, on the signal-to-noise in each resolu-tion element where the continuum is fitted, and the value adoptedhere corresponds to S/N=5%. The final error bars are shown onthe scatter plots in Sect. 3. For the sake of readability we plot themean errors instead of individual errors for each point. When theemission is dominated by the conglomerate points of the diffusehalo (which is the case for most of the plots), we show ratherthe mean computed between only the maximum and minimumvalues, in order to cover the full range of error variations.
3. Analysis
HARO 11 – The Hα image in Fig. 1 in the first column showsa complex morphology with three main star-forming condensa-tions (Kunth et al. 2003). The continuum subtracted Lyα imagedoes not delineate this morphology, showing Lyα in emission inonly knot C, whereas it is seen in absorption in knot A and B.The decoupling of Lyα from continuum is clearly observable inthe bottom frame, which represents Lyα map at HST resolutionoverlayed by FUV (1500Å) contours. The emission exhibits twodifferent components consisting of a central bright knot and alow surface brightness diffuse emission. It seems that, examin-ing the extinction map, the diffuse component is not quite regu-lated by the dust amount. Moreover, the bright Lyα emission inknot C, corresponds to a high extinction region.
This galaxy is a well known Lyα emitter (Kunth et al. 1998),while the detection of Lyman continuum leakage by Bergvallet al. (2006) is still controversial (Grimes et al. 2007). It hasbeen studied in more details in Hayes et al. (2007).
ESO 338-04 – In the second column of Fig. 1, the Lyα imageshows three main absorption regions and a surrounding bright
emission. The absorption sites correspond to relatively dusty re-gions of the galaxy seen in the extinction map, which traps Lyαphotons, while the emission is not correlated with the dust con-tent. The last component is, again, the diffuse emission aroundand overall the galaxy, with a low surface brightness, which isshowing up the resonant decoupling of Lyα photons. Many dustfeatures are clearly visible in the E(B-V) map, with a clumpy-like structure, and following roughly the Hα structure.
The Lyα image is produced by matching the HST/ACS im-age to the NTT resolution. This results in spreading out the cen-tral absorption to more extended region, revealing small new ab-sorption features around and dimming the surface brightness ofthe emission component. The bottom frame shows again howLyα is uncorrelated with the FUV continuum which traces un-obscured star formation sites.
NGC 6090 – Third column in Fig. 1 shows that the interactingsystem NGC 6090 exhibits Lyα emission from each component,at a distance of about 6′′ from each other. The emission is peak-ing around low extinction regions, and the overlapping regionbetween the two components, where no emission is seen appearsvery dusty. The extinction map of NGC 6090 shows dust patternlike a spiral structure and no evident correlation with the ionisedgas traced by the Hα emission is seen.
The main Hα structures correspond to the Lyα emissioncomponents, although the largest Lyα emission represents asmall region in Hα, and vice-versa. This discrepancy may bedue the large amount of dust in the upper left component thatcould destroy a part of Lyα photons. Knot A appears also dustier(EB−V,gas ∼ 0.75) than knot B (EB−V,gas ∼ 0.55).
IRAS 08339+6517 – This nuclear starburst shows a spiralstructure conspicuous on the Hα (Fig 2) and FUV continuumimages (the latter is not shown here). However the Lyα imagedoes not resemble any of them, showing a central bright emis-sion and the ubiquitous halo component. The FUV contours ex-hibit much more details in the arms of the galaxy consisting inmany star clusters where Lyα is absent.
The extinction map indicates a dust-free central spot. Thedust distribution has no clear relationship with the emissionmaps.
SBS 335-052 – The dust distribution is apparently correlatedwith the Hα emission in this galaxy. In Fig. 2, the brightest re-gion in Hα presents the most important amount of dust. Are alsovisible in both images a shell structure and a dust-free regiontoward the S-E of the bright region.
The bright dusty spot corresponds to a relatively high Lyαabsorption region. The galaxy shows Lyα only in absorption sur-rounded by a faint diffuse emission. It appears that, despite abright Hα or FUV continuum emission, no Lyα photons manageto escape directly without scattering on neutral hydrogen.
Tololo 65 – In the last column of Fig. 2, no Lyα structurecan be seen for this galaxy, though the HST image shows someemission features (bottom frame), they have been smoothed tothe NTT resolution. Degrading the resolution of the HST im-age leads to ghost features since the emission becomes as weakas the background level and is swallowed up. These artefacts inthe background, although less dramatical, are also present in theother galaxies. The Hα map presents a two-components emis-

6 H. Atek et al.: Lyα emission in star-forming galaxies
Fig. 1. Galaxy imaging (Part 1): From top to bottom: Hα Lyα, E(B-V)gas map, and Lyα as seen by HST overlayed with FUVcontours. Inverted logarithmic scale is used, showing emission in black and absorption in white. The extinction map is overlayedwith the mask generated following the description in Sect. 4. Regions out of the contour are excluded from our study. The dustiestregions are in black. from left to right with the FoV and spatial scale in parentheses: Ground-based images (top three rows): Haro11 (17′′, 0.4 kpc/′′), ESO 338-04 (17′′, 0.2 kpc/′′), and NGC 6090 (19′′, 0.57 kpc/′′); HST images (last row): Haro 11 (13′′), ESO338-04 (15′′), and NGC 6090 (21′′). North is down and East to the right.

H. Atek et al.: Lyα emission in star-forming galaxies 7
Fig. 2. Galaxy imaging (Part 2): From top to bottom: Hα, Lyα, E(B-V)gas map, and Lyα as seen by HST overlayed with FUVcontours. Inverted logarithmic scale is used, showing emission in black and absorption in white. The extinction map is overlayedwith the mask generated following the description in Sect. 4. Regions out of the contour are excluded from our study. The dustiestregions are in black. from left to right with the FoV in parentheses: Ground-based images (top three rows): IRAS 08339+6517 (15′′,0.38 kpc/′′), SBS 335-052 (4′′, 0.27 kpc/′′), Tololo 65 (8′′, 0.18 kpc/′′); HST images (last row): IRAS 08339+6517 (14′′), SBS335-052 (5′′), Tololo 65 (8′′). North is up and East to the left.

8 H. Atek et al.: Lyα emission in star-forming galaxies
Fig. 3. Haro 11 scatter plots. Top-left: Lyα surface brightness as a function of the extinction determined from the Balmer decrement.Regions of knots A, B, C and the diffuse emission are marked in the figure and represented with different colors and differentsymbols: Emission is in red, absorption is in blue (knot A) and green (knot B), and the diffuse emission component is in cyan. Forthe remaining plots, the same color code is used for the respective regions. Top-right: Lyα equivalent width vs E(B-V). Bottom-left:Hα equivalent width vs E(B-V). Bottom-right: Lyα/Hα ratio vs E(B-V). Overplotted on all figures the error bars corresponding tothe uncertainties estimated in Sec. 2.3
sion that resembles the structure of the dust content in the E(B-V) map.
In order to investigate the Lyα emission variations and pos-sible correlations with dust or other parameters at the smallestpossible scale, we have produced scatter plots from the images.In extinction maps obtained in Fig. 1 each point represents onepixel in the galaxy region which has been isolated by maskingthe background at 5σ level. Regions of interest, such as star-forming knots and emission or absorption features, are pickedup using circular apertures and represented with different colorsand symbols on the figures.
3.1. Blended emission and absorption systems
Haro 11 – The first plot in Fig. 3 presents the correlation be-tween the Lyα emission and the extinction determined from theBalmer decrement tracing the dust in the gas phase (EB−V,gas).The color-code represents different regions of interest consist-ing of circular apertures centered on the three main knots of thegalaxy, which are marked on the Lyα image. We can see a dif-fuse emission component extending up to EB−V ∼ 1.5. Knot Cshows a bright and spread emission with a mean extinction of
0.48, while the absorption is essentially localised around knot Aand B. The mean extinctions in each knot are derived using theratio of integrated Hα and Hβ fluxes within the correspondingapertures.
The presence of two distinct emission components is indica-tive of two different physical processes implied in the escapeof Lyα photons. Firstly the diffuse component that shows theresonant decoupling of Lyα photons resonantly scattered on hy-drogen atoms until they escape far away from there productionsites (thus, experiencing a large range of extinction). On theother hand, the emission from knot C is less spread and rep-resents photons escaping directly from this small region with amean extinction EB−V ∼ 0.48. The Lyα resonant decoupling isalso visible in Fig. 4 representing the correlation between theLyα and the Hα fluxes in log-scale, hence, showing only pos-itive pixels (in emission). We observe a first component at alow and roughly constant Lyα surface brightness (around 10−14
erg s−1 cm−2 arcsec−2), independent of Hα emission. Thanks totheir resonant scattering, Lyα photons reach regions where non-resonant photons, such as Hα, are absent, making the Lyα/Hαratio higher than the Case B level (represented by a dashed linein the figure). The second component at higher Lyα and Hαfluxes ( fLyα ≥ 10−14 erg s−1 cm−2 arcsec−2 ) is always below thepredicted recombination value. These pixels represent regions

H. Atek et al.: Lyα emission in star-forming galaxies 9
Fig. 5. ESO 338-04 scatter plots. Top-left: Lyα surface brightness vs E(B-V). Emission from the central region is in red, Absorptionin the central region (knot A) is represented in blue (knot A), the surrounding emission is in red, and the diffuse emission componentis in cyan. Same color code applied in all the plots. Top-right: Lyα equivalent width vs E(B-V). Bottom-left: Hα equivalent width vsE(B-V). Bottom-right: Lyα/Hα ratio vs E(B-V). Error bars correspond to the uncertainties estimated in Sect. 2.3
Fig. 4. Pixel distribution of the Lyα against Hα surface bright-ness. A logarithmic scale is used and hence shows only positivecontribution (emission). The dashed line represents the case Brecombination ratio. The galaxy name is given in each plot.
where Lyα photons escape directly from their production sitewhere Hα is also produced.
That we see Lyα in emission from knot C with EB−V ∼ 0.48whereas absorption is seen in knots A and B with EB−V ∼ 0.2 and0.41 respectively is interesting. Indeed Lyα photons manage toescape from regions with higher extinction than those of a pureabsorption. The dust content is clearly not the main driver in theescape process of Lyα photons. A great covering of static Hicolumn density in knot A and an expanding neutral ISM and/orionised Hii holes in knot C may lead to this observation.
Looking at Lyα equivalent width, we observe that the diffuseemission shows relatively high EWLyα whereas the pure emis-sion equivalent width in knot C (in red) is much weaker. Thissuggests that a hard FUV radiation could create ionised holesthrough which Lyα photons may escape, in a inhomogeneousdistribution of Hi and dust. In this case of multi-phase ISM, ithas been shown (Neufeld 1991; Hansen & Peng Oh 2006) that,thanks to their scattering on the dusty Hi clumps, Lyα escapes inan easier way than non-resonant photons. We also observe thatthe diffuse emission (in cyan) corresponds to the highest equiv-alent width observed (EWLyα higher than 200 Å), since it repre-sents photons that have scattered far away from their productionsites and escape where the Lyα continuum is lower. This declinein the emission is, again, symptomatic of the resonant nature ofLyα photons. Indeed, when we plot the equivalent width of Hαagainst the extinction, we do not see any correlation, as we ex-pect for non-resonant lines, since the online and the continuum
10 H. Atek et al.: Lyα emission in star-forming galaxies
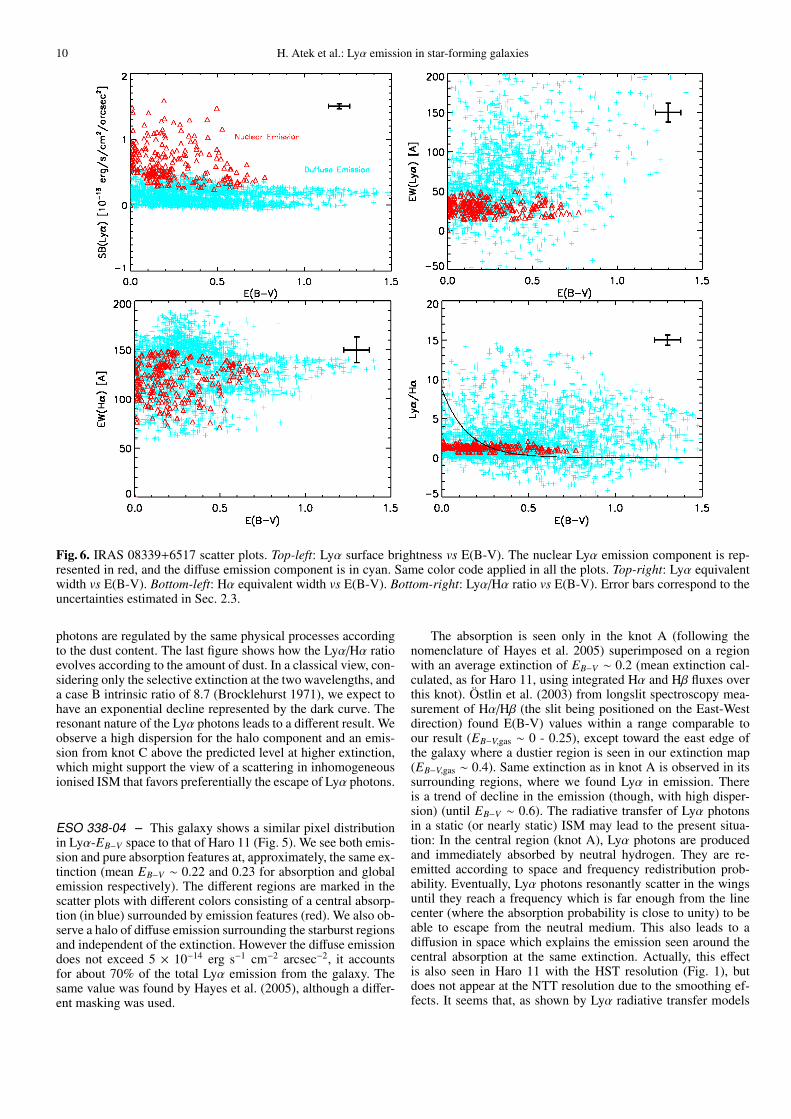
Fig. 6. IRAS 08339+6517 scatter plots. Top-left: Lyα surface brightness vs E(B-V). The nuclear Lyα emission component is rep-resented in red, and the diffuse emission component is in cyan. Same color code applied in all the plots. Top-right: Lyα equivalentwidth vs E(B-V). Bottom-left: Hα equivalent width vs E(B-V). Bottom-right: Lyα/Hα ratio vs E(B-V). Error bars correspond to theuncertainties estimated in Sec. 2.3.
photons are regulated by the same physical processes accordingto the dust content. The last figure shows how the Lyα/Hα ratioevolves according to the amount of dust. In a classical view, con-sidering only the selective extinction at the two wavelengths, anda case B intrinsic ratio of 8.7 (Brocklehurst 1971), we expect tohave an exponential decline represented by the dark curve. Theresonant nature of the Lyα photons leads to a different result. Weobserve a high dispersion for the halo component and an emis-sion from knot C above the predicted level at higher extinction,which might support the view of a scattering in inhomogeneousionised ISM that favors preferentially the escape of Lyα photons.
ESO 338-04 – This galaxy shows a similar pixel distributionin Lyα-EB−V space to that of Haro 11 (Fig. 5). We see both emis-sion and pure absorption features at, approximately, the same ex-tinction (mean EB−V ∼ 0.22 and 0.23 for absorption and globalemission respectively). The different regions are marked in thescatter plots with different colors consisting of a central absorp-tion (in blue) surrounded by emission features (red). We also ob-serve a halo of diffuse emission surrounding the starburst regionsand independent of the extinction. However the diffuse emissiondoes not exceed 5 × 10⁻¹⁴ erg s−1 cm−2 arcsec−2, it accountsfor about 70% of the total Lyα emission from the galaxy. Thesame value was found by Hayes et al. (2005), although a differ-ent masking was used.
The absorption is seen only in the knot A (following thenomenclature of Hayes et al. 2005) superimposed on a regionwith an average extinction of EB−V ∼ 0.2 (mean extinction cal-culated, as for Haro 11, using integrated Hα and Hβ fluxes overthis knot). Ostlin et al. (2003) from longslit spectroscopy mea-surement of Hα/Hβ (the slit being positioned on the East-Westdirection) found E(B-V) values within a range comparable toour result (EB−V,gas ∼ 0 - 0.25), except toward the east edge ofthe galaxy where a dustier region is seen in our extinction map(EB−V,gas ∼ 0.4). Same extinction as in knot A is observed in itssurrounding regions, where we found Lyα in emission. Thereis a trend of decline in the emission (though, with high disper-sion) (until EB−V ∼ 0.6). The radiative transfer of Lyα photonsin a static (or nearly static) ISM may lead to the present situa-tion: In the central region (knot A), Lyα photons are producedand immediately absorbed by neutral hydrogen. They are re-emitted according to space and frequency redistribution prob-ability. Eventually, Lyα photons resonantly scatter in the wingsuntil they reach a frequency which is far enough from the linecenter (where the absorption probability is close to unity) to beable to escape from the neutral medium. This also leads to adiffusion in space which explains the emission seen around thecentral absorption at the same extinction. Actually, this effectis also seen in Haro 11 with the HST resolution (Fig. 1), butdoes not appear at the NTT resolution due to the smoothing ef-fects. It seems that, as shown by Lyα radiative transfer models

H. Atek et al.: Lyα emission in star-forming galaxies 11
Fig. 7. NGC 6090 scatter plots. Top-left: Lyα surface brightness vs E(B-V). Emission from knot A is in red, and from knot B is ingreen. Diffuse emission component is represented as usual in cyan. Same color code applied in all the plots. Top-right: Lyα equiv-alent width vs E(B-V). Bottom-left: Hα equivalent width vs E(B-V). Bottom-right: Lyα/Hα ratio vs E(B-V). Error bars correspondto the uncertainties estimated in Sec. 2.3.
(e.g. Verhamme et al. 2006), Lyα photons do not easily escapefrom where they have been produced but scatter in space andfrequency avoiding absorption by HI atoms at line center (ν0 =2.46 × 10¹⁵ Hz).
We note in Fig. 5 very high Lyα equivalent width, rangingfrom -10 Å for the absorption (blue) to ∼250 Å in the surround-ing emission (red). Such high EW might be due either to theresonant scattering mechanism that allows Lyα photons to travelwhere continuum photons can not, or to a multi-phase configu-ration of the ISM where, Hansen & Peng Oh (2006) noted forreasonable HI column density and dust amount, that continuumis preferentially extinguished, boosting the initial EW easily bya factor of 2-5. This configuration may also explain the highEWLyα observed in some high-redshift galaxies, extending upto 150 Å in LALA z ∼ 5.7 sources (Rhoads et al. 2003) in thecase of spectroscopically confirmed candidates (higher possibleequivalent widths were found in the imaging survey). On theother hand, Hα equivalent width map shows similar distributionto that of Haro 11 without any correlation.
The last frame shows the evolution of Lyα/Hα ratio with theextinction. In the central region around knot A, Lyα/Hα followsloosely the theoretical curve (marked in black).
However, the absorption region does not show any trend ofdecrease in Lyα/Hα ratio. Rather, we see a dispersion, as seen inthe Lyα-EB−V plot, ranging from EB−V ∼ 0 to 0.5.
3.2. Emission systems: NGC 6090 & IRAS 08339+6517
Both of these galaxies exhibit Lyα only in emission, with littlesigns of direct absorption, as we have seen on Fig. 1 and 2. Asusual, the first plot in Fig. 6 and 7 shows Lyα flux function ofthe color excess EB−V . In both systems, we do see the diffusecomponent independent of EB−V at low Lyα flux.
Although, the calibration procedure used for IRAS08339+6517 data is not accurate (see section 2.2), the averageextinction found for this galaxy ( EB−V ∼ 0.12 ) is still close tothe value estimated by Gonzalez Delgado et al. (1998).
STIS spectroscopy (Mas-Hesse et al. 2003) revealed a P-Cygni profile, with a red wing shifted by ∼ 300 km s−1 withrespect to the Hii region velocity determined from the opticalemission lines. The extension of the neutral gas shell is found tobe very large, with a diameter of around 10 kpc, which is largerthan the aperture used here to isolate the emission region in thecenter of the galaxy (∼ 2 kpc). Thus, the central emission (redcomponent) is observed through an expanding shell approachingus at a velocity of ∼ 300 km s−1.
Same Lyα profile has been observed for NGC 6090 byGonzalez Delgado et al. (1998), with a velocity offset with re-spect to blueshifted interstellar absorption lines, indicative oflarge scale high-velocity outflows of gas, of several hundredkm s−1. We differentiate two emission blobs (red for A and greenfor B in Fig. 7). Component A appears at a mean E(B-V) around

12 H. Atek et al.: Lyα emission in star-forming galaxies
Fig. 8. SBS 335-052 scatter plots. Top-left: Lyα surface brightness vs E(B-V). The damped central absorption is represented in red,and the diffuse emission component is in cyan. Same color code applied in all the plots. Top-right: Lyα equivalent width vs E(B-V). Bottom-left: Hα equivalent width vs E(B-V). Bottom-right: Lyα/Hα ratio vs E(B-V). Error bars correspond to the uncertaintiesdescribed in Sec. 2.3.
0.74 whereas the second one at E(B-V) ∼ 0.54. The diffuse emis-sion, also in this galaxy, is the only component that attains therecombination level (Figure 4) while its bulk stays quite below.
Again, regarding these two galaxies, the ISM kinematicsmust play an important role in the escape of Lyα photons throughneutral gas shells, making Lyα less sensitive to the dust con-tent. It leads to the observed dispersion in the emission over alarge range of extinction for these two galaxies. To confirm thisvisual inspection, we have performed a Spearman’s statisticaltest which gives the probability that a correlation between Lyαand EB−V exists. The Spearman’s correlation coefficient ρ cantake values from -1 to +1. A value of +1 shows that the vari-ables are perfectly correlated with a positive slope, a value of -1shows that the variables are anti-correlated (negative slope), anda value of 0 shows that the variables are completely indepen-dent. While we would expect an anti-correlation between thesetwo variables, we found ρ ∼ 0.15 for both galaxies (whereas ρ ∼-0.2 and -0.05 for Haro 11 and ESO 338-04 respectively), con-firming that Lyα is less sensitive to dust in these systems. ForSBS 335-052 we found ρ ∼ -0.56.
The Lyα equivalent width appears to be not correlated withthe dust in IRAS 08339+6517 . This absence of correlation isalso seen when observing the evolution of the line ratio Lyα/Hαwhich is around 2 and stays constant as the extinction increasessupporting the importance of the ISM kinematics.
The situation is slightly different for NGC 6090, where inknot A we see values more clearly above the theoretical Lyα/Hαcurve (as seen for Haro 11). In addition to kinematics, we maybe in presence of clumpy ISM configuration as well (as it is sug-gested by the images), that allows Lyα to get out through theionised inter-clouds medium. Furthermore, the two knots showdifferent equivalent widths: EWLyα ∼ 54 Å in knot A and 20 Åin knot B. Note that, the diffuse emission presents higher valuesbecause of the numerous resonant scatterings that have experi-enced these photons. This is still valid for Lyα/Hα ratio.
3.3. Damped absorption system: SBS 335-052
HST/GHRS spectroscopy (Thuan et al. 1997) has revealed thesemetal-deficient BCDs to be damped Lyα absorbers. They don’tshow, indeed in our images, any direct emission but a low sur-face brightness diffuse halo. The Lyα photons manage to escapefrom these galaxies after multiple scattering events. Figure 8shows how Lyα is related to different physical parameters. Wesee, for SBS 335-052, in the first frame, a weak diffuse compo-nent which accounts for the whole Lyα emission. In a classicalvision, where dust is the main parameter responsible of the de-struction of Lyα photons, we expect a declining relationship be-tween Lyα flux and the dust extinction. It is precisely what weobserve in this galaxy. A strong absorption ( fLyα ∼ −3 × 10⁻¹²

H. Atek et al.: Lyα emission in star-forming galaxies 13
erg s−1 cm−2 arcsec−2) is seen, with a weak declining trend in therange 0 <
∼ EB−V<∼ 0.7. This result suggests that the dust is play-
ing, in this case, an important role in the escape of Lyα photons.Very Large Array 21 cm observations (Thuan & Izotov 1997)show the BCD to be embedded in a large Hi cloud. The Hi col-umn density in the GHRS aperture derived by these authors isvery large, N(Hi) = 7.0 × 1021 cm−2. According to Mas-Hesseet al. (2003) and the evolutionary models of Tenorio-Tagle et al.(1999), this galaxy is a very young starburst of which the ageof the stellar population is too small to have ionised the wholesurrounding medium, leading to a great amount of neutral gascovering the massive stars. In addition, the Hi cloud is static withrespect to the central Hii region as the 21 cm and the emissionline velocities are in good agreement. As a result, the Lyα pho-tons after a large scattering process on hydrogen atoms increasetheir mean path and the probability to be absorbed by dust grains.The combination of a great Hi column density in front of theLyα production sites and the absence of kinematics in this neu-tral envelope makes Lyα photons very likely to be destroyed bydust, hence turning the dust extinction into a very important Lyαescape regulator. This configuration, with the related dust corre-lations, was observed for the knot A in Haro 11. It also appearsthat the Lyα equivalent width is declining with the extinction.
TOLOLO 65, in the same way, shows very weak Lyαemission through a diffuse component without direct emission.GHRS spectrum (Thuan & Izotov 1997) shows, with an accept-able signal-to-noise ratio although poorer than that of SBS 335-052, that this galaxy is a pure Lyα absorber. This is consistentwith the very faint and diffuse emission found here, which is stillnot significantly greater than the background level where the de-graded resolution wipes out the absorption seen in the originalHST/ACS image by Ostlin et al. (2008).
4. Discussion
Rather than the detailed description performed in the last section,for each galaxy to investigate how Lyα emission is related toother parameters, especially dust, at a small scale; we discusshereinafter the global characteristics of the galaxies based uponthe integrated quantities in defined apertures. These aperturesare defined for all the galaxies by masking regions that showsf(Hβ) below a threshold of 5 times the standard deviation of thebackground in the Hβ image. This study of course does not allowany meaningful statistics with only six galaxies in our hands,that have been however selected in order to sample the largestpossible starburst physical parameters. Yet we can outline someinteresting trends when compared to the small-scale approachand how far some properties could be smoothed, or not, at thegalaxy scale.
4.1. The role of the dust in Lyα obscuration
We show in Table 4 the photometric properties of our sample,integrated in an aperture defined by a mask based upon a Hβ fluxthreshold above the sky level, in order to get the extended emis-sion of the Balmer lines and the Lyα diffuse emission. As men-tioned before, all the quantities presented have been correctedfor galactic extinction using Schlegel et al. (1998) method. Theintegration of the Lyα flux within the mask aperture results infive candidates of our sample being emitters and only one netabsorber (SBS 335-052). Defining this galaxy as a net absorbermeans that the sum of the flux overall the galaxy gives a negativeresult, however we do see emission in some regions. Though, theflux and the measurements derived from are very sensitive to the
Fig. 9. Scatter plot of integrated quantities, representing in eachgalaxy the Lyα equivalent width as a function of the extinction.E(B-V) is derived from the ratio between the integrated Hα andHβ fluxes. The legend of symbols assigned to the galaxies areshowed in the inset. We have included in this plot the two com-ponents of NGC 6090 that we have considered separately.
aperture size. We can expect that we are losing a part of the weakdiffuse Lyα emission and the most extended Hα or Hβ emission,which could be attained by deeper observations. Thus, measure-ments such as the escape fraction of Lyα may change accordingto the adopted mask size since Lyα can scatter further from theproduction sites than Balmer or continuum photons.
The Lyα/Hα ratio ranges from -1.12 to 1.36, showing Lyαemission much weaker for all the sample than predicted by re-combination theory even, in most cases, when corrected for thedifferential extinction at these different wavelengths. Previousobservations (Terlevich et al. 1993; Giavalisco et al. 1996)yielded the same conclusions. The dust is just the final stageof the process responsible for the obscuration of Lyα photons,after the resonant scattering in an homogeneous medium thatincrease their mean path, which makes the recombination rationot only regulated by the dust (as seen from the Hα/Hβ ratiowhich traces the nebular dust). Setting the Lyα equivalent widthagainst the different parameters of Table 4 ends up with no cleartrends. Plotting the Lyα equivalent width against E(B-V) allowsus to probe the difference in extinction between resonant andnon-resonant radiations, knowing that EWLyα is not affected bythe selective extinction (i.e. independent of the dust extinctioncurve). We see, indeed, in Fig. 9, a rather scattered data pointsand no well-observed correlation. Since we are dealing with res-onant radiation investigated from only one line-of-sight one ex-pect that the geometry and the distribution of the dust layersaround the emitting regions may affect the observed scatter ofEWLyα according to the extinction. This relation depends alsoon the intrinsic EWs.
When we calculate the dereddened ratio (Lyα/Hα)C , ratherthan EWLyα, in Table 4, we observe that it lies below the re-combination value (8.7), expected if the extinction is only due todust, for five galaxies. Only NGC 6090 shows (Lyα/Hα)C thatexceeds this recombination level. Since the resonant Lyα radi-ation is spatially decoupled from continuum or Balmer lines,the Lyα photons may suffer different extinction than traced bythe Balmer decrement and lead to this overestimation of thereddening correction. In other words, the Lyα photons that aredetected and survived to numerous scattering and various ex-tinctions, have been travelling through ISM regions where dust

14 H. Atek et al.: Lyα emission in star-forming galaxies
Target Aperture fLyα fHα fHβ Lyα/Hα (Lyα/Hα)C Hα/Hβ EW(Lyα) EW(Hα)Size (erg s−1 cm−2) (erg s−1 cm−2) (erg s−1 cm−2) (Å) (Å)
Haro 11 143 (23) 1.3e-12 2.3e-12 5.48e-13 0.57 5.48 4.14 22.8 523ESO 338-IG04 267 (10) 2.5e-12 2.5e-12 8.1e-13 0.98 1.69 3.12 15.8 479SBS 0335-052 3.40 (0.23) -4.0e-13 3.6e-13 9.9e-14 -1.12 -4.8 3.62 -27 808NGC 6090 147 (49) 6.6e-13 1.4e-12 2.1e-13 0.46 82 6.66 62 180IRAS 08339+6517 157 (23) 3.1e-12 2.3e-13 6.9e-13 1.36 3 3.26 45.6 140Tololo 65 22.7 (0.75) 5.e-14 1.8e-13 4.9e-14 0.28 1.15 3.6 9.1 1153
Table 4. Integrated fluxes and equivalent widths for the six galaxies of the sample. The integration aperture is defined by maskingregions below a certain threshold based upon Hβ flux ( fHβ ≥ 5σ, where σ is the background standard deviation in the same line).The aperture size is given in the first column in (′′)2 and in kpc2 in parentheses. The quantities are corrected for galactic extinction(Schlegel et al. 1998) but not for internal reddening, except for (Lyα/Hα)C , which has been dereddened with EB−V,gas using Cardelliet al. (1989) parameterization.
amount locally departs from the average. Including a large partof the Lyα diffuse emission in the integration aperture could, forthe same reason, contribute to this effect.
We can retain from the above analysis that assuming simpledust extinction fails to recover the intrinsic Lyα/Hα ratio, wherethe role of the dust is, in most cases, underestimated because ofthe resonant scattering phenomenon of Lyα .
4.2. Galaxy sample and Lyα emission morphology
We present here a comparison of our sample properties totheir high redshift counterparts, such as Lyman Break Galaxies(LBGs). The FUV luminosity is that derived from integrationwithin the apertures based on FUV background mask and theradius corresponds to RUV =
√area/π. The galaxies span a
large range in FUV luminosity 8.3 ≤ log(LFUV/L) ≤ 10.3that reaches, for two galaxies, the characteristic LBGs lumi-nosity, and are relatively compact systems, similar to LBGsradii range (log(RUV (kpc))∼ 0-0.5). Accordingly, the FUV sur-face brightness lFUV of the sample corresponds to that ob-served in Ultraviolet Luminous Galaxies (UVLGs), as definedby Heckman et al. (2005), with lFUV ≥ 108 L kpc−2 that clas-sifies them in the ”compact” category. Figure 10 illustrates thecompacity of our galaxies among the UVLGs and LBGS, withtheir respective classification criteria on LFUV and lFUV overplot-ted. It is instructive to note, in reference to the present discus-sions related to local objects and the implications on high-z ob-servations discussed later, that Haro 11 and IRAS 08339+6517, could, regarding also their SFR and metallicity, be consideredas UVLGs and LBG analogs.
One of the consequences of the decoupling of Lyα from non-resonant radiation is the diffuse emission halo observed in all oursample. We present in Fig. 11 the fraction of this diffuse com-ponent with respect to the total Lyα flux as a function of theequivalent radius from the brightest emission source which hasbeen isolated in each galaxy to produce the scatter plots of Sect.3. The radius is yet derived from the surface size covered by theemission. SBS 335-052 and Tololo 65 are not represented on thefigure since they do not show any bright (direct) emission thatmight be identified as photons production sources and are onlydominated by a weak diffuse emission. At a distance of 2 kpc,the Lyα emission reaches 40% of the total galaxy emission inonly one galaxy, where for the remaining ones, it is still around
Fig. 10. FUV luminosity derived from F140LP flux (1500 Å) inunits of L versus galaxy radius (in kpc). The masking tech-nique based on the FUV background is applied to derive inte-grated LFUV and the equivalent radius RUV =
√area/π. The up-
per dotted line corresponds to compact-large UVLGs thresholdand lower ones are LBG limits in terms of lFUV (see text). LBGSand UVLGs spaces are marked on the figure.
20% or below. We need to integrate until 3 to 10 kpc (dependingon galaxies) to account for the whole Lyα flux. These consider-ations are relative to the threshold level reached by the observa-tions. We consider, because of the masking technique, that above80% of the total emission we are background limited. However,we can infer from these plots that the bulk of Lyα emission con-sists of a low surface brightness region.
The situation is slightly different in the galaxies not plottedfor which the decrease of the surface brightness with radius isless steeper for reasons stated above. This illustrates the domi-nation of the photon diffusion mechanism in the escape of Lyαphotons, which appears at low surface brightness and extends tolarge physical scale (several kpc).
4.3. Age and evolutionary effects
We have computed the mean age for each galaxy from the SEDfitting output in each resolution element with two stellar compo-nents as free parameters assuming in both of them an instanta-neous burst, and averaging over the whole integration aperture

H. Atek et al.: Lyα emission in star-forming galaxies 15
Fig. 11. Lyα emission morphology. The left plot shows the Lyαsurface brightness integrated in radius bins against the distancefrom the brightest emission center. On the right plot, we seethe evolution of the Lyα emission fraction cumulated in varyingapertures, as a function of the equivalent radius of these aper-tures. It shows what fraction of Lyα is emitted within a givenaperture around the bright emission center. SBS 335-052 andTololo 65, which show no direct bright but only weak diffuseemission, are not represented.
by weighting the age in each resolution element by the corre-sponding Hα luminosity:
mean age =
∑i LHα, i × agei∑
i LHα, i(2)
except for Tololo 65, for which no HST Hα image is availableand the luminosity in the B band is used for the weighting. Wealso carried out Monte Carlo simulations in order to estimate theerrors on the weighted age. Each pixel has been resampled with1000 data points and the fitting procedure is applied to this newsample. The standard deviation gives the 1-σ errors plotted inFig. 12.
The equivalent widths of strong hydrogen recombinationlines are known to be, in principle, good age indicators since theymeasure the ratio between young ionising over old non-ionisingradiations (Leitherer 2005, and references therein). In Fig. 12we observe an anticorrelation between Hα equivalent width andthe age of the galaxy. This is what is expected by SED mod-els (starburst99 for instance) for both Hα and Lyα equivalentwidths, for ages ≥ 1 Myr. This is due to the decrease of the ion-izing photons quantity and the increase of the number of starsthat contributes to increase the continuum with time. Howeverthe dispersion observed is symptomatic of the complexity of thisindicator in practise. EWHα can be affected, among other effects,by the difference in reddening between nebular and continuumradiations and also the contribution of underlying older stellarpopulation diluting the continuum.
Plotting the Lyα equivalent width yields a different result.EWLyα does not follow this evolutionary sequence where an in-crease is observed as function of the age. The present obser-vations show the additional complexity of Lyα with respect toHα radiation, since we are comparing in the same plot differentobjects with different mechanisms at work, such as expandingshell in some ones and static medium in others, and/or probablyclumpy ISM, that makes Lyα quite difficult to interpret in a gen-eral way. Large variations in the observed EWLyα are found inLBGs where most of them have likely the same intrinsic EWLyα.Schaerer & Verhamme (2008) have shown that for an extinc-tion of E(B-V)∼ 0.3 an intrinsic emission with EWLyα ≥ 60Å is transformed into an absorption, hence a negative observedEWLyα. Radiation transfer and dust effects can lead to large dif-ferences between intrinsic and observed Lyα equivalent widths.
In addition, the apparition and the evolution of superwinds isyet function of the age, and we can expect that EWLyα rises inthe presence of ISM kinematical effects. Because of the limitedstatistics, this could be considered only as a first step toward amore detailed and significant investigation. It is however worthnoting that the small age (∼ 2.6 Myr) of SBS 335-052 agreeswith our discussion about this galaxy as a young starburst em-bedded in a static Hi leading to a damped absorption. This is alsotrue for Tololo 65 (∼ 3.3 Myr) where no direct emission is seenand for which GHRS spectrum shows a damped absorption.
Fig. 12. Age correlations: The left plot shows the integratedEWLyα against the mean age integrated over the galaxy. On theright, EWHα is plotted as a function of the age. 1-σ errors onthe age fit are also shown. See text for age calculation and errorsestimate. Each point represents a galaxy and the legend is givenin the inset.
4.4. Reddening correction and star formation rate
The evolution of the LFIR/LFUV ratio provides an alternative toevaluate the reddening estimate reliability. We show in Fig. 13a weak correlation between this luminosity ratio and the UVcontinuum slope β derived from the SED fit. We have plottedon the same figure (in blue) the predicted relationship (Konget al. 2004) between LFIR/LFUV and β following Meurer et al.(1999). Our galaxies have the same dispersion behavior as thoseof Burgarella et al. (2005), overplotted as red points, which arethough more dusty and luminous in the IR. NGC 6090 fallsamong the red points as it is classified as LIRG and is a verydusty starburst with EB−V,gas ∼ 0.75). Three of our galaxies (NGC6090, Haro 11 and IRAS 08339+6517 ) appear to be LuminousInfrared Galaxies (LIRGs, log(LFIR) > 11 L). In contrast withIUE starburst sample of Meurer et al. (1999), Goldader et al.(2002) found, as for our galaxies, that LIRGs and ULIRGs oftheir sample fall above the line. Seibert et al. (2005) have alsoderived, using a large sample of galaxy types, a correction thatlowers the empirical LFIR/LFUV-β reddening relation and is thusalso in disagreement with our observations. The observed dis-crepancy suggests that a simple empirical law, is actually notrepresentative of the observations and the galaxies suffer appar-ently a higher attenuation than suggested by β. Star-formationrate is an essential diagnostic tool of the evolution of galaxies.It allows, since the high-redshift universe has became reachable,to study star-formation episodes and their evolution on a widerange of epochs (e.g. Madau et al. 1996; Giavalisco et al. 2004).Many indicators that ranges from rest-frame UV to infrared areused to estimate the SFR, and a commonly used one in the dis-tant universe is based on Lyα emission, since the window openedon the high-z candidates ended up with using the Lyα line as themain detection and investigation tool. One of the most critical is-

16 H. Atek et al.: Lyα emission in star-forming galaxies
Target log(LFUV ) log(LFIR) SFR(UV) SFR(Lyα) SFR(FIR) SFR(Hα) (SFRUV /SFRLyα) (SFRUV /SFRLyα)COR
Haro 11 10.3 11.1 5.1 1.07 21.7 16.33 4.77 0.53ESO 338-IG04 9.76 9.8 1.56 0.3 1.1 3.9 5.20 3.20SBS 0335-052 9.1 9.4 0.34 ... 0.4 1.1 ... ...NGC 6090 10.03 11.4 2.9 1.1 43.3 20.7 2.64 0.015IRAS 08339+6517 10.3 11.0 4.4 2.2 17.3 14 2 0.85Tololo 65 8.3 8.4 0.05 0.008 0.05 0.24 6.25 2.6
Table 5. Star formation rates and luminosities. LFUV is calculated with λ× fλ where λ=1525Å. fλ is the flux density in F140LP filter.LFIR is from Ostlin et al. (2008). Both are expressed in units of L,Bol (3.8×1033 ergs s−1). Star formation rates are derived fromthe integrated fluxes over apertures based on sky background threshold and using the calibration of Kennicutt (1998) (presented inunits of M yr−1). All quantities are corrected for galactic foreground extinction. The last column ratio only is corrected for internalreddening using EB−V,stars for SFRUV correction and EB−V,gas for SFRLyα one.
Fig. 13. LIR to LFUV ratio versus the UV slope β. Our galax-ies are plotted with the same symbols as in previous figures. βis determined from the SED fitting. The remaining red pointsare galaxies from ELAIS S1 observations in Burgarella et al.(2005). The law describing the relationship between FIR to FUVluminosity ratio and the slope β, deduced from UV observations(Kong et al. 2004) is overplotted (dashed blue line).
sues related to estimate the SFR, from UV or optical indicators,is the correction for internal reddening. One needs to properlyestimate the dust obscuration and therefore the intrinsic flux tomake a correct conversion to star-formation rate. This issue iseven more critical for the indicator based on Lyα emission, con-sidering the radiative transfer complexity of this line discussed inthis paper. Table 5 summarizes the SFRs computed from differ-ent indicators using Kennicutt (1998) calibrations. The conver-sion from flux to SFR from these calibrations assumes a contin-uous star formation regime in the equilibrium phase, whereas inour SED fitting procedure, used for the Lyα continuum subtrac-tion or age estimation, we have assumed an instantaneous burstscenario. Nevertheless, translating our results into star-formationrates gives a useful comparison with previous works using thesewidely used calibrations.
UV emission from galaxies traces the young stellar popula-tion and a conversion from UV luminosity to SFR can be com-puted across the UV range (1250-2500 Å). This estimation isvery sensitive to dust attenuation, because of the wavelength do-main and the patchy ISM (Kennicutt 1998)1. Alternatively, nebu-
1 SFRUV(M yr−1) = 1.4 × 10⁻²⁸ Lν(ergs s−1 Hz−1)
lar emission lines, such as Lyα, provides information on the ion-ising flux of the young massive stellar population with lifetimes< 20 Myr. Therefore, it provides a quasi-instantaneous estima-tion of the current star-formation rate. For case B recombinationtheory (Brocklehurst 1971) we have:
SFRLyα(M yr−1) = 9.1 × 10−43 L(Lyα) (ergs s−1) (3)
Yet, in addition to the IMF dependency, this method is highlysensitive to the extinction correction as we have mentioned be-fore. Figure 14 is illustrative of the reddening correction issue.Figure 14(a) represents SFR(Lyα) versus SFR(UV): for darkpoints neither SFR is corrected and for red points SFR(Lyα)is corrected using EB−V,gas and SFR(UV) using EB−V,stars . Inthe purpose of comparison, data from literature are also in-cluded. It is interesting to note the consistent discrepancy be-tween SFR(Lyα) and SFR(UV) (dark points) for both our sam-ple and objects from literature, including low- (Giavalisco et al.1996) and high-redshift galaxies (Taniguchi et al. 2005; Ajikiet al. 2003; Tapken et al. 2007). The lack of points under theline of equality at low SFR(Lyα) for high-z observations, is aconsequence of the completeness limit, for LAEs in particular,excluding faint Lyα emitters. Indeed, we expect, because of theresonance effects of Lyα to observe a scattered distribution be-low the line of slope unity providing one uses a statisticallysignificant sample. Such a distribution would help to charac-terize a potential upper limit of the discrepancy between res-onant and non-resonant SFR indicators. Such a diagram couldalso serve as an important probe for the galaxy evolution fromthe damped and/or young systems lying at SFRLyα ∼ 0, to moreevolved starburst events with higher ionised gas fraction and/orundergoing feedback outflows hence approaching the line whereSFRLyα ∼ SFRUV.
For our galaxies, in the case of observed values, SFR(Lyα) issystematically below the equal values line, underestimating SFRby a factor between 2 to 6 with respect to SFR(UV). This dis-crepancy, usually observed in high-z galaxies also, emphasizesthe highest attenuation of Lyα emission line with respect to UVcontinuum. The correction for dust attenuation, one of the mainresponsible of this discrepancy, brings the two star-formationrates in a better agreement except for NGC 6090.
When SFR derived from the UV is not corrected for absorp-tion, the SFR measured from the infrared should, in principle,be complementary, since radiation that is strongly absorbed inthe UV is re-emitted in the thermal IR 2. Figure 14(b) shows the”total” SFR (SFRUV + SFRFIR) where SFRUV is not corrected,
2 SFRFIR(M yr−1) = 4.5 × 10−44 LFIR(ergs s−1)

H. Atek et al.: Lyα emission in star-forming galaxies 17
(a) SFRLyα vs SFRUV (b) SFRTOT vs different SFRs
Fig. 14. Star formation rates: Figure 14(a) shows SFR derived from nebular emission line Lyα versus SFR derived from UV contin-uum. The dark points represent undereddened SFRs. Note that because of the logarithmic scale and for the sake of readability, wehave put galaxies for which SFRLyα=0 at SFRLyα=0.001. Observed SFRs from literature at low-z (Giavalisco et al. 1996, and IUEdata from NED) and high-z (Taniguchi et al. 2005; Ajiki et al. 2003, for LAEs) (Tapken et al. 2007, for LBGs) are also overplottedand explained in the legend. For our sample, the red points represent SFRLyα dereddened using EB−V,gas and SFRUV dereddenedusing EB−V,stars. The dashed line is for SFRLyα = SFRUV . Figure 14(b) represents SFR(UV+IR) (where SFRUV is not corrected forextinction) versus different corrected SFRs. The legend is also marked on the figure. Units are in M yr−1.
versus dereddened SFRLyα and SFRHα with EB−V,gas (dark andblue points), and SFRUV with EB−V,stars (red points). The cor-rected SFR(Lyα) is still below the total SFR for most of thegalaxies except for NGC 6090 where the dust correction highlyoverestimates the total SFR (we have discussed possible reasonsfor this overestimation in Section 4.1). Conversely, SFR derivedfrom corrected Hα (blue points) luminosity yields a better result.Similarly, the dereddened UV estimator (red points) places thegalaxies rather close to the line of equality.
Finally the different results found when deriving SFR fromLyα and others indicators such as Hα or UV, and in particular thefailure of Lyα indicator to recover the total SFR (UV + IR) evenwhen corrected for reddening, are indicative of the decouplingof resonant Lyα and non resonant (e.g. UV continuum or Balmerlines) radiation with respect to the dust obscuration and thereforethe difficulty to use this line as a reliable star formation indicator.
As an alternative, we can take advantage of the available in-formations of our observations to make a better estimate of thestar formation rate when only Lyα luminosity is known. We cancalculate the Lyα escape fraction using the corrected Hα fluxand assuming the case B recombination ratio Lyα/Hα:
fesc(Lyα) = f (lyα)/(8.7 × f (Hα)C) (4)f (Hα)C = f (Hα) × 10(1.048×E(B−V)gas) (5)
where f(lyα) is the observed flux and f (Hα)C is the Hα flux cor-rected pixel by pixel for internal reddening using Cardelli et al.(1989) extinction law. Unlike high-z observations, where in thebest case only the global UV slope is known, our present studygives access to accurate extinction information. Therefore, fesc isa good estimate of the intrinsic Lyα flux, since it takes into ac-count both dust obscuration and resonant scattering mechanismand hence allows us to correct the SFRLyα calibration (Eq. 3) asfollows:
SFRLyα(M yr−1) = (1/ fesc)×9.1×10−43 L(Lyα) (ergs s−1) (6)
The escape fractions obtained for the six galaxies are reported inTable 6. We can assume, in general terms, an escape fraction of5% as a mean ”statistical” value to deduce the appropriate SFRwhen fesc is not available. This correction is evidently subjectto uncertainties due to fesc variations, but is in any case morerepresentative of the reality than standard calibrations (Kennicutt1998, for instance).
The revised star formation rate based on L(Lyα) is equiva-lent, according to the definition of the escape fraction in Eq. 4,to SFR(Hα) corrected for reddening. Hence, it is represented onthe right plot of Fig. 14 by the blue points, which appears to givea better estimation of the total SFR than that given by the SFRLyαcorrected for only dust obscuration.
4.5. Implications for high-redshift galaxies
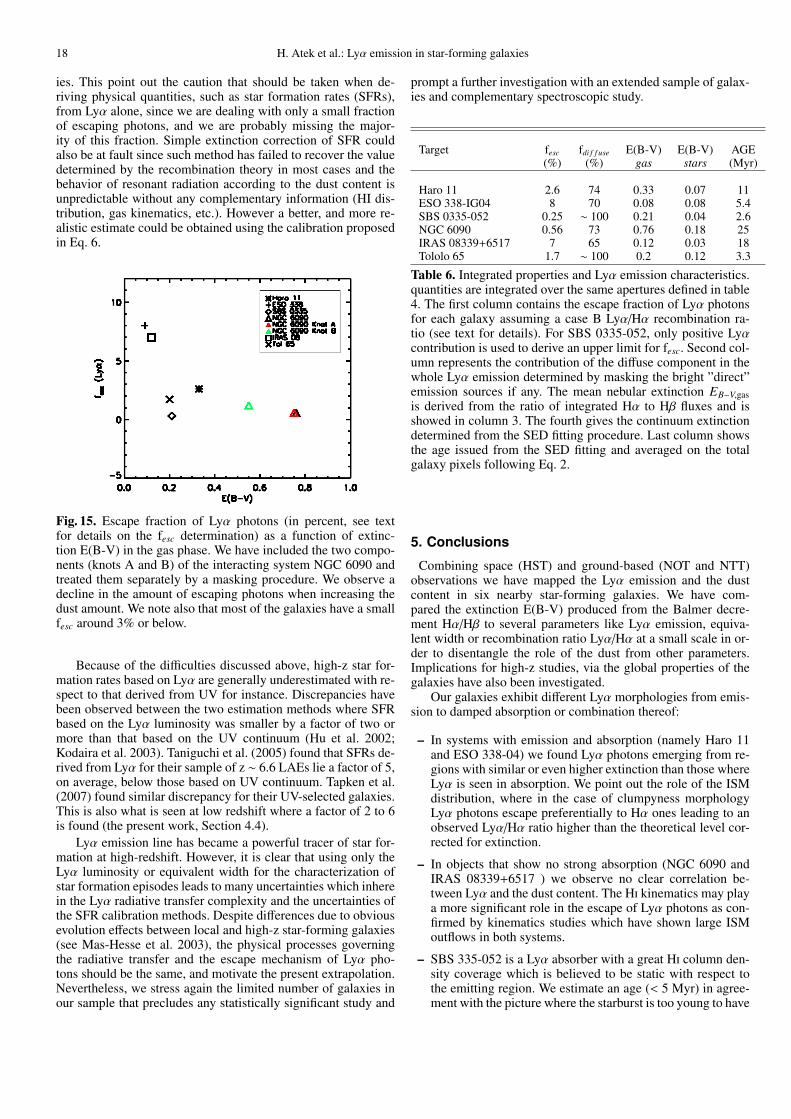
We show in figure 15 how fesc is function of the extinction. Weobserve that the Lyα escape fraction is somewhat correlated withEB−V,gas but with an important dispersion in, moreover, a quitelimited sample. At a galaxy scale we see the manifestation ofthe dust obscuration effect on emergent Lyα radiation, althoughin a purely dust regulated model, this correlation would havebeen more striking. It is also interesting to note that correctingthe total Hα flux using the mean EB−V,gas lead to higher escapefractions by 15 to 40 % that those calculated using pixel levelcorrections. In high redshift observations only global correctionis possible in absence of spatial resolution.
The rate of escaping Lyα photons does not exceed 10% inthis sample. In addition, we have outlined the ubiquitous haloof diffuse emission present in all the observed galaxies, and weare able to get a feeling of how important is this contributionin section 4.2. The diffuse component represents the bulk of theLyα emission (Table 6). It is very likely that such low surfacebrightness emission remains undetectable in high-redshift galax-
18 H. Atek et al.: Lyα emission in star-forming galaxies
ies. This point out the caution that should be taken when de-riving physical quantities, such as star formation rates (SFRs),from Lyα alone, since we are dealing with only a small fractionof escaping photons, and we are probably missing the major-ity of this fraction. Simple extinction correction of SFR couldalso be at fault since such method has failed to recover the valuedetermined by the recombination theory in most cases and thebehavior of resonant radiation according to the dust content isunpredictable without any complementary information (HI dis-tribution, gas kinematics, etc.). However a better, and more re-alistic estimate could be obtained using the calibration proposedin Eq. 6.
Fig. 15. Escape fraction of Lyα photons (in percent, see textfor details on the fesc determination) as a function of extinc-tion E(B-V) in the gas phase. We have included the two compo-nents (knots A and B) of the interacting system NGC 6090 andtreated them separately by a masking procedure. We observe adecline in the amount of escaping photons when increasing thedust amount. We note also that most of the galaxies have a smallfesc around 3% or below.
Because of the difficulties discussed above, high-z star for-mation rates based on Lyα are generally underestimated with re-spect to that derived from UV for instance. Discrepancies havebeen observed between the two estimation methods where SFRbased on the Lyα luminosity was smaller by a factor of two ormore than that based on the UV continuum (Hu et al. 2002;Kodaira et al. 2003). Taniguchi et al. (2005) found that SFRs de-rived from Lyα for their sample of z ∼ 6.6 LAEs lie a factor of 5,on average, below those based on UV continuum. Tapken et al.(2007) found similar discrepancy for their UV-selected galaxies.This is also what is seen at low redshift where a factor of 2 to 6is found (the present work, Section 4.4).
Lyα emission line has became a powerful tracer of star for-mation at high-redshift. However, it is clear that using only theLyα luminosity or equivalent width for the characterization ofstar formation episodes leads to many uncertainties which inherein the Lyα radiative transfer complexity and the uncertainties ofthe SFR calibration methods. Despite differences due to obviousevolution effects between local and high-z star-forming galaxies(see Mas-Hesse et al. 2003), the physical processes governingthe radiative transfer and the escape mechanism of Lyα pho-tons should be the same, and motivate the present extrapolation.Nevertheless, we stress again the limited number of galaxies inour sample that precludes any statistically significant study and
prompt a further investigation with an extended sample of galax-ies and complementary spectroscopic study.
Target fesc fdi f f use E(B-V) E(B-V) AGE(%) (%) gas stars (Myr)
Haro 11 2.6 74 0.33 0.07 11ESO 338-IG04 8 70 0.08 0.08 5.4SBS 0335-052 0.25 ∼ 100 0.21 0.04 2.6NGC 6090 0.56 73 0.76 0.18 25IRAS 08339+6517 7 65 0.12 0.03 18Tololo 65 1.7 ∼ 100 0.2 0.12 3.3
Table 6. Integrated properties and Lyα emission characteristics.quantities are integrated over the same apertures defined in table4. The first column contains the escape fraction of Lyα photonsfor each galaxy assuming a case B Lyα/Hα recombination ra-tio (see text for details). For SBS 0335-052, only positive Lyαcontribution is used to derive an upper limit for fesc. Second col-umn represents the contribution of the diffuse component in thewhole Lyα emission determined by masking the bright ”direct”emission sources if any. The mean nebular extinction EB−V,gasis derived from the ratio of integrated Hα to Hβ fluxes and isshowed in column 3. The fourth gives the continuum extinctiondetermined from the SED fitting procedure. Last column showsthe age issued from the SED fitting and averaged on the totalgalaxy pixels following Eq. 2.
5. Conclusions
Combining space (HST) and ground-based (NOT and NTT)observations we have mapped the Lyα emission and the dustcontent in six nearby star-forming galaxies. We have com-pared the extinction E(B-V) produced from the Balmer decre-ment Hα/Hβ to several parameters like Lyα emission, equiva-lent width or recombination ratio Lyα/Hα at a small scale in or-der to disentangle the role of the dust from other parameters.Implications for high-z studies, via the global properties of thegalaxies have also been investigated.
Our galaxies exhibit different Lyα morphologies from emis-sion to damped absorption or combination thereof:
– In systems with emission and absorption (namely Haro 11and ESO 338-04) we found Lyα photons emerging from re-gions with similar or even higher extinction than those whereLyα is seen in absorption. We point out the role of the ISMdistribution, where in the case of clumpyness morphologyLyα photons escape preferentially to Hα ones leading to anobserved Lyα/Hα ratio higher than the theoretical level cor-rected for extinction.
– In objects that show no strong absorption (NGC 6090 andIRAS 08339+6517 ) we observe no clear correlation be-tween Lyα and the dust content. The Hi kinematics may playa more significant role in the escape of Lyα photons as con-firmed by kinematics studies which have shown large ISMoutflows in both systems.
– SBS 335-052 is a Lyα absorber with a great Hi column den-sity coverage which is believed to be static with respect tothe emitting region. We estimate an age (< 5 Myr) in agree-ment with the picture where the starburst is too young to have

H. Atek et al.: Lyα emission in star-forming galaxies 19
ionised the surrounding gas or driven an outflow. We observeprecisely what is expected from the resonant nature of Lyαin a static neutral gas: a damped absorption with a declin-ing relationship between Lyα and E(B-V) indicating that thedust is, in this case, the main regulator of Lyα escape.
When investigating global parameters of our sample, wefound that simple dust extinction correction fails to recover theintrinsic Lyα/Hα ratio, where the role of the dust is, in somecases, underestimated because of the resonant scattering, and inother cases, overestimated because of the clumpyness distribu-tion of the ISM. We observe neither no evident correlation be-tween EWLyα and the reddening. The observed Lyα escape frac-tion is found to not exceed 10% in our sample and is, for mostof our galaxies, about 3% or less.
The resonant decoupling of Lyα from non-resonant radiationleads also to an ubiquitous diffuse halo with low surface bright-ness. It represents the bulk of the Lyα emission and extend toregions at several kpc from emitting regions and which are notreached by Hα or continuum radiation yielding high EWLyα.
Because of the radiative transfer complexity of the Lyα line,star formation rate (SFR) based on Lyα lead to different resultsthan SFR derived from other indicators (from UV for instance),and fails to recover the total SFR (UV + IR), and this evenwhen corrected for dust obscuration, preventing any determina-tion of the intrinsic star formation rate. We propose thereforea more realistic calibration for the SFR when information onLyα only is available (which is usually the case for high-redshiftsurveys), accounting for dust attenuation and resonant scatteringphenomenon through the Lyα escape fraction.
Acknowledgements. We are very grateful to Daniel Schaerer for thoughtful andvaluable comments on the draft of this paper. We thank Anne Verhamme foruseful discussions, Claus Leitherer and Artashes Petrosian for their work on theLyα project. Filter 113 for ALFOSC observations was acquired thanks to a grantfrom Erik Holmberg foundation.
ReferencesAhn, S.-H., Lee, H.-W., & Lee, H. M. 2003, MNRAS, 340, 863Ajiki, M., Taniguchi, Y., Fujita, S. S., et al. 2003, AJ, 126, 2091Bergvall, N. & Ostlin, G. 2002, A&A, 390, 891Bergvall, N., Zackrisson, E., Andersson, B.-G., et al. 2006, A&A, 448, 513Brocklehurst, M. 1971, MNRAS, 153, 471Burgarella, D., Buat, V., Small, T., et al. 2005, ApJ, 619, L63Calzetti, D. & Kinney, A. L. 1992, ApJ, 399, L39Calzetti, D., Kinney, A. L., & Storchi-Bergmann, T. 1994, ApJ, 429, 582Cardelli, J. A., Clayton, G. C., & Mathis, J. S. 1989, ApJ, 345, 245Charlot, S. & Fall, S. M. 1993, ApJ, 415, 580Cowie, L. L. & Hu, E. M. 1998, AJ, 115, 1319de Propris, R., Pritchet, C. J., Hartwick, F. D. A., & Hickson, P. 1993, AJ, 105,
1243Deharveng, J. M., Joubert, M., & Kunth, D. 1985, in Star-Forming Dwarf
Galaxies and Related Objects, ed. D. Kunth, T. X. Thuan, & J. Tran Thanhvan, 431–+
Dekker, H., Delabre, B., & Dodorico, S. 1986, in Presented at the Societyof Photo-Optical Instrumentation Engineers (SPIE) Conference, Vol. 627,Instrumentation in astronomy VI; Proceedings of the Meeting, Tucson,AZ, Mar. 4-8, 1986. Part 1 (A87-36376 15-35). Bellingham, WA, Societyof Photo-Optical Instrumentation Engineers, 1986, p. 339-348., ed. D. L.Crawford, 339–348
Dijkstra, M., Wyithe, J. S. B., & Haiman, Z. 2007, MNRAS, 379, 253Djorgovski, S. & Thompson, D. J. 1992, in IAU Symposium, Vol. 149, The
Stellar Populations of Galaxies, ed. B. Barbuy & A. Renzini, 337D’Odorico, S., Beletic, J. W., Amico, P., et al. 1998, in Presented at the Society
of Photo-Optical Instrumentation Engineers (SPIE) Conference, Vol. 3355,Proc. SPIE Vol. 3355, p. 507-511, Optical Astronomical Instrumentation,Sandro D’Odorico; Ed., ed. S. D’Odorico, 507–511
Finkelstein, S. L., Rhoads, J. E., Malhotra, S., Grogin, N., & Wang, J. 2007,ArXiv e-prints, 708
Fujita, S. S., Ajiki, M., Shioya, Y., et al. 2003, AJ, 125, 13
Giavalisco, M., Dickinson, M., Ferguson, H. C., et al. 2004, ApJ, 600, L103Giavalisco, M., Koratkar, A., & Calzetti, D. 1996, ApJ, 466, 831Goldader, J. D., Meurer, G., Heckman, T. M., et al. 2002, ApJ, 568, 651Gonzalez Delgado, R. M., Leitherer, C., Heckman, T., et al. 1998, ApJ, 495, 698Grimes, J. P., Heckman, T., Strickland, D., et al. 2007, ApJ, 668, 891Gronwall, C., Ciardullo, R., Hickey, T., et al. 2007, ApJ, 667, 79Hamana, T., Ouchi, M., Shimasaku, K., Kayo, I., & Suto, Y. 2004, MNRAS, 347,
813Hansen, M. & Peng Oh, S. 2006, New Astronomy Review, 50, 58Hayes, M., Ostlin, G., Atek, H., et al. 2007, MNRAS, 382, 1465Hayes, M., Ostlin, G., Mas-Hesse, J. M., & Kunth, D. 2008, AJ, submittedHayes, M., Ostlin, G., Mas-Hesse, J. M., et al. 2005, A&A, 438, 71Heckman, T. M., Hoopes, C. G., Seibert, M., et al. 2005, ApJ, 619, L35Hu, E. M., Cowie, L. L., & McMahon, R. G. 1998, ApJ, 502, L99+Hu, E. M., Cowie, L. L., McMahon, R. G., et al. 2002, ApJ, 568, L75Izotov, Y. I., Chaffee, F. H., & Green, R. F. 2001, ApJ, 562, 727Izotov, Y. I., Lipovetsky, V. A., Chaffee, F. H., et al. 1997, ApJ, 476, 698Izotov, Y. I., Papaderos, P., Guseva, N. G., Fricke, K. J., & Thuan, T. X. 2004,
A&A, 421, 539Kashikawa, N., Shimasaku, K., Malkan, M. A., et al. 2006, ApJ, 648, 7Kennicutt, Jr., R. C. 1998, ARA&A, 36, 189Kodaira, K., Taniguchi, Y., Kashikawa, N., et al. 2003, PASJ, 55, L17Kong, X., Charlot, S., Brinchmann, J., & Fall, S. M. 2004, MNRAS, 349, 769Kudritzki, R.-P., Mendez, R. H., Feldmeier, J. J., et al. 2000, ApJ, 536, 19Kunth, D., Leitherer, C., Mas-Hesse, J. M., Ostlin, G., & Petrosian, A. 2003,
ApJ, 597, 263Kunth, D., Lequeux, J., Sargent, W. L. W., & Viallefond, F. 1994, A&A, 282,
709Kunth, D., Mas-Hesse, J. M., Terlevich, E., et al. 1998, A&A, 334, 11Leitherer, C. 2005, in American Institute of Physics Conference Series, Vol. 783,
The Evolution of Starbursts, ed. S. Huttmeister, E. Manthey, D. Bomans, &K. Weis, 280–295
Leitherer, C., Schaerer, D., Goldader, J. D., et al. 1999, ApJS, 123, 3Lequeux, J., Kunth, D., Mas-Hesse, J. M., & Sargent, W. L. W. 1995, A&A, 301,
18Madau, P., Ferguson, H. C., Dickinson, M. E., et al. 1996, MNRAS, 283, 1388Malhotra, S. & Rhoads, J. E. 2004, ApJ, 617, L5Margon, B., Anderson, S. F., Mateo, M., Fich, M., & Massey, P. 1988, ApJ, 334,
597Martins, L. P., Delgado, R. M. G., Leitherer, C., Cervino, M., & Hauschildt, P.
2005, MNRAS, 358, 49Mas-Hesse, J. M., Kunth, D., Tenorio-Tagle, G., et al. 2003, ApJ, 598, 858Meier, D. L. & Terlevich, R. 1981, ApJ, 246, L109Meurer, G. R., Heckman, T. M., & Calzetti, D. 1999, ApJ, 521, 64Moustakas, J. & Kennicutt, Jr., R. C. 2006, ApJS, 164, 81Murayama, T., Taniguchi, Y., Scoville, N. Z., et al. 2007, ApJS, 172, 523Neufeld, D. A. 1991, ApJ, 370, L85Oke. 1990, ApJOsterbrock, D. E. 1989, Astrophysics of gaseous nebulae and active galac-
tic nuclei (Research supported by the University of California, John SimonGuggenheim Memorial Foundation, University of Minnesota, et al. MillValley, CA, University Science Books, 1989, 422 p.)
Ostlin, G., Hayes, M., Kunth, D., et al. 2008, AJ, submittedOstlin, G., Zackrisson, E., Bergvall, N., & Ronnback, J. 2003, A&A, 408, 887Ouchi, M., Shimasaku, K., Akiyama, M., et al. 2005, ApJ, 620, L1Papaderos, P., Izotov, Y. I., Guseva, N. G., Thuan, T. X., & Fricke, K. J. 2006,
A&A, 454, 119Partridge, R. B. & Peebles, P. J. E. 1967, ApJ, 147, 868Pirzkal, N., Malhotra, S., Rhoads, J. E., & Xu, C. 2007, ApJ, 667, 49Pritchet, C. & Hartwick, D. 1989, JRASC, 83, 318Pritchet, C. J. 1994, PASP, 106, 1052Rhoads, J. E., Dey, A., Malhotra, S., et al. 2003, AJ, 125, 1006Salpeter, E. E. 1955, ApJ, 121, 161Schaerer, D. & Verhamme, A. 2008, A&A, 480, 369Schlegel, D. J., Finkbeiner, D. P., & Davis, M. 1998, ApJ, 500, 525Seibert, M., Martin, D. C., Heckman, T. M., et al. 2005, ApJ, 619, L55Shapley, A. E., Steidel, C. C., Pettini, M., & Adelberger, K. L. 2003, ApJ, 588,
65Steidel, C. C., Giavalisco, M., Dickinson, M., & Adelberger, K. L. 1996, AJ,
112, 352Taniguchi, Y., Ajiki, M., Nagao, T., et al. 2005, PASJ, 57, 165Tapken, C., Appenzeller, I., Noll, S., et al. 2007, A&A, 467, 63Tenorio-Tagle, G., Silich, S. A., Kunth, D., Terlevich, E., & Terlevich, R. 1999,
MNRAS, 309, 332Terlevich, E., Diaz, A. I., Terlevich, R., & Vargas, M. L. G. 1993, MNRAS, 260,
3Thuan, T. X. & Izotov, Y. I. 1997, ApJ, 489, 623Thuan, T. X., Izotov, Y. I., & Lipovetsky, V. A. 1997, ApJ, 477, 661

20 H. Atek et al.: Lyα emission in star-forming galaxies
Vazquez, G. A. & Leitherer, C. 2005, ApJ, 621, 695Verhamme, A., Schaerer, D., Atek, H., & Tapken, C. 2007, A&A, submittedVerhamme, A., Schaerer, D., & Maselli, A. 2006, A&A, 460, 397