Embed Size (px)
Citation preview

FUNDAÇÃO GETULIO VARGAS
ESCOLA DE ADMINISTRAÇÃO DE EMPRESAS DE SÃO PAULO
CREDIT UNION CORRESPONDENTS AND FINANCIAL INCLUSION IN BRAZIL
An Exploratory Study
OSKARI KALLIALA
SÃO PAULO
2016

OSKARI KALLIALA
CREDIT UNION CORRESPONDENTS AND FINANCIAL INCLUSION IN BRAZIL
An Exploratory Study
Dissertation presented to Escola de
Administração de Empresas de São Paulo of
Fundação Getulio Vargas, as a requirement to
obtain the title of Master in International
Management (MPGI).
Knowledge Field: Financial Inclusion
Adviser: Prof. Dr. Lauro Emilio Gonzalez
Farias
SÃO PAULO
2016

Kalliala, Oskari. Credit Union Correspondents and Financial Inclusion in Brazil / Oskari Kalliala - 2016. 209 f. Orientador: Lauro Emilio Gonzalez Farias Dissertação (MPGI) - Escola de Administração de Empresas de São Paulo. 1. Cooperativas de crédito. 2.Crédito bancário - Brasil. 3. Bancos. Farias, Lauro Emilio Gonzalez. II. Dissertação (MPGI) - Escola de Administração de Empresas de São Paulo. III. Título. CDU 334.2(81)

OSKARI KALLIALA
CREDIT UNION CORRESPONDENTS AND FINANCIAL INCLUSION IN BRAZIL
An Exploratory Study
Thesis presented to Escola de Administração de
Empresas de São Paulo of Fundação Getulio
Vargas, as a requirement to obtain the title of
Master in International Management (MPGI).
Knowledge Field: Financial Inclusion
Approval Date
11/03/2016
Committee members:
________________________________
Prof. Dr. Lauro Emilio Gonzalez Farias
________________________________
Prof. Dr. Eduardo Henrique Diniz
________________________________
Prof. Dr. Tania Pereira Christopoulos

Acknowledgements
Firstly, I would like to express my gratitude to my advisor, Prof. Dr. Lauro Emilio Gonzalez
Farias, for his valuable advice and the support of my thesis and related research, as well as for his
patience and readiness to help. His guidance helped me in all the time of research and writing of
this thesis. I could not have imagined having a better advisor or mentor for my study.
Besides my advisor, I would like to thank the researchers at the Center of Studies in
Microfincance (CEMF) of the FGV, Prof. Dr. Eduardo Henrique Diniz, Prof. Dr. Vladimir
Fernandes Maciel and Prof. Ms. Caroline Cipolla for providing me with the access to data
required for this thesis.
My sincere thanks also go to the participants of the “Projeto Conexão Local”, Leonardo Fujisima
Yada, Melina Chen Padoin, as well as Erico Przeybilovicz, for letting me participate in the study
of credit union correspondents in Panambi. The interviews conducted in the framework of this
project gave me invaluable material for this research.
A special acknowledgment also goes to Prof. Dr. Felipe Zambaldi of the FGV for his valuable
advice concerning the methodology of this thesis.
Last but not least, I would like to thank my family and my girlfriend Justyna for their support
during the long days and nights that I spent writing this thesis.

Abstract
The Brazilian banking correspondent network has been a topic of study for already a decade, due
to its well-documented success in improving access to financial services in remote areas. The
marginal but growing role of credit unions in the usage of correspondents has not received much
attention from academics, despite the appraised importance of credit unions in finance of
proximity. This thesis takes a multi-method approach to perform an exploratory research of
credit union correspondents in Brazil. The research objective is two-fold, aiming, from one side,
at understanding the incentives of credit unions for contracting correspondents and, from the
other, at evaluating whether credit union correspondents improve financial inclusion. The
research consists of a case study and quantitative analysis of correspondent registration data
and credit union financials. The results indicate that generally the largest and most profitable
credit unions use banking correspondents in order to improve efficiency and decrease waiting
lines, while promoting financial inclusion only in one restricted dimension – bill payment.
Nevertheless, in 2014, credit union correspondents had an important role in providing access to
payments in 690 municipalities, of which 200 had low financial depth. Despite the scope
limitation of credit union correspondents, the results give reasons to believe that these actors
could increase their importance in the promotion of financial inclusion in the future.
Keywords: financial inclusion, agent banking, banking correspondents, credit union
correspondents, credit unions

Resumo
A rede de correspondentes bancários do Brasil tem sido estudada há mais de uma década, em
particular por causa da sua importância no aumento do alcance de serviços financeiros para
regiões distantes dos maiores centros urbanos. O uso de correspondentes por cooperativas de
crédito não tem recebido destaque, apesar do papel importante das cooperativas na inclusão
financeira. Esta dissertação adota uma abordagem “multimétodo” para efetuar uma pesquisa
exploratória dos correspondentes de cooperativas de crédito no Brasil. A pesquisa visa, por um
lado, alargar a compreensão dos incentivos que levam cooperativas a usarem correspondentes, e
por outro, avaliar se esses correspondentes merlhoram a inclusão financeira. A pesquisa é
formada por um estudo de caso assim como por análise de dados relativos ao registro de
correspondentes bancários e de dados financeiros das cooperativas. Os resultados apontam que
o uso de correspondentes bancários por cooperativas está relacionado à busca de maior
eficiência e redução de filas nas agências. A melhoria da inclusão financeira por esses
correspondentes limita-se a um serviço único – o recebimento de pagamentos. Não obstante, em
2014, cooperativas de correspondentes de crédito tinham um papel importante no fornecimento
de serviços de recebimento de contas em 690 municípios brasileiros, dos quais 200 tinham
baixos níveis de inclusão financeira. Apesar da escassa disponibilidade de serviços dos
correspondentes das cooperativas, os resultados sugerem que esses atores poderiam adquirir
uma importância maior na promoção de inclusão financeira no futuro.
Palavras-chave: inclusão financeira, correspondentes bancários, agentes credenciados,
cooperativas de crédito

Table of Contents 1. Introduction to Credit Union Correspondents ............................................................................... 14
Introduction and Objectives ....................................................................................................... 14 1.1.
Research Question and Methodological Choices ...................................................................... 15 1.2.
Results of the Research .............................................................................................................. 16 1.3.
2. Academic Framework of Credit Union Correspondents ............................................................... 17
Literature Framework ................................................................................................................ 17 2.1.
Financial Inclusion ..................................................................................................................... 18 2.2.
2.2.1. Definition of Financial Inclusion .................................................................................... 18
2.2.2. Importance of Financial Inclusion .................................................................................. 19
2.2.3. Measuring Financial Inclusion ........................................................................................ 21
2.2.4. State of Financial Inclusion around the World ............................................................... 23
2.2.5. Policies for Improving Financial Inclusion .................................................................... 25
2.2.6. Financial Inclusion in Brazil ........................................................................................... 28
Correspondent Banking ............................................................................................................. 32 2.3.
2.3.1. Overview of Correspondent Banking ............................................................................. 32
2.3.2. Development of Correspondent Banking in Brazil ......................................................... 34
2.3.3. Banking Correspondents and Financial Inclusion in Brazil ........................................... 37
2.3.4. Controversial Issues Related to Correspondent Banking in Brazil ................................. 40
2.3.5. Future of Banking Correspondents in Brazil .................................................................. 41
Credit Unions ............................................................................................................................. 42 2.4.
2.4.1. Credit Unions Explained ................................................................................................. 42
2.4.2. Brief History and Examples of Credit Unions ................................................................ 44
2.4.3. Challenges of Credit Unions ........................................................................................... 45
2.4.4. The Common Bond of Association ................................................................................ 46
2.4.5. Credit Unions in Brazil ................................................................................................... 47
2.4.6. History of Credit Union Development in Brazil ............................................................. 47
2.4.7. Different CU types in Brazil ........................................................................................... 49
2.4.8. Credit Unions and Financial Inclusion in Brazil ............................................................ 50
2.4.9. Success Factors for Credit Unions in Brazil ................................................................... 52
2.4.10. Challenges of the Credit Union Sector in Brazil ......................................................... 53
2.4.11. Credit Union Correspondents ...................................................................................... 55
3. Methodology .................................................................................................................................. 56
Research Type ............................................................................................................................ 56 3.1.

Research Paradigm and Approach ............................................................................................. 57 3.2.
Research Design ........................................................................................................................ 57 3.3.
Quantitative Method – Analysis of Banking Correspondent Registration Data ........................ 59 3.4.
3.4.1. Analysis of Quantitative Data ......................................................................................... 60
3.4.2. Sources of Data ............................................................................................................... 62
3.4.3. Data Validity ................................................................................................................... 63
3.4.4. Processing the BC Database ........................................................................................... 64
3.4.5. Municipal Index for Financial Inclusion ........................................................................ 66
Qualitative Method – Case Study of Sicredi in Panambi .......................................................... 69 3.5.
3.5.1. Plan of the Case Study .................................................................................................... 69
3.5.2. Data Analysis Method .................................................................................................... 71
3.5.3. Data Validity and Generalizability ................................................................................. 71
4. Results ........................................................................................................................................... 72
General Data about Credit Union Correspondents .................................................................... 72 4.1.
4.1.1. Credit Union Correspondents – Growth, Exclusiveness and Type of Service ............... 72
4.1.2. Banking Correspondents by Credit Union ...................................................................... 76
4.1.3. Geographical Distribution of Credit Union Correspondents .......................................... 78
4.1.4. Banking Correspondents by Credit Union Type and Affiliation .................................... 80
Panambi Case-Study .................................................................................................................. 88 4.2.
4.2.1. Background of the Case .................................................................................................. 88
4.2.2. General Information about Panambi and Sicredi ............................................................ 90
4.2.3. Sicredi Banking Correspondents .................................................................................... 91
4.2.3.1. Banking Correspondents for Receiving Bills .......................................................... 92
4.2.3.2. Car Dealers as Banking Correspondents ................................................................. 93
4.2.3.3. Advantages of Using Banking Correspondents ....................................................... 94
4.2.3.4. Challenges Encountered with Banking Correspondents ......................................... 94
4.2.3.5. Sicredi Future Plans for Banking Correspondents .................................................. 95
4.2.4. Commercial Bank Correspondents ................................................................................. 95
4.2.5. Opinions of Stakeholders ................................................................................................ 96
4.2.5.1. Opinion on Sicredi ................................................................................................... 96
4.2.5.2. Opinion on Banking Correspondents ...................................................................... 96
4.2.5.3. Banking Correspondents’ Point of View ................................................................. 97
Correspondents and Credit Union Financials ............................................................................ 98 4.3.
4.3.1. BC Intensity and Return on Equity ................................................................................. 99
4.3.2. BC Intensity and Size of Credit Union ......................................................................... 100
4.3.3. BC Intensity and Other Revenue Share ........................................................................ 101
4.3.4. BC Intensity and Return on Assets ............................................................................... 101
4.3.5. BC Intensity and Coverage with Services .................................................................... 102
4.3.6. BC Intensity and Banking Profitability ........................................................................ 103
4.3.7. Potential Hidden Variables ........................................................................................... 103
Credit Union Correspondents and the Municipal Index of Financial Inclusion ...................... 104 4.4.
4.4.1. The Index of Financial Inclusion .................................................................................. 105
4.4.2. Credit union Correspondents by Municipality on the IFI ............................................. 106
4.4.3. Credit Unions’ Share of All Correspondents ................................................................ 110
4.4.3.1. Credit Unions’ Share of BCs with Bill Payments ................................................. 110
4.4.3.1. Credit Unions’ Share of BCs with Credit Proposals ............................................. 113
4.4.4. Municipalities with Significant Share of Credit Union Correspondents ...................... 114
4.4.4.1. Municipalities with Significant Presence of CU BCs with Bill Payment ............. 114
4.4.4.1. Municipalities with Significant Presence of CU BCs with Credit Proposals ........ 117
4.4.5. Credit Union Share of Recent Growth in Banking Correspondents ............................. 118
4.4.5.1. Growth in BCs with Service III, 2007-2014 ......................................................... 118
4.4.5.2. Growth in BCs with Service V, 2011-2014 ........................................................... 120
4.4.6. Credit Union BC Significance by Urbanization Rate and Municipal HDI ................... 120
5. Discussion of Results .................................................................................................................. 122
General Data about Credit Union Correspondents .................................................................. 122 5.1.
Panambi Case Study ................................................................................................................ 125 5.2.
Credit Union Financials ........................................................................................................... 129 5.3.
Correspondents by Municipality .............................................................................................. 131 5.4.
6. Conclusions ................................................................................................................................. 133
Usefulness of Credit Union Correspondents ........................................................................... 133 6.1.
Credit Union Correspondents and Financial Inclusion ............................................................ 134 6.2.
Final Considerations ................................................................................................................ 136 6.3.
Limitations of the Research ..................................................................................................... 137 6.4.
Avenues for Future Research ................................................................................................... 139 6.5.
References ......................................................................................................................................... 141
Appendices ........................................................................................................................................ 148

List of Figures
Figure 1: Account penetration around the world ................................................................................. 23 Figure 2: Registration of credit union correspondents, 2003 - 2014 ................................................... 74 Figure 3: Operational credit union correspondents and PAEs, 2003-2014 ......................................... 75 Figure 4: Number of credit unions by BCs operated, 2014 ................................................................. 77
Figure 5: Credit unions and exclusiveness of CU BCs in 2014 .......................................................... 77 Figure 6: Number of municipalities with credit union correspondents, 2003- 2014 ........................... 78 Figure 7: Share of all CU BCs by region, 2003 - 2014 ....................................................................... 79 Figure 8: Share of municipalities with CU BCs by region 2003 -2014 .............................................. 79 Figure 9: Operational CU BCs by affiliation, 2003 - 2014 ................................................................. 82
Figure 10: Independent credit unions, BCs and PAEs, 2008 - 2014 ................................................... 83 Figure 11: Sicredi-affiliated credit unions, BCs and PAEs, 2008 - 2014 ............................................ 84
Figure 12: Sicoob-affiliated credit unions, BCs and PAEs, 2008 - 2014 ............................................ 84
Figure 13: Number of Sicoob-affiliated credit unions with BCs and PAEs, 2008 - 2014 .................. 85
Figure 14: Sicredi and Sicoob-affiliated credit unions and BCs, 2014 ............................................... 88 Figure 15: Location of Panambi in Brazil and performance on IFI in 2014 ....................................... 89 Figure 16: BC Intensity and Return on Equity by affiliation, 2012-2014 ........................................... 99
Figure 17: BC Intensity and Size by type of credit union, 2012-2014 .............................................. 100 Figure 18: BC Intensity and Return on Assets by affiliation, 2012-2014 ......................................... 102
Figure 19: BC Intensity and Coverage with Services by affiliation, 2012-2014 .............................. 102 Figure 20: Asset Size and ROE, all credit unions, 2012-2014 .......................................................... 104 Figure 21: Distribution of municipalities on the Index of Financial Inclusion, 2014 ....................... 105
Figure 22: Number of CU BCs by IFI category, 2014 ...................................................................... 106 Figure 23: Municipalities with CU BC by IFI category, 2014 .......................................................... 107
Figure 24: Municipalities of the South region with CU BCs, 2014 .................................................. 108 Figure 25: Credit union correspondents and credit unions seats by IFI category, 2014 ................... 108
Figure 26: CU Affiliation and CU BCs by IFI category, 2014 ......................................................... 109 Figure 27: CU BC coverage of municipalities on IFI, by affiliation, 2014 ....................................... 109
Figure 28: Cumulative distribution of CU BCs and municipalities on IFI, 2014 ............................. 110 Figure 29: All banking correspondents by IFI category, 2014 .......................................................... 111 Figure 30: All banking correspondents by IFI category in the South region, 2014 .......................... 111
Figure 31: Credit union BC share of total BCs with Inc. III, 2014 ................................................... 112 Figure 32: Credit union share of total BCs with Inc. III by affiliation, 2014 .................................... 112 Figure 33: Share of total BCs with Inc. III by region by affiliation, 2014 ........................................ 113
Figure 34: Share of municipalities with CU BC majority for Inc. III by region, 2014. .................... 114 Figure 35: Municipalities where CU BCs represent 50% of more of all BCs with Inc. III, 2014 .... 115 Figure 36: Municipalities where CU BCs represent 50% or more of all BCs with Inc. III, 2014 .... 115
Figure 37: Municipalities where CU BCs represent 50% or more of all BCs, by affiliation, 2014 .. 116 Figure 38: Average share of CU BCs with Inc. V out of total in covered mun., South, 2014 .......... 118 Figure 39: Share of CUs out of total growth in BCs with service III, 2008-2014 ............................ 119 Figure 40: CU share of total growth in BC with service III in the South, by IFI category, 08-14 .... 119
Figure 41: Increase in municipalities with CU BC majority for service III, 2012-2014 ................... 120 Figure 42: Urbanization rate and mun. with significant share of CU BCs for service III, 2014 ...... 121 Figure 43: HDI and importance of CU BC by municipality, 2014 ................................................... 121 Figure 44: HDI and importance of CU BCs by municipality, South region, 2014 ........................... 122

List of Tables
Table 1: Weighting used for calculating the municipal Index of Financial Inclusion ........................ 66 Table 2: Registration of credit union correspondents, 2003 - 2014 .................................................... 73 Table 3: Credit union correspondents versus all banking correspondents, 2003 - 2014 ..................... 74 Table 4: Operational credit union correspondents and PAEs, 2008-2014 .......................................... 74
Table 5: Credit union correspondents by type of service, 2003-2014 ................................................. 75 Table 6: Banking Correspondents with service III, 2003-2014 .......................................................... 76 Table 7: Exclusiveness of CU BCs with payment and credit proposal services, 2003 – 2014 ........... 76 Table 8: Proliferation of credit union correspondents in Brazilian municipalities, 2003 - 2014 ........ 78 Table 9: Number of correspondents by type of credit union, 2003 - 2014 ......................................... 80
Table 10: Prevalence of correspondents by type of credit union, 2008-2014 ..................................... 81 Table 11: Banking correspondents by affiliation of credit union, 2003-2014 .................................... 82
Table 12: CU Correspondents with service V by affiliation, 2011- 2014 ........................................... 82
Table 13: Exclusiveness of banking correspondents by affiliation, 2008 - 2014 ................................ 83
Table 14: Share of active credit unions with BCs, by affiliation, 2008-2014 ..................................... 85 Table 15: Municipalities covered by CU BCs of different affiliations, 2003 - 2014 .......................... 86 Table 16: Correspondents by CU affiliation, North region, 2008-2014 .............................................. 86
Table 17: Correspondents by CU affiliation, Northeast region, 2008-2014 ....................................... 86 Table 18: Correspondents by CU affiliation, Southeast region, 2008-2014 ....................................... 87
Table 19: Correspondents by CU affiliation, South region, 2008-2014 .............................................. 87 Table 20: Correspondents by CU affiliation, Center-West region, 2008-2014 ................................... 87 Table 21: Average IFI value by region, 2010 - 2014 ........................................................................ 105
Table 22: Credit union share of all BCs with service V in the South region, 2014 .......................... 113 Table 23: Number of municipalities with CU BC share of BCs with Inc. V above 25%, 2014 ....... 117
Table 24: Credit union share of increase in BC with service V, 2011-2014 ..................................... 120

List of Acronyms and Terms
ADH: Atlas do Desenvolvimento Humano
AML/CFT: Anti-Money Laundering / Combating the Finance of Terrorism
BC: Banking Correspondent
BF/ PBF: Programa Bolsa Família
BCB: Central Bank of Brazil
BRL/R$: Brazilian Real
CEF: Caixa Econômica Federal or Caixa [Brazilian bank]
CAGR: Compound Annual Growth Rate
CNPJ: National Registry of Natural Persons [Brazil]
CU: Credit Union
G2P: Government-to-Public
HDI: Human Development Index
IBGE: Brazilian Institute of Geography and Statistics
ICT: Information and Communications Technology
IFI: Index of Financial Inclusion
IMF: International Monetary Fund
Inc. III: Bill payment service [for banking correspondents]
Inc. V: Credit proposal service [for banking correspondents]
MFI: Microfinance Institution
PAA: Advanced Point of Access (see Appendix 2)
PAB: Bank Point of Access (see Appendix 2)
PAE: Electronic Point of Access (see Appendix 2)
POA: Point of Access [to financial services], listed in Appendix 2
ROA/ROE: Return on Assets / Return on Equity
SME/MSME: Small and Medium-sized Enterprise / Micro, Small & Medium Enterprise
UNDP: United Nations Development Program
WOCCU: World Council of Credit Unions
14
1. Introduction to Credit Union Correspondents
Introduction and Objectives 1.1.
Financial inclusion refers to the delivery of financial services to disadvantaged groups of a
society. It is seen as an important element of both economic and personal development, and has
been receiving an increasing amount of attention from academics in the last decade. Several
international organizations and forums, such as the G20 and the World Bank, have
acknowledged the importance of financial inclusion to economic development, and international
cooperation has been strengthened to fight against financial exclusion.
There is a large consensus on the importance of financial inclusion in developing a stable
economy, and several countries have placed the issue at the core of their public policies for
economic development. Brazil, the world’s ninth largest economy in nominal terms in 2015, has
done tremendous improvements in financial depth in the last decade, and acts as a benchmark for
many developing economies in this field.
Banking correspondents (BCs), third parties allowed to act as financial intermediaries for a bank,
have played a major role in the financial inclusion strategy of Brazil. Through the decrease of
distribution costs, the banking correspondent model allowed the Brazilian banking system to
reach thousands of previously financially excluded municipalities in the beginning of the last
decade. The Brazilian banking correspondent network, unparalleled in its extent, has inspired a
number of similar financial inclusion initiatives in Latin America and beyond.
Despite the well-documented success of banking correspondents in giving access to financial
services to underserved populations, they have not achieved a significant improvement in the
distribution of so-called “relational” services, such as microcredit and savings accounts. This is
particularly due to a lack of incentives, as well as inadequacy of banking products for low-
income population groups.
In this context, it is interesting to study banking correspondents operated by credit unions (CU).
Credit unions have an important role in finance of proximity in Brazil and around the world, due
to their engagement with communities and capacity to reach unbanked populations. The usage of

15
banking correspondents by credit unions has been increasing steadily in the last years, and it is
interesting to study their usage in more detail. While this is still a marginal phenomenon, credit
unions may have the potential to overcome the obstacles of traditional banking correspondents
through their experience with finance of proximity and financially excluded populations.
The objective of this thesis is to evaluate if and how banking correspondents operated by credit
unions improve financial inclusion in Brazil. This topic is important due to the essential role that
access to finance plays on personal empowerment, as well as on economic development and
poverty reduction.
The outcome of this study is an improved understanding of the role of this relatively new actor in
the Brazilian banking correspondent network. Furthermore, this study contributes to the
academic literature about the development of the credit union sector in Brazil, and improves
understanding of the remaining bottlenecks in financial inclusion in the country.
Research Question and Methodological Choices 1.2.
The participation of credit unions to the banking correspondent network in Brazil is a rather new
phenomenon that has not yet received particular attention from academics. This study aims at
presenting an overview of credit union correspondents from the point of view of financial
inclusion.
Both credit unions and banking correspondents have an important role in access to finance
among financially excluded populations. Furthermore, credit unions are seen as having better
ability to deliver affordable financial services to low-income segments. Therefore, credit union
correspondents present a potentially powerful tool for fighting financial exclusion.
The research question of this thesis is two-dimensional in order to develop a complete
understanding of credit union correspondents.
Question 1: Is it useful for credit unions to open correspondents?
This first question aims at assessing whether CUs have incentives to open BCs in the first place,
and to understand why they do it. If there is no incentive to do it, it is unlikely that networks of

16
credit union BCs would ever develop to a scale large enough to play an important role in the
Brazilian banking correspondent system.
Question 2: Do credit union correspondents improve financial inclusion in Brazil?
After finding out what the incentives of CUs are to use correspondents, this second research
question aims at addressing the effect of credit union BCs on financial inclusion. Financial
inclusion is assessed through the framework used by the Central Bank of Brazil, which consists
of three dimensions – access, usage and quality of financial services. The data available for this
thesis does not allow for a precise quantitative assessment of the impact on financial inclusion.
Nevertheless, the results may indicate in which ways credit union correspondents bring about for
financial inclusion
As this topic has received rather little attention from academics, the type of research performed
in this thesis is largely exploratory, and there are therefore no hypotheses for the research
questions. The research is performed using a multi-method approach, consisting of a case study
of a credit union in Brazil, as well as an extensive analysis of secondary data available about
banking correspondents, credit unions and financial infrastructure in the country.
Results of the Research 1.3.
The results showed that correspondents are useful for credit unions, particularly for large ones, as
well as for the ones most resembling banks. When it comes to financial inclusion, it is clear that
credit union correspondents are a niche phenomenon in Brazil, as they represented less than 2%
of all correspondents in the end of 2014. Furthermore, they could not be seen to be superior to
traditional banking correspondents in any way - they were limited in scope of services and
geographical reach, and did not promote relational services better than regular banking
correspondents. Credit unions did not seem to use BCs as a distribution model for financial
services, but rather as a way to improve operational efficiency. Furthermore, credit unions
appeared to be more limited in technological infrastructure than banks, limiting their ability to
distribute financial services through the network.

17
Notwithstanding, credit union correspondents do improve financial inclusion in some
dimensions. Notably, credit union correspondents form a significant share of correspondents for
access to bill payment in over 690 municipalities of Brazil, out of which 200 have low financial
depth. This improvement of access may have led to the decrease of transaction costs for bill
payment at the local level for millions of citizens. However, the precise number of people
affected by the proliferation of credit union correspondents could not be assessed through this
research.
While credit union correspondents currently remain inferior to regular banking correspondents in
terms of financial inclusion, they may hold potential for gaining importance in the future. This is
particularly due to the alignment of interests between credit unions and its member
correspondents, which is more difficult to achieve for commercial banks.
The following part of the thesis introduces the academic framework of the research topic, from
financial inclusion to credit union correspondents. The third part of the thesis presents the
methodological choices of the research, while the fourth part displays the obtained results.
Finally, the fifth part of this thesis discusses the results in relation to the academic framework,
and the sixth part draws conclusions to answer the research questions.
2. Academic Framework of Credit Union Correspondents
Literature Framework 2.1.
As this thesis aims at observing credit union correspondents in a context of financial inclusion,
all these concepts need to be explained in the light of previous theory. This section thus aspires
to provide the reader with a complete understanding of the theoretical framework of the topic.
Each section seeks to present the topic from a universal and a Brazilian point of view, as the
research object of this thesis is essentially related to financial inclusion in Brazil.
Financial inclusion has been a topic of study for at least the past 20 years and it has received
growing international attention from academics, national regulators and international

18
organizations such as G20 and the World Bank. There is therefore a rich and wide array of
literature regarding this subject.
Banking correspondents have been studied since the beginning of the 21st century, but they are
often presented in the context of Brazil, as this country hosts the most successful and far-
reaching network of banking correspondents up to date.
Academics have studied credit unions and mutual finance at least since the 1950s, and a
relatively large literature framework about the Brazilian credit union segment has emerged in the
last 15 years.
When it comes to credit union correspondents, there is little prior academic research on the topic
up to date, but a few blog entries and one minor study have been published and are presented in
the literature review.
Financial Inclusion 2.2.
2.2.1. Definition of Financial Inclusion
When defining financial inclusion, various approaches have been presented in relation to the
nature of the target group as well as to the essence of the inclusion itself. For the purpose of this
thesis, the definition of the Central Bank of Brazil (BCB) is retained: “Process of effective
access to and usage of adequate financial services for the population’s needs, with impact on
their quality of life.” (2015, p.19)
Financial inclusion is hence a process aiming at increasing the reach of the financial sector to
include the entire population of a country or area. The reach of the financial sector can be seen as
the access to and usage of financial services. In addition, it is also important to consider the
quality of the services offered, to assess their suitability to the needs of the population.
By definition, financial inclusion aims at including groups of people to the financial sector that
have traditionally been excluded from it. According to Kempson and Claire (1999), financial
exclusion is either due to poor access to financial services, inappropriate conditions of the formal

19
financial sector, non-targeted products, too high prices or self-exclusion (out of fear of refusal).
Financially excluded populations are thus not a homogenous group.
According to Jansen and Hannig (2010), catering to the lowest income groups has traditionally
not been of the interest of formal financial institutions, due to the costs associated with high
information asymmetry. This information asymmetry between banks and low-income
populations could be seen as one of the root causes of financial exclusion. Nonetheless, Jansen
and Hannig (2010), also remind that the number of financially excluded people in the world is
much larger than the number of people living under $2 a day. Hence, despite a large focus of the
financial inclusion discourse on low-income socio-economic groups, the underbanked do not
only represent the poorest people in the society.
2.2.2. Importance of Financial Inclusion
It is widely believed that financial inclusion presents benefits for the society, which has led it to
become an important topic of discussion in international organizations and central banks.
Financial inclusion is accepted to be strongly related to development, although there is no
consensus on causality. A good way to start looking at the benefits of financial inclusion is to
observe the disadvantages of financial exclusion.
Leeladhar illustrates some of the challenges faced by people excluded from the formal financial
sector (2006). People with no access to financial infrastructure may have to travel long distances
to receive governmental transfers or to make payments. In addition, with no access to formal
financial instruments, financially excluded people may have to rely on informal moneylenders
that charge exorbitant interest rates. Transactions are also difficult in unbanked communities, and
investment remains at suboptimal levels.
Besley (1995) describes the difficulty that financial exclusion imposes on low-income
populations. In large areas of the world, the poor are subject to several risks that are not familiar
to more affluent socio-economic groups. Due to poor sanitation and reliance on agriculture, they
are exposed to serious contagious diseases and unexpected income shocks. Being generally
excluded from the formal financial sector, they cannot protect themselves against those risks
with insurance, savings or credit, which renders their situation even more precarious. Aggarwal
20
and Klapper (2013) also mention, that the lack of risk management instruments often leads to
children of farmers dropping out of school in case of income shocks, which perpetuates poverty.
Demirgüç-Kunt and Klapper (2012) add that without the ability to borrow money from financial
institutions, low income populations must rely on their savings for investments in education and
business, for example, which is economically inefficient and maintains income inequality in the
society. Murdoch (1995) also points out, that the unavailability of financial services makes the
poor very risk averse and leads to poor decisions in terms of work and production. A further
example is given by Abramovay (2004), in which farmers lacking more liquid investment
options would invest in livestock, risking having to sell entire animals in case of unexpected
liquidity requirements.
From a macro-economic point of view, Mettenheim, Diniz and Gonzalez (2013) indicate that
financial exclusion implies a lower effectiveness of monetary policy, as large parts of the
population do not participate in the formal financial system, as was the case in Brazil until the
beginning of the 21st century.
Due to these rather explicit inconveniences of financial exclusion, policies aiming at including
all population segments to the formal financial sector have yielded positive results.
According to Jansen and Hannig (2010), financial inclusion has a causal impact on economic
growth, as access to finance for small companies fuels creative destruction. Sarma (2012)
confirms this effect on economic growth and likewise explains it through a more effective
allocation of productive resources and capital formation.
In addition, according to a study by Beck, Demirgüç-Kunt and Levine (2007), financial
development both improves income levels and reduces poverty. Furthermore, financial
development benefits the lowest income segments disproportionately compared to the higher
ones, and thus is an effective tool for reducing income inequality.
According to Jansen and Hannig (2010), research results on the improvement of the lives of low-
income groups have apparently been ambiguous, as the effect of financial access is hard to
isolate from other factors. Nevertheless, Sarma (2012) states that the access to formal financial
services improves the management of day to day finances of the poor, while reducing their

21
dependence on often exploitative informal sources of credit. Burges and Pande (2005) as well as
Bruhn and Love (2009) have observed positive effects of bank branch penetration on income and
unemployment of local population in India and Mexico, as having an account makes receiving
wages and remittances easier.
Finally, based on Mettenheim, Diniz and Gonzalez (2013), improving financial depth has proved
very beneficial for monetary policy in Brazil, for the Central Bank overnight rate hike required to
counter shocks decreased as the percentage of Brazilians affected by the policy grew.
Overall, it can be agreed that financial inclusion brings about numerous benefits to the society,
and it has therefore been accepted as one of the main instruments of economic development by
various governments, not only in developing countries but also in developed ones.
2.2.3. Measuring Financial Inclusion
As it has already been established, financial inclusion is largely regarded as an important factor
for economic development. In order to monitor the evolution of financial inclusion over time,
compare countries, and appreciate the effectiveness of public policies, it is essential to be able to
measure it.
The number of banked people has often been used as a proxy for financial inclusion, but
according to Sarma (2012), this measure ignores the access to and quality of usage of the
financial system. As Leeladhar (2006) puts it, financial inclusion is not “black and white”, in the
sense that people cannot be categorized into either financially “included” or “excluded”
individuals. Instead, there would be different levels of inclusion, meaning that a person could for
example own a bank account, but not be eligible for loans due to information asymmetry.
Jansen and Hannig (2010) admit to the difficulty of measuring financial inclusion, but propose
four attributes against which it could be observed: access (existence of barriers), quality
(adequacy of products to the client), usage (frequency and regularity) and impact (how the
client’s life is affected by the usage of formal financial services).
The World Bank started compiling data about the worldwide usage of financial services in the
beginning of this decade, in an attempt to systematize the measurement of financial inclusion
(Demirgüç-Kunt and Klapper, 2012). This Findex database was updated in 2014 (Demirgüç-

22
Kunt et al., 2015), and now contains data based on a survey of 150,000 individuals above 15
years of age in 148 countries. This database looks at the demand side of financial services, and
provides information on four main types of indicators: account penetration, savings behavior,
sources and purposes of borrowing and insurance for health and agriculture. The Findex database
is widely referred to globally, as it allows for a comparison of several indicators across countries
and years.
Despite the plenitude of the first Findex database published in 2011, Sarma (2012) sees it as an
incomplete measurement of financial inclusion. According to his criticism, the survey method
used to compile the Findex database gives an incomplete picture, as it only conveys information
about the individual level. For some countries, the individual financial behavior data in the
database can be very similar, despite those countries exhibiting very different financial inclusion
data on the macro level. Sarma (2012) proposes a single weighted indicator measuring inclusion
on three dimensions: banking penetration, availability of banking services and usage of the
banking system. Arithmetically, the method is analogous to the Human Development Index
(HDI) of the United Nations Development Program (UNDP), and its formula is displayed in
Appendix 1.
The Central Bank of Brazil adopted Sarma’s (2012) measurement for its Financial Inclusion
Report (2011a)1, but divided each dimension into sub-dimensions – for example, access was
measured both in terms of demographic and geographic density. In the Financial Inclusion
Report of 2015 (Banco Central do Brasil, 2015a), the Central Bank adds quality of services to the
measured dimensions, in order to track the adequacy of financial products to the needs of the
population. However, this dimension was not yet integrated to the composite indicator in 2015
due to a lack of appropriate data.
An adaptation of the Sarma (2012) model is used for computing a municipal financial inclusion
index for the research of this thesis, in a manner that is specified in the methodology section.
This referred model measures the access and usage dimensions of financial inclusion and ignores
quality due to lack of data.
1 The Financial Inclusion Report 2011 of the Central Bank of Brazil was based on the first version of Sarma’s IFI,
published in 2008.

23
2.2.4. State of Financial Inclusion around the World
After having examined the importance of financial inclusion and its measurement, this section
presents the current state of financial inclusion in the world, factors explaining financial
inclusion, as well as the evolution of policy response to improve financial reach.
Despite all previous efforts, in 2014, 2 billion people, more than a third of the world’s working
age population, remained excluded from the formal financial sector (Demirgüç-Kunt et al.,
2015). Such a large amount of people was still unable to save, borrow or protect themselves
against the unexpected, despite continuous efforts for greater inclusion. Nevertheless, it is
worthwhile to note that the number of people excluded from the formal financial sector had
decreased by 20% since 2011 (Demirgüç-Kunt and Klapper, 2012).
The map below, based on data of the Findex database, gives an overview of the global situation
in bank account ownership in 2014. On average, only 6% of adults in OECD-countries did not
have a bank account in 2014, compared to 46% in developing countries. At first glance, the map
seems to imply that more developed countries have a higher penetration of bank account
ownership, but that is not the whole story.
Figure 1: Account penetration around the world. (Demirgüç-Kunt et al., 2015)
According to Demirgüç-Kunt and Klapper (2012), national income does indeed explain
differences in financial inclusion indicators when looking at the world as a whole. However,
when observing only low and middle-income countries, national income does no longer explain
24
financial depth. There are significant differences between levels of financial inclusion of many
countries of this category at the same level of economic development, implying that other factors
could explain financial inclusion. Sarma (2012) also comes to the same conclusion when
applying his index of financial inclusion to different countries in the world. Based on Findex data
(Demirgüç-Kunt et al, 2015), there are also important differences between regions and inside
regions between socio-economic groups. The difference between men and women is also
remarkable, women tending to be more excluded from the formal financial sector everywhere in
the world. The differences in bank account ownership rather concisely reflect income
inequalities in the country. Moreover, rural populations also tend to be more excluded from the
formal financial sector than urban populations.
Demirgüç-Kunt et al. explain (2015) that a major reason for not having a bank account was
distance to banks, implying that there is a lack of banking infrastructure in many deprived
regions of the world. Other barriers stated were religious reasons, lack of trust, lack of
documentation, family member with an account, expense of bank account ownership or lack of
money to keep on a bank account. Interestingly enough, there are indeed large differences
between countries with respect to the number of documents required to open a bank account, and
the minimum balance required to keep a bank account, for example.
Aggarwal and Klapper (2013) confirmed that the cost of ownership of a bank account is
undoubtedly excessively high in Africa, as it costs around $4 per year on average.
Documentation, minimum balance requirements and distance impose an indirect cost on many
people, leading to financial exclusion. These differences among countries, along with distance to
banking services, seem to be main explicative factors behind the large discrepancy in financial
inclusion in low and middle-income countries.
According to Chakrabarty (2006), it is also often not economically viable for banks to cater to
the poor, generally due to poor infrastructure that renders the “last mile problem” very hard to
overcome. In addition, as previously mentioned, Jansen and Hannig (2010) explain that banks
often do not cater to the poor due to high information asymmetry.
Considering the factors stated above, public actors of a given country can try lower the barriers
that lead to exclusion, for instance by facilitating bureaucracy, strengthening institutions and
25
making banking with the unbanked segment more affordable for banks. According to Ardic,
Heimann and Mylenko (2011), in 2010, 86% of countries had at least one policy objective
regarding financial inclusion on their agenda. The issue is given more attention in developing
countries, but is also part of government policies in many developed countries.
In an article published on the website of the Consultative Group to Assist the Poor, Tsuji (2015)
contemplates the most dramatic changes in the last 20 years of financial inclusion. After the
rapid growth of microcredit, academic interest started shifting towards a larger array of financial
services, such as savings, insurance, remittances, payments and leases, together with credit. This
phenomenon of diversification in services has also been visible in the actors operating in the
field of financial inclusion: on top of the traditional microfinance institutions (MFIs), also
commercial banks, national governments and non-financial organizations participate in the
action against financial exclusion. In addition, digitalization and the development of information
and communications technology (ICT) has become an integral part of financial inclusion today.
Finally, Tsuji (2015) notes the increased importance of financial inclusion on global agendas and
the improved quality of its measurement as major developments of the last 20 years. There is a
wide consensus that nobody should be left behind from participating to the financial sector.
2.2.5. Policies for Improving Financial Inclusion
According to Mettenheim, Diniz and Gonzalez (2013), the global financial crisis led to
disillusionment with private sector-led initiatives for improving financial inclusion. These
initiatives, mostly consisting of micro credit, often involved abusive practices and led to over-
indebtedness of target populations. Conforming to the same authors, reaching the poor with
profitable interest rates was often not possible, and the importance of financial inclusion is such,
that its implementation cannot be left solely to the private sector. Jansen and Hannig (2010) also
stress the importance of partnerships between the private and public sector in reaching financial
inclusion. Furthermore, savings should be stressed over credit as a buffer against income shocks.
Jansen and Hannig (2010), as well as Mettenheim, Diniz and Gonzalez (2013) equally stress the
role of public banks in the implementation of public financial inclusion objectives, due to their
usually high reach and scale in developing countries. There is nowadays global consensus that
the public sector has a major role to play in the promotion of financial inclusion.

26
The G20 has taken financial inclusion as a main development objective, and created the Global
Partnership for Financial Inclusion in 2010, a platform of G20 and other countries for learning,
knowledge sharing, policy advocacy and coordination on financial inclusion (G20 Financial
Inclusion Experts Group, 2010). One of the main targets of the group is to include micro-
entrepreneurs in the financial system as engines of economic growth and employment
generation. According to the group’s report from 2014, 47 countries committed to actions to
promote financial inclusion by signing the Maya Declaration of 2011 (Global Partnership for
Financial Inclusion, 2014).
Policies adopted around the world for promoting financial inclusion aim at removing some of the
barriers discussed in the previous section, such as distance, documentation requirements and cost
(Demirgüç-Kunt et al. 2015).
Basic accounts have been a way to reduce distribution costs for banks when promoting financial
inclusion, and have been tested, among others, in South Africa (Aggarwal and Klapper, 2013),in
India (Leeladhar, 2006 and Thorat, 2006) and in Brazil (Mettenheim, Diniz & Gonzalez, 2013).
In South Africa, many of the opened accounts were dormant and the solution was not
commercially viable for banks, but its initial success caused the formal financial sector to see the
vast demand of the unbanked population for financial services (Aggarwal and Klapper, 2013).
In several countries, document requirements for opening bank accounts have been relaxed
(Aggarwal & Klapper, 2013). The Anti-Money Laundering (AML) and Combating the Finance
of Terrorism (CFT) controls, adhered to by most countries, often impose unreasonably strict
identification requirements on low-income populations, effectively barring them from the formal
financial sector. Indeed, studying the Findex data, Aggarwal and Klapper found that the number
of documents required for opening bank accounts was very negatively correlated with the
amount of accounts opened (2013). The Reserve Bank of India (RBI) has also engaged in
measures to facilitate the procedure for opening a bank account (Thorat, 2006).
As mentioned by Demirgüç-Kunt et al. (2015), one reason identified for poor bank account
penetration was a lack of trust towards the banking sector. According to Aggarwal and Klapper
(2013), previous defaults of financial institutions in developing countries could explain this
mistrust towards the formal financial sector. Only 16% of developing countries have deposit

27
insurance, and the implementation of such a system holds potential for improving the trust of the
population towards the financial sector.
In the Findex database (Demirgüç-Kunt et al., 2015), distance to banking services was an
important explaining factor behind exclusion. Numerous initiatives have been put in place to
increase the physical proximity of financial services to unbanked segments of the population.
According to Thorat (2006), the RBI has mandated banks to open a share of new branches in
underserved areas, but this has not been successful as reported by Aggarwal and Klapper (2013).
In agreement with Chakrabarty (2011), this is a sort of subsidy paid by the banks, while financial
inclusion can only be sustainable if it is economically viable for financial institutions.
According to Mas (2009), banks are not inherently incapable of catering to the poor, but have
rather never had the right incentives to do so. Branchless banking can be a way of making
financial inclusion economically viable for the formal financial sector. Policy makers rather need
to ensure that proper regulation exists to incentivize private actors to adopt new distribution
models.
Branchless banking can essentially be divided into mobile banking and agent banking (or
correspondent banking). Jansen and Hannig (2010) and Demirgüç-Kunt and Klapper (2012)
write about the success of mobile banking in Kenya and the Philippines, where the model has
met the largest success. Mobile payments are a practical way to overcome physical infrastructure
barriers, which tend to be high in Africa, for example. In 2014, 12% of Africans used mobile
payments, a figure much larger than on any other continent, according to Demirgüç-Kunt et al.
(2015). Mettenheim, Diniz and Gonzalez (2013) point out that mobile banking is a good solution
to overcome cost barriers, but it requires a complex infrastructure in order to function properly.
Such an infrastructure is harder to put in place, the more there is competition on the mobile
phone market and banking sector, and it has thus been successful in countries with more
concentrated markets. Furthermore, mobile banking solutions raise issues with respect to
monetary mass and AML/CFT controls, which form a challenge to their wider adoption
(Mettenheim, Diniz & Gonzalez, 2013 and Jansen & Hannig, 2010).

28
Another form of branchless banking, referred to as agent banking (or correspondent banking in
Brazil), has become rather popular around the world, particularly in Latin America and India
(Jansen and Hannig, 2010 and Mettenheim, Diniz & Gonzalez, 2013). This model will be
covered in detail in later sections, but it consists of banks collaborating with retailers to solve the
“last mile” problem. This model, just as mobile banking, is highly dependent on national
financial regulation and availability of adapted ICT-solutions.
Bold, Porteous and Rotman (2012) as well as Mettenheim, Diniz and Gonzalez (2013) present
another form of public policy aiming at improving financial inclusion – Government to Public
(G2P) transfers. These initiatives in several countries have originally aimed at improving the
disposable income of low-income populations, but have recently also been the object of financial
inclusion policies by national governments. Payment of these benefits on bank accounts or
electronic cards, as has been done in South Africa, Brazil, Mexico or Colombia, for example,
promotes the usage of the formal financial sector while decreasing the cost of these cash
transfers (Bold, Porteous & Rotman, 2012). As reported by these authors, the economic viability
of such programs has often been precarious, but technological advances and increase of scale
might change the setting in the future.
Jansen and Hannig (2010) write that in order for financial inclusion to be successful, the formal
financial sector should have low barriers of entry, competition between financial service
providers, quality infrastructure, informed demand and customer protection put in place.
Villasenor, West & Lewis (2015) also highlight the importance of informed demand, as financial
illiteracy is a key factor behind low adoption levels of financial services. The improvement of
financial literacy has thus become a major policy objective in different countries (Alliance for
Financial Inclusion, 2011 and Jansen & Hannig, 2010). The stability of the financial system also
needs more careful monitoring as more actors enter the field (Jansen & Hannig, 2010).
2.2.6. Financial Inclusion in Brazil
In a report of the state of financial inclusion published by the World Bank and the International
Monetary Fund (2013), the authors complement Brazil on the significant progress made in the
last decade. The country has one of the highest banking penetrations in developing countries, and
the Central Bank of Brazil, in cooperation with various public and private sector partners, has

29
engaged in a number of successful actions to promote financial inclusion in the country. The
Financial and Digital Inclusion Report 2015 ranked Brazil third after South Africa and Kenya
(Villasenor, West & Lewis, 2015). According to the Central Bank, a stable macroeconomic
environment (since 1994) and public policies have been main factors behind the success of
financial inclusion in the country (Banco Central do Brasil, 2015a).
A major Brazilian policy initiative, explained in detail in the next section, is the facilitation of
regulation concerning agent banking, referred to as correspondent banking in Brazil. This
initiative has allowed banking services to reach all Brazilian municipalities (World Bank & IMF,
2013).
Another main contributor to financial inclusion in Brazil is the Bolsa Família program (PBF), a
G2P program of the type portrayed by Bold, Porteous and Rotman (2012) in the previous
section. This program has been successful in increasing the available income of the poor while
bringing them closer to the formal financial sector. The public bank Caixa Econômica Federal
(CEF) has distributed this benefit through its correspondents, and developed simplified bank
accounts to promote the use of financial services. This initiative led to a massive penetration of
bank accounts among the unbanked in the last decade, as reported by Bold, Porteous and Rotman
(2012) and the Central Bank of Brazil (2011a). According to Mettenheim, Diniz and Gonzalez
(2013), the payment of the transfer on simplified accounts or electronic cards increased
convenience and safety for recipients, while decreasing costs for the government. The simplified
bank account itself was an important decision by the BCB to promote financial inclusion. In
2010, there were already 8.75 million such accounts in the country (Banco Central do Brasil,
2011a).
Despite this success, the Central Bank of Brazil (2011a) noted the inability of the involved banks
to promote other products through the simplified bank accounts – only 2.3% of recipient
households were using formal savings products in 2010. Nonetheless, the program was one of
the first ones to tap the potential of the banking correspondent networks in Brazil and gave useful
lessons for future policies.
The Central Bank of Brazil has also made an effort to promote microcredit in Brazil through
regulation (2011a). All banks are mandated to use 2% of their sight deposits for microcredit or

30
deposit it on a non-remunerated account of the Central Bank, which has led to a somewhat large
volume of money available for microcredit operations, at least in theory. Furthermore, a program
for rural lending, Pronaf was initiated by the government in the 1990s. In addition, the Central
Bank of Brazil has pushed for the creation of a positive credit registry, as the lack of one proved
a serious deficiency for financial markets due to high information asymmetry (International
Finance Corporation, 2006). The recent approval of the registry should bring downwards
pressure on interest rates and boost the financial sector, if implemented correctly, according to
the World Bank and the IMF (2013).
Nichter, Goldmark and Fiori (2002) report that private sector-led microcredit initiatives have
always been marginal in Brazil, due to the macroeconomic instability of the country until the
implementation of the stabilization program Plano Real in 1994 as well as due to the tradition of
government subsidized micro credit programs. One such program, Crediamigo of the Banco do
Nordeste, has reached over one million beneficiaries (representing 75% of the microcredit
portfolio of the country) in the Northeast region of Brazil, improving livelihoods through
subsidized credit (Mettenheim, Diniz and Gonzalez, 2013). Furthermore, the inability of MFIs to
accept deposits has been an obstacle to private sector-led credit programs.
Having signed the Maya treaty in 2011, the BCB participates actively in G20 programs for the
promotion of financial inclusion (Banco Central do Brasil, 2015a). The Central Bank gives high
importance to partnerships between the public and private sector to achieve targets. The tasks of
the bank include data collection, monitoring of indicators, and definition of targets as well as
evaluation of adopted strategies. The BCB launched the National Partnership for Financial
Inclusion in 2011 to reach G20 objectives (Parceria Nacional para Inclusão Financeira, 2012).
One of the latest initiatives of the Central Bank has been the Financial Citizenship program,
launched in 2013, with a focus on financial education and consumer protection, identified as
main barriers for financial inclusion in the country and worldwide (Banco Central do Brasil,
2015a).
Since 2010, the BCB has published a report on the state of financial inclusion in the country, the
latest issue dating from 2015 (Banco Central do Brasil, 2015a). A persistent problem noted in
these reports (Banco Central do Brasil, 2011a & 2015a) has been the unequal distribution of

31
financial depth in the country. There are large differences in the penetration of financial services
among regions, as depicted in Appendix 4. These differences seem to reflect rather consistently
the differences in development inside Brazil. Indeed, the index of financial inclusion of the BCB
strongly correlates with HDI in Brazilian mesoregions (Banco Central do Brasil, 2011a).
Cazella and Búrigo (2009) criticize Brazilian initiatives for financial inclusion for not reaching
the poorest people in rural areas. According to them, the national financial system, based on
urban centers, leads to capital flight from the interior to cities, and ruins the potential for
innovativeness and sustainable development in rural communities, thus perpetuating regional
inequalities. The authors equally criticize the concentration of the Brazilian banking sector, and
also note the fact that millions of people are not served by the formal financial sector, the
products of which are not adapted to their needs.
Nevertheless, as already mentioned, a lot of positive development has taken place in Brazil in
terms of financial inclusion. Indeed, since 2003, every Brazilian municipality has had at least one
point of access (POA) to financial services, and 84% of Brazilians have some type of relation
with a formal financial institution (Banco Central do Brasil, 2015a). However, only a share of
those people make use of this relation, as many people keep very low balances on bank accounts
or use formal services only for simple transactions. Between 2011 and 2014, the number of bank
branches increased by 24% in the country, but 35% of municipalities remained unserved. It is
worthwhile mentioning that there has been a wide expansion of Electronic Service Points (PAE)
in recent years (Banco Central do Brasil, 2015a). A list of the different types of Points of Access
(POA) in the country is available in Appendix 3, and the regional division of POAs is illustrated
in Appendices 4, 7 and 8.
The Central Bank of Brazil (2015a), as well as the World Bank and the IMF (2013), have
highlighted the rapid growth of credit in the country. The ratio of credit to GDP reached 25.6%
of GDP in 2014, and 73% of the population of the lowest income quintile had some sort of debt.
This issue is of particular importance, as savings are not aligned with credit due to the lack of
savings habit in Brazil – only 20% of Brazilians reported saving in 2012, half of them in the
informal sector. According to the World Bank and the IMF (2013), the expansion of credit is
mostly due to the wide availability of consumer credit and credit cards, as well as to the

32
popularity of virtually risk-free payroll credit, sometimes aggressively marketed to low-income
populations. As reported by the World Bank and the IMF (2013), Brazil has a very high cost of
credit compared to most countries, a phenomenon that they speculate is linked to the lack of
savings, information asymmetry, and lack of competition (from mobile operators, for example).
The high availability of credit and the relatively generous government pension programs do not
incentivize the population to save. Financial education programs should tackle this issue in order
to decrease risks in the financial system (World Bank & IMF, 2013).
Gonzalez et al. (2013) describe how integration with the formal financial sector in Brazil is
strongly linked with socio-economic class, as 61% of low-income households have a bank
account, compared to 91% of high-income ones. The authors also note the low penetration of
insurance products in Brazil, as only 26% of the population has health insurance.
In terms of mobile banking, Brazil has not reached levels of usage reported in Africa, despite
having a large base of mobile phone users. This is mostly due to regulation and to the strong
competitive position of banks on the market (World Bank & IMF, 2013), as well as to taxes on
broadband (Villasenor, West & Lewis, 2015). Nevertheless, the BCB believes that a future field
of development in Brazil will be wireless technological platforms (2015a), even though the
implementation of identification and AML/CFT-controls remains an issue. Furthermore, lowest
income segments might not have access to these technologies, a fact that cannot be ignored in the
design of future financial inclusion policies.
In the future, a large focus of the BCB (2015a) will be on the improvement of the quality of
services and products offered to the population, promotion of savings, as well as financial
education and consumer protection, due to an increase in complaints in the last years (The World
Bank & IMF, 2013).
Correspondent Banking 2.3.
2.3.1. Overview of Correspondent Banking
As already mentioned in the previous section, banking correspondents (BC) are third parties
contracted by financial institutions to deliver predetermined services for a commission. This type

33
of branchless banking has gained large popularity in Laos, Bangladesh, Nepal, the Philippines,
and particularly Brazil (Demirgüç-Kunt & Klapper, 2012). According to Aggarwal and Klapper
(2013), banking correspondents allow banks to reduce costs significantly by mobilizing networks
of local retailers for the distribution of their products, thus also addressing potential trust issues
of local population towards banks. In consonance with the same authors, the cost of opening a
banking correspondent could represent as little as 0.5% of the costs of opening a branch in
Brazil.
Correspondent banking is essentially based on technological infrastructure, such as
microcomputers or Point-of-Sale (POS) devices. According to Cernev, Diniz and Jayo (2009),
the use of banking correspondents is a manifestation of the “fifth wave of banking technology”,
the four prior waves being the automatization of back-office functions, the advent of branch level
processing through minicomputers, self-service platforms and internet banking. This fifth wave
of banking links the back office with banking intermediaries engaging in distribution, with the
target of increasing the customer base and opening new markets, motivated by the excessive
costs of distribution involved with the traditional channels.
The quality of technology and technological infrastructure is indeed a key factor of success, and
as Aggarwal and Klapper (2013) describe, many banking correspondents in India failed at
performing transactions in real time due to inappropriate technology. Additionally, regulation
plays an important role in correspondent banking, as several countries do not allow non-bank
actors to engage in financial services. Furthermore, in the case of India, correspondents
originally were not allowed to be located further than 15 kilometers away from the contracting
institution, which effectively reduced the reach of the network.
In his analysis of different set ups of branchless banking, Mas (2009) concludes that the banking
correspondent network based on retailers allows to reduce fixed costs for the institution by using
existing infrastructure, while also reducing transaction costs to the customers (in terms of travel
time and cost, for example). A fee-based remuneration system guarantees minimal risk for the
contracting institution, while providing remuneration for the retailer to cover for working hours
and trips to the institution, if volume is large enough.

34
Overall, a functioning banking correspondent network thus requires advanced technological
infrastructure, adapted regulation and agreements mutually beneficial for financial institutions
and the contracted third parties.
2.3.2. Development of Correspondent Banking in Brazil
According to Batista and Menéndez Rodríguez (2010), the BCB already authorized some sort of
usage of banking correspondents in 1973, but started to change regulation towards the modern
BC system in 1999, in an attempt to democratize access to finance. This was fore mostly due to
the unequal regional development of financial services in Brazil. As Batista and Menéndez
Rodríguez explain (2010), the end of hyperinflation achieved by the macroeconomic stabilization
program “Plano Real” in 1994 caused a geographical restructuration of bank branches in the
country. After the loss of inflationary revenue, often representing over 40% of the turnover,
many branches of formal financial institutions had to be closed in areas that had become
unprofitable. Banks refocused their activities to urban areas and to the richest regions of the
country, leading to an effective decrease in banking infrastructure in the North and Northeast
regions between 1991 and 2000, as illustrated by the figure in Appendix 5.
This development gave incentives to the Central Bank of Brazil to develop innovative solutions
for the provision of financial services to underserved regions (Batista & Menéndez Rodríguez,
2010). Originally, banking correspondents were only allowed to serve municipalities with no
branches, but through the Bolsa Família program, banks were finally permitted to contract
correspondents everywhere in the country.
The Central Bank decisions 3.110 and 3.156 of 2003 consolidated the regulation concerning
banking correspondents (Banco Central do Brasil, 2003a and 2003b). All financial institutions
were allowed to contract banking correspondents for the provision of services such as opening
accounts, payment of bills and loan requests (a detailed list of services is available in the
Appendix 3). The range of services to be offered remains at the discretion of the contracting
financial institution. Originally, the rules did not permit correspondents to sublet the contract,
but the BCB changed this rule to allow for the use of network integrators, a type of actor
introduced below. All private institutions and companies could become banking correspondents
since 2003. The contracting institution is entirely responsible for the actions of the
35
correspondent, and the BCB has the right to access all data concerning the correspondent (Banco
Central do Brasil, 2003a, 2003b). With the decision 3.954 of 2011, the Central Bank allowed
public companies to become banking correspondents and required training and certification for
BCs, in order avoid abuses and protect customers (Banco Central do Brasil, 2011b). The
resolution 4.294 of 2013 involved changes in the nature of credit proposals, requiring a plan of
economic viability for each credit operation (Banco Central do Brasil, 2013).
Kumar et al. (2006) describe the evolution of the correspondent networks of largest Brazilian
banks. CEF was the first bank to set up a BC network in 2000 for the distribution of the Bolsa
Família. The bank entered in cooperation with the national lottery, which already operated a
rather extensive network of lottery offices around the country. By modernizing the technology
used in the lotteries, Caixa quickly was able to cover all municipalities of Brazil. After
regulatory changes in 2003, the bank expanded its correspondent network to include retailers.
According to Mettenheim, Diniz and Gonzalez (2013), Caixa’s network was divided into
“transactional” and “business” correspondents, lotteries mostly belonging to the former category.
Banco do Brasil created a subsidiary, Banco Popular, for operating its BC network. Bradesco
won a public tender for tapping the network of the national postal service with the target to reach
all unbanked municipalities by 2003. In 2011, Bradesco lost this network to Banco do Brasil in a
second public tender, but opened new branches to compensate for the loss (Taraborelli, 2015).
Lemon Bank was an actor that entered the market in 2002 only with BCs and grew with retailers
and integrator networks in urban areas (Kumar et al., 2006), until selling its network to Banco do
Brasil in 2009 (Travaglini, 2009).
An aspect of the Brazilian correspondent network that deserves attention is the network
integrator, a type of intermediary between banks and correspondents. According to Jayo and
Diniz (2009), these actors were born in the 1990s in the Northeast region of Brazil, where
retailers collected payments for public concessionaries, due to a lack of banking infrastructure.
These retailers started being operated by “collection networks managers”, which retained a share
of the fee paid by the public service concessioner. When the BCB decided to allow
correspondents to “sublet” their contract and hire other correspondents, these network integrators
modernized their “correspondents” (mostly with POS devices) and offered their services to

36
banks. Jayo and Diniz (2011) provide a detailed explanation of the way in which different banks
outsource their BC networks, as the management of 54% of all BCs was partly or completely
outsourced in 2010. They conclude that the Brazilian BC network is very heterogeneous in
structure, and the architecture of each bank’s own BC system needs to be considered for future
development of public financial inclusion policy.
According to Kumar et al. (2006), opening a banking correspondent represents on average 0.5%
of the cost of opening a new branch, and operational costs are negligible. This saving in costs is
particularly due to the strict security requirements of bank branches. Batista and Menéndez
Rodríguez (2010) add that banking staff is expensive due to strong unions in the sector, and
outsourcing this service is a material saving. Banks only furnish installation of the technological
platform and pay fees for each transaction made through the system. It can therefore be seen as
an innovation that allows reaching segments of population previously unreached by the banking
sector. For Mettenheim, Diniz and Gonzalez (2013), the banking correspondent network could
be seen as a social innovation from the point of view of the customers that previously had
difficulties accessing finance.
Diniz, Birochi and Pozzebon (2012) affirm that the success of banking correspondents in Brazil
was made possible through a combination of technology and political will. The ICT solutions
used in the banking sector in Brazil are among the most advanced in the world, as they were
developed under the necessity for rapid clearing during the hyperinflation period. Furthermore,
the large scale of the Bolsa Família program made reaching underserved areas an important
target for regulators. Kumar et al. (2006) add that high costs of unionization equally pushed
banks to outsource, while the lack of restrictions for non-financial actors to handle cash made it
possible to do so. Diniz, Pozzebon and Jayo (2009) also mention the continental dimensions of
the country, the high barriers to entry to the formal financial sector and the consequent
concentration of the market as major reasons for the success of the system in Brazil. Batista and
Menéndez Rodríguez (2010) also mention the high interest rates of Brazil as a motivation for
banks to seek new markets. To all of this, Mas (2009) still adds the facts that bill payment is a
regulated banking service in Brazil, and that people can withdraw from their account at any bank
in the country. The convergence of these factors made the success of the BC concept possible in

37
Brazil. Overall, despite correspondent banking being practiced in many countries around the
world, especially in Latin America, the concept has reached the largest success in Brazil, for the
reasons mentioned above.
Indeed, the banking correspondent network was a major success - the number of correspondents
grew by a yearly average of 38% between 2000 and 2009, and their share out of total
transactions grew along (Batista & Menéndez Rodríguez, 2010). Between 2010 and 2014,
growth was more modest, but the number of banking correspondents in the country grew from
194,438 to 207,192, with a decrease between 2013 and 2014, due to a registration update (Banco
Central do Brasil, 2015a). Appendix 6 illustrates the evolution of banking correspondents
between 2010 and 2014. The growth in number of correspondents mostly occurred in smaller
municipalities. Banking correspondents represented 70% of all POAs in the country in 2014.
According to the Central Bank of Brazil (2015a), 2.5 billion transactions were made through the
network in 2014, and it was the most used channel for payments and transfers.
The Central Bank of Brazil (2015a) states that the role of the banking network in the
improvement of financial inclusion has been fundamental, due to the capillarity, improved
convenience and competition it has brought to the financial system.
2.3.3. Banking Correspondents and Financial Inclusion in Brazil
As the purpose of this study is to observe the relation between credit union correspondents and
financial inclusion, it is important to know how regular banking correspondents have been seen
to improve financial inclusion in Brazil.
Diniz, Birochi and Pozzebon (2012) studied the influence of opening a correspondent in a small
community in the State of Amazonas in Brazil, Autazes. The municipality was the first in the
North region to receive a Banco Postal (BC of Bradesco bank), and did not have any financial
infrastructure prior to its opening. This lack of access to formal financial services led to high
transaction costs for people in the municipality to get government transfers (public sector
salaries, Bolsa Família and pensions), as they had to travel to the state capital, Manaus, to collect
them. This was expensive, time consuming and risky, as robberies on the way were common.
Additionally, after having received their money in Manaus, they would usually spend it there and
bring goods back home, spending only little in their home municipality.

38
According to the study of Diniz, Birochi and Pozzebon (2012), one very positive outcome of the
implantation of the BC was the decrease of the previously mentioned high transaction costs for
using financial services. Another very explicit benefit, arising therefrom, was the stimulation of
the local economy, as locals would no longer spend their money in Manaus, but in their home
municipality. This significantly increased the impact of the PBF on local development.
Diniz, Birochi and Pozzebon (2012) also noted some negative impacts brought upon the
municipality through the BC implementation. One of the aforementioned impacts was the rapidly
increasing indebtedness of the municipality – many people were offered payroll loans with their
BF as collateral. Lacking financial literacy, 90% of the municipality held a debt by the time of
the study. Despite the high availability of debt for people with stable income, local SMEs were
not able to contract loans due to lack of collateral. Many people wished for financial education
and for products better adapted to their needs. Overall, it can be concluded that opening a
banking correspondent in a municipality with no prior financial infrastructure has a large impact
on the local community, with potentially both negative and positive aspects. Nonetheless, one
can expect the marginal impact of BC opening to decrease significantly after the contracting of
the first one in an area.
In a report by Bankable Frontier Associates, Sanford and Cojocaru (2013) studied the impact of
the Brazilian banking correspondent network on financial inclusion with a survey of 2,885 adults
in 2012, with interesting results. They concluded that banking correspondents manage to reach
underserved populations, as people using them are more likely to be poorer and less educated, as
well as living in rural areas or small towns. They also concluded that BC users are more likely to
be women. The majority of Brazilians (67%) lived within five kilometers of a banking
correspondent, and 57% could get to one without any cost. In rural areas, the average distance to
a banking correspondent was already longer, 10 kilometers.
Despite this relatively convenient access to banking correspondents, Sanford and Cojocaru
(2013) conclude that banking correspondents are mainly used for bill payment, as 67% of
households use them only for performing this service. Out of other transactions, only 12% of
withdrawals and 9% of deposits were made at banking correspondents. Furthermore, most
correspondents do not even offer a full range of services – only 19% of all correspondents could

39
open bank accounts in 2012. On the opposite side, only 4% of surveyed people with a bank
account had opened it at a banking correspondent. Moreover, even though 79% of BCs were
accredited with credit proposals, only 6% of loan detainers had contracted their credit at a
correspondent. There are large differences among regions, and citizens of the Northeast are the
most likely to use this channel. Anyhow, Sanford and Cojocaru (2013) see this as a missed
opportunity for the banks, as 70% of unbanked families have regular contact with correspondents
and could be attracted to the formal financial sector. According to Gonzalez et al. (2013), 94% of
people living close to a banking correspondent said they have already used its services.
An unexpected observation of Sanford and Cojocaru (2013) is that people prefer to pay bills at
banking correspondents due to physical proximity, but do not associate them with friendliness,
reliability, safety or protection of privacy. These are attributes more likely to be associated with
traditional bank branches. When given the chance, people prefer to do their transactions at a
branch office of a bank, which implies that there is substantial work to be done to improve the
quality of service of banking correspondents.
On a positive note, Sanford and Cojocaru (2013) report that paying bills at banking
correspondents has decreased the share of people having to do a special trip for that from 23% to
10%, thus somewhat decreasing transaction costs for people. Moreover, people paying bills at
correspondents were more likely to use other services of the BC. Furthermore, Villasenor, West
and Lewis (2015) point out that banking correspondents increase convenience to customers due
to longer opening hours than those of bank branches.
Ivatury (2007) studied the Brazilian banking correspondent system through interviews with
Brazilian banks in 2006. For him, the Brazilian banking correspondent system seemed to be the
perfect way to promote microcredit, as it would solve the distribution problem that has
commonly been problematic in microfinance. Nevertheless, it seemed that correspondents were
not targeting micro-entrepreneurs with loans, but rather informal workers. Ivatury (2007) states
that even though the goal of the system was never to distribute microcredit, banks might end up
offering more adapted products after gaining familiarity with the segment. He believes that BCs
distributing only transactional services will have to close when facing competition from nearby
correspondents with larger service offerings. However, Ivatury (2007) identifies the promotion

40
of financial literacy as a main investment required from banks, in order to improve the system.
He also raises issues with fraud that have occurred in the past, and that have led to some actors
scaling down their networks. Finally, Ivatury (2007) wonders whether banks can ever provide a
quality service to low-income populations while outsourcing distribution, and if competition
from MFIs would change something.
Kumar et al. (2006) also note that transactions and payments are the central success of the
system, while credit and other services remain minimal. Furthermore, many BC networks remain
concentrated in urban areas, and numerous opened accounts remain passive. Apparently, in 2006
the majority of banking correspondents were located in urban areas with existing financial
architecture, thus acting as a niche market inside them. Cernev, Diniz and Jayo (2009) state that
the fifth wave of banking innovation literally aims at outsourcing low value-added services such
as bill payments, in order to free capacity at branches. This innovation has not yet succeeded in
diversifying services. Jayo and Diniz (2011) also write that the BC network is a good way to
reach the unbanked, but it mostly works for well-structured services, such as payments, and does
not succeed in delivering services requiring intense relation or exchange of information.
2.3.4. Controversial Issues Related to Correspondent Banking in Brazil
Some negative issues have been raised by the proliferation of the banking correspondent system
that ought to be mentioned in this section. These issues are mostly related to labor rights and
safety of correspondents.
Silva (2007) analyses the banking correspondent phenomenon from a sociologic point of view,
and harshly criticizes the movement. According to her paper, banks have embraced the
correspondent model as a convenient way to reorganize work to advance the capitalist agenda.
Correspondent banking is a type of flexible contracting that circumvents the labor rights that the
banking sector has spent decades to achieve. Banks manage to improve reach with minimal
costs, while keeping competition at the minimum on the market. Allowing banks to open
correspondents in cities was a convenient way for them to segment the market and serve lower
value customers in low-cost service points, while keeping more affluent customers at the branch
office. Silva (2007) thus gives a different and somewhat exacerbating point of view to
correspondent banking.

41
Safety issues have equally been raised with respect to banking correspondents. Kumar et al.
(2006) write that correspondents usually do not have any safety infrastructure put in place, such
as bulletproof glass or security. Echoes of safety concerns are heard in two reports of the EPTV
news of Ribeirão Preto, a municipality of the State of São Paulo, where retailers receiving
payments of the CPFL (utility company) have stopped receiving bill payments due to the
increase in armed robberies and lack of guarantee of safety. This has left people in the
municipality with fewer options to pay their bills, as they have been used to the convenience of
bill payment at the retailer (Jornal EPTV Ribeirão Preto, 2011a and 2011b). This is a challenging
issue for banks, as the lack of security requirements of BCs in an integral part of the low cost that
makes them an attractive distribution channel in the first place.
2.3.5. Future of Banking Correspondents in Brazil
According to Diniz, Pozzebon and Jayo (2009), the banking correspondent network and the
expansion of microcredit in Brazil are developing on separate paths, but ICT could be a tool to
make their paths converge. The authors note that the way the BC system is currently modeled is
essentially well suited for the delivery of transactional services. According to them, relational
services that depend on negotiation between a bank clerk and the client, such as credit and
investments, are very difficult to automate. The success of transactional services can be seen in
their large share out of total – they represented 70% of transactions and 95% of value transacted
through the system in 2008.
Diniz, Pozzebon and Jayo (2009) try to understand the interests of actors involved in the system.
At first, when the BC system aimed at expanding reach of banking services, there were no
conflicting interests, but such clashes emerged in 2003, when a wider range of services was
allowed by the BCB. This was also the time when network integrators entered the market, and
different network set ups emerged. The system was no longer homogenous – for some actors
BCs were only a way of billing, while they were a way to overcome information asymmetries for
credit expansion for others. In concordance with Diniz, Pozzebon and Jayo (2009), network
integrators might emerge as actors pushing for more relational services, as they already operate
large networks and possess proven ability of adaptation.

42
Kumar et al (2006) are more pessimistic in their assessment of the future, and wonder whether
relaxing rules on branch opening by the BCB would not be a better way to bring quality services
to municipalities than banking correspondents, if the main factor behind their success is the low
cost of set up and operation. They also see banking correspondents as the “second best option”,
as was also observed in the study of Sanford and Cojocaru (2013).
According to the Central Bank of Brazil, the role of banking correspondents needs to be
reviewed in order to improve the quality of financial services promoted to the population, instead
of simply granting access to financial services. If banks do not take the lead in this process, the
banking correspondent network might find itself challenged by online and mobile banking in the
future (Banco Central do Brasil, 2015a).
Credit Unions 2.4.
2.4.1. Credit Unions Explained
The World Council of Credit Unions (WOCCU) defines credit unions (CU) as “Member owned,
not for profit financial cooperatives that provide financial services to their members” (World
Council of Credit Unions, 2015). Membership in credit unions is often based on some sort of
linkage between members, a common bond. According to WOCCU (2015), credit unions pool
members’ savings to finance loan portfolios, and do not rely on external sources of finance
(however, this is not always the case e.g. in Brazil). Credit unions are also characterized by
democratic control, as they function with a “one member – one vote” principle and any member
can volunteer for the board of directors. Soares and Sobrinho (2008) stress the role credit unions
play in development, as they reach more remote areas and form a bond with the local society.
Indeed, according to Ardic, Heimann and Mylenko (2011), 40% of credit union branches
worldwide are located in rural areas compared to 24% of bank branches. Conforming to Soares
and Sobrinho (2008), credit unions do not impose a systemic risk on the financial sector, as
credit unions use members’ funds to finance loan portfolios, and all risks and losses are borne by
members. Comparisons of credit unions and banks can be found in the Appendices 9 and 10.

43
According to WOCCU (2014), as of 2014, there were 57,000 active credit unions in the world in
105 countries, with 217 million members, representing 8% of the global working age population.
Together they boasted $1.5 trillion in savings and $1.2 trillion in loans in the same year. As
reported by Ardic, Heimann and Mylenko (2011), credit unions’ share of outstanding loans
worldwide was 19% as of 2011.
From a theoretical point of view, credit unions can be seen as a bond between people, through
which resources are pooled from surplus members to people in need of liquidity. In resonance
with Besley (1995), people who tend to form institutional connections are often exposed to
nonsynchronous shocks in consumption and can benefit from each other’s differing cash flow
patterns. The physical proximity of these people reduces information asymmetry. Indeed, as
Besley (1995) puts it, credit unions can reduce the cost of loan collection through their peer
monitoring system, especially in cases where the formal financial sector is underdeveloped to
serve low-income populations.
Furthermore, according to Fama and Jensen (1983a & 1983b), financial institutions based on
mutuality, such as credit unions, are a solution to the agency problem of traditional banks in
which depositors and bank owners have different risk appetites. This discrepancy disappears in a
credit union, in which depositors are themselves the owners of the institution.
Smith and Stutzer (1990) as well as Bhattacharya and Thakor (1993) explain credit unions as an
endogenous phenomenon of credit markets. When the market is composed of good and bad
payers with respective probabilities of default, and people only know themselves to which
category they belong, good payers would be likely to opt for a credit union. As the person knows
that he will pay, his savings will be safe and he can even get return on his savings by paying the
loan. De Aghion and Morduch (2005) equally confirm that participation in a CU encourages
payment of loans, as the borrower has his own money invested in the institution. Brazilian
evidence seems to prove that credit unions attract better payers, as they boast lower default rates
than traditional banks (Banco Central do Brasil, 2015).

44
2.4.2. Brief History and Examples of Credit Unions
The history and examples of credit unions found in literature illustrate that the movement often
started with a social mission, but as it grew, a dilemma was born between efficiency and social
objectives.
According to Mettenheim, Diniz and Gonzalez (2013), credit unions were founded by Schulz-
Delitzsch and Raiffeisen in 19th
century Europe as philanthropic institutions promoting savings
for the working class populations, in an attempt to solve social problems. The movement grew
fast with the establishment of centrals for wholesale operations, while singular CUs remained
independent. Credit unions were suppressed during the 1930s and 1940s but started growing
again after World War II and are nowadays a solid part of the financial sector of several
European countries.
Axworthy (1981) writes about the development of credit unions in Canada, where they had an
important social role until the 1970s. Faced with efficiency imperatives, credit unions had to
grow and give up part of their social mission. Membership became easy to acquire and credit
unions started resembling commercial banks.
In the United Kingdom, credit unions were seen as a solution for an increasing incidence of
financial exclusion in the aftermath of a credit crunch in the 1990s (Fuller, 1998). Almost 15
years later, credit unions were still seen as a safety net for rural communities and as safe havens
for savings and credit during the financial crisis by regulators in the UK (Myers et al., 2012).
Nevertheless, the movement remained rather marginal in the UK, as credit union penetration was
only 3% in 2014, compared to 43.2% in Canada in the same year (WOCCU, 2014).
The credit union movement came to a crossroad in the 1980s, as explained by Búrigo (2006).
Facing pressures of large membership base and competition with the formal financial sector, the
credit union movement chose between three different paths around the world. Some credit unions
partially or completely lost their credit union status. This “demutualization” occurred mostly in
Australia, Belgium, New Zealand, South Africa, Sweden, the United States, and the United
Kingdom, as stated by Búrigo (2006). Another path was the enforcement of cooperative activity
through fusions and cooperation, which was demonstrated by the credit unions Rabobank (NL),
Desjardins (CA) and Caja Rural (ES), that nowadays host extensive networks while maintaining

45
cooperative principles. The last option, that Búrigo (2006) calls “internal demutualization”,
occurred when credit unions remained with a cooperative status while acquiring shares of
commercial banks to adopt methods more in line with the formal financial sector. This happened
largely in France and Germany. According to Búrigo (2006), this commercial development of
the credit union movement gave birth to a counter-movement of CUs focusing on local
development and social inclusion, as will be depicted in a later section.
2.4.3. Challenges of Credit Unions
The literature has identified several challenges of the credit union movement, some of which
were already introduced in the previous section.
Axworthy (1981) noted that Canadian credit unions faced the challenge of being efficient
financial institutions with good quality management and a full range of services, while being an
organization with a social focus catering to basic needs of the society. Keeping the involvement
of members is difficult as the union grows, and becomes a challenge to the movement, as
illustrated by Búrigo (2006) in the previous section. Axworthy (1981) highlights that staying
small is important in order to accomplish cooperative mission, and therefore scale should be
achieved through centrals rather than growth.
Besley (1995) describes that the transfer of credit union concepts from one region to another has
not been successful – a phenomenon that he explains through the necessity for a bottom-up
approach in the foundation of sustainable CUs. Furthermore, the same author illustrates how
credit unions are subject to covariant risks – if all members are farmers, a bad harvest year could
compromise the entire union’s liquidity and lead to mass default.
Some difficulties experienced by credit unions in the United Kingdom include the difficulty to
get volunteers and the lack of public awareness (Fuller, 1998). Myers et al. (2012) describe how
the Welsh government wanted credit unions to be financially independent while keeping their
focus on the poor. This led to the necessity to attract more affluent people with larger resources,
while maintaining a focus on the poor and yet not being labeled as a “poor people’s bank”.
Myers et al. (2012) saw that credit unions needed to improve their management significantly and
increase their portfolio if they are to attract higher income populations and become a self-
sufficient segment.

46
Several theorists have noted challenges that cooperatives generally tend to face. According to
Bonin, Jones and Putterman (1983), the inability of cooperative members to sell their equity
leads to a fragile financial system. Furthermore, the authors note that differences in investment
horizons of members might cause conflicts. This is particularly problematic since decision
making in the cooperative is democratic. As Hansmann (1996) and Staatz (1987) illustrate, the
indirect costs of decision-making are high in such a system, when interests of the members are
not aligned. Furthermore, the lack of hierarchy leads to inefficient governance in a cooperative,
in consonance with Williamson (1980 & 1985), as performance monitoring is challenging to
implement. Caves and Petersen (1986) state that, despite these disadvantages over enterprise
structures, cooperatives tend to be more used during industry down turns and market failures, as
competition is less intense. Despite this criticism, credit unions have managed to survive in open
market economies (Mettenheim, Diniz, Gonzalez, 2013 and Búrigo, 2006), but often not without
adaptation.
2.4.4. The Common Bond of Association
A concept closely related to credit unions that deserves attention is the common bond of
association. As explained in earlier sections, credit unions are often formed by individuals that
share a common occupation or geographical area. Indeed, as Fuller (1998) puts it, the objective
of the bond is to bind members together and increase pressure for compliance with common
rules. This is thus a way to decrease information asymmetry, as mentioned earlier. Arnold and
Stiglitz (1990) note that members of non-market institutions (such as CUs) usually know each
other well, and can better monitor each other, compared to distant formal institutions. Members
have a higher threshold to cheat on their promises to people they know. Furthermore, as stated by
Axworthy (1981), the more tightly defined the common bond is, the easier it is to devise services
suited to the members. He also notes that the bond limits competition between credit unions, as
they have different target groups.
Despite the advantages of the common bond in binding people together and overcoming
information asymmetry, the rule started to be gradually relaxed in Canada in the 1970s
(Axworthy 1981), and similar developments were visible in the United Kingdom on the wake of
the 21st century (Fuller 1998). This had been from one side justified by the exclusionary nature
47
of some common bond requirements, such as those based on geography (Fuller, 1998), and from
another by the need to achieve greater scale. Burger and Dacin (1991, as cited by Fuller, 1998)
note that the relaxation of the common bond requirements led to unprecedented growth of the
credit union movement in the United States. Nevertheless, according to Axworthy (1981),
phasing out the common bond might increase competition between credit unions, which is not
necessarily good for the social aspect of the movement. Along these lines, it seems that the
common bond question is challenging, as it ensures the proper functioning of a credit union, but
potentially prevents it from achieving sufficient scale to be competitive against banks.
2.4.5. Credit Unions in Brazil
Brazil hosts the most credit union members in Latin America in absolute numbers, but the
participation rate of the population is the smallest, as illustrated on the map in Appendix 11
(World Council of Credit Unions, 2014). Only 4.3% of the active population of Brazil
participates in credit unions, compared to a Latin American average of 8.3%. Nevertheless,
Marques Soares and Duarte de Melo Sobrinho (2008) write that the growth pace of the
movement in Brazil between 2004 and 2007 was among the fastest in the world. The Central
Bank of Brazil (2015a) equally notes that credit volume grew by 128% for credit unions between
2010 and 2014, compared to a growth of 76% in the banking sector.
2.4.6. History of Credit Union Development in Brazil
In a report published by the Central Bank of Brazil, Marques Soares and Duarte de Melo
Sobrinho (2008) tell a rather detailed history of normative development of the credit union
movement in the country. The first credit union of Brazil was opened in the 20th
century in the
State of Rio Grande do Sul. It was based on agriculture, similarly to most consequently founded
credit unions until the 1960s. Several “Luzzatti” type credit unions were also opened, in which
membership was open and services were also offered to non-members. In 1965, the common
bond rule was strictly enforced and credit unions could only be used for rural finance (Marques
Soares & Duarte de Melo Sobrinho, 2008).
In the 1990s, the BCB got interested in the credit union movement again and engaged in a series
of regulation changes to structure the movement. Credit union networks were allowed to create
cooperative banks in the 1990s, and regulation slowly decreased the risk management

48
requirements of credit unions to levels similar to commercial banks. The Central Bank also
decreased capital requirements to form a credit union and allowed micro-entrepreneurs and other
natural persons to form them. Posteriorly, the BCB gradually relaxed the common bond rule and
finally allowed “free admission” credit unions in 2003. In addition, the Central Bank
progressively increased the compliance requirements on single credit unions and enforced the
role of centrals, incentivizing single CUs to join a network. Most of these changes were decided
with the intention of encouraging the growth and consolidation of the movement and allowing it
to increase in scale, as the Central Bank saw credit unions to be beneficial for financial inclusion
(Marques Soares & Duarte de Melo Sobrinho, 2008). Indeed, the movement grew fast, and the
number of credit unions more than doubled between 2002 and 2006 (Búrigo, 2006).
The Central Bank of Brazil saw the removal of the common bond requirement as a global trend,
and estimated that it would allow accommodating the mismatch between agricultural production
and commercialization (Marques Soares & Duarte de Melo Sobrinho, 2008). This could also be
seen as a way to reduce the collateral risk inherent to tightly knit credit unions, portrayed earlier
by Besley (1995). In his ex-post assessment of the removal of common bond requirements in
Brazil, Meinen (2013) affirms it was a major development allowing joining economically active
populations from various fields under one roof. In his assessment of the change, Meinen (2013)
sees free admission as the only way to build sustainable credit unions in less densely populated
areas of the country. Furthermore, as free admission credit unions are already somewhat
universalistic, they are more open to mergers, which is important to reach scale and reduce costs
for the success of the movement. According to the BCB (2015a), free admission credit unions
grew by 24% between 2010 and 2014, while other types of credit unions (mutual and rural
credit) saw their number decrease by 25% over the same period. Despite only 26% of single
credit unions being free admission ones, their share of the total CU credit portfolio represented
62% in 2014 (Banco Central do Brasil, 2015a).
It seems that the removal of common bond requirements has indeed boosted growth in the sector,
as Meinen (2013) speculates, but one may wonder whether the removal of this bond increased
information asymmetry or default rates, as would follow from theories of Besley (1995) as well
as Arnold and Stiglitz (1990), cited in previous sections. This is likely to be a reason why the
49
Central Bank put increased pressure for governance and compliance on credit unions after
relaxing common bond requirements (Marques Soares & Duarte de Melo Sobrinho, 2008).
Between 2010 and 2014, the number of single credit unions decreased in Brazil, mostly due to
fusions, market exits and denials of operation permits, according to the BCB (2015a). This is part
of a “clean-up” of the sector to increase scale while professionalizing governance and extending
services, and free admission credit unions seem to play an undeniable role in this process.
2.4.7. Different CU types in Brazil
As already implied in the previous section, there are different types of credit unions in Brazil –
mutual credit unions (mostly urban), rural credit unions (mostly rural), Luzzatti credit unions
(mutual with free admission, founded prior to 1999) and free admission credit unions. Singular
credit unions often choose to join networks of credit unions to coordinate activities through a
central. According to Soares and Sobrinho (2008), without centrals, the scale of the credit union
movement would be much smaller than it is today. Centrals take care of reporting, training and
fund guarantee, thus allowing single credit unions to gain scale for administrative tasks and
reduce costs. Their role became particularly important after the advent of free admission credit
unions, in concordance with Soares and Sobrinho (2008).
Centrals often are part of a confederation, leading to the existence of a network of single
cooperatives under the same brand. In 2008, 63% of credit unions in Brazil operated under this
structure, referred to as “pyramid” by Marques Soares and Duarte de Melo Sobrinho (2008). The
three main networks are Sicoob, Sicredi and Unicred. On top of this structure, 19% of credit
unions acted independently and a share founded networks of singular credit unions without
centrals. On top of this structure, Marques Soares and Duarte de Melo Sobrinho (2008) present
Ancosol, which is an organized system of rural credit unions with around 200 single members.
For Cazella and Búrigo (2009), Ancosol is the only network true to the “solidary” mission of
credit unions, as other networks operate in a rather bank-like manner. Cresol, the main network
of the unofficial confederation has a strong focus on education of members and the community.
Cresol distributes mostly public funds through governmental agriculture development and
housing programs, and is as such somewhat different from the other networks of unions. A
graphic illustration of the Brazilian credit union system is available in Appendix 15.

50
According to Marques Soares and Duarte de Melo Sobrinho (2008), the verticalization of credit
unions, illustrated by the growth of networks, is a tentative to better organize activities, increase
scale and improve efficiency. The quest for larger scale has also been accompanied by the
increase of reach through the opening of more points of service (PACs).
2.4.8. Credit Unions and Financial Inclusion in Brazil
Credit unions are largely seen as beneficial for financial inclusion in Brazil, which is a root cause
for the changes in central bank regulation described in the previous chapters (Marques Soares &
Duarte de Melo Sobrinho, 2008 and Banco Central do Brasil, 2015a). The World Bank and the
IMF (2013) acknowledge the importance of the credit union movement in the promotion of
financial inclusion in the South and Southeast regions of Brazil. According to their report, the
application of local resources in investments makes credit unions more careful and responsible in
investment decisions.
Marques Soares and Duarte de Melo Sobrinho (2008) acclaim credit unions for their ability to
apply private resources and assume risks in favor of the community where they develop. As
citizen-led initiatives for financial inclusion, they are considered to hold great potential for
sustainable local development. By facilitating savings and financing entrepreneurship, credit
unions are beneficial to the community, as they promote job creation and more equal income
distribution. Marques Soares and Duarte de Melo Sobrinho (2008) see credit unions as a
response to globalization, managing to keep savings and jobs in small communities, while
offering services more adapted to local populations.
Gonzalez and Brito (2013) studied the importance of credit unions in the provision of micro
credit in Brazil. In agreement with these authors, the objectives of credit unions and microcredit
are essentially the same, as they both use proximity as a tool to overcome information
asymmetries deterring the formal financial sector from serving a segment of the population.
MFIs and credit unions aim at knowing their borrowers to judge their credit worthiness. Taking
into account these converging aspirations, Gonzalez and Brito (2013) see credit unions as the
best way for proximity finance to work in Brazil. This is especially the case due to the regulatory
limitations imposed on MFIs, such as their inability to attract deposits. Unlike MFIs, credit
51
unions already have relatively large capillarity in Brazil, with a presence in 43% of
municipalities in 2014 (Banco Central do Brasil, 2015a).
In their study of credit union data, Gonzalez and Brito (2013) find that credit unions already play
an important role in microcredit, as they had a total portfolio of R$ 4.8 billion of loans below R$
5,000 in December 2011, with an average loan size of R$ 530. Furthermore, R$ 886.2 million in
the portfolio consisted of loans below R$ 1,000, averaging R$ 168 per loan. Loans of this size
seem to be directed to the lowest income segments. In concordance with Gonzalez and Brito
(2013), credit unions are often situated where low-income populations are, which only makes it
likely that they manage to distribute funds to those segments. The authors conclude that credit
unions have an undeniable role in finance of proximity and in fostering income generation
among the poorest socio-economic groups.
The size of the small loan portfolio of credit unions presented by Gonzalez and Brito (2013) is
rather different from the figures provided by the BCB (2015a) that estimate the CU micro credit
portfolio at R $331.6 million in 2014. This is most likely due to particular classification methods
of micro credit in Brazil. In any manner, according to the BCB (2015a), credit unions have the
lowest default rate in micro credit – 1.8% in 2014, compared to 4.2% for banks and 4.7% for
MFIs (“SCHMEPPs”), which could be explained by proximity and lower information
asymmetry. This implies that credit unions hold great potential for financial inclusion in Brazil.
Marques Soares and Duarte de Melo Sobrinho (2008) still remind that credit policies of CUs
should be better adapted to micro entrepreneurs, in order to improve loan quality and reach to
MSMEs.
Búrigo (2006) exhibits a somewhat more pessimistic view about the credit union movement. For
him, most credit unions in Brazil have lost touch with their solidary roots and have become
almost undistinguishable from banks. According to him, the only credit unions that do not only
care about their members, but also try to extend impact to a maximum of people in the
community are the Cresol unions, part of the Ancosol network. Búrigo (2006) explains that these
credit unions achieve deep penetration in communities and focus on products adapted to the need
of low-income populations, while promoting financial education. Despite Búrigo’s criticism of
credit union networks, they at least improve financial inclusion for their members. Nevertheless,

52
it would be interesting to know whether Cresol member CUs have larger portfolios of small
loans than other networks.
2.4.9. Success Factors for Credit Unions in Brazil
As mentioned in the previous sections, the credit union sector in Brazil has recently seen some
concentration (Banco Central do Brasil, 2015 and Marques Soares & Duarte de Melo Sobrinho,
2008), as the total number of credit unions has decreased due to market exits. According to
Marques Soares and Duarte de Melo Sobrinho (2008), the mortality rate of credit unions in
Brazil between 2000 and 2008 was 74%.
In their study of factors behind longevity of credit unions in Brazil, De Carvalho et al. (2011)
conclude that size is the biggest determinant of survival. According to these authors, the pressure
put on credit unions to remain competitive against banks while adhering to cooperative
principles has led to numerous market exits, mostly in the form of mergers. Mergers as such are
a way for credit unions to reach scale, and the larger the credit union, the smaller its probability
of market exit. As De Carvalho et al. (2011) state, financial indicators are of secondary
importance for credit unions, whose main targets are of social nature. Nonetheless, a certain level
of financial solidness is required in order to ensure the continuity of activity, and size is one of
the main “cushions” against market exit. Other important factors for the survival of credit unions
are their funding ability and management focus. Credit unions that have a large share of revenue
outside of lending have higher probabilities of market exit, as it may imply failure in the core
activity, according to De Carvalho et al. (2011). Critical financial ratios for credit union market
survival are listed in Appendix 16. Interestingly, Barroso, Bialoskorski and Neto (2010, as cited
by De Carvalho et al., 2011) conclude that the surplus distribution policy of a credit union has a
significant effect on the attractiveness of membership and thus on the ability of the CU to attract
funds. In concordance with the same authors, credit unions that distributed surplus directly on the
members’ current account were more attractive than credit unions that transform the surplus into
equity or do not divide it. De Carvalho et al (2011) still add that in order to outperform banks,
credit unions have to manage their costs in a professional manner.
Garcia and Villa Lhacer (2012) write about the maximization of value to customers. As the aim
of credit unions is to offer benefits compared to the traditional banking system, the authors

53
studied whether credit union members receive “abnormal benefits” compared to bank customers.
These benefits would materialize to the customers in the form of lower interest rates on loans and
higher interest rates on deposits. The liquid benefit to members is maximized when the spread
between CU rates and bank rates for these products is maximized. Interestingly, Garcia and Villa
Lhacer (2012) note that the more concentration on the market, the higher the spreads between
these rates. This implies that member benefits are greater in large credit unions. Garcia and Villa
Lhacer (2012) found that credit unions had indeed generated abnormal returns for members in
the studied year 2008.
Both studies by Garcia and Villa Lhacer (2012) as well as De Carvalho et al. (2011) imply that
credit unions need to reach scale in order to be successful, which explains the recent
restructuring of the market. The success of “free admission” credit unions in this process might
be explained by their better ability to grow both organically and through acquisition, as
suggested by Meinen in a prior section (2013). This phenomenon is part of a general
“rationalization” of the credit union sector in Brazil, in consonance with Marques Soares and
Duarte de Melo Sobrinho (2008).
2.4.10. Challenges of the Credit Union Sector in Brazil
Marques Soares and Duarte de Melo Sobrinho (2008) write that even though regulators in Brazil
see credit unions as a corrective force for resolving regional inequalities, most credit unions are
located in the South East and South regions, which are already the most developed and
financially included parts of the country. An illustration of this unequal distribution can be seen
in Appendix 12. According to BCB data (2015a), the South region, being the “cradle” of the
credit union movement in Brazil, still has by far the most active population in this respect. In the
South, 90% of municipalities had a credit union branch, compared to only 17% of the
municipalities in the North and 9% in the Northeast region. Similarly, the South region
represented 44.4% of total CU credit to physical persons in 2014, whereas the North and
Northeast region together represented only 6.1% (see Appendix 13). Furthermore, as illustrated
by data of the BCB (2015a) available in Appendix 14, credit union penetration reached 12.2% in
the South and only 0.8% in the North and Northeast. In 2014, 6.4% of Brazilian municipalities
were lacking a bank branch, and only a quarter of those municipalities were covered by credit

54
unions (Banco Central do Brasil, 2015a). Moreover, 72% of small municipalities did not have
credit union presence in 2014.
Marques Soares and Duarte de Melo Sobrinho (2008) note that it might be necessary to develop
different principles for credit union development in order to ensure their success in less densely
populated regions. Meinen (2013) highlights the improvement brought upon the sector by the
removal of the common bond requirement and claims that credit union development in sparsely
populated places such as Rondônia, a federal unit of the North region, would never have been
possible without it.
Another challenge seen by Marques Soares and Duarte de Melo Sobrinho (2008) is the
heterogeneity of the credit union sector in terms of assets, and the difficulty this imposes on
regulators. In consonance with the same authors, credit union regulation would be best left to the
CUs themselves, but the reality of generally poor education and management knowledge in the
sector makes this impossible. Fixing objectives and planning future cash flows would prove very
useful to credit unions, but is rarely done, according to Marques Soares and Duarte de Melo
Sobrinho (2008).
A further issue noted with respect to credit unions is the competition brought upon them by
payroll loans. Marques Soares and Duarte de Melo Sobrinho (2008) report that these loans often
have lower interest rates than credit union loans due to the low risk for financial institutions. It
has to be noted that credit union networks that own cooperative banks, namely Sicredi and
Sicoob, may also be able to offer payroll loans. However, these credit unions represent only a
minor share of all credit unions in Brazil. In consonance with the same authors, it is important
for credit unions to manage their costs in order to remain competitive with banks. This could be
best done through mergers, but there is a large resistance against consolidation on the market, as
Marques Soares and Duarte de Melo Sobrinho (2008) note that mergers are often resorted to only
in case of financial distress. The same authors also propose cooperation between actors in the
form of a mutual guarantee fund in order to improve trust.
Marques Soares and Duarte de Melo Sobrinho (2008) also note that in 2007, only 50% of credit
union assets were in financial use due to inefficient management. Meinen (2013) claims that
credit union members still get a substantial amount of loans from the formal financial sector due

55
to the insufficiency of credit union funds. The Central Bank (2015a) sees a great need for
development in the management of the sector and hopes that the ongoing restructuration will
lead to a healthier and more sustainable credit union segment in Brazil.
2.4.11. Credit Union Correspondents
The BCB’s decision 3.156 of 2003 allowed credit unions to contract correspondents in the same
way as banks (Banco Central do Brasil, 2003b). As mentioned earlier, there is a rather
constrained availability of literature concerning the use of banking correspondents by credit
unions, but the topic has been mentioned in some sources that are presented here. In the light of
previous theory, credit unions and correspondents can be seen to form a good match. As credit
unions excel in the promotion of finance of proximity, they may be able to promote relational
services through correspondents better than traditional banks. According to data of the BCB
(2015g), credit unions already had around 3,100 correspondents in Brazil in December 2014.
The academic literature presents both credit unions and banking correspondents as actors that
increase the proximity of financial services. Furthermore, credit unions are seen as actors with a
mission to improve financial inclusion. Banking correspondents could help credit unions
improve the reach of their services to low-income populations. This combination has the
potential to become a powerful tool for fighting financial exclusion in Brazil.
Nevertheless, the initial literature found on the topic does not directly support the speculations of
the previous paragraph. Ramos and Kovaleski (2011) performed a study of a credit union
correspondent (or “accredited agent”) in a municipality of the State of Paraná. In their study, a
credit union had contracted a member retailer as a BC to receive bill payments to free capacity in
the credit union branch. This added convenience to customers and the credit union, but was not
profitable for the correspondent in question, as concluded by Ramos and Kovaleski (2011).
In a blog entry concerning credit unions, Coelho (2013) writes about the increased waiting lines
at credit union branches due to non-members paying bills. In line with the same author, the
consumer protection law 8.078 of 1990 gives the right to anyone to pay bills at any institution
entitled to receive them. Credit unions that have signed a contract with energy concessioners for
receiving payments may therefore not limit this service to its members. Coelho (2013) writes that

56
the wish to liberate capacity at branches has led some credit unions to open BCs for receiving
bills.
These two sources suggest that credit union correspondents might be used only for transactional
services, being thus more restrained than regular banks’ BCs. Sicredi seems to confirm this
impression, as the union’s website (2015) advertises becoming a correspondent, and details that
the point is to receive bill payments.
Finally, it has to be stressed that the above-mentioned sources are somewhat limited, as they
focus on particular credit unions and municipalities, and can thus not be considered as
universally relevant. Furthermore, as Sanford and Cojocaru (2013) concluded, BCs used for bill
payments do decrease transactional costs of people and thus improve financial inclusion to some
extent. It can be concluded that there is still room for improving understanding of credit union
correspondents.
3. Methodology
Research Type 3.1.
As it has already been made clear, despite the existence of an abundant body of academic
literature about credit unions, banking correspondents and financial inclusion, those topics have
not been “combined” up to date. This means that there is no established theoretical framework
for the study of credit union correspondents, despite their potential similarity to regular banking
correspondents.
According to Hair, Babin, Honey and Samouel (2003), exploratory research is used to develop
better understanding of a topic. According to Robson (2002) it is used to find out “what is
happening, to seek new insights, to ask questions and to assess phenomena in a new light” (p.59).
In contrast, explanatory research aims at establishing causal relationships between variables, and
descriptive studies aim at portraying and describing phenomena accurately (Saunders, Lewis and
Thornhill, 2007).

57
This thesis combines elements from exploratory and descriptive research. It aims at paving the
way for research about an aspect of credit unions and banking correspondents that has received
very little attention, and is therefore mainly exploratory. Nevertheless, in its attempt to portray
the usage of correspondents by credit unions, this thesis can also be seen to be partly descriptive.
Research Paradigm and Approach 3.2.
In his 1990 publication, Egon Guba (1990) defines paradigm as “a basic set of beliefs that guides
action, whether of the everyday garden variety or action taken in connection with a disciplined
inquiry” (p.17). Research paradigms are differentiated by their answers to three main questions
of ontology, epistemology and methodology. The main paradigms described by Guba (1990) are
positivism, postpositivism, critical theory and constructivism. Saunders, Lewis and Thornhill
(2007) present yet another research philosophy: pragmatism.
This thesis subscribes to the pragmatist school of thought, which, according to Tashakkori and
Teddlie (1998), implies thinking of research philosophies as a continuum, rather than opposite
positions.
According to Saunders, Lewis and Thornhill (2007), there are two main types of research
approaches: deductive and inductive. The deductive approach aims at testing a hypothesis
developed on theory, while the inductive approach aims at developing theory based on data.
According to the same authors, deductive approach often requires a highly structured theory in
order to test the hypothesis and results. The inductive approach is rather bottom-up, as theory is
based on the information gathered from the field. Exploratory research is often inductive by
definition, which is also the case of the research presented in this thesis.
Research Design 3.3.
According to Saunders, Lewis and Thornhill (2007), there are three main approaches to research
– quantitative, qualitative and mixed-methods.

58
In consonance with Leedy and Ormrod (2001), quantitative researchers seek explanations and
predictions that can be generalized in order to establish relationships and develop theory.
Quantitative methodology can be classified into descriptive, experimental and causal
comparative. Similarly, analysis methods used in quantitative research can be categorized to
correlational, development design or observational ones.
As advanced by Sale, Lohfeld and Brazil (2002), quantitative research aims at reducing
phenomena into empirical indicators to represent the truth. It is based on the positivist paradigm.
Qualitative research, according to Leedy & Ormrod (2001), often aims at building new theories.
According to the same authors, it is often based on a poststructuralist paradigm and seeks to
understand the complexity of a phenomenon. As explained by Williams (2007), qualitative
studies are often rather inductive than deductive, and there is a clear relationship between the
observer and the data. Along the same lines, Sale, Lohfeld and Brazil (2002), describe
qualitative methods as being constructivist, as they are based on the vision of a socially
constructed reality that exists only during the time of research. Robson (2002) defines qualitative
data as relating to ambiguous concepts that are characterized by their richness and fullness,
arising from the ability to study a phenomenon from different points of view.
As explained by Tashakkori and Teddlie (2003) – mixed method research refers to the
integration of qualitative and quantitative methods in data collection and analysis. According to
Williams (2007), mixed methods also allow to combine inductive and deductive research
methods in the research. According to Saunders, Lewis and Thornhill (2007), mixed methods
refer to research designs that combine quantitative and qualitative data gathering and analysis
techniques, as opposed to multi-method studies that combine both techniques but are restricted to
either a qualitative or quantitative worldview. Furthermore, mixed method research refers to a
combination of quantitative and qualitative data that are analyzed separately, as opposite to
mixed model research, which allows for quantitative data to be analyzed using qualitative
methods, and vice versa.
Mixed methods are not without their critics. Indeed, according to Sale, Lohfeld and Brazil
(2002), mixing qualitative and quantitative research methods cannot yield valid results, as both
methods are ontologically and epistemologically different. According to them, qualitative data

59
cannot complement quantitative data, as they do not measure the same phenomena, and one
cannot be a constructivist and positivist at the same time. Nevertheless, the same authors accept
the usage of mixed-method designs to give answer to different phenomena forming part of a
research question.
According to Saunders, Lewis and Thornill (2007), mixed methods do not lead to philosophical
mismatches when the paradigm adopted by the reader is pragmatism, as is the case in this thesis.
According to Tashakkori and Teddlie (2003), multiple methods are appropriate when they
provide better opportunities to answer research questions and evaluate the reliability of findings,
while improving the ability to draw conclusions from them.
Subscribing to a pragmatic worldview and requiring both empirical and detailed data to answer
the research questions, this thesis adopts a mixed-method research design. For the first research
question, the usefulness of correspondents to credit unions will be assessed both from a financial
(quantitative) and managerial (qualitative) point of view. Similarly, in order to answer the second
research question, the potential improvement of financial inclusion ensuing from the spread of
CU BCs will be observed on the macro level with quantitative analysis, as well as on the “grass-
roots” level through qualitative analysis.
Quantitative Method – Analysis of Banking Correspondent Registration Data 3.4.
The main source of quantitative data for this thesis is a banking correspondent registration
database maintained by the Central Bank of Brazil, made accessible by the Center for Studies in
Microfinance of the FGV (CEMF).
Archival research, according to Saunders, Lewis and Thornill (2007) refers to using archives or
databases as a source of data. The difference between secondary data analysis and archival
research is that the archives being studied were originally not intended for research purposes but
rather for documentation of a company or organization, for example. This is the case in this
thesis, as the correspondent registry database is originally compiled for internal information
purposes of the BCB, rather than for a research.

60
This database will be analyzed both separately as well as in combination with secondary data
compiled from various sources. Generally, according to Saunders, Lewis and Thornill (2007),
using secondary data can be the best way to get access to good quality data when time is
restricted. Furthermore, it allows access to longitudinal data, which would not be possible
otherwise in a temporally constrained research. However, secondary data may have been
compiled for other types of research, being thus potentially maladjusted for any other purpose.
The aspirations of the original author of the data having been different, the data may have been
aggregated in ways that are unfit for the purposes of the secondary researcher. Furthermore, the
quality of secondary data may be difficult to assess. Some of these challenges have manifested
themselves in this study, and are detailed in the following subsections.
3.4.1. Analysis of Quantitative Data
Tukey (1977) defines the concept of Exploratory Data Analysis, which aims at visualizing data
using various methods, such as histograms, scatter graphs, conjunctions or mean values. The
purpose of such an analysis is to observe the general characteristics of a data set, in order to get
an overview of the phenomenon studied, as well as to plan potential next steps for a research.
This method has become widely adopted for illustrating data of various sorts. Such an
exploratory data analysis is the starting point of this research, in order to improve understanding
of the characteristics of the data.
The first part of this analysis aims at improving general understanding of credit union
correspondents, through metrics such as growth, geographic reach and scope of services. As
illustrated by the literature review, there are several different types of credit union in operation in
Brazil, and some credit unions unite through networks. Studying the evolution of credit union
correspondents by region, affiliation and type of credit union provides a good general picture of
the topic before engaging in further analysis. Furthermore, this gives interesting information
about the scope and geographic reach of credit union correspondents, which helps in the
delimitation of subsequent parts of the research
The second part of the quantitative analysis aspires to establish links between the financials of
credit unions and the usage of correspondents, in an effort to answer the first research question of
this thesis, related to the usefulness of banking correspondents for credit unions. De Carvalho et

61
al. (2011) present some financial ratios that are important for credit union survival, namely size,
investments in credit operations, treasury investments, funding by demand deposits and banking
margin. These and other financial indicators are calculated for all CUs and compared to the
usage of banking correspondents by credit unions. The ratios used and their computation, as well
as their initial effect on credit union survival according to De Carvalho et al. (2011) are detailed
in Appendix 16. Some of the ratios do not reflect credit union survival according to De Carvalho
et al. (2011), but they are included in the analysis as generally accepted indicators of efficiency
and profitability.
This analysis is judged to be pertinent in the sense that it allows to observe the relation between
BC usage and CU financials. If it is useful for credit unions to use correspondents, there may be
an impact on their financials. The relationships are searched for with the aid of correlations.
According to Saunders, Lewis and Thornill (2007), the Pearson Product Moment Correlation, or
simply the Pearson correlation, is best suited for assessing the strength of relationship between
two numeric variables, be they discrete or continuous. Despite not being able to establish
causality, the performed research illustrates interesting relationships between the characteristics
of CUs observed.
The third part of the quantitative analysis observes credit union correspondents at the municipal
level, comparing their number to the general level of financial inclusion of the municipality. The
financial inclusion level of municipalities is assessed by implementing the IFI method presented
by Sarma (2012) and adapted by the BCB (2011a). The formula for this indicator is exhibited in
Appendix 1, and the variables and weights used for its computation are detailed in section 4.4.5.
Analysis of the data is done using conjunctions and histograms, in order to examine the
distribution of credit union correspondents in municipalities with different levels of financial
inclusion, to find out in which type of municipality credit union correspondents tend to be
located. If a credit union correspondent is located in a municipality with a low score on the IFI,
its usefulness for financial inclusion may be larger, as the marginal improvement in access points
following the opening of a CU BC is more important in municipalities with lower densities of
POAs. Conjunctions of the data are also computed for other attributes of the municipalities,
62
namely HDI and share of urban population, as a part of exploratory research seeking to find
relationships between variables.
This method is used both for looking at the absolute number of credit unions correspondents by
municipality, as well as their share of all local BCs with different services, particularly bill
payment and credit proposal (Inc. III and V). This gives an indication of the importance of credit
union correspondents in providing access to different financial services in different
municipalities, and thus improves our understanding of the relation between credit unions BCs
and financial inclusion. For each category of the IFI, the number of municipalities with
significant share of CU BCs out of total is calculated, both for service III and V. This is done in
order to examine the importance of CU BCs at the local level for different services. The share of
CU BCs out of all BCs with a service was deemed “significant” when it exceeded 25% of all
BCs with this service. This number is already large, taking into account that CU BCs represented
less than 2% of all BCs in Brazil in 2014.
It must be stressed that the quantitative analysis of this thesis, due to data limitations, is unable to
provide a numeric assessment of the improvement of financial inclusion attributable to credit
union correspondents. The nature of the topic makes such a measurement complicated and
subject to error. However, the performed analysis is able give indications about the role of credit
union correspondents in the improvement of different dimensions of financial inclusion.
3.4.2. Sources of Data
The main source of data for the quantitative part of the thesis is the database mentioned above,
provided by the BCB (2015g) through the CEMF, that contains data about registered banking
correspondents in Brazil as of December 2014.
Other sources of secondary data used in the thesis are the Brazilian Institute for Geography and
Statistics (IBGE), other databases of the Central Bank of Brazil, as well as Atlas do
Desenvolvimento Humano (ADH), an online database of development indicators.
The IBGE censuses of 2000 and 2010, as well as the population count of 2007 and estimates of
2013 are used for extracting the following municipal-level data: population, share of adult

63
population and share of urban population. The IBGE database is also used to extract the area of
Brazilian municipalities.
The Central Bank is a valuable source of information concerning the financial sector of Brazil.
Trial balances of financial institutions (BCB, 2015b) are used to gather financial data of credit
unions for calculating financial ratios. The “Report of branches and points of access” of the BCB
(2015f) is used for compiling data of access points at municipal level (PAB, PAA and PAE, as
described in Appendix 2). Furthermore, the Central Bank of Brazil provided a file with non-bank
points of access by municipality in 2010 and 2014 (Banco Central do Brasil, 2015d), which is
used to extract information on PAC location. The database of banking institutions (2015g)
provides data concerning active credit unions in Brazil. The banking sector statistics by
municipality of the BCB (2015e) are used to extract data about deposits and credit by
municipality. Finally, ADH is used to extract data for municipal HDI (2013).
It has to be noted that the analyses conducted at the municipal level consider only 5,565 out of
all 5,570 Brazilian municipalities. The following four municipalities are excluded from analysis,
for they were founded in the middle of the period of analysis (2012 or 2014), and would disrupt
results at municipal level: Paraíso das Águas (MS), Mojuí dos Campos (PA), Pescaria Brava
(SC) and Pinto Bandeira (RS). In addition, Balneário Rincão (SC), founded in 2003, is excluded
from analysis due to incomplete demographic data for the period.
3.4.3. Data Validity
The BC registration database is compiled and maintained by the Central Bank of Brazil, which
can be considered a reliable source. Nevertheless, financial institutions input the data to the base,
and despite being required to keep it updated by law, they may take a long time to do it. This has
resulted in some inconsistencies, and the database is not entirely up to date. Despite measures
taken to clean the data, this inherent limitation of the database is difficult to remediate, and
results must thus be taken with some level of caution.
When it comes to other data from the BCB, while the source is generally trustworthy, similar
levels of precaution are needed. However, the table about points of access by municipality,
provided by the Central Bank of Brazil (2015d), contains a level of data aggregation that is
impractical for the purposes of this thesis, and illustrates one of the classic drawbacks of

64
secondary data, portrayed by Saunders, Lewis and Thornill (2007). Fortunately this problem is
overcome with the aid of data from other bases of the BCB.
The IBGE carries out national censuses, and despite potential occasional measurement error, can
be seen to detain the most reliable data about demographics in Brazil. When it comes to the
municipal HDI data provided by Atlas Brasil, it is compiled by the UNDP, which is a rather
trustworthy source. The calculation method of the HDI in general can be subject to criticism, but
it can be assumed to provide a means to compare and classify municipalities based on generally
agreed upon proxies of development.
According to Saunders, Lewis and Thornill (2007), when using quantitative methods for
measuring relationship and significance, so called type 1 and type 2 errors may arise. A type 1
error refers to rejecting a null hypothesis (or claiming relatedness of data) incorrectly, whereas
type 2 error refers to not rejecting the null hypothesis when the variables are in fact related. In
order to avoid these errors, the statistical significance level needs to be appropriately set.
According to the same authors, testing for significance is done in order to assess the
representativeness of a sample compared to the total population. In this thesis, correlations are
measured between credit union financials and usage of correspondents, using all active credit
unions. As this is not a sample but the whole population, one might suggest that testing for
significance is not required. Nevertheless, the current population of credit unions in Brazil could
be seen as a mere sample of the whole population in, say, 10 years, and in order to allow for the
generalizability of results, significance levels should be calculated. Significance tests are done
mostly at the 0.01-level, and occasionally at the 0.05-level.
3.4.4. Processing the BC Database
The database of banking correspondents (BCB, 2015g) is composed of around 850,000 lines.
Each line of the database refers to one “service” permitted for a credit correspondent. Therefore a
correspondent allowed to offer several financial services is present on several lines of the
database. For each service of the database, the following information is provided: identification
number (CNPJ) of the responsible institution, type of institution (Commercial Bank, MFI, Credit
Union etc. ), identification number (CNPJ) of the correspondent and the installation, as well as

65
respective addresses, the service provided (list in Appendix 3) as well as the opening and
potential closing date of the service.
For each line of the database, there is a “correspondent” institution and an “installation”
institution. The “correspondent” is the natural person to which the service is granted by the
financial institution, while the “installation” is the location where this service is in use. If these
entries are different, it means that the correspondent sublet the service to another institution. This
can imply the usage of a network integrator, a concept explained in the literature review. The
installation is the subject of study, as it refers to the physical place where the service is provided.
In some cases, the correspondent-case is the only available information, as the installation part
has been left blank. This concerns around 12.2% of the lines of the database. In cases where only
the correspondent information is provided, that one is used for the analysis. Another problematic
feature of the database was the high occurrence of services opened on April 4th
2011, equally
representing around 12% of the lines in the database. These lines were mostly the same as the
ones without the “installation” information. It is possible that this data represents correspondents
that had been opened for longer, but that had remained unregistered until 2011. This may be
related to the BCB decision 3.954 of February 2011 (BCB, 2011b). This is also the impression
gotten from the credit union interviewed in the framework of this thesis. Be it as it may, it
certainly presents a challenge for the comparability of longitudinal data for the period prior to
2011.
In many cases, a correspondent identified by a CNPJ can be found in different locations, making
this information insufficient to provide information about individual correspondents. An
individual correspondent is therefore denoted by a combination of the identification number of
the correspondent (CNPJ) and the municipality code (IBGE-identifier). This allows identifying
individual correspondents in the database, as many correspondents have several services
assigned to them, and in many cases act as correspondents for several financial institutions.
After clearing the data of these inconsistencies, the opening (and potential closing) year is
searched for each correspondent for different services. This way, information is extracted about
the correspondents operated by different institutions in different years, as well as about the
number of banking correspondents with different services in each municipality of Brazil for each

66
year. The data resulting as an outcome of this process is used as the main source for the
quantitative analysis of credit union correspondents.
It has to be noted that the amount of correspondents is always showed at year-end, except for the
year 2014, where the situation is reflected as of December 16th
, as the database is dated at that
moment.
3.4.5. Municipal Index for Financial Inclusion
The municipal index of financial inclusion is computed based on the formula of the Index of
Financial Inclusion presented by Sarma (2012), as well as its adaptation by the Central Bank of
Brazil (2011a). Financial inclusion is observed on two dimensions – access and usage. Both
dimensions have a total weight of 0.5 out of total in the model. The index is computed from 2010
to 2014. As already noted by Sarma (2012), a key challenge of the IFI is the recurrent lack of
accurate data. This is also a challenge faced by the research of this thesis, and this chapter aims
at detailing the process through which missing data is approximated.
Table 1: Weighting used for calculating the municipal Index of Financial Inclusion (As defined by the author)
The access dimension is assessed through access points of financial services by municipality,
both in terms of demographic density (per 10,000 adults), as well as geographic density (per
1,000 km2), in order to make municipalities comparable between each other. In the weighting of
these access points, bank branches are given the highest weight, and other points of access and
correspondents lower weights, due to their lower scope of services and potentially lower
attractiveness to customers, as suggested by Sanford and Cojocaru (2013). Therefore, advanced
points of access (PAA) and banking points of access (PAB) are given a lower weight than bank
Weight
Operational bank branches and CU seats at year end / 1 000 km2 0,08
Operational bank branches and CU seats at year end / 10 000 adults 0,08
Operational PAB and PAA at year end / 1 000km2 0,07
Operational PAB and PAA at year end / 10 000 adults 0,07
Operational PAE at year end / 1 000km20,05
Operational PAE at year end / 10 000 adults 0,05
Banking correspondents (all actors) / 1 000 km2 0,05
Banking correspondents (all actors) / 10 000 adults 0,05
Bank credit to private sector by municipality (fixed) / 10 000 adults 0,25
Bank deposits from private sector by municipality (fixed) / 10 000 adults 0,25
1,00
Category of financial inclusion
Use
Total
Acc
ess

67
branches, while correspondents and electronic service points (PAE) are given the lowest weight.
It is important to note that all access points include both bank and non-bank actors, meaning that
credit union seats receive the same weight as bank branches. This is judged appropriate due to
the wide range of basic financial services available at credit unions. Credit union branches that
are not seats are given the same weight as PABs and PAAs. The weights used to compute the
IFI are illustrated in Table 1. It is important to note that these weights are defined by the author
of this thesis, as explained above, and hence are likely to be different from the ones used by the
BCB, which had not been made public as of December 2015.
For the usage dimensions, data on bank deposits from the private sector as well as bank credit to
the private sector by municipality is used. Unfortunately, data about credit unions’ or MFIs’
deposits and credit by municipality is not accessible for the calculation of this index. However,
credit from banks represented around 95% of total credit in Brazil in 2014 (BCB, 2015a), which
already allows for a relevant comparison of the usage of financial services between
municipalities. However, a major challenge for the computation of the index is the fact that
credit and deposits are only shown for municipalities where a bank branch is active, as if all bank
deposits and credit were distributed solely through branch offices. As theory has made clear,
banks use correspondents and other points of access (PAB and PAEs, for example) for attracting
deposits and distributing credit. Therefore, one may assume that citizens of branchless
municipalities with bank service points also have deposits and credit. This calls for a reallocation
of deposit and credit data based on the availability of POAs in different municipalities. Leaving
over 1,000 municipalities without deposits and credit, despite wide availability of access points,
would automatically push them to the lowest category of financial inclusion, as the weight for
usage is 0.5 in the model.
This rearrangement can at best yield approximate results, and its arbitrariness is well
acknowledged. Nevertheless, the method used aims at reflecting the amount of different types of
points of access to financial services in the municipality, as well as the general amount of
deposits and credit in the region. Lacking more accurate information, such a rearrangement is
seen fit for an index whose main purpose is to compare Brazilian municipalities in terms of

68
financial inclusion. The methodology of this rearrangement is explained in detail in Appendix
17.
When it comes to the population by municipality and the share of adult population, the only
available data is for the years 2010 and 2014. This makes it necessary to approximate values for
years from 2011 to 2013, in order to compute the demographic density of access points to
financial services. Lacking more accurate methods, values for the years from 2011 to 2013 are
estimated using the compound annual growth rate (CAGR) of the indicator between 2010 and
2014. This is naturally only an approximation of the real value, but it does not drastically
influence the score of municipalities in relation to each other, and hence can be seen as a fair
assumption for this case. The same method was used for approximating the value of non-bank
points of access by municipality from 2011 to 2013 (only 2010 and 2014 available).
Another decision regarding the computation of the IFI concerns the maximum and minimum
limits of variables. The lower limit for each dimension of the index is set to be zero, as was done
by Sarma (2012) in his model. Lacking the definition of a universal maximum value for any of
the indicators, the upper limit for each dimension is set to be the value under which 90% of all
Brazilian municipalities lie. This is justified as the purpose of the index is to classify Brazilian
municipalities with respect to each other, and not to a theoretical maximum level of financial
inclusion. This results in a relatively balanced distribution of municipalities over the IFI index
from 0.0 to 1.0, useful for observing patterns in the location of credit union correspondents.
As one may already infer, the use of this model entails some limitations. Firstly, the selection of
weights for the model, despite being based on the theoretical framework of financial inclusion, is
ultimately an arbitrary decision. Secondly, the rearrangement of deposit and credit information in
municipalities, as explained above and in Appendix 17, makes longitudinal comparisons over the
IFI difficult. As the allocation of deposits and credit in a municipality is dependent on the
number of access points, a change in the number of access points over one year also changes the
level of deposit and credits in the municipality, leading to a multiplied effect on the IFI. The IFI
of this thesis is a valuable tool for comparing municipalities where credit union correspondents
are located, but it is best fit for cross-sectional analyses, rather than longitudinal ones.

69
Qualitative Method – Case Study of Sicredi in Panambi 3.5.
As previously explained, the academic literature lacks research about the use of correspondents
by credit unions. Therefore, even though data of the Central Bank of Brazil allows for
quantitatively assessing the evolution of this phenomenon, it does not give information on the
motivations and aspirations of credit unions in this process. A qualitative method allows
shedding light on credit union usage of BCs and gives valuable insight for answering both
research questions. Understanding the reasons behind the adoption of credit union
correspondents allows appreciating the dimensions in which credit unions perceive banking
correspondents as useful. Furthermore, this method can increase our understanding of the
contribution of credit union correspondents to financial inclusion on the “micro” level.
The selected method of analysis is a case study focusing on a Sicredi-affiliated credit union in a
small town of the Brazilian state of Rio Grande do Sul, Panambi. This area has the highest
concentration of credit union correspondents with credit proposal services (Inc. V), that are more
interesting than correspondents with bill payment only, with respect to financial inclusion. In the
framework of this case, numerous stakeholders of the credit union are interviewed.
A case study, according to Robson (2002), involves an empirical investigation of a particular
phenomenon within a real life context using various sources of evidence. Morris and Wood
(1991) see case studies as a particularly good method to gather a rich understanding of the
context of a research. According to Leedy and Ormrod (2001), case studies allow researchers to
learn more about a situation that is little understood. Such is the case of credit union
correspondents in this thesis, as without qualitative data, the motivations and aspirations of credit
unions in this process could only be speculated about.
The case study presented here is cross-sectional, as the interviews took place during a two-week
period in July 2015. Despite a potentially enrichening impact for the thesis, a longitudinal study
could not be adopted due to temporal and logistical constrains.
3.5.1. Plan of the Case Study
Two undergraduate students from the FGV, Leonardo Fujisima Yada and Melina Chen Padoin,
accompanied by their mentor, doctoral student Erico Przeybilovicz, travelled to Panambi to
perform the interviews. Interview questions were planned together with the thesis writer, and

70
audio recordings as well as interview notes were used for the qualitative analysis. The
interviewees included managers of the credit union, its correspondents as well as employees of
local banks, the city’s trade association and the city hall. Meetings were scheduled with the
interviewees, and the local Sicredi president appointed the correspondents to be interviewed. The
users present at time of interviewing the correspondent were also interviewed for the case study.
The initial schedule of interviews is exhibited in Appendix 18.
The interview questions, available in Appendix 19, were open-ended and semi-structured. It has
to be noted that part of the questions served the interviewers own ends, and were not used for the
research of this thesis, despite providing interesting additional information. The prepared
questions generally aimed at unraveling the motive of the credit union for using correspondents,
as well as revealing the plans for the network and the usefulness of BCs for the credit union.
Reasons behind a rapid increase in BC adoption in 2011 and 2012 were also inquired about.
Furthermore, the plan included questions concerning practical issues such as technological
infrastructure as well as union membership of correspondent clients.
According to Saunders, Lewis and Thornill (2007), a semi-structured interview consists of a list
of questions to be covered that might vary from interview to interview. Some questions can be
omitted in particular situations and additional questions can also be asked when required, in
order to increase knowledge. This is in contrast with structured interviews, which are used to
collect quantifiable data, and therefore involve much stricter rules for internal coherence of
questions, as well as a larger distance between the interviewee and interviewer.
As explained by Saunders, Lewis and Thornhill (2007), non-standardized interviews, such as
semi-structured ones, are useful for understanding reasons behind decisions, opinions and
attitudes. The lack of standard structure allows interviewers to adapt questions to the situation,
and interviewees to give more information about a particular topic that is seen as important.
An advantage of conducting interviews over doing surveys, according to Saunders, Lewis and
Thornhill (2007), is that participants may be more willing to give information, and the researcher
is often able to know why some question was left unanswered.

71
3.5.2. Data Analysis Method
According to Saunders, Lewis and Thornhill (2007), qualitative data should be analyzed through
conceptualization, by first understanding the characteristics or language, discovering regularities,
understanding the meaning of text and finally, reflecting on the content. This process starts
through the transcription of interviews.
King (2004) explains the concept of template analysis – based on the preparation of a list of
codes and categories that represent themes revealed in the interview transcripts. These codes
should be based on the existing theory, but can evolve as understanding about the topic
increases. According to Saunders, Lewis and Thornhill (2007), this analysis method is a mixture
of inductive and deductive analysis, due to its base in theory but relative flexibility. This method
is judged to be relevant for this analysis, as the qualitative research is exploratory in nature, but
there is an existing theoretical framework from which codes can be developed.
This analysis is somewhat similar to the one baptized directed content analysis by Hsiu-Fang and
Shannon (2007). Such an analysis is formed by open-ended questions that are directed towards
categories predetermined from the theory. The transcripts are coded with predetermined codes,
and new codes are created if needed. According to the authors, an advantage of this approach is
its ability to support or extend a theory, but it entails a bias of the researcher towards the wanted
results.
The initial codes used for the analysis of the interview transcripts are related to the development
of Panambi, the management of Sicredi, the registration and usage of BCs, technology, financial
inclusion and credit proposal, as well as opinions of stakeholders. The final coding is detailed in
Appendix 31.
3.5.3. Data Validity and Generalizability
A potential concern when using semi-structured interviews is the generalizability of the results.
Indeed, the inherent lack of standardization of semi-structured interviews might cause difficulties
with reliability, and it remains unclear whether other researchers would reach the same result
(Easterby-Smith, Thorpe and Lowe, 2002). However, according to Marshall and Rossman
(1999), the interviews performed do not necessarily need to be repeatable, as they only reflect

72
the reality of the actual situation. The value of the interviews is in the flexibility they offer, not in
their capacity of replication.
Nonetheless, there is a clear limitation on generalizability arising from this method, as it focuses
on only one credit union. However, the studied credit union represents Sicredi, a network under
which most CU BCs operate. Furthermore, with a large number of credit union correspondents
with credit proposal services, Panambi makes for a very interesting case to be studied in detail.
A potential data validity issue that can arise in the chosen method is the interviewer bias, as
explained by Saunders, Lewis and Thornhill (2007). The interviewer may influence the answers
of the interviewee through tones and non-verbal behaviors. Non-verbal behavior cannot be
perceived through audio recordings, which equally limits the validity of this method.
Furthermore, recording the interview in itself can cause respondents to answer questions
differently than they would without the recording.
On the same note, it can be added that the managers of the credit union have incentives for
embellishing their image by masking the real motivations for decisions taken. There is
unfortunately no way to control for this in the transcripts. Another practical limitation of this
case study is the fact that part of the interview records went missing or were of poor quality, and
the research has to rely on notes of the interviewers for some interviews. However, this was
luckily not the case for interviews with the credit union management, which are the most
relevant ones for this research.
4. Results
General Data about Credit Union Correspondents 4.1.
4.1.1. Credit Union Correspondents – Growth, Exclusiveness and Type of Service
Credit unions have used correspondents for over ten years, but the phenomenon started gaining
momentum in the year 2008, which is illustrated by a tenfold growth in the number of
correspondents registered in the BCB database (2015g). Interestingly, according to the database,

73
there were already 12 credit union correspondents operational prior to 2003, even though this
practice was not officially permitted before the BCB decision 3.156 of 2003 (BCB, 2003b).
The year 2011 presents another year of high growth in correspondents, but as already mentioned,
this increase may be due to pressure from the BCB on financial institutions to register
unregistered correspondents, as was revealed during interviews in Panambi (explained in the
following section). In the worst case, the same could apply to the year 2008. This uncertainty
sets a limitation on the reliability of longitudinal analysis of correspondent data, particularly
prior to the year 2011. This is also reflected in the high CAGR of operational CU BCs from 2008
to 2011 compared to the period from 2011 to 2014 (see Table 2). Due to this limitation, analyses
conducted in further sections of this thesis mostly consider the period from 2011 onwards. Most
of the further tables present growth between 2011 and 2014, due to the uncertainty of CU BC
registration data before year-end 2011.
As the number of registered correspondents started to grow in 2008, so did the number of closed
correspondents, which slowed down the growth in operational correspondents. Much alike the
overall trend in banking correspondents growth in Brazil, the year 2014 saw a weaker growth in
CU BC than in the previous years. This may imply a saturation of growth, or may be due to
changes in BC registration by the Central Bank, as was generally the case in 2014 (BCB, 2015a).
Table 2: Registration of credit union correspondents, 2003 - 2014 (Based on BCB, 2015g)
Interestingly, a large share of CU BCs is not exclusive to credit unions, but also distributes
services for commercial banks, as can be seen from Table 2 and Figure 2. This is an important
detail, for if credit unions use a correspondent that already acts as a BC for a commercial bank, it
cannot be seen as an increase in financial access. Nonetheless, in some cases, a BC may
distribute different services for banks and credit unions. In Table 2, the exclusiveness of BCs is
considered in general, while in the analyses of section 4.4, for example, exclusiveness is
considered for individual services. In general, as illustrated in Table 2, the exclusiveness of CU
Year <2003 2003 2004 2005 2006 2007 2008 2009 2010 2011 2012 2013 2014 CAGR 2008-11 CAGR 2011-14
Opened CU BC 12 5 0 3 13 71 882 699 532 1 493 490 554 308 19,2 % -40,9 %
Closed CU BC 0 0 0 0 0 2 9 59 84 137 145 364 206 147,8 % 14,6 %
Operational CU BC 12 17 17 20 33 102 975 1 615 2 063 3 419 3 764 3 954 4 056 51,9 % 5,9 %
Only Exclusive 12 17 17 20 28 94 805 1 260 1 620 2 656 2 817 2 901 3 054 48,9 % 4,8 %
Share of exlusive CU BC 100 % 100 % 100 % 100 % 85 % 92 % 83 % 78 % 79 % 78 % 75 % 73 % 75 % -2,0 % -1,0 %
Registration of CU BCs 2003-2014

74
BCs has decreased along with the overall growth in credit union correspondents, dropping from
92% in 2007 to 75% in 2014. In the analysis of increase in access to financial services of later
sections, only exclusive correspondents will be considered for each service.
Figure 2: Registration of credit union correspondents, 2003 - 2014 (Based on BCB, 2015g)
Out of 4,056 active credit union correspondents in 2014, only 3,054 were exclusive to credit
unions. While credit unions had only a modest share of 1.6% of all correspondents in Brazil, as
illustrated in Table 3, the growth of CU BCs was larger than that of the sector in general. From
2011 to 2014, the number of BCs in general increased by an annual average of 0.5%, while CU
BCs increased by 4.8%. Therefore, while CU BCs remained a limited phenomenon in 2014, their
share of all BCs was growing rather steadily, at a CAGR of 4.3% over the period.
Table 3: Credit union correspondents versus all banking correspondents, 2003 - 2014 (Based on BCB, 2015g)
An interesting observation that deserves mention in this part of the thesis is related to the
growing popularity of electronic access points (or PAEs) among credit unions, as visible in Table
4 and Figure 3. In 2010, credit unions started to use PAEs alongside BCs, which often offer
similar services as correspondents – according to the Central Bank of Brazil (2015a), several
commercial banks have substituted parts of their correspondents by PAEs.
Table 4: Operational credit union correspondents and PAEs, 2008-2014 (Based on BCB, 2015f and 2015g)
Number of BCs <2003 2003 2004 2005 2006 2007 2008 2009 2010 2011 2012 2013 2014 CAGR 2011-14
Total BCs 33 365 43 859 60 511 74 240 89 690 109 204 117 519 136 151 145 366 192 960 212 168 219 718 195 664 0,5 %
Exclusive CU BCs 12 17 17 20 28 94 805 1 260 1 620 2 656 2 817 2 901 3 054 4,8 %
CU BC Share 0,0 % 0,0 % 0,0 % 0,0 % 0,0 % 0,1 % 0,7 % 0,9 % 1,1 % 1,4 % 1,3 % 1,3 % 1,6 % 4,3 %
Share of Credit Union Correspondents out of all BCs in Brazil, all services, 2003-2014
Year 2008 2009 2010 2011 2012 2013 2014 CAGR 2011-14
Operational CU BCs 975 1615 2063 3419 3764 3954 4056 5,9 %
Exclusive Operational CU BCs 805 1 260 1 620 2 656 2 817 2 901 3 054 4,8 %
Operational CU PAEs 0 0 12 212 330 523 684 47,8 %
Registration of CU BCs vs. PAEs 2008 - 2014

75
While there were almost five times more (exclusive) CU BCs than PAEs in 2014, the growth rate
of electronic access points was staggering - with a CAGR of 47.8% over the period compared to
5.9% for BCs, PAEs could be expected to exceed the number of CU BCs by 2020.
Figure 3: Operational credit union correspondents and PAEs, 2003-2014 (Based on BCB, 2015f and 2015g)
When looking at the service portfolio of credit union correspondents, the predominance of
payment services (Inc. III) is explicit – out of 4,056 correspondents in 2014, 3,938 were
accredited with this service (97% of total). The second most common service was credit
proposals (Inc. V), with 93 correspondents (2% of total). Other services are distributed by a
small number of BCs, and their numbers have not increased in the past years, as is exhibited in
Table 5. The total sum of services exceeds the total number of correspondents, as some
correspondents have more than one service. However, this remains a marginal phenomenon, as
only nine correspondents had more than one service in 2014, out of which two had both services
III and V (See Appendix 21). Despite the low share of CU BCs with Inc. V out of total, their
growth rate between 2011 and 2014 was much larger than that of other services, as exhibited in
Table 5. It is important to note that the fact that a correspondent is registered to deliver a certain
service does not necessarily mean that it is doing it. However, this thesis focuses only on
registered services, due to the lack of means for assessing the actual services offered by CU BCs.
Table 5: Credit union correspondents by type of service, 2003-2014 (Based on BCB, 2015g)
Type of Service <2003 2003 2004 2005 2006 2007 2008 2009 2010 2011 2012 2013 2014 CAGR 11-14
Service I - Opening accounts 0 0 0 0 0 0 0 0 1 1 0 0 0 -100,0 %Service II - Transfers, remittances 0 0 0 0 0 0 1 1 2 11 12 11 11 0,0 %Service III - Payments 12 17 17 20 33 101 973 1 612 2 058 3 386 3 685 3 844 3 938 5,2 %Service IV - Remittances 0 0 0 0 0 0 0 0 0 7 7 7 7 0,0 %Service V - Credit Proposals 0 0 0 0 0 0 0 0 0 6 53 86 93 149,3 %Service VII - Collection 0 0 0 0 0 0 0 1 1 11 11 11 11 0,0 %Service VIII - Credit cards 0 0 0 0 0 1 1 1 1 4 4 4 4 0,0 %Service IX - Other control services 0 0 0 0 0 0 0 0 0 3 3 3 3 0,0 %
Total 12 17 17 20 33 102 975 1 615 2 063 3 429 3 775 3 966 4 067 5,9 %
Operational CU BCs by type of service, 2003 - 2014

76
While CU BCs represented only 1.6% of all BCs in 2014, the share of CU BCs out of all BCs
with payment services was much larger, as illustrated in Table 6 below. CU BCs with Inc. III
represented 6.7% of all BCs with this service. Furthermore, the growth of CU BCs with Inc. III
from 2011 to 2014 was much larger than the average growth of BCs with this service.
Table 6: Banking Correspondents with service III, 2003-2014 (Based on BCB 2015g)
When observing the exclusiveness of banking correspondents between the two most prevalent
services, payments and credit proposals, the difference is striking. In 2014, 87% of CU BCs with
service III were exclusive, but only 24% of CU BCs with service V. This means there were only
22 exclusive credit union correspondents with credit proposals in 2015. As mentioned above, a
correspondent may be multi-bank, but not have the same services for all different actors. This
explains the fact that 87% of CU BCs with payment services were exclusive in 2014, while
overall only 75% of CU BCs were exclusive the same year. As illustrated in Table 7, CUs
“contributed” to the availability of BCs with payment service by 3,445 correspondents in 2014.
Table 7: Exclusiveness of CU BCs with payment and credit proposal services, 2003 – 2014 (Based on BCB, 2015g)
4.1.2. Banking Correspondents by Credit Union
Appendix 20 exhibits the distribution of correspondents between credit unions. In 2014, 200
credit unions used correspondents (17.5% of all active CUs), and the average number of
correspondents by credit union was 21, with a rather high standard deviation of 28. Indeed, some
credit unions had large amounts of correspondents, while several had only a few, as illustrated in
Figure 4 below. In 2014, only 42 credit unions had over 30 correspondents, while the majority
of credit unions (158) had up to 30 BCs. Six credit unions had over a hundred correspondents in
2014.
<2003 2003 2004 2005 2006 2007 2008 2009 2010 2011 2012 2013 2014 CAGR 2011-14
Exclusive CU BC with Inc. III 12 17 17 20 33 101 896 1 453 1 803 2 919 3 136 3 296 3 445 5,7 %
All BCs with Inc. III 128 1 114 3 354 5 547 8 918 16 750 25 721 30 703 40 503 50 939 56 281 57 048 51 141 0,1 %
CU Share of total 9,4 % 1,5 % 0,5 % 0,4 % 0,4 % 0,6 % 3,5 % 4,7 % 4,5 % 5,7 % 5,6 % 5,8 % 6,7 % 5,5 %
Credit Union share of BCs with service III in Brazil, 2003-2014
Type of Service <2003 2003 2004 2005 2006 2007 2008 2009 2010 2011 2012 2013 2014 CAGR 2011-14
Inc. III All CU BC 12 17 17 20 33 101 973 1 612 2 058 3 386 3 685 3 844 3 938 5,2 %
Inc. III Only exclusive 12 17 17 20 33 101 896 1 453 1 803 2 919 3 136 3 296 3 445 5,7 %
Share of exclusive 100 % 100 % 100 % 100 % 100 % 100 % 92 % 90 % 88 % 86 % 85 % 86 % 87 % 0,5 %
Inc. V All CU BC 0 0 0 0 0 0 0 0 0 6 53 86 93 149,3 %
Inc. V Only exclusive 0 0 0 0 0 0 0 0 0 3 19 21 22 94,3 %
Share of exclusive 0 % 0 % 0 % 0 % 0 % 0 % 0 % 0 % 0 % 50 % 36 % 24 % 24 % -22,1 %
CU BCs with bill payment and credit proposal services 2003 - 2014
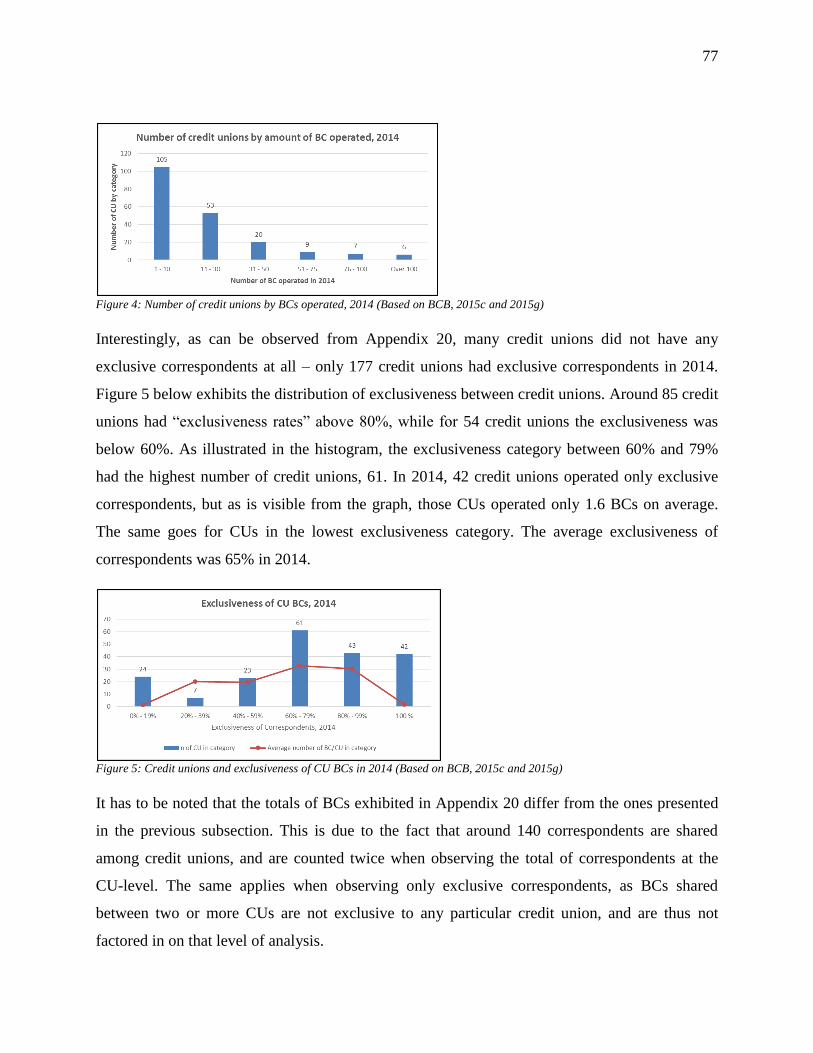
77
Figure 4: Number of credit unions by BCs operated, 2014 (Based on BCB, 2015c and 2015g)
Interestingly, as can be observed from Appendix 20, many credit unions did not have any
exclusive correspondents at all – only 177 credit unions had exclusive correspondents in 2014.
Figure 5 below exhibits the distribution of exclusiveness between credit unions. Around 85 credit
unions had “exclusiveness rates” above 80%, while for 54 credit unions the exclusiveness was
below 60%. As illustrated in the histogram, the exclusiveness category between 60% and 79%
had the highest number of credit unions, 61. In 2014, 42 credit unions operated only exclusive
correspondents, but as is visible from the graph, those CUs operated only 1.6 BCs on average.
The same goes for CUs in the lowest exclusiveness category. The average exclusiveness of
correspondents was 65% in 2014.
Figure 5: Credit unions and exclusiveness of CU BCs in 2014 (Based on BCB, 2015c and 2015g)
It has to be noted that the totals of BCs exhibited in Appendix 20 differ from the ones presented
in the previous subsection. This is due to the fact that around 140 correspondents are shared
among credit unions, and are counted twice when observing the total of correspondents at the
CU-level. The same applies when observing only exclusive correspondents, as BCs shared
between two or more CUs are not exclusive to any particular credit union, and are thus not
factored in on that level of analysis.

78
4.1.3. Geographical Distribution of Credit Union Correspondents
Basic descriptive statistics of credit union correspondents, available in Appendix 20, reveal a
high disparity of CU BCs among Brazilian municipalities. Indeed, the maximum amount of CU
BCs (of any type) in any municipality was 34 in 2014, while most municipalities did not host any
CU correspondents. The average number of CU BC by municipality was 3.3 in the same year,
with a standard deviation of 4.1.
Table 8: Proliferation of credit union correspondents in Brazilian municipalities, 2003 - 2014 (Based on BCB, 2015g)
Looking at the proliferation of credit union correspondents in municipalities, one may notice that
already 1,025 municipalities had exlusive CU BCs in 2014 (all services), representing 18.4% of
all municipalities in Brazil. This trend is depicted in Figure 6. When looking at payment services
only, there were already 1,083 municipalities covered with exclusive CU BCs with this service in
2014, which represents 19.5% of all municipalities. As it has become clear, credit union
correspondents with credit proposals are not widely spread, as exclusive BCs with this service
could be found in only 15 Brazilian municipalities in 2014, as can be seen from Table 8.
Figure 6: Number of municipalities with credit union correspondents, 2003- 2014 (Based on BCB, 2015g)
Not surprisingly, municipalities with credit union correspondents are not evenly distributed
within Brazil, as is visible from Appendices 22 and 23, as well as the following figures. The
dissemination of CU BCs among Brazilian regions seems to reflect the disparities in
Type of Service <2003 2003 2004 2005 2006 2007 2008 2009 2010 2011 2012 2013 2014 CAGR 2011-14
Municipalities with CU BCs with any service 7 10 10 12 25 72 522 704 788 1074 1100 1129 1145 2,2 %
Municipalities with exlusive CU BCs with any service 7 10 10 12 20 66 475 642 731 971 981 1009 1025 1,8 %
% of Brazilian municipalities with exclusive CU BCs 0,1 % 0,2 % 0,2 % 0,2 % 0,4 % 1,2 % 8,5 % 11,5 % 13,1 % 17,4 % 17,6 % 18,1 % 18,4 % 1,8 %
Municipalities with CU BCs with Inc III 7 10 10 12 25 71 521 702 786 1069 1096 1126 1140 2,2 %
Municipalities with exlusive CU BCs with Inc III 7 10 10 12 25 71 503 675 753 1010 1027 1066 1083 2,4 %
% of Brazilian municipalities with exclusive CU BCs w/ Inc III 0,1 % 0,2 % 0,2 % 0,2 % 0,4 % 1,3 % 9,0 % 12,1 % 13,5 % 18,1 % 18,5 % 19,2 % 19,5 % 2,4 %
Municipalities with CU BCs with Inc V 0 0 0 0 0 0 0 0 6 13 22 23 56,5 %
Municipalities with exlusive CU BCs with Inc V 0 0 0 0 0 0 0 0 0 3 9 14 15 71,0 %
% of Brazilian municipalities with exclusive CU BCs w/ Inc V 0,0 % 0,0 % 0,0 % 0,0 % 0,0 % 0,0 % 0,0 % 0,0 % 0,0 % 0,1 % 0,2 % 0,3 % 0,3 % 71,0 %
Number of municipalities with credit union correspondents, by service, 2003 - 2014

79
development and financial inclusion within the country, as can be seen from Figure 7. Apart
from levels of development, the strong tradition of credit union activity in the South is likely to
play a big role in explaining the high concentration of CU BCs in that region.
Figure 7: Share of all CU BCs by region, 2003 - 2014 (Based on BCB, 2015g)
The South region, the most developed in Brazil in terms of both HDI and IFI, hosted around 70%
of credit union correspondents in 2014, while the Southeast and Center-West regions hosted 16%
and 11%, respectively. The North and Northeast regions, the least developed and most
financially excluded parts of the country, correspondingly, had only 2% and 1% of CU BCs in
2014.
The depth of the penetration of CU BCs in the South becomes even clearer when looking at the
share of municipalities of each region covered by credit union correspondents, depicted in Figure
8. Indeed, almost 60% of municipalities in the South region were covered by credit union
correspondents in 2014, compared to around 27% in the Center-West region, 10% in the
Southeast and less than 3% in the North and Northeast regions together.
Figure 8: Share of municipalities with CU BCs by region 2003 -2014 (Based on BCB, 2015g)

80
4.1.4. Banking Correspondents by Credit Union Type and Affiliation
As previously explained and depicted in Appendix 15, there are different networks of credit
unions in Brazil, under which centrals and singular credit unions operate. Those confederations
are Sicredi, Sicoob, Ancosol and Unicred. Singular credit unions in Brazil, members or not of a
network, are divided into four different types: rural credit unions, mutual credit unions, free
admission credit unions and Luzzatti credit unions. This section contemplates the use of banking
correspondents by credit unions of those different types and affiliations. Appendix 24 illustrates
the distribution of credit unions by type and affiliation in 2008 and 2014.
When looking at the prevalence of credit union correspondents among different types of credit
unions, it becomes clear that free admission credit unions have by far the most correspondents,
accounting for 89% of total in 2014, while mutual credit unions accounted for 9% of total. This
is illustrated in Table 9. One may note that the total number of correspondents is different from
figures presented above – this is due to many correspondents being “multi-credit union”, as
explained in the previous section. Such a correspondent is counted twice if it serves different
types of credit unions. The same applies to the number of credit unions by affiliation. In addition,
a fifth type of actor is included in the comparison, a cooperative bank. Indeed, Banco
Cooperativo do Brasil, a cooperative bank pertaining to the Sicoob centrals, operated 17
correspondents in 2014. This actor is not analyzed in detail, as its comparability with credit
union correspondents is unclear, due to potentially differing targets and motives.
Table 9: Number of correspondents by type of credit union, 2003 - 2014 (Based on BCB, 2015c and 2015g)
Table 10 presents the “popularity” of using banking correspondents for different types of credit
unions. Out of free admission credit unions, almost 60% operated banking correspondents in
Type of CU Figure 2003 2004 2005 2006 2007 2008 2009 2010 2011 2012 2013 2014 CAGR 11-14 % of Total
All BCs 0 0 0 0 2 28 33 28 66 72 65 66 0,0 % 1,6 %
Exclusive BCs 0 0 0 0 2 20 22 21 31 33 22 29 -2,2 % 1,0 %
Exclusiveness % - - - - 100 % 71 % 67 % 75 % 47 % 46 % 34 % 44 % -2,2 % -
All BCs 0 0 1 2 2 12 21 26 326 327 330 330 0,4 % 8,1 %
Exclusive BCs 0 0 1 2 2 9 13 13 280 280 279 280 0,0 % 9,3 %
Exclusiveness % - - 100 % 100 % 100 % 75 % 62 % 50 % 86 % 86 % 85 % 85 % -0,4 % -
All BCs 17 17 19 31 98 942 1568 2011 3042 3384 3582 3671 6,5 % 89,6 %
Exclusive BCs 17 17 19 26 90 767 1212 1575 2302 2465 2557 2699 5,4 % 89,2 %
Exclusiveness % 100 % 100 % 100 % 84 % 92 % 81 % 77 % 78 % 76 % 73 % 71 % 74 % -1,0 % -
All BCs 0 0 0 0 0 3 6 8 7 7 8 15 28,9 % 0,4 %
Exclusive BCs 0 0 0 0 0 2 4 4 4 2 3 9 31,0 % 0,3 %
Exclusiveness % - - - - - 67 % 67 % 50 % 57 % 29 % 38 % 60 % 1,6 % -
All BCs 0 0 0 0 0 0 0 0 17 17 17 17 0,0 % 0,4 %
Exclusive BCs 0 0 0 0 0 0 0 0 9 9 9 9 0,0 % 0,3 %
Exclusiveness % - - - - - - - - 53 % 53 % 53 % 53 % 0,0 % -
Cooperative Bank
Operational and exclusive CU BCs by type of credit union
Rural Credit
Mutual Credit
Free Admission
Luzzatti

81
2014, compared to 6% and 10% of mutual credit and rural credit unions, respectively. Out of
Luzzatti-credit unions, 40% had banking correspondents in 2014, but the low number of credit
unions of this type (five) decreases the relevance of this figure. Out of credit unions with banking
correspondents in 2014, 74.5% were free admission credit unions, a fact that is certainly linked
to the flexibility of membership of this type of CU.
Table 10: Prevalence of correspondents by type of credit union, 2008-2014 (Based on BCB, 2015c and 2015g)
Interestingly, as detailed in the aforementioned appendix, there was a moderate correlation
between the number of free admission credit unions and the number of CU BCs in a mesoregion,
(Pearson = 0.55, significant at the 0.01-level). This makes sense, as most credit unions with BCs
represent this type of CU.
When observing credit union correspondents by affiliation, as presented in Table 11 and Figure
9, clear trends are also visible. In 2014, the majority of credit union correspondents, 67%, were
operated by Sicredi-affiliated credit unions, while 30% were operated by Sicoob-affiliated CUs.
Ancosol affiliated credit unions represented 0.1% of all BCs, while independent credit unions
accounted for around 4% of total BCs in 2014. A more detailed table of credit union
correspondents by affiliation and type of CU is available in Appendix 25.
2008 2009 2010 2011 2012 2013 2014 CAGR 2011-14
n of CU BC 942 1 568 2 011 3 042 3 384 3 582 3 671 6,5 %
Total n CU of this type 301 305 302 301 302 295 291 -1,1 %
n of CU with BC 102 110 118 164 166 170 172 1,6 %
Share of total CU with BC 34 % 36 % 39 % 54 % 55 % 58 % 59 % 2,8 %
n of CU BC 3 6 8 7 7 8 15 28,9 %
Total n CU of this type 9 8 8 7 7 5 5 -10,6 %
n of CU with BC 1 1 1 1 1 2 2 26,0 %
Share of total CU with BC 11 % 13 % 13 % 14 % 14 % 40 % 40 % 40,9 %
n of CU BC 12 21 26 326 327 330 330 0,4 %
Total n CU of this type 825 784 758 720 688 645 617 -5,0 %
n of CU with BC 6 10 14 35 36 35 35 0,0 %
Share of total CU with BC 1 % 1 % 2 % 5 % 5 % 5 % 6 % 5,3 %
n of CU BC 28 33 28 66 72 65 66 0,0 %
Total n CU of this type 291 280 266 252 243 236 225 -3,7 %
n of CU with BC 5 4 4 22 22 22 22 0,0 %
Share of total CU with BC 2 % 1 % 2 % 9 % 9 % 9 % 10 % 3,8 %
Correspondent usage by type of credit union
Rural Credit
Comparison of different CU types
Free Admission
Luzzatti
Mutual Credit

82
Table 11: Banking correspondents by affiliation of credit union, 2003-2014 (Based on BCB, 2015c and 2015g)
Figure 9: Operational CU BCs by affiliation, 2003 - 2014 (Based on BCB, 2015c and 2015g)
As illustrated in Appendix 26, around 40% of all correspondents opened by independent credit
unions since 2003 had been closed by 2014, compared to 27% for Sicredi and only 10% for
Sicoob. The reasons behind the closing of correspondents are not specified in the database.
While most credit union correspondents of different affiliations are accredited with payment
services, it is interesting to note that Sicredi has over 98% of all correspondents with credit
proposals, as illustrated in Table 12. Around 11% of all Sicredi-affiliated credit unions with BCs
used service V, while Sicoob-affiliated CUs did not use such BCs at all in 2014.
Table 12: CU Correspondents with service V by affiliation, 2011- 2014 (based on Banco Central do Brasil 2015c and 2015g)
Affiliation Figure <2003 2003 2004 2005 2006 2007 2008 2009 2010 2011 2012 2013 2014 CAGR 2011-14
Municipalities with CU BC 0 0 0 0 0 0 0 0 1 2 2 2 2 0,0 %
Municipalities with exclusive CU BC 0 0 0 0 0 0 0 0 1 0 0 0 1 0,0 %
Municipalities with CU BC 1 2 2 3 14 37 56 71 93 346 356 371 374 2,6 %
Municipalities with exclusive CU BC 1 2 2 3 9 32 49 66 89 314 317 331 334 2,1 %
Municipalities with CU BC 0 0 0 0 1 13 33 42 45 65 67 64 63 -1,0 %
Municipalities with exclusive CU BC 0 0 0 0 1 12 27 37 39 50 52 47 48 -1,4 %
Municipalities with CU BC 0 0 0 0 0 0 0 0 0 2 3 3 3 14,5 %
Municipalities with exclusive CU BC 0 0 0 0 0 0 0 0 0 0 1 1 1 0,0 %
Municipalities with CU BC 6 8 8 9 10 24 443 607 664 721 744 765 779 2,6 %
Municipalities with exclusive CU BC 6 8 8 9 10 23 399 545 610 643 655 676 694 2,6 %
Ancosol
Municipalities with CU BC by affiliation
Unicred
Sicredi
Sicoob
Independent
Credit proposals
Affiliation of CU 2011 2012 2013 2014 2011 2012 2013 2014 2011 2012 2013 2014
Unicred 1 1 1 1 1 1 1 1 33 % 33 % 50 % 50 %
Sicoob 0 0 0 0 0 0 0 0 0 % 0 % 0 % 0 %
Independent 1 1 1 1 1 1 1 1 5 % 5 % 7 % 7 %
Ancosol 0 0 0 0 0 0 0 0 0 % 0 % 0 % 0 %
Sicredi 5 65 99 106 5 5 7 8 6 % 6 % 9 % 11 %
n of BC with Inc V n of CU with Inc V BC % of all CU with BC

83
As can be seen from Table 13 below, Sicoob correspondents are on average more exclusive than
Sicredi correspondents – 83% of Sicoob-affiliated BCs are exclusive to Sicoob, compared to
only 71% for both Sicredi-affiliated and independent BCs.
Table 13: Exclusiveness of banking correspondents by affiliation, 2008 - 2014 (Based on BCB, 2015c and 2015g)
The following graphs trace the evolution of credit union correspondents and electronic access
points by affiliation. Ancosol and Unicred are ignored in this analysis due to their insignificant
numbers of BCs and PAEs.
Figure 10: Independent credit unions, BCs and PAEs, 2008 - 2014 (Based on BCB, 2015c, 2015f and 2015g)
Independent credit unions operated around 150 correspondents in 2014, out of which 102 were
exclusive. They also operated 25 PAEs in the same year. Independent CUs closed exceptionally
many correspondents in 2013, as can be seen from Figure 10. Their number of operational BCs
in 2014 was lower than in had been in 2012 (180).
As illustrated in Figure 11 and Appendix 27, Sicredi-affiliated credit unions have steadily opened
correspondents over the observed period, and operated around 2,500 BCs in 2014. Out of those
BCs, only around 1,950 were exclusive. Sicredi-affiliated credit unions did not use PAEs in
2014.
Affiliation of CU 2008 2009 2010 2011 2012 2013 2014
Unicred 0 % 0 % 100 % 0 % 0 % 0 % 50 %
Sicoob 87 % 86 % 89 % 85 % 82 % 81 % 83 %
Independent 79 % 77 % 82 % 73 % 71 % 67 % 71 %
Ancosol 0 % 0 % 0 % 0 % 33 % 33 % 33 %
Sicredi 81 % 76 % 77 % 74 % 71 % 69 % 71 %
Exclusivity percentage of CU BCs by affiliation

84
Figure 11: Sicredi-affiliated credit unions, BCs and PAEs, 2008 - 2014 (Based on BCB, 2015c, 2015f and 2015g)
As can be seen from Figure 12, 2011 was a year of massive growth in BCs for Sicoob-affiliated
credit unions, which, as previously explained, suggests the registration of previously unofficial
BCs. With the exception of the year 2011, the growth in BCs has been rather stable. Sicoob
affiliated credit unions operated around 1,200 correspondents in 2014, out of which 1,000, or
80%, were exclusive. An interesting phenomenon in the case of Sicoob-affiliated credit unions is
the rapid increase in adoption of PAEs since 2011 – there were already over 600 such access
points operated by Sicredi-affiliated CUs in 2014, compared to 200 in 2011.
Figure 12: Sicoob-affiliated credit unions, BCs and PAEs, 2008 - 2014 (Based on BCB, 2015c, 2015f and 2015g)
As depicted in Figure 13 and Appendix 28, out of Sicoob-affiliated credit unions, 80 operated
PAEs in 2014, while roughly 105 operated BCs. In the same year, 40 credit unions used both
PAEs and BCs. Interestingly, the average growth between 2011 and 2014 is much larger for the
number of Sicoob-affiliated credit unions with PAEs than for CUs with BCs and even larger for
credit unions with both. As a matter of fact, the growth in Sicoob affiliated CUs with BCs had
stalled since 2011, as can be seen from Figure 13.
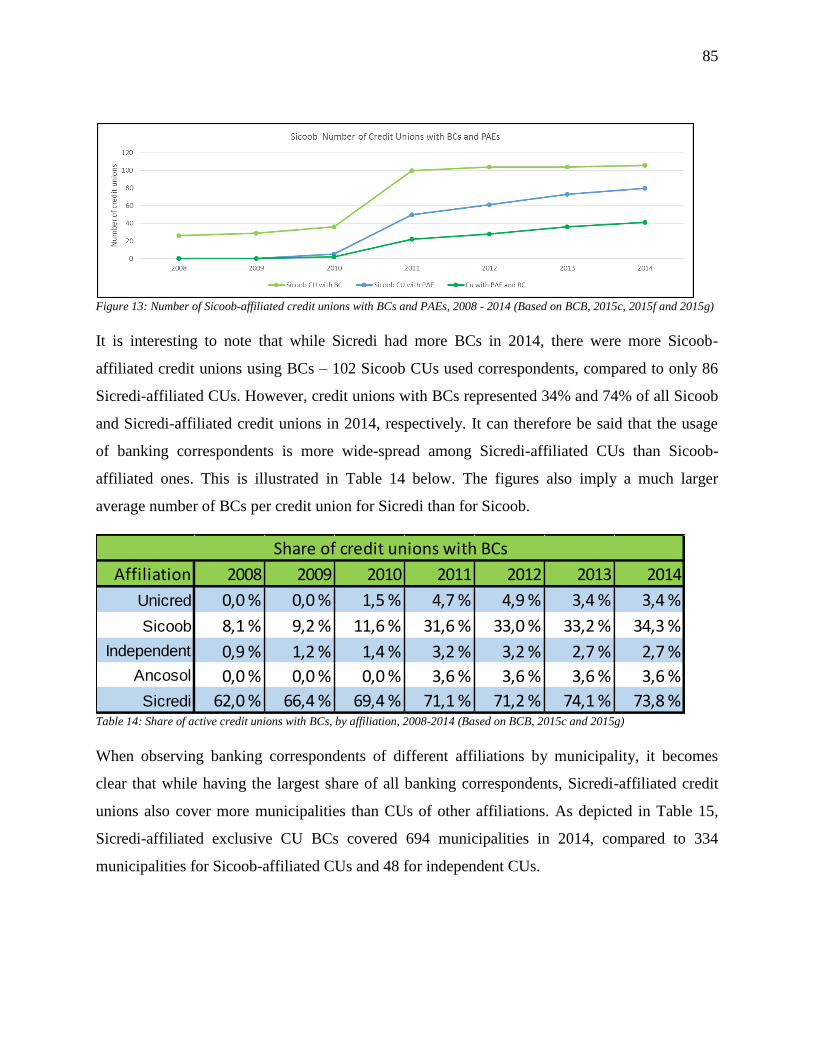
85
Figure 13: Number of Sicoob-affiliated credit unions with BCs and PAEs, 2008 - 2014 (Based on BCB, 2015c, 2015f and 2015g)
It is interesting to note that while Sicredi had more BCs in 2014, there were more Sicoob-
affiliated credit unions using BCs – 102 Sicoob CUs used correspondents, compared to only 86
Sicredi-affiliated CUs. However, credit unions with BCs represented 34% and 74% of all Sicoob
and Sicredi-affiliated credit unions in 2014, respectively. It can therefore be said that the usage
of banking correspondents is more wide-spread among Sicredi-affiliated CUs than Sicoob-
affiliated ones. This is illustrated in Table 14 below. The figures also imply a much larger
average number of BCs per credit union for Sicredi than for Sicoob.
Table 14: Share of active credit unions with BCs, by affiliation, 2008-2014 (Based on BCB, 2015c and 2015g)
When observing banking correspondents of different affiliations by municipality, it becomes
clear that while having the largest share of all banking correspondents, Sicredi-affiliated credit
unions also cover more municipalities than CUs of other affiliations. As depicted in Table 15,
Sicredi-affiliated exclusive CU BCs covered 694 municipalities in 2014, compared to 334
municipalities for Sicoob-affiliated CUs and 48 for independent CUs.
Affiliation 2008 2009 2010 2011 2012 2013 2014
Unicred 0,0 % 0,0 % 1,5 % 4,7 % 4,9 % 3,4 % 3,4 %
Sicoob 8,1 % 9,2 % 11,6 % 31,6 % 33,0 % 33,2 % 34,3 %
Independent 0,9 % 1,2 % 1,4 % 3,2 % 3,2 % 2,7 % 2,7 %
Ancosol 0,0 % 0,0 % 0,0 % 3,6 % 3,6 % 3,6 % 3,6 %
Sicredi 62,0 % 66,4 % 69,4 % 71,1 % 71,2 % 74,1 % 73,8 %
Share of credit unions with BCs

86
Table 15: Municipalities covered by CU BCs of different affiliations, 2003 - 2014 (Based on BCB, 2015c and 2015g)
Nevertheless, Sicredi-affiliated CU BCs are not dominant in all regions of Brazil, as can be seen
from tables below and from Appendix 30. In the North region, Sicoob-affiliated credit unions
had most of the 68 CU BCs operational in 2014. Sicredi had only 10 BCs in the region in 2014.
Table 16: Correspondents by CU affiliation, North region, 2008-2014 (Based on BCB, 2015c and 2015g)
In the Northeast region, only 25 CU BCs were active in 2014, 20 of which were operated by
Sicoob. Sicredi did not operate any correspondents in the region in 2014, but also did not have
any affiliated credit unions there. Interestingly enough, there are more credit union seats in the
Northeast than the Central-West, but significantly less credit union correspondents. However, as
exhibited in Appendix 25, there were less than 20 free admission credit unions in the North and
Northeast regions, compared to 44 in the Center-West, which may largely explain the lower
number of CU BCs in the region.
Table 17: Correspondents by CU affiliation, Northeast region, 2008-2014 (Based on BCB, 2015c and 2015g)
Affiliation Figure <2003 2003 2004 2005 2006 2007 2008 2009 2010 2011 2012 2013 2014 CAGR 2011-14
Municipalities with CU BC 0 0 0 0 0 0 0 0 1 2 2 2 2 0,0 %
Municipalities with exclusive CU BC 0 0 0 0 0 0 0 0 1 0 0 0 1 0,0 %
Municipalities with CU BC 1 2 2 3 14 37 56 71 93 346 356 371 374 2,6 %
Municipalities with exclusive CU BC 1 2 2 3 9 32 49 66 89 314 317 331 334 2,1 %
Municipalities with CU BC 0 0 0 0 1 13 33 42 45 65 67 64 63 -1,0 %
Municipalities with exclusive CU BC 0 0 0 0 1 12 27 37 39 50 52 47 48 -1,4 %
Municipalities with CU BC 0 0 0 0 0 0 0 0 0 2 3 3 3 14,5 %
Municipalities with exclusive CU BC 0 0 0 0 0 0 0 0 0 0 1 1 1 0,0 %
Municipalities with CU BC 6 8 8 9 10 24 443 607 664 721 744 765 779 2,6 %
Municipalities with exclusive CU BC 6 8 8 9 10 23 399 545 610 643 655 676 694 2,6 %
Ancosol
Municipalities with CU BC by affiliation
Unicred
Sicredi
Sicoob
Independent
Affiliation 2008 2009 2010 2011 2012 2013 2014 CAGR 11-14 n of CU 2014
Unicred 0 0 0 0 0 0 0 0,0 % 4
Sicoob 1 1 1 30 51 58 58 24,6 % 19
Independent 0 1 1 0 0 0 0 0,0 % 29
Ancosol 0 0 0 0 0 0 0 0,0 % 3
Sicredi 2 3 4 8 9 9 10 7,7 % 3
Total 3 5 6 38 60 67 68 21,4 % 58
North Region CU BCs
Affiliation 2008 2009 2010 2011 2012 2013 2014 CAGR 11-14 n of CU 2014
Unicred 0 0 0 0 0 0 0 0,0 % 19
Sicoob 0 1 2 18 19 20 20 3,6 % 25
Independent 0 0 0 5 5 5 5 0,0 % 36
Ancosol 0 0 0 0 0 0 0 0,0 % 16
Sicredi 0 0 0 0 0 0 0 0,0 % 0
Total 0 1 2 23 24 25 25 2,8 % 96
Northeast Region CU BCs

87
In the Southeast region, Sicoob still had the lead in 2014, with 580 operational banking
correspondents, despite a small decrease in number from 2013. Independent credit unions also
operated 58 BCs in the Southeast in 2014, and there were only 23 Sicredi-affiliated BCs. Overall,
there were 179 Sicoob-affiliated CUs in the region in 2014, compared to only 11 Sicredi-
affiliated CUs. Sicredi-affiliated CU BCs had been increasing fast in the region, though.
Table 18: Correspondents by CU affiliation, Southeast region, 2008-2014 (Based on BCB, 2015c and 2015g)
In the South region, Sicredi affiliated BCs were the most prevalent in 2014. In that year, there
were 2,254 Sicredi BCs compared to 540 Sicoob BCs and 65 independent ones. It has to be
noted that Sicoob-affiliated CU BCs saw faster growth in the region than other affiliations
between 2011 and 2014 (Except for Ancosol, which had only two BCs in the region in 2014).
Table 19: Correspondents by CU affiliation, South region, 2008-2014 (Based on BCB, 2015c and 2015g)
In the Center-West region, there were only four Sicoob-affiliated BCs in 2014, while most BCs
were affiliated to Sicredi. There were indeed 417 Sicredi BCs in the region in 2014, while
independent credit unions operated 22 correspondents in the same year.
Table 20: Correspondents by CU affiliation, Center-West region, 2008-2014 (Based on BCB, 2015c and 2015g)
Affiliation 2008 2009 2010 2011 2012 2013 2014 CAGR 11-14 n of CU 2014
Unicred 0 0 0 1 1 1 1 0,0 % 28
Sicoob 75 92 121 539 573 585 580 2,5 % 179
Independent 25 29 31 46 49 55 58 8,0 % 311
Ancosol 0 0 0 0 0 0 0 0,0 % 7
Sicredi 0 1 2 7 9 18 23 48,7 % 11
Total 100 122 154 593 632 659 662 3,7 % 536
Southeast Region CU BCs
Affiliation 2008 2009 2010 2011 2012 2013 2014 CAGR 11-14 n of CU 2014
Unicred 0 0 0 0 0 0 0 0,0 % 8
Sicoob 11 52 66 443 455 548 540 6,8 % 51
Independent 10 32 40 84 95 69 65 -8,2 % 88
Ancosol 0 0 0 1 2 2 2 26,0 % 140
Sicredi 662 1 163 1 531 1 868 2 086 2 169 2 254 6,5 % 69
Total 683 1247 1637 2396 2638 2788 2861 6,1 % 356
South Region CU BCs
Affiliation 2008 2009 2010 2011 2012 2013 2014 CAGR 11-14 n of CU 2014
Unicred 0 0 1 1 1 1 1 0,0 % 0
Sicoob 0 0 0 4 4 4 4 0,0 % 23
Independent 17 17 16 29 34 24 24 -6,1 % 49
Ancosol 0 0 0 1 1 1 1 0,0 % 0
Sicredi 179 231 252 337 375 397 417 7,4 % 20
Total 196 248 269 372 415 427 447 6,3 % 92
Center-West CU BCs

88
It is interesting to note that in the Center-West, in contrast to other regions, each credit union
affiliation had at least one banking correspondent in 2014. Nevertheless, the number of BCs
operated by Unicred, Sicoob and Ancosol affiliated credit unions was very small in 2014.
A further interesting observation is related to the fact that Unicred and Ancosol-affiliated credit
unions are widely represented in all regions (except for the Center-West), but almost do not
operate correspondents.
As detailed in Appendix 29 and illustrated in Figure 14, while having more correspondents,
Sicredi-affiliated credit unions are also generally more prone to use BCs. Indeed, in most regions
where Sicredi is present, the share of credit unions using BCs is higher than for Sicoob.
However, in the Southeast, this figure is higher for Sicoob-affiliated credit unions. In the South
and Center-West regions, 80% of Sicredi-affiliated credit unions use banking correspondents,
compared to 55% and 20% for Sicoob, respectively.
Figure 14: Sicredi and Sicoob-affiliated credit unions and BCs, 2014 (Based on BCB, 2015c and 2015g)
Panambi Case-Study 4.2.
4.2.1. Background of the Case
Panambi is a municipality of the State of Rio Grande do Sul, in the South of Brazil (see map in
Figure 15). The municipality was selected for the case study due to its relatively high
proliferation of credit union BCs with credit proposal services – in 2014, there were 15
correspondents with service V in the municipality. All of these were operated by a Sicredi
affiliated credit union, Sicredi Panambi RS, which merged with other credit unions of the region

89
in the end of 2013 to form a new credit union - Sicredi das Culturas. As its name suggests, the
credit union is affiliated to the Sicredi network.
Panambi was rather well covered with financial services in 2014, as it had a score of 0.90 that
year in the municipal index of financial inclusion created for the purposes of this case. The
municipality had the maximum score in six of the ten categories of the index, while exhibiting
lower scores in the amount of branches and PAB/PAA in the municipality. Panambi’s
performance on different aspects of the index of financial inclusion in 2014 is illustrated in
Figure 15 below.
Figure 15: Location of Panambi in Brazil and performance on IFI in 2014 (Based on Banco Central do Brasil, 2015c-g)
The interview group had to carry out part of the interviews in Ijuí, where the seat of the credit
union was relocated following the recent merger. Part of the planned interviews was not
executed due to time and access constrains. As the planned interviews were semi-structured, not
all questions detailed in Appendix 19 were asked to the interviewees. The questions rather served
as a guideline for the interviews.
The group interviewed the mayor of Panambi, the president of the trade association, three
managers of Sicredi das Culturas, as well as four managers of commercial banks, three
correspondents and 11 users of correspondents (information detailed in Appendix 19). Some of
the responses obtained were contradicting, which is discussed in the next section of this thesis.
The analysis of the qualitative data obtained through the interviews was done according to the
plan detailed in the methodology section. The “codes” used were grouped in four categories, as

90
visible in Appendix 31: General, Sicredi BC, Banks BC and Opinions of Stakeholders. The
structure of this section follows this grouping.
4.2.2. General Information about Panambi and Sicredi
Panambi had a population of around 40,804 in 2014. According to the mayor of Panambi, the
municipality is the third largest industrial center in the northern part of Rio Grande do Sul, and
exhibits the largest demographic growth in the region with a 2.5% annual rate.
According to the mayor of the city, the main challenge of the municipality is immigration from
neighboring poorer regions, as the newcomers lack education and technical skills, and therefore
often end up unemployed and risk social exclusion. According to the trade union president,
other major challenges of Panambi are the logistical distance from major economic centers, the
lack of entertainment services leading to the outflow of skilled labor, as well as the general poor
quality of physical and telecommunications infrastructure. The City Hall has implemented
several social programs in order to prevent social exclusion, by providing housing, education and
buying the products of local farmers, as well as promoting entrepreneurship.
In the view of the trade association president, despite a good coverage by banks and credit
unions, access to credit for entrepreneurs in the municipality is precarious, and is particularly
rendered difficult by bureaucracy and structural poverty. In his opinion, the facility of access to
credit that is given to physical persons through credit cards and payroll credit should be rather
given to natural persons, and at affordable cost. The lack of access to credit is deindustrializing
the municipality. Furthermore, default rates have risen during the crisis, and many people lack
the ability to analyze cost of credit.
As retained from the interview with the Sicredi management in Ijuí, the credit union, founded in
1931, was a rural credit union until becoming a free admission credit union in 2004, making the
credit union accessible to everyone. That way the credit union also started developing its
portfolio, soon being able to compete with banks in financial services. Sicredi das Culturas was
born through the merger of four credit unions with their central. Following the merger, processes
and services were standardized.

91
The vice-president of Sicredi das Culturas (ex-president of Sicredi Panambi) affirmed that there
was no alternative to the merger in order to keep the credit union operational. Through the
merger, he attested, the credit union was able to service a much larger number of customers than
in the past, partly due to the increase in equity. The merger led to a remodeling of the
management of the credit union, as unnecessary management levels were removed. Despite
changes brought to the credit union management by the merger, the vice-president of the CU
maintained that no changes could be felt by the members.
Defending the apparent similarity of Sicredi with a bank, the credit union management stressed
the necessity of a credit union to provide similar service quality as regular financial institutions
in order to be competitive. Furthermore, in its discourse, the management highlighted the
engagement of Sicredi with its members as a main differential to banks. The vice-president of
Sicredi accentuated the “valorization of the member” as a main distinction from commercial
banks. As a member-owner, the member receives a share of the proceeds of the credit union
proportional to his or her transaction volume.
According to Sicredi management in Ijuí, credit is only given to members in Sicredi, even
though some non-members had been able to get credit in the past. Nevertheless, the equity
investment required to acquire membership had decreased significantly because of the growth
ambition of the credit union.
4.2.3. Sicredi Banking Correspondents
The management of Sicredi das Culturas in Ijuí talked about banking correspondents in a rather
enthusiastic way. As explained by them, banking correspondents allow the credit union to have
“one more person to serve the customers”. Retailers need to be Sicredi members in order to work
as correspondents. This was made possible by the free admission model, as natural persons could
join the credit union. Sicredi operates two types of correspondents, one for receiving bill
payments, and the other to finance vehicles. In addition, some companies wanted to become
correspondents for Sicredi in order to facilitate their own payments and money processing, as
they are able to use the credit union’s clearing system for their own transactions while receiving
bills.

92
4.2.3.1. Banking Correspondents for Receiving Bills
Most correspondents are used for receiving bill payments from both members and non-members,
apparently in an effort to remove waiting lines from credit union branches. The credit union
imposes a limit on daily transactions, after which the correspondent has to bring the cash
generated from the day’s transactions to a Sicredi branch, before being allowed to continue
operations. This entails a certain level or risk, according to the Sicredi management, as
correspondents need to keep and transport considerable cash balances. This requirement arises
partly from the fact that correspondents are unable to accept payments by check or card. In the
first quarter of 2015, BCs were used on average for 50 operations a day.
The area of operations of Sicredi das Culturas around Ijuí and Panambi is composed of 13
municipalities, where it operates 19 BCs. The initial plan regarding the distribution of financial
services was to have one proprietary branch and one correspondent in each municipality, but
some branches did not want to have a BC. In Panambi, Sicredi has three branches, four
correspondents and four ATMs, which translates to one point of access per 4,500 inhabitants.
As explained by the management of Sicredi das Culturas, the credit union has had banking
correspondents since 2008, when a pharmacy was contracted to receive bills. The management
attested that a number of correspondents operated without being registered prior to 2011, before
the compliance requirements became more stringent. The registration of previously non-
registered banking correspondents explains the large growth in BCs during that period, as
revealed by the Sicredi management. Nowadays the update of BC information in the Central
Bank databases is a constant process, and the management needs to keep an eye on the
documentation of all 19 correspondents all the time.
In terms of location of the banking correspondents, the proximity of branches is preferred,
allowing clients an easy access to both the branch and the correspondent. All but one of the 19
correspondents are located in urban areas, the exception being a correspondent located in an
indigenous reserve. As the main role of the agent is to remove waiting lines, they are apparently
not supposed to be located far from branches. Nonetheless, according to the CU management, in
Panambi, there are two BCs in the city center and two in the suburbs. But in general, due to the
coverage of all municipalities of the region with Sicredi branches, as well as to the limited size of

93
the municipalities, there is no need for correspondents to be located far from branches, according
to the management. The management also added that a larger distance from the branch implies
lower security for the correspondent, as they need to bring their cash balances to the branch
daily.
When it comes to the technology used for managing correspondents, an intranet accessible online
is used. This intranet is connected with the Sicredi Bank, and clearance of bills is done through
it. Due to this, the correspondent only needs a basic computer with internet access in order to pay
bills, on top of a receipt printing machine, or “authentication device”. There is no requirement
for this authentication device to be of a certain type, as long as it fills minimum requirements and
is compatible with the platform, according to the Sicredi-management.
4.2.3.2. Car Dealers as Banking Correspondents
When it comes to correspondents with service V, the management of Sicredi das Culturas
considers them a separate type of actor. Sicredi cooperates with car dealers in order to help
people buy cars for personal use. These correspondents need to get a certification from the
Brazilian Bank Federation (Febraban), unlike correspondents receiving payments. The
management of Sicredi das Culturas explains the involvement of the credit union in this segment
through the importance of cars in Brazilian culture on the one hand, and through the ability to
cross-sell financial products for the car on the other.
According to Sicredi, a competitive offer was initially crafted for dealers, in order to be
recommended to potential car buyers. The car dealer is able to inform the customer on
installments and to fill the credit proposal that is sent to Sicredi. After analysis and potential
approval of financing, the money is transferred on the car dealer’s account in the credit union.
According to the management, Sicredi entered the market when car sales were booming in
Brazil, and credit was also granted to non-members in order to increase the portfolio. However,
the default rate of these debtors was higher than that of Sicredi members, and the credit union
finally had to back-off from this market, in particular after the economic downturn in 2014.
Nowadays credit is only granted to Sicredi members.

94
4.2.3.3. Advantages of Using Banking Correspondents
According to the Sicredi das Culturas management in Ijuí, a major advantage of banking
correspondents are the flexible working hours, that are not limited by laws in the same way as
regular financial service providers. In some cases, correspondents also serve to fill geographical
gaps, as there are no branches in the suburbs, and they thus provide more capillarity and better
service. Nevertheless, the managers state the removal of waiting lines at branches as the main
purpose of banking correspondents, as bill payments can be directed to them. Their adoption led
to a general decrease of waiting times for members, increasing customer satisfaction. Thus the
role of the correspondent is related to increasing efficiency, as well as improving the image of
Sicredi in the community.
As the management puts it, a major motive behind the adoption of the correspondent model was
to have service levels similar to a bank and being closer to people - “Having several service
channels allows you to be different and ensure service quality to the client”. The management
mentions the fact that as Sicredi members, banking correspondents have an incentive to help the
credit union, as all the profit generated by the union is distributed back to its members.
4.2.3.4. Challenges Encountered with Banking Correspondents
The Sicredi management in Ijuí identifies some problems related to the usage of correspondents.
One of these is the operational limit compared to banks, as correspondents are not yet able to
perform other services than bill payment. Furthermore, the brand of Sicredi is in the hands of the
correspondent, and it is very challenging to manage it properly despite its importance to the
credit union. Developing the brand and “educating” the correspondent is a long process.
Another challenge related to the use of banking correspondents is the fact that payments are done
in cash only, which increases operational costs. This also leads to insecurity for the
correspondent and thus to the need for insurance, which becomes an extra cost on Sicredi,
according to the management in Ijuí. Generally, the physical and technological infrastructure
lags behind the plans of Sicredi to improve the system. Furthermore, many correspondents do not
have the required equipment to receive bills, and providing it to them is an extra cost on the
credit union.

95
According to the Sicredi management in Ijuí, they do not forbid correspondents from working
with other banks, but they do not recommend that, as they are trying to build the Sicredi brand in
cooperation with the agent.
4.2.3.5. Sicredi Future Plans for Banking Correspondents
According to the credit union management, the plan was for members to be able to make
deposits and withdraw money at correspondents by the end of the year 2015. Generally, the
management wishes for correspondents to be also used for electronic transactions, account
clearance, credit cards and registrations, in order to improve competitiveness of credit unions
against commercial banks. With a complete set of services, correspondents could be used for
attracting new members.
However, making this possible requires an improvement of the technology used to deal with
correspondents. Furthermore, this increase in scope may require many agents to get accredited
by Febraban, in order to have full understanding of services offered.
4.2.4. Commercial Bank Correspondents
Managers of the following banks were interviewed about the usage of banking correspondents:
Caixa, Banrisul, Bradesco and Santander. All of these banks use banking correspondents in the
region.
The Caixa manager saw the main advantage of banking correspondents in the flexibility of
working hours. The Banrisul manager, in turn, saw the correspondents as a way to “unburden”
the banks, streamlining its processes. Having correspondents for four years had decreased
operational costs, due to a reduction in the number of employees. Banrisul affirmed using
correspondents not only for payments, but also for payroll loans and housing credit.
At Bradesco, banking correspondents were only used for payments, due to the preference of
retailers themselves, as this arrangement implies lower staff requirements. According to the
Santander manager, correspondents are useful for decreasing the number of clients at branch
offices.

96
4.2.5. Opinions of Stakeholders
Several people were asked for their opinions about Sicredi and banking correspondents, among
others. Statements related to these interviews are gathered in this section.
4.2.5.1. Opinion on Sicredi
According to the mayor, Sicredi had an important role in the development of Panambi after the
founding of the municipality, when it was an agricultural bank financing housing in the area. As
the mayor sees it, nowadays Sicredi is a large commercial bank competing with other large banks
with a similar portfolio. The trade association president sees Sicredi as having an important
differential mostly for its members, as they get a financial return for being members, contrary to
commercial bank clients.
Out of commercial bank managers interviewed in Panambi, one saw Sicredi as an actor much
more similar to a bank than a credit union, despite incurring a different tax on financial
operations. Two of the managers interviewed saw Sicredi as indeed being a credit union serving
a different market than banks, thus not being in direct competition with them.
Out of correspondent users interviewed in the rural workers’ union and jewelry store, two people
had been Sicredi-members for a long time, the other one seeing credit unions as a safe haven in
times of economic turmoil. Nonetheless, she did not see the credit union as being present in the
lives of members. Two interviewed people didn’t like Sicredi’s service, and the other one
claimed that both service level and financial return had been negatively affected by the growth of
the union. One of the members interviewed also admitted having felt “prouder” to be a Sicredi
member when the credit union represented Panambi citizens only.
4.2.5.2. Opinion on Banking Correspondents
When asked about the impact of banking correspondents on the development of Panambi, the
mayor of the municipality stressed that in his opinion, the main impact of access to finance
comes from bank branches. Nonetheless, he noted that correspondents help in improving access
and convenience due to longer opening hours. He also mentioned that he himself does all his
financial transactions through a Bradesco correspondent located in the City Hall, and it has made
operations easy. However, he expressed some doubt over the durability of this phenomenon due
to the increasing facilitation of online payments.

97
The trade association president agreed that correspondents improve access and decrease long-
distance travels. He also believed that it is important for people to have access to financial
services in non-bank outlets. The president equally highlighted the security issues related to
being a correspondent, but noted that it can be an interesting and mutually beneficial agreement
due to increased turnover for retailers.
All six correspondent users interviewed at the rural workers’ union of Ijuí praised the
convenience brought upon them by the Sicredi correspondent at the syndicate. Many of them
saw their logistics improved significantly through the correspondent, as they previously had to
pay bills in several locations. Furthermore, many of the interviewed users said they were from
rural parts of the municipality, and came to the city mostly to visit the workers’ union, and
having a correspondent there made their transportation easier. Out of the users of a Sicredi BC
located in a jewelry store in Panambi, all affirmed using the banking correspondent to pay their
bills due to the lack of waiting lines, speed of service and convenient location.
4.2.5.3. Banking Correspondents’ Point of View
According to the managers of the rural workers’ union in Ijuí, being a banking correspondent
does not bring financial return, but members are satisfied with its service. A farming store owner
in Panambi affirms having been able to increase the turnover of the store thanks to being a
banking correspondent. The owner of the jewelry store acting as a correspondent was on the
same lines, saying she decided to become a BC in Panambi after the success she had perceived
acting as a CU BC in a different municipality.
When interviewed about potential disadvantages of being a correspondent, all BCs had
something to say. According to the manager of the rural workers’ union, on top of the low
financial return of the activity, other problems are the risk of robbery during cash transportation,
the unavailability of card payments, constant failure of the system, as well as the lack of proper
training for performing operations. The farming storeowner also deplored the cash-only payment
system, and mentioned the low limit of daily transactions as a problem, as it leads her to closing
bill payment activities before the store itself. Furthermore, she would wish for the system to
allow for other services than only bill payment. The jewelry store manager mentioned similar
problems as the first two correspondents – the low limit of daily transactions, the cash payment

98
and low return of the activity. She also found the initial cost of becoming a correspondent too
high, as the credit union did not provide her a computer, unlike had been the case in the previous
municipality where she had acted as a CU correspondent.
The owner of the farming store also mentioned that she had been offered to be a correspondent
for another institution but had given up on the idea due to the expensive investment in material it
would have entailed, as well as to the requirement to separate both activities.
Correspondents and Credit Union Financials 4.3.
This part of the study aims at establishing links between credit union financials and the usage of
banking correspondents, in an attempt to perceive potential effects of BC usage on credit unions.
This process started with a search for relationships between the number of banking
correspondents and the financials of credit unions, as explained in the methodology-section of
this thesis. In this analysis, all correspondents operated by credit unions were observed, as
exclusiveness does not matter as much from the point of view of the credit union as from the
point of view of access to financial services for the population. Calculations also showed that the
difference in results was minimal when considering only exclusive correspondents.
Appendix 32 illustrates examples of the initial search for correlations, which involved searching
for correlations with different sub-populations of credit unions. Sub-populations observed were
related to geographic regions as well as to the type and affiliation of credit unions. The relations
found were often stronger in certain subpopulations than in the entire population of credit unions.
In this initial search, relations were found between the number of correspondents and the
following indicators: return on equity, return on assets, size, coverage with services, other
revenue share as well as banking profitability. The relation was taken for further analysis if the
Pearson correlation was higher than 0.20. No relations reaching this level were found between
the number of credit unions and treasury investments, investments in credit operations, or
funding by long-term deposits – all indicators judged to be important for credit union survival
according to De Carvalho et al. (2011).
As a next step, these relations were looked into with more detail, in a manner exemplified in
Appendix 33. This consisted in looking at the relations in different years for the same sub-

99
populations as the ones that were used in the initial search. The number of banking
correspondents of a credit union was divided by its size (logarithm of assets), in order to improve
the comparability of banking correspondent usage between credit unions of different sizes. The
variable obtained this way was named banking correspondent intensity or BC intensity.
In order not to be biased by a relation in a single year, the average figures between 2012 and
2014 for BC intensity and financial ratios were computed to observe further relations. For all six
indicators taken into further analysis, all relations were calculated for different types and
affiliations of credit unions, as well as for different regions. For each relation, significance tests
were carried out. These results are all represented graphically in Appendix 34. The rest of his
section presents the most interesting results obtained for each observed financial ratio. The
strength of correlation is assessed through the framework presented by Evans (1996), detailed in
Appendix 36.
4.3.1. BC Intensity and Return on Equity
Figure 16: BC Intensity and Return on Equity by affiliation, 2012-2014 (Based on BCB, 2015b, 2015c and 2015g)
Return on Equity is a general measurement of rate of return for an organizations’ ownership.
When observing the entire population of credit unions, the relationship between BC Intensity and
ROE is weak but positive (Pearson = 0.32, significant at the 0.01-level), as is illustrated in Figure
16.

100
Nevertheless, for Sicredi-affiliated credit unions, the relation was much stronger (Pearson = 0.57,
significant at the 0.01-level), as can be seen from Figure 16. For Sicoob-affiliated credit unions
the relationship was weak but positive (Pearson = 0.23, significant at the 0.01-level). When
looking at the type of credit unions, as detailed in Appendix 34, free admission credit unions also
show a moderate correlation between BC Intensity and ROE for the period – 0.57 (significant at
the 0.01-level). In regional sets, this relationship was strong in the Central-West (Pearson = 0.63,
significant at the 0.01-level) and moderate in the South, Southeast and North regions (0.47, 0.40
and 0.41, respectively, sig. at the 0.01-level). For the Northeast, no significant relationship was
found.
4.3.2. BC Intensity and Size of Credit Union
In the study of De Carvalho et al. (2011), the size of a credit union was defined as the most
important determinant of its survival. For the whole population, the relationship between BC
intensity and size of the credit union was weak but positive (Pearson = 0.30, significant at the
0.01-level), as can be seen from Figure 17.
Figure 17: BC Intensity and Size by type of credit union, 2012-2014 (Based on BCB, 2015b, 2015c and 2015g)
Nonetheless this relationship was strong for free admission credit unions (Pearson = 0.60,
significant at the 0.01-level) and moderate for Sicredi-affiliated credit unions (Pearson = 0.50,
significant at the 0.01-level). For Sicoob-affiliated credit unions, the relationship was very weak

101
but positive (Pearson = 0.15, significant at the 0.01-level). At the regional level, the relationship
was generally very weak, except for the Central-West, where it was moderate (Pearson = 0.43,
sig. at the 0.01-level).
4.3.3. BC Intensity and Other Revenue Share
Other Revenue Share refers to the share of revenue from non-financial activities. It was seen to
have a negative impact on the survival of credit unions in the study of De Carvalho et al. (2011).
For the whole population of credit unions active in 2013, this relationship was very weak
(Pearson = 0.14, significant at the 0.01-level).
For free admission credit unions, the relation was a bit stronger, but still weak (Pearson = 0.28,
significant at the 0.01-level), as can be seen from Appendix 34. Interestingly, for Sicredi and
Sicoob the relationship was almost non-existent and actually not significant (Pearson= 0.01 and -
0.08, respectively, NOT significant at the 0.05-level). At the regional level, the relationship was
generally also very weak, except for the Central-West region where it was moderate (Pearson =
0.43, significant at the 0.01-level).
4.3.4. BC Intensity and Return on Assets
Return on Assets measures the efficiency of an organization’s assets in generating revenue. For
all credit unions, there was no relationship between BC intensity and ROA, and the result was
not even significant at the 0.05-level, as can be seen from Figure 18.
Notwithstanding, for Sicredi-affiliated credit unions, the relationship is moderate and positive
(Pearson = 0.49, significant at the 0.01-level). For Sicoob-affiliated credit unions, the
relationship was also positive but weak (Pearson = 0.20, significant at the 0.01-level). Such is
the case with free admission credit unions (Pearson = 0.37, significant at the 0.01-level). At the
regional level, the relationship was weak in the Central-West region (Pearson = 0.30, significant
at the 0.01-level) and moderate in the South (Pearson = 0.4, significant at the 0.01-level).

102
Figure 18: BC Intensity and Return on Assets by affiliation, 2012-2014 (Based on BCB, 2015b, 2015c and 2015g)
4.3.5. BC Intensity and Coverage with Services
Coverage with Services refers to the amount of structural expenses covered with revenue from
services. The relationship was weak but positive for credit unions in general (Pearson = 0.32,
significant at the 0.01-level). However, it was moderate for Sicredi-affiliated credit unions
(Pearson = 0.44, significant at the 0.01-level), while for Sicoob it was close to that (Pearson =
0.35, significant at the 0.01-level). At the regional level, the relationship was moderate in the
South and Center-West (0.43 and 0.39, respectively, significant at the 0.01-level).
Figure 19: BC Intensity and Coverage with Services by affiliation, 2012-2014 (Based on BCB, 2015b, 2015c and 2015g)

103
4.3.6. BC Intensity and Banking Profitability
Banking Profitability in this case refers to the ratio of operating income and operating expenses.
The relationship between BC intensity and banking profitability was overall not significant, as
can be observed from Appendix 34. Nevertheless, for Sicredi- affiliated credit unions, this
relationship was weak but positive, implying a potential link of some level between these two
variables (Pearson = 0.3, significant at the 0.01-level).
4.3.7. Potential Hidden Variables
Some of the relationships found in this analysis are rather interesting, such as the relationship
between BC Intensity and ROE as well as CU size and coverage with services, for example.
However, it is important to take into account the potential existence of “hidden variables” that
could explain this relation. The tables presented in Appendix 35 detail the relationships between
the variables observed, and aim at providing indication of potential hidden variables.
Out of the variables observed, asset size has potential to explain many of the relationships
obtained. Indeed, for all credit unions it has a moderate correlation with ROE (Pearson = 0.53,
significant at the 0.01-level), and for Sicredi it also has a moderate correlation with ROA
(Pearson = 0.45, significant at the 0.01-level). For free admission credit unions, the size of the
CU has a strong correlation with ROE (Pearson = 0.71, significant at the 0.01-level), as is
illustrated in Figure 20. It also has a moderate relationship with ROA (Pearson = 0.54,
significant at the 0.01-level). The same applies to the South-region, for example, where the
relation between CU size and ROE is strong (Pearson = 0.64, significant at the 0.01-level) and
the relation between CU size and ROA is moderate (Pearson = 0.51, significant at the 0.01-
level).
Interestingly, for Sicredi, coverage with services correlates strongly with banking profitability
(Pearson = 0.67, significant at the 0.01-level) and moderately with ROE (Pearson = 0.44,
significant at the 0.01-level).
All in all, it is unclear which relationship explains which, but these potential “hidden variables”
need to be considered in order to reach valid conclusions on the relationship between credit
union correspondents and credit union financials.

104
Figure 20: Asset Size and ROE by type of credit union, 2012-2014 (Based on BCB, 2015b and 2015c)
Credit Union Correspondents and the Municipal Index of Financial Inclusion 4.4.
This part of the research compares the location of credit union correspondents with municipal
data. By matching the municipal IFI with BC data, it is possible to observe the general level of
financial inclusion of municipalities where CU BCs are located.
While CU BCs are included in the IFI calculation, they generally represented less than 2% of all
BCs in 2014, and the BC category had only a 0.10 weighting in the computation of the index.
Even in the very few cases where CU BCs account for a large part of all BCs in a municipality,
their contribution to the total municipal IFI score is less than 10%. This makes comparisons of
the number of CU BCs with the municipal IFI possible and relevant for the purposes of this
research, as the IFI represents the general availability and usage of financial services in the
municipality.
The purpose of this analysis is not to claim causality between CU BC location and IFI score, but
rather to use the IFI score as an indication of the level of need for financial services in a
municipality. The presence of credit union correspondents in municipalities with low IFI could
be seen to be more important for financial inclusion than their presence in municipalities with
high IFI. If a municipality has a low IFI, by definition it implies that there is a restricted
availability of access points to financial services and, therefore, a larger marginal increase in
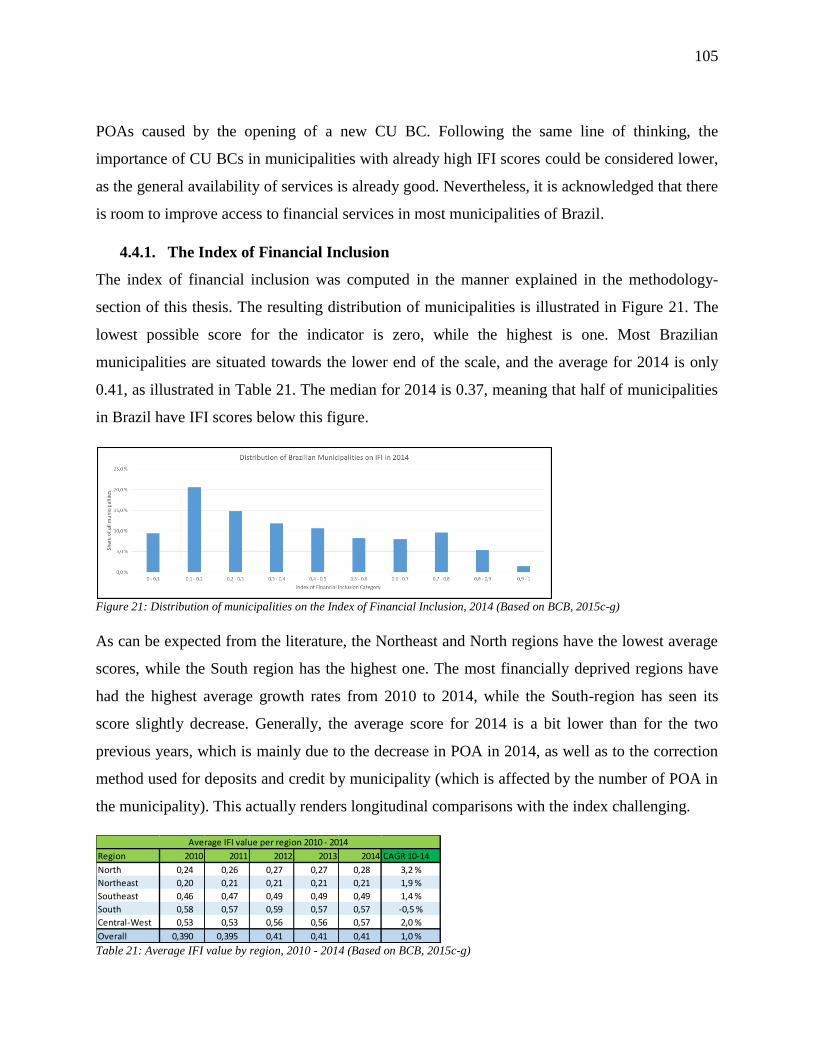
105
POAs caused by the opening of a new CU BC. Following the same line of thinking, the
importance of CU BCs in municipalities with already high IFI scores could be considered lower,
as the general availability of services is already good. Nevertheless, it is acknowledged that there
is room to improve access to financial services in most municipalities of Brazil.
4.4.1. The Index of Financial Inclusion
The index of financial inclusion was computed in the manner explained in the methodology-
section of this thesis. The resulting distribution of municipalities is illustrated in Figure 21. The
lowest possible score for the indicator is zero, while the highest is one. Most Brazilian
municipalities are situated towards the lower end of the scale, and the average for 2014 is only
0.41, as illustrated in Table 21. The median for 2014 is 0.37, meaning that half of municipalities
in Brazil have IFI scores below this figure.
Figure 21: Distribution of municipalities on the Index of Financial Inclusion, 2014 (Based on BCB, 2015c-g)
As can be expected from the literature, the Northeast and North regions have the lowest average
scores, while the South region has the highest one. The most financially deprived regions have
had the highest average growth rates from 2010 to 2014, while the South-region has seen its
score slightly decrease. Generally, the average score for 2014 is a bit lower than for the two
previous years, which is mainly due to the decrease in POA in 2014, as well as to the correction
method used for deposits and credit by municipality (which is affected by the number of POA in
the municipality). This actually renders longitudinal comparisons with the index challenging.
Table 21: Average IFI value by region, 2010 - 2014 (Based on BCB, 2015c-g)
Region 2010 2011 2012 2013 2014 CAGR 10-14
North 0,24 0,26 0,27 0,27 0,28 3,2 %
Northeast 0,20 0,21 0,21 0,21 0,21 1,9 %
Southeast 0,46 0,47 0,49 0,49 0,49 1,4 %
South 0,58 0,57 0,59 0,57 0,57 -0,5 %
Central-West 0,53 0,53 0,56 0,56 0,57 2,0 %
Overall 0,390 0,395 0,41 0,41 0,41 1,0 %
Average IFI value per region 2010 - 2014

106
Due to the limitation mentioned above, only the IFI of 2014 is used in this analysis. In the
assessment of BC growth, the municipal IFI scores are kept constant at 2014 values, in order to
ensure comparability.
4.4.2. Credit union Correspondents by Municipality on the IFI
Overall, as illustrated in Figure 22, credit union correspondents tend to be located in
municipalities with higher IFI scores. Around 74% of all CU BCs were located in municipalities
with an IFI score above 0.5 in 2014, even though roughly 65% of Brazilian municipalities have
an IFI score below this figure. Furthermore, less than 3% of all CU BCs were located in
municipalities with IFI scores below 0.2, while 27% of all municipalities fell into this category.
Correspondingly, 27% of CU BCs were located in municipalities with an IFI score above 0.8,
while only 7% of Brazilian municipalities entered in this category. The trend was similar when
observing only exclusive banking correspondents. Interestingly, the general exclusiveness rate of
CU BCs was lower, the higher the IFI score of the municipality. This is potentially due to the
higher amount of financial institutions competing for retailers.
Figure 22: Number of CU BCs by IFI category, 2014 (Based on BCB, 2015c-g)
The uneven distribution of credit union correspondents on the IFI was also explicit when
observing the coverage of municipalities by IFI category, meaning the number of municipalities
of each category with a CU BC. As illustrated in Figure 23, more municipalities were covered in
higher IFI categories - in the ones already having relatively good access to financial services.
The difference is most striking at the extremes – less than 5% of municipalities with an IFI-score
below 0.2 had a CU BC in 2014, compared to 60% of municipalities with an IFI score over 0.9.
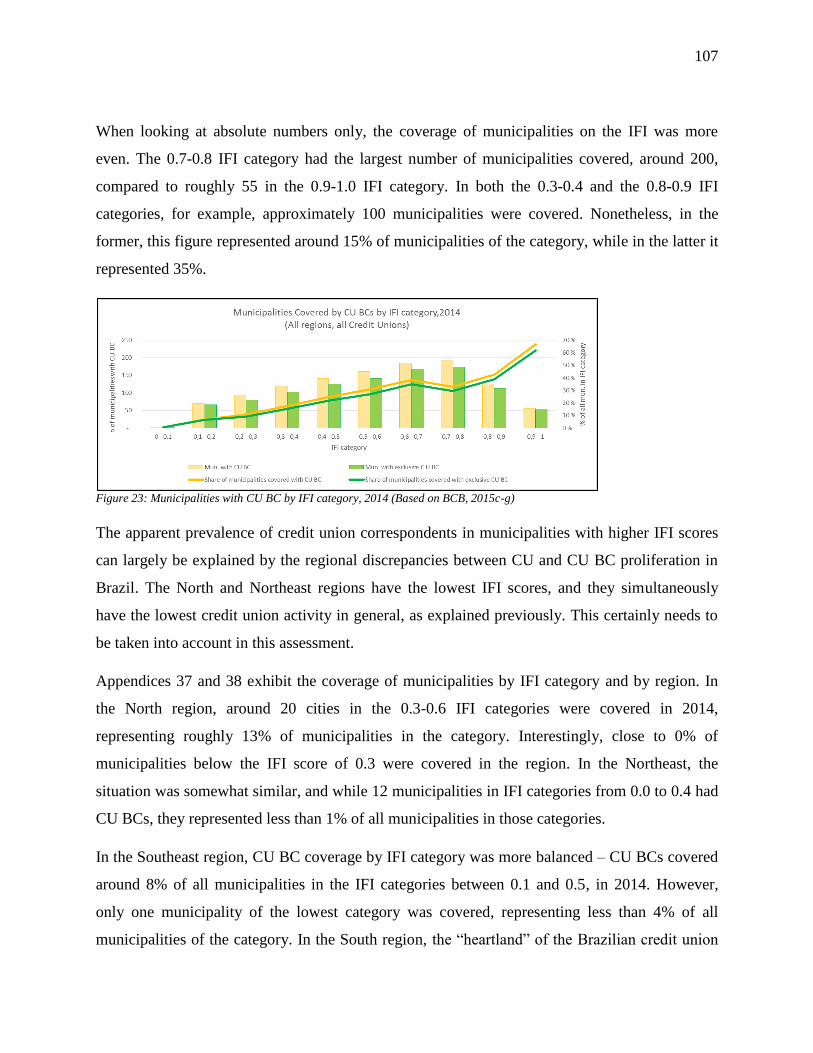
107
When looking at absolute numbers only, the coverage of municipalities on the IFI was more
even. The 0.7-0.8 IFI category had the largest number of municipalities covered, around 200,
compared to roughly 55 in the 0.9-1.0 IFI category. In both the 0.3-0.4 and the 0.8-0.9 IFI
categories, for example, approximately 100 municipalities were covered. Nonetheless, in the
former, this figure represented around 15% of municipalities of the category, while in the latter it
represented 35%.
Figure 23: Municipalities with CU BC by IFI category, 2014 (Based on BCB, 2015c-g)
The apparent prevalence of credit union correspondents in municipalities with higher IFI scores
can largely be explained by the regional discrepancies between CU and CU BC proliferation in
Brazil. The North and Northeast regions have the lowest IFI scores, and they simultaneously
have the lowest credit union activity in general, as explained previously. This certainly needs to
be taken into account in this assessment.
Appendices 37 and 38 exhibit the coverage of municipalities by IFI category and by region. In
the North region, around 20 cities in the 0.3-0.6 IFI categories were covered in 2014,
representing roughly 13% of municipalities in the category. Interestingly, close to 0% of
municipalities below the IFI score of 0.3 were covered in the region. In the Northeast, the
situation was somewhat similar, and while 12 municipalities in IFI categories from 0.0 to 0.4 had
CU BCs, they represented less than 1% of all municipalities in those categories.
In the Southeast region, CU BC coverage by IFI category was more balanced – CU BCs covered
around 8% of all municipalities in the IFI categories between 0.1 and 0.5, in 2014. However,
only one municipality of the lowest category was covered, representing less than 4% of all
municipalities of the category. In the South region, the “heartland” of the Brazilian credit union

108
movement, the coverage of municipalities was generally higher and more balanced than in other
regions, as illustrated in Figure 24. Roughly, 50% of municipalities in all IFI categories were
covered, in 2014, except for the lowest IFI category, in which none of the four municipalities had
CU BCs.
Figure 24: Municipalities of the South region with CU BCs, 2014 (Based on BCB, 2015b-g)
In the Center-West region, the coverage of municipalities with IFI scores below 0.4 was lower
than in municipalities with higher scores in 2014, as 16.7% of those municipalities had CU BCs
compared to 29.3% of municipalities with higher IFI scores. Nevertheless, each IFI category
except for the lowest one had a coverage of around 20% of municipalities.
It is clear that the distribution of credit union BCs on the IFI score is dependent on the region –
the North and the Northeast regions, already having little CU BC activity, have a lower coverage
of municipalities, and a concentration of CU BCs in municipalities with higher IFI.
It is interesting to note that the number of credit union correspondents by IFI category follows
the number of credit union seats in the category to some extent, as illustrated in Figure 25. This
is clearly the case for lower IFI-categories, but less so for higher ones.
Figure 25: Credit union correspondents and credit unions seats by IFI category, 2014 (Based on BCB, 2015c-g)

109
If one is to observe the coverage of municipalities by credit union affiliation, it becomes clear
that Sicredi-affiliated credit unions, already using BCs more than other CUs, also covered more
municipalities in all IFI categories, as illustrated in Figures 26 and 27. Appendices 37 and 38
provide detailed tables for regional comparison of CU BC location based on credit union
affiliation.
Figure 26: CU Affiliation and CU BCs by IFI category, 2014 (Based on BCB, 2015c-g)
Indeed, Sicredi affiliated credit unions had more BCs than other affiliations in each IFI-category
in 2014, and they covered more municipalities in each of them, as is also visible in Appendix 37.
Compared to BCs operated by Sicoob-affiliated credit unions and independent credit unions,
Sicredi-affiliated BCs seemed to be somewhat more focused on the higher-end of the IFI scale.
Figure 27: CU BC coverage of municipalities on IFI, by affiliation, 2014 (Based on BCB, 2015c-g)
For Sicoob-affiliated and independent CUs, the coverage of municipalities was more
concentrated on the middle of the IFI-range whereas for Sicredi it seems to be increasing along
with the IFI score. This is also illustrated in Figure 28, which shows that 45% of Sicredi BCs are
located in municipalities with an IFI score above 0.6, compared to 35% of Sicoob BCs and only

110
30% of Independent CU BCs. As a comparison, 26% of municipalities had an IFI score above
0.6 in 2014. The figures imply that in 2014, all CU affiliations mainly had BCs in more
prominent municipalities in terms of financial inclusion.
Figure 28: Cumulative distribution of CU BCs and municipalities on IFI, 2014 (Based on BCB, 2015c-g)
The difference in coverage between affiliations is also dependent on the region, as one may
easily conclude from Appendices 37 and 38. For instance, in the Southeast, Sicoob covered 71
municipalities with exclusive BCs in the IFI categories from 0.1 to 0.5 in 2014 (8% of
municipalities of the range), while Sicredi covered only one municipality (0.1%). In contrast, in
the Center-West region, Sicredi covered 29 municipalities in that range (19% of all) in 2014,
while Sicoob covered none.
4.4.3. Credit Unions’ Share of All Correspondents
In order to assess the importance of credit union correspondents in increasing access to financial
services, it is important to compare them to the overall number of correspondents in different
locations. This analysis focuses only on services III and V, as other services offered by CU BCs
are negligible.
In this analysis, only exclusive correspondents are considered, as non-exclusive ones are shared
with banks. Exclusive credit union correspondents are the ones that increase the number of
access points to financial services, and are thus more relevant when considering financial
inclusion.
4.4.3.1. Credit Unions’ Share of BCs with Bill Payments
Figure 29 below illustrates the distribution of (exclusive) banking correspondents in different IFI
categories in 2014. From the graph, one can observe that credit unions had a minority share of
BCs in all IFI categories, particularly in the municipalities with lower IFI scores. Indeed, as

111
illustrated in appendix 39, credit unions represented only 0.3% of all BCs with Inc. III in the
lowest IFI category in 2014, while they represented on average 6.7% of all BCs with this service.
Figure 29: All banking correspondents by IFI category, 2014 (Based on BCB, 2015c-g)
As the reader might expect, the share of CU BCs out of all BCs with service III was not uniform
across regions. As a matter of fact, the overall share of CU BCs out of total BCs with service III
for the North and Northeast regions was 2.1% and 0.3%, respectively, in 2014. For the
Southeast, the share of credit unions was also very low, only 3.0%. However, in the South and
Center-West regions, the share of credit unions out of all BCs with payment services is larger, as
it was 21.3% and 8.3%, respectively, for 2014.
Figure 30: All banking correspondents by IFI category in the South region, 2014 (Based on Banco Central do Brasil, 2015c-g)
Furthermore, as is illustrated in Figures 30 and 31, as well as in Appendix 39, credit unions had a
share of 25% of all BCs with service III in the municipalities of the 0.0-0.5 IFI range in the
South region, which is already considerable. In the South, the share of credit unions out of all

112
BCs was lower than 20% only in municipalities with an IFI score above 0.7, as well as in the
lowest category (which had only four municipalities).
Figure 31: Credit union BC share of total BCs with Inc. III, 2014 (Based on BCB, 2015c-g)
When it comes to the affiliation of credit unions, it is evident that Sicredi also had the largest
share of all BCs with Inc. III in 2014, since they had so many more BCs than other affiliations.
This was true for all IFI categories in 2014, as visible in Figure 32 below.
Figure 32: Credit union share of total BCs with Inc. III by affiliation, 2014 (Based on BCB, 2015c-g)
Nevertheless, as suggested by Figure 33 and detailed in appendix 39, Sicredi was superior to
other affiliations only in the South and Center-West regions, while Sicoob represented a slightly
larger share of BCs with service III in both the North and Southeast regions in 2014.

113
Figure 33: Share of total BCs with Inc. III by region by affiliation, 2014 (Based on BCB, 2015c-g)
4.4.3.1. Credit Unions’ Share of BCs with Credit Proposals
While credit union correspondents represented a decent share of all BCs with payment services
in 2014 in some areas, this can hardly be said for credit proposals. As table 22 suggests,
exclusive credit union correspondents with service V represented only 0.1% of all BCs with this
service in the South region. Furthermore, these correspondents were mostly located in
municipalities with an IFI score above 0.6. This implies that this service is very marginal even in
the South region, where credit unions generally are well represented among correspondents.
It has to be noted that this analysis only considers Sicredi correspondents in the South region, but
this is justified by the fact that only two BCs with service V were not Sicredi-affiliated, and only
two Sicredi correspondents with this service were not located in the South region.
Table 22: Credit union share of all BCs with service V in the South region, 2014 (Based on BCB, 2015c-g)
0 - 0,1 4 0 0,0 % 0 0,0 %
0,1 - 0,2 141 1 0,7 % 1 0,7 %
0,2 - 0,3 356 0 0,0 % 0 0,0 %
0,3 - 0,4 665 0 0,0 % 0 0,0 %
0,4 - 0,5 956 0 0,0 % 0 0,0 %
0,5 - 0,6 1394 0 0,0 % 0 0,0 %
0,6 - 0,7 2195 4 0,2 % 1 0,0 %
0,7 - 0,8 2850 13 0,5 % 7 0,2 %
0,8 - 0,9 3716 16 0,4 % 6 0,2 %
0,9 - 1 7952 55 0,7 % 4 0,1 %
Total 20229 89 0,4 % 19 0,1 %
All BCs All CU BCs CU BC Share Exclusive CU BCs
Exclusive CU BC
ShareIFI class
Sicredi share of all BCs with service V in the South region

114
4.4.4. Municipalities with Significant Share of Credit Union Correspondents
In this subsection, the share of credit union correspondents out of total is observed at the
municipal level, and the number of municipalities with a significant share is counted for each IFI
category. In this analysis, a share of 25% or above is considered significant.
4.4.4.1. Municipalities with Significant Presence of CU BCs with Bill Payment
There are several municipalities in each region of Brazil, where credit unions have a significant
share of all BCs for payment services. Appendices 40 and 41 present detailed tables of this issue.
Overall, there were 14 municipalities in the North region and 2 municipalities in the Northeast
region, where credit union BCs represented over 25% of all BCs with service III in 2014. These
municipalities represented an insignificant share of all municipalities in their respective regions,
though. However, the number of municipalities with an important presence of CU BCs increases
when moving south. Indeed, in the Southeast region, 105 municipalities (6% of total) had a share
of CU BCs exceeding 25% of total. In the South, there were already 492 such municipalities,
representing 41% of all municipalities of the region. In the Center-West, 17% of all
municipalities, or 79 municipalities, had a share of CU BCs exceeding 25% for service III in
2014. In total, there were 692 such municipalities in Brazil in 2014.
These figures also vary by IFI class. Interestingly, in the South region, over 46% of
municipalities with an IFI score from 0.0 to 0.3 had a share of credit union correspondents above
25% in 2014. In the Center-West, this figure was around 15.6%, while it was 7% for the
Southeast. An equally interesting figure to observe is the number of municipalities where credit
union correspondents represent half or more of BCs with service III.
Figure 34: Share of municipalities with CU BC majority for Inc. III by region, 2014. (Based on BCB, 2015c-g)

115
Figure 34 above depicts the municipalities in each region, where CU BCs represent 50% or more
of all BCs with service III. As illustrated in the graph as well as in Appendix 40, there were 5
such municipalities in the North-region, zero in the Northeast, 51 in the Southeast, 224 in the
South, and 33 in the Center-West, adding up to a total of 313 for Brazil. While this represents
only 6% of Brazilian municipalities, the role of credit union correspondents for the availability of
payment services in such municipalities cannot be neglected. These municipalities would have
half or less the BC access points to this service without CU BCs. As usual, the prevalence of
municipalities with CU BC majority for Inc. III in 2014 was particularly high in the South, where
19% of municipalities fell into this category. The distribution of such municipalities on the IFI in
2014 is illustrated in Figure 35.
Figure 35: Municipalities where CU BCs represent 50% of more of all BCs with Inc. III, 2014 (Based on BCB, 2015c-g)
Figure 36 presents the distribution of municipalities where CU BCs represent 50% of more of all
BCs with payment services in the South region in 2014. One may observe that in the South
region, in 2014, 49 municipalities, or 28% of all municipalities with an IFI score between 0 and
0.3 had a majority of CU BCs for payment services.
Figure 36: Municipalities where CU BCs represent 50% or more of all BCs with Inc. III, 2014 (Based on BCB, 2015c-g)

116
When observing the number of municipalities with CU BC majority by affiliation, one can note
that once again, Sicredi-affiliated credit union BCs had the majority in most municipalities. This
can be observed from Appendices 40 and 41, as well as from Figure 37 below.
Figure 37: Municipalities where CU BCs represent 50% or more of BCs, by affiliation, 2014 (Based on BCB, 2015c-g)
While Sicredi clearly dominated in the number of municipalities where they had 50% or more of
all BCs in 2014, independent CUs and Sicoob-affiliated CUs also had the majority in several
municipalities. Sicoob had the majority in 91 municipalities, and independent credit union BCs
in six municipalities in 2014. In the Southeast region, Sicoob had the majority in 48
municipalities, while Sicredi did not have majority in any, as can be seen from Appendices 40
and 41.
Interestingly enough, as illustrated in Appendix 41, there were also municipalities where CUs
had 75% or more, or even 100% of all BCs with payment services in 2014. Indeed, there were 55
municipalities where credit unions had over 75% of BCs with payment services in 2014, of
which 39 were located in the Southeast region. Furthermore, there were 30 municipalities in
2014, where all BCs with Inc. III belonged to credit unions. These were mostly located in the
South and Southeast region, and were distributed in the middle range of the IFI category, as is
illustrated in Appendix 41. There were 21 municipalities where all BCs pertained to Sicredi-
affiliated credit unions, all of them in the South (19) and Center-West (2) in 2014. In contrast,
there were nine municipalities with only Sicoob-affiliated BCs in the same year, four of them in
the Southeast, four in the South and one in the North.
Looking at demographic data, one may observe that over 11 million people lived in
municipalities where credit unions accounted for over 25% of BCs with payment service in
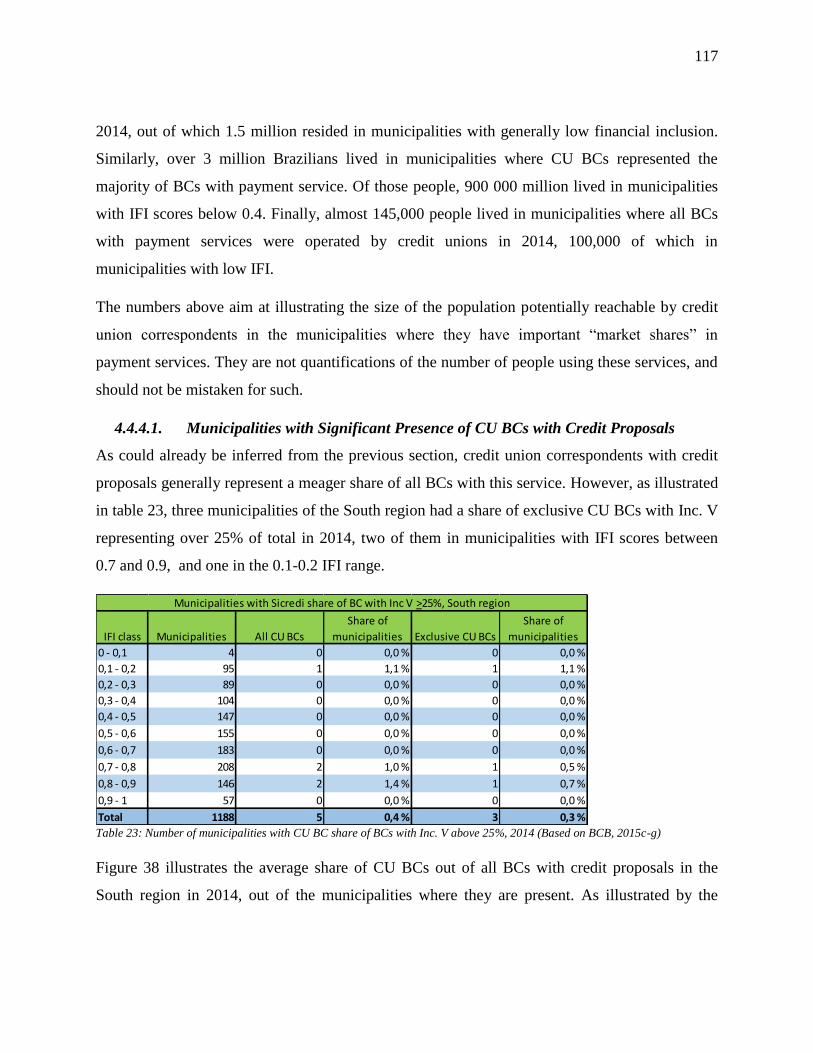
117
2014, out of which 1.5 million resided in municipalities with generally low financial inclusion.
Similarly, over 3 million Brazilians lived in municipalities where CU BCs represented the
majority of BCs with payment service. Of those people, 900 000 million lived in municipalities
with IFI scores below 0.4. Finally, almost 145,000 people lived in municipalities where all BCs
with payment services were operated by credit unions in 2014, 100,000 of which in
municipalities with low IFI.
The numbers above aim at illustrating the size of the population potentially reachable by credit
union correspondents in the municipalities where they have important “market shares” in
payment services. They are not quantifications of the number of people using these services, and
should not be mistaken for such.
4.4.4.1. Municipalities with Significant Presence of CU BCs with Credit Proposals
As could already be inferred from the previous section, credit union correspondents with credit
proposals generally represent a meager share of all BCs with this service. However, as illustrated
in table 23, three municipalities of the South region had a share of exclusive CU BCs with Inc. V
representing over 25% of total in 2014, two of them in municipalities with IFI scores between
0.7 and 0.9, and one in the 0.1-0.2 IFI range.
Table 23: Number of municipalities with CU BC share of BCs with Inc. V above 25%, 2014 (Based on BCB, 2015c-g)
Figure 38 illustrates the average share of CU BCs out of all BCs with credit proposals in the
South region in 2014, out of the municipalities where they are present. As illustrated by the
0 - 0,1 4 0 0,0 % 0 0,0 %
0,1 - 0,2 95 1 1,1 % 1 1,1 %
0,2 - 0,3 89 0 0,0 % 0 0,0 %
0,3 - 0,4 104 0 0,0 % 0 0,0 %
0,4 - 0,5 147 0 0,0 % 0 0,0 %
0,5 - 0,6 155 0 0,0 % 0 0,0 %
0,6 - 0,7 183 0 0,0 % 0 0,0 %
0,7 - 0,8 208 2 1,0 % 1 0,5 %
0,8 - 0,9 146 2 1,4 % 1 0,7 %
0,9 - 1 57 0 0,0 % 0 0,0 %
Total 1188 5 0,4 % 3 0,3 %
Share of
municipalities
Share of
municipalities
Municipalities with Sicredi share of BC with Inc V >25%, South region
IFI class Municipalities All CU BCs Exclusive CU BCs

118
graph, the average share of exclusive CU BCs out of total BCs with this service in a given
municipality did not surpass 0.5% in any IFI category in 2014.
Figure 38: Average share of CU BCs with Inc. V out of total in covered municipalities, South, 2014 (Based on BCB,2015c-g)
4.4.5. Credit Union Share of Recent Growth in Banking Correspondents
In this section, the total growth in correspondents is observed between 2007 and 2014. As
commercial banks have operated correspondents since the beginning of the last decade, and
credit unions only started joining in the market in 2008, it can be interesting to observe growth in
that period. This allows assessing the role of credit union correspondents in the total growth of
access points to these services for citizens. For credit proposals, the growth between 2011 and
2014 is observed, for this service started being adopted only in 2012. The classification of
municipalities over the IFI is kept fixed (at the 2014 values) for this assessment, as this allows
for comparison of growth over the IFI category.
4.4.5.1. Growth in BCs with Service III, 2007-2014
As illustrated in appendix 42, banking correspondents with service III increased by nearly 34,391
between December 2007 and December 2014, out of which 3,340 were operated by credit
unions. This means that credit unions contributed to 9.7% of the growth in CUs with this service
over the period. The CU share of growth in BCs with service III was the lowest in the lowest
quartile of the IFI range, 3.1% while it was 15.5% in the range from 0.50 to 0.74, as illustrated in
Figure 39.

119
Figure 39: Share of CUs out of total growth in BCs with service III, 2007-2014 (Based on BCB, 2015c-g)
As it has become logical to expect, this contribution to growth in BCs was not homogenous in
different regions of Brazil – the credit union share of total growth in BCs with this service was
30.0% in the South, while it was only 0.4% in the Northeast. This share was 3.0% in the North
and 4.2% in the Southeast. In the South region, the CU share of growth over the three lowest IFI
quartiles was rather homogenous, as depicted by Figure 40 below.
Figure 40: CU share of total growth in BC with service III in the South, by IFI category, 2007-2014 (Based on BCB, 2015c-g)
Figure 41 below illustrates the growth in the number of municipalities with a majority of CU
BCs for service III from 2011 to 2014. The figure illustrates that CU BCs kept on increasing
their importance in certain municipalities – over a three year-period, the number of
municipalities with CU BC majority grew by 70, or 28.8%.

120
Figure 41: Increase in municipalities with CU BC majority for service III, 2011-2014 (Based on BCB, 2015c-g)
4.4.5.2. Growth in BCs with Service V, 2011-2014
As can be seen from Table 24 below, the number of BCs with credit proposals decreased by
2,365 in the South region between December 2011 and December 2014. At the same time, the
number of exclusive CU BC with this service increased by 19, which represents a negative
growth of 0.8%. Taking this into account, the importance of credit unions in this segment may be
somewhat larger than suggested by the plain number of CU BCs with this service.
Table 24: Credit union share of increase in BC with service V, 2011-2014 (Based on BCB, 2015c-g)
4.4.6. Credit Union BC Significance by Urbanization Rate and Municipal HDI
Finally, the share of CU BCs out of total correspondents was compared against two different
variables – urbanization rate and municipal HDI. In rural areas, people often have more
difficulties to access banking infrastructure, and tend to be more financially excluded. Likewise,
0 - 0,1 2 0 0,0 % 0 0,0 %
0,1 - 0,2 53 1 1,9 % 1 1,9 %
0,2 - 0,3 62 0 0,0 % 0 0,0 %
0,3 - 0,4 -50 0 0,0 % 0 0,0 %
0,4 - 0,5 -24 0 0,0 % 0 0,0 %
0,5 - 0,6 -3 0 0,0 % 0 0,0 %
0,6 - 0,7 -36 4 -11,1 % 1 -2,8 %
0,7 - 0,8 -383 13 -3,4 % 7 -1,8 %
0,8 - 0,9 -536 15 -2,8 % 6 -1,1 %
0,9 - 1 -1450 54 -3,7 % 4 -0,3 %
Total -2365 87 -3,7 % 19 -0,8 %
Sicredi Share of increase in BC with service V - 2011 - 2014
IFI class All BCs All CU BCs CU BC Share Exclusive CU BCs
Exclusive CU BC
Share
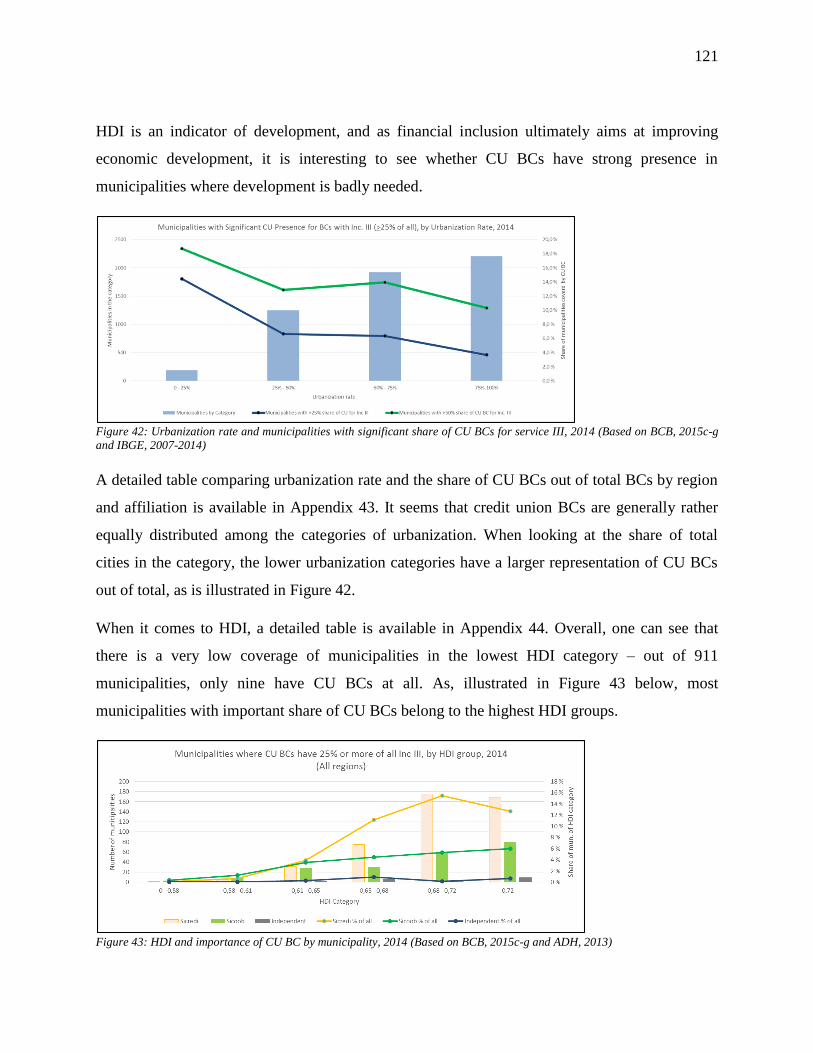
121
HDI is an indicator of development, and as financial inclusion ultimately aims at improving
economic development, it is interesting to see whether CU BCs have strong presence in
municipalities where development is badly needed.
Figure 42: Urbanization rate and municipalities with significant share of CU BCs for service III, 2014 (Based on BCB, 2015c-g
and IBGE, 2007-2014)
A detailed table comparing urbanization rate and the share of CU BCs out of total BCs by region
and affiliation is available in Appendix 43. It seems that credit union BCs are generally rather
equally distributed among the categories of urbanization. When looking at the share of total
cities in the category, the lower urbanization categories have a larger representation of CU BCs
out of total, as is illustrated in Figure 42.
When it comes to HDI, a detailed table is available in Appendix 44. Overall, one can see that
there is a very low coverage of municipalities in the lowest HDI category – out of 911
municipalities, only nine have CU BCs at all. As, illustrated in Figure 43 below, most
municipalities with important share of CU BCs belong to the highest HDI groups.
Figure 43: HDI and importance of CU BC by municipality, 2014 (Based on BCB, 2015c-g and ADH, 2013)

122
As 94% of the municipalities of the lowest HDI group are located in the North and Northeast
regions, where there is low CU activity, it is clear that the results are different when observing
different regions. Indeed, as illustrated in Figure 44, the coverage of municipalities is much more
balanced in the South region, even though only four of the 21 municipalities in the lowest HDI
categories have a significant share of BCs.
Figure 44: HDI and importance of CU BCs by municipality, South region, 2014 (Based on BCB, 2015c-g and ADH, 2013)
5. Discussion of Results
The results of the research are examined in this part of the thesis. Each step of the research
presented above will first be discussed separately, after which general conclusions of the
research are presented. For each step, significant contributions to research objectives are detailed
separately.
General Data about Credit Union Correspondents 5.1.
Credit union correspondents are clearly a marginal phenomenon in the banking correspondent
network of Brazil, but they have seen their share increase rapidly. There were 3,054 exclusive
credit union correspondents in 2014 (1.6% of all BCs), covering 1,025 Brazilian municipalities
(18.4% of all municipalities).

123
An interesting phenomenon is the rather high degree of occurrence of “multi-bank”
correspondents, or so to say non-exclusive CU BCs. These correspondents, representing around
25% of all correspondents in 2014, do not increase access to financial services for the
population, and thus only act as a potentially useful tool for credit unions.
In terms of regional distribution, it is quite clear that CU BCs are not widely present in the most
financially excluded areas of Brazil, the North and Northeast region. Instead, they are mostly
present in the more developed regions of Brazil, mainly in the South region and partly in the
Center-West and Southeast regions. This is not surprising though, as credit unions have mostly
developed in those regions of Brazil, leaving other regions in a marginal role (BCB, 2015a as
well as the World Bank and IMF, 2013).
Disappointingly, credit union correspondents are generally accredited only with bill payment
services, and in a minority of cases with credit proposals. Furthermore, only nine correspondents
had more than one service assigned to them in 2014, which means that most correspondents
focus on only one service – bill payments. This shows that credit union correspondents, as of
2014, were mainly used for transactional services – even more so than BCs of traditional banks.
Out of all banking correspondents, around 46% were accredited with credit proposal services in
2014, compared to only 3% of credit union correspondents in the same year. Moreover, other
relational services such as savings or investments were practically nonexistent.
This fact not only limits the extent to which CU BCs improve financial inclusion, but also
shatters prospects of credit unions performing better than banks at distributing relational services
through this channel. The sheer fact that there are almost no credit union correspondents with
account opening services implies that credit unions do not use this channel to attract new
members. This observation credits the findings of Ramos and Kovaleski (2011) as well as the
comments of Coelho (2013), although it does not allow making judgements on the intentions of
credit unions.
Nevertheless, one cannot deny the role of transactional services in financial inclusion - as
Sanford and Cojocaru (2013) report, facilitating bill payment often translates to decreasing both
cost and time required for this activity. Therefore, credit union correspondents still can improve
financial inclusion to some extent, while not being as diversified as most regular BCs. The

124
importance of this improvement can be seen to depend on the general availability of payment
services in the municipality, as was studied in the fourth part of the analysis.
Furthermore, the CU BC network seems to be slowly improving, as the growth of banking
correspondents with service V was much higher than that of other services between 2012 and
2014, which could be seen as a marginal yet rapid movement towards relational services. As
most CU BCs with this service were located in the South region in 2014 and operated by Sicredi-
affiliated CUs, the case study of this thesis is particularly relevant for this analysis.
Only around 18% of credit unions active in 2014 had correspondents. Interestingly, most of these
credit unions were free admission CUs, pertaining either to the Sicredi or Sicoob networks. Free
admission credit unions are likely to be able to accommodate correspondents the easiest, as
retailers can become members of the CU, as was implied by the case study in Panambi, as well
as the research of Ramos and Kovaleski (2011). Furthermore, at least in theory, free admission
credit unions, lacking a common bond requirement, are also the most able to attract new
members through correspondents, as anybody can join.
In general, Sicoob has the largest networks in the North, Northeast and Southeast regions, while
Sicredi dominates in the South and Center-West regions. Interestingly, 80% of Sicredi-affiliated
credit unions in the South region operated correspondents in 2014, while 30% of the ones in the
Southeast did. For Sicoob, the respective figures were 35% and 55%. It would be interesting to
understand why more credit unions chose to use BCs in the South compared to the Southeast,
which is a similar region in terms of financial inclusion and economic development.
In 2014, 200 credit unions had BCs, which represented 17.5% of all credit unions active in that
year. However, only 40 of those CUs had more than 30 BCs, while the majority had up to 10
BCs. Few credit unions have large networks of correspondents; BCs are rather used on a small
scale. In contrast, 85 credit unions used PAEs in 2014. These electronic access points can be
seen as a higher-quality substitute to BCs in cases where the latter offer only bill payment
services. It is interesting to notice that these access points were mostly used by CUs in the
Southeast region in 2014, and not at all in the South. For Sicoob, the number of PAEs could
surpass the number of BCs in a few years, if the growth rate remains the same. Sicredi operated
no such access points in 2014, but based on the case study, they already used them in 2015.
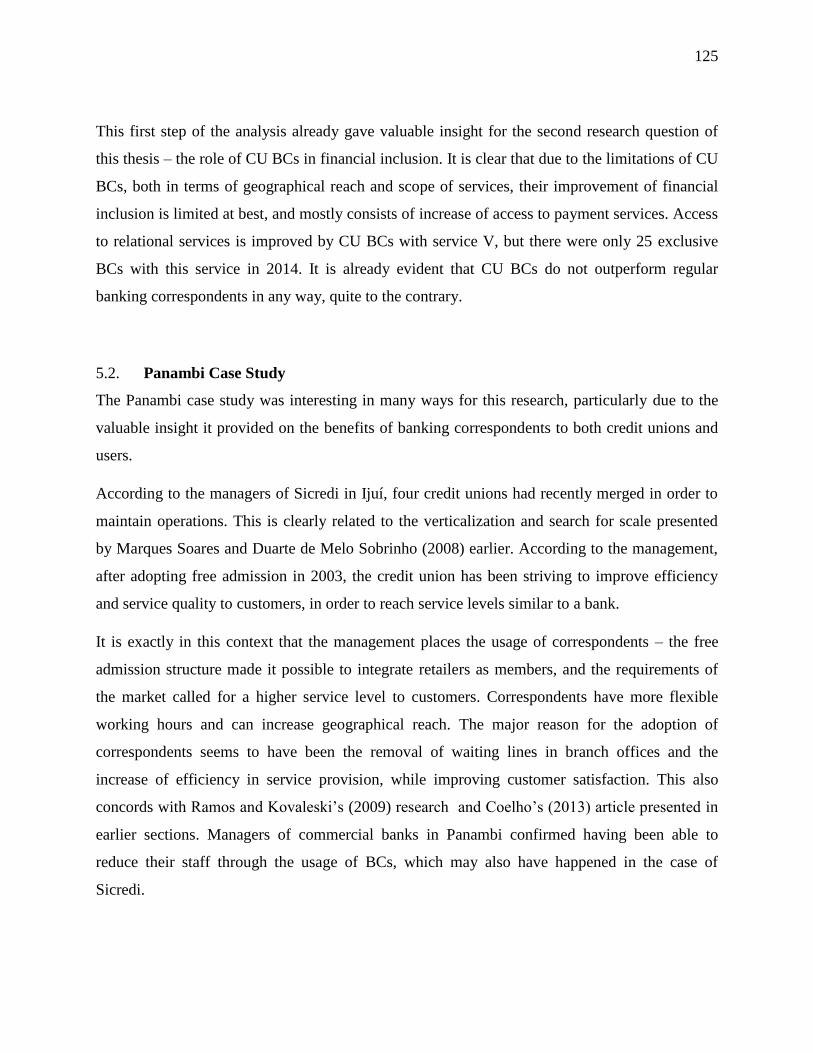
125
This first step of the analysis already gave valuable insight for the second research question of
this thesis – the role of CU BCs in financial inclusion. It is clear that due to the limitations of CU
BCs, both in terms of geographical reach and scope of services, their improvement of financial
inclusion is limited at best, and mostly consists of increase of access to payment services. Access
to relational services is improved by CU BCs with service V, but there were only 25 exclusive
BCs with this service in 2014. It is already evident that CU BCs do not outperform regular
banking correspondents in any way, quite to the contrary.
Panambi Case Study 5.2.
The Panambi case study was interesting in many ways for this research, particularly due to the
valuable insight it provided on the benefits of banking correspondents to both credit unions and
users.
According to the managers of Sicredi in Ijuí, four credit unions had recently merged in order to
maintain operations. This is clearly related to the verticalization and search for scale presented
by Marques Soares and Duarte de Melo Sobrinho (2008) earlier. According to the management,
after adopting free admission in 2003, the credit union has been striving to improve efficiency
and service quality to customers, in order to reach service levels similar to a bank.
It is exactly in this context that the management places the usage of correspondents – the free
admission structure made it possible to integrate retailers as members, and the requirements of
the market called for a higher service level to customers. Correspondents have more flexible
working hours and can increase geographical reach. The major reason for the adoption of
correspondents seems to have been the removal of waiting lines in branch offices and the
increase of efficiency in service provision, while improving customer satisfaction. This also
concords with Ramos and Kovaleski’s (2009) research and Coelho’s (2013) article presented in
earlier sections. Managers of commercial banks in Panambi confirmed having been able to
reduce their staff through the usage of BCs, which may also have happened in the case of
Sicredi.

126
A contradictory element of the interviews was the fact that the management first claimed to want
to increase geographical reach with correspondents, but later affirmed that correspondents need
to be located close to a credit union branch in order to facilitate closing the accounts. Generally,
the management’s way of speaking about correspondents alternated between a discourse on
optimal customer service and search for efficiency for the credit union. The impression gotten
was that the management was trying to embellish the real motive of BC usage – the improvement
of efficiency and increase of profits.
This was equally the case for BCs with credit proposals – the management first confirmed using
them in order to improve access to car finance, but later stressed the ability to cross-sell products
such as insurance as the primary reason for their usage. Be that as it may, this service is solely
available at certain car dealers and promotes only credit for cars. A quick search through the
correspondent database indicates that the vast majority of all CU BCs with this service are
garages or car dealers, implying that this may be a general Sicredi policy for this service. Credit
proposals, while already marginal in size, are not used for economically productive activities
such as finance for MSMEs. Nevertheless, one may rightfully argue that people need vehicles to
go to work, especially in rural areas, implying that this service is not completely without impact
on people’s quality of life. Nonetheless, as these services are apparently only offered to existing
CU members, they do not really improve access to financial services for anyone else, as the car
dealers do not attract new members.
In the light of the case study, Sicredi das Culturas (and perhaps all Sicredi-affiliated credit
unions) could be seen as an example of a credit union that has “compromised its social mission”
due to growth, as exemplified by Axworthy (1981) and Cazella and Búrigo (2009). The mayor of
Panambi, as well as some of the managers of local banks saw Sicredi as just another commercial
bank without any important role in community development usually attributed to credit unions.
Membership in Sicredi had become significantly easier to acquire due to growth aspirations, as
had been the case in Canadian credit unions in the 1970s (Axworthy, 1981).
While correspondents in 2015 were only limited to processing bill payments and in some cases
credit proposals, the management affirmed having the intention to increase the scope of services
by the end of the year. A constrain to the increase of scope that was mentioned was the

127
limitedness of the technological platforms used by Sicredi das Culturas – they were based on an
intranet and a code reader, and transactions were made in cash only.
Mas (2009) explains banking correspondents as a phenomenon partly made possible through the
development of banking technology in Brazil. As Marques Soares and Duarte de Melo Sobrinho
(2008) explain, credit union management in Brazil is generally archaic and lacks forward
planning and rationality. It is possible that most credit unions, particularly independent ones, do
not even possess clearing technology allowing them to use correspondents. The Sicredi and
Sicoob networks are viewed as resembling commercial banks the most (Cazella and Búrigo,
2009), and their technological platforms may therefore generally be of higher quality, allowing
them to use this distribution channel.
On a similar note, the apparent focus of Sicredi and Sicoob affiliated credit unions on
transactional services can be seen as an embracement of the “fifth wave of banking technology”
(Cernev, Diniz and Jayo, 2009), aiming at outsourcing low value-added services to free space
from branch offices. Nonetheless, it is unclear whether credit unions without correspondents are
even willing to outsource bill payment, as they may not be dealing with the sort of waiting line
problem presented in this case and mentioned by Coelho in his article (2013). Finding out the
real state of things would require a further study of several credit unions.
Anyhow, the case study revealed that the technological platform of Sicredi, despite being
potentially better than that of most credit unions, was still not advanced enough to tap the full
potential of the BC distribution model. This limitation not only restrained the scope of services
of BCs, but also the bill payment activity itself, as payment was done in cash only, requiring
correspondents to keep significant cash balances. Moreover, daily limits of transactions were set
low due to this constrain, further confining the usage of payment services.
Apart from technological impediments to enlarging scope, Sicredi mentioned the requirement to
educate correspondents. Interestingly, Sicredi affirmed working together with correspondents in
order to develop “the brand”, and to offer more services in the future. The future purpose of
correspondents, according to the Sicredi management, was to find new members. An intriguing
point made by the management was the fact that their correspondents, as members of the credit
union, have incentives to increase profits to the CU, as surplus is shared among members. If and

128
when technological and education barriers are removed, this alignment of incentives could result
in a distribution model superior to that of banks’ BCs. If credit unions are able to gather new
members through correspondents, it could be a good way for the credit union to improve
financial inclusion through growth. Nevertheless, the materialization of this advantage would
need to be studied in practice.
When it comes to the improvement of financial inclusion, it was interesting to see that most users
paying bills at correspondents were satisfied with the service, particularly due to the saved
transportation time and easiness offered by this solution. Lives of those people had become
easier through the CU BC, even though it offered only bill payment. This is particularly
interesting when taking into account the fact that both Panambi and Ijuí had IFI scores of around
0.9 in 2014, and payments could only be made in cash. If payment services can facilitate many
people’s lives in a municipality with relatively high financial depth, it implies that CU BCs can
in general have some sort of impact in all municipalities, despite their limitation in scope.
Indeed, travelling in order to pay bills costs time and money that can be better allocated.
Despite the current usefulness of BCs with payment services, Ivatury (2007) and the Central
Bank of Brazil (2015a) see that banking correspondents offering only transactional services may
be quickly replaced by mobile or online banking services, or simply be forced to close due to
competition from correspondents with wider scopes of services.
The interviews conducted in Panambi gave valuable insight for answering both research
questions of this thesis. Firstly, correspondents are useful for credit unions in that they decrease
waiting lines, increase geographical reach and can be opened longer, thus increasing customer
satisfaction. Furthermore, correspondents save costs in the sense that low value-added services
can be outsourced to a third party that is paid on a per-transaction basis. It can thus be said that
the motivations of credit unions to open correspondents are rather operational and very similar to
the reasons for which commercial banks adopted these distribution channels. It is therefore
particularly interesting to note that both Sicredi and Sicoob, the most bank-like credit union
groups, have been on the front line of CU BC adoption. It remains unclear whether most credit
unions are unable to operate BCs due to technological limitations, or unwilling to do so in the
first place.
129
In terms of improvement of financial inclusion, the Panambi case showed that even in
municipalities with relatively high financial depth, increase of access points to payment services
can facilitate everyday life. When it comes to credit proposals, being limited to car financing,
they only cater to a limited group of people with a very restricted service portfolio. Despite the
generally extensive microcredit portfolio of credit unions (Gonzalez and Brito, 2013) and the
large credit expansion of the sector in the last years (Banco Central do Brasil, 2015a), visibly no
credit was distributed through CU BCs. Credit unions, as of 2015, seemed unable to apply their
expertise in finance of proximity to this distribution channel. Notwithstanding, the interviews
gave hope that credit union correspondents could see their role in financial inclusion increase in
the future.
Credit Union Financials 5.3.
When looking at relations between credit union financials and the usage of correspondents, most
important correlations were found with ROE, ROA, size and coverage with services. No
relations with other ratios judged important for CU survival by De Carvalho et al. (2011) were
found, such as investment in credit operations, treasury investments, or funding by LT deposits.
All of the indicators with which relations were found can be seen to be related to efficiency in
one way or another. Indeed, the size of a credit union is important in order to increase scale, as
was noted by Garcia and Villa Lhacer (2012) – scale allows to save costs and increase
profitability. Similarly, coverage with services refers to the ability of a credit union to cover
structural costs with service revenue, and thus to improve the bottom line. Similarly, both ROE
and ROA are measurements of profitability, which could be seen as the outcome of operational
efficiency.
The usage of correspondents was correlated with these ratios, implying that it could also be
related to increased efficiency of credit unions. Correspondents were in general more used by
large credit unions with rather high profitability. Overall, while causality could not be proven, if
cooperatives were used by efficient credit unions, it implies that they were a result of careful
management thinking. Nevertheless, as already discussed, the correlations may also be explained
through the technological platforms used by efficient CUs, which make it possible to contract
130
correspondents. Furthermore, large credit unions may be more likely than small ones to have
issues with waiting lines, and therefore more prone to outsource part of their services. As
formerly mentioned, this mystery remains unraveled in this research.
The correlations were generally most important for free admission credit unions, as well as for
Sicredi-affiliated CUs, while they were weak for others. For Sicoob and mutual credit CUs, for
example, the correlations were notably weaker. Indeed, based on the correlations, it seems that
generally the most profitable free admission or Sicredi-affiliated CUs had BCs, while this was
not necessarily the case for Sicoob-affiliated or mutual credit unions. However, free admission
credit unions were generally the most profitable, and most of them used BCs. Out of Sicredi-
affiliated CUs, around 80% were free admission credit unions, while this ratio was only 55% for
Sicoob in 2014. This certainly could explain why correlations were stronger for Sicredi. Free
admission credit unions, being more able to rapidly increase scale than other types of CU, are the
most likely to remain competitive and “survive” the rationalization of the sector documented by
Marques Soares and Duarte de Melo Sobrinho (2008) and the BCB (2015a).
Credit unions that adopt free admission may easily contract BCs to improve efficiency and
increase reach. As explained by Marques Soares and Duarte de Melo Sobrinho (2008), credit
unions need to improve their cost management. This was also stressed by De Carvalho et al.
(2011) and Garcia and Villa Lhacer (2012). Credit union correspondents may allow decreasing
costs through the decrease in staff, while yielding revenue from bill payment to cover a part of
structural costs.
In relation to the first research question of this thesis, this step of the research could not directly
establish causality between BC usage and “usefulness”. Nevertheless, the evidence gives reasons
to believe that generally more profitable and more efficient credit unions tend to use banking
correspondents, implying that they view them as useful for something. There is also reason to
believe that BCs improve efficiency, as was explained by managers in Panambi, and that they
would therefore be used by CUs willing to professionalize the management of the cooperative.
BCs could be seen as part of the “rationalization” movement of the credit union sector presented
by Marques Soares and Duarte de Melo Sobrinho (2008). However, one needs to consider the

131
fact the correspondents may only offer benefits to large credit unions, while they may not be
financially sustainable for smaller ones.
Correspondents by Municipality 5.4.
It is already clear that the main purpose of CU BCs is not to improve financial inclusion but
rather to improve the efficiency of credit union management and quality of service. Moreover,
the contribution of credit unions to financial inclusion, at least in 2014, limited itself to the
increase of POAs to payment services, and to a much lesser extent to the increase of access to car
finance in some municipalities.
Notwithstanding, it is apparent that credit union correspondents with payment services can still
be relevant for people’s lives, also in municipalities with relatively good financial infrastructure
such as Panambi and Ijuí. Their importance is likely to be larger in municipalities with low
financial depth, as there are less other options for bill payment. The IFI computed for the
purposes of this research, despite its limitations, allowed to compare Brazilian municipalities in
terms of access to (and usage of) financial services.
CU BCs are generally located in municipalities with higher IFI scores, but there were still 500 of
them in 252 municipalities with IFI scores below 0.4, representing 8% of municipalities in this
category. This phenomenon is clearly marginal, but potentially relevant at the local level.
Outside of the North and Northeast region, credit union correspondents are generally also present
in municipalities of the lowest IFI categories.
The concept had been relatively successful in the South region, where up to 55% of
municipalities with low IFI (below 0.4) had CU BCs in 2014 and where CUs had accounted for
31.3% of growth in BCs with service III between 2008 and 2014. Both figures are considerable,
taking into account the generally low scale of the CU BC phenomenon. In around half of the
“low IFI” municipalities of the South, CUs represented 50% or more of all BCs with payment
services. In this region, credit union correspondents had also reached importance in rural
municipalities as well as municipalities with low HDI.

132
Credit union BCs for payment services are a marginal phenomenon, but have undeniable
importance for the everyday reality of part of the population of the 692 municipalities where they
represent 25% or more of those access points, half of which are located in municipalities with
low IFI. Furthermore, their importance can be seen to be even larger in the 313 municipalities
where CUs represent 50% or more of all BCs with payment service, and even the 30
municipalities where there are only CU BCs for this service. This is significant for the role of
CUs in improving access to payment service in those regions, as it lowers transaction costs for
the people living in those municipalities.
In contrast, CU BCs with credit proposals had reached significant importance in only three
municipalities in 2014, and even those were car dealers offering credit for personal vehicles. The
contribution of credit union correspondents to the promotion of relational services remained
close to zero in 2014. Despite its high growth in recent years, the service was confined to car
dealers as of 2014.
This last step of the analysis yielded valuable understanding for answering the second research
question of this thesis, concerning the relation of CU BCs and financial inclusion. Indeed, even
though the service scope of CU BCs was limited to services III and V in 2014, they could be
seen to have some impact on the everyday life of citizens of several municipalities.
As illustrated in the previous section, in 2014, several million Brazilians lived in municipalities
where credit unions had important shares of all BCs with payment services, many of which in
municipalities with low general availability of financial services, as conveyed by the IFI. While
the improvement of financial inclusion brought by credit union BCs is very limited and concerns
but a fraction of Brazil’s population, it may be considerable at the local level. Bill payment
service does not play a major role in economic development, but its role in the facilitation of
everyday life in financially excluded communities is non-negligible. The exact number of people
impacted by the proliferation of credit union correspondents could not be measured in the
framework of this thesis, but there may well be hundreds of thousands of them.

133
6. Conclusions
This thesis had a dual research objective - firstly, to understand the usefulness of banking
correspondents for credit unions, and secondly, to assess the potential improvement of financial
inclusion ensuing from the usage of credit union correspondents in Brazil. Both research
questions were answered with the means available for this research, and it is possible to draw
some conclusions.
Usefulness of Credit Union Correspondents 6.1.
With respect to the first research question, it is clear that banking correspondents are useful for at
least a part of active credit unions. Very much like commercial banks, some credit unions use
banking correspondents as a low-cost distribution channel that liberates capacity for higher
value-added services at branch offices. Furthermore, correspondents are a way for credit unions
to increase geographical reach. As of 2014, correspondents were mostly used by credit unions
affiliated to networks that are viewed as resembling banks the most – Sicredi and Sicoob. Out of
those networks of credit unions, mostly free admission credit unions use correspondents. Credit
unions pertaining to networks traditionally more focused on the educational and development
mission of the credit union movement, such as Ancosol, did not use correspondents in 2014.
Nevertheless, it may also be that these credit unions did not have the required ICT-platforms to
use correspondents, or they might not even suffer from the excessive waiting lines that have led
other CUs to adopt this solution.
Comparison of credit union financials and usage of banking correspondents over the period from
2012 to 2014 gave indications that correspondents are generally adopted by the largest, most
profitable and most efficient credit unions. In this respect, it appears that correspondents play a
role in the process of rationalization of the credit union sector in Brazil, whereby credit unions
seek ways to ensure their survival through the improvement of efficiency and increase in scale.
In this process, correspondents are seemingly a way to streamline credit unions’ processes, and

134
the fact that most profitable credit unions use them implies that they are viewed as an important
tool for improving efficiency.
The answer to the first research question is that using correspondents is useful for credit unions,
in particular for the largest ones, as a means to improve operational efficiency and profitability.
Simultaneously, smaller credit unions may not see the benefits in using correspondents.
Nevertheless, those credit unions may also not be able to use correspondents due to technological
constrains, or they may not face the same challenges as larger credit unions in terms of
operational capacity.
Credit Union Correspondents and Financial Inclusion 6.2.
When it comes to the second research question, the answer is somewhat ambiguous. In the
newest related report of the Central Bank of Brazil (2015a), financial inclusion is observed over
three dimensions: availability (or access), usage and adequacy (influence on quality of life) of
financial services. This framework can be adapted to assess the contribution of credit union
correspondents to financial inclusion.
In relation to the access to financial services, credit union correspondents mostly provide access
to bill payment services, and to a lesser extent to car financing. Furthermore, credit union
correspondents are mostly located in the South region of Brazil, and partly in the Center-West
and Southeast regions. The North and Northeast regions, which generally encompass the least
developed and most financially excluded areas of Brazil, together have less than three percent of
all correspondents. It may thus be said that credit union correspondents are limited both in scope
and geographic reach when compared to traditional banking correspondents, and are thus
definitely not better than traditional banking correspondents in any way. The competence of
credit unions in finance of proximity did not manifest itself in the usage of correspondents, at
least not as of 2014. However, it may be noted that the distribution channel shows some
potential for future development.
While credit union correspondents generally represented less than two percent of all banking
correspondents in 2014, in terms of bill payment they had reached certain importance. There

135
were in general over 1,000 municipalities in Brazil with credit union correspondents in 2014.
Over half of all municipalities of the South region had credit union correspondents with payment
services in that year, and they represented over 25% of all correspondents with this service in
41% of municipalities of the region. Overall, there were 692 such municipalities in Brazil, 200 of
which had low financial depth in 2014. The analysis also demonstrated that in around 300
municipalities, half or more of BCs with payment service were operated by credit unions. The
population reached by these access points may be counted in millions, although further research
is needed.
The analysis also showed that the number of municipalities with an important share of credit
union correspondents had been increasing over the period from 2012 to 2014, and it has
potentially continued doing so over subsequent years.
Overall, it can be said that relative to their size, credit union correspondents had a rather
important role in improving access to payment services in certain regions of Brazil, managing to
reach also the most financially deprived municipalities of the South and Central-West regions.
When it comes to correspondents with credit proposal services, despite their rapid growth over
the period from 2011 to 2014, they remained a very marginal phenomenon. These
correspondents were mostly constrained to the municipalities of the South region with the
highest financial depth, and appeared to provide only personal vehicle finance for existing
members of Sicredi.
This research did not yield or have access to quantitative data allowing to assess the level of
usage of the financial services provided by credit union correspondents. Nevertheless, the
interviews conducted in Panambi, as well as the sheer growth in usage of financial services give
indications that there is a large demand for payment services in Brazilian municipalities. This
follows from the fact that the majority of the population does not use internet banking, which
would allow easily performing such transactions.
In terms of adequacy of financial services (and their impact on quality of life), it is clear that the
limited scope of services of credit union correspondents restrains their contribution to the
provision of relevant services to citizens. However, as the interviews conducted in Panambi

136
revealed, people generally found the availability of payment services to increase their quality of
life through added convenience and decreased travel times. Certainly, in municipalities where
CU BCs have an important share of BCs for payment services, credit union correspondents
provide some level of improvement to quality of life.
Credit union correspondents with credit proposal services, in turn, provide a very limited service
that is adequate only for people willing to get credit for purchasing a car. While this may be
relevant at the individual level, it offers a very small improvement of quality of life overall,
particularly since credit is granted to existing CU members only. These BCs do not provide
microcredit to small scale entrepreneurs in Brazil, a service that could truly improve the quality
of life of many people.
To resume the answer to the second research question of this thesis – as of 2014, credit union
correspondents, despite limitations in scope and geographic reach, could be seen to improve
financial inclusion to some extent. This improvement was limited to bill payment, but was likely
to be relevant to the everyday life of citizens of several hundred Brazilian municipalities.
However, due to their limitations, credit union correspondents could not be said to be better than
their commercial bank counterparts in any way, quite to the contrary.
Furthermore, it is clear that most credit unions, particularly the Sicredi and Sicoob-affiliated
ones, do not contract correspondents in order to improve financial inclusion of the population,
but rather in order to improve their own efficiency. The limited improvement of financial
inclusion ensuing from this practice is simply a by-product of the search for efficiency. Credit
unions most concerned about economic development and financial inclusion, such as the ones
pertaining to the Ancosol network, did not use correspondents at all as of 2014, for reasons that
were not researched in this thesis.
Final Considerations 6.3.
An interesting issue noted in the case study in Panambi was the fact that technology was a major
bottleneck in the development of the credit union correspondent network. However, the
137
interviews conducted in Panambi gave reason to believe that the scope of services could be
enlarged in the near future.
Correspondents could be used to attract new members in the future. At least in theory, credit
union correspondents have shared interests with credit unions to promote relational financial
products. This is due to the fact that, as credit union members, correspondents can get their share
of the surplus generated by the union, which is not the case for regular banking correspondents.
If credit unions manage to surpass technological and educational bottlenecks, this could be an
interesting growth path for credit unions in the future, particularly for free admission ones.
However, it needs to be noted that credit union correspondents might see their services become
obsolete through the proliferation of online and mobile banking solutions in Brazil, particularly if
scopes of services are not enlarged to include more complex, relational services, such as
(productive) credit and insurance. Furthermore, if the service quality of credit union
correspondents does not reach higher levels than those of bank BCs, they might always remain
“the second best option” for customers, as regular BCs appear to be. Additionally, credit union
correspondents may be difficult to educate well enough to be able to overcome the information
asymmetry inherent to financial services directed at low-income population groups.
Limitations of the Research 6.4.
Seven limitations of this thesis may be identified, some of which have already been introduced
throughout the thesis. The first and perhaps most important one is the potential inaccuracy of
correspondent registration information in the database obtained for the research. This limits the
relevance of longitudinal analysis of the BC data, and casts some doubt over the accuracy of
results obtained, even for 2014.
The second limitation is related to the fact that credit union affiliation was only considered for
2014, meaning that longitudinal analysis of banking correspondents by affiliation may be
somewhat inaccurate.
The third limitation is related to the Panambi- case study. The interviews conducted for the study
were limited to one credit union, active in a micro-region with relatively high financial depth.

138
This may limit the generalizability of results. Nevertheless, it is important to note that this credit
union represented Sicredi, the network with the highest number of banking correspondents over
the past years. However, the extent to which the network affects credit union policies regarding
BCs remains unclear.
The fourth limitation, still related to the interviews, is the fact that they were analyzed based on
audio recordings and notes, which makes it challenging to interpret non-verbal communication
and context. Moreover, the truthfulness of interviewed credit union managers cannot be
confirmed, as they certainly have incentives to embellish the aspirations underlying their
strategic decisions.
The fifth limitation is related to the correlation analysis of credit union data, in particular to the
potential lack of independence of observed variables. As the variable used for correlations was
“BC Intensity” [nBC/log(assets)] and not simply the number of correspondents, the variables are
not entirely independent, particularly when observing the relation between BC Intensity and CU
Size. Nevertheless, the relations obtained seemed to be similar when using only the number of
BCs. Using BC Intensity instead of the absolute number of BCs was judged relevant in order to
take the size of the CU into account, as 10 correspondents could be a lot for a small CU, while
being little for a large one.
The sixth limitation is related to the municipal IFI score computed in the framework of this
research. This model does not allow comparisons between years, due to the methodology used to
correct municipal values of credit and deposits. In addition, the weights assigned for the IFI
strongly affect the results. Notwithstanding, the index allowed comparing Brazilian
municipalities in relation to each other, which gave valuable information when comparing the
location of BCs.
The seventh limitation of this study is the fact that the exact locations of credit union
correspondents within municipalities were not assessed, which does not give an accurate image
of the true saving in transactional costs brought to the population by the correspondents.

139
Avenues for Future Research 6.5.
Several potential paths could be explored in order to deepen understanding of credit union
correspondents and overcome limitations of this thesis.
A future research could reach more pertinent results by engaging in a case study of multiple
credit unions in different regions of Brazil, using internal BC registration data and financials
over a longer period. This sort of study could involve credit unions of different affiliations and
types with and without correspondents. A case study based on surveys, focus groups and
analyses of financials with such a sample could be particularly pertinent to reveal the reasons
that lead to the adoption of correspondents by credit unions, as well as to the usefulness of
correspondents to the institutions. Such a study could also reveal the role that technological
platforms play in the decision of credit unions to open banking correspondents. Furthermore, it
would be interesting to understand how the practicalities of the “BC contract” differ between
different types of credit unions – such as between rural and free admission ones.
Another interesting type of study would be to follow the way Sicredi “develops” its relationship
with its correspondents, and whether or not they manage to build an effective distribution
channel for promoting relational services through the BC. A topic of interest would be to assess
the level of shared profits potentially gained by the BC member, in order to evaluate whether this
sort of partnership truly has better potential for aligning incentives of the institution and the
correspondent, as was claimed by the CU managers interviewed in the framework of this thesis.
An third, minor type of study could involve a survey of credit unions to find out reasons for the
closing of correspondents. Since 2003, 20% of all opened credit union correspondents have been
closed for reasons unspecified in the registry database. This information could yield valuable
information on the nature of partnerships between credit unions and retailers or other actors
operating as correspondents.
A fourth type of study could improve the understanding of the impact of credit union
correspondents with payment services through a detailed study of the location of BCs. This could
be done using geocoded data, and would entail assessing the proximity of these banking
correspondents to financial infrastructure with similar services. Such an analysis would allow

140
identifying the areas in which credit union correspondents are truly decreasing distance to
payment services for the population.
All in all, it may be said that there is still room for increasing knowledge of this little understood
phenomenon of the Brazilian correspondent network. The general importance of branchless
banking and the promise of the credit union sector for financial inclusion in the world’s fifth
largest country make credit union correspondents a valuable topic for further studies.

141
References Abramovay, R. (2004). Laços Financeiros na Luta contra a Pobreza. Revista Fapesp.
Aggarwal, S., & Klapper, L. (2013). Designing Govenment Policies to Expand Financial
Inclusion: Evidence from Around the World. Unpublished Working Paper. World Bank.
Aggarwal, S., & Klapper, L. (2013). Designing Govenment Policies to Expand Financial
Inclusion: Evidence from Around the World. Unpublished Working Paper. World Bank.
Alliance for Financial Inclusion. (2011). G20 Principles for Innovative Financial Inclusion. G20
Global Partnership fo Financial Inclusion.
Ardic, P., Heimann, M., & Mylenko, N. (2011). Access to Financial Services and the Financial
Inclusion Agenda around the World - A Cross-Country Analysis with a New Data Set.
Policy Research Working Paper. The World Bank, Financial and Private Sector
Development, Consultative Group to Assist the Poor.
Arnott, R., & Stiglitz, J. (1990). The Welfare Economics of Moral Hazard. Risk, Information and
Insurance, 91-121.
Atlas do Desenvolvimento Humano. (2013). Consulta. Retrieved 1 03, 2016, from Atlas do
Desenvolvimento Humano: http://www.atlasbrasil.org.br/2013/pt/consulta/
Axworthy, C. S. (1981). Credit Unions in Canada: The Dilemma of Success. The University of
Toronto Law Journal, Vol. 31, No.1, 72 - 116.
Bader, M., & Ferreira Savoia, J. R. (2013). Logística da distribuição bancária: tendências,
oportunidades e fatores para inclusão financeira. Revista de Administração de empresas
vol. 53 no 2, 208 - 215.
Banco Central do Brasil. (2003a). Resolução N 3.110, de 31 de julho de 2003. Banco Central do
Brasil, retrieved from http://www.bcb.gov.br 2.12.2015.
Banco Central do Brasil. (2003b). Resolução No. 3156. Resolução nº 3.156, de 17/12/2003.
Banco Central do Brasil, retrieved from http://www.bcb.gov.br 2.12.2015.
Banco Central do Brasil. (2011a). Relatório de Inclusão Financeira. Banco Central do Brasil.
Banco Central do Brasil. (2011b). Resolução N 3.954. Resolução N 3954, de 24 de fevereiro de
2011. Banco Central do Brasil. Retrieved from: www.bcb.gov.br on 2/12/2015.
Banco Central do Brasil. (2013). Resolução 4.294/2013. Resolução N 4.294, de 20 de dezembro
2013. Banco Central do Brasil. Retrieved from www.bcb.gov.br on 02/12/2015.
Banco Central do Brasil. (2015a). Relatório de Inclusão Financeira. Banco Central do Brasil.
Banco Central do Brasil. (2015b). Balancetes. Retrieved 12 15, 2015, from Banco Central do
Brasil: http://www4.bcb.gov.br/fis/cosif/balancetes.asp
Banco Central do Brasil. (2015c). Relação de instituições em funcionamento no país. Retrieved
12 5, 2015, from Banco Central do Brazil: http://www.bcb.gov.br/?RELINST

142
Banco Central do Brasil. (2015d). Pontos de atendimento por municipio 2010 - 2014.
Banco Central do Brasil. (2015e). ESTBAN - Estatística Bancária por Município (transferência
de arquívos). Retrieved 12 10, 2015, from Banco Central do Brasil:
http://www4.bcb.gov.br/fis/cosif/estban.asp
Banco Central do Brasil. (2015f). Relação de agências e postos bancários. Retrieved 12 5, 2015,
from Banco Central do Brasil: http://www.bcb.gov.br/?RELAGPAB
Banco Central do Brasil. (2015g). Correspondentes no país - posição em 16 dezembro 2014.
Batista, O. J., & Menéndez Rodríguez, T. D. (2010). Correspondentes Bancários: Instrumento
para a Inclusão Financeira e o Desenvolvimento Local. Convibra Administração.
Congresso Virtual Brasileiro de Administração.
Beck, T., Demirgüç-Kunt, A., & Levine, R. (2007). Finance, Inequality and the Poor. Journal of
Economic Growth, 27 - 49.
Besley, T. (1995). Nonmarket Institutions for Credit and Risk Sharing in Low-Income Countries.
The Journal of Economic Perspectives, Vol. 9 No.3, 115 - 127.
Bhattacharya, S., & Thakor, A. V. (1993). Contemporary Banking Theory. Journal of Financial
Intermediation 3, 2-50.
Bold, C., Porteous, D., & Rotman, S. (2012). Social Cash Transfers and Financial Inclusion :
Evidence from Four Countries. CGAP Focus Note No. 77.
Bonin, J. P., Jones, D. C., & Putterman, L. (1993). Theoretical and empirical studies of producer
cooperatives: Will ever the Twain meet? Journal of Economic Literature vol. 31, 1290-
1320.
Bruhn, M., & Love, I. (2009). The economic impact of banking the unbanked: Evidence from
Mexico . World Bank Policy Research Working Paper No. 4981.
Burges, R., & Pande, R. (2005). Do Rural Banks Matter? Evidence from the Indian Social
Banking Experiment. American Economic Review no 95, vol. 3 , 780-795.
Búrigo, F. L. (2006). Finanças e solidariedade: o cooperativismo de crédito rural solidário no
Brasil. Estudos Sociedade e Agricultura, Rio de janeiro, vol.14, no. 2, 312 - 349.
Burrell, G., & Morgan, G. (1979). Sociological Paradigms and Organisational Analysis -
Elements of the Sociology of Corporate Life . London : Heinemann.
Caves, R. E., & Petersen, B. S. (1986). Cooperatives' shares in farm industries: Organizational
and policy factors. Agribusiness vol. 2, 1-19.
Cazella, A. A., & Búrigo, F. L. (2009). Inclusão financeira e desenvolvimento rural: A
importância das organizações territoriais. Politica & Sociedade N 14 - abril de 2009, 301
- 331.
Cernev, A., Diniz, E., & Jayo, M. (2009). Emergência da quinta onda de inovação bancária.
Americas Conference on Information Systems.
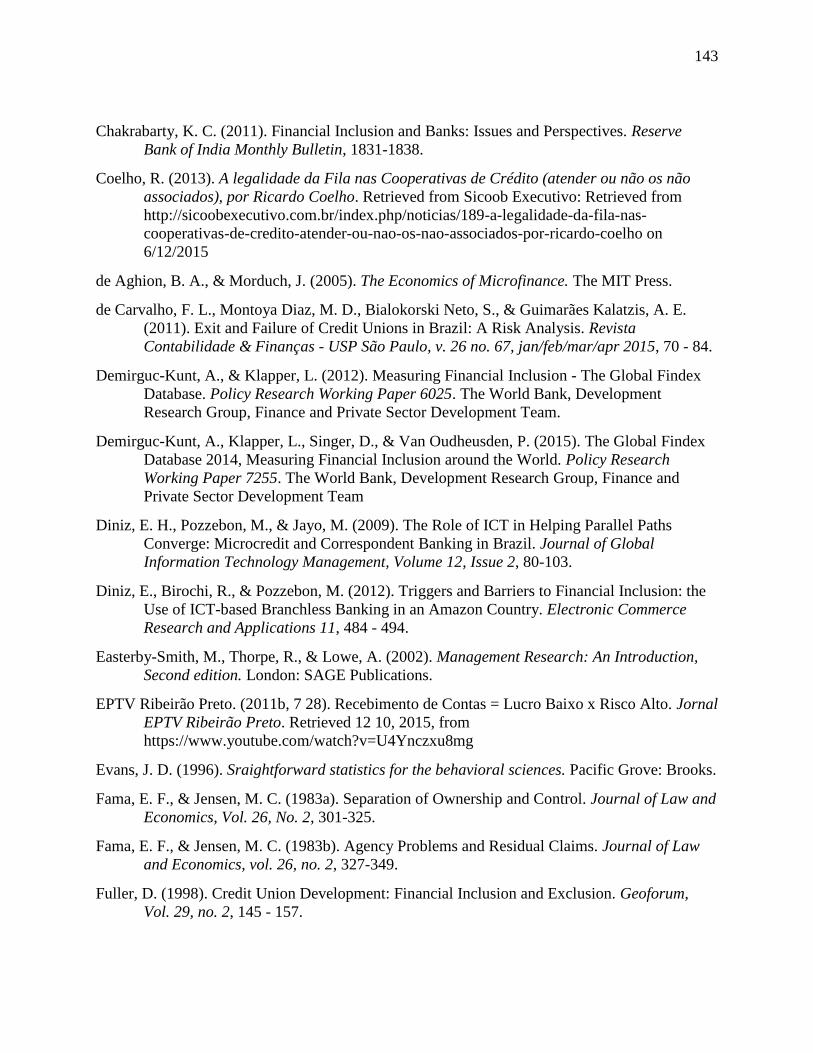
143
Chakrabarty, K. C. (2011). Financial Inclusion and Banks: Issues and Perspectives. Reserve
Bank of India Monthly Bulletin, 1831-1838.
Coelho, R. (2013). A legalidade da Fila nas Cooperativas de Crédito (atender ou não os não
associados), por Ricardo Coelho. Retrieved from Sicoob Executivo: Retrieved from
http://sicoobexecutivo.com.br/index.php/noticias/189-a-legalidade-da-fila-nas-
cooperativas-de-credito-atender-ou-nao-os-nao-associados-por-ricardo-coelho on
6/12/2015
de Aghion, B. A., & Morduch, J. (2005). The Economics of Microfinance. The MIT Press.
de Carvalho, F. L., Montoya Diaz, M. D., Bialokorski Neto, S., & Guimarães Kalatzis, A. E.
(2011). Exit and Failure of Credit Unions in Brazil: A Risk Analysis. Revista
Contabilidade & Finanças - USP São Paulo, v. 26 no. 67, jan/feb/mar/apr 2015, 70 - 84.
Demirguc-Kunt, A., & Klapper, L. (2012). Measuring Financial Inclusion - The Global Findex
Database. Policy Research Working Paper 6025. The World Bank, Development
Research Group, Finance and Private Sector Development Team.
Demirguc-Kunt, A., Klapper, L., Singer, D., & Van Oudheusden, P. (2015). The Global Findex
Database 2014, Measuring Financial Inclusion around the World. Policy Research
Working Paper 7255. The World Bank, Development Research Group, Finance and
Private Sector Development Team
Diniz, E. H., Pozzebon, M., & Jayo, M. (2009). The Role of ICT in Helping Parallel Paths
Converge: Microcredit and Correspondent Banking in Brazil. Journal of Global
Information Technology Management, Volume 12, Issue 2, 80-103.
Diniz, E., Birochi, R., & Pozzebon, M. (2012). Triggers and Barriers to Financial Inclusion: the
Use of ICT-based Branchless Banking in an Amazon Country. Electronic Commerce
Research and Applications 11, 484 - 494.
Easterby-Smith, M., Thorpe, R., & Lowe, A. (2002). Management Research: An Introduction,
Second edition. London: SAGE Publications.
EPTV Ribeirão Preto. (2011b, 7 28). Recebimento de Contas = Lucro Baixo x Risco Alto. Jornal
EPTV Ribeirão Preto. Retrieved 12 10, 2015, from
https://www.youtube.com/watch?v=U4Ynczxu8mg
Evans, J. D. (1996). Sraightforward statistics for the behavioral sciences. Pacific Grove: Brooks.
Fama, E. F., & Jensen, M. C. (1983a). Separation of Ownership and Control. Journal of Law and
Economics, Vol. 26, No. 2, 301-325.
Fama, E. F., & Jensen, M. C. (1983b). Agency Problems and Residual Claims. Journal of Law
and Economics, vol. 26, no. 2, 327-349.
Fuller, D. (1998). Credit Union Development: Financial Inclusion and Exclusion. Geoforum,
Vol. 29, no. 2, 145 - 157.

144
G20 Financial Inclusion Experts Group. (2010). G20 Financial Inclusion Action Plan. retrieved
from: http://www.gpfi.org/publications/financial-inclusion-action-plan.
Garcia, F. G., & Villa Lhacer, P. M. (2012). Maximização de valor pelas cooperativas de crédito
brasileiras. Revista Pensamento & Realidade vol. 27 Issue 1, 62 - 76.
Global Partnership for Financial Inclusion. (2014). 2014 Financial Inclusion Action Plan. G20
Global Partnership for Financial Inclusion.
Gonzalez, L., & Brito, M. (2013). Microcredit in Credit Unions: An Exploratory Study. Working
Paper retrieved from www.asbaweb.org.
Gonzalez, L., Diniz, E. H., Nascimento, E., & Kasmirski, P. (2013). Inclusão financeira e
correspondentes bancários no Brasil. Centro de Estudos em Microfinanças da Fundação
Getulio Vargas.
Guba, E. G. (1990). The Paradigm Dialog. Newsbury Park: SAGE Publications.
Hair, J. F., Babin, B., Honey, A. H., & Samouel, P. (2003). Essentials of Business Research
Methods, 1st Edition. Minion: Leyh Publishing.
Hansmann, H. (1996). The ownership of enterprise. Cambridge: Harvard University Press.
Hsiu-Fang, H., & Shannon, S. E. (2007). Three Approaches to Qualitative Content Analysis.
Qualitative Research, vol. 15 no. 9,, 1277-1288.
IBGE. (2000). Censo Demográfico 2000: Características da População e dos Domicílios:
Resultados do Universo. Retrieved 10 5, 2015, from Instituto Brasileiro de Geografia e
Estatística: http://www.ibge.gov.br/home/estatistica/populacao/censo2000/default.shtm
IBGE. (2007). Contagem da população 2007. Retrieved 10 1, 2015, from Instituto Brasileiro de
Geografia e Estatística:
http://www.ibge.gov.br/home/estatistica/populacao/contagem2007/
IBGE. (2010). Censo Demográfico 2010. Retrieved 10 5, 2015, from Instituto Brasileiro de
Geografia e Estatística:
www.ibge.gov.br/home/estatistica/populacao/censo2010/default.shtm
IBGE. (2013). Estimativas populacionais para os municípios brasileiros em 1.07.2013.
Retrieved 10 5, 2015, from Instituto Brasileiro de Geografia e Estatística:
http://www.ibge.gov.br/home/estatistica/populacao/estimativa2013/estimativa_dou.shtm
IBGE. (2015). Área Territorial Brasileira. Retrieved 11 1, 2015, from Instituto Brasileiro de
Geografia e Estatísticas:
http://www.ibge.gov.br/home/geociencias/cartografia/default_territ_area.shtm
International Finance Corporation. (2006). Credit Bureau Knowledge Guide. IFC.
Ivatury, G. (2007). Brazil's Banking Correspondents. CGAP.
Jansen, S., & Hannig, A. (2010). Financial Inclusion and Financial Stability: Current Policy
Issues. ABDI Working Paper Series. No 259. Asian Development Bank Institute.

145
Jayo, M. H., & Diniz, E. (2011). Um mapeamento descritivo dos modelos de gestão de redes de
correspondentes bancários no Brasil. Revista de Administração, São Paulo vol. 48 n3
julho/agosto/setembro 2013, 621 - 634.
Jayo, M., & Diniz, E. H. (2009). Correspondentes Bancários como Canal de Distribuição de
Serviços Financeiros: o Papel dos "Gestores de Rede". AMCIS 2009 Proceedings. Paper
3.
Jornal EPTV Ribeirão Preto. (2011a, 8 3). Recebimento de Contas = Lucro Baixo x Risco Alto
2. Jornal EPTV Ribeirão Preto. Retrieved 12 10, 2015, from
https://www.youtube.com/watch?v=6LT21VJc2iQ
Kempson, E., & Claire, W. (1999). Kept out or opted out - Understanding and combating
financial exclusion. The Policy Press.
King, N. (2004). Using templates in the thematic analysis of text. In C. Cassell, & G. Symon,
Essential Guide to Qualitative Methods in Organizational Research (pp. 256-270).
London: SAGE Publications.
Kumar, A., Nair, A., Parsons, A., & Urdapilleta, E. (2006). Expanding Bank Outreach through
Retail Partnerships - Correspondent Banking in Brazil. World Bank Working Paper No.
85. The World Bank.
Leedy, P. D., & Ormrod, J. E. (2001). Practical Research: Planning and Design. Upper Saddle
River: Merrill Prentice Hall.
Leeladhar, V. (2006). Taking Banking Services to the Common Man - Financial Inclusion.
Reserve Bank of India Bulletin, 73-77.
Marques Soares, M., & Duarte de Melo Sobrinho, A. (2008). Microfinaças - O Papel do Banco
Central do Brasil e a Importância do Cooperativismo de Crédito. 2a edição, revista e
ampliada. Brasília: Banco Central do Brasil.
Marshall, C., & Rossman, G. B. (1999). Designing Qualitative Research, Third Edition.
Thousand Oaks: SAGE Publications.
Mas, I. (2009). The Economics of Branchless Banking. Innovations, 57-75.
Meinen, Ê. (2013, July 1). As instituições financeiras cooperativas e os 10 anos de livre
admissão de associados. Retrieved from Bancoob:
http://www.bancoob.com.br/imprensa/as-instituicoes-financeiras-cooperativas-e-os-10-
anos-de-livre-admissao-de-associados Retrieved on 6/12/2015
Mettenheim, K., Diniz, E., & Gonzalez, L. (2013). New Perspectives on Banking and Agendas
for Financial Inclusion. Call for Papers, FInancial Inclusion Research Conference, 2013.
Bridging the Gap: How can banks reach the unbanked? FGV Center for Microfinance
Studies.
Morduch, J. (1995). Income Smoothing and Consumption Smoothing. The Journal of Economic
Perspectives, Vol. 9 No. 3, 103-114.

146
Morris, T., & Wood, S. (1991). Testing the survey method: continuity and change in British
industrial relations. Work, Employment and Society, vol. 5 no. 2, 259-282.
Myers, J., Scott Cato, M., & Jones, P. A. (2012). An 'alternative mainstream'? The impact of
financial inclusion policy on credit unions in Wales. Public Money & Management, 32:6,
409-416.
Nichter, S., Goldmark, L., & Fiori, A. (2002). Understanding Microfinance in the Brazilian
Context. PDI/BNDES.
Parceria Nacional para Inclusão Financeira. (2012). Plano de Ação para Fortalecimento do
Ambiente Institucional. Banco Central do Brasil.
Ramos, W., & Kovaleski, J. L. (2011). Cooperativas de crédito e Agentes Credenciados: Quem
realmente ganha com essa parceria? Retrieved from:
http://pg.utfpr.edu.br/expout/2011/artigos/18.pdf on 6/12/2015.
Robson, C. (2002). Real World Research - A Resource for Social Scientists and Practicioner-
Researchers, Second Edition. Oxford: Blackwell Publishing.
Sale, J. E., Lohfeld, L. H., & Brazil, K. (2002). Revisiting the Quantitative-Qualitative Debate:
Implications for Mixed-Methods Research. Quality & Quantity, no 36, 43-53.
Sanford, C., & Cojocaru, L. (2013). Do Banking Correspondents Improve Financial Inclusion?
Evidence from a National Survey in Brazil. Bankable Frontier Associates.
Sarma, M. (2012). Index of Financial Inclusion - A measure of financial sector inclusiveness.
Working Paper No. 07/2012. Berlin Working Papers on Money, Finance, Trade and
Development.
Saunders, M., Lewis, P., & Thornhill, A. (2007). Research Methods for Business Students,
Fourth Edition. Harlow: FT Prentice Hall.
Sicredi. (2015). Conheça as vantagens de se tornar um agente credenciado do SICREDI.
Retrieved from Sicredi:
http://www.sicredi.com.br/websitesicredi/sicredi/psmlId/110?menuId=21 accessed on
6/12/2015
Silva, M. (2007). Correspondentes Bancários: uma forma de terceirização. SBS - XXII Congresso
Brasileiro de Sociologia. UFPE: Recife.
Smith, B. D., & Stutzer, M. J. (1990). Adverse Selection, Aggregate Uncertainty, and the Role
for Mutual Insurance Contracts. Journal of Business vol. 63 no. 4, 493 - 510.
Staatz, J. M. (1987). Farmers' incentives to take collective action via cooperatives: A transaction-
cost approach. USDA ACS Service Report, vol. 18, 87-107.
Taraborelli, A. (2015, 04 08). Perda de Banco Postal foi bom para a instituição, diz Bradesco.
Brasil Econômico. Retrieved from http://brasileconomico.ig.com.br/financas/2015-04-
08/perda-de-banco-postal-foi-bom-para-a-instituicao-diz-bradesco.html

147
Tashakkori, A., & Teddlie, C. (1998). Mixed Methodology: Combining Qualitative and
Quantitative Approaches,. Thousand Oaks: SAGE Publications.
The World Bank;International Monetary Fund. (2013, May). Financial Inclusion in Brazil:
Building on Success. Financial Sector Assessment Program Update Technical Note.
International Monetary Fund, The World Bank.
Thorat, U. (2006). Financial Inclusion and the Millenium Development Goals. Reserve Bank of
India Bulletin, 10-15.
Travaglini, F. (2009, 7 16). Banco do Brasil assume os correspondentes do Lemon. Retrieved 12
13, 2015, from Globo - Epoca Negócios:
http://epocanegocios.globo.com/Revista/Common/0,,EMI82732-16359,00-
BANCO+DO+BRASIL+ASSUME+OS+CORRESPONDENTES+DO+LEMON.html
Tsuji, K. (2015, November 23). The Five Most Dramatic Changes in 20 Years of Financial
Inclusion. Retrieved from CGAP: www.cgap.org/blog/five-most-dramatic-changes-20-
years-financial-inclusion
Tukey, J. W. (1977). Exploratory Data Analysis. Reading: Addison-Wesley.
Villasenor, J. D., West, D. M., & Lewis, R. J. (2015). The 2015 Brookings Financial and Digital
Inclusion Project Report - Measuring Progress on Financial Access and Usage.
Washington, DC: Center for Technology Innovation at Brookings.
Williams, C. (2007). Research Methods. Journal of Business & Economic Research, vol. 5. no.3,
65-71.
Williamson, O. E. (1980). The organization of work: a comparative institutional assessment.
Journal of Economic Behavior and Organization vol. 1, 5-58.
Williamson, O. E. (1985). The economic institutions of capitalism. New York: Free Press.
World Bank. (2015). Financial Inclusion Data - World Bank. Retrieved from Datatopics World
Bank: datatopics.worldbank.org
World Council of Credit Unions. (2014). 2014 Statistical Report. WOCCU.
World Council of Credit Unions. (2015). What is a Credit Union? Retrieved 12 15, 2015, from
World Council of Credit Unions: http://www.woccu.org/about/creditunion

148
Appendices
Appendix 1: Index of Financial Inclusion (IFI) formula by Sarma (2012)

149
Appendix 2: Definitions of different Points of Access (POA) (Banco Central do Brasil, 2015a)
Advanced Service Point (PAA): Simplified bank branch office
ATM: Automatic Teller Machine, self-service point of access for a limited amount of services
Branch: cannot be mobile or temporary – offers the largest variety of banking services
Banking Correspondent (BC): Third parties contracted by financial institutions or other
institutions to offer a predetermined amount of services in the name of the institution
Credit Union Service Point (PAC): Can be a credit union seat or credit union service point
Electronic Service Point (PAE): a range of ATMs for self-service
Point of Service (POS): Smaller electronic installation used by commercial places to receive
payments by card
Service point (PAB): can be mobile, services selected by the financial institution
Appendix 3: Types of Services offered by banking correspondents (Banco Central do Brasil,
2011b)
I: Opening of accounts (deposit, term and savings)
II: Receipts and payments relative to accounts as well as application and discharges of
investment funds
III: Receipt of payments and similar transactions
IV: Execution of payment orders for the contractor
V: Reception and forwarding of loan and financing requests
VI: Analysis of credit and registration
VII: Execution of collection services (Revoked in 2011)
VIII: Reception and forwarding of credit card emission requests
IX: Foreign exchange operations
X: Other activities at the discretion of the Central Bank of Brazil

150
Appendix 4: Evolution of the density of bank branches by municipality in Brazil (Banco
Central do Brasil, 2015a)
Appendix 5: Growth rate of bank branches in Brazilian regions 1991-2000 (Banco Central
do Brasil, 2015c)
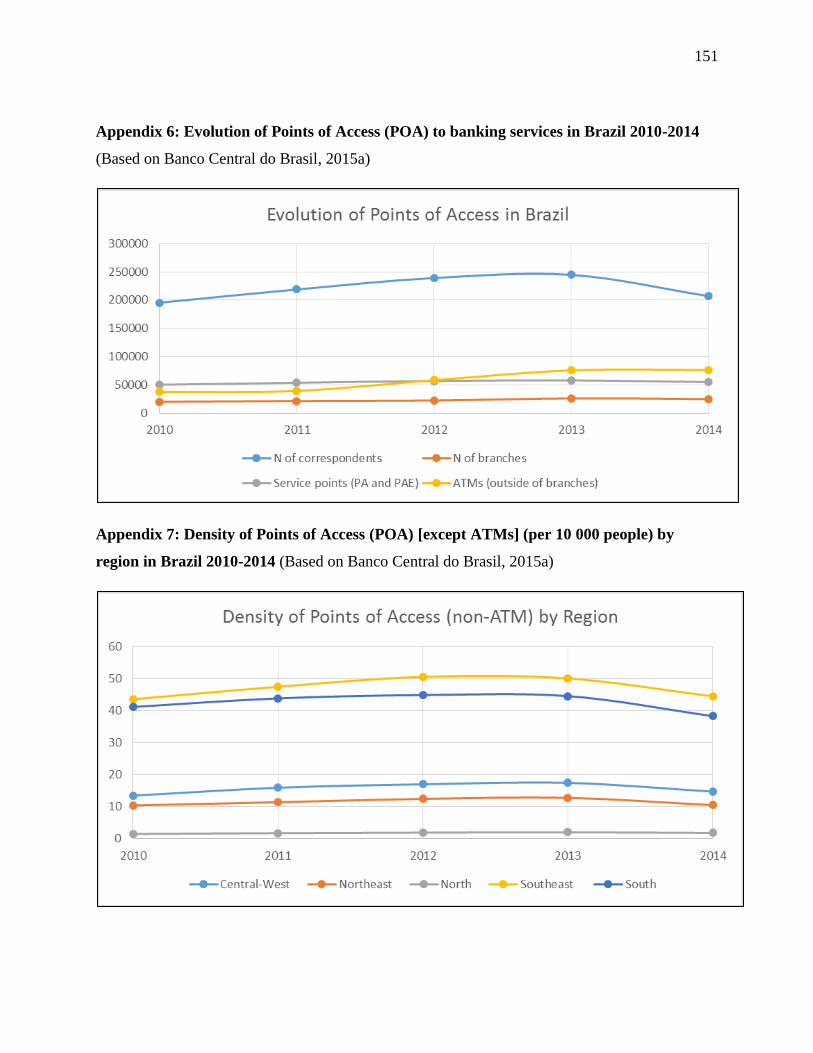
151
Appendix 6: Evolution of Points of Access (POA) to banking services in Brazil 2010-2014
(Based on Banco Central do Brasil, 2015a)
Appendix 7: Density of Points of Access (POA) [except ATMs] (per 10 000 people) by
region in Brazil 2010-2014 (Based on Banco Central do Brasil, 2015a)

152
Appendix 8: Growth of the number of Points of Access (POA) [except ATMs] by region in
Brazil 2010-2014 (Based on Banco Central do Brasil, 2015a)

153
Appendix 9: Comparison of credit unions and other financial institutions (based on World
Council of Credit Unions, 2014)
Service
Delivery
Main office, shared branching,
ATMs, POS devices, PDAs, cell
phones, Internet
Main office, shared branching,
ATMs, POS devices, PDAs, cell
phones, Internet
Regular visits to the community
group
Earnings
Net income is applied to lower
interest on loans, higher interest on
savings or new product and service
development.
Stockholders receive a pro-rata
share of profits.
Net income builds reserves or is
divided among investors.
Products &
Services
Full range of financial services,
primarily savings, credit,
remittances and insurance.
Full range of financial services,
including investment opportunities.
Focus on microcredit. Some MFIs
offer savings products and
remittance services.
Clientele
Members share a common bond,
such as where they live, work or
worship. Service to the poor is
blended with service to a broader
spectrum of the population, which
allows credit unions to offer
competitive rates and fees.
Typically serve middle-to-high
income clients. No restrictions on
clientele.
Target low-income
members/clients, mostly women,
who belong to the same community.
Governance
Credit union members elect a
volunteer board of directors from
their membership. Members each
have one vote in board elections,
regardless of their amount of
savings or shares in the credit union.
Stockholders vote for a paid board of
directors who may not be from the
community or use the bank's
services. Votes are weighted based
on the amount of stock owned.
Institutions are run by an appointed
board of directors or salaried staff.
Credit Unions Commercial BanksOther Microfinance Institutions
(MFIs)
Structure
Not-for-profit, member-owned
financial cooperatives funded
largely by voluntary member
deposits
For-profit institutions owned by
stockholders
Institutions typically funded by
external loans, grants and/or
investors

154
Appendix 10: Comparison of credit unions and banks (Translated from Soares & Sobrinho,
2008)
Banks Credit UnionsOwnership is private and aims at
maximizing profit Ownership is social and does not seek profit
May sell equity to third parties May not tranfser ownership to third parties
Members of the Board of Directors are
owners or hired from the market
Members of the Board are credit union
members
The user is just a client
The user is an owner of the company and
has decision making power in the
operationa policy and has to be treated
equitably
In the relation with the clients, priority is in
cost reduction
The investment and payment capacity of
the credit union members is analyzed
Prioritize large urban centers Also act in more remote communities
Impersonal service, based on financial
reciprocity, and focus only on the economic
dimension
Mostly personal service to the member,
with more social relationships between
directors, workers and members. The socio-
economic aspect dominates
Fragile link with the society
Link with the society, where attracted
ressources are applied
Focus on market competition Develop through cooperation
The remuneration of shareholders is
proportional to their share of equity
The surplus of the fiscal year can be
distributed between members based on
the proportion of services used, or
reinvested in cooperative funds
Are a potential source of systemic risk to
the financial sector
The risks and losses are borne by the
members

155
Appendix 11: Credit union membership penetration in Latin America in 2014 (Based on
WOCCU, 2014)

156
Appendix 12: Credit union penetration by region in Brazil (Based on Banco Central do
Brasil, 2015a)
Appendix 13: Credit unions: share of total credit to physical persons by region in Brazil (Based on Banco Central do Brasil, 2015a)

157
Appendix 14: Penetration rate of credit unions by region in 2012 – Share of population that
is member of a credit union (Based on Banco Central do Brasil, 2015a)
Appendix 15: Brazilian credit union system structure (Based on Marques Soares and Duarte
de Melo Sobrinho, 2008)
Ban
coo
b
Cen
tral
s
Cen
tral
s
Ban
sicr
edi
Cen
tral
s
Cen
tral
s
Sin
gle
CU
sStructure of Credit Unions in Brazil
Ancosol
Single CUs Single CUs Single CUs Single CUs
Sicoob Unicred SicrediIndependent
Single CUs

158
Appendix 16: Formulas used for financial ratios of credit unions (De Carvalho et al., 2011)
* ROA and ROE formulas changed from De Carvalho et al (2011) to use the average of Assets
and Equity (respectively) for the period observed instead of the value at the end of the period
solely
** Funding by Long-Term Deposits used instead of Funding by Time Deposits and Funding by
Demand Deposits, due to data availability
Ratio Calculation Method Correlation with survival of CU
Investments in Credit Operations Credit assets / Operating Assets Positive
Treasury Investments Treasury / Operating Assets Positive
Banking Profitability Operating Income/Operating Expenses
Coverage with Services Services Revenue / Structural Expenses
Operational Efficiency Operating Profit / Administrative Expenses
Banking Margin Operating Profit / Total Revenue
Other Revenue Share Other Operating Revenue / Total revenue Negative
Service Revenue Share Service Revenue / Total revenue Negative
Credit Volume Credit Operations / Equity
Size logarithm of Total Assets Positive
Return on Assets (ROA)* Net Profit/(Total Assetsn + Total Assetsn-1 )/2
Return on Equity (ROE)* Net Profit/(Equityn + Equityn-1)/2
Funding by Long-Term Deposits** Long-Term Deposits / Total Deposits Positive

159
Appendix 17: Methodology for redistribution of debit and credit by municipality
It is assumed that banking actors distribute a certain percentage of their credit and attract a
certain percentage of their deposits through the PAAs, PABs and PAEs and BCs they operate.
This percentage is set at 20% for credit, and 15% for deposits. The total amount of credit and
deposits in the country remains the same, only its distribution among municipalities changed.
Of all credit distributed through other channels, it is assumed that 80% is distributed through
PABs and PAAs together, 10% through PAEs and 10% through BCs with service V. Similarly,
for deposits, 90% are distributed through PABs and PAAs, 5% through PAEs and 5% through
BCs with either service I or II. This difference aims at reflecting the relative difficulty of banks
to attract deposits, as well as their willingness to promote payroll credit through all channels.
For each mesoregion, an average number of credit and deposits to be distributed through other
channels is calculated for each channel type (PAB and PAA, PAE & BC). Only financial
services channels of commercial banks are considered, as the statistics of deposits and credit by
municipality only contain this data. Finally, for each municipality the resulting amount of credit
and deposit is calculated in the following manner:
Credit by municipality = 80% * C0 + CPAB/PAA * nPAB/PAA + CPAE * nPAE + CBC * nBCInc.V
C0 = Original amount of credit in municipality
CPAB/PAA = Cx * 80% / All PAB & PAA in the Mesoregion
CPAE = Cx * 10% / All PAE in the Mesoregion
CBC = Cx * 10% / All BC with Inc. V in the Mesoregion
Cx = 20% * Sum of Credit in Mesoregion
nPAB/PAA = Number of commercial bank PAB/PAA in the municipality
nPAE = Number of commercial bank PAE in the municipality
nBCInc.V = Number of commercial bank BC with service V in the municipality
Deposits by municipality = 80% * D0 + DPAB/PAA * nPAB/PAA + DPAE * nPAE + DBC * nBCInc.I & II0
D0 = Original amount of deposits in municipality
DPAB/PAA = Dx * 90% / All PAB & PAA in the Mesoregion
DPAE = Dx * 5% / All PAE in the Mesoregion
DBC = Dx * 5% / All BC with Inc. V in the Mesoregion
Dx = 15% * Sum of Credit in Mesoregion
nPAB/PAA = Number of commercial bank PAB/PAA in the municipality
nPAE = Number of commercial bank PAE in the municipality
nBCInc.I&II = Number of commercial bank BC with services I or II in the municipality

160
Appendix 18: Timeline plan of interviews in Panambi (Interviews performed by Leonardo
Fujisima Yada and Melina Chen Padoin)
D1
D2
D3
D4
D5
D6
D7
D8
D9
D1
0D
11
D1
2D
13
D1
4D
15
D1
6D
17
D1
8D
19
D2
0D
21
5/7
6/7
7/7
8/7
9/7
10
/71
1/7
12
/71
3/7
14
/71
5/7
16
/71
7/7
18
/71
9/7
20
/72
1/7
22
/72
3/7
24
/72
5/7
Pha
se 1: Trip
an
d fie
ld in
spe
ction
Trave
l to Pa
na
mb
i
Con
tact w
ith Sicre
di
Con
tact w
ith City H
all - In
tervie
w w
ith M
ayo
r
Tran
script o
f inte
rview
with
Ma
yor
Con
tact w
ith b
an
ks
Con
tact w
ith b
an
ks an
d Tra
de
As
socia
tion
Trave
l to Sicre
di Iju
í
Inte
rview
with
dire
ctors o
f Sicred
i
Inte
rview
with
corre
spo
nd
en
t at th
e La
bo
r Un
ion
Inte
rview
with
thre
e u
sers o
f the
Lab
or U
nio
n co
rresp
on
de
nt
As
k regu
lato
ry an
d ch
arte
r do
cum
en
ts from
Alin
e (Sicre
di)
Re
turn
to B
an
co d
e B
rasil
Visit to
Bo
zan
o - 2 p
eo
ple
Visit o
f corre
spo
nd
en
ts in Pa
na
mb
i - 2 pe
op
le
Plan
inte
rview
s with
car d
ea
lers w
ith Eve
rton
See
age
nd
a w
ith Eve
rton
for in
tervie
ws
Seco
nd
visit of co
rresp
on
de
nts in
Pan
am
bi (6 u
sers)
Inte
rview
with
Mr. Elm
o
Inte
rview
with
Everto
n
Plan
of visit to
São
Va
lério
Inte
rview
s with
two
car d
ea
lers
Visit o
f São
Va
lério
(Inte
rview
of co
rresp
on
de
nt a
nd
2 use
rs)
Sche
du
le a
visit to tw
o m
ore
corre
spo
nd
en
ts
Seco
nd
visit to co
rresp
on
de
nts
Time
line
of P
anam
bi P
roje
ct, 2015

161
Appendix 19: Interviewed people and questions prepared for interviews in Panambi
(Interviews performed by Leonardo Fujisima Yada and Melina Chen Padoin)
Stakeholders Mayor of Panambi
Head of local Chamber of Commerce
Sicredi President in Ijuí and Counsellor
Vice-President (ex-President)
Correspondents Rural Worker’s Union Ijuí
Jewelry Store
Farming Store
Users of Correspondents 7 users at the Worker’s Union (Four
women and three men)
4 users at the Jewelry Store (Three
women, one man)
Bank managers Banrisul Manager
Santander Manager
Bradesco Manager
Caixa Manager
Questions for the project “Local Connection” (Original questions in Portuguese follow)
Credit Unions
1. Could you tell us about the history of the credit union (foundation, who took part)?
2. What was the purpose of creation of the credit union?
3. How is the credit union structured (employees, members, branches)?
4. What is the area of activity of the credit union?
5. What services does the credit union offer?
6. When did the credit union decide to open correspondents?
7. What were the motives that led to the use of banking correspondents?
8. What are the services most used by the customers of the correspondents?
9. How is the relation between the credit union and the banking correspondents?
10. How did the opening of banking correspondents affect the credit union?
11. Does the credit union have a strategy regarding the expansion of the correspondent network?
12. What platform and technology is used to connect the credit union with the correspondents?
13. Who is responsible for support to the correspondents? How does this work?
14. Is it necessary to be a member to receive credit from the credit union?
15. How can one become a member of the credit union?
16. Where specific credit models developed for banking correspondents?

162
17. What is the volume of credit distributed through the correspondents? Did the volume of
credit generally increase through the adoption of correspondents?
18. Is there training for the correspondents to promote credit?
Correspondents
1. Since when do you act as a banking correspondent?
2. Why did you choose to become a banking correspondent?
3. What are the perceived advantages in being a banking correspondent?
4. What are the daily difficulties that you face as a banking correspondent?
5. What kind of relationship do you maintain with your customers?
6. What banking correspondent service are you authorized to do?
7. What are the most used services? Why do people use correspondents?
8. Do people come to the correspondent to apply for loans?
9. What are generally the reasons that lead people to apply for a loan? ¨
10. Did you notice any change in the number of people visiting your facility since you became a
banking correspondent?
11. Are you a correspondent of more than one bank or credit union? Which ones?
12. What support do the banks or credit unions provide for your daily operations?
13. Do you receive some type of training?
14. Who provides support when you have problems with the equipment?
15. Do you hire people for promotion of loans outside your facility (so called pastinhas)?
16. How much is your working capital per month, approximately?
Banks
1. Does your bank have banking correspondents in the region?
2. What is your perception of credit unions?
3. Credit unions recently started operating banking correspondents. Did this affect your bank in
any way?
4. Is there a strategy of the bank in the region regarding the use of banking correspondents?
People on the streets and at correspondent outlets
1. Do you know what banking correspondents are?
2. Do you use the services of banking correspondents?
3. Why do you use the services of the correspondent?
4. Do you receive any sort of government transfers (Bolsa Família, retirement, unemployment
compensation)?
5. Do you feel that a local business or familiar person acting as a correspondent is more
trustworthy?
6. Do you consider this system efficient? Are there any flaws?
7. How were the same operations done before the appearance of banking correspondents?

163
8. What did the correspondents change in your daily lives (shorter distances, faster service…)?
9. Are you a member of any credit union? Why?
10. Can you notice any difference between the correspondents of banks and credit unions?
11. Have you already gotten a loan from a credit union through a correspondent? Why? For what
purpose?
12. Which credit unions are you familiar with in your region?
Public administration bodies
1. What is the history of the municipality of Panambi?
2. What difficulties does the administration of the municipality face?
3. What is the socioeconomic profile of the municipality?
4. What are the major financial difficulties of the citizens of Panambi?
5. In your view, what is the role of credit unions in the municipality?
6. In your view, what is the role of banking correspondents in the municipality?
Perguntas para o Projeto Conexão Local
Cooperativas
1. Você pode contar a história de cooperativa (fundação, quem participou)?
2. Qual foi o proposito da criação da cooperativa?
3. Como a cooperativa está estruturada (funcionários, sócios, pontos de atendimento)?
4. Qual é a área de atuação da cooperativa?
5. Quais são os serviços oferecidos pela cooperativa?
6. Quando a cooperativa decidiu por abrir correspondentes bancários?
7. Quais motivos levaram à cooperativa abrir correspondentes?
8. Quais são os serviços mais usados pelos clientes dos correspondentes?
9. Como é a relação entre a cooperativa e os correspondentes bancários?
10. Qual foi o impacto percebido para a cooperativa com a abertura dos correspondentes
bancários?
11. Há alguma estratégia da cooperativa em relação à ampliação da rede de correspondentes
bancários?
12. Qual plataforma e tecnologia são utilizadas para conectar a cooperativa com os
correspondentes?
13. Quem é responsável pelo suporte aos correspondentes? Como funciona?
14. É necessário ser sócio para conseguir crédito na cooperativa?
15. Como uma pessoa pode ficar sócia da cooperativa?
16. Foram desenvolvidos modelos específicos de crédito para os correspondentes bancários?
17. Qual é o volume de crédito disponibilizado via correspondente? Aumentou com a utilizam
dos correspondes?
18. Há treinamento para os correspondentes venderem crédito?

164
Correspondentes
1- Desde quando é um correspondente bancário?
2- Por que escolheu ser um correspondente bancário?
3- Quais são as vantagens percebidas por ser um correspondente bancários?
4- Quais são as dificuldades no dia-a-dia de um correspondente bancário?
5- Como é a relação com os seus clientes?
6- Qual serviço de correspondente bancário você está autorizado a fazer?
7- Quais são os serviços que as pessoas mais utilizam? Para que as pessoas utilizam o
correspondente?
8- As pessoas procuram o correspondente para fazer empréstimos?
9- Quais são, em geral, os motivos que fazem as pessoas pegar um empréstimo?
10- Você percebeu alguma alteração no número de pessoas que vem ao estabelecimento após
ser um correspondente bancário?
11- Você é correspondente de mais de um banco ou cooperativa de crédito? Quais?
12- Qual o apoio fornecido pelos bancos/cooperativas no seu dia-a-dia?
13- Você recebe algum tipo de treinamento?
14- Quem dá suporte quando você tem problemas com os equipamentos?
15- Possuem alguma pessoa terceirizada para venda de emprestimos (“pastinha”)?
16- De quanto aproximadamente é o capital de giro por mes?
Bancos
1. O Banco possui correspondentes bancários associados na região?
2. Qual é a visão do banco em relação às cooperativas de crédito?
3. As cooperativas passaram a ter correspondentes bancários ha pouco tempo, isto
impactou de alguma forma o banco?
4. Há alguma estratégia do banco na região quando ao uso de correspondentes bancários?
Pessoas da Cidade
1- Sabe o que são os correspondentes bancários?
2- Você utiliza os serviços do correspondente bancário?
3- Por quê você usa os serviços do correspondente?
4- Recebe algum tipo de auxilio governamental (bolsa família, aposentadoria, seguro
desemprego)?
5- Considera mais confiável o correspondente ser um comércio da regiao ou uma pessoa
conhecida?
6- Considera o sistema eficiente? Há alguma falha?
7- Como eles faziam as mesmas operações antes de usar o correspondente?
8- O que o correspondente mudou no seu dia-a-dia (distância menor, serviço mais rápido)?
9- Você é associado de alguma cooperativa de crédito? Por quê?
10- Você percebe alguma diferença entre as correspondentes das cooperativas e dos bancos?
11- Você já contratou crédito da cooperativa pelo correspondente? Por quê? Para quê?
12- Quais cooperativas de crédito conhece na sua região?

165
Perguntas para Administração pública
1. Qual é a história do município de Panambi?
2. Quais as dificuldades enfrentadas pela administração do município?
3. Qual é o perfil socioeconômico do município?
4. Quais são as maiores dificuldades financeiras dos habitantes de Panambi?
5. Na visão da administração pública, qual é o papel das cooperativas de crédito do
município?
6. Na visão da administração pública, qual é o papel das cooperativas de crédito no
município?
7. Na visão da administração pública, qual é o papel dos correspondentes bancários no
município?

166
Appendix 20: Descriptive statistics of the distribution of CU BCs among Credit Unions, as
well as on the Municipal level (Based on Banco Central do Brasil, 2015g)
Descriptive Statistics for CU BCs by Credit Union
Descriptive Statistics for CU BCs by Municipality
Year <2003 2003 2004 2005 2006 2007 2008 2009 2010 2011 2012 2013 2014 CAGR 11-14
n of CU BC 12 17 17 20 33 103 1 002 1 651 2 105 3 525 3 891 4 089 4 198 6,0 %
n of CU with BC 3 5 5 7 18 41 95 103 115 191 194 198 200 1,5 %
Average of BC/CU 4,0 3,4 3,4 2,9 1,8 2,5 10,5 16,0 18,3 18,5 20,1 20,7 21,0 4,4 %
Std. Dev 0,5 0,6 0,6 0,7 0,7 1,5 7,2 11,8 15,2 24,1 25,9 26,7 27,8 4,8 %
Min 0 0 0 0 0 0 0 0 0 0 0 0 0 0,0 %
Max 8 9 9 9 9 16 45 69 96 246 246 247 247 0,1 %
n CUs that closed all BCs 0 0 0 0 0 2 6 8 10 9 10 12 12 10,1 %
Descriptive statistical figures for BCs by credit union
<2003 2003 2004 2005 2006 2007 2008 2009 2010 2011 2012 2013 2014 CAGR 11-14
n of exclusive CU BC 12 17 17 20 28 93 782 1 232 1 588 2 585 2 737 2 822 2 974 4,8 %
n of CU with exclusive BC 3 5 5 7 15 35 90 99 108 164 166 173 177 2,6 %
Average of exclusive BC/CU 4,0 3,4 3,4 2,9 1,9 2,7 8,7 12,4 14,7 15,8 16,5 16,3 16,8 2,2 %
Std. Dev 0,5 0,6 0,6 0,7 0,7 1,5 5,8 9,1 11,8 20,2 21,1 21,1 22,3 3,3 %
Min 0 0 0 0 0 0 0 0 0 0 0 0 0 0,0 %
Max 8 9 9 9 9 16 35 52 70 231 231 232 232 0,1 %
n CUs that closed all BCs 0 0 0 0 0 0 0 128 96 0 1 0 0 0,0 %
Descriptive statistical figures for exclusive BCs by credit union
Year <2003 2003 2004 2005 2006 2007 2008 2009 2010 2011 2012 2013 2014 CAGR 11-14
Min 0 0 0 0 0 0 0 0 0 0 0 0 0 0,0 %
Max 4 4 4 4 4 5 17 25 33 33 36 34 34 1,0 %
Average 0,0 0,0 0,0 0,0 0,0 0,1 0,8 1,3 1,7 2,8 3,1 3,2 3,3 5,9 %
Std. Dev 0,2 0,2 0,2 0,2 0,2 0,4 1,5 2,2 2,8 3,8 4,0 4,0 4,1 2,7 %
Descriptive statistical figures for all CU BCs by municipality
Year <2003 2003 2004 2005 2006 2007 2008 2009 2010 2011 2012 2013 2014 CAGR 11-14
Min 0 0 0 0 0 0 0 0 0 0 0 0 0 0,0 %
Max 4 4 4 4 4 5 13 18 23 27 28 29 29 2,4 %
Average 0,0 0,0 0,0 0,0 0,0 0,1 0,7 1,0 1,3 2,2 2,3 2,4 2,5 4,8 %
Std. Dev 0,2 0,2 0,2 0,2 0,2 0,4 1,2 1,7 2,1 3,0 3,1 3,1 3,2 2,7 %
Descriptive statistical figures for exclusive CU BCs by municipality

167
Appendix 21: Number of municipalities with operational credit union correspondents by
region
Appendix 22: Number of operational credit union correspondents by region (Based on
Banco Central do Brasil, 2015g)
I II III IV V VII VIII IX
Southeast 3143401/21310222 x x
Southeast 3170107/8685007 x x
South 4201406/5703047 x x
South 4204608/2012195 x x
South 4205456/73720484 x x
South 4314076/91039198 x x
Central-West 5000708/7003543 x x
Central-West 5106216/9559502 x x
Central-West 5300108/0 x x x x
Credit Union Correspondents with more than one assigned service in 2014
Region
Service offeredCorrespondent
ID code
Region <2003 2003 2004 2005 2006 2007 2008 2009 2010 2011 2012 2013 2014 CAGR 11-14
North n of CU BCs 0 0 0 0 0 1 3 5 6 38 60 67 68 21,4 %
North n of exclusive CU BCs 0 0 0 0 0 1 1 2 4 26 47 53 54 27,6 %
North % of exclusive 0 % 0 % 0 % 0 % 0 % 100 % 33 % 40 % 67 % 68 % 78 % 79 % 79 % 5,1 %
Northeast n of CU BCs 0 0 0 0 0 0 0 1 2 39 40 41 41 1,7 %
Northeast n of exclusive CU BCs 0 0 0 0 0 0 0 0 1 25 23 24 25 0,0 %
Northeast % of exclusive 0 % 0 % 0 % 0 % 0 % 0 % 0 % 0 % 50 % 64 % 58 % 59 % 61 % -1,7 %
Southeast n of CU BCs 3 6 6 7 18 68 100 122 154 592 631 658 661 3,7 %
Southeast n of exclusive CU BCs 3 6 6 7 13 61 88 111 140 493 504 519 528 2,3 %
Southeast % of exclusive 100 % 100 % 100 % 100 % 72 % 90 % 88 % 91 % 91 % 83 % 80 % 79 % 80 % -1,4 %
South n of CU BCs 9 11 11 12 12 27 680 1 243 1 636 2 388 2 631 2 777 2 851 6,1 %
South n of exclusive CU BCs 9 11 11 12 12 27 566 966 1 268 1 830 1 936 1 994 2 115 4,9 %
South % of exclusive 100 % 100 % 100 % 100 % 100 % 100 % 83 % 78 % 78 % 77 % 74 % 72 % 74 % -1,1 %
Center-West n of CU BCs 0 0 0 1 3 6 192 244 265 362 402 411 435 6,3 %
Center-West n of exclusive CU BCs 0 0 0 1 3 5 150 181 207 282 307 311 332 5,6 %
Center-West % of exclusive 0 % 0 % 0 % 100 % 100 % 83 % 78 % 74 % 78 % 78 % 76 % 76 % 76 % -0,7 %
Brazil n of CU BCs 12 17 17 20 33 102 975 1 615 2 063 3 419 3 764 3 954 4 056 5,9 %
Brazil n of exclusive CU BCs 12 17 17 20 28 94 805 1 260 1 620 2 656 2 817 2 901 3 054 4,8 %
Brazil % of total 100 % 100 % 100 % 100 % 85 % 92 % 83 % 78 % 79 % 78 % 75 % 73 % 75 % -1,0 %
Number of operational CU BC per region

168
Appendix 23: Municipalities covered by CU BCs by region (Based on Banco Central do
Brasil, 2015g)
Number of municipalities covered by region
Share of all municipalities of the region covered
Region <2003 2003 2004 2005 2006 2007 2008 2009 2010 2011 2012 2013 2014 CAGR 11-14
North mun. with CU BCs 0 0 0 0 0 1 2 4 5 16 21 23 24 14,5 %
North mun. with exclusive CU BCs 0 0 0 0 0 1 1 2 4 13 18 20 20 15,4 %
North % of exclusive 0 % 0 % 0 % 0 % 0 % 100 % 50 % 50 % 80 % 81 % 86 % 87 % 83 % 0,8 %
Northeast mun. with CU BCs 0 0 0 0 0 0 0 1 2 23 24 24 24 1,4 %
Northeast mun. with exclusive CU BCs 0 0 0 0 0 0 0 0 1 19 17 17 17 -3,6 %
Northeast % of exclusive 0 % 0 % 0 % 0 % 0 % 0 % 0 % 0 % 50 % 83 % 71 % 71 % 71 % -5,0 %
Southeast mun. with CU BCs 1 2 2 2 13 45 57 67 89 193 194 201 205 2,0 %
Southeast mun. with exclusive CU BCs 1 2 2 2 8 40 50 63 84 171 170 172 174 0,6 %
Southeast % of exclusive 100 % 100 % 100 % 100 % 62 % 89 % 88 % 94 % 94 % 89 % 88 % 86 % 85 % -1,4 %
South mun. with CU BCs 6 8 8 9 9 21 371 534 583 716 730 749 756 1,8 %
South mun. with exclusive CU BCs 6 8 8 9 9 21 340 487 539 652 657 679 691 2,0 %
South % of exclusive 100 % 100 % 100 % 100 % 100 % 100 % 92 % 91 % 92 % 91 % 90 % 91 % 91 % 0,1 %
Center-West mun. with CU BCs 0 0 0 1 3 5 92 98 109 126 131 132 136 2,6 %
Center-West mun. with exclusive CU BCs 0 0 0 1 3 4 84 90 103 116 119 121 123 2,0 %
Center-West % of exclusive 0 % 0 % 0 % 100 % 100 % 80 % 91 % 92 % 94 % 92 % 91 % 92 % 90 % -0,6 %
Brazil mun. with CU BCs 7 10 10 12 25 72 522 704 788 1 074 1 100 1 129 1 145 2,2 %
Brazil mun. with exclusive CU BCs 7 10 10 12 20 66 475 642 731 971 981 1 009 1 025 1,8 %
Brazil % of total 100 % 100 % 100 % 100 % 80 % 92 % 91 % 91 % 93 % 90 % 89 % 89 % 90 % -0,3 %
Number of municipalities with operational CU BC
Region <2003 2003 2004 2005 2006 2007 2008 2009 2010 2011 2012 2013 2014 CAGR 11-14
North - share of mun. with CU BC 0,0 % 0,0 % 0,0 % 0,0 % 0,0 % 0,2 % 0,4 % 0,9 % 1,1 % 3,6 % 4,7 % 5,1 % 5,3 % 14,5 %
North - share of mun. with exclusive CU BC 0,0 % 0,0 % 0,0 % 0,0 % 0,0 % 0,2 % 0,2 % 0,4 % 0,9 % 2,9 % 4,0 % 4,5 % 4,5 % 15,4 %
Northeast - share of mun. with CU BC 0,0 % 0,0 % 0,0 % 0,0 % 0,0 % 0,0 % 0,0 % 0,1 % 0,1 % 1,3 % 1,3 % 1,3 % 1,3 % 1,4 %
Northeast - share of mun. with exclusive CU BC 0,0 % 0,0 % 0,0 % 0,0 % 0,0 % 0,0 % 0,0 % 0,0 % 0,1 % 1,1 % 0,9 % 0,9 % 0,9 % -3,6 %
Southeast - share of mun. with CU BC 0,1 % 0,1 % 0,1 % 0,1 % 0,8 % 2,7 % 3,4 % 4,0 % 5,3 % 11,6 % 11,6 % 12,1 % 12,3 % 2,0 %
Southeast - share of mun. with exclusive CU BC 0,1 % 0,1 % 0,1 % 0,1 % 0,5 % 2,4 % 3,0 % 3,8 % 5,0 % 10,3 % 10,2 % 10,3 % 10,4 % 0,6 %
South - share of mun. with CU BC 0,5 % 0,7 % 0,7 % 0,8 % 0,8 % 1,8 % 31,2 % 44,9 % 49,1 % 60,3 % 61,4 % 63,0 % 63,6 % 1,8 %
South - share of mun. with exclusive CU BC 0,5 % 0,7 % 0,7 % 0,8 % 0,8 % 1,8 % 28,6 % 41,0 % 45,4 % 54,9 % 55,3 % 57,2 % 58,2 % 2,0 %
Center-West - share of mun. with CU BC 0,0 % 0,0 % 0,0 % 0,2 % 0,6 % 1,1 % 19,7 % 21,0 % 23,4 % 27,0 % 28,1 % 28,3 % 29,2 % 2,6 %
Center-West - share of mun. with exclusive CU BC 0,0 % 0,0 % 0,0 % 0,2 % 0,6 % 0,9 % 18,0 % 19,3 % 22,1 % 24,9 % 25,5 % 26,0 % 26,4 % 2,0 %
Brazil - share of mun. with CU BC 0,1 % 0,2 % 0,2 % 0,2 % 0,4 % 1,3 % 9,4 % 12,7 % 14,2 % 19,3 % 19,8 % 20,3 % 20,6 % 2,2 %
Brazil - share of mun. with exclusive CU BC 0,1 % 0,2 % 0,2 % 0,2 % 0,4 % 1,2 % 8,5 % 11,5 % 13,1 % 17,4 % 17,6 % 18,1 % 18,4 % 1,8 %
Share of municipalities of the region with CU BCs

169
Appendix 24: Credit Union type and affiliation 2008 – 2014 (Based on Banco Central do
Brasil, 2015c)
Situation in 2008 Unicred Sicoob Independent Ancosol Sicredi Total % of total
Rural Credit 0 30 101 158 2 291 20 %
Mutual Credit 58 135 590 6 36 825 58 %
Free Admission 12 156 44 0 89 301 21 %
Luzzatti 0 1 6 0 2 9 1 %
Total 70 322 741 164 129 1426 100 %
% of total 5 % 23 % 52 % 12 % 9 % 100 %
Types of credit union by affiliation 2008
Situation in 2014 Unicred Sicoob Independent Ancosol Sicredi Total % of total
Rural Credit 0 22 44 159 0 225 20 %
Mutual Credit 47 118 424 7 21 617 54 %
Free Admission 12 156 43 0 80 291 26 %
Luzzatti 0 1 2 0 2 5 0 %
Total 59 297 513 166 103 1138 100 %
% of total 5 % 26 % 45 % 15 % 9 % 100 %
Types of credit union by affiliation 2014
Change 2008-2014 Unicred Sicoob Independent Ancosol Sicredi All
Rural Credit N/A -27 % -56 % 1 % -100 % -23 %
Mutual Credit -19 % -13 % -28 % 17 % -42 % -25 %
Free Admission 0 % 0 % -2 % N/A -10 % -3 %
Luzzatti N/A 0 % -67 % N/A 0 % -44 %
All -16 % -8 % -31 % 1 % -20 % -20 %
Variation of types and affiliations of credit unions, 2008 - 2014
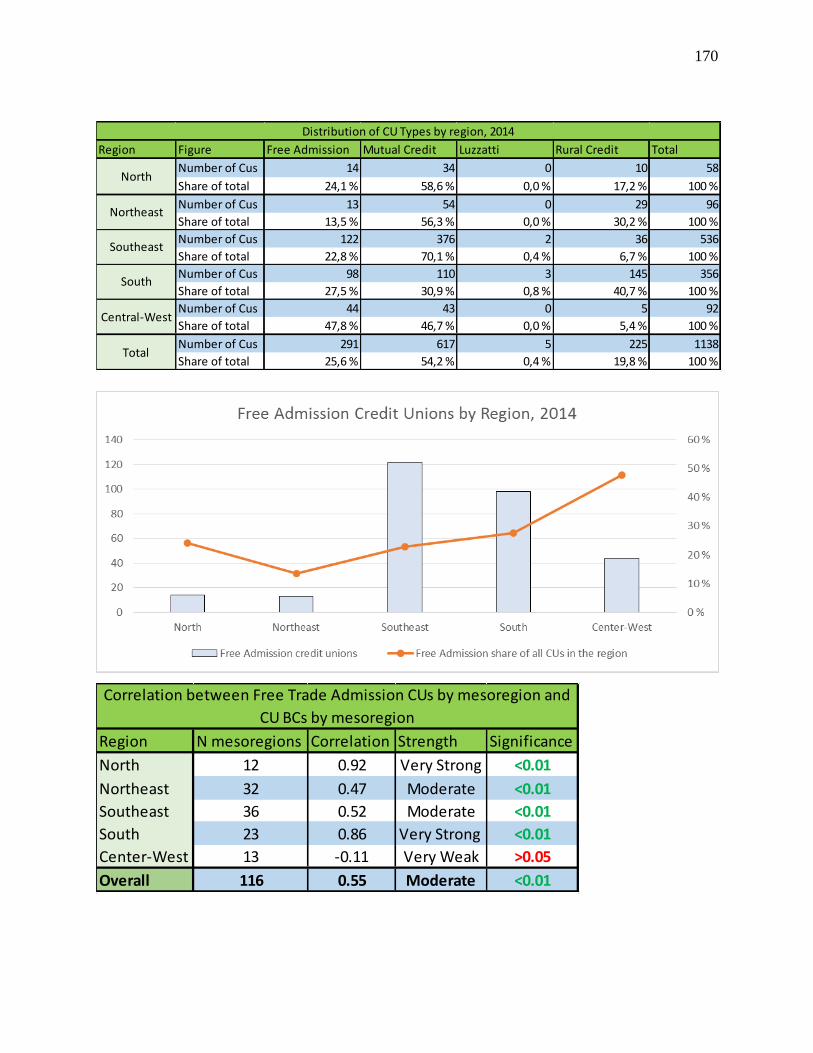
170
Region Figure Free Admission Mutual Credit Luzzatti Rural Credit Total
Number of Cus 14 34 0 10 58
Share of total 24,1 % 58,6 % 0,0 % 17,2 % 100 %
Number of Cus 13 54 0 29 96
Share of total 13,5 % 56,3 % 0,0 % 30,2 % 100 %
Number of Cus 122 376 2 36 536
Share of total 22,8 % 70,1 % 0,4 % 6,7 % 100 %
Number of Cus 98 110 3 145 356
Share of total 27,5 % 30,9 % 0,8 % 40,7 % 100 %
Number of Cus 44 43 0 5 92
Share of total 47,8 % 46,7 % 0,0 % 5,4 % 100 %
Number of Cus 291 617 5 225 1138
Share of total 25,6 % 54,2 % 0,4 % 19,8 % 100 %
North
Distribution of CU Types by region, 2014
Total
Central-West
South
Southeast
Northeast
Region N mesoregions Correlation Strength Significance
North 12 0.92 Very Strong <0.01
Northeast 32 0.47 Moderate <0.01
Southeast 36 0.52 Moderate <0.01
South 23 0.86 Very Strong <0.01
Center-West 13 -0.11 Very Weak >0.05
Overall 116 0.55 Moderate <0.01
Correlation between Free Trade Admission CUs by mesoregion and
CU BCs by mesoregion

171
Appendix 25: Credit Union Correspondents by type and affiliation (Based on Banco Central
do Brasil (2015g and 2015c)
Appendix 26: Share of opened correspondents closed, by affiliation (Based on Banco Central
do Brasil (2015g and 2015c)
2008 2009 2010 2011 2012 2013 2014 2008 2009 2010 2011 2012 2013 2014 2008 2009 2010 2011 2012 2013 2014 2008 2009 2010 2011 2012 2013 2014
Rural Credit 0 0 0 0 0 0 0 0 0 0 0 0 0 0 0 0 0 0 0 0 0 0 % 0 % 0 % 0 % 0 % 0 % 0 %
Mutual Credit 58 57 55 52 49 47 47 83 % 83 % 82 % 81 % 80 % 80 % 80 % 0 0 1 2 2 1 1 0 % 0 % 2 % 4 % 4 % 2 % 2 %
Free Admission 12 12 12 12 12 12 12 17 % 17 % 18 % 19 % 20 % 20 % 20 % 0 0 0 1 1 1 1 0 % 0 % 0 % 8 % 8 % 8 % 8 %
Luzzatti 0 0 0 0 0 0 0 0 % 0 % 0 % 0 % 0 % 0 % 0 % 0 0 0 0 0 0 0 0 % 0 % 0 % 0 % 0 % 0 % 0 %
Total 70 69 67 64 61 59 59 100 % 100 % 100 % 100 % 100 % 100 % 100 % 0 0 1 3 3 2 2 0 % 0 % 1 % 5 % 5 % 3 % 3 %
Rural Credit 30 26 24 22 22 22 22 9 % 8 % 8 % 7 % 7 % 7 % 7 % 1 1 1 6 7 7 7 3 % 4 % 4 % 27 % 32 % 32 % 32 %
Mutual Credit 135 131 129 127 126 122 118 42 % 42 % 42 % 41 % 41 % 41 % 40 % 2 2 4 14 15 15 15 1 % 2 % 3 % 11 % 12 % 12 % 13 %
Free Admission 156 156 156 157 157 156 156 48 % 50 % 50 % 51 % 51 % 52 % 53 % 23 26 31 77 79 78 80 15 % 17 % 20 % 49 % 50 % 50 % 51 %
Luzzatti 1 1 1 1 1 1 1 0 % 0 % 0 % 0 % 0 % 0 % 0 % 0 0 0 0 0 0 0 0 % 0 % 0 % 0 % 0 % 0 % 0 %
Total 322 314 310 307 306 301 297 100 % 100 % 100 % 100 % 100 % 100 % 100 % 26 29 36 97 101 100 102 8 % 9 % 12 % 32 % 33 % 33 % 34 %
Rural Credit 101 88 78 67 60 54 44 14 % 13 % 12 % 11 % 10 % 10 % 9 % 2 1 2 7 6 4 3 2 % 1 % 3 % 10 % 10 % 7 % 7 %
Mutual Credit 590 554 536 505 480 448 424 80 % 80 % 81 % 82 % 82 % 82 % 83 % 0 1 2 8 8 6 6 0 % 0 % 0 % 2 % 2 % 1 % 1 %
Free Admission 44 45 44 43 44 43 43 6 % 7 % 7 % 7 % 7 % 8 % 8 % 5 6 5 5 5 5 5 11 % 13 % 11 % 12 % 11 % 12 % 12 %
Luzzatti 6 5 5 4 4 2 2 1 % 1 % 1 % 1 % 1 % 0 % 0 % 0 0 0 0 0 0 0 0 % 0 % 0 % 0 % 0 % 0 % 0 %
Total 741 692 663 619 588 547 513 100 % 100 % 100 % 100 % 100 % 100 % 100 % 7 8 9 20 19 15 14 1 % 1 % 1 % 3 % 3 % 3 % 3 %
Rural Credit 158 164 163 162 161 160 159 96 % 96 % 96 % 96 % 96 % 96 % 96 % 0 0 0 6 6 6 6 0 % 0 % 0 % 4 % 4 % 4 % 4 %
Mutual Credit 6 7 7 7 6 6 7 4 % 4 % 4 % 4 % 4 % 4 % 4 % 0 0 0 0 0 0 0 0 % 0 % 0 % 0 % 0 % 0 % 0 %
Free Admission 0 0 0 0 0 0 0 0 % 0 % 0 % 0 % 0 % 0 % 0 % 0 0 0 0 0 0 0 0 % 0 % 0 % 0 % 0 % 0 % 0 %
Luzzatti 0 0 0 0 0 0 0 0 % 0 % 0 % 0 % 0 % 0 % 0 % 0 0 0 0 0 0 0 0 % 0 % 0 % 0 % 0 % 0 % 0 %
Total 164 171 170 169 167 166 166 100 % 100 % 100 % 100 % 100 % 100 % 100 % 0 0 0 6 6 6 6 0 % 0 % 0 % 4 % 4 % 4 % 4 %
Rural Credit 2 2 1 1 0 0 0 2 % 2 % 1 % 1 % 0 % 0 % 0 % 1 1 1 1 0 0 0 50 % 50 % 100 % 100 % 0 % 0 % 0 %
Mutual Credit 36 35 31 29 27 22 21 28 % 27 % 25 % 24 % 23 % 20 % 20 % 4 7 4 5 4 1 1 11 % 20 % 13 % 17 % 15 % 5 % 5 %
Free Admission 89 92 90 89 89 84 80 69 % 70 % 73 % 74 % 75 % 78 % 78 % 74 78 80 79 79 77 73 83 % 85 % 89 % 89 % 89 % 92 % 91 %
Luzzatti 2 2 2 2 2 2 2 2 % 2 % 2 % 2 % 2 % 2 % 2 % 1 1 1 1 1 2 2 50 % 50 % 50 % 50 % 50 % 100 % 100 %
Total 129 131 124 121 118 108 103 100 % 100 % 100 % 100 % 100 % 100 % 100 % 80 87 86 86 84 80 76 62 % 66 % 69 % 71 % 71 % 74 % 74 %
Sicredi
Unicred
Sicoob
Independent
Ancosol
Type and affiliation of
credit union
Number of different CU types Share of different CU types Number of CU with BC Share of active CU with BC
Affiliation of CU 2003 2004 2005 2006 2007 2008 2009 2010 2011 2012 2013 2014
Unicred 0 % 0 % 0 % 0 % 0 % 0 % 0 % 0 % 0 % 0 % 33 % 33 %
Sicoob 25 % 25 % 20 % 10 % 7 % 10 % 10 % 11 % 3 % 5 % 7 % 10 %
Independent 0 % 0 % 0 % 0 % 9 % 17 % 23 % 30 % 22 % 23 % 39 % 41 %
Ancosol 0 % 0 % 0 % 0 % 0 % 0 % 0 % 0 % 0 % 0 % 0 % 0 %
Sicredi 0 % 0 % 0 % 0 % 3 % 5 % 7 % 10 % 13 % 17 % 24 % 27 %
Share of opened BCs closed

172
Appendix 27: BC evolution by type of credit union, 2008 – 2014 (Based on Banco Central do
Brasil, 2015c and 2015g)
Unicred 2008 2009 2010 2011 2012 2013 2014 CAGR 11-14
Opened BC 0 0 1 2 0 0 0 -100 %
Closed BC 0 0 0 0 0 1 0 0 %
Operational BC 0 0 1 2 2 2 2 0 %
Exlusive operational BC 0 0 1 0 0 0 1 0 %
PAE 0 0 0 2 2 2 0 -100 %
Sicoob 2008 2009 2010 2011 2012 2013 2014 CAGR 11-14
Opened BC 42 66 50 867 91 155 20 -72 %
Closed BC 6 7 6 9 21 41 35 57 %
Operational BC 87 146 190 1034 1102 1215 1202 5 %
Exlusive operational BC 76 125 170 875 906 988 998 4 %
PAE 0 0 8 206 324 504 660 47 %
Independent 2008 2009 2010 2011 2012 2013 2014 CAGR 11-14
Opened BC 41 40 22 90 26 11 6 -59 %
Closed BC 9 13 13 11 7 43 7 -14 %
Operational BC 52 79 88 164 183 153 152 -3 %
Exlusive operational BC 41 61 72 120 130 102 108 -3 %
PAE 0 0 4 4 4 17 24 82 %
Ancosol 2008 2009 2010 2011 2012 2013 2014 CAGR 11-14
Opened BC 0 0 0 2 1 0 0 -100 %
Closed BC 0 0 0 0 0 0 0 0 %
Operational BC 0 0 0 2 3 3 3 14 %
Exlusive operational BC 0 0 0 0 1 1 1 0 %
PAE 0 0 0 0 0 0 0 0 %
Sicredi 2008 2009 2010 2011 2012 2013 2014 CAGR 11-14
Opened BC 850 619 476 589 411 426 312 -19 %
Closed BC 43 67 85 147 151 314 190 9 %
Operational BC 843 1398 1789 2220 2479 2593 2704 7 %
Exlusive operational BC 682 1067 1373 1638 1757 1781 1922 5 %
PAE 0 0 0 0 0 0 0 0 %

173
Appendix 28: Sicoob-affiliated credit unions, BCs and PAEs, 2008 - 2014 (Based on Banco
Central do Brasil, 2015c, 2015f and 2015g)
Appendix 29: Credit Unions with BCs by affiliation and region (Based on Banco Central do
Brasil, 2015c and 2015g)
Indicator 2008 2009 2010 2011 2012 2013 2014 CAGR 11-14
Active credit unions 322 314 310 307 306 301 297 -1,1 %
CU with only BC 26 29 34 78 76 68 65 -5,9 %
CU with only PAE 0 0 3 28 33 37 39 11,7 %
Cu with PAE and BC 0 0 2 22 28 36 41 23,1 %
Sicoob - credit unions with BC versus PAE
Affiliation by region
Unicred 2008 2009 2010 2011 2012 2013 2014 2008 2009 2010 2011 2012 2013 2014 2008 2009 2010 2011 2012 2013 2014
North 4 4 4 4 4 4 4 0 0 0 0 0 0 0 0 % 0 % 0 % 0 % 0 % 0 % 0 %
Northeast 22 22 22 21 20 19 19 0 0 0 0 0 0 0 0 % 0 % 0 % 0 % 0 % 0 % 0 %
Southeast 32 32 30 29 28 28 28 0 0 1 3 3 2 2 0 % 0 % 3 % 10 % 11 % 7 % 7 %
South 12 11 11 10 9 8 8 0 0 0 0 0 0 0 0 % 0 % 0 % 0 % 0 % 0 % 0 %
Central-West 0 0 0 0 0 0 0 0 0 0 0 0 0 0 - - - - - - -
Total 70 69 67 64 61 59 59 0 0 1 3 3 2 2 0 % 0 % 1 % 5 % 5 % 3 % 3 %
Affiliation by region
Sicoob 2008 2009 2010 2011 2012 2013 2014 2008 2009 2010 2011 2012 2013 2014 2008 2009 2010 2011 2012 2013 2014
North 20 21 21 22 21 19 19 1 1 1 2 2 2 2 5 % 5 % 5 % 9 % 10 % 11 % 11 %
Northeast 27 27 27 25 25 26 25 0 1 1 3 4 4 4 0 % 4 % 4 % 12 % 16 % 15 % 16 %
Southeast 191 186 181 183 184 182 179 23 23 29 63 65 63 63 12 % 12 % 16 % 34 % 35 % 35 % 35 %
South 58 55 56 54 53 51 51 2 4 5 25 26 27 29 3 % 7 % 9 % 46 % 49 % 53 % 57 %
Central-West 26 25 25 23 23 23 23 0 0 0 4 4 4 4 0 % 0 % 0 % 17 % 17 % 17 % 17 %
Total 322 314 310 307 306 301 297 26 29 36 97 101 100 102 8 % 9 % 12 % 32 % 33 % 33 % 34 %
Affiliation by region
Independent 2008 2009 2010 2011 2012 2013 2014 2008 2009 2010 2011 2012 2013 2014 2008 2009 2010 2011 2012 2013 2014
North 48 44 43 37 37 35 29 0 1 0 0 0 0 0 0 % 2 % 0 % 0 % 0 % 0 % 0 %
Northeast 81 73 68 57 50 44 36 0 0 0 5 5 3 2 0 % 0 % 0 % 9 % 10 % 7 % 6 %
Southeast 428 399 380 363 345 323 311 3 4 4 5 5 4 4 1 % 1 % 1 % 1 % 1 % 1 % 1 %
South 109 106 104 101 100 93 88 3 2 4 9 8 8 8 3 % 2 % 4 % 9 % 8 % 9 % 9 %
Central-West 75 70 68 61 56 52 49 1 1 1 1 1 0 0 1 % 1 % 1 % 2 % 2 % 0 % 0 %
Total 741 692 663 619 588 547 513 7 8 9 20 19 15 14 1 % 1 % 1 % 3 % 3 % 3 % 3 %
Affiliation by region
Ancosol 2008 2009 2010 2011 2012 2013 2014 2008 2009 2010 2011 2012 2013 2014 2008 2009 2010 2011 2012 2013 2014
North 1 3 3 3 3 3 3 0 0 0 0 0 0 0 0 % 0 % 0 % 0 % 0 % 0 % 0 %
Northeast 19 20 18 17 16 16 16 0 0 0 2 2 2 2 0 % 0 % 0 % 12 % 13 % 13 % 13 %
Southeast 8 8 8 8 7 7 7 0 0 0 0 0 0 0 0 % 0 % 0 % 0 % 0 % 0 % 0 %
South 136 140 141 141 141 140 140 0 0 0 4 4 4 4 0 % 0 % 0 % 3 % 3 % 3 % 3 %
Central-West 0 0 0 0 0 0 0 0 0 0 0 0 0 0 - - - - - - -
Total 164 171 170 169 167 166 166 0 0 0 6 6 6 6 0 % 0 % 0 % 4 % 4 % 4 % 4 %
Affiliation by region
Sicredi 2008 2009 2010 2011 2012 2013 2014 2008 2009 2010 2011 2012 2013 2014 2008 2009 2010 2011 2012 2013 2014
North 4 5 4 4 3 3 3 1 2 2 2 2 2 2 25 % 40 % 50 % 50 % 67 % 67 % 67 %
Northeast 0 0 0 0 0 0 0 0 0 0 0 0 0 0 - - - - - - -
Southeast 17 17 17 16 16 13 11 0 1 1 2 2 3 3 0 % 6 % 6 % 13 % 13 % 23 % 27 %
South 85 85 81 79 79 72 69 60 65 64 63 63 59 55 71 % 76 % 79 % 80 % 80 % 82 % 80 %
Central-West 23 24 22 22 20 20 20 19 19 19 19 17 16 16 83 % 79 % 86 % 86 % 85 % 80 % 80 %
Total 129 131 124 121 118 108 103 80 87 86 86 84 80 76 62 % 66 % 69 % 71 % 71 % 74 % 74 %
Number of Credit unions Number of CU with BC
Number of Credit unions Number of CU with BC Share of all active
Number of Credit unions Number of CU with BC Share of all active
Share of all active
Number of Credit unions Number of CU with BC Share of all active
Number of Credit unions Number of CU with BC Share of all active

174
Appendix 30: Credit Union BCs by affiliation and region (Based on Banco Central do Brasil,
2015c and 2015g)
Unicred 2008 2009 2010 2011 2012 2013 2014 CAGR 11-14 n of CU 2014
North 0 0 0 0 0 0 0 0,0 % 4
Northeast 0 0 0 0 0 0 0 0,0 % 19
Southeast 0 0 0 1 1 1 1 0,0 % 28
South 0 0 0 0 0 0 0 0,0 % 8
Central-West 0 0 1 1 1 1 1 0,0 % 0
Total 0 0 1 2 2 2 2 0,0 % 59
Sicoob 2008 2009 2010 2011 2012 2013 2014 CAGR 11-14 n of CU 2014
North 1 1 1 30 51 58 58 24,6 % 19
Northeast 0 1 2 18 19 20 20 3,6 % 25
Southeast 75 92 121 539 573 585 580 2,5 % 179
South 11 52 66 443 455 548 540 6,8 % 51
Central-West 0 0 0 4 4 4 4 0,0 % 23
Total 87 146 190 1034 1102 1215 1202 5,1 % 297
Independent 2008 2009 2010 2011 2012 2013 2014 CAGR 11-14 n of CU 2014
North 0 1 1 0 0 0 0 0,0 % 29
Northeast 0 0 0 5 5 5 5 0,0 % 36
Southeast 25 29 31 46 49 55 58 8,0 % 311
South 10 32 40 84 95 69 65 -8,2 % 88
Central-West 17 17 16 29 34 24 24 -6,1 % 49
Total 52 79 88 164 183 153 152 -2,5 % 513
Ancosol 2008 2009 2010 2011 2012 2013 2014 CAGR 11-14 n of CU 2014
North 0 0 0 0 0 0 0 0,0 % 3
Northeast 0 0 0 0 0 0 0 0,0 % 16
Southeast 0 0 0 0 0 0 0 0,0 % 7
South 0 0 0 1 2 2 2 26,0 % 140
Central-West 0 0 0 1 1 1 1 0,0 % 0
Total 0 0 0 2 3 3 3 14,5 % 166
Sicredi 2008 2009 2010 2011 2012 2013 2014 CAGR 11-14 n of CU 2014
North 2 3 4 8 9 9 10 7,7 % 3
Northeast 0 0 0 0 0 0 0 0,0 % 0
Southeast 0 1 2 7 9 18 23 48,7 % 11
South 662 1163 1531 1868 2086 2169 2254 6,5 % 69
Central-West 179 231 252 337 375 397 417 7,4 % 20
Total 843 1398 1789 2220 2479 2593 2704 6,8 % 103
Number of BCs by affiliation by region
Number of BCs by affiliation by region
Number of BCs by affiliation by region
Number of BCs by affiliation by region
Number of BCs by affiliation by region

175
Appendix 31: Codes and grouping used for the analysis of Panambi interviews
Group Code
Panambi general (PG)
Panambi Development (PD)
Panambi Financial Inclusion (PBFI)
Sicredi History (SC)
Sicredi on Banking Correspondents (SoBC)
Sicredi Banking Correspondent Registration (SBCR)
Sicredi Banking Correspondent Technology (SBCT)
Sicredi Banking Correspondent Location (SBCL)
Sicredi on Usefulness of Banking Correspondents (SoUBC)
Sicredi on Banking Correspondent Problems (SoBCP)
Sicredi on Banking Correspondents with Inc V (SoBCI5)
Multi-Bank Banking Correspondents (MBBC)
Sicredi Future Plans for Banking Correspondents – (SFPfBC)
Banks BC Commercial Banks on Banking Correspondents (CBoBC)
Opinion on Sicredi (OoS)
Opinion on Banking Correspondents (OoBC)
Banking Correspondents on Usefulness (BcoU)
Banking Correspondents on Challenges (BCoC)
General
Sicredi BC
Opinions of
Stakeholders

176
Appendix 32: Examples of initial search for relationships between CU BCs and CU
financials (Based on Banco Central do Brasil, 2015b, 2015g)
All credit unions active in 2014, all regions ( Pearson Correlations)
1138 n 78 204 75 108 108 200 3 9 78 204 75 108 200 3 9
Opened
Cumul
Opened Closed
Cumul
Closed % closed
Operatio
nal
Opened
Inc V
Operatio
nal Inc V Opened
Cumul
Opened Closed
Cumul
Closed
Operatio
nal
Opened
Inc V
Operatio
nal Inc V
2008 2014 2013 2014 2014 2014 2012 2014 2008 2014 2013 2014 2014 2012 2014
Active 2015 0,04 0,05 0,04 0,04 0,05 0,05 0,01 0,01 0,05 0,05 0,04 0,04 0,05 0,01 0,01
PABs 2014 0,04 - 0,04 0,03 0,01 0,16 0,04 0,01 - 0,01 - 0,04 - 0,04 0,03 0,02 0,05 0,01 - 0,01 -
2011 0,01 - 0,02 - 0,01 - 0,02 - 0,01 0,02 - 0,00 0,02 - 0,01 - 0,02 - 0,01 - 0,02 - 0,02 - 0,00 0,02 -
2015sep 0,03 - 0,03 - 0,03 - 0,03 - 0,02 - 0,03 - 0,01 - 0,02 - 0,03 - 0,03 - 0,03 - 0,03 - 0,03 - 0,01 - 0,02 -
%Change 0,02 - 0,02 - 0,03 - 0,02 - 0,03 - 0,02 - 0,01 - 0,01 - 0,02 - 0,02 - 0,03 - 0,02 - 0,02 - 0,01 - 0,01 -
2011 0,04 - 0,01 - 0,03 - 0,04 - 0,04 - 0,00 0,01 - 0,01 - 0,04 - 0,00 - 0,03 - 0,04 - 0,01 0,01 - 0,01 -
2015sep 0,04 - 0,03 0,03 - 0,04 - 0,05 - 0,06 0,01 - 0,02 - 0,04 - 0,05 0,03 - 0,04 - 0,07 0,01 - 0,02 -
%Change 0,02 - 0,02 - 0,01 - 0,01 - 0,01 - 0,02 - 0,00 - 0,00 - 0,02 - 0,02 - 0,01 - 0,01 - 0,02 - 0,00 - 0,00 -
2011 0,10 0,11 0,07 0,08 0,11 0,10 0,03 0,02 0,11 0,11 0,07 0,08 0,10 0,03 0,02
2015sep 0,08 0,09 0,05 0,06 0,11 0,08 0,01 0,01 0,08 0,09 0,05 0,06 0,08 0,01 0,01
%Change 0,02 - 0,02 - 0,01 - 0,02 - 0,02 - 0,02 - 0,00 - 0,01 - 0,02 - 0,02 - 0,01 - 0,02 - 0,02 - 0,00 - 0,01 -
2011 0,19 0,28 0,15 0,17 0,18 0,28 0,05 0,06 0,19 0,28 0,16 0,17 0,29 0,05 0,06
2015sep 0,16 0,25 0,12 0,15 0,16 0,25 0,03 0,04 0,16 0,26 0,12 0,15 0,26 0,03 0,04
%Change 0,01 - 0,01 - 0,01 - 0,01 - 0,01 - 0,01 - 0,00 - 0,00 - 0,01 - 0,01 - 0,01 - 0,01 - 0,01 - 0,00 - 0,00 -
2011 0,03 0,03 0,02 0,03 0,02 0,03 0,00 0,00 0,03 0,03 0,02 0,03 0,03 0,00 0,00
2015sep 0,04 0,04 0,03 0,04 0,04 0,04 0,01 0,01 0,04 0,04 0,03 0,04 0,03 0,01 0,01
%Change 0,01 0,01 0,00 0,00 0,00 0,01 0,00 0,00 0,01 0,01 0,00 0,00 0,01 0,00 0,00
2011 0,01 0,01 0,01 0,01 0,01 0,01 0,00 0,00 0,01 0,01 0,01 0,01 0,01 0,00 0,00
2015sep 0,04 0,04 0,02 0,04 0,04 0,04 0,01 0,01 0,04 0,04 0,02 0,04 0,04 0,01 0,01
%Change 0,00 - 0,00 - 0,00 - 0,00 - 0,00 - 0,00 - 0,00 - 0,00 - 0,00 - 0,00 - 0,00 - 0,00 - 0,00 - 0,00 - 0,00 -
2011 0,22 0,18 0,15 0,18 0,17 0,16 0,03 0,05 0,22 0,18 0,14 0,18 0,16 0,03 0,05
2015sep 0,28 0,23 0,19 0,23 0,22 0,20 0,06 0,09 0,28 0,22 0,19 0,23 0,20 0,06 0,09
%Change 0,01 - 0,01 - 0,01 - 0,01 - 0,01 - 0,01 - 0,00 - 0,00 - 0,01 - 0,01 - 0,01 - 0,01 - 0,01 - 0,00 - 0,00 -
2011 0,15 0,23 0,12 0,13 0,14 0,24 0,04 0,05 0,15 0,24 0,12 0,13 0,25 0,04 0,05
2015sep 0,09 0,17 0,07 0,08 0,09 0,18 0,02 0,02 0,09 0,18 0,07 0,08 0,19 0,02 0,02
%Change 0,01 - 0,01 - 0,01 - 0,01 - 0,01 - 0,01 - 0,00 - 0,00 - 0,01 - 0,01 - 0,01 - 0,01 - 0,01 - 0,00 - 0,00 -
2011 0,10 0,11 0,08 0,09 0,10 0,10 0,02 0,03 0,10 0,11 0,08 0,09 0,10 0,02 0,03
2015sep 0,09 0,11 0,07 0,08 0,11 0,11 0,01 0,02 0,09 0,11 0,07 0,08 0,10 0,01 0,02
%Change 0,05 - 0,05 - 0,05 - 0,05 - 0,04 - 0,04 - 0,02 - 0,02 - 0,05 - 0,05 - 0,05 - 0,05 - 0,04 - 0,02 - 0,02 -
2011 0,23 0,26 0,19 0,22 0,23 0,24 0,04 0,07 0,23 0,25 0,19 0,22 0,23 0,04 0,07
2015sep 0,19 0,21 0,15 0,18 0,19 0,20 0,04 0,06 0,19 0,21 0,15 0,18 0,19 0,04 0,06
2011-2015 0,05 0,06 0,04 0,05 0,06 0,06 0,02 0,02 0,06 0,06 0,04 0,05 0,06 0,02 0,02
2011 0,01 0,01 0,01 0,01 0,01 0,01 0,00 0,00 0,01 0,01 0,01 0,01 0,01 0,00 0,00
2015sep 0,12 0,12 0,08 0,11 0,09 0,11 0,02 0,03 0,12 0,12 0,08 0,12 0,10 0,02 0,03
%Change 0,01 0,01 0,01 0,01 0,01 0,01 0,00 0,00 0,01 0,01 0,01 0,01 0,01 0,00 0,00
2011 0,17 0,19 0,14 0,17 0,16 0,17 0,01 0,04 0,17 0,18 0,14 0,17 0,17 0,01 0,03
2015sep 0,25 0,28 0,19 0,25 0,22 0,25 0,05 0,08 0,25 0,27 0,19 0,25 0,25 0,05 0,08
%Change 0,01 0,01 0,01 0,01 0,01 0,01 0,00 0,01 0,01 0,01 0,01 0,01 0,01 0,00 0,01
2011 0,01 0,01 0,01 0,02 0,02 0,01 0,00 0,00 0,01 0,01 0,01 0,02 0,01 0,00 0,00
2015sep 0,02 0,01 0,00 0,01 0,01 0,01 0,00 0,00 0,02 0,01 0,00 0,01 0,01 0,00 0,00
%Change 0,01 - 0,01 - 0,01 - 0,01 - 0,01 - 0,01 - 0,00 - 0,00 - 0,01 - 0,01 - 0,01 - 0,01 - 0,01 - 0,00 - 0,00 -
ROE
Banking
Profitability
All Credit Unions all
regions (active 2014)
Inv. In Credit
operations
Treasury
investments
Funding by LT
deposits
Coverage with
services
Operational
Efficiency
Banking
Margin
Other revenue
share
Service
Revenue Share
Credit Volume
Assets size
ROA

177
All credit unions in the South region ( Pearson Correlations)
356 n 52 97 51 62 62 96 3 7 52 97 51 62 96 3 7
Opened
Cumul
Opened Closed
Cumul
Closed % closed
Operatio
nal
Opened
Inc V
Operatio
nal Inc V Opened
Cumul
Opened Closed
Cumul
Closed
Operatio
nal
Opened
Inc V
Operatio
nal Inc V
2008 2014 2013 2014 2014 2014 2012 2014 2008 2014 2013 2014 2014 2012 2014
Active 2015 0,04 0,04 0,03 0,04 0,04 0,04 0,01 0,01 0,04 0,04 0,03 0,04 0,04 0,01 0,01
PABs 2014 N/A N/A N/A N/A N/A N/A N/A N/A N/A N/A N/A N/A N/A N/A N/A
2011 0,07 - 0,08 - 0,05 - 0,07 - 0,08 - 0,08 - 0,01 0,03 - 0,07 - 0,08 - 0,05 - 0,07 - 0,08 - 0,01 0,03 -
2015sep 0,12 - 0,12 - 0,09 - 0,10 - 0,11 - 0,11 - 0,02 - 0,05 - 0,12 - 0,12 - 0,09 - 0,10 - 0,11 - 0,02 - 0,05 -
%Change 0,07 - 0,05 - 0,05 - 0,05 - 0,04 - 0,05 - 0,03 - 0,04 - 0,07 - 0,05 - 0,05 - 0,05 - 0,05 - 0,03 - 0,04 -
2011 0,01 0,29 0,02 0,01 - 0,03 - 0,35 0,01 - 0,02 - 0,01 0,33 0,02 0,01 - 0,39 0,01 - 0,02 -
2015sep 0,02 - 0,27 0,00 0,02 - 0,04 - 0,33 0,00 - 0,01 - 0,02 - 0,31 0,01 0,02 - 0,37 0,00 - 0,01 -
%Change 0,05 - 0,05 - 0,04 - 0,04 - 0,05 - 0,05 - 0,01 - 0,01 - 0,05 - 0,05 - 0,04 - 0,04 - 0,05 - 0,01 - 0,01 -
2011 0,15 0,12 0,09 0,09 0,09 0,11 0,07 0,06 0,15 0,12 0,09 0,09 0,11 0,07 0,06
2015sep 0,09 0,08 0,05 0,05 0,07 0,08 0,04 0,02 0,09 0,08 0,05 0,05 0,08 0,04 0,03
%Change 0,03 - 0,03 - 0,02 - 0,02 - 0,03 - 0,03 - 0,01 - 0,01 - 0,03 - 0,03 - 0,02 - 0,02 - 0,03 - 0,01 - 0,01 -
2011 0,27 0,42 0,21 0,23 0,22 0,44 0,08 0,09 0,27 0,44 0,21 0,23 0,45 0,08 0,09
2015sep 0,14 0,27 0,10 0,11 0,11 0,29 0,04 0,04 0,14 0,28 0,10 0,11 0,30 0,04 0,04
%Change 0,08 - 0,08 - 0,06 - 0,07 - 0,08 - 0,08 - 0,02 - 0,02 - 0,08 - 0,08 - 0,06 - 0,07 - 0,07 - 0,02 - 0,02 -
2011 0,10 0,09 0,07 0,09 0,07 0,08 0,02 0,02 0,10 0,09 0,07 0,09 0,08 0,02 0,02
2015sep 0,13 0,11 0,09 0,11 0,12 0,10 0,03 0,03 0,13 0,11 0,09 0,11 0,09 0,03 0,03
%Change 0,02 0,01 0,01 0,01 0,01 0,01 0,00 0,00 0,02 0,01 0,01 0,01 0,01 0,00 0,00
2011 0,04 0,04 0,03 0,04 0,04 0,04 0,01 0,00 0,04 0,04 0,03 0,04 0,04 0,01 0,00
2015sep 0,20 0,17 0,13 0,17 0,17 0,15 0,05 0,06 0,20 0,16 0,13 0,17 0,14 0,05 0,06
%Change 0,01 0,00 0,00 - 0,00 0,00 0,00 0,00 0,00 0,01 0,00 0,00 - 0,00 0,00 0,00 0,00
2011 0,33 0,21 0,17 0,23 0,22 0,18 0,04 0,07 0,33 0,20 0,17 0,23 0,17 0,04 0,07
2015sep 0,44 0,32 0,26 0,34 0,32 0,28 0,09 0,14 0,45 0,31 0,26 0,34 0,26 0,09 0,14
%Change 0,04 0,02 0,02 0,03 0,04 0,02 0,02 0,02 0,04 0,02 0,02 0,03 0,02 0,02 0,02
2011 0,18 0,33 0,14 0,15 0,13 0,35 0,06 0,07 0,18 0,35 0,14 0,15 0,37 0,06 0,07
2015sep 0,03 0,17 0,02 0,02 0,01 - 0,20 0,01 0,01 0,03 0,19 0,02 0,02 0,21 0,01 0,01
%Change 0,08 - 0,09 - 0,06 - 0,07 - 0,08 - 0,08 - 0,02 - 0,02 - 0,08 - 0,08 - 0,06 - 0,07 - 0,08 - 0,02 - 0,02 -
2011 0,03 - 0,04 - 0,03 - 0,03 - 0,06 - 0,04 - 0,00 - 0,01 - 0,03 - 0,05 - 0,03 - 0,03 - 0,04 - 0,00 - 0,01 -
2015sep 0,08 - 0,10 - 0,08 - 0,08 - 0,10 - 0,09 - 0,03 - 0,04 - 0,08 - 0,10 - 0,08 - 0,08 - 0,09 - 0,03 - 0,04 -
%Change 0,09 - 0,08 - 0,08 - 0,09 - 0,07 - 0,07 - 0,04 - 0,04 - 0,09 - 0,08 - 0,08 - 0,09 - 0,07 - 0,04 - 0,04 -
2011 0,32 0,31 0,24 0,28 0,30 0,28 0,06 0,09 0,32 0,30 0,24 0,28 0,27 0,06 0,09
2015sep 0,32 0,31 0,24 0,28 0,30 0,28 0,06 0,10 0,32 0,30 0,24 0,28 0,27 0,06 0,10
2011-2015 0,03 0,03 0,01 0,01 0,03 0,04 0,04 0,04 0,03 0,03 0,01 0,01 0,03 0,04 0,04
2011 0,26 0,31 0,24 0,29 0,31 0,28 0,03 0,05 0,26 0,31 0,24 0,29 0,27 0,03 0,05
2015sep 0,34 0,33 0,28 0,34 0,41 0,28 0,09 0,12 0,33 0,32 0,28 0,34 0,27 0,09 0,12
%Change 0,09 0,08 0,05 0,06 0,10 0,07 0,02 0,04 0,09 0,08 0,05 0,06 0,07 0,02 0,04
2011 0,31 0,36 0,28 0,35 0,32 0,33 0,03 0,08 0,31 0,35 0,28 0,35 0,31 0,03 0,08
2015sep 0,35 0,34 0,28 0,35 0,39 0,30 0,08 0,13 0,35 0,33 0,28 0,35 0,29 0,08 0,13
%Change 0,08 0,07 0,05 0,06 0,10 0,07 0,02 0,04 0,08 0,07 0,05 0,06 0,07 0,02 0,04
2011 0,12 0,12 0,09 0,11 0,09 0,11 0,03 0,03 0,12 0,12 0,09 0,11 0,11 0,03 0,03
2015sep 0,15 0,12 0,10 0,13 0,13 0,11 0,04 0,05 0,15 0,12 0,09 0,13 0,10 0,04 0,05
%Change 0,09 0,05 0,04 0,07 0,10 0,04 0,02 0,03 0,09 0,05 0,04 0,07 0,04 0,02 0,03
Credit Volume
Assets size
ROA
ROE
Banking
Profitability
Inv. In Credit
operations
Treasury
investments
Funding by LT
deposits
Coverage with
services
Operational
Efficiency
All Credit Unions South
region (active 2014)
Banking
Margin
Other revenue
share
Service
Revenue Share

178
Free Admission credit unions active in 2014, all regions ( Pearson Correlations)
291 n 76 160 71 102 102 159 3 6 76 160 71 102 159 3 6
Opened
Cumul
Opened Closed
Cumul
Closed % closed
Operatio
nal
Opened
Inc V
Operatio
nal Inc V Opened
Cumul
Opened Closed
Cumul
Closed
Operatio
nal
Opened
Inc V
Operatio
nal Inc V
2008 2014 2013 2014 2014 2014 2012 2014 2008 2014 2013 2014 2014 2012 2014
Active 2015 0,04 0,05 0,03 0,03 0,05 0,05 0,01 0,01 0,04 0,05 0,03 0,03 0,05 0,01 0,01
PABs 2014 0,17 - 0,11 - 0,07 - 0,10 - 0,07 0,10 - 0,03 - 0,04 - 0,17 - 0,10 - 0,07 - 0,10 - 0,09 - 0,03 - 0,04 -
2011 0,09 - 0,08 - 0,07 - 0,10 - 0,04 - 0,07 - 0,01 0,05 - 0,09 - 0,08 - 0,07 - 0,10 - 0,06 - 0,00 0,05 -
2015sep 0,10 - 0,08 - 0,10 - 0,08 - 0,04 - 0,07 - 0,02 - 0,07 - 0,09 - 0,08 - 0,10 - 0,08 - 0,07 - 0,02 - 0,07 -
%Change 0,02 - 0,02 - 0,04 - 0,01 - 0,02 - 0,03 - 0,03 - 0,02 - 0,02 - 0,02 - 0,04 - 0,01 - 0,03 - 0,03 - 0,02 -
2011 0,05 0,01 0,02 0,00 - 0,14 0,02 0,02 - 0,03 - 0,06 0,02 0,02 0,00 0,03 0,02 - 0,03 -
2015sep 0,03 - 0,03 - 0,01 - 0,06 - 0,04 - 0,02 - 0,01 - 0,04 - 0,02 - 0,03 - 0,01 - 0,05 - 0,02 - 0,01 - 0,04 -
%Change 0,16 - 0,14 - 0,09 - 0,12 - 0,14 - 0,13 - 0,02 - 0,03 - 0,16 - 0,14 - 0,09 - 0,12 - 0,13 - 0,02 - 0,02 -
2011 0,05 - 0,11 - 0,09 - 0,09 - 0,03 - 0,10 - 0,01 0,02 - 0,04 - 0,11 - 0,09 - 0,09 - 0,10 - 0,01 0,02 -
2015sep 0,14 - 0,18 - 0,15 - 0,16 - 0,06 - 0,17 - 0,03 - 0,07 - 0,13 - 0,18 - 0,14 - 0,16 - 0,16 - 0,03 - 0,07 -
%Change 0,19 - 0,19 - 0,12 - 0,16 - 0,07 - 0,18 - 0,08 - 0,09 - 0,20 - 0,19 - 0,12 - 0,16 - 0,18 - 0,08 - 0,09 -
2011 0,26 0,29 0,20 0,22 0,23 0,28 0,09 0,09 0,27 0,29 0,20 0,22 0,28 0,09 0,09
2015sep 0,10 0,12 0,05 0,09 0,12 0,12 0,02 0,02 0,10 0,12 0,05 0,09 0,12 0,02 0,02
%Change 0,23 - 0,23 - 0,19 - 0,20 - 0,21 - 0,22 - 0,06 - 0,08 - 0,23 - 0,24 - 0,19 - 0,20 - 0,22 - 0,06 - 0,08 -
2011 0,04 0,02 0,02 0,04 0,04 0,01 0,00 - 0,00 - 0,04 0,02 0,01 0,04 0,01 0,00 - 0,00 -
2015sep 0,13 0,10 0,04 0,12 0,09 0,08 0,01 0,02 0,13 0,10 0,04 0,11 0,08 0,01 0,02
%Change 0,04 0,05 0,02 - 0,03 0,01 0,05 0,00 - 0,01 0,04 0,05 0,02 - 0,03 0,05 0,00 - 0,01
2011 0,06 0,06 0,04 0,06 0,08 0,05 0,01 0,01 0,06 0,06 0,04 0,06 0,05 0,01 0,01
2015sep 0,02 0,00 - 0,05 - 0,02 0,01 - 0,01 - 0,00 0,01 0,02 0,01 - 0,05 - 0,01 0,01 - 0,00 0,01
%Change 0,02 - 0,01 - 0,06 - 0,03 - 0,03 - 0,00 - 0,01 - 0,00 - 0,02 - 0,01 - 0,06 - 0,03 - 0,00 - 0,01 - 0,00 -
2011 0,39 0,32 0,22 0,28 0,27 0,29 0,04 0,08 0,39 0,32 0,21 0,28 0,29 0,04 0,08
2015sep 0,44 0,36 0,26 0,32 0,28 0,33 0,09 0,13 0,44 0,36 0,26 0,32 0,33 0,09 0,13
%Change 0,04 0,01 0,01 0,02 0,01 - 0,00 0,02 0,03 0,04 0,01 0,01 0,02 0,00 0,02 0,03
2011 0,17 0,19 0,13 0,14 0,16 0,19 0,07 0,07 0,18 0,19 0,13 0,14 0,19 0,07 0,07
2015sep 0,01 - 0,00 - 0,02 - 0,02 - 0,03 0,01 0,01 0,00 - 0,01 - 0,00 0,02 - 0,02 - 0,01 0,01 0,00 -
%Change 0,26 - 0,27 - 0,20 - 0,23 - 0,23 - 0,25 - 0,07 - 0,08 - 0,26 - 0,27 - 0,20 - 0,23 - 0,25 - 0,07 - 0,08 -
2011 0,17 0,24 0,15 0,15 0,17 0,25 0,04 0,04 0,17 0,24 0,15 0,15 0,25 0,04 0,04
2015sep 0,04 0,11 0,02 0,03 0,06 0,13 0,01 - 0,00 - 0,05 0,11 0,02 0,03 0,13 0,01 - 0,00 -
%Change 0,13 - 0,15 - 0,13 - 0,13 - 0,12 - 0,13 - 0,04 - 0,04 - 0,13 - 0,15 - 0,13 - 0,13 - 0,14 - 0,04 - 0,04 -
2011 0,34 0,40 0,26 0,32 0,26 0,39 0,05 0,09 0,34 0,40 0,26 0,32 0,38 0,05 0,09
2015sep 0,33 0,39 0,24 0,30 0,25 0,38 0,06 0,09 0,33 0,39 0,24 0,30 0,38 0,06 0,09
2011-2015 0,01 0,01 0,04 - 0,02 - 0,01 0,02 0,05 0,04 0,01 0,01 0,04 - 0,02 - 0,02 0,05 0,04
2011 0,17 0,20 0,12 0,20 0,11 0,17 0,02 - 0,01 - 0,16 0,19 0,12 0,19 0,16 0,02 - 0,01 -
2015sep 0,26 0,28 0,16 0,27 0,16 0,25 0,05 0,07 0,26 0,28 0,16 0,27 0,25 0,05 0,07
%Change 0,09 0,11 0,03 0,06 0,05 0,12 0,04 0,04 0,09 0,11 0,03 0,06 0,12 0,04 0,04
2011 0,31 0,40 0,27 0,36 0,24 0,37 0,01 - 0,04 0,31 0,40 0,27 0,36 0,36 0,01 - 0,04
2015sep 0,32 0,38 0,22 0,33 0,21 0,36 0,06 0,11 0,31 0,38 0,22 0,33 0,35 0,06 0,11
%Change 0,05 0,07 0,01 0,02 0,03 0,09 0,03 0,03 0,06 0,08 0,01 0,03 0,09 0,03 0,03
2011 0,04 - 0,04 - 0,03 - 0,02 - 0,00 0,05 - 0,00 - 0,01 - 0,04 - 0,04 - 0,04 - 0,02 - 0,05 - 0,00 - 0,01 -
2015sep 0,00 - 0,02 - 0,05 - 0,01 - 0,02 - 0,02 - 0,01 - 0,01 - 0,01 - 0,02 - 0,05 - 0,01 - 0,02 - 0,00 - 0,01 -
%Change 0,02 0,00 0,04 - 0,00 0,03 - 0,00 - 0,00 - 0,00 0,02 0,00 - 0,04 - 0,00 0,00 - 0,00 - 0,00
ROA
ROE
Banking
Profitability
Banking
Margin
Other revenue
share
Service
Revenue Share
Credit Volume
Assets size
Inv. In Credit
operations
Treasury
investments
Funding by LT
deposits
Coverage with
services
Operational
Efficiency
Free Admission Credit
Unions all regions (active
2014)

179
Sicredi-affiliated credit unions active in 2014, all regions ( Pearson Correlations)
103 n 64 76 51 62 62 76 3 7 64 76 51 62 76 3 7
Opened
Cumul
Opened Closed
Cumul
Closed % closed
Operatio
nal
Opened
Inc V
Operatio
nal Inc V Opened
Cumul
Opened Closed
Cumul
Closed
Operatio
nal
Opened
Inc V
Operatio
nal Inc V
2008 2014 2013 2014 2014 2014 2012 2014 2008 2014 2013 2014 2014 2012 2014
Active 2015 0,15 0,16 0,10 0,11 0,15 0,15 0,02 0,03 0,15 0,16 0,10 0,12 0,15 0,02 0,03
PABs 2014 N/A N/A N/A N/A N/A N/A N/A N/A N/A N/A N/A N/A N/A N/A N/A
2011 0,21 0,23 0,13 0,13 0,24 0,23 0,07 0,01 0,22 0,24 0,13 0,13 0,24 0,07 0,01
2015sep 0,33 0,31 0,19 0,24 0,37 0,29 0,06 0,02 0,34 0,32 0,19 0,24 0,30 0,06 0,02
%Change 0,12 0,07 0,05 0,11 0,13 0,05 0,01 - 0,00 0,12 0,07 0,05 0,11 0,04 0,01 - 0,00
2011 0,05 0,01 - 0,05 - 0,04 - 0,17 0,01 0,03 - 0,05 - 0,06 0,00 0,05 - 0,04 - 0,02 0,03 - 0,05 -
2015sep 0,05 - 0,04 - 0,04 - 0,06 - 0,09 - 0,03 - 0,01 - 0,03 - 0,05 - 0,04 - 0,04 - 0,06 - 0,02 - 0,01 - 0,03 -
%Change 0,11 - 0,09 - 0,05 - 0,07 - 0,10 - 0,08 - 0,01 - 0,02 - 0,11 - 0,09 - 0,05 - 0,07 - 0,08 - 0,01 - 0,02 -
2011 0,15 0,07 0,04 0,04 0,12 0,07 0,06 0,02 0,16 0,08 0,04 0,04 0,08 0,06 0,02
2015sep 0,19 0,14 0,04 0,08 0,24 0,14 0,02 0,02 - 0,20 0,14 0,05 0,09 0,14 0,02 0,02 -
%Change 0,10 - 0,08 - 0,08 - 0,07 - 0,03 0,07 - 0,07 - 0,08 - 0,10 - 0,08 - 0,08 - 0,07 - 0,07 - 0,07 - 0,08 -
2011 0,34 0,41 0,25 0,25 0,22 0,42 0,12 0,11 0,34 0,42 0,25 0,25 0,42 0,12 0,11
2015sep 0,42 0,43 0,25 0,32 0,29 0,40 0,08 0,09 0,43 0,43 0,26 0,32 0,41 0,08 0,10
%Change 0,11 0,02 0,02 0,08 0,11 0,02 - 0,05 - 0,03 - 0,10 0,02 0,02 0,09 0,02 - 0,05 - 0,03 -
2011 0,17 0,17 0,12 0,14 0,19 0,15 0,02 0,03 0,17 0,17 0,12 0,15 0,15 0,02 0,03
2015sep 0,22 0,22 0,15 0,19 0,25 0,19 0,03 0,05 0,22 0,22 0,15 0,20 0,19 0,03 0,05
%Change 0,04 0,03 0,02 0,04 0,01 - 0,02 0,00 - 0,00 0,03 0,03 0,02 0,04 0,02 0,00 - 0,00
2011 0,10 0,11 0,07 0,08 0,10 0,10 0,02 0,02 0,10 0,11 0,07 0,08 0,10 0,02 0,02
2015sep 0,32 0,31 0,22 0,29 0,33 0,27 0,06 0,08 0,32 0,31 0,22 0,29 0,27 0,06 0,08
%Change 0,06 0,05 0,04 0,05 0,00 0,04 0,01 0,01 0,06 0,05 0,04 0,05 0,04 0,01 0,01
2011 0,18 0,16 0,12 0,14 0,26 0,14 0,05 - 0,01 - 0,18 0,15 0,12 0,14 0,13 0,05 - 0,02 -
2015sep 0,14 0,16 0,12 0,13 0,23 0,14 0,01 0,04 0,14 0,16 0,12 0,13 0,14 0,01 0,04
%Change 0,02 - 0,02 0,01 0,01 0,01 0,02 0,06 0,05 0,01 - 0,02 0,01 0,01 0,02 0,06 0,06
2011 0,30 0,38 0,21 0,21 0,16 0,39 0,12 0,11 0,31 0,39 0,21 0,21 0,40 0,12 0,11
2015sep 0,33 0,36 0,19 0,21 0,16 0,36 0,08 0,08 0,34 0,36 0,19 0,22 0,37 0,08 0,08
%Change 0,00 - 0,07 - 0,06 - 0,03 - 0,02 - 0,08 - 0,06 - 0,06 - 0,01 - 0,08 - 0,06 - 0,03 - 0,08 - 0,06 - 0,06 -
2011 0,08 0,18 0,11 0,07 0,12 0,20 0,03 0,02 0,09 0,19 0,11 0,08 0,20 0,03 0,02
2015sep 0,18 0,24 0,08 0,10 0,16 0,27 0,01 0,02 0,19 0,25 0,08 0,10 0,27 0,01 0,02
%Change 0,02 0,04 - 0,08 - 0,05 - 0,03 - 0,03 - 0,02 - 0,01 - 0,02 0,04 - 0,08 - 0,05 - 0,03 - 0,02 - 0,01 -
2011 0,31 0,35 0,23 0,27 0,27 0,32 0,03 0,07 0,30 0,35 0,23 0,27 0,32 0,03 0,07
2015sep 0,29 0,33 0,21 0,25 0,26 0,31 0,04 0,07 0,29 0,33 0,20 0,25 0,31 0,04 0,07
2011-2015 0,11 0,12 0,01 0,05 0,11 0,13 0,07 0,07 0,11 0,12 0,01 0,05 0,13 0,07 0,07
2011 0,36 0,40 0,31 0,39 0,37 0,33 0,04 - 0,02 - 0,35 0,39 0,31 0,39 0,32 0,04 - 0,02 -
2015sep 0,41 0,39 0,28 0,41 0,40 0,31 0,08 0,11 0,41 0,39 0,29 0,41 0,31 0,08 0,11
%Change 0,02 - 0,03 - 0,04 - 0,03 - 0,03 0,03 - 0,01 0,03 0,02 - 0,03 - 0,04 - 0,03 - 0,02 - 0,01 0,03
2011 0,29 0,42 0,34 0,40 0,33 0,35 0,05 - 0,01 0,28 0,41 0,33 0,39 0,34 0,05 - 0,01
2015sep 0,42 0,45 0,30 0,43 0,37 0,38 0,07 0,15 0,41 0,45 0,30 0,44 0,38 0,07 0,14
%Change 0,03 - 0,04 - 0,05 - 0,04 - 0,02 0,04 - 0,00 - 0,03 0,03 - 0,04 - 0,05 - 0,04 - 0,03 - 0,00 - 0,03
2011 0,24 0,26 0,17 0,21 0,25 0,23 0,05 0,05 0,24 0,26 0,17 0,21 0,23 0,05 0,05
2015sep 0,34 0,33 0,23 0,29 0,36 0,29 0,06 0,08 0,34 0,33 0,23 0,30 0,29 0,06 0,08
%Change 0,25 0,23 0,16 0,22 0,27 0,20 0,04 0,06 0,25 0,23 0,17 0,22 0,20 0,04 0,06
Banking
Profitability
Sicredi all regions (active
2014)
Inv. In Credit
operations
Treasury
investments
Funding by LT
deposits
Coverage with
services
Operational
Efficiency
Banking
Margin
Other revenue
share
Service
Revenue Share
Credit Volume
Assets size
ROA
ROE

180
Appendix 33: Examples of more detailed search for relationships between CU BCs and CU
financials (Based on Banco Central do Brasil, 2015c and 2015g)
CU BC intensity vs. Return on Equity
CU BC intensity vs. Size
n = 1089
n (>0) All CUs operational in 2015 2009 2010 2011 2012 2013 2014 2015sep
95 2008 0,11 0,15 0,17 0,22 0,38 0,26 0,27
103 2009 0,13 0,17 0,19 0,23 0,39 0,26 0,26
115 2010 0,13 0,17 0,19 0,23 0,39 0,26 0,26
189 2011 0,15 0,17 0,16 0,20 0,33 0,22 0,23
193 2012 0,15 0,17 0,16 0,21 0,35 0,23 0,24
197 2013 0,15 0,17 0,17 0,22 0,35 0,24 0,25
199 2014 0,14 0,17 0,17 0,22 0,35 0,24 0,24
n = 203
n (>0) All CUs with BCs 2009 2010 2011 2012 2013 2014 2015sep
95 2008 0,13 0,20 0,30 0,38 0,45 0,19 0,29
103 2009 0,19 0,25 0,37 0,43 0,47 0,19 0,28
115 2010 0,19 0,26 0,37 0,44 0,47 0,19 0,28
189 2011 0,24 0,24 0,23 0,31 0,33 0,14 0,21
193 2012 0,23 0,24 0,24 0,34 0,35 0,15 0,22
197 2013 0,23 0,24 0,25 0,36 0,36 0,15 0,23
199 2014 0,22 0,24 0,25 0,37 0,37 0,15 0,22
Correlation BC intensity - ROE for Credit Unions operational in 2015
Correlation BC intensity - ROE for Credit Unions operational in 2015
n = 1089
n (>0) All CUs operational in 2015 2008 2009 2010 2011 2012 2013 2014 2015sep
95 2008 0,21 0,21 0,23 0,25 0,26 0,30 0,31 0,33
103 2009 0,21 0,22 0,24 0,26 0,27 0,31 0,32 0,34
115 2010 0,21 0,22 0,24 0,26 0,27 0,31 0,32 0,34
189 2011 0,18 0,19 0,21 0,23 0,24 0,27 0,28 0,30
193 2012 0,19 0,20 0,22 0,23 0,25 0,28 0,29 0,31
197 2013 0,19 0,20 0,22 0,24 0,25 0,28 0,30 0,31
199 2014 0,19 0,20 0,22 0,24 0,25 0,28 0,30 0,31
n = 203
n (>0) All CUs with BCs 2008 2009 2010 2011 2012 2013 2014 2015sep
95 2008 0,29 0,30 0,37 0,37 0,48 0,47 0,46 0,46
103 2009 0,31 0,33 0,40 0,40 0,52 0,51 0,50 0,49
115 2010 0,30 0,32 0,41 0,40 0,53 0,52 0,50 0,50
189 2011 0,22 0,22 0,27 0,27 0,34 0,32 0,32 0,32
193 2012 0,23 0,23 0,28 0,28 0,36 0,35 0,34 0,34
197 2013 0,23 0,24 0,29 0,29 0,37 0,36 0,35 0,35
199 2014 0,23 0,24 0,30 0,30 0,38 0,37 0,36 0,36
Correlation BC intensity - Asset Size for Credit Unions operational in 2015
Correlation BC intensity - Asset Size for Credit Unions operational in 2015
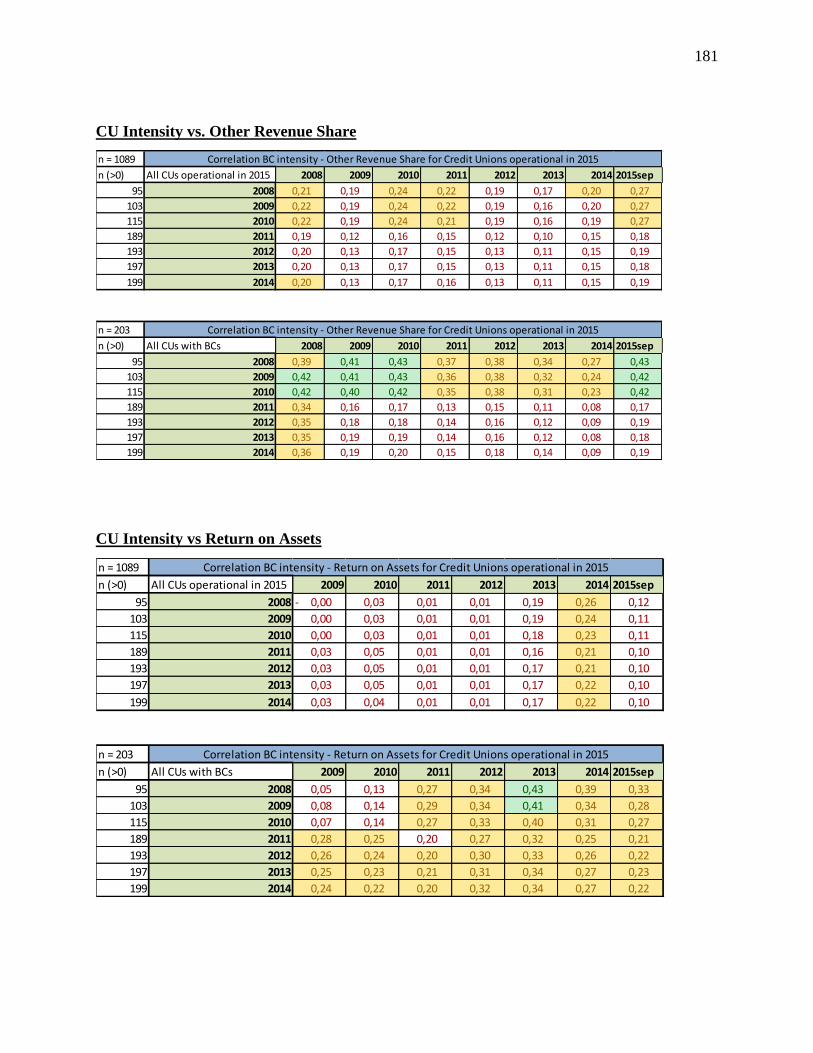
181
CU Intensity vs. Other Revenue Share
CU Intensity vs Return on Assets
n = 1089
n (>0) All CUs operational in 2015 2008 2009 2010 2011 2012 2013 2014 2015sep
95 2008 0,21 0,19 0,24 0,22 0,19 0,17 0,20 0,27
103 2009 0,22 0,19 0,24 0,22 0,19 0,16 0,20 0,27
115 2010 0,22 0,19 0,24 0,21 0,19 0,16 0,19 0,27
189 2011 0,19 0,12 0,16 0,15 0,12 0,10 0,15 0,18
193 2012 0,20 0,13 0,17 0,15 0,13 0,11 0,15 0,19
197 2013 0,20 0,13 0,17 0,15 0,13 0,11 0,15 0,18
199 2014 0,20 0,13 0,17 0,16 0,13 0,11 0,15 0,19
n = 203
n (>0) All CUs with BCs 2008 2009 2010 2011 2012 2013 2014 2015sep
95 2008 0,39 0,41 0,43 0,37 0,38 0,34 0,27 0,43
103 2009 0,42 0,41 0,43 0,36 0,38 0,32 0,24 0,42
115 2010 0,42 0,40 0,42 0,35 0,38 0,31 0,23 0,42
189 2011 0,34 0,16 0,17 0,13 0,15 0,11 0,08 0,17
193 2012 0,35 0,18 0,18 0,14 0,16 0,12 0,09 0,19
197 2013 0,35 0,19 0,19 0,14 0,16 0,12 0,08 0,18
199 2014 0,36 0,19 0,20 0,15 0,18 0,14 0,09 0,19
Correlation BC intensity - Other Revenue Share for Credit Unions operational in 2015
Correlation BC intensity - Other Revenue Share for Credit Unions operational in 2015
n = 1089
n (>0) All CUs operational in 2015 2009 2010 2011 2012 2013 2014 2015sep
95 2008 0,00 - 0,03 0,01 0,01 0,19 0,26 0,12
103 2009 0,00 0,03 0,01 0,01 0,19 0,24 0,11
115 2010 0,00 0,03 0,01 0,01 0,18 0,23 0,11
189 2011 0,03 0,05 0,01 0,01 0,16 0,21 0,10
193 2012 0,03 0,05 0,01 0,01 0,17 0,21 0,10
197 2013 0,03 0,05 0,01 0,01 0,17 0,22 0,10
199 2014 0,03 0,04 0,01 0,01 0,17 0,22 0,10
n = 203
n (>0) All CUs with BCs 2009 2010 2011 2012 2013 2014 2015sep
95 2008 0,05 0,13 0,27 0,34 0,43 0,39 0,33
103 2009 0,08 0,14 0,29 0,34 0,41 0,34 0,28
115 2010 0,07 0,14 0,27 0,33 0,40 0,31 0,27
189 2011 0,28 0,25 0,20 0,27 0,32 0,25 0,21
193 2012 0,26 0,24 0,20 0,30 0,33 0,26 0,22
197 2013 0,25 0,23 0,21 0,31 0,34 0,27 0,23
199 2014 0,24 0,22 0,20 0,32 0,34 0,27 0,22
Correlation BC intensity - Return on Assets for Credit Unions operational in 2015
Correlation BC intensity - Return on Assets for Credit Unions operational in 2015

182
CU Intensity vs. Coverage with Services
CU Intensity vs. Banking Profitability
n = 1089
n (>0) All CUs operational in 2015 2008 2009 2010 2011 2012 2013 2014 2015sep
95 2008 0,15 0,18 0,20 0,21 0,25 0,23 0,21 0,17
103 2009 0,15 0,18 0,20 0,21 0,26 0,24 0,21 0,17
115 2010 0,15 0,18 0,21 0,21 0,25 0,24 0,21 0,16
189 2011 0,18 0,34 0,35 0,30 0,35 0,34 0,28 0,26
193 2012 0,18 0,33 0,34 0,30 0,35 0,34 0,28 0,26
197 2013 0,18 0,33 0,34 0,30 0,35 0,34 0,28 0,26
199 2014 0,18 0,33 0,34 0,29 0,35 0,33 0,28 0,26
n = 203
n (>0) All CUs with BCs 2008 2009 2010 2011 2012 2013 2014 2015sep
95 2008 0,04 0,03 0,07 0,19 0,18 0,19 0,21 0,10
103 2009 0,02 0,04 0,08 0,20 0,18 0,20 0,21 0,07
115 2010 0,02 0,04 0,09 0,20 0,18 0,21 0,20 0,07
189 2011 0,12 0,47 0,51 0,51 0,47 0,51 0,48 0,40
193 2012 0,12 0,44 0,48 0,49 0,46 0,50 0,46 0,38
197 2013 0,11 0,42 0,47 0,48 0,45 0,48 0,45 0,37
199 2014 0,12 0,42 0,46 0,47 0,44 0,47 0,44 0,37
Correlation BC intensity - Coverage with Services for Credit Unions operational in 2015
Correlation BC intensity - Coverage with Services for Credit Unions operational in 2015
n = 1089
n (>0) All CUs operational in 2015 2008 2009 2010 2011 2012 2013 2014 2015sep
95 2008 0,05 - 0,04 - 0,02 - 0,01 0,01 0,04 0,06 0,00
103 2009 0,05 - 0,04 - 0,02 - 0,01 0,01 0,04 0,05 0,01 -
115 2010 0,05 - 0,04 - 0,02 - 0,01 0,00 0,04 0,04 0,01 -
189 2011 0,04 - 0,03 - 0,01 - 0,01 0,01 0,04 0,05 0,01 -
193 2012 0,04 - 0,03 - 0,01 - 0,01 0,01 0,04 0,05 0,01 -
197 2013 0,05 - 0,03 - 0,01 - 0,01 0,01 0,04 0,04 0,01 -
199 2014 0,05 - 0,03 - 0,01 - 0,01 0,01 0,04 0,04 0,01 -
n = 203
n (>0) All CUs with BCs 2008 2009 2010 2011 2012 2013 2014 2015sep
95 2008 0,03 0,01 - 0,02 0,10 0,12 0,20 0,16 0,20
103 2009 0,02 0,01 - 0,01 0,08 0,11 0,18 0,12 0,14
115 2010 0,01 0,02 - 0,01 0,07 0,10 0,17 0,10 0,13
189 2011 0,10 0,08 0,09 0,09 0,13 0,17 0,11 0,13
193 2012 0,09 0,07 0,09 0,09 0,14 0,18 0,11 0,13
197 2013 0,09 0,07 0,08 0,08 0,13 0,17 0,10 0,12
199 2014 0,08 0,07 0,08 0,08 0,13 0,16 0,10 0,12
Correlation BC intensity - Banking Profitability for Credit Unions operational in 2015
Correlation BC intensity - Banking Profitability for Credit Unions operational in 2015

183
Appendix 34: Illustration of some relationships between CU BCs and CU financials,
average from 2012 to 2014 (Based on Banco Central do Brasil, 2015c and 2015g)
BC Intensity vs. Return on Equity
All credit unions
By type of credit union

184
By affiliation
By region

185
BC Intensity vs. Asset Size
All credit unions
By type of credit union

186
By affiliation
By Region

187
BC Intensity vs. Other Revenue Share
All credit unions
By type of credit union

188
By affiliation
By region

189
BC Intensity vs. Return on Assets
All credit unions
By type of Credit union

190
By affiliation
By region

191
BC Intensity vs. Coverage with Services
All credit unions
By type of credit union

192
By affiliation
By region
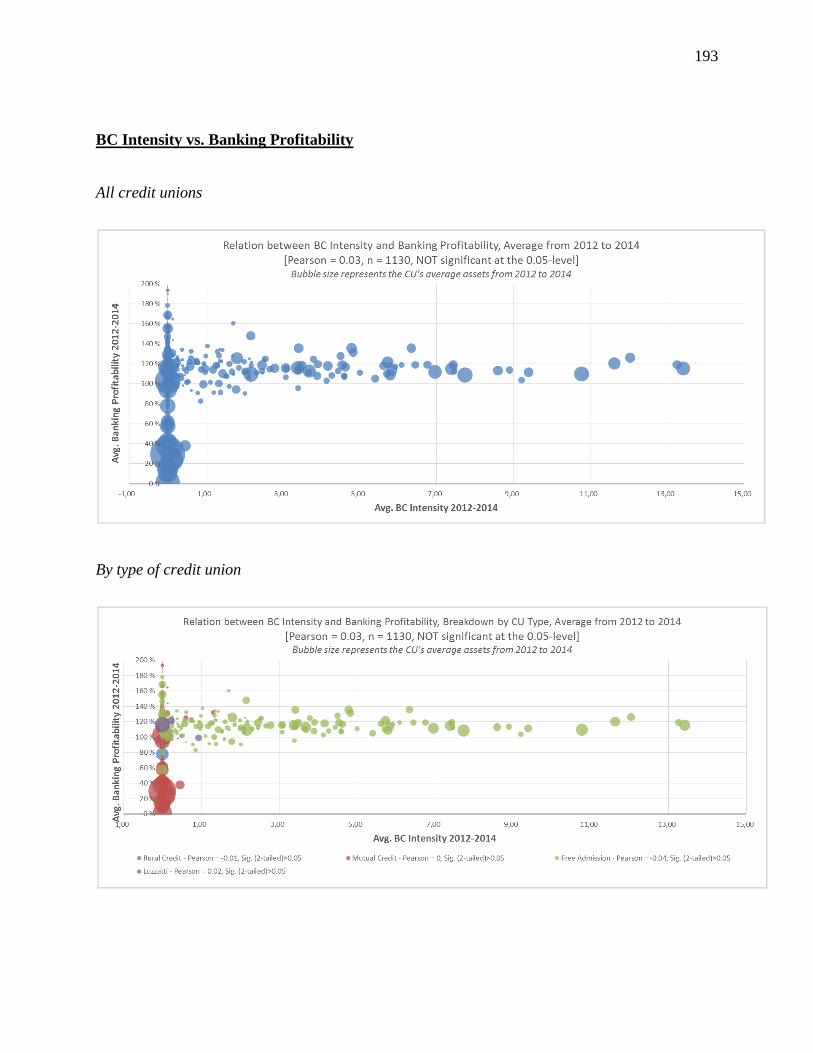
193
BC Intensity vs. Banking Profitability
All credit unions
By type of credit union

194
By affiliation
By region

195
Appendix 35: Search for potential hidden variables explaining the observed relationships
(Based on Banco Central do Brasil, 2015c and 2015g)
All Credit Unions
Avg. BC
Intensity
2012-14
Avg. ROE
2012-14
Avg. Size
2012-
2014
Avg. Other
Revenue
Share
2012-14
Avg. ROA
2012-14
Avg.
Coverage
with
Services
2012-
2014
Avg.
Banking
Profitability
2012-14
Pearson Correlation 1 ,323**
,298**
,145** ,012 ,318
** ,031
Sig. (2-tailed) ,000 ,000 ,000 ,679 ,000 ,292
N 1130 1130 1130 1130 1130 1130 1130
Pearson Correlation ,323** 1 ,528
**,085
**,421
**,184
**,290
**
Sig. (2-tailed) ,000 ,000 ,004 ,000 ,000 ,000
N 1130 1130 1130 1130 1130 1130 1130
Pearson Correlation ,298**
,528** 1 ,209
**,159
**,203
** -,013
Sig. (2-tailed) ,000 ,000 ,000 ,000 ,000 ,666
N 1130 1130 1130 1130 1130 1130 1130
Pearson Correlation ,145**
,085**
,209** 1 -,027 ,173
**-,068
*
Sig. (2-tailed) ,000 ,004 ,000 ,361 ,000 ,022
N 1130 1130 1130 1130 1130 1130 1130
Pearson Correlation ,012 ,421**
,159** -,027 1 ,007 ,078
**
Sig. (2-tailed) ,679 ,000 ,000 ,361 ,810 ,009
N 1130 1130 1130 1130 1130 1130 1130
Pearson Correlation ,318**
,184**
,203**
,173** ,007 1 -,016
Sig. (2-tailed) ,000 ,000 ,000 ,000 ,810 ,582
N 1130 1130 1130 1130 1130 1130 1130
Pearson Correlation ,031 ,290** -,013 -,068
*,078
** -,016 1
Sig. (2-tailed) ,292 ,000 ,666 ,022 ,009 ,582
N 1130 1130 1130 1130 1130 1130 1130
Avg. Other Revenue Share 2012-14
All
Avg. BC Intensity 2012-14
Avg. ROE 2012-14
Avg. Size 2012-2014
Avg. ROA 2012-14
Avg. Coverage with Services 2012-2014
Avg. Banking Profitability 2012-14
**. Correlation is significant at the 0.01 level (2-tailed).
*. Correlation is significant at the 0.05 level (2-tailed).

196
Type: Free Admission Credit Unions
Avg. BC
Intensity
2012-14
Avg. ROE
2012-14
Avg. Size
2012-
2014
Avg. Other
Revenue
Share
2012-14
Avg. ROA
2012-14
Avg.
Coverage
with
Services
2012-
2014
Avg.
Banking
Profitability
2012-14
Pearson
Correlation1 ,569
**,597
**,277
**,381
**,307
** -,040
Sig. (2-tailed) ,000 ,000 ,000 ,000 ,000 ,493
N 290 290 290 290 290 290 290
Pearson
Correlation,569
** 1 ,706**
,161**
,856**
,204**
,220**
Sig. (2-tailed) ,000 ,000 ,006 ,000 ,000 ,000
N 290 290 290 290 290 290 290
Pearson
Correlation,597
**,706
** 1 ,280**
,549** ,024 ,015
Sig. (2-tailed) ,000 ,000 ,000 ,000 ,682 ,801
N 290 290 290 290 290 290 290
Pearson
Correlation ,277**
,161**
,280** 1 ,090 ,045 ,051
Sig. (2-tailed) ,000 ,006 ,000 ,126 ,443 ,387
N 290 290 290 290 290 290 290
Pearson
Correlation,381
**,856
**,549
** ,090 1 ,061 ,547**
Sig. (2-tailed) ,000 ,000 ,000 ,126 ,300 ,000
N 290 290 290 290 290 290 290
Pearson
Correlation ,307**
,204** ,024 ,045 ,061 1 -,053
Sig. (2-tailed) ,000 ,000 ,682 ,443 ,300 ,371
N 290 290 290 290 290 290 290
Pearson
Correlation -,040 ,220** ,015 ,051 ,547
** -,053 1
Sig. (2-tailed) ,493 ,000 ,801 ,387 ,000 ,371
N 290 290 290 290 290 290 290
Free Admission
Avg. BC Intensity 2012-14
Avg. ROE 2012-14
Avg. Size 2012-2014
Avg. Other Revenue Share 2012-14
Avg. ROA 2012-14
Avg. Coverage with Services 2012-
2014
Avg. Banking Profitability 2012-14
**. Correlation is significant at the 0.01 level (2-tailed).

197
Affiliation: Sicredi
Avg. BC
Intensity
2012-14
Avg. ROE
2012-14
Avg. Size
2012-
2014
Avg. Other
Revenue
Share
2012-14
Avg. ROA
2012-14
Avg.
Coverage
with
Services
2012-
2014
Avg.
Banking
Profitability
2012-14
Pearson
Correlation1 ,573
**,497
** ,012 ,492**
,444**
,298**
Sig. (2-tailed) ,000 ,000 ,906 ,000 ,000 ,002
N 101 101 101 101 101 101 101
Pearson
Correlation,573
** 1 ,509** ,118 ,934
**,523
**,575
**
Sig. (2-tailed) ,000 ,000 ,240 ,000 ,000 ,000
N 101 101 101 101 101 101 101
Pearson
Correlation,497
**,509
** 1 ,212*
,450** ,005 -,154
Sig. (2-tailed) ,000 ,000 ,034 ,000 ,964 ,123
N 101 101 101 101 101 101 101
Pearson
Correlation,012 ,118 ,212
* 1 ,071 -,129 ,188
Sig. (2-tailed) ,906 ,240 ,034 ,478 ,199 ,060
N 101 101 101 101 101 101 101
Pearson
Correlation,492
**,934
**,450
** ,071 1 ,497**
,602**
Sig. (2-tailed) ,000 ,000 ,000 ,478 ,000 ,000
N 101 101 101 101 101 101 101
Pearson
Correlation,444
**,523
** ,005 -,129 ,497** 1 ,665
**
Sig. (2-tailed) ,000 ,000 ,964 ,199 ,000 ,000
N 101 101 101 101 101 101 101
Pearson
Correlation,298
**,575
** -,154 ,188 ,602**
,665** 1
Sig. (2-tailed) ,002 ,000 ,123 ,060 ,000 ,000
N 101 101 101 101 101 101 101
**. Correlation is significant at the 0.01 level (2-tailed).
*. Correlation is significant at the 0.05 level (2-tailed).
Avg. Other Revenue Share 2012-14
Avg. ROA 2012-14
Avg. Coverage with Services 2012-
2014
Avg. Banking Profitability 2012-14
Sicredi
Avg. BC Intensity 2012-14
Avg. ROE 2012-14
Avg. Size 2012-2014

198
Affiliation: Sicoob
Avg. BC
Intensity
2012-14
Avg. ROE
2012-14
Avg. Size
2012-
2014
Avg. Other
Revenue
Share
2012-14
Avg. ROA
2012-14
Avg.
Coverage
with
Services
2012-
2014
Avg.
Banking
Profitability
2012-14
Pearson
Correlation1 ,235
**,152
** -,079 ,203**
,350** ,071
Sig. (2-tailed) ,000 ,009 ,177 ,000 ,000 ,225
N 295 295 295 295 295 295 295
Pearson
Correlation,235
** 1 ,514** -,016 ,845
**,127
*,366
**
Sig. (2-tailed) ,000 ,000 ,789 ,000 ,029 ,000
N 295 295 295 295 295 295 295
Pearson
Correlation,152
**,514
** 1 ,041 ,326**
-,233**
-,179**
Sig. (2-tailed) ,009 ,000 ,485 ,000 ,000 ,002
N 295 295 295 295 295 295 295
Pearson
Correlation-,079 -,016 ,041 1 -,047 -,108 ,130
*
Sig. (2-tailed) ,177 ,789 ,485 ,422 ,065 ,026
N 295 295 295 295 295 295 295
Pearson
Correlation,203
**,845
**,326
** -,047 1 ,110 ,569**
Sig. (2-tailed) ,000 ,000 ,000 ,422 ,059 ,000
N 295 295 295 295 295 295 295
Pearson
Correlation,350
**,127
*-,233
** -,108 ,110 1 ,300**
Sig. (2-tailed) ,000 ,029 ,000 ,065 ,059 ,000
N 295 295 295 295 295 295 295
Pearson
Correlation,071 ,366
**-,179
**,130
*,569
**,300
** 1
Sig. (2-tailed) ,225 ,000 ,002 ,026 ,000 ,000
N 295 295 295 295 295 295 295
Avg. Other Revenue Share 2012-14
Sicoob
Avg. BC Intensity 2012-14
Avg. ROE 2012-14
Avg. Size 2012-2014
Avg. ROA 2012-14
Avg. Coverage with Services 2012-
2014
Avg. Banking Profitability 2012-14
**. Correlation is significant at the 0.01 level (2-tailed).
*. Correlation is significant at the 0.05 level (2-tailed).

199
Region: South
Avg. BC
Intensity
2012-14
Avg. ROE
2012-14
Avg. Size
2012-
2014
Avg. Other
Revenue
Share
2012-14
Avg. ROA
2012-14
Avg.
Coverage
with
Services
2012-
2014
Avg.
Banking
Profitability
2012-14
Pearson
Correlation1 ,473
**,372
**,139
**,404
**,425
**,134
*
Sig. (2-tailed) ,000 ,000 ,009 ,000 ,000 ,012
N 352 352 352 352 352 352 352
Pearson
Correlation,473
** 1 ,638** ,046 ,877
**,269
**,360
**
Sig. (2-tailed) ,000 ,000 ,389 ,000 ,000 ,000
N 352 352 352 352 352 352 352
Pearson
Correlation,372
**,638
** 1 ,170**
,519** ,086 -,125
*
Sig. (2-tailed) ,000 ,000 ,001 ,000 ,109 ,019
N 352 352 352 352 352 352 352
Pearson
Correlation,139
** ,046 ,170** 1 -,101 ,051 ,058
Sig. (2-tailed) ,009 ,389 ,001 ,058 ,343 ,282
N 352 352 352 352 352 352 352
Pearson
Correlation,404
**,877
**,519
** -,101 1 ,199**
,498**
Sig. (2-tailed) ,000 ,000 ,000 ,058 ,000 ,000
N 352 352 352 352 352 352 352
Pearson
Correlation,425
**,269
** ,086 ,051 ,199** 1 ,149
**
Sig. (2-tailed) ,000 ,000 ,109 ,343 ,000 ,005
N 352 352 352 352 352 352 352
Pearson
Correlation,134
*,360
**-,125
* ,058 ,498**
,149** 1
Sig. (2-tailed) ,012 ,000 ,019 ,282 ,000 ,005
N 352 352 352 352 352 352 352
South
Avg. BC Intensity 2012-14
Avg. ROE 2012-14
Avg. Size 2012-2014
Avg. Other Revenue Share 2012-14
*. Correlation is significant at the 0.05 level (2-tailed).
Avg. ROA 2012-14
Avg. Coverage with Services 2012-
2014
Avg. Banking Profitability 2012-14
**. Correlation is significant at the 0.01 level (2-tailed).

200
Region: Central-West
Appendix 36: Interpretation of the value of the Pearson correlation (Based on Evans, 1996)
Avg. BC
Intensity
2012-14
Avg. ROE
2012-14
Avg. Size
2012-
2014
Avg. Other
Revenue
Share
2012-14
Avg. ROA
2012-14
Avg.
Coverage
with
Services
2012-
Avg.
Banking
Profitability
2012-14
Pearson Correlation 1 ,636**
,432**
,335**
,298**
,389** ,093
Sig. (2-tailed) ,000 ,000 ,001 ,004 ,000 ,379
N 91 91 91 91 91 91 91
Pearson Correlation ,636** 1 ,614
**,251
*,827
** ,164 ,399**
Sig. (2-tailed) ,000 ,000 ,016 ,000 ,121 ,000
N 91 91 91 91 91 91 91
Pearson Correlation ,432**
,614** 1 ,279
**,406
** -,059 -,031
Sig. (2-tailed) ,000 ,000 ,007 ,000 ,577 ,768
N 91 91 91 91 91 91 91
Pearson Correlation ,335**
,251*
,279** 1 ,030 ,057 -,019
Sig. (2-tailed) ,001 ,016 ,007 ,775 ,591 ,858
N 91 91 91 91 91 91 91
Pearson Correlation ,298**
,827**
,406** ,030 1 ,047 ,526
**
Sig. (2-tailed) ,004 ,000 ,000 ,775 ,656 ,000
N 91 91 91 91 91 91 91
Pearson Correlation ,389** ,164 -,059 ,057 ,047 1 ,111
Sig. (2-tailed) ,000 ,121 ,577 ,591 ,656 ,294
N 91 91 91 91 91 91 91
Pearson Correlation ,093 ,399** -,031 -,019 ,526
** ,111 1
Sig. (2-tailed) ,379 ,000 ,768 ,858 ,000 ,294
N 91 91 91 91 91 91 91
Central-West
Avg. BC Intensity 2012-14
Avg. ROE 2012-14
Avg. Size 2012-2014
*. Correlation is significant at the 0.05 level (2-tailed).
Avg. Other Revenue Share 2012-14
Avg. ROA 2012-14
Avg. Coverage with Services 2012-2014
Avg. Banking Profitability 2012-14
**. Correlation is significant at the 0.01 level (2-tailed).
Pearson Strength
I 0.00 - 0.19 I very weak
I 0.20 - 0.39 I weak
I 0.40 - 0.59 I moderate
I 0.60 - 0.79 I strong
I 0.80 - 1.00 I very strong
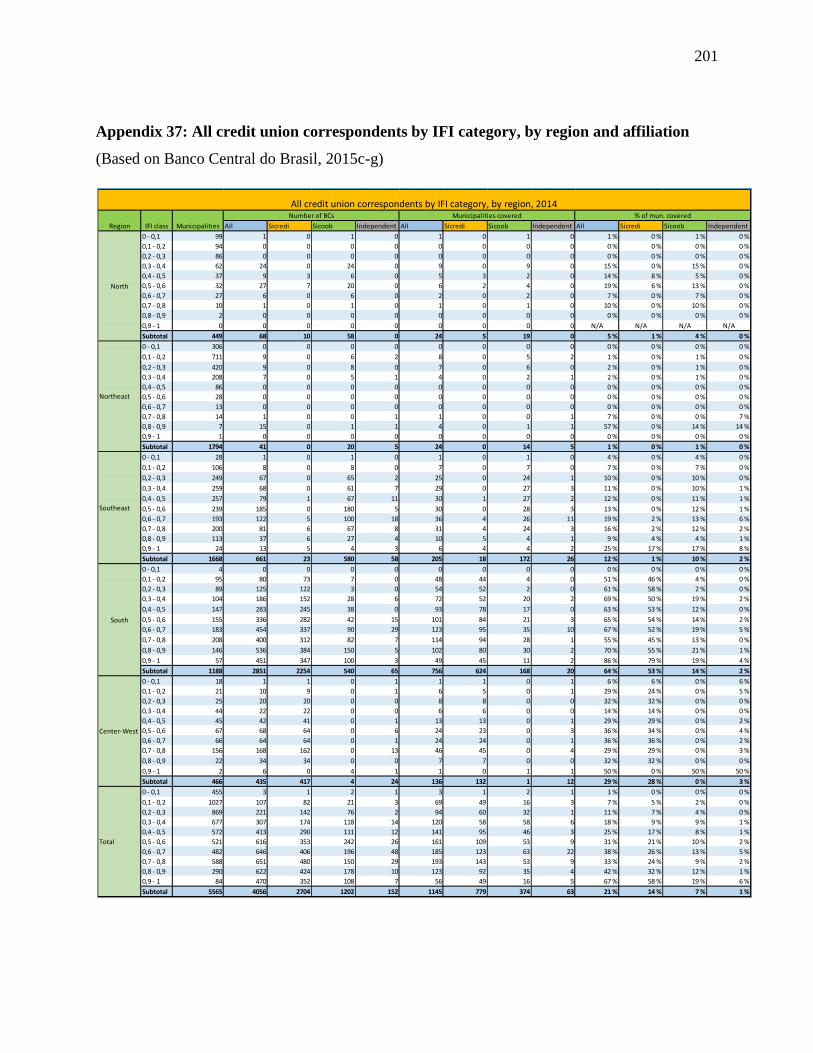
201
Appendix 37: All credit union correspondents by IFI category, by region and affiliation
(Based on Banco Central do Brasil, 2015c-g)
All Sicredi Sicoob Independent All Sicredi Sicoob Independent All Sicredi Sicoob Independent
0 - 0,1 99 1 0 1 0 1 0 1 0 1 % 0 % 1 % 0 %
0,1 - 0,2 94 0 0 0 0 0 0 0 0 0 % 0 % 0 % 0 %
0,2 - 0,3 86 0 0 0 0 0 0 0 0 0 % 0 % 0 % 0 %
0,3 - 0,4 62 24 0 24 0 9 0 9 0 15 % 0 % 15 % 0 %
0,4 - 0,5 37 9 3 6 0 5 3 2 0 14 % 8 % 5 % 0 %
0,5 - 0,6 32 27 7 20 0 6 2 4 0 19 % 6 % 13 % 0 %
0,6 - 0,7 27 6 0 6 0 2 0 2 0 7 % 0 % 7 % 0 %
0,7 - 0,8 10 1 0 1 0 1 0 1 0 10 % 0 % 10 % 0 %
0,8 - 0,9 2 0 0 0 0 0 0 0 0 0 % 0 % 0 % 0 %
0,9 - 1 0 0 0 0 0 0 0 0 0 N/A N/A N/A N/A
Subtotal 449 68 10 58 0 24 5 19 0 5 % 1 % 4 % 0 %
0 - 0,1 306 0 0 0 0 0 0 0 0 0 % 0 % 0 % 0 %
0,1 - 0,2 711 9 0 6 2 8 0 5 2 1 % 0 % 1 % 0 %
0,2 - 0,3 420 9 0 8 0 7 0 6 0 2 % 0 % 1 % 0 %
0,3 - 0,4 208 7 0 5 1 4 0 2 1 2 % 0 % 1 % 0 %
0,4 - 0,5 86 0 0 0 0 0 0 0 0 0 % 0 % 0 % 0 %
0,5 - 0,6 28 0 0 0 0 0 0 0 0 0 % 0 % 0 % 0 %
0,6 - 0,7 13 0 0 0 0 0 0 0 0 0 % 0 % 0 % 0 %
0,7 - 0,8 14 1 0 0 1 1 0 0 1 7 % 0 % 0 % 7 %
0,8 - 0,9 7 15 0 1 1 4 0 1 1 57 % 0 % 14 % 14 %
0,9 - 1 1 0 0 0 0 0 0 0 0 0 % 0 % 0 % 0 %
Subtotal 1794 41 0 20 5 24 0 14 5 1 % 0 % 1 % 0 %
0 - 0,1 28 1 0 1 0 1 0 1 0 4 % 0 % 4 % 0 %
0,1 - 0,2 106 8 0 8 0 7 0 7 0 7 % 0 % 7 % 0 %
0,2 - 0,3 249 67 0 65 2 25 0 24 1 10 % 0 % 10 % 0 %
0,3 - 0,4 259 68 0 61 7 29 0 27 3 11 % 0 % 10 % 1 %
0,4 - 0,5 257 79 1 67 11 30 1 27 2 12 % 0 % 11 % 1 %
0,5 - 0,6 239 185 0 180 5 30 0 28 3 13 % 0 % 12 % 1 %
0,6 - 0,7 193 122 5 100 18 36 4 26 11 19 % 2 % 13 % 6 %
0,7 - 0,8 200 81 6 67 8 31 4 24 3 16 % 2 % 12 % 2 %
0,8 - 0,9 113 37 6 27 4 10 5 4 1 9 % 4 % 4 % 1 %
0,9 - 1 24 13 5 4 3 6 4 4 2 25 % 17 % 17 % 8 %
Subtotal 1668 661 23 580 58 205 18 172 26 12 % 1 % 10 % 2 %
0 - 0,1 4 0 0 0 0 0 0 0 0 0 % 0 % 0 % 0 %
0,1 - 0,2 95 80 73 7 0 48 44 4 0 51 % 46 % 4 % 0 %
0,2 - 0,3 89 125 122 3 0 54 52 2 0 61 % 58 % 2 % 0 %
0,3 - 0,4 104 186 152 28 6 72 52 20 2 69 % 50 % 19 % 2 %
0,4 - 0,5 147 283 245 38 0 93 78 17 0 63 % 53 % 12 % 0 %
0,5 - 0,6 155 336 282 42 15 101 84 21 3 65 % 54 % 14 % 2 %
0,6 - 0,7 183 454 337 90 29 123 95 35 10 67 % 52 % 19 % 5 %
0,7 - 0,8 208 400 312 82 7 114 94 28 1 55 % 45 % 13 % 0 %
0,8 - 0,9 146 536 384 150 5 102 80 30 2 70 % 55 % 21 % 1 %
0,9 - 1 57 451 347 100 3 49 45 11 2 86 % 79 % 19 % 4 %
Subtotal 1188 2851 2254 540 65 756 624 168 20 64 % 53 % 14 % 2 %
0 - 0,1 18 1 1 0 1 1 1 0 1 6 % 6 % 0 % 6 %
0,1 - 0,2 21 10 9 0 1 6 5 0 1 29 % 24 % 0 % 5 %
0,2 - 0,3 25 20 20 0 0 8 8 0 0 32 % 32 % 0 % 0 %
0,3 - 0,4 44 22 22 0 0 6 6 0 0 14 % 14 % 0 % 0 %
0,4 - 0,5 45 42 41 0 1 13 13 0 1 29 % 29 % 0 % 2 %
0,5 - 0,6 67 68 64 0 6 24 23 0 3 36 % 34 % 0 % 4 %
0,6 - 0,7 66 64 64 0 1 24 24 0 1 36 % 36 % 0 % 2 %
0,7 - 0,8 156 168 162 0 13 46 45 0 4 29 % 29 % 0 % 3 %
0,8 - 0,9 22 34 34 0 0 7 7 0 0 32 % 32 % 0 % 0 %
0,9 - 1 2 6 0 4 1 1 0 1 1 50 % 0 % 50 % 50 %
Subtotal 466 435 417 4 24 136 132 1 12 29 % 28 % 0 % 3 %
0 - 0,1 455 3 1 2 1 3 1 2 1 1 % 0 % 0 % 0 %
0,1 - 0,2 1027 107 82 21 3 69 49 16 3 7 % 5 % 2 % 0 %
0,2 - 0,3 869 221 142 76 2 94 60 32 1 11 % 7 % 4 % 0 %
0,3 - 0,4 677 307 174 118 14 120 58 58 6 18 % 9 % 9 % 1 %
0,4 - 0,5 572 413 290 111 12 141 95 46 3 25 % 17 % 8 % 1 %
0,5 - 0,6 521 616 353 242 26 161 109 53 9 31 % 21 % 10 % 2 %
0,6 - 0,7 482 646 406 196 48 185 123 63 22 38 % 26 % 13 % 5 %
0,7 - 0,8 588 651 480 150 29 193 143 53 9 33 % 24 % 9 % 2 %
0,8 - 0,9 290 622 424 178 10 123 92 35 4 42 % 32 % 12 % 1 %
0,9 - 1 84 470 352 108 7 56 49 16 5 67 % 58 % 19 % 6 %
Subtotal 5565 4056 2704 1202 152 1145 779 374 63 21 % 14 % 7 % 1 %
Number of BCs Municipalities covered % of mun. covered
MunicipalitiesIFI class
South
Center-West
Total
North
Region
All credit union correspondents by IFI category, by region, 2014
Northeast
Southeast

202
Appendix 38: All exclusive credit union correspondents by IFI category, by region and
affiliation (Based on Banco Central do Brasil, 2015c-g)
All Sicredi Sicoob Independent All Sicredi Sicoob Independent All Sicredi Sicoob Independent
0 - 0,1 99 1 0 1 0 1 0 1 0 1 % 0 % 1 % 0 %
0,1 - 0,2 94 0 0 0 0 0 0 0 0 0 % 0 % 0 % 0 %
0,2 - 0,3 86 0 0 0 0 0 0 0 0 0 % 0 % 0 % 0 %
0,3 - 0,4 62 22 0 22 0 9 0 9 0 15 % 0 % 15 % 0 %
0,4 - 0,5 37 8 2 6 0 4 2 2 0 11 % 5 % 5 % 0 %
0,5 - 0,6 32 18 4 14 0 4 1 3 0 13 % 3 % 9 % 0 %
0,6 - 0,7 27 5 0 5 0 2 0 2 0 7 % 0 % 7 % 0 %
0,7 - 0,8 10 0 0 0 0 0 0 0 0 0 % 0 % 0 % 0 %
0,8 - 0,9 2 0 0 0 0 0 0 0 0 0 % 0 % 0 % 0 %
0,9 - 1 0 0 0 0 0 0 0 0 0 N/A N/A N/A N/A
Subtotal 449 54 6 48 0 20 3 17 0 4 % 1 % 4 % 0 %
0 - 0,1 306 0 0 0 0 0 0 0 0 0 % 0 % 0 % 0 %
0,1 - 0,2 711 8 0 6 2 7 0 5 2 1 % 0 % 1 % 0 %
0,2 - 0,3 420 4 0 4 0 3 0 3 0 1 % 0 % 1 % 0 %
0,3 - 0,4 208 4 0 3 0 2 0 1 0 1 % 0 % 0 % 0 %
0,4 - 0,5 86 0 0 0 0 0 0 0 0 0 % 0 % 0 % 0 %
0,5 - 0,6 28 0 0 0 0 0 0 0 0 0 % 0 % 0 % 0 %
0,6 - 0,7 13 0 0 0 0 0 0 0 0 0 % 0 % 0 % 0 %
0,7 - 0,8 14 1 0 0 1 1 0 0 1 7 % 0 % 0 % 7 %
0,8 - 0,9 7 8 0 1 0 4 0 1 0 57 % 0 % 14 % 0 %
0,9 - 1 1 0 0 0 0 0 0 0 0 0 % 0 % 0 % 0 %
Subtotal 1794 25 0 14 3 17 0 10 3 1 % 0 % 1 % 0 %
0 - 0,1 28 1 0 1 0 1 0 1 0 4 % 0 % 4 % 0 %
0,1 - 0,2 106 8 0 8 0 7 0 7 0 7 % 0 % 7 % 0 %
0,2 - 0,3 249 57 0 55 2 22 0 21 1 9 % 0 % 8 % 0 %
0,3 - 0,4 259 50 0 44 6 22 0 20 3 8 % 0 % 8 % 1 %
0,4 - 0,5 257 55 1 45 9 25 1 22 2 10 % 0 % 9 % 1 %
0,5 - 0,6 239 147 0 143 4 26 0 25 2 11 % 0 % 10 % 1 %
0,6 - 0,7 193 103 2 87 14 32 2 25 9 17 % 1 % 13 % 5 %
0,7 - 0,8 200 69 4 58 7 27 3 21 3 14 % 2 % 11 % 2 %
0,8 - 0,9 113 30 2 24 4 7 2 4 1 6 % 2 % 4 % 1 %
0,9 - 1 24 8 3 2 2 5 3 2 2 21 % 13 % 8 % 8 %
Subtotal 1668 528 12 467 48 174 11 148 23 10 % 1 % 9 % 1 %
0 - 0,1 4 0 0 0 0 0 0 0 0 0 % 0 % 0 % 0 %
0,1 - 0,2 95 65 59 6 0 46 42 4 0 48 % 44 % 4 % 0 %
0,2 - 0,3 89 100 97 3 0 49 47 2 0 55 % 53 % 2 % 0 %
0,3 - 0,4 104 135 107 24 4 65 47 18 2 63 % 45 % 17 % 2 %
0,4 - 0,5 147 217 183 34 0 83 68 17 0 56 % 46 % 12 % 0 %
0,5 - 0,6 155 249 202 35 9 90 73 19 2 58 % 47 % 12 % 1 %
0,6 - 0,7 183 343 243 75 24 113 87 32 8 62 % 48 % 17 % 4 %
0,7 - 0,8 208 295 224 67 4 103 85 26 1 50 % 41 % 13 % 0 %
0,8 - 0,9 146 409 279 123 4 96 74 29 1 66 % 51 % 20 % 1 %
0,9 - 1 57 302 201 98 2 46 41 11 2 81 % 72 % 19 % 4 %
Subtotal 1188 2115 1595 465 47 691 564 158 16 58 % 47 % 13 % 1 %
0 - 0,1 18 1 0 0 0 1 0 0 0 6 % 0 % 0 % 0 %
0,1 - 0,2 21 10 9 0 1 6 5 0 1 29 % 24 % 0 % 5 %
0,2 - 0,3 25 13 13 0 0 6 6 0 0 24 % 24 % 0 % 0 %
0,3 - 0,4 44 20 20 0 0 5 5 0 0 11 % 11 % 0 % 0 %
0,4 - 0,5 45 30 30 0 0 13 13 0 0 29 % 29 % 0 % 0 %
0,5 - 0,6 67 54 48 0 4 21 19 0 2 31 % 28 % 0 % 3 %
0,6 - 0,7 66 50 50 0 0 21 21 0 0 32 % 32 % 0 % 0 %
0,7 - 0,8 156 127 117 0 5 43 41 0 3 28 % 26 % 0 % 2 %
0,8 - 0,9 22 22 22 0 0 6 6 0 0 27 % 27 % 0 % 0 %
0,9 - 1 2 5 0 4 0 1 0 1 0 50 % 0 % 50 % 0 %
Subtotal 466 332 309 4 10 123 116 1 6 26 % 25 % 0 % 1 %
0 - 0,1 455 3 0 2 0 3 0 2 0 1 % 0 % 0 % 0 %
0,1 - 0,2 1027 91 68 20 3 66 47 16 3 6 % 5 % 2 % 0 %
0,2 - 0,3 869 174 110 62 2 80 53 26 1 9 % 6 % 3 % 0 %
0,3 - 0,4 677 231 127 93 10 103 52 48 5 15 % 8 % 7 % 1 %
0,4 - 0,5 572 310 216 85 9 125 84 41 2 22 % 15 % 7 % 0 %
0,5 - 0,6 521 468 254 192 17 141 93 47 6 27 % 18 % 9 % 1 %
0,6 - 0,7 482 501 295 167 38 168 110 59 17 35 % 23 % 12 % 4 %
0,7 - 0,8 588 492 345 125 17 174 129 47 8 30 % 22 % 8 % 1 %
0,8 - 0,9 290 469 303 148 8 113 82 34 2 39 % 28 % 12 % 1 %
0,9 - 1 84 315 204 104 4 52 44 14 4 62 % 52 % 17 % 5 %
Subtotal 5565 3054 1922 998 108 1025 694 334 48 18 % 12 % 6 % 1 %
IFI class
All exclusive credit union correspondents by IFI category, by region, 2014
Region Municipalities
Number of BCs Municipalities covered % of mun. covered
North
Northeast
Southeast
South
Center-West
Total

203
Appendix 39: All BCs with Inc. III by category, comparison with exclusive CU BCs (Based
on Banco Central do Brasil, 2015c-g)
All BC All Cus Sicredi Sicoob Independent All Cus Sicredi Sicoob Independent
0 - 0,1 99 194 1 0 1 0 0,5 % 0,0 % 0,5 % 0,0 %
0,1 - 0,2 94 381 0 0 0 0 0,0 % 0,0 % 0,0 % 0,0 %
0,2 - 0,3 86 312 0 0 0 0 0,0 % 0,0 % 0,0 % 0,0 %
0,3 - 0,4 62 308 22 0 22 0 7,1 % 0,0 % 7,1 % 0,0 %
0,4 - 0,5 37 251 8 2 6 0 3,2 % 0,8 % 2,4 % 0,0 %
0,5 - 0,6 32 301 21 4 17 0 7,0 % 1,3 % 5,6 % 0,0 %
0,6 - 0,7 27 646 3 0 3 0 0,5 % 0,0 % 0,5 % 0,0 %
0,7 - 0,8 10 91 1 0 1 0 1,1 % 0,0 % 1,1 % 0,0 %
0,8 - 0,9 2 219 0 0 0 0 0,0 % 0,0 % 0,0 % 0,0 %
0,9 - 1 0 0 0 0 0 0 N/A N/A N/A N/A
Subtotal 449 2703 56 6 50 0 2,1 % 0,2 % 1,8 % 0,0 %
0 - 0,1 306 716 0 0 0 0 0,0 % 0,0 % 0,0 % 0,0 %
0,1 - 0,2 711 3557 8 0 6 2 0,2 % 0,0 % 0,2 % 0,1 %
0,2 - 0,3 420 2831 7 0 6 0 0,2 % 0,0 % 0,2 % 0,0 %
0,3 - 0,4 208 2155 6 0 4 1 0,3 % 0,0 % 0,2 % 0,0 %
0,4 - 0,5 86 973 0 0 0 0 0,0 % 0,0 % 0,0 % 0,0 %
0,5 - 0,6 28 545 0 0 0 0 0,0 % 0,0 % 0,0 % 0,0 %
0,6 - 0,7 13 163 0 0 0 0 0,0 % 0,0 % 0,0 % 0,0 %
0,7 - 0,8 14 571 1 0 0 1 0,2 % 0,0 % 0,0 % 0,2 %
0,8 - 0,9 7 1455 13 0 1 0 0,9 % 0,0 % 0,1 % 0,0 %
0,9 - 1 1 1 0 0 0 0 0,0 % 0,0 % 0,0 % 0,0 %
Subtotal 1794 12967 35 0 17 4 0,3 % 0,0 % 0,1 % 0,0 %
0 - 0,1 28 39 1 0 1 0 2,6 % 0,0 % 2,6 % 0,0 %
0,1 - 0,2 106 294 8 0 8 0 2,7 % 0,0 % 2,7 % 0,0 %
0,2 - 0,3 249 1139 64 0 62 2 5,6 % 0,0 % 5,4 % 0,2 %
0,3 - 0,4 259 1626 57 0 51 6 3,5 % 0,0 % 3,1 % 0,4 %
0,4 - 0,5 257 2090 65 1 53 11 3,1 % 0,0 % 2,5 % 0,5 %
0,5 - 0,6 239 2663 171 0 166 5 6,4 % 0,0 % 6,2 % 0,2 %
0,6 - 0,7 193 2171 110 2 93 14 5,1 % 0,1 % 4,3 % 0,6 %
0,7 - 0,8 200 2467 74 5 61 8 3,0 % 0,2 % 2,5 % 0,3 %
0,8 - 0,9 113 3816 33 3 26 4 0,9 % 0,1 % 0,7 % 0,1 %
0,9 - 1 24 3390 10 4 3 2 0,3 % 0,1 % 0,1 % 0,1 %
Subtotal 1668 19695 593 15 524 52 3,0 % 0,1 % 2,7 % 0,3 %
0 - 0,1 4 2 0 0 0 0 0,0 % 0,0 % 0,0 % 0,0 %
0,1 - 0,2 95 239 74 68 6 0 31,0 % 28,5 % 2,5 % 0,0 %
0,2 - 0,3 89 440 112 109 3 0 25,5 % 24,8 % 0,7 % 0,0 %
0,3 - 0,4 104 660 154 126 24 4 23,3 % 19,1 % 3,6 % 0,6 %
0,4 - 0,5 147 1027 243 210 33 0 23,7 % 20,4 % 3,2 % 0,0 %
0,5 - 0,6 155 1193 289 238 37 11 24,2 % 19,9 % 3,1 % 0,9 %
0,6 - 0,7 183 1566 391 284 80 25 25,0 % 18,1 % 5,1 % 1,6 %
0,7 - 0,8 208 1840 330 250 74 5 17,9 % 13,6 % 4,0 % 0,3 %
0,8 - 0,9 146 1926 449 313 129 4 23,3 % 16,3 % 6,7 % 0,2 %
0,9 - 1 57 2318 341 240 98 1 14,7 % 10,4 % 4,2 % 0,0 %
Subtotal 1188 11211 2383 1838 484 50 21,3 % 16,4 % 4,3 % 0,4 %
0 - 0,1 18 37 1 0 0 0 2,7 % 0,0 % 0,0 % 0,0 %
0,1 - 0,2 21 81 10 9 0 1 12,3 % 11,1 % 0,0 % 1,2 %
0,2 - 0,3 25 141 17 17 0 0 12,1 % 12,1 % 0,0 % 0,0 %
0,3 - 0,4 44 271 21 21 0 0 7,7 % 7,7 % 0,0 % 0,0 %
0,4 - 0,5 45 387 34 33 0 1 8,8 % 8,5 % 0,0 % 0,3 %
0,5 - 0,6 67 530 59 53 0 4 11,1 % 10,0 % 0,0 % 0,8 %
0,6 - 0,7 66 597 58 57 0 0 9,7 % 9,5 % 0,0 % 0,0 %
0,7 - 0,8 156 1270 147 135 0 5 11,6 % 10,6 % 0,0 % 0,4 %
0,8 - 0,9 22 535 28 28 0 0 5,2 % 5,2 % 0,0 % 0,0 %
0,9 - 1 2 716 3 0 2 0 0,4 % 0,0 % 0,3 % 0,0 %
Subtotal 466 4565 378 353 2 11 8,3 % 7,7 % 0,0 % 0,2 %
0 - 0,1 455 988 3 0 2 0 0,3 % 0,0 % 0,2 % 0,0 %
0,1 - 0,2 1027 4552 100 77 20 3 2,2 % 1,7 % 0,4 % 0,1 %
0,2 - 0,3 869 4863 200 126 71 2 4,1 % 2,6 % 1,5 % 0,0 %
0,3 - 0,4 677 5020 260 147 101 11 5,2 % 2,9 % 2,0 % 0,2 %
0,4 - 0,5 572 4728 350 246 92 12 7,4 % 5,2 % 1,9 % 0,3 %
0,5 - 0,6 521 5232 540 295 220 20 10,3 % 5,6 % 4,2 % 0,4 %
0,6 - 0,7 482 5143 562 343 176 39 10,9 % 6,7 % 3,4 % 0,8 %
0,7 - 0,8 588 6239 553 390 136 19 8,9 % 6,3 % 2,2 % 0,3 %
0,8 - 0,9 290 7951 523 344 156 8 6,6 % 4,3 % 2,0 % 0,1 %
0,9 - 1 84 6425 354 244 103 3 5,5 % 3,8 % 1,6 % 0,0 %
Subtotal 5565 51141 3445 2212 1077 117 6,7 % 4,3 % 2,1 % 0,2 %
North
Northeast
Southeast
Region IFI class Municipalities
Number of banking correspondents with Inc. III CU % of all correspondents with Inc. III
All banking correspondents and exclusive CU BCs with service III by region and IFI category
South
Center-West
Total

204
Appendix 40: Number of municipalities with exclusive CU BC share of BCs with Inc. III
over 25% and 50% (Based on Banco Central do Brasil, 2015c-g)
All Sicr. Sico. Indep. All Sicr. Sico. Indep. All Sicr. Sico. Indep. All Sicr. Sico. Indep.
0 - 0,1 99 1 0 1 0 1 % 0 % 1 % 0 % 0 0 0 0 0 % 0 % 0 % 0 %
0,1 - 0,2 94 0 0 0 0 0 % 0 % 0 % 0 % 0 0 0 0 0 % 0 % 0 % 0 %
0,2 - 0,3 86 0 0 0 0 0 % 0 % 0 % 0 % 0 0 0 0 0 % 0 % 0 % 0 %
0,3 - 0,4 62 8 0 8 0 13 % 0 % 13 % 0 % 2 0 2 0 3 % 0 % 3 % 0 %
0,4 - 0,5 37 1 0 1 0 3 % 0 % 3 % 0 % 1 0 1 0 3 % 0 % 3 % 0 %
0,5 - 0,6 32 2 0 2 0 6 % 0 % 6 % 0 % 0 0 0 0 0 % 0 % 0 % 0 %
0,6 - 0,7 27 1 0 1 0 4 % 0 % 4 % 0 % 1 0 1 0 4 % 0 % 4 % 0 %
0,7 - 0,8 10 1 0 1 0 10 % 0 % 10 % 0 % 1 0 1 0 10 % 0 % 10 % 0 %
0,8 - 0,9 2 0 0 0 0 0 % 0 % 0 % 0 % 0 0 0 0 0 % 0 % 0 % 0 %
0,9 - 1 0 0 0 0 0 N/A N/A N/A N/A 0 0 0 0 N/A N/A N/A N/A
Subtotal 449 14 0 14 0 3 % 0 % 3 % 0 % 5 0 5 0 1 % 0 % 1 % 0 %
0 - 0,1 306 0 0 0 0 0 % 0 % 0 % 0 % 0 0 0 0 0 % 0 % 0 % 0 %
0,1 - 0,2 711 2 0 2 0 0 % 0 % 0 % 0 % 0 0 0 0 0 % 0 % 0 % 0 %
0,2 - 0,3 420 0 0 0 0 0 % 0 % 0 % 0 % 0 0 0 0 0 % 0 % 0 % 0 %
0,3 - 0,4 208 0 0 0 0 0 % 0 % 0 % 0 % 0 0 0 0 0 % 0 % 0 % 0 %
0,4 - 0,5 86 0 0 0 0 0 % 0 % 0 % 0 % 0 0 0 0 0 % 0 % 0 % 0 %
0,5 - 0,6 28 0 0 0 0 0 % 0 % 0 % 0 % 0 0 0 0 0 % 0 % 0 % 0 %
0,6 - 0,7 13 0 0 0 0 0 % 0 % 0 % 0 % 0 0 0 0 0 % 0 % 0 % 0 %
0,7 - 0,8 14 0 0 0 0 0 % 0 % 0 % 0 % 0 0 0 0 0 % 0 % 0 % 0 %
0,8 - 0,9 7 0 0 0 0 0 % 0 % 0 % 0 % 0 0 0 0 0 % 0 % 0 % 0 %
0,9 - 1 1 0 0 0 0 0 % 0 % 0 % 0 % 0 0 0 0 0 % 0 % 0 % 0 %
Subtotal 1794 2 0 2 0 0 % 0 % 0 % 0 % 0 0 0 0 0 % 0 % 0 % 0 %
0 - 0,1 28 1 0 1 0 4 % 0 % 4 % 0 % 1 0 1 0 4 % 0 % 4 % 0 %
0,1 - 0,2 106 5 0 5 0 5 % 0 % 5 % 0 % 2 0 2 0 2 % 0 % 2 % 0 %
0,2 - 0,3 249 19 0 18 1 8 % 0 % 7 % 0 % 12 0 12 0 5 % 0 % 5 % 0 %
0,3 - 0,4 259 14 0 13 1 5 % 0 % 5 % 0 % 9 0 9 0 3 % 0 % 3 % 0 %
0,4 - 0,5 257 16 0 14 2 6 % 0 % 5 % 1 % 6 0 4 2 2 % 0 % 2 % 1 %
0,5 - 0,6 239 19 0 17 2 8 % 0 % 7 % 1 % 9 0 8 1 4 % 0 % 3 % 0 %
0,6 - 0,7 193 15 0 13 1 8 % 0 % 7 % 1 % 6 0 6 0 3 % 0 % 3 % 0 %
0,7 - 0,8 200 14 0 13 1 7 % 0 % 7 % 1 % 6 0 6 0 3 % 0 % 3 % 0 %
0,8 - 0,9 113 2 0 1 1 2 % 0 % 1 % 1 % 0 0 0 0 0 % 0 % 0 % 0 %
0,9 - 1 24 0 0 0 0 0 % 0 % 0 % 0 % 0 0 0 0 0 % 0 % 0 % 0 %
Subtotal 1668 105 0 95 9 6 % 0 % 6 % 1 % 51 0 48 3 3 % 0 % 3 % 0 %
0 - 0,1 4 0 0 0 0 0 % 0 % 0 % 0 % 0 0 0 0 0 % 0 % 0 % 0 %
0,1 - 0,2 95 44 40 4 0 46 % 42 % 4 % 0 % 29 28 1 0 31 % 29 % 1 % 0 %
0,2 - 0,3 89 43 41 2 0 48 % 46 % 2 % 0 % 22 21 1 0 25 % 24 % 1 % 0 %
0,3 - 0,4 104 50 37 12 1 48 % 36 % 12 % 1 % 22 15 6 0 21 % 14 % 6 % 0 %
0,4 - 0,5 147 62 49 14 0 42 % 33 % 10 % 0 % 31 24 5 0 21 % 16 % 3 % 0 %
0,5 - 0,6 155 62 48 11 2 40 % 31 % 7 % 1 % 25 16 7 1 16 % 10 % 5 % 1 %
0,6 - 0,7 183 78 55 21 3 43 % 30 % 11 % 2 % 35 24 4 1 19 % 13 % 2 % 1 %
0,7 - 0,8 208 68 56 12 1 33 % 27 % 6 % 0 % 30 22 4 0 14 % 11 % 2 % 0 %
0,8 - 0,9 146 63 40 19 1 43 % 27 % 13 % 1 % 25 15 9 1 17 % 10 % 6 % 1 %
0,9 - 1 57 22 16 4 0 39 % 28 % 7 % 0 % 5 4 1 0 9 % 7 % 2 % 0 %
Subtotal 1188 492 382 99 8 41 % 32 % 8 % 1 % 224 169 38 3 19 % 14 % 3 % 0 %
0 - 0,1 18 1 0 0 0 6 % 0 % 0 % 0 % 0 0 0 0 0 % 0 % 0 % 0 %
0,1 - 0,2 21 4 4 0 0 19 % 19 % 0 % 0 % 2 2 0 0 10 % 10 % 0 % 0 %
0,2 - 0,3 25 5 5 0 0 20 % 20 % 0 % 0 % 1 1 0 0 4 % 4 % 0 % 0 %
0,3 - 0,4 44 5 5 0 0 11 % 11 % 0 % 0 % 4 4 0 0 9 % 9 % 0 % 0 %
0,4 - 0,5 45 9 9 0 0 20 % 20 % 0 % 0 % 6 5 0 0 13 % 11 % 0 % 0 %
0,5 - 0,6 67 11 9 0 2 16 % 13 % 0 % 3 % 5 4 0 0 7 % 6 % 0 % 0 %
0,6 - 0,7 66 14 13 0 0 21 % 20 % 0 % 0 % 6 5 0 0 9 % 8 % 0 % 0 %
0,7 - 0,8 156 27 26 0 0 17 % 17 % 0 % 0 % 8 8 0 0 5 % 5 % 0 % 0 %
0,8 - 0,9 22 3 3 0 0 14 % 14 % 0 % 0 % 1 1 0 0 5 % 5 % 0 % 0 %
0,9 - 1 2 0 0 0 0 0 % 0 % 0 % 0 % 0 0 0 0 0 % 0 % 0 % 0 %
Subtotal 466 79 74 0 2 17 % 16 % 0 % 0 % 33 30 0 0 7 % 6 % 0 % 0 %
0 - 0,1 455 3 0 2 0 1 % 0 % 0 % 0 % 1 0 1 0 0 % 0 % 0 % 0 %
0,1 - 0,2 1027 55 44 11 0 5 % 4 % 1 % 0 % 33 30 3 0 3 % 3 % 0 % 0 %
0,2 - 0,3 869 67 46 20 1 8 % 5 % 2 % 0 % 35 22 13 0 4 % 3 % 1 % 0 %
0,3 - 0,4 677 77 42 33 2 11 % 6 % 5 % 0 % 37 19 17 0 5 % 3 % 3 % 0 %
0,4 - 0,5 572 88 58 29 2 15 % 10 % 5 % 0 % 44 29 10 2 8 % 5 % 2 % 0 %
0,5 - 0,6 521 94 57 30 6 18 % 11 % 6 % 1 % 39 20 15 2 7 % 4 % 3 % 0 %
0,6 - 0,7 482 108 68 35 4 22 % 14 % 7 % 1 % 48 29 11 1 10 % 6 % 2 % 0 %
0,7 - 0,8 588 110 82 26 2 19 % 14 % 4 % 0 % 45 30 11 0 8 % 5 % 2 % 0 %
0,8 - 0,9 290 68 43 20 2 23 % 15 % 7 % 1 % 26 16 9 1 9 % 6 % 3 % 0 %
0,9 - 1 84 22 16 4 0 26 % 19 % 5 % 0 % 5 4 1 0 6 % 5 % 1 % 0 %
Subtotal 5565 692 456 210 19 12 % 8 % 4 % 0 % 313 199 91 6 6 % 4 % 2 % 0 %
Mun. where CU BC > 50% of Inc. III Share of all municipalities
North
Northeast
Southeast
Region IFI class Mun.
Mun. where CU BC > 25% of Inc. III
Number of municipalities with exclusive CU BC share over 25% and 50% of all BCs with Inc. III, by region and IFI category
South
Center-West
Total
Share of all municipalities

205
Appendix 41: Share of CU BCs out of total exclusive Inc. III BCs by municipality, by
affiliation, 2014 [four IFI categories] (Based on Banco Central do Brasil, 2015c-g)
All credit unions:
Sicredi-affiliated credit unions:
>0% >25% >50% >75% 100 % >0% >25% >50% >75% 100 %
0 - 0,24 239 1 1 0 0 0 0,4 % 0,4 % 0,0 % 0,0 % 0,0 %
0,25 - 0,49 139 13 9 3 0 0 9,4 % 6,5 % 2,2 % 0,0 % 0,0 %
0,50 - 0,74 62 7 3 1 0 0 11,3 % 4,8 % 1,6 % 0,0 % 0,0 %
0,75 - 100 9 1 1 1 1 1 11,1 % 11,1 % 11,1 % 11,1 % 11,1 %
Subtotal 449 22 14 5 1 1 4,9 % 3,1 % 1,1 % 0,2 % 0,2 %
0 - 0,24 1268 9 2 0 0 0 0,7 % 0,2 % 0,0 % 0,0 % 0,0 %
0,25 - 0,49 463 7 0 0 0 0 1,5 % 0,0 % 0,0 % 0,0 % 0,0 %
0,50 - 0,74 49 1 0 0 0 0 2,0 % 0,0 % 0,0 % 0,0 % 0,0 %
0,75 - 100 14 4 0 0 0 0 28,6 % 0,0 % 0,0 % 0,0 % 0,0 %
Subtotal 1794 21 2 0 0 0 1,2 % 0,1 % 0,0 % 0,0 % 0,0 %
0 - 0,24 243 18 14 7 1 0 7,4 % 5,8 % 2,9 % 0,4 % 0,0 %
0,25 - 0,49 656 64 41 23 7 3 9,8 % 6,3 % 3,5 % 1,1 % 0,5 %
0,50 - 0,74 524 74 39 17 3 1 14,1 % 7,4 % 3,2 % 0,6 % 0,2 %
0,75 - 100 245 31 11 4 0 0 12,7 % 4,5 % 1,6 % 0,0 % 0,0 %
Subtotal 1668 187 105 51 11 4 11,2 % 6,3 % 3,1 % 0,7 % 0,2 %
0 - 0,24 146 74 66 39 6 5 50,7 % 45,2 % 26,7 % 4,1 % 3,4 %
0,25 - 0,49 293 179 133 65 14 8 61,1 % 45,4 % 22,2 % 4,8 % 2,7 %
0,50 - 0,74 430 268 173 73 11 6 62,3 % 40,2 % 17,0 % 2,6 % 1,4 %
0,75 - 100 319 203 120 47 8 4 63,6 % 37,6 % 14,7 % 2,5 % 1,3 %
Subtotal 1188 724 492 224 39 23 60,9 % 41,4 % 18,9 % 3,3 % 1,9 %
0 - 0,24 52 11 8 2 1 1 21,2 % 15,4 % 3,8 % 1,9 % 1,9 %
0,25 - 0,49 101 21 16 11 1 1 20,8 % 15,8 % 10,9 % 1,0 % 1,0 %
0,50 - 0,74 173 61 33 14 2 0 35,3 % 19,1 % 8,1 % 1,2 % 0,0 %
0,75 - 100 140 36 22 6 0 0 25,7 % 15,7 % 4,3 % 0,0 % 0,0 %
Subtotal 466 129 79 33 4 2 27,7 % 17,0 % 7,1 % 0,9 % 0,4 %
5565 1083 692 313 55 30 19,5 % 12,4 % 5,6 % 1,0 % 0,5 %
IFI ClassRegion
Municipalities with CU BC by IFI category in 2014 - all credit unions
n of municipalities with CU BC share above… n of municipalities with CU BC share above…% of total
Total
Municipalities
North
Northeast
Southeast
South
Center-West
>0% >25% >50% >75% 100 % >0% >25% >50% >75% 100 %
0 - 0,24 239 0 0 0 0 0 0,0 % 0,0 % 0,0 % 0,0 % 0,0 %
0,25 - 0,49 139 2 0 0 0 0 1,4 % 0,0 % 0,0 % 0,0 % 0,0 %
0,50 - 0,74 62 1 0 0 0 0 1,6 % 0,0 % 0,0 % 0,0 % 0,0 %
0,75 - 100 9 0 0 0 0 0 0,0 % 0,0 % 0,0 % 0,0 % 0,0 %
Subtotal 449 3 0 0 0 0 0,7 % 0,0 % 0,0 % 0,0 % 0,0 %
0 - 0,24 1268 0 0 0 0 0 0,0 % 0,0 % 0,0 % 0,0 % 0,0 %
0,25 - 0,49 463 0 0 0 0 0 0,0 % 0,0 % 0,0 % 0,0 % 0,0 %
0,50 - 0,74 49 0 0 0 0 0 0,0 % 0,0 % 0,0 % 0,0 % 0,0 %
0,75 - 100 14 0 0 0 0 0 0,0 % 0,0 % 0,0 % 0,0 % 0,0 %
Subtotal 1794 0 0 0 0 0 0,0 % 0,0 % 0,0 % 0,0 % 0,0 %
0 - 0,24 243 0 0 0 0 0 0,0 % 0,0 % 0,0 % 0,0 % 0,0 %
0,25 - 0,49 656 1 0 0 0 0 0,2 % 0,0 % 0,0 % 0,0 % 0,0 %
0,50 - 0,74 524 4 0 0 0 0 0,8 % 0,0 % 0,0 % 0,0 % 0,0 %
0,75 - 100 245 9 0 0 0 0 3,7 % 0,0 % 0,0 % 0,0 % 0,0 %
Subtotal 1668 14 0 0 0 0 0,8 % 0,0 % 0,0 % 0,0 % 0,0 %
0 - 0,24 146 70 62 38 6 5 47,9 % 42,5 % 26,0 % 4,1 % 3,4 %
0,25 - 0,49 293 145 105 50 12 6 49,5 % 35,8 % 17,1 % 4,1 % 2,0 %
0,50 - 0,74 430 216 133 51 8 5 50,2 % 30,9 % 11,9 % 1,9 % 1,2 %
0,75 - 100 319 165 82 30 5 3 51,7 % 25,7 % 9,4 % 1,6 % 0,9 %
Subtotal 1188 596 382 169 31 19 50,2 % 32,2 % 14,2 % 2,6 % 1,6 %
0 - 0,24 52 9 7 2 1 1 17,3 % 13,5 % 3,8 % 1,9 % 1,9 %
0,25 - 0,49 101 21 16 10 1 1 20,8 % 15,8 % 9,9 % 1,0 % 1,0 %
0,50 - 0,74 173 58 30 12 2 0 33,5 % 17,3 % 6,9 % 1,2 % 0,0 %
0,75 - 100 140 33 21 6 0 0 23,6 % 15,0 % 4,3 % 0,0 % 0,0 %
Subtotal 466 121 74 30 4 2 26,0 % 15,9 % 6,4 % 0,9 % 0,4 %
5565 734 456 199 35 21 13,2 % 8,2 % 3,6 % 0,6 % 0,4 %
Northeast
Southeast
South
Center-West
Municipalities with CU BC by IFI category in 2014 - Sicredi
n of municipalities with CU BC share above… n of municipalities with CU BC share above…% of total
North
Total
Region IFI Class Municipalities

206
Sicoob-affiliated credit unions:
Independent credit unions:
>0% >25% >50% >75% 100 % >0% >25% >50% >75% 100 %
0 - 0,24 239 1 1 0 0 0 0,4 % 0,4 % 0,0 % 0,0 % 0,0 %
0,25 - 0,49 139 11 9 3 0 0 7,9 % 6,5 % 2,2 % 0,0 % 0,0 %
0,50 - 0,74 62 6 3 1 0 0 9,7 % 4,8 % 1,6 % 0,0 % 0,0 %
0,75 - 100 9 1 1 1 1 1 11,1 % 11,1 % 11,1 % 11,1 % 11,1 %
Subtotal 449 19 14 5 1 1 4,2 % 3,1 % 1,1 % 0,2 % 0,2 %
0 - 0,24 1268 7 2 0 0 0 0,6 % 0,2 % 0,0 % 0,0 % 0,0 %
0,25 - 0,49 463 4 0 0 0 0 0,9 % 0,0 % 0,0 % 0,0 % 0,0 %
0,50 - 0,74 49 0 0 0 0 0 0,0 % 0,0 % 0,0 % 0,0 % 0,0 %
0,75 - 100 14 1 0 0 0 0 7,1 % 0,0 % 0,0 % 0,0 % 0,0 %
Subtotal 1794 12 2 0 0 0 0,7 % 0,1 % 0,0 % 0,0 % 0,0 %
0 - 0,24 243 17 13 7 1 0 7,0 % 5,3 % 2,9 % 0,4 % 0,0 %
0,25 - 0,49 656 59 38 21 7 3 9,0 % 5,8 % 3,2 % 1,1 % 0,5 %
0,50 - 0,74 524 61 35 16 3 1 11,6 % 6,7 % 3,1 % 0,6 % 0,2 %
0,75 - 100 245 19 9 4 0 0 7,8 % 3,7 % 1,6 % 0,0 % 0,0 %
Subtotal 1668 156 95 48 11 4 9,4 % 5,7 % 2,9 % 0,7 % 0,2 %
0 - 0,24 146 4 4 1 0 0 2,7 % 2,7 % 0,7 % 0,0 % 0,0 %
0,25 - 0,49 293 36 28 12 2 2 12,3 % 9,6 % 4,1 % 0,7 % 0,7 %
0,50 - 0,74 430 61 34 12 1 1 14,2 % 7,9 % 2,8 % 0,2 % 0,2 %
0,75 - 100 319 57 33 13 2 1 17,9 % 10,3 % 4,1 % 0,6 % 0,3 %
Subtotal 1188 158 99 38 5 4 13,3 % 8,3 % 3,2 % 0,4 % 0,3 %
0 - 0,24 52 0 0 0 0 0 0,0 % 0,0 % 0,0 % 0,0 % 0,0 %
0,25 - 0,49 101 0 0 0 0 0 0,0 % 0,0 % 0,0 % 0,0 % 0,0 %
0,50 - 0,74 173 0 0 0 0 0 0,0 % 0,0 % 0,0 % 0,0 % 0,0 %
0,75 - 100 140 1 0 0 0 0 0,7 % 0,0 % 0,0 % 0,0 % 0,0 %
Subtotal 466 1 0 0 0 0 0,2 % 0,0 % 0,0 % 0,0 % 0,0 %
5565 346 210 91 17 9 6,2 % 3,8 % 1,6 % 0,3 % 0,2 %
Municipalities with CU BC by IFI category in 2014 - Sicoob
n of municipalities with CU BC share above… n of municipalities with CU BC share above…% of total
North
Region IFI Class Municipalities
Northeast
Southeast
South
Center-West
Total
>0% >25% >50% >75% 100 % >0% >25% >50% >75% 100 %
0 - 0,24 239 0 0 0 0 0 0,0 % 0,0 % 0,0 % 0,0 % 0,0 %
0,25 - 0,49 139 0 0 0 0 0 0,0 % 0,0 % 0,0 % 0,0 % 0,0 %
0,50 - 0,74 62 0 0 0 0 0 0,0 % 0,0 % 0,0 % 0,0 % 0,0 %
0,75 - 100 9 0 0 0 0 0 0,0 % 0,0 % 0,0 % 0,0 % 0,0 %
Subtotal 449 0 0 0 0 0 0,0 % 0,0 % 0,0 % 0,0 % 0,0 %
0 - 0,24 1268 2 0 0 0 0 0,2 % 0,0 % 0,0 % 0,0 % 0,0 %
0,25 - 0,49 463 1 0 0 0 0 0,2 % 0,0 % 0,0 % 0,0 % 0,0 %
0,50 - 0,74 49 1 0 0 0 0 2,0 % 0,0 % 0,0 % 0,0 % 0,0 %
0,75 - 100 14 0 0 0 0 0 0,0 % 0,0 % 0,0 % 0,0 % 0,0 %
Subtotal 1794 4 0 0 0 0 0,2 % 0,0 % 0,0 % 0,0 % 0,0 %
0 - 0,24 243 1 1 0 0 0 0,4 % 0,4 % 0,0 % 0,0 % 0,0 %
0,25 - 0,49 656 5 3 2 0 0 0,8 % 0,5 % 0,3 % 0,0 % 0,0 %
0,50 - 0,74 524 13 3 1 0 0 2,5 % 0,6 % 0,2 % 0,0 % 0,0 %
0,75 - 100 245 6 2 0 0 0 2,4 % 0,8 % 0,0 % 0,0 % 0,0 %
Subtotal 1668 25 9 3 0 0 1,5 % 0,5 % 0,2 % 0,0 % 0,0 %
0 - 0,24 146 0 0 0 0 0 0,0 % 0,0 % 0,0 % 0,0 % 0,0 %
0,25 - 0,49 293 2 1 0 0 0 0,7 % 0,3 % 0,0 % 0,0 % 0,0 %
0,50 - 0,74 430 13 6 2 0 0 3,0 % 1,4 % 0,5 % 0,0 % 0,0 %
0,75 - 100 319 2 1 1 0 0 0,6 % 0,3 % 0,3 % 0,0 % 0,0 %
Subtotal 1188 17 8 3 0 0 1,4 % 0,7 % 0,3 % 0,0 % 0,0 %
0 - 0,24 52 1 0 0 0 0 1,9 % 0,0 % 0,0 % 0,0 % 0,0 %
0,25 - 0,49 101 1 0 0 0 0 1,0 % 0,0 % 0,0 % 0,0 % 0,0 %
0,50 - 0,74 173 3 2 0 0 0 1,7 % 1,2 % 0,0 % 0,0 % 0,0 %
0,75 - 100 140 2 0 0 0 0 1,4 % 0,0 % 0,0 % 0,0 % 0,0 %
Subtotal 466 7 2 0 0 0 1,5 % 0,4 % 0,0 % 0,0 % 0,0 %
5565 53 19 6 0 0 1,0 % 0,3 % 0,1 % 0,0 % 0,0 %
Region IFI Class Municipalities
Total
Municipalities with CU BC in 2014 by IFI category - Independent Credit Unions
n of municipalities with CU BC share above… n of municipalities with CU BC share above…% of total
North
Center-West
South
Southeast
Northeast

207
Appendix 42: Credit union contribution to growth in banking correspondents, 2008-2014
(Based on Banco Central do Brasil, 2015c-g)
All CUs Sicredi Sicoob Indep. All CUs Sicredi Sicoob Indep.
0 - 0,24 570 1 0 1 0 0,2 % 0,0 % 0,2 % 0,0 %
0,25 - 0,49 430 30 2 28 0 7,0 % 0,5 % 6,5 % 0,0 %
0,50 - 0,74 628 23 4 19 0 3,7 % 0,6 % 3,0 % 0,0 %
0,75 - 100 218 1 0 1 0 0,5 % 0,0 % 0,5 % 0,0 %
Subtotal 1846 55 6 49 0 3,0 % 0,3 % 2,7 % 0,0 %
0 - 0,24 4416 11 0 9 2 0,2 % 0,0 % 0,2 % 0,0 %
0,25 - 0,49 2974 10 0 7 1 0,3 % 0,0 % 0,2 % 0,0 %
0,50 - 0,74 668 1 0 0 1 0,1 % 0,0 % 0,0 % 0,1 %
0,75 - 100 1009 13 0 1 0 1,3 % 0,0 % 0,1 % 0,0 %
Subtotal 9067 35 0 17 4 0,4 % 0,0 % 0,2 % 0,0 %
0 - 0,24 568 31 0 29 2 5,5 % 0,0 % 5,1 % 0,4 %
0,25 - 0,49 3086 143 1 131 11 4,6 % 0,0 % 4,2 % 0,4 %
0,50 - 0,74 3637 286 5 266 14 7,9 % 0,1 % 7,3 % 0,4 %
0,75 - 100 5099 66 9 49 7 1,3 % 0,2 % 1,0 % 0,1 %
Subtotal 12390 526 15 475 34 4,2 % 0,1 % 3,8 % 0,3 %
0 - 0,24 363 123 117 6 0 33,9 % 32,2 % 1,7 % 0,0 %
0,25 - 0,49 1450 454 390 60 4 31,3 % 26,9 % 4,1 % 0,3 %
0,50 - 0,74 2588 856 665 145 40 33,1 % 25,7 % 5,6 % 1,5 %
0,75 - 100 3463 923 641 272 5 26,7 % 18,5 % 7,9 % 0,1 %
Subtotal 7864 2356 1813 483 49 30,0 % 23,1 % 6,1 % 0,6 %
0 - 0,24 136 20 18 0 1 14,7 % 13,2 % 0,0 % 0,7 %
0,25 - 0,49 530 62 61 0 1 11,7 % 11,5 % 0,0 % 0,2 %
0,50 - 0,74 987 154 146 0 5 15,6 % 14,8 % 0,0 % 0,5 %
0,75 - 100 1571 136 122 2 4 8,7 % 7,8 % 0,1 % 0,3 %
Subtotal 3224 372 347 2 11 11,5 % 10,8 % 0,1 % 0,3 %
0 - 0,24 6053 186 135 45 5 3,1 % 2,2 % 0,7 % 0,1 %
0,25 - 0,49 8470 699 454 226 17 8,3 % 5,4 % 2,7 % 0,2 %
0,50 - 0,74 8508 1320 820 430 60 15,5 % 9,6 % 5,1 % 0,7 %
0,75 - 100 11360 1139 772 325 16 10,0 % 6,8 % 2,9 % 0,1 %
Total 34391 3344 2181 1026 98 9,7 % 6,3 % 3,0 % 0,3 %
North
Northeast
Southeast
South
Center-West
All regions
Region IFI Class Increase in BC
Credit Union contribution to growth in Banking Correspondents 2007 - 2014 [All Cus]
Increase in CU BCS Share of total increase in BC

208
Appendix 43: Credit union BCs by urbanization rate, 2014 (Based on Banco Central do
Brasil, 2015c-g and IBGE, 2007, 2010 and 2013)
>0% >25% >50% >75% 100 % >0% >25% >50% >75% 100 %
0 - 25% 19 1 1 1 0 0 5,3 % 5,3 % 5,3 % 0,0 % 0,0 %
25% - 50% 135 8 6 2 0 0 5,9 % 4,4 % 1,5 % 0,0 % 0,0 %
50% - 75% 192 5 4 2 1 1 2,6 % 2,1 % 1,0 % 0,5 % 0,5 %
75%-100% 103 8 3 0 0 0 7,8 % 2,9 % 0,0 % 0,0 % 0,0 %
Subtotal 449 22 14 5 1 1 4,9 % 3,1 % 1,1 % 0,2 % 0,2 %
0 - 25% 88 0 0 0 0 0 0,0 % 0,0 % 0,0 % 0,0 % 0,0 %
25% - 50% 584 5 2 0 0 0 0,9 % 0,3 % 0,0 % 0,0 % 0,0 %
50% - 75% 748 5 0 0 0 0 0,7 % 0,0 % 0,0 % 0,0 % 0,0 %
75%-100% 374 11 0 0 0 0 2,9 % 0,0 % 0,0 % 0,0 % 0,0 %
Subtotal 1794 21 2 0 0 0 1,2 % 0,1 % 0,0 % 0,0 % 0,0 %
0 - 25% 6 1 1 1 0 0 16,7 % 16,7 % 16,7 % 0,0 % 0,0 %
25% - 50% 178 29 22 11 2 0 16,3 % 12,4 % 6,2 % 1,1 % 0,0 %
50% - 75% 458 58 33 19 6 3 12,7 % 7,2 % 4,1 % 1,3 % 0,7 %
75%-100% 1026 99 49 20 3 1 9,6 % 4,8 % 1,9 % 0,3 % 0,1 %
Subtotal 1668 187 105 51 11 4 11,2 % 6,3 % 3,1 % 0,7 % 0,2 %
0 - 25% 72 35 33 25 7 4 48,6 % 45,8 % 34,7 % 9,7 % 5,6 %
25% - 50% 297 134 118 62 13 10 45,1 % 39,7 % 20,9 % 4,4 % 3,4 %
50% - 75% 373 251 190 82 13 6 67,3 % 50,9 % 22,0 % 3,5 % 1,6 %
75%-100% 446 304 151 55 6 3 68,2 % 33,9 % 12,3 % 1,3 % 0,7 %
Subtotal 1188 724 492 224 39 23 60,9 % 41,4 % 18,9 % 3,3 % 1,9 %
0 - 25% 2 0 0 0 0 0 0,0 % 0,0 % 0,0 % 0,0 % 0,0 %
25% - 50% 57 16 13 8 2 1 28,1 % 22,8 % 14,0 % 3,5 % 1,8 %
50% - 75% 150 45 41 19 2 1 30,0 % 27,3 % 12,7 % 1,3 % 0,7 %
75%-100% 257 68 25 6 0 0 26,5 % 9,7 % 2,3 % 0,0 % 0,0 %
Subtotal 466 129 79 33 4 2 27,7 % 17,0 % 7,1 % 0,9 % 0,4 %
0 - 25% 187 37 35 27 7 4 19,8 % 18,7 % 14,4 % 3,7 % 2,1 %
25% - 50% 1251 192 161 83 17 11 15,3 % 12,9 % 6,6 % 1,4 % 0,9 %
50% - 75% 1921 364 268 122 22 11 18,9 % 14,0 % 6,4 % 1,1 % 0,6 %
75%-100% 2206 490 228 81 9 4 22,2 % 10,3 % 3,7 % 0,4 % 0,2 %
Total 5565 1083 692 313 55 30 19,5 % 12,4 % 5,6 % 1,0 % 0,5 %
Municipalities with CU BC in 2014 by urbanization rate [All CUs]
Region
Urban
population Municipalities
n of municipalities with CU BC share above… n of municipalities with CU BC share above…% of total
Northeast
Southeast
South
Center-West
North
Total

209
Appendix 44: Credit union BCs by municipal HDI, 2014 (Based on Banco Central do Brasil,
2015c-g and Atlas do Desenvolvimento Humano, 2013)
>0% >25% >50% >75% 100 % >0% >25% >50% >75% 100 %
0 - 0,58 132 0 0 0 0 0 0,0 % 0,0 % 0,0 % 0,0 % 0,0 %
0,58 - 0,61 97 2 2 0 0 0 2,1 % 2,1 % 0,0 % 0,0 % 0,0 %
0,61 - 0,65 108 11 8 4 0 0 10,2 % 7,4 % 3,7 % 0,0 % 0,0 %
0,65 - 0,68 71 3 2 1 1 1 4,2 % 2,8 % 1,4 % 1,4 % 1,4 %
0,68 - 0,72 27 5 2 0 0 0 18,5 % 7,4 % 0,0 % 0,0 % 0,0 %
0,72 - 14 1 0 0 0 0 7,1 % 0,0 % 0,0 % 0,0 % 0,0 %
Subtotal 449 22 14 5 1 1 4,9 % 3,1 % 1,1 % 0,2 % 0,2 %
0 - 0,58 726 1 1 0 0 0 0,1 % 0,1 % 0,0 % 0,0 % 0,0 %
0,58 - 0,61 529 6 1 0 0 0 1,1 % 0,2 % 0,0 % 0,0 % 0,0 %
0,61 - 0,65 362 5 0 0 0 0 1,4 % 0,0 % 0,0 % 0,0 % 0,0 %
0,65 - 0,68 93 1 0 0 0 0 1,1 % 0,0 % 0,0 % 0,0 % 0,0 %
0,68 - 0,72 48 1 0 0 0 0 2,1 % 0,0 % 0,0 % 0,0 % 0,0 %
0,72 - 36 7 0 0 0 0 19,4 % 0,0 % 0,0 % 0,0 % 0,0 %
Subtotal 1794 21 2 0 0 0 1,2 % 0,1 % 0,0 % 0,0 % 0,0 %
0 - 0,58 38 2 1 1 1 0 5,3 % 2,6 % 2,6 % 2,6 % 0,0 %
0,58 - 0,61 74 6 5 3 0 0 8,1 % 6,8 % 4,1 % 0,0 % 0,0 %
0,61 - 0,65 212 29 19 11 3 0 13,7 % 9,0 % 5,2 % 1,4 % 0,0 %
0,65 - 0,68 256 41 27 15 4 4 16,0 % 10,5 % 5,9 % 1,6 % 1,6 %
0,68 - 0,72 447 45 32 17 2 0 10,1 % 7,2 % 3,8 % 0,4 % 0,0 %
0,72 - 641 64 21 4 1 0 10,0 % 3,3 % 0,6 % 0,2 % 0,0 %
Subtotal 1668 187 105 51 11 4 11,2 % 6,3 % 3,1 % 0,7 % 0,2 %
0 - 0,58 7 2 1 1 0 0 28,6 % 14,3 % 14,3 % 0,0 % 0,0 %
0,58 - 0,61 14 6 4 1 0 0 42,9 % 28,6 % 7,1 % 0,0 % 0,0 %
0,61 - 0,65 69 32 26 18 4 3 46,4 % 37,7 % 26,1 % 5,8 % 4,3 %
0,65 - 0,68 147 72 56 30 6 4 49,0 % 38,1 % 20,4 % 4,1 % 2,7 %
0,68 - 0,72 401 241 173 82 12 7 60,1 % 43,1 % 20,4 % 3,0 % 1,7 %
0,72 - 550 371 232 92 17 9 67,5 % 42,2 % 16,7 % 3,1 % 1,6 %
Subtotal 1188 724 492 224 39 23 60,9 % 41,4 % 18,9 % 3,3 % 1,9 %
0 - 0,58 8 4 2 0 0 0 50,0 % 25,0 % 0,0 % 0,0 % 0,0 %
0,58 - 0,61 13 2 2 1 0 0 15,4 % 15,4 % 7,7 % 0,0 % 0,0 %
0,61 - 0,65 40 9 8 6 0 0 22,5 % 20,0 % 15,0 % 0,0 % 0,0 %
0,65 - 0,68 107 31 27 14 3 2 29,0 % 25,2 % 13,1 % 2,8 % 1,9 %
0,68 - 0,72 208 54 30 11 1 0 26,0 % 14,4 % 5,3 % 0,5 % 0,0 %
0,72 - 90 29 10 1 0 0 32,2 % 11,1 % 1,1 % 0,0 % 0,0 %
Subtotal 466 129 79 33 4 2 27,7 % 17,0 % 7,1 % 0,9 % 0,4 %
0 - 0,58 911 9 5 2 1 0 1,0 % 0,5 % 0,2 % 0,1 % 0,0 %
0,58 - 0,61 727 22 14 5 0 0 3,0 % 1,9 % 0,7 % 0,0 % 0,0 %
0,61 - 0,65 791 86 61 39 7 3 10,9 % 7,7 % 4,9 % 0,9 % 0,4 %
0,65 - 0,68 674 148 112 60 14 11 22,0 % 16,6 % 8,9 % 2,1 % 1,6 %
0,68 - 0,72 1131 346 237 110 15 7 30,6 % 21,0 % 9,7 % 1,3 % 0,6 %
0,72 - 1331 472 263 97 18 9 35,5 % 19,8 % 7,3 % 1,4 % 0,7 %
Total 5565 1083 692 313 55 30 19,5 % 12,4 % 5,6 % 1,0 % 0,5 %
Northeast
Southeast
South
Center-West
North
Municipalities with CU BC in 2014 by HDI [All CUs]
Region
Municipal
HDI Municipalities
Overall
n of municipalities with CU BC share above… n of municipalities with CU BC share above…% of total