Embed Size (px)
Citation preview
BIS Papers No 83 9
The role of banks
Torsten Ehlers and Agustín Villar1
Abstract
Credit has grown at a rapid pace in emerging markets (EMs) over the last 10 years. Banks have played a major role in the extension of credit and have continued to be its main source. Domestic banks have taken over business from foreign banks since 2008. However, developments across EMEs have been heterogeneous, with non-bank financing playing a greater role in the faster growing economies. Important changes have occurred in the composition of bank assets over this period. While the banking sector leverage generally has not increased, banks’ sources of funding and recipients of their credit have changed. Bank credit is increasingly flowing to households, in particular, in the form of mortgage loans. Corporate deposits have gained share relative to household deposits, potentially making banks rely on a less stable source of funding. In some EMs, non-core funding (liabilities other than equity and deposits) are playing a greater role in sustaining credit growth by banks. Forward-looking measures point to increased credit risk in many EMs. Interest rate risks remain in many cases with customers, as, for instance, as large share of mortgage loans are variable rate contracts. But interest rates could feed back to credit and funding risks, if defaults on loans rise and corporates respond by discontinuing their supply of deposits.
Keywords: Emerging markets, financial intermediation, banks, bank lending, credit growth
JEL classification: E44, G20, G21
1 Bank for International Settlements. Agne Subelyte and Diego Urbina provided excellent research
assistance. It draws on the BIS survey conducted for this meeting. The replies are presented in summary tables in the appendix.

10 BIS Papers No 83
Introduction
Historically, banks have been the main supplier of credit in emerging market economies (EMEs). In the 1990s, market-based finance began to compete with bank lending. Since 2008, this structural shift has continued in parallel with the exceptionally easy global financial conditions ushered in by the accommodative monetary policies in major advanced economies. How have these changes affected financial intermediation in EMEs? In particular, has the role of banks changed? Has the development of debt securities markets combined with global cyclical forces made banks more vulnerable to credit and funding risks? And how has the role of foreign banks in EMEs changed?
EME banks have not changed their business models in the same way as those in advanced economies did in the run-up to the financial crisis. In the advanced economies, banks rapidly expanded their balance sheets by buying securitised debt, financed mostly with short-term debt instruments such as commercial paper ((Adrian et al (2012) and Acharya and Schnabl (2010)). In contrast, EME banks have relied more on deposits.
This does not mean that EME banks are less risky. Although they have reduced their leverage over the past decade, forward-looking indicators point to heightened credit risk in many EMEs. In a number of economies, the gap between private credit-to-GDP and its long-term trend is positive and large. Already sizeable private sector debt service ratios would increase further with higher interest rates. Moreover, the management of liquidity could become challenging in some EMEs. As banks have relied on deposits to fund long-term loans, deposit withdrawals – in particular, by corporates – could expose banks to increased funding risk. Their reliance on non-core debt is sizeable in some economies.
Post-crisis, many EMEs have seen banks withdraw from the hardest-hit countries. Over the past five years, as domestic credit has expanded rapidly, the relative reliance on direct cross-border bank credit has actually declined in all major EM regions. And foreign banks are increasingly operating through local offices (branches and subsidiaries). The exception is emerging Asia, where a more regional model of cross-border banking seems to be taking shape.
The rest of the paper is organised as follows. Section 1 discusses the relative importance of bank credit in EMEs. Section 2 illustrates the changes in the structure of bank assets and liabilities. Section 3 discusses the potential credit, interest rate and funding risks in the banking sector. The final section briefly reviews the role of international banks.
1. Credit financing and the role of the banking sector
Private sector credit grew rapidly across EMEs over the decade to 2013, driving up credit-to-GDP ratios, particularly since 2008 (Table 1, left-hand columns). In some EMEs, expanding credit pushed the ratio to new heights. While the share of bank credit in total private sector credit declined in several EMEs (Table 1, right-hand columns), banks continue to be the main source of credit (see also country notes from the Czech Republic, Indonesia and the Philippines). There is also evidence that banks

BIS Papers No 83 11
have faced increased competition from debt securities markets in financing some EME borrowers, particularly after 2008.2, 3
In several EMEs, private sector credit is increasingly provided by other sectors and financial intermediaries. For example, the sharp fall in the share of domestic bank credit in China reflects the strong expansion of cross-border borrowing and the activities of trust companies, as international portfolios have sought greater exposure to the economy (Ma and Villar (2014)). In Korea, the non-banking sector provides about one third of private sector credit. In Hungary, a banking crisis has cut the banks’ share. In contrast, banks have been regaining market share in Mexico and Turkey despite greater competition from fast-developing bond markets.
A drawback of these data is that financial accounts (flows of funds) are available for only a small group of economies. As a result, most private sector credit estimates are based on BIS data for (domestic and cross-border) private sector bank borrowing and debt securities issues.4 Thus, the estimates exclude debt obtained through the issuance of domestic securities unless these are held by banks. This might be a considerable amount, given increased issuance in EMEs in recent years.
State-owned banks continue to play an important role in a few EMEs. One reason is that only small changes have been made to ownership structures over the past decade (Appendix Table A1). State-owned banks hold a dominant position in Algeria, China and India, and constitute a large share of banking sector assets in Argentina, Indonesia, Brazil, Russia and Turkey (and, to a lesser extent, in Korea and Thailand). At the same time, state ownership is negligible in a few countries, such as Hong Kong SAR and Israel. Beyond the pattern of ownership, government intervention seems to have declined (Mohanty and Turner (2008)). Governments have lifted interest rate controls and seem to be interfering less in credit allocation.
2 These trends will be described in more detail in the second background paper for this meeting on
“The role of debt securities markets”.
3 See country note from the Bank of Korea for this meeting.
4 For Colombia, Peru, the Philippines and Israel, the estimation follows the methodology used in the BIS publication, but it is not being published.

12 BIS Papers No 83
Private sector credit and domestic bank lending in EMEs Table 1
Total credit to non-financial private sector (as a share of nominal GDP)1
Bank credit to non-financial private sector (as a share of total credit to non-financial
private sector)
2004 2007 2013 2004 2007 2013
Emerging Asia
China 124 118 181 96 91 75
Hong Kong SAR 164 183 261 90 83 81
India 38 50 59 96 93 92
Indonesia 29 28 41 87 93 89
Korea 139 160 185 74 76 67
Malaysia 131 114 135 96 96 100
Philippines2 41 34 41
Singapore 101 97 139 91 84 87
Thailand 109 97 127 97 98 97
Latin America
Argentina 13 15 16 64 76 94
Brazil 34 45 76 88 93 93
Chile 85 94 123 71 71 63
Colombia2 26 33 44
Mexico 23 27 34 34 45 41
Peru2 20 23 37
Central and eastern Europe
Czech Republic 69 78 98 39 52 55
Hungary 81 112 121 48 47 39
Poland 43 57 79 59 65 65
Other EMEs
Algeria
Israel2 88 99
Russia 37 53 68 67 71 75
Saudi Arabia 39 46 43 88 85 95
South Africa 61 80 73 96 95 94
Turkey 21 37 70 72 75 89
United Arab Emirates 1 BIS calculations of total credit to private non–financial sector. 2 Total credit to the private sector estimate based on domestic bank credit to private sector (IMF, International Financial Statistics, line 22d), plus cross-border loans to the non-bank sector, less government exposure from BIS consolidated banking statistics, plus international debt securities issued by non-financial corporations.
Sources: IMF, International Financial Statistics; national data; BIS international banking statistics; BIS securities statistics.

BIS Papers No 83 13
2. Banks’ balance sheets and potential risks
A key question is whether favourable global financing conditions have encouraged procyclical behaviour by banks and a build-up of risks on their balance sheets. Relying on balance sheet data for such analysis is fraught with difficulties for reasons outlined below. Nevertheless, a cross-sectional look at banking sectors might help to unveil common features across different economies.
2.1 Bank assets
EME bank assets have grown strongly over the last decade (Appendix Table A8), but without lifting bank leverage (asset-to-equity ratio). In the country sample for the whole decade, leverage marginally decreased (ie somewhat more than half of the changes in asset-to-equity ratio are negative) despite the significant growth rates in bank assets. By splitting the sample into two periods (Graph 1, left-hand panel), two outlier observations seem to weigh on the whole panel relationship. In the period 2009–13, there is a slightly positive, albeit less than proportional, relationship between changes in bank total assets and in leverage (asset-to-equity ratio) in the cross section.
The procyclicality of bank leverage tends to obtain where bank portfolios are marked to market, as when tradable securities are held and value-at-risk constraints are binding (Adrian and Shin (2010a,b)). This analysis is based on a very crude measure of leverage that stems from accounting standards which vary widely across EMEs. But EME banks still follow a more traditional business model and are less engaged in investment banking activities than are their advanced economy counterparts.
The strong growth in EME bank assets shifted the composition of assets towards a higher share of loans (Graph 1, centre panel). In 2009–13, the increase in the shares
Bank leverage, asset growth and credit
Percentage changes Graph 1
Bank assets and leverage Bank assets and loans Bank assets and public sector bonds
Source: BIS questionnaire.
–100
0
100
200
300
–20 0 20 40Asset-equity ratio
Tot
al b
ank
asse
ts
Change between 2004 and 2009
–20
0
20
40
0 100 200 300 400Total bank assets
Loan
-ass
et r
atio
Change between 2009 and 2013
–100
–50
0
50
100
0 100 200 300 400Total bank assets
Pub
lic s
ecto
r bo
nd h
oldi
ngs
to a
sset
s
14 BIS Papers No 83
of loans appeared to be stronger, hinting at a continued strong expansion of bank credit.
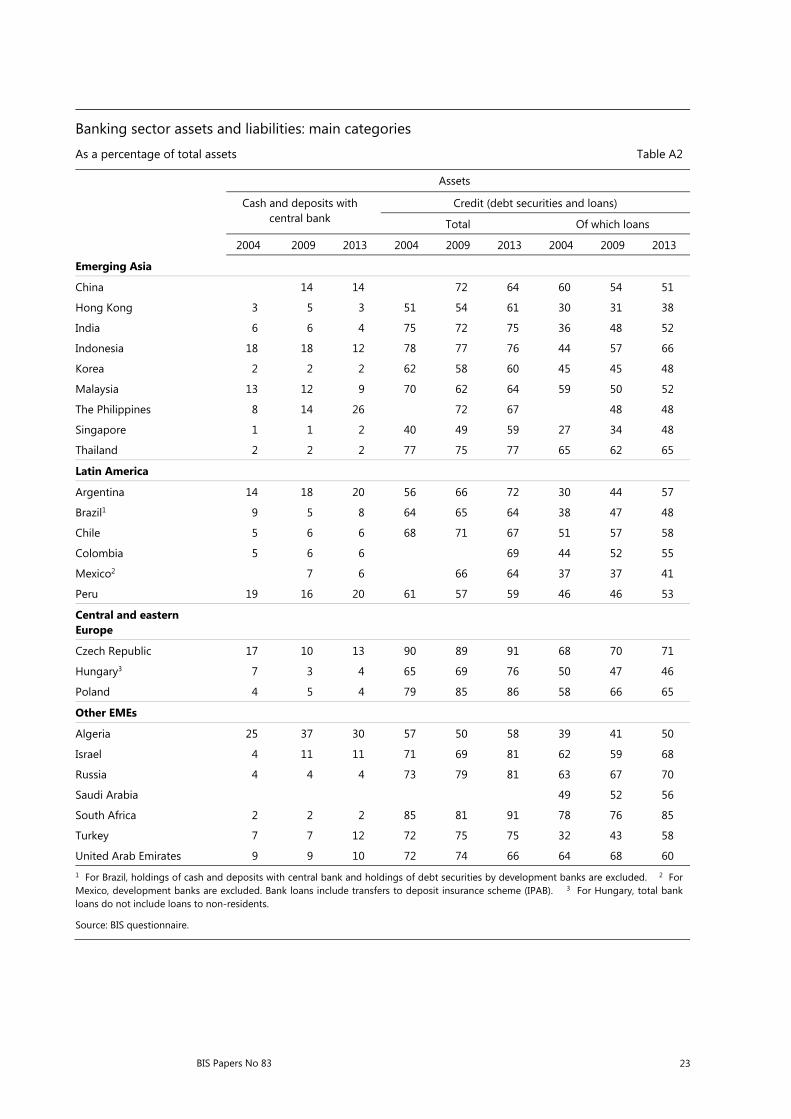
While bank assets grew, the share of government debt securities holdings in their total assets fell (Graph 1, right-hand panel). The rise in loan ratios is mirrored by a reduction in the share of government bonds in total assets (see country note from Colombia). As banks shifted their portfolio from government bonds to loans, they kept roughly steady the holdings of other (private) securities and financial instruments as a share of their assets. Such holdings are generally comparatively low (Appendix Table A4).
Even though changes in the composition of EME bank loan portfolios vary widely (Appendix Table A5), some general trends stand out. First, the median share of loans to non-financial corporates has declined slightly (from 48% in 2004 and 48% in 2009, to 44% in 2013), which is mirrored mainly by a rise in the share of loans to households. The increase in this median share across EMEs is most visible from 2004–09 (35% to 38%). Since 2009, it has edged up only slightly (to 39%), possibly influenced by a tightening of regulation in many economies (see country note from Korea). But shares vary considerably between countries. In Peru, the share of corporate loans was around 70% in 2013. This share can be much smaller in countries with highly developed bond markets (ie Singapore, 25%), or where loans to the public sector play an important role (ie the Czech Republic, 23.5%).
Second, lending to the household sector is concentrated in residential mortgages; but the pattern is not homogeneous (Appendix Table A9). In 13 out of 23 countries for which information was provided, residential mortgage loans account for more than half of household loans, including in several of the largest or financially more developed EMEs. In nine economies they account for over 10% of total assets, in Chile, the Czech Republic, Malaysia and Hungary for over 15%, and in Poland, Israel and South Africa for over 20%.
2.2. Debt liabilities
How has this asset growth been financed and has the mix of debt liabilities changed? Debt liabilities comprise four funding sources: (i) retail deposits; (ii) corporate deposits; (iii) long-term debt securities (bonds); and (iv) other non-core funding. Sources (iii) and (iv) are typically considered non-core liabilities. Other non-core liabilities include interbank claims5 and short-term debt securities. These are usually the least stable sources of funding, as they can quickly dry up under stress (Hahm et al (2013)).
Deposits in general have contributed the most to the growth in liabilities over the last 10 years (Graph 2). Across EMEs, retail and corporate deposits made the greatest contribution to total liabilities growth. The median contribution of corporate deposits was 24% and 31% of total debt liability growth in 2004–09 and in 2009–13, respectively. For households deposits the median contribution was 21% and 31%, respectively.
Another major source of bank funding was other non-core liabilities. Across all countries in the sample, its mean contribution was 28% of total debt liabilities in both
5 It refers to other liabilities than deposits from banks, as those are included in corporate deposits.

BIS Papers No 83 15
2004–09 and 2009–13. However, the banking sectors where financial markets are more developed (such as Hong Kong, Korea and Mexico) seem to rely on non-core debt financing to a greater extent.6
Despite its growth, banks’ bond financing still accounts for no more than a small share in total liabilities (Appendix Table A2). In Hungary, Colombia and Israel, where bond financing has increased the most, its contribution to the growth in total debt liabilities was still lower than that of deposits.7
3. Credit, funding and interest rate risks
The fast growth in bank assets and the changes in the composition of banks’ assets and liabilities raise questions about credit, interest rate, currency and funding risks.
6 An exception is Hungary, where a decline in deposits seems to have been substituted by non-core
financing.
7 For India, Brazil, Algeria, Turkey and the United Arab Emirates, the numbers for bond financing are not available.
Bank debt liabilities
Contributions to total growth in debt liabilities, in per cent Graph 2
AE = United Arab Emirates; AR = Argentina; BR = Brazil; CL = Chile; CN =China; CO = Colombia; CZ = Czech Republic; DZ = Algeria; HK = Hong Kong SAR; HU = Hungary; ID = Indonesia; IL = Israel; IN = India; KR = Korea; MX = Mexico;MY = Malaysia; PE = Peru; PH = Philippines; PL = Poland; RU = Russia; SA = Saudi Arabia; SG = Singapore; TH = Thailand; TR = Turkey; VE = Venezuela; ZA = South Africa.
1 For Hong Kong SAR, Israel, Russia and Turkey, full breakdown of deposits by sector was not provided, therefore total deposits are shown. No data on deposits were provided by Brazil and China. 2 Retail deposits = deposits from households. 3 Corporate deposits = total deposits from non-financial and financial corporates. 4 Other deposits = deposits other than from households or corporates. 5 Bonds = tradable long-term debt securities. Data for Algeria, Argentina, Colombia, India, Saudi Arabia, Turkey and the United Arab Emirates were not provided. For Brazil, data for 2004 and 2009 were not provided. For the Czech Republic, Mexico and Thailand, data for 2004 were not provided. For Russia, only domestic debt securities. 6 Other non-core liabilities = all liabilities other than equity, deposits, or bonds.
Source: BIS questionnaire.
–75
–50
–25
0
25
50
75
100
125
150
CN HK IN ID KR MY PH SG TH AR CL CO MX PE CZ HU PL DZ IL RU SA ZA TR AE
2004
–09
2009
–13
Total deposits1
Retail deposits2Corporate deposits3
Other deposits4Bonds5
Other non-core liabilities6

16 BIS Papers No 83
3.1. Credit, interest rate and currency risk
Are there signs that the rapid expansion of bank assets in EMEs has exposed banks to heightened credit risk? Balance sheet measures of credit risk losses, such as non-performing loan ratios or loan loss provisions, signal low risks. In both emerging Asia and Latin America, non-performing loan ratios have been declining and are usually between 2% and 3% of total loans. In central and eastern Europe, non-performing loan ratios have increased since 2008, and are around 6% at the median. Loan loss provisions are low relative to operating income across virtually all emerging markets (median EM Asia = 12%, LatAm = 18%, CEE = 11%).
But, statistics based on balance sheet items are insufficient measures of credit risks or potential instabilities (Lowe (2002)). Crucially, given accounting rules, they function more as backward-looking measures than as leading indicators of potential financial distress. And they may even give misleading signals as profits tend to be high and provisions low during the boom stage of the financial cycle (Borio and Drehmann (2009)).
Forward-looking metrics may signal risks ahead for the banking sector in a number of EMEs (BIS (2014)). Rapid growth in bank assets has fuelled a fast rise in private credit-to-GDP ratios. The credit-to-GDP gap – the deviation of credit-to-GDP ratio from its long-run trend – has proved to be a fairly reliable indicator of future banking sector distress (Borio and Lowe (2002)), with a typical lead time of two or more years ahead. Sceptics argue that emerging market economies (EMEs) are more likely to be undergoing a period of financial deepening, which renders the specification of the trend for the calculation of the credit gap problematic. Yet Drehmann and Tsatsaronis (2014) have shown that the credit gap also performs well for EMEs, albeit not as well as it does for the group of advanced economies.
For China, India, Hong Kong SAR and other economies in Asia, as well as Brazil and Turkey, the credit-to-GDP ratio is more than 10 percentage points above its long-run trend (see Graph 3, left-hand panel). This is a threshold at which the Basel III framework suggests that the countercyclical buffer rate should be set at its maximum level (Basel Committee (2010)). Hong Kong has recently activated countercyclical capital buffers, in part as a response to a high credit-to-GDP gap (HKMA (2015)). ). For many other EMEs such as Korea, Mexico and South Africa, credit-to-GDP gaps are approaching levels that deserve close attention.
While credit-to-GDP gaps are a fairly reliable predictor of strains at long horizons, high debt service ratios (DSRs) provide better signals for horizons of a year or so (Drehmann and Juselius (2014)). DSRs tend to peak just before strains materialise. While increases in the credit-to-GDP ratio result in steady cumulative increases in the DSR, it is rising or falling interest rates that cause the sharpest changes. The DSR’s explicit dependence on interest rates is one link between monetary policy and financial stability. Substantial increases in interest rates, possibly triggered by the normalisation of US monetary policy, could push up debt service costs in many EMEs to critical levels (Graph 3, right-hand panel). In Brazil and Turkey, a 250 basis point increase in rates could result – ceteris paribus – in debt service costs greater than 6 percentage points above their long-run average; assuming that increases in interest rates are fully passed through to lending rates. Levels of more than 6% over the long-run average are critical for financial stability risks. For China, this ratio would be considerably higher.

BIS Papers No 83 17
Increases in interest rates are also a source of market risks, given banks’ debt securities holdings. In some economies, total debt securities holdings exceed 20% of total assets. Unless banks are fully hedged against interest rate risks, a rise in interest rates would induce losses. In particular, government bonds, which can be of relatively long maturity in an increasing number of EMEs, carry notable duration risk. For instance, for bonds with a duration of seven years and a yield of 3.5%, a 250 basis point increase in interest rates would cause a loss of roughly 17%. In some economies, government bond holdings represent more than 15% of total bank assets (Hungary, India, Poland and Turkey). In many jurisdictions, banks are required to hold capital against interest rate risk and may be hedged. Nevertheless, very large increases in interest rates could expose unhedged positions and squeeze banks’ equity buffers.
To the extent banks are not hedged against interest rate increases, these would also increase funding costs. This could, in turn, squeeze banks’ operating margins and reduce buffers against potential credit losses. Higher financing costs would be especially felt where banks rely heavily on non-core debt liabilities. A proper assessment of interest rate risk would require detailed knowledge of the maturities of liabilities and the use of hedging instruments. Nevertheless, a relevant dimension covered in the BIS survey is the share of fixed and flexible rate loans. Among respondents, the banking sector charges flexible interest rates on more than 50% of outstanding loans (Graph 4, right-hand panel, and Appendix Table A10). While this may help insulate banks to some extent, deposits have shorter average maturities and
Early warning indicators for domestic banking crises signal risk ahead1 Graph 3
Credit-to-GDP gap, latest figures2, 3 Debt service ratio (DSR) – impact of a 250bp increase in interest rates4, 5
Percentage points
AR = Argentina; BR = Brazil; CEE = central and eastern Europe; CL = Chile; CN = China; CZ = Czech Republic; HK = Hong Kong SAR; HU = Hungary; ID = Indonesia; IN = India; KR = Korea; MX = Mexico; MY = Malaysia; PL = Poland; RU = Russia; SG = Singapore;TH = Thailand; TR = Turkey; ZA = South Africa.
1 Thresholds for red bars are chosen by minimising false alarms, conditional on capturing at least two thirds of the crises over a cumulativethree-year horizon. A signal is correct if a crisis occurs in any of the three years ahead. The noise is measured by the wrong predictions outsidethis horizon. Beige bars for the credit-to-GDP gap are based on guidelines for countercyclical capital buffers underBasel III. Beige bars for DSRs are based on critical thresholds if a two-year forecast horizon is used. For a derivation of critical thresholds for credit-to-GDP gaps, see Drehmann et al (2011). For debt service ratios, see Drehmann and Juselius (2012). 2 Difference of the credit-to-GDP ratio from its long-run, real-time trend calculated with a one-sided HP filter using a smoothing factor of 400,000, in percentage points. 3 Q3 2014 for the Czech Republic, Hungary, Korea and Mexico; Q2 2014 for other countries. 4 Assuming that an increase of 2.50 percentage points in interest rates is fully transmitted to lending rates and that all the other components of the DSRs stay fixed. 5 Difference of DSRs from country-specific long-run averages since 1985 or later depending on data availability and when five-year average inflation fell below 10% (for Russia and Turkey, the last 10 years are taken). 6 Hong Kong SAR, Indonesia, Malaysia and Thailand. 7 The Czech Republic, Hungary, Poland and Russia.
Sources: National data; BIS; BIS calculations.
–40
–20
0
20
40
HK TH SGCN ID TR BRMY CL CZMXKR ARRU PL ZA IN HU
Credit/GDP gap > 10 2 <= Credit/GDP gap <= 10
–2
0
2
4
6
8
10
12
Asia6 BR CN IN TR CEE7 KR MX ZA
Actual DSR4
+250 bp interest rate rise5
DSR > 6 4 <= DSR <= 6

18 BIS Papers No 83
pay interest rates that are adjusted more frequently. In addition, in many banking sectors the share of variable-rate deposits is also high; sometimes higher than that for loans (the Czech Republic, Malaysia and Brazil).
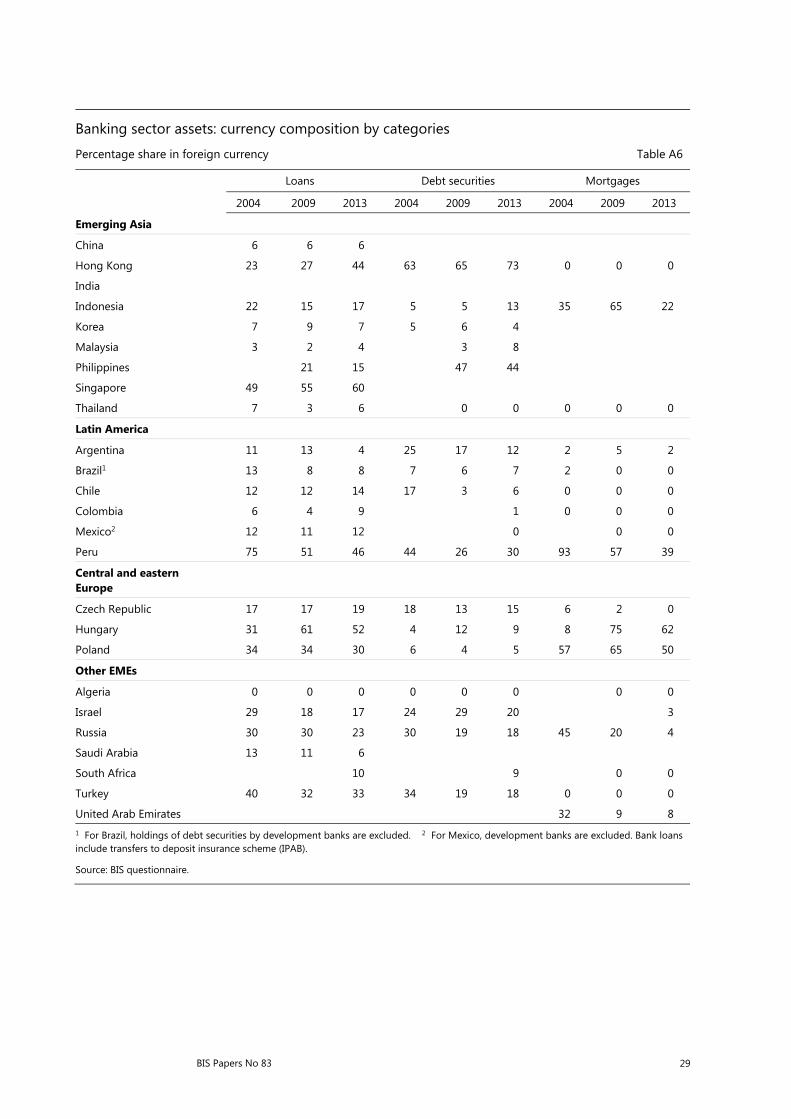
Another dimension of potential credit and interest rate risks is foreign currency lending. Loans to non-financial corporates and households in foreign currency – mostly US dollars outside CEE – are a feature of the banking sector in a number of EMEs. A concern is that higher US interest rates and further dollar appreciation might raise the debt burdens. In some countries, a large share of bank assets is denominated in foreign currency, suggesting that bank borrowers may be exposed to substantial currency mismatch (Appendix Tables A6 and A7).
3.2. Funding risks
High loan-to-deposit ratios (LDRs) are a potential source of funding risk. LDRs have increased over the last 10 years – and from relatively high levels (Graph 4, left-hand panel). Out of the 24 countries in the sample, 14 had LDRs greater than 90% in 2013, and nine above 100%. In some cases LDRs have declined since 2008, but from very high levels (see Appendix Table A8).
A sudden withdrawal of deposits would force banks to switch to other funding sources or to fire-sale assets. Attracting additional deposits would likely require higher rates. And tapping capital or interbank markets might prove difficult if financial conditions deteriorated. A concern is the possible behaviour of large corporate depositors (see second background paper on “The role of debt securities”). The median share of corporate deposits in total deposits increased from 33% in 2004 to
Loan-to-deposit ratios and variable vs fixed rate contracts
In per cent Graph 4
Median loan-to-deposit ratios1 in major EM regions Share of variable rate bank loans and deposits
AR = Argentina; BR = Brazil; CEE = central and eastern Europe; CL = Chile; CZ = Czech Republic; DZ = Algeria; HK = Hong Kong SAR; ID = Indonesia; KR = Korea; MX = Mexico; MY = Malaysia; PL = Poland; SG = Singapore; TR = Turkey.
1 Gross loans over total deposits. 2 Emerging Asia = China, India, Indonesia, Hong Kong SAR, Korea, Malaysia, the Philippines, Singaporeand Thailand. 3 Latin America = Argentina, Brazil, Chile, Colombia, Mexico, Peru and Venezuela. 4 Central and eastern Europe = the Czech Republic, Hungary and Poland. 5 Other EMEs = Algeria, Israel, Russia, Saudi Arabia, South Africa, Turkey and the United Arab Emirates.
Source: BIS questionnaire.
50
60
70
80
90
100
110
120
Emerging Asia2 Latin America3 CEE4 Other EMEs5
2004 2009 2013
–40
–20
0
20
40
60
80
HK SG PL ID CZ KR MX MY BR TR CL AR DZ
2004Change 2004–132013
Share of flexible rate loans2004Change 2004–132013
Share of flexible rate deposits

BIS Papers No 83 19
44% in 2009, after which it stabilised. In a few countries, non-financial corporate deposits now exceed those of households (Algeria, Colombia and South Africa; see also Appendix Table A2).
4. Role of international banks and their business models
International banks have historically played a substantial role in private sector financing in EMEs. After the Lehman default in 2008, however, foreign bank lending declined considerably. And in the wake of the euro area crisis in late 2011, European banks retreated further from cross-border lending, driven by their deteriorating financial health (Avdjiev et al (2012)). Have international bank business models become more local in response? Have regional banks stepped into the void?
4.1. The role of international bank credit in EMEs
Overall, the role of international bank credit in EMEs has declined (Graph 5, left-hand panel). In Latin America, the median ratio of foreign bank credit (cross-border plus local bank credit by foreign banks) to domestic bank credit for the non-bank sector was around 50% in 2004. Since then, it has declined to roughly 30%. In central and eastern Europe, the same ratio dropped from 100% in 2009 to roughly 75% at the end of 2013. In some Latin American countries, foreign bank credit used to be of
Cross-border and local claims by foreign banks to the private sector1, 2
As a percentage of domestic bank credit to non-financial private sector Graph 5
By recipient region3 By recipient country
AE = United Arab Emirates; AR = Argentina; BR = Brazil; CEE = central and eastern Europe; CL = Chile; CN = China; CO = Colombia; CZ = Czech Republic; DZ = Algeria; HK = Hong Kong SAR; HU = Hungary; ID = Indonesia; IL = Israel; IN = India; KR = Korea; MX = Mexico; MY = Malaysia; PE = Peru; PH = Philippines; PL = Poland; RU = Russia; SA = Saudi Arabia; SG = Singapore; TH = Thailand; TR = Turkey; VE = Venezuela; ZA = South Africa.
1 Outstanding foreign claims on the non-bank private sector on an ultimate borrower basis. Foreign claims comprise international claims (cross-border claims in all currencies and local claims of foreign bank offices in foreign currencies) and local claims of foreign bank offices in local currency. 2 Data from all the BIS consolidated reporting countries. 3 Median value of the region. 4 For a definition of the regions see the footnotes to Graph 4.
Sources: IMF, International Financial Statistics; national data; BIS consolidated banking statistics.
0
30
60
90
2005 2006 2007 2008 2009 2010 2011 2012 2013 2014
Asia-Pacific4
Latin America4CEE4
Other EMEs4
–50
0
50
100
CZMXHKHUPLSGPE CL AE ZAARMYTR ID COVEPHTHDZ IN BRRUKRSA IL CN
End-2008End-2013
Absolute change betweenend-2008 and end-2013

20 BIS Papers No 83
similar importance in the late 1990s, but by end-2013 the ratio was significantly below 50% in most countries (Graph 5, right-hand panel). Despite this decline, foreign credit remains an important funding source in many EMEs. In many emerging Asian economies, the relative importance of foreign bank has traditionally been smaller and has not changed dramatically over the last 10 years.
4.2. International bank business models and regionalisation
International banks’ locally intermediated lending is considered to be less volatile than cross-border lending (García-Herrero and Martínez Pería (2007), McCauley et al (2012)). Already prior to 2008, a gradual new trend toward more localised banking models had emerged (intermediation through local offices, branches and subsidiaries).
This trend continued after 2008, except in emerging Asia. The trend is most visible in Latin America: from 2004 to 2013, the ratio of claims denominated in local currency from local offices in total foreign bank claims rose from about 45% to over 60% (Graph 6, left-hand panel). In central and eastern Europe, the same ratio declined slightly after 2008, but has since recovered to around 60% for the median country. In emerging Asian economies, it has generally not increased since 2008 (Graph 6, right-hand panel).
Channels of foreign bank intermediation
As a percentage of total foreign claims1, 2 Graph 6
Local claims of foreign bank offices in local currency by counterparty region2
Local claims of foreign bank offices in local currency by counterparty country2
AE = United Arab Emirates; AR = Argentina; BR = Brazil; CEE = central and eastern Europe; CL = Chile; CN = China; CO = Colombia; CZ = Czech Republic; DZ = Algeria; HK = Hong Kong SAR; HU = Hungary; ID = Indonesia; IL = Israel; IN = India; KR = Korea; MX = Mexico; MY = Malaysia; PE = Peru; PH = Philippines; PL = Poland; RU = Russia; SA = Saudi Arabia; SG = Singapore; TH = Thailand; TR = Turkey; VE = Venezuela; ZA = South Africa.
1 Outstanding foreign claims on an immediate borrower basis. Foreign claims comprise international claims (cross-border claims in all currencies and local claims of foreign bank offices in foreign currencies) and local claims of foreign bank offices in local currency. 2 Data aggregated across 26 BIS reporting countries which report local claims of foreign bank offices in local currency: Australia, Austria, Belgium,Brazil, Canada, Chinese Taipei, Denmark, Finland, France, Germany, Greece, India, Ireland, Italy, Japan, Korea, the Netherlands, Norway, Portugal, Singapore, Spain, Sweden, Switzerland, Turkey, the United Kingdom and the United States. 3 For a definition of the regions, see the footnotes to Graph 4.
Source: BIS consolidated banking statistics.
0
20
40
60
2004 2006 2008 2010 2012 2014
Asia-Pacific3
Latin America3CEE3
Other EMEs3
–50
–25
0
25
50
75
DZCZVETH ZAMXARCLCOMYBRPL HKKRHU IN TRSGPEPHCNRUAE ID IL SA
End-2008End-2013
Absolute change betweenend-2008 and end-2013

BIS Papers No 83 21
For the part of foreign bank credit that is locally intermediated, lending via subsidiaries appears to have been less volatile than that via branches during the financial crisis (Hoggarth et al (2013)). Since 2009, local intermediation is increasingly taking place through subsidiaries (Appendix Table A12), probably in response to the financial crisis. Local funding ratios are generally quite high for subsidiaries (Appendix Table A13). This helps to better insulate them from funding shocks to the parent bank. The subsidiary-based model clearly prevails in Latin America and most countries in central and eastern Europe (as well as in Turkey). In some emerging Asian countries, however, branches remain the prevalent form of local presence. This likely reflects more stringent regulation on branches in some countries.

22 BIS Papers No 83
Appendix
Banking sector assets: ownership
As a percentage of total assets Table A1
Private domestic Foreign-owned State-owned
2004 2009 2013 2004 2009 2013 2004 2009 2013
Emerging Asia
China 17 24 29 2 2 2 65 60 52
Hong Kong 32 30 28 68 70 72
India 19 20 21 7 8 7 74 72 73
Indonesia 41 40 43 13 13 13 41 39 36
Korea 52 47 48 6 12 9 23 22 24
Malaysia 72 70 69 7 7 7
The Philippines 75 76 77 14 11 10 11 13 13
Singapore 25 27 32 75 73 68
Thailand 64 58 57 9 14 14 17 20 21
Latin America
Argentina 31 31 28 29 28 28 39 39 43
Brazil1 33 37 35 19 18 15 44 43 48
Chile 44 44 49 40 38 34 16 16 16
Colombia 55 63 69 15 18 18 15 5 5
Mexico2 17 22 24 66 62 58 17 15 16
Peru 57 59 58 26 22 24 12 11 8
Central and eastern Europe
Czech Republic3 0 0 1 97 97 95 3 3 4
Hungary 26 27 27 63 64 62 5 4 5
Poland 3 5 8 65 68 63 26 21 22
Other EMEs
Algeria 3 0 0 4 11 14 93 89 86
Israel 99 98 98 1 2 2
Russia 54 42 40 8 18 15 38 39 44
Saudi Arabia
South Africa 94 70 74 6 27 26
Turkey 58 53 51 4 15 19 38 32 31
United Arab Emirates 13 18 18 23 19 19 64 63 64 1 For Brazil, figures on state-owned banking corporations include development banks. The percentage shares of development banks’ assets in total banking sector assets were 12.6%, 13% and 13.6% in 2004, 2009 and 2013, respectively. 2 For Mexico, figures on state-owned banking corporations include only development banks. 3 For Czech Republic, 2013 figure on private domestic banking corporations and figures on state-owned banking corporations are confidential.
Source: BIS questionnaire.
BIS Papers No 83 23
Banking sector assets and liabilities: main categories
As a percentage of total assets Table A2
Assets
Cash and deposits with central bank
Credit (debt securities and loans)
Total Of which loans
2004 2009 2013 2004 2009 2013 2004 2009 2013
Emerging Asia
China 14 14 72 64 60 54 51
Hong Kong 3 5 3 51 54 61 30 31 38
India 6 6 4 75 72 75 36 48 52
Indonesia 18 18 12 78 77 76 44 57 66
Korea 2 2 2 62 58 60 45 45 48
Malaysia 13 12 9 70 62 64 59 50 52
The Philippines 8 14 26 72 67 48 48
Singapore 1 1 2 40 49 59 27 34 48
Thailand 2 2 2 77 75 77 65 62 65
Latin America
Argentina 14 18 20 56 66 72 30 44 57
Brazil1 9 5 8 64 65 64 38 47 48
Chile 5 6 6 68 71 67 51 57 58
Colombia 5 6 6 69 44 52 55
Mexico2 7 6 66 64 37 37 41
Peru 19 16 20 61 57 59 46 46 53
Central and eastern Europe
Czech Republic 17 10 13 90 89 91 68 70 71
Hungary3 7 3 4 65 69 76 50 47 46
Poland 4 5 4 79 85 86 58 66 65
Other EMEs
Algeria 25 37 30 57 50 58 39 41 50
Israel 4 11 11 71 69 81 62 59 68
Russia 4 4 4 73 79 81 63 67 70
Saudi Arabia 49 52 56
South Africa 2 2 2 85 81 91 78 76 85
Turkey 7 7 12 72 75 75 32 43 58
United Arab Emirates 9 9 10 72 74 66 64 68 60 1 For Brazil, holdings of cash and deposits with central bank and holdings of debt securities by development banks are excluded. 2 For Mexico, development banks are excluded. Bank loans include transfers to deposit insurance scheme (IPAB). 3 For Hungary, total bank loans do not include loans to non-residents.
Source: BIS questionnaire.

24 BIS Papers No 83
Banking sector assets and liabilities: main categories
As a percentage of total assets Table A2 (cont)
Deposits
Total Corporate Retail
2004 2009 2013 2004 2009 2013 2004 2009 2013
Emerging Asia
China
Hong Kong 54 60 54
India 80 77 75 14 19 16 47 45 44
Indonesia 76 78 74 18 20 23 47 47 42
Korea 40 33 41 13 15 18 23 15 19
Malaysia 76 68 65 37 36 34 30 24 23
The Philippines 62 70 71 11 24 33 51 46 38
Singapore 36 44 44 11 14 15 10 12 13
Thailand 70 65 65 13 13 16 49 44 40
Latin America
Argentina 39 51 54 19 25 27 20 26 27
Brazil
Chile 56 57 57 35 36 36 18 12 12
Colombia 56 57 58 22 32 34 21 14 13
Mexico1 58 51 51 31 28 30 27 23 21
Peru 59 52 54 21 24 22 28 20 26
Central and eastern Europe
Czech Republic 61 56 54 21 18 19 40 38 35
Hungary 50 40 46 17 13 20 31 22 22
Poland 56 55 57 17 19 18 39 36 38
Other EMEs
Algeria 64 63 68 64 39 42 24 26
Israel 77 80 82 48 41 40
Russia 61 58 61 28 25 30
Saudi Arabia 74 72 76 23 21 20 51 51 56
South Africa 74 74 72 40 46 46 20 17 18
Turkey 47 43 36 39 37 29
United Arab Emirates 65 63 60 22 28 29 25 18 23 1 For Mexico, development banks are excluded.
Source: BIS questionnaire.

BIS Papers No 83 25
Banking sector assets and liabilities: main categories
As a percentage of total assets Table A2 (cont)
Other liabilities (non-core financing) Equity
Total non-core financing Of which bond financing
2004 2009 2013 2004 2009 2013 2004 2009 2013
Emerging Asia
China 5 6 7 4 6 7
Hong Kong 42 36 42 4 1 6 4 4 4
India 14 16 18 6 7 7
Indonesia 13 11 13 2 1 1 11 11 13
Korea 54 61 51 7 8 6 6 6 8
Malaysia 16 21 25 0 2 2 8 11 11
The Philippines 25 19 18 1 3 4 13 11 11
Singapore 60 51 51 2 2 4 4 5 5
Thailand 19 22 23 8 4 11 13 12
Latin America
Argentina 50 36 34 11 12 12
Brazil 21 11 11 9
Chile 36 36 35 5 9 13 8 7 8
Colombia 38 36 33 6 7 9
Mexico1 34 38 39 7 6 8 11 10
Peru 30 39 36 4 3 2 11 10 10
Central and eastern Europe
Czech Republic 29 33 34 6 6 11 11 12
Hungary 41 52 44 10 11 10 9 8 10
Poland 36 37 33 1 1 2 8 9 10
Other EMEs
Algeria 32 31 25 4 6 7
Israel 16 14 12 1 5 8 7 6 6
Russia 26 26 27 1 2 3 13 16 12
Saudi Arabia 16 14 11 10 13 13
South Africa 17 20 20 2 4 6 8 7 8
Turkey 41 45 54 13 12 11
United Arab Emirates 25 22 27 10 15 13 1 For Mexico, development banks are excluded.
Source: BIS questionnaire.

26 BIS Papers No 83
Banking sector assets: outstanding credit by recipient sector
As a percentage of total bank credit1 Table A3
Households Non-financial corporations
Public sector Non-residents
2004 2009 2013 2004 2009 2013 2004 2009 2013 2004 2009 2013
Emerging Asia
China 50 49
Hong Kong 21 16 13 33 39 37
India 17 21 27 53 44 40 0 0 0
Indonesia 24 34 39 27 30 37 46 34 21 1 1 1
Korea 32 29 31 41 46 48 17 13 11
Malaysia 44 44 45 42 37 37 8 14 12 0 2 4
The Philippines 9 12 24 34 32 29 13 7
Singapore 18 15 17 16 16 23 45 48 44
Thailand 38 44 47 46 36 32 12 16 17 2 2 3
Latin America
Argentina 16 28 34 21 32 36 61 40 30 1 0 0
Brazil2 24 32 34 33 39 40 39 24 20 1 1 1
Chile 33 36 38 41 44 46 14 12 6 2 2 2
Colombia 33 39 23 3
Mexico3 21 24 39 40 36 32 1 1
Peru 17 23 25 58 58 62 15 15 9 2 1 0
Central and eastern Europe
Czech Republic 13 26 25 20 21 19 47 33 37 17 15 14
Hungary 27 33 29 46 33 29 21 29 38
Poland 26 47 46 28 23 21 30 26 28 17 4 3
Other EMEs
Algeria 0 7 6 78 81 31 15 13 0 0 0
Israel 28 35 39 50 43 36 12 12 13 9 10 11
Russia 10 15 21 64 54 45 11 7 4 8 15 13
Saudi Arabia
South Africa 42 38 31 27 8 6 8 18
Turkey 13 21 26 30 35 50 56 42 22 2 2 1
United Arab Emirates 7 6 7 55 61 51 14 16 24 22 9 11 1 Total bank credit = loans + debt security holdings by banks. 2 For Brazil, holdings of debt securities by development banks are excluded. 3 For Mexico, development banks are excluded. Public sector loans include transfers to deposit insurance scheme (IPAB).
Source: BIS questionnaire.

BIS Papers No 83 27
Banking sector assets: holdings of debt securities and other financial instruments
As a percentage of total assets Table A4
Total holdings of debt securities and other financial
instruments1
Holdings of private debt securities
Holdings of government or central bank debt securities
2004 2009 2013 2004 2009 2013 2004 2009 2013
Emerging Asia
China 9 9 10 5
Hong Kong 20 23 23 15 14 15 5 9 8
India 41 28 27 5 2 2 33 22 21
Indonesia 33 20 10 2 2 2 31 19 8
Korea 17 14 12 8 7 6 9 6 5
Malaysia 37 32 33 5 5 5 5 8 7
The Philippines 25 20 5 4 18 14
Singapore 15 17 13 10 10 6 4 5 4
Thailand 12 13 13 6 4 3 7 8 9
Latin America
Argentina 25 22 16 2 2 2 23 20 14
Brazil2 27 18 17 3 4 6 23 14 11
Chile 17 14 10 8 6 6 9 8 4
Colombia 14 2 13
Mexico3 29 23 11 9 18 14
Peru 15 10 6 6 2 1 9 9 5
Central and eastern Europe
Czech Republic 23 21 22 9 8 6 13 12 14
Hungary 28 37 34 4 3 4 11 19 26
Poland 21 19 21 1 1 2 20 18 19
Other EMEs
Algeria 18 9 8 0 1 0 17 7 8
Israel 23 19 19 2 4 3 7 7 9
Russia 10 11 11 3 7 9 7 4 2
Saudi Arabia
South Africa 24 19 18 2 1 1 5 5 5
Turkey 80 63 33 1 1 1 39 31 16
United Arab Emirates 8 6 6 7 4 4 1 2 2 1 Excludes cash holdings and deposits with central bank. 2 For Brazil, holdings of debt securities by development banks are excluded. 3 For Mexico, development banks are excluded.
Source: BIS questionnaire.

28 BIS Papers No 83
Banking sector assets: loans by recipient sector
As a percentage of total loans Table A5
Households Non-financial corporations
Public sector Non-residents
2004 2009 2013 2004 2009 2013 2004 2009 2013 2004 2009 2013
Emerging Asia
China 65 57
Hong Kong 35 28 20 45 46 43 11 20 30
India 36 31 39 41 38 35 17 19 18 0 0 0
Indonesia 42 47 45 47 41 42 10 12 12 1 0 0
Korea 45 38 38 47 50 52 2 2 2
Malaysia 51 54 55 43 39 37 1 2 2 1 2 3
The Philippines 14 17 34 44 10 11 12 4
Singapore 27 22 21 20 21 25 36 40 44
Thailand 45 53 56 49 40 36 4 6 5 2 2 3
Latin America
Argentina 30 42 43 33 43 43 36 14 14 2 1 0
Brazil 41 45 47 54 51 48 4 3 4 1 1 1
Chile 44 45 45 54 54 53 1 1 1 1 1 1
Colombia 43 42 42 48 50 49 8 7 5 1 1 4
Mexico1 27 37 38 36 46 46 36 15 15 1 2 1
Peru 23 28 29 76 71 70 1 0 0 0 0 0
Central and eastern Europe
Czech Republic 18 33 32 26 27 23 43 25 29 13 15 16
Hungary 36 49 48 60 48 47 5 3 5
Poland 35 60 61 37 30 27 7 6 8 22 4 4
Other EMEs
Algeria 0 9 7 100 91 93 0 0 0 0 0 0
Israel 33 41 47 57 49 42 3 3 2 7 7 9
Russia 12 18 25 72 59 50 1 1 2 7 14 13
Saudi Arabia 35 25 30 54 69 65 9 4 4 3 2 1
South Africa 45 41 33 28 2 1 9 18
Turkey 28 36 34 66 60 64 3 2 1 3 2 1
United Arab Emirates 8 6 8 62 66 56 15 15 23 14 6 8 1 For Mexico, development banks are excluded. Public sector loans include transfers to deposit insurance scheme (IPAB).
Source: BIS questionnaire.
BIS Papers No 83 29
Banking sector assets: currency composition by categories
Percentage share in foreign currency Table A6
Loans Debt securities Mortgages
2004 2009 2013 2004 2009 2013 2004 2009 2013
Emerging Asia
China 6 6 6
Hong Kong 23 27 44 63 65 73 0 0 0
India
Indonesia 22 15 17 5 5 13 35 65 22
Korea 7 9 7 5 6 4
Malaysia 3 2 4 3 8
Philippines 21 15 47 44
Singapore 49 55 60
Thailand 7 3 6 0 0 0 0 0
Latin America
Argentina 11 13 4 25 17 12 2 5 2
Brazil1 13 8 8 7 6 7 2 0 0
Chile 12 12 14 17 3 6 0 0 0
Colombia 6 4 9 1 0 0 0
Mexico2 12 11 12 0 0 0
Peru 75 51 46 44 26 30 93 57 39
Central and eastern Europe
Czech Republic 17 17 19 18 13 15 6 2 0
Hungary 31 61 52 4 12 9 8 75 62
Poland 34 34 30 6 4 5 57 65 50
Other EMEs
Algeria 0 0 0 0 0 0 0 0
Israel 29 18 17 24 29 20 3
Russia 30 30 23 30 19 18 45 20 4
Saudi Arabia 13 11 6
South Africa 10 9 0 0
Turkey 40 32 33 34 19 18 0 0 0
United Arab Emirates 32 9 8 1 For Brazil, holdings of debt securities by development banks are excluded. 2 For Mexico, development banks are excluded. Bank loans include transfers to deposit insurance scheme (IPAB).
Source: BIS questionnaire.

30 BIS Papers No 83
Banking sector assets: loans by recipients – currency composition
Percentage share in foreign currency Table A7
Domestic households Non-financial corporations
Domestic government and public sector
corporations
Non-residents
2004 2009 2013 2004 2009 2013 2004 2009 2013 2004 2009 2013
Emerging Asia
China
Hong Kong 3 3 5 21 22 41 85 73 75
India
Indonesia 1 1 2 40 27 30 18 23 30 94 82 87
Korea
Malaysia 0 5 3 7 63 1 0 40 38 47
The Philippines 1 1 17 18 2 1 100 99
Singapore
Thailand 0 0 0 9 6 11 5 0 2 92 59 70
Latin America
Argentina 5 3 1 19 26 9 4 0 0 100 100 100
Brazil 1 21 14 13 1 100 100 100
Chile 0 0 0 19 20 24 16 25 73 93 97 100
Colombia 0 0 0 10 7 13 5 1 4 37 37 46
Mexico1 3 1 0 28 19 22 1 9 8 99 56 91
Peru 61 37 34 80 57 51 10 33 4 100 57 77
Central and eastern Europe
Czech Republic 0 0 0 19 19 22 7 7 6 70 67 78
Hungary 13 66 54 43 58 50 22 24 55
Poland 24 37 32 24 25 25 6 9 17 75 83 80
Other EMEs
Algeria 0 0 0 0 0 0 0 0 0
Israel 4 3 2 35 20 15 15 8 0 100 100 100
Russia 16 11 2 27 25 19 2 0 0 89 81 81
Saudi Arabia 21 32 14 100 79 71
South Africa 0 3 2 47
Turkey 3 2 0 51 47 49 100 55 57 93 80 81
United Arab Emirates 1 For Mexico, development banks are excluded. Public sector loans include transfers to deposit insurance scheme (IPAB).
Source: BIS questionnaire.

BIS Papers No 83 31
Banking sector: leverage, asset growth and loan-to-deposit ratio Table A8
Asset-to-equity ratio Change in assets1 Loan-to-deposit ratio1
2004 2009 2013 2009/04 2013/09 2004 2009 2013
Emerging Asia
China 25 18 15 152 90
Hong Kong 26 27 25 49 59 56 52 70
India 17 14 14 165 83 46 62 70
Indonesia 9 9 8 99 96 58 73 90
Korea 18 16 13 73 10 111 136 117
Malaysia 12 9 9 81 50 78 73 81
The Philippines 8 9 9 54 61 69 68
Singapore 24 22 21 40 29 74 77 108
Thailand 9 8 8 41 61 93 95 99
Latin America
Argentina 9 8 8 82 159 78 86 105
Brazil 9 9 11 127 91
Chile 13 14 12 92 55 91 100 102
Colombia 16 14 11 102 82 77 90 95
Mexico2 12 9 10 69 40 63 72 79
Peru 9 10 10 146 68 78 90 97
Central and eastern Europe
Czech Republic 9 9 9 60 24 112 124 131
Hungary 11 12 10 103 –9 100 116 99
Poland 13 12 10 96 33 104 121 115
Other EMEs
Algeria 23 16 14 90 41 61 65 73
Israel 14 16 16 30 17 81 74 83
Russia 8 6 8 314 95 103 116 116
Saudi Arabia 10 8 8 107 39 66 72 75
South Africa 12 15 13 109 29 105 103 117
Turkey 8 8 10 172 108 68 101 164
United Arab Emirates 10 7 8 247 36 99 108 100 1 In per cent. 2 For Mexico, development banks are excluded. Bank loans include transfers to deposit insurance scheme (IPAB).
Source: BIS questionnaire.

32 BIS Papers No 83
Banking sector assets: residential mortgage loans Table A9
As a percentage of total assets As a percentage of household loans
2004 2009 2013 2004 2009 2013
Emerging Asia
China
Hong Kong 9 7 6 81 77 72
India
Indonesia 3 5 6 14 18 21
Korea 12 11 13 62 65 68
Malaysia 15 13 15 50 49 51
The Philippines 3 4 51 45
Singapore 5 5 8 67 73 76
Thailand 10 12 11 34 35 29
Latin America
Argentina 4 5 4 47 26 18
Brazil 2 3 7 13 15 30
Chile 20 17 17 90 67 66
Colombia 10 8 8 54 37 35
Mexico1 4 7 8 44 51 49
Peru 6 7 9 57 53 62
Central and eastern Europe
Czech Republic 10 19 18 81 82 78
Hungary 11 18 18 64 78 80
Poland 7 21 24 33 52 60
Other EMEs
Algeria 2 3 57 89
Israel 15 17 22 73 68 69
Russia 0 3 5 3 28 27
Saudi Arabia 4 6 29 34
South Africa 23 26 22 77 63
Turkey 1 5 6 9 34 32
United Arab Emirates 2 10 8 44 229 176 1 For Mexico, development banks are excluded.
Source: BIS questionnaire.

BIS Papers No 83 33
Banking sector assets: loans – contractual terms of interest rate charged Table A10
Fixed rate1 Variable rate1 Average contractual repricing interval2
2004 2009 2013 2004 2009 2013 2004 2009 2013
Emerging Asia
China
Hong Kong
India
Indonesia 23 22 22 75 77 77
Korea 35 65
Malaysia 87 70 50 14 30 50
The Philippines 2.4 3.0
Singapore 0.9 0.6 0.5
Thailand
Latin America
Argentina 91 9
Brazil 40 50 56 60 50 44
Chile 76 77 81 24 23 19 2.8 3.2 3.5
Colombia
Mexico 49 43 51 57 0.1 0.1
Peru
Central and eastern Europe
Czech Republic 22 26 32 78 74 68 2 2 2
Hungary 3 3 3
Poland 17 9 7 83 91 93
Other EMEs
Algeria 100 100 100 0 0 0
Israel
Russia
Saudi Arabia
South Africa
Turkey 86 60 64 14 40 36 1 2
United Arab Emirates 100 100 100 1 As a share of total loans, in per cent. 2 Average maturity in years.
Source: BIS questionnaire.

34 BIS Papers No 83
Banking sector liabilities: deposits – contractual terms of interest rate paid Table A11
Fixed rate1 Variable rate1 Average contractual repricing interval2
2004 2009 2013 2004 2009 2013 2004 2009 2013
Emerging Asia
China
Hong Kong SAR 53 47 49 47 53 51
India
Indonesia 52 49 49 43 47 46 2.7 2.9 3.4
Korea 92 8 18.6 8.5 7.7
Malaysia 13 21 35 87 79 65 0.4 0.4 0.4
Philippines 0.6 1.4
Singapore 67 54 43 33 46 57 0.4 0.3 0.3
Thailand
Latin America
Argentina 95 98 100 5 2 0 0.1 0.1 0.1
Brazil 2 98
Chile 100 100 100 0 0 0 0.6 0.4 0.4
Colombia
Mexico 97 87 83 3 13 17 0.3 0.8 1.8
Peru
Central and eastern Europe
Czech Republic 49 45 33 51 55 67 0.6 0.5 0.6
Hungary 0.2 0.3 0.3
Poland 59 51 49 41 49 51
Other EMEs
Algeria 100 100 100 0 0 0
Israel
Russia
Saudi Arabia
South Africa
Turkey 100 100 100 0 0 0 0.2 0.2 0.2
United Arab Emirates 100 100 100 1 As a share of total deposits, in per cent. 2 Average maturity in years.
Source: BIS questionnaire.

BIS Papers No 83 35
Banking sector assets: residential mortgage loans – contractual terms of interest rate charged
As a percentage of residential mortgage loans Table A12
Fixed interest rate Variable interest rate
2004 2009 2013 2004 2009 2013
Emerging Asia
China
Hong Kong SAR 5 1 1 95 99 99
India
Indonesia 2 1 5 99 99 95
Korea 5 26 95 75
Malaysia 29 28 72 72
Philippines
Singapore Minority Minority Minority Majority Majority Majority
Thailand 0 0 0 100 100 100
Latin America
Argentina 71 29
Brazil 100 100 100 0 0 0
Chile 70 80 86 30 20 14
Colombia 13 88 86 87 12 14
Mexico 96 96 4 4
Peru
Central and eastern Europe
Czech Republic Majority Majority 75 Minority Minority 25
Hungary
Poland 9 2 0 91 98 100
Other EMEs
Algeria 100 100 0 0
Israel 25 75
Russia
Saudi Arabia
South Africa
Turkey 100 100 0 0
United Arab Emirates
Source: BIS questionnaire.

36 BIS Papers No 83
Banking sector assets: total assets and loans of foreign bank subsidiaries and branches
In per cent Table A13
Subsidiaries Branches
Assets as a share of total foreign-owned
banks’ assets
Loans as a share of their total assets
Assets as a share of total foreign-owned
banks’ assets
Loans as a share of their total assets
2004 2009 2013 2004 2009 2013 2004 2009 2013 2004 2009 2013
Emerging Asia
China 84 87 53 43 16 13 58 48
Hong Kong SAR 34 38 39 43 37 36 66 62 61 13 13 17
India 0 0 0 100 100 100 44 37 41
Indonesia 33 40 40 61 59 69 67 60 60 41 49 58
Korea 0 0 0 100 100 100 10 5 8
Malaysia 55 50 55
The Philippines 12 14 14 47 49 88 86 86 41 42
Singapore 5 7 9 0 9 27 95 93 91 7 9 14
Thailand 12 33 35 72 67 67 88 67 65 61 62 56
Latin America
Argentina 73 81 88 47 47 63 27 19 12 39 35 53
Brazil
Chile 86 98 99 71 66 75 14 2 1 58 10 17
Colombia 100 100 100 57 60 66 0 0 0
Mexico 100 100 100 39 38 42 0 0 0
Peru 100 100 100 56 54 60 0 0 0
Central and Eastern Europe
The Czech Republic 90 88 90 58 63 61 10 12 10 59 39 51
Hungary 100 90 88 51 56 55 0 10 12 37 33
Poland 99 92 96 45 59 61 1 8 4 20 60 33
Other EMEs
Algeria 59 81 76 95 52 51 41 19 24 19 23 36
Israel 0 29 38 77 70 100 71 62 56 24 28
Russia
Saudi Arabia 81 56
South Africa 6 82 80 14 3 1 94 18 20 19 24 20
Turkey 86 98 99 47 59 60 14 2 1 7 14 10
United Arab Emirates
Source: BIS questionnaire.

BIS Papers No 83 37
Banking sector assets and liabilities: loans and liabilities – currency composition
In per cent Table A14
Subsidiaries Branches
Local currency loans as a share of total subsidiaries loans
Funding raised from local sources in local currency as a share of total liabilities
Local currency loans as a share of total
branches loans
Funding raised from local sources in local currency as a share of total liabilities
2004 2009 2013 2004 2009 2013 2004 2009 2013 2004 2009 2013
Emerging Asia
China 64 74 41 47
Hong Kong 91 89 74 65 62 50 62 64 41 20 17 16
India 68 57 60
Indonesia 35 54 48 30 40 27 52 50 36 30 20 22
Korea 59 40 33 59 41 43
Malaysia 90 95 89 62 68 65
The Philippines 66 81 57 70 87 91 37 38
Singapore 2 9 24 8 11 10
Thailand 96 97 88 95 68 73 62 90 75 63 66 41
Latin America
Argentina 91 84 96 78 74 89 92 87 98 74 76 87
Brazil 80 93 90 80 87 83
Chile 86 92 85 65 76 73 90 38 42 59 60 50
Colombia 92 95 94 98 97 97
Mexico 89 89 87 63 56 54
Peru 26 48 54 90 83 87
Central and eastern Europe
Czech Republic 92 93 93 71 73 69 92 80 86 40 43 50
Hungary 59 31 41 31 34 32 37 42 0 3 3
Poland 69 62 64 71 68 72 70 54 75 74 43 28
Other EMEs
Algeria 100 100 100 54 63 69 100 100 100 56 59 75
Israel 100 100 97 99 36 31 34 39 51 49
Russia 59 85 87 49 54 66
Saudi Arabia 91 90 38 55
South Africa 81 83 73 59
Turkey 66 74 83 34 37 47 0 67 60 60 17 19
United Arab Emirates 36 38 31
Source: BIS questionnaire.

38 BIS Papers No 83
References
Acharya, V and P Schnabl (2010): “Do global banks spread global imbalances? Asset-backed commercial paper during the financial crisis of 2007–09”, IMF Economic Review, vol 58, no 1, pp 37–73.
Adrian, T, P Colla and H S Shin (2012): “Which financial frictions? Parsing the evidence from the financial crisis of 2007–9”, NBER Working Papers, no 18335.
Adrian, T and H S Shin (2010a): “Liquidity and leverage”, Journal of Financial Intermediation, vol 19, no 3, pp 418–37.
——— (2010b): “The changing nature of financial intermediation and the financial crisis of 2007–2009”, Annual Review of Economics, vol 2, pp 603–17.
Avdjiev, S, Z Kuti and E Takáts (2012): “The euro area crisis and cross-border bank lending to emerging markets”, BIS Quarterly Review, December, pp 37–47.
Basel Committee on Banking Supervision (2010): “Guidance for national authorities operating the countercyclical capital buffer”, December.
Basel Committee on Banking Supervision (2014): Basel III: the net stable funding ratio, October.
Bank for International Settlements (2014): 84th Annual Report, Chapter IV, pp 65–83.
Borio, C and M Drehmann (2009): “Towards an operational framework for financial stability: ‘fuzzy’ measurement and its consequences”, BIS Working Papers, no 284, June.
Borio, C and P Lowe (2002): “Assessing the risk of banking crises”, BIS Quarterly Review, December, pp 43–54.
Drehmann, M and K Tsatsaronis (2014): “The credit-to-GDP gap and countercyclical capital buffers: questions and answers”, BIS Quarterly Review, March, pp 55–73.
Drehmann, M, C Borio and K Tsatsaronis (2011): “Anchoring countercyclical capital buffers: the role of credit aggregates”, International Journal of Central Banking, vol 7, no 4, pp 189–240.
Drehmann, M and M Juselius (2014): "Evaluating early warning indicators of banking crises: Satisfying policy requirements", International Journal of Forecasting, vol 30, no 3, 759-780.
García–Herrero, A and M S Martínez Pería (2007): “The mix of international banks’ foreign claims: determinants and implications”, Journal of Banking and Finance, vol 31, no 6, pp 1613–31.
Hahm, J-H, H S Shin and K Shin (2013): “Noncore bank liabilities and financial vulnerability”, Journal of Money, Credit and Banking, vol 45, no 8, pp 3–36.
Hoggarth, G, J Hooley and Y Korniyenko (2013): “Which way do foreign branches sway? Evidence from the recent UK domestic credit cycle”, Bank of England Financial Stability Papers, no 22.
Hong Kong Monetary Authority (2015): “Monetary Authority Announces Countercyclical Capital Buffer for Hong Kong”, January, http://www.hkma.gov.hk/eng/key-information/press-releases/2015/20150127-4.shtml.

BIS Papers No 83 39
Lowe, P (2002): “Credit risk measurement and procyclicality”, BIS Working Papers, no 116.
Ma, G and A Villar (2014): “Internationalisation of emerging market currencies”, BIS Papers, no 78, August, pp 72–86.
McCauley, R, P McGuire and G von Peter (2012): “After the global financial crisis: From international to multinational banking?”, Journal of Economics and Business, vol 64, no 1, January-February, pp 7–23.
Mohanty, M and P Turner (2008): “Monetary policy transmission in emerging market economies: what is new?”, BIS Papers, no 35.
——— (2010): “Banks and financial intermediation in emerging Asia: reforms and new risks”, BIS Working Papers, no 313.