Embed Size (px)
Citation preview

Bullion Bullion
Volume 44 Number 4 Article 4
12-2020
The role of agriculture in the economic diversification of the The role of agriculture in the economic diversification of the
Nigerian economy: (1980 – 2016) Nigerian economy: (1980 – 2016)
Adamu Hassan Muhammad Bauchi State University, Gadau
Tahir Hussaini Mairiga Bauchi State University, Gadau
Iliya Ayuba Thompson Bauchi State University, Gadau
Usman Ismaeel Bello Bauchi State University, Gadau
Follow this and additional works at: https://dc.cbn.gov.ng/bullion
Part of the Agricultural and Resource Economics Commons, and the Macroeconomics Commons
Recommended Citation Recommended Citation Muhammad, Adamu Hassan; Mairiga, Tahir Hussaini; Thompson, Iliya Ayuba; and Bello, Usman Ismaeel (2020) "The role of agriculture in the economic diversification of the Nigerian economy: (1980 – 2016)," Bullion: Vol. 44 : No. 4 , Article 4. Available at: https://dc.cbn.gov.ng/bullion/vol44/iss4/4
This Article is brought to you for free and open access by CBN Institutional Repository. It has been accepted for inclusion in Bullion by an authorized editor of CBN Institutional Repository. For more information, please contact [email protected].

44
Abstract
This study empirically examines the role of agriculture in the diversification of the Nigerian economy, using time series data from 1980–2016. Estimation results using Cointegration and Vector Error Correction Technique indicate that agricultural output has a positive relationship and significant impact with non-oil exports (NOE) and that non-oil revenue has a positive relationship with non-oil exports (NOE). It was recommended that, government should endeavor to increase agricultural productivity by improving its expenditure on the sector so as to enhance the growth of the economy. Government should also increase its non-oil revenue and revive the sector through sufficient budgetary allocation and efficient utilization of allocated resources in order to guarantee poverty reduction, sustainable livelihood and enhanced food security.
Keywords: Agriculture, economic diversification, cointegration, error correction term, sustainable development.
1.0 Introduction
Nigeria is the largest oil exporting country in Africa and has a rapidly growing economy. The country follows a resource based growth strategy driven by the production and exporting of oil. With the volatility of global oil prices and often volatile growth of its economy, the country has wasted much of its opportunities to break away from underdevelopment despite its massive natural and human resource endowments. It has dwelt only on its huge crude oil resources as the major source of revenue, driving a monolithic economy for years in spite of the enormous developmental challenges it faces (Ojo,1994).
Agriculture has been an important sector in the Nigerian economy in the past decades, and is still a major sector despite the oil boom. Basically, it provides employment opportunities for the teeming population,
The Role of Agriculture in the Economic Diversification of the Nigerian Economy: (1980 – 2016)
Adamu Hassan Muhammad
Tahir Hussaini Mairiga
Iliya Ayuba Thompson
Bello, Usman Ismaeel
Department of Economics, Bauchi State University, Gadau. Nigeria.
Department of Economics, Bauchi State University, Gadau. Nigeria.
Department of Economics, Bauchi State University, Gadau. Nigeria.
Department of Economics, Bauchi State University, Gadau. Nigeria.
Volume 44, No.4 October - December, 2020

45
averagely operational costs, increase national competitiveness and grow the standard of living and confidence of the citizens for national renaissance.
Economic diversification is generally taken as the process in which a growing range of economic output is produced. It can also refer to the diversification of markets for exports or the diversification of income sources away from domestic economic activities (i.e. income from overseas investment).The last is particularly relevant to capital-surplus oil exporting countries.
In spite of Nigeria's rich agricultural resource endowment, there has been a gradua l dec l ine in agr icu l tu re 's contributions to the nation's economy (Manyong et al., 2005). In the 1960s, agriculture accounted for 65-70% of total exports; it fell to about 40% in the 1970s, and crashed to less than 2% in the late 1990s. The decline in the agricultural sector was largely due to rise in crude oil revenue in the early 1970s. Less than 50% of the Nigeria's cultivable agricultural land is under cultivation, even though, smallholder and traditional farmers who use rudimentary production techniques, with resultant low yields, cultivate most of this land. But, smallholder farmers are constrained by many problems including those of poor access to modern inputs and credit, poor infrastructure, inadequate a c c e s s t o m a r k e t s , l a n d a n d env i ronmenta l degradat ion , and inadequate research and extension services. (Lawal, 2011).
Options for diversifying an economy a b o u n d , s u c h a s a g r i c u l t u r e , entertainment, f inancial services, industr ial izat ion, information and communication technology, tourism, mining, etc. However, it is worthy to note that country-specific circumstances ought to as a matter of necessity, be considered. This is cogent, since due to structural differences, a model that fits an economy perfectly well may prove irrelevant in another.
eradicates poverty and contributes to the growth of the economy. The study of economic history provides us with ample evidence that an agricultural revolution is a fundamental pre-condition for economic development (Eicher and Witt, 1964; Oluwasami 1966).
The agricultural sector has the potential to be the industr ia l and economic springboard from which a country's development can take off. Indeed, more often than not, agricultural activities are usually concentrated in the less developed rural areas where there is a critical need for rural transformation, income redistribution, poverty alleviation and socio-economic development (Stewart, 2000). Nigeria's economic aspirations have remained that of altering the structure of production and consumption patterns, diversifying the economic base and reducing dependence on oil, with the aim of putting the economy on a path of sustenance, all inclusive and non-inflationary growth. Despite Nigeria's vast agricultural resources both human and natural, it is still faced with acute food crisis, the intensification of poverty and massive suffering of the overwhelming majority of Nigerians. This situation is however typical of all third world countries operating within the neo-colonial capitalist system (Akor, 2009).
Diversification implies “movement into new fields and stimulation and expansion of exist ing tradi t ional products.” Diversification does not discourage specialization, but requires that resources be channeled into the best alternative uses (Iniodu, 1995). It presents the most competitive and strategic option for Nigeria in the light of her developmental challenges and given her background. Diversification has a lot of benefits for Nigeria to maximally utilize her abundant resource base to rebuild the economy and enjoy the benefits of all the linkages, synergy, economies of scale, grow national technology and foreign investment profile, build human capital, exploit new opportunities, lessen
Volume 44, No.4 October - December, 2020

46
Components of agricultural production include Crop production: this involves the cultivation of different crops which may be food crops or cash crops, Livestock which involves rearing of domestic animals for consumption. Such animals include goat, ram sheep etc, Forestry concerns the preservation and maintenance of economic trees or plants and Fishing involves breeding and catching of fish from the river for domestic consumption and commercial purpose.
Broadly speaking, agricultural activities are undertaken as peasant farming and or plantation farming. Peasant farming involves cultivation of small scale acres of land. This is also called subsistence agriculture because it is undertaken to meet domestic needs and survival or to eke out living from the farm produce. The size of the of the land used by peasant farmers is determined by the size of their family, land and the number of the size of the family interested in agriculture. Rudimentary agriculture equipment such as hoes, cutlasses, and axes etc. which are crude in nature are usually used.
Plantation farming: is the system that involves the use of a large estate of land permanently planted with economic or commercial crops which include cocoa, tea, cotton, sugar, tobacco, rubber, sugarcane, palm tree, coffee and other commercial crops. In plantation farming land could be owned by government, private, individuals or corporate bodies. Mechanized equipment and modern inputs are mainly used in plantation farming.
2.1.2 Concept of Development
The term development may mean different things to different people. The concept has been misconceived by many to mean economic growth. This view is myopic because the concept does not consider if the increase in per capital income trickle-down. The concept is more than a sustained increase in per capita income. If
Given its major objective of examining the role of agriculture in diversifying the productive base of the Nigerian economy with a view to reducing dependence on the oil sector; and following Eko, et.al, (2013), this study zeroed in on agriculture as imperative. The choice of this approach is informed by developmental policy in Nigeria and the huge successes recorded by 'Asian Tigers' (some Asian countries) in applying these imperative, as well as the fact that these countries were basically at the same level of national development with Nigeria, at the time of their respective take-off and still share certain similarities with Nigeria. (Eko, et al. 2008).
In view of the gradual decline in agricultural contribution to the nation's economy which has negative effect on the Nigerian economy as a whole, this research work is aimed at examining the agricultural sector as the key to the diversification of the Nigerian economy for sustainable development as its main objective. The specific objectives are:I. To examine the impact o f agricultural output on economic d ivers i f i ca t ion in N iger ian .
ii. To determine the role of agriculture in the diversification of Nigerian
e c o n o m y f o r s u s t a i n a b l e development.
2.0 LITERATURE REVIEW2.1 Conceptual Framework2.1.1 The concept of Agriculture
Agriculture is a way of life that involves production of animals, fishes, crops, forest resources for the consumption of man and supply of agro-allied product required by various sectors. It is seen as the inherited and dominant occupation employing about 70% of Nigerians. Though, subsistence agriculture is practiced in this part of the world, it will not be an overstatement to say that it is the life-wire of the economies of developing countries.
Volume 44, No.4 October - December, 2020

47
ownership of, or access to capital resources and income earning activities which includes; reserves and assets to offset risk, ease stocks and meet contingencies as well as enhancement and maintenance of productive resources on a long term basis. Therefore, increase agricultural output (food security) is not just food affordability but the ability to produce food and earn income on a long term basis by farmers.
2.3 Empirical Literature
Ligon and Sadoulet (2008) in their analysis, using panel data, investigated the contribution and impact of the agricultural sector and non-agricultural sector on GDP. The findings agree with other researchers that the agricultural sector is significantly a stimulant for the growth and development of an economy about other sectors.
Simeon (2009) using the global trade analysis project (GTAP) approach found out the growth capacity of Nigerian agricultural sector. The study concluded that the bias against the agricultural sector should be discarded and meaningful contribution in terms of funding and the entire well-being should be made available because, the agricultural sector holds the capacity for job creation, food sufficiency and foreign exchange earnings from exportation.
Okoro (2011) investigated the contribution of agricultural sector on the Nigerian economy, using panel data for a period of 1986 - 2007. The study discovered a positive relationship between agricultural sector and economic growth. From the finding, FDI and domestic savings were able to explain 81 percent of the variation i n t h e e c o n o m i c g r o w t h . H e recommended, better improvement of the Nigerian agricultural sector, and that the government and Central Bank of Nigeria (CBN) should have accessible and low-interest rate loan plan for farmers and also
the sustained in per capita income brings about the desirable social changes, and improve the functioning, capability of individual, we will say there is economic development although, increase in income per capita must have occurred before there can be development. .
2.2 Theoretical Framework2.2.1 Agricultural based economic development theory:
Wiggins (2009) propounded the Agricultural based economic development theory which stressed that Agriculture requires technical, institutional and financial incentive change that will raise the productivity of small farmers. The theory further explains that in strive for economic development; agricultural financial scheme can play a dual role of increased purchasing power and provision of input to sustain the industrial revolution.
2.2.2. Structural change theory:
The theory which was formulated by Nobel laureate W. Arthur Lewis in the mid-1950s emphasized on the mechanism by which developing economies can transform their domestic structure from a heavy dependence on traditional subsistence agricultural to a more modern and advanced agricultural practices through sufficient financial support. An extended version of this theory adds that increased agricultural development cannot be realized unless government builds a supporting system which creates and provides the necessary incentives, opportunities and most importantly productivity in the agricultural sector.
2.2.3 Sustainable Livestock Theory:
Chamber and Conway (1991) extended the sustainable livestock theory for capabilities, including capital and other social resources as well as other farming practices required for a means of living. The theory holds that increase output can only be achieving by ensuring secured
Volume 44, No.4 October - December, 2020

48
Mussema (2015) examines the drivers of agricultural diversification in Oromia region. Hackman's two-step method was employed on survey data from a regionally representative household survey. The study discovered that asset ownership, soil quality, agricultural extension, and level of infrastructural development are the significant drivers of crop diversification in Oromia. The study recommends that public investment and policy reform geared toward risk mitigation, soil health improvement, extension information, and reduction in transactions will have the greatest pay off in promoting agricultural diversification.
Inusa et al., (2018) investigates the impact of agriculture on economic growth of Nigeria using Ordinary Least Squares (OLS) regression technique on a time series data from 2016 to the second quarter of 2017. The study discovered that exchange rate has positively and significantly impacted agricultural output. Loans and advances, and total savings were also discovered to have significantly impacted agricultural output as a componen t o f GDP. The s tudy recommends that agricultural inputs be largely sourced locally and foreign exchange be made favorable, government allocation to the sector be increased and monitored to ensure prudency in its usage.
Adesoye (2018) examined how enhancing the agricultural value chain can contribute to rapid economic diversification in Nigeria. Autoregressive distributed lag (ARDL) model was employed as the econometric method of estimation from (1981-2015). Findings showed that agricultural raw material, machinery and land have direct impact on agricultural productivity in Nigeria while agriculture productivity had positive impact on economic growth in Nigeria. The study recommended that government should make deliberate efforts to create institutions that wil l make policy programmes on agricultural development not only to enhance its growth and the
strengthen the research institutions for noble findings.
Ebere et al. (2012) investigated on the impact of government spending on agriculture and economic growth, using the Ordinary Least Squares (OLS) econometrics technique on a time series data from 1980 - 2012. The study revealed that there exist a positive and significant association between GDP and agricultural output. The study also figured out a couple of constraints among which are paucity of capital available to the rural farmers, poor infrastructure and emphasis was laid on timely and adequate agricultural extension services among all key agents in the agricultural sector.
Oyetade and Oluwatoyese (2014) examined the effect of the agricultural sector as the determinant of economic growth, using a time series econometric model from 1980 to 2011. The study revealed a positive relationship between the agricultural sector and economic growth. It was discovered that the agricul tural sector could be the determinant for exportation, if given due attention in all ramification in terms of funding and enabling the environment to key actors in the sector. The study also concluded that there are constraints to the full attainment of agricultural sector progress.
Ahungwa et al., (2014) examined trend of the impact of agriculture to GDP 1960 - 2012 using time series data. The regression results show that there exists positive and significant relationship between the agricultural sector and GDP, with GDP accounting for 66.4 percent of the variation in the economy, and also displays the dominance of the agricultural sector relative to other sectors of the economy. The study recommended that there should be a conducive and enabling environment provided by the government and decision makers so that the full gains can be derived from the sector.
Volume 44, No.4 October - December, 2020

49
NOR = Non-oil revenueFrom equation (2) above, an econometric model can be generated by incorporating intercept ( ) and disturbance variable (µ) b0
as follows:-
Finally, a time series model can be generated by adding (t) subscribe to equation 3 above with the exception of intercept of the model ( ) as:-b0
Equation four (4) is our final model for estimating the role of agriculture in the diversification of the Nigerian economy for a period of 37 years.
3.3 Method of Data Analysis
A time series data covering (1980-2016) a period of 37 years was estimated using Augmented Dickey Fuller (ADF) unit root test, Vector Autoregressive (VAR) method, Lag Length Selection Criteria, Johansen co-integration technique, Vector error correction model (VECM) and Ordinary least square estimator
3.3.1 Unit Root Test (ADF)
ADF test is used to determine the order of integration of a variable, i.e. how many times it has to be differenced or not to become stationary. The null hypothesis is that there is no unit root. The rule is that if the (ADF) test statistic is greater in absolute terms than the five percent critical value we accept the null hypothesis i.e. the variable is stationary, but if the (ADF) test statistic is less than the five percent critical value i.e. the variable is non-stationary we reject the null hypothesis and go ahead to difference once.
If the variable does not become stationary at first difference we difference twice. However it is expected that the variable becomes stationary at first difference.
overall output growth but also make it all inclusive.
3.0 Materials and Methods3.1 Data and Data Source
Secondary data was used in this study. The data was obtained from the Central Bank of Nigeria (CBN) Statistical Bulletin and World Bank's Development Indicators. The models used in this study were estimated using data on non-oil exports (NOE) and some macroeconomic indicators which includes: government expenditure on agriculture (GEA), agricultural value added (AGV) and agricultural GDP (AGDP) for the period 1980-2016.
3.2 Model Specification
The model specifies that non-oil export (NOE) is significantly influenced by non-oil revenue (NOR), government expenditure on agriculture (GEA), agricultural value added (AGV) and agricultural GDP (AGDP). The research model adopts the Cobb -Douglas production function which takes the form:-
Where Q is the output; A is the level of technology; L is labor; K stand for capital; while α and β stand for the coefficients of labor and capital respectively.
The equation can be transformed by incorporating government expenditure on agriculture (GEA) as a proxy to labor (L) and non-oil revenue(NOR) as a proxy to capital(K), while agricultural GDP and agricultural value added as factor a inputs that determine non-oil export(NOE).The functional relationship can be expressed as follows;
Where:NOE = Non-oil exportsAGDP = Agricultural GDPGEA = Government expenditure on AgricultureAGV = Agricultural value added
Volume 44, No.4 October - December, 2020

50
estimation in the Johansen co-integration and the Vector error correction models. A combination of Akaike Information Criterion (AIC), Schwarz Bayesian Criterion (SC), Likelihood Ratio (LR), Hannan- Quinn (HQ), Final prediction error (FPE) were adopted and ran for the optimal lag length.
3.3.3 Johansen Co-integration Test
Co-integration is a statistical property possessed by some time series data that is defined by the concept of stationarity and the order of integration of the series. A stationary series is one with a mean value which will not only vary with the sampling period. The series will constantly return to its mean value as fluctuations occur. In contrast, a non-stationary series will exhibit a time varying mean.
Consider a VAR model of order p:
Assume the vector: x = ƒ (AGDP, GEA, AGV, NOR)
Where:NOE= Non-oil exportsAGDP = Agricultural GDPGEA = Government expenditure on AgricultureAGV= Agricultural value addedNOR= Non-oil revenueAssume that the vector has a VAR representation of the form:
Decision Rule
Ho: = 0 (there is no co-integration among the variables)
H : ≠ 0 (there is co-integration among the 1
variables)If the trace or Max-Eigen test statistics value is greater than its critical value in absolute terms at 5% level of significance, we reject Ho and accept H . This means 1
that there is co-integration among the variables of study and otherwise there is no cointegration.
The Fundamentals of Augmented Dickey Fuller (ADF) test
Ho: δ = 0, ρ = 1 (presence of unit root, the data is non-stationary)H : δ < 0, ρ ≠ 1 (the data is stationary and 1
does not need to be differenced)
Unit Root Equation
This test is conducted by “augmenting” the preceding three equations by adding the lagged values of the dependent variable Yt. The Augmented Dickey Fuller (ADF) test here consists of estimating the following regression:
Where ε is a pure white noise error term, t t
is the time or trend variable and where ∆Y = (Y – Y ), ∆Y = (Y – Y ), etc. The t-1 t-1 t-2 t-2 t-3 t-3
number of lagged difference terms to include is often determined empirically, the idea being to include enough terms so that the error term is serially uncorrelated, so that we can obtain an unbiased estimate of δ, the coefficient of lagged Yt-1
So the rest regressors equation is as follows:
3.3.2 VAR-Lag Length Selection Criterion
Determination of the VAR lag length will be preceded by the estimation of differenced data through the unrestricted VAR. In order to avoid reporting unauthentic casual relations; it is important to determine the optimal lag length to be used for the
Volume 44, No.4 October - December, 2020

51
can then be express as:
Only if then, Y and X are co-integrated, by t t
definition µt ~ I (0). Which will now have the advantage of including both long-run and short-run information. In this model,
3.4 Diagnostic Checks
Diagnostic checks were further applied and appropriate lags levels determined to ensure a better model. These tests include
3.4.1 Serial Correlation
In order to find out where the error terms are correlated in the regression, we will use the Breusch-Godfrey Statistics. The Breusch-Godfrey serial correlation LM test is a test for autocorrelation in the errors in a regression model. It makes use of the residuals from the model being considered in a regression analysis, and a test statistic is derived from these. The null hypothesis is that there is no autocorrelation of any order up to p.
3.4.2 Heteroscedasticity Test
Breaking this assumption means that the Gauss–Markov theorem does not apply, meaning that OLS estimators are not the Best Linear Unbiased Estimators (BLUE) and their variance is not the lowest of all other unbiased estimators.
3.4.3 Normality Test
To find out if the error term is normally distributed with zero mean and constant variance. The Jarque-Bera test was used to test for the normality in the time series variable used.
Co-Integration Test Equation.
Johansen's methodology takes its starting point in the vector auto-regression (VAR) of order p given by
Where Y is an nx1 vector of variables that t
are integrated of order one commonly denoted I(1) and ε is an nx1 vector of t
innovations. This VAR can be re-written as:
Now the equation of the study will be written as
3.3.4 Vector Error Correction Model
Yule (1936) and Granger and New bold (1974) were the first to draw attention to the problem of spurious correlation and found solutions on how to address it in time series analysis. A vector error correction model (VECM) is a restricted VAR designed for use with non-stationary series that are known to be co-integrated. The VEC has a co-integration relation built into the specification so that it restricts the long-run behavior of the endogenous variables to converge to their co-integrating relationships while allowing for short-run adjustment dynamics. The co-integration term is known as the error correction term since the deviation from long-run equilibrium is corrected gradually through a series of partial short-run adjustments.
The purpose of the error correction model is to indicate the speed of adjustment from the short-run equilibrium to the long-run equilibrium state. However, the greater the coefficient of the vector error term (ECM), the higher the speed of adjustment of the model from the short-run to the long-run equilibrium.The VECM express the relationship between Y and X . The model specification t t
Volume 44, No.4 October - December, 2020

52
by subjecting them to unit root test using Augmented Dickey-Fuller test. The results of the unit root test are presented on table 4.1 below
4.0 Data Presentation and Analysis4.1 Unit Root Test
The variables were verified for stationarity
Table 4.1 Unit Root Test Variables
Order of integration
Augmented Dickey Fuller Test Critical Values 1% 5% 10% ADF
Statistic Prob.
NOE I (0) 2.6639210 1.951687 1.610579 4.309301 0.0001 ∆ GEA I (1) 2.634731 1.951000 1.610907 7.057164 0.0000 ∆AGDP I (1) 3.632900 2.948404 2.612874 4.621661 0.0007 ∆AGV I (1) 3.639407 2.951125 2.614300 6.314073 0.0000 ∆2NOR I (2) 3.653730 2.957110 2.617434 7.633912 0.0000
4.2 Vector Autoregressive Estimate.
VAR estimation enabled the determination of the optimal lag length selection while serial correlation test was conducted to determine the stability of the VAR equations where it was found that residuals were not auto correlated.
The result of the serial correlation LM test is presented on table 4.2.1 below.
1. ∆= Difference Operator2. I(d) = No. of times of integration3. Level = 10%, 5% and 1% level of significance
The results on table 4.1 above shows that the variables have been found to be stationary at level, first and second differencing at 1%, 5% and 10% level of significance respectively, i.e. one of the variable is integrated of orderI (0), three (3) of the variables are integrated of order I(1) while the remaining one (1) is integrated of order I(2).
Table 4.2.1 Serial correlation LM test
Prob from chi square with 25 df
From the table 4.2.1 above it can be observed that there is absence of serial
correlation. In other words the residual are not autocorrolated.
Result of the VAR lag length selection criteria is presented on table 4.2.2 below
Source: (Computed by author using E-views 9)
Volume 44, No.4 October - December, 2020
Lags LM-Stat Prob. 1 2
34.02548 31.19919
0.1074 0.1825

53
that trace statistics show evidence of four (4) co-integrating equations and maximum Eigen statistics show evidence of two (2) co-integration equations at 5% critical value, which implies existence of unique long-run relationship between non-oil export and other variables of study in the model.
4.3 Johansen Co-Integration Test
Tables 4.3.1 and 4.3.2 compare unrestricted co-integration rank test obtained from the trace and maximum Eigen value test with the corresponding critical values due to Mackinnon. The results on tables 4.3.1 and 4.3.2 indicate
Table 4.2.2 VAR Lag Order Selection Criteria Lag Logl LR FPE AIC SC HQ 0 -1045.991 NA 8.32e+19 60.05662 60.27881 60.13332 1 2
-908.8336 -862.5201
227.2893 63.51560*
1.39e+17 4.52e+16*
53.64763 52.42972*
54.98079 54.87384*
54.10784 53.27343*
*Indicates lag order selection by the criterion. From the table 4.2.2 above, it is indicated that LR, FPE, AIC, SC, and HQ selected lag two (2) as the optimal lag . L ag two (2) was selected for the estimation procedure as presented on the table. Results of the Johansen Co -Integration Test are presented on tables 4.3.1 and 4.3.2
Table 4.3.1
Unrestricted Co-integration Rank Test (Trace)
Hypothesized
No. of CE(s)
Eigenvalue Trace
Statistic
5% Critical
Value
Prob.**
None * 0.808984 123.6148 69.81889 0.0000
At most 1 * 0.610401 67.33119 47.85613 0.0003
At most 2 * 0.422540 35.28153 29.79707 0.0106
At most 3 * 0.379637 16.61158 15.49471 0.0338
At most 4 0.011064 0.378258 3.841466 0.5385
Source: (Computed by author using E -views 9)
Trace test indicates four(4)co-integrating eqn(s) at the 0.05 level* denotes rejection of the hypothesis at the 0.05 level**Mackinnon-Haug-Michelis (1999) p-values
hypothesis that there are two or fewer co-integrating equation can be rejected. While the trace statistic at (At most 3*=16.61158) is greater than its critical value of 15.49471, the null hypothesis that there are three or fewer co-integrating equation is also rejected. Finally the trace statistics at (At most 4 =0.378258) is less than its critical value of 3.841466, the null hypothesis that there are four or fewer co-integrating equation is therefore accepted.
From table 4.3.1 above, the trace statistic at (None * = 123.6148) exceeds its critical value of 69.81889, the null hypothesis of no co-integrating equations is rejected. Also the trace statistic at (At most 1* =67.33119) is greater than it critical value of 47.85613, the null hypothesis that there is one or fewer co-integrating equations is therefore rejected. Also the trace statistic at (At most 2* =35.28153) is greater than its critical value of 29.79707, the null
Volume 44, No.4 October - December, 2020

54
Table 4.3.2
Unrestricted Co-integration Rank Test (Maximum Eigenvalue) Hypothesized No. of CE(s)
Eigenvalue Trace Statistic
5% Critical Value
Prob.**
None * 0.808984 56.28359 33.87687 0.0000 At most 1 * 0.610401 32.04965 27.58434 0.0124 At most 2 0.422540 18.66995 21.13162 0.1068 At most 3 * 0.379637 16.23333 14.26460 0.0241 At most 4 0.011064 0.378258 3.841466 0.5385
Source: (Computed by author using E-views 9)- Trace test indicates 4 co-integrating eqn(s) at the 0.05 level * denotes rejection of the hypothesis at the 0.05 level **Mackinnon-Haug-Michelis (1999) p-values
are three or fewer co-integrating equations can also be rejected. Finally, the max Eigen statistics at (At most 4 =0.378258) is less than its critical value of 3.841466, the null hypothesis that there are four or fewer co-integrating equations can be accepted.Therefore, since we found four co-integrating vectors, the economic interpretation of the long-run on Non-oil Export (NOE) in Nigeria can only be obtained by normalizing the estimates of the unrestricted co-integrating vector on the Non-oil Export.
Results of the VECM OLS estimates of NOE and the corresponding diagnostic tests are presented on tables 4.4.1 and 4.4.1.1 respectively.
The Eigen value shown on table 4.3.2 also indicates the presence of co-integration. T h e m a x E i g e n s t a t i s t i c a t (None*=56.28358) exceeds its critical value of 33.87687, the null hypothesis of no co-integrating equations is rejected. Also the max Eigen statistic at (At most 1 *=32.04965) is greater than its critical value of 27.58434, the null hypothesis that there is one or fewer co-integrating equations is rejected. Also the max Eigen statistic at (At most 2 * = 18.66995) is less than its critical value of 21.13162, the null hypothesis that there are two or fewer co-integrating equations are accepted also the max Eigen statistic at (At most 3 * = 16.23333) is greater than its critical value of 14.26460, the null hypothesis that there
4.4 Error Correction Model (ECM) Table 4.4.1
VECM OLS Estimates of NOE
Coefficient
Std. Error
t-Statistics
Prob.0.800572
0.471360
1.698429
0.1035
-0.515845
0.435494
-1.184507
0.2489-0.739223
0.397155
-1.861298
0.07610.442821
0.160371
2.761229
0.0114-0.371632
0.139189
-2.669992
0.01403.038479
4.694494
0.647243
0.52421.148653
4.029051
0.285093
0.77820.157052
0.054252
2.894843
0.0084-0.059816
0.044050
-1.357908
0.1883-2.906915 1.718697 -1.691348 0.1049
C(1)
C(2)
C(3)
C(4)
C(5)
C(6)
C(7)
C(8)
C(9)
C(10)C(11) -0.874184 1.535580 -0.569285 0.5749C(12) 11.01282 28.81686 0.382166 0.7060
R-squared = 0.422946 Adjusted R-squared = 0.134419 Durbin Watson D* = 1.670846 F statistics = 1.465880 Prob. (F-statistic) = 0.213954.
Volume 44, No.4 October - December, 2020

55
(1) is positive and insignificant while ECT(2) is negative and also insignificant. R-squared is 0.42, indicating that 42% variation in the dependent variable is explained by the independent variables.
From table 4.4.1, above it can be seen that there are two error correction terms i.e C(1) and C(2), but the rule is that the ECT must be either positive significant or negative significant at 0.05. Therefore ECT
Diagnostic Test Table 4.4.1.1 Diagnostic test result Test statistics LM version F version
1 Serial correlation CHSQ(2)=0.0839 F(2,20)=0.02069 2 Heteroscedasticity CHS(15)=0.0567 F(15,18)=0.0121
3 Normality JB=11.73497 0.002830
Table 4.4.2 VECM OLS Estimates of NOR Coefficient Std. Error t-Statistics Prob.
C(13) 1.973988 0.525092 3.759316 0.0011 C(14) -0.757838 0.485138 -1.562110 0.1325 C(15) -1.359427 0.442428 -3.072653 0.0056 C(16) 0.351958 0.178652 1.970076 0.0615 C(17) 0.023499 0.155055 0.151550 0.8809 C(18) -1.196091 5.229639 -0.228714 0.8212 C(19) -2.315914 4.488339 -0.515985 0.6110 C(20) 0.063956 0.060437 1.058223 0.3014 C(21) 0.016217 0.049071 0.330481 0.7442 C(22) -6.865892 1.914619 -3.586036 0.0016 C(23) 2.520183 1.710628 1.473250 0.1548 C(24) 79.78675 32.10181 2.485428 0.0210
R-squared = 0.806141 Adjusted R-squared = 0.709211 Durbin Watson D* = 2.307741 F statistics = 8.316772 Prob. (F-statistic) = 0.000015.
ECT14 is negative in sign but insignificant.
R-squared is 0.80, indicating that 80% variation in the dependent variable is explained by the independent variables.
From table 4.4.2, above it can be seen that there are two error correction terms i.e C(13) and C(14), (ECT13) is positive and significant at 0.05, which means that there is a long-run relation or causality running from NOR, AGV, GEA, AGDP to NOE while
that the results are not affected by white noise distribution process, enhances efficiency and consistency.
Results of the VECM OLS estimates of NOR and the corresponding diagnostic tests are presented on table 4.4.2 and 4.4.2.1 respectively
From table 4.4.1.1 the result shows that the model is generally free from serial correlation. In other words the residuals are not auto correlated. Additionally, no evidence of heteroscedasticity was found in the errors of the estimated system while confirming that the errors are normally distributed. Therefore, it can be concluded
Volume 44, No.4 October - December, 2020

Diagnostic Test
Table 4.4.2.1
Diagnostic test result
Test statistics LM version F version 1 Serial correlation CHSQ(2)=0.0666 F(2,20)=0.0210 2 Heteroscedasticity CHS(15)=0.4991 F(15,18)=0.5976 3 Normality JB=101.8926 0.000000
56
of estimated system while it was confirmed that the errors are normally distributed. Results of the VECM OLS estimates of AGV and the corresponding diagnostics test are presented on tables 4.4.3 and 4.4.3.1 respectively.
From the above table 4.4.2.1 the result shows that the model is generally free from serial correlation. In other words, the residuals are not auto correlated. A d d i t i o n a l l y , n o e v i d e n c e o f heteroscedasticity was found in the errors
Table 4.4.3 VECM OLS Estimates of AGV
Coefficient Std. Error t-Statistics Prob. C(25) -0.068198 0.017529 -3.890556 0.0008 C(26) 0.058138 0.016195 3.589829 0.0016 C(27) 0.017823 0.014769 1.206763 0.2403 C(28) -0.007743 0.005964 -1.298228 0.2077 C(29) 0.015306 0.005176 2.957093 0.0073 C(30) -0.311638 0.174580 -1.785069 0.0880 C(31) C(32) C(33) C(34) C(35) C(36)
-0.206202 -0.005441 0.000643 0.108797 0.069290
-1.008834
0.149833 0.002018 0.001638 0.063915 0.057106 1.071649
-1.376208 -2.697057 0.392346 1.702210 1.213365
-0.941385
0.1826 0.0132 0.6986 0.1028 0.2379 0.3567
GEA, AGDP to NOE. ECT26 is positive in sign and significant at 0.05 which means that there is also a long-run relation from NOR, AGV, GEA, AGDP to NOE or causality running from AGV to NOE R-squared is 0.67, thereby indicating that 67% variation in the dependent variable is explained by the independent variables.
R-squared = 0.671712 Adjusted R-squared = 0.507569 Durbin Watson D* = 2.007610 F statistics = 4.092219 Prob. (F-statistic) = 0.002393From table 4.4.3, above it can be seen that there are two error correction term i.e. C (25) and C(26), ECT(25) is negative and significant at 0.05, which means that there is a long-run relation from NOR, AGV,
Diagnostic Test Table 4.4.3.1 Diagnostic test result Test sta tistics LM version F version 1 Serial correlation CHSQ(2)=0.3144 F(2,20)=0.4942 2 Heteroscedasticity CHS(15)=0.5308 F(15,18)=0.6360
3 Normality JB=0.323150 0.855025
Volume 44, No.4 October - December, 2020

57
that the errors are normally distributed.
Results of the VECM OLS estimates of AGDP and the corresponding diagnostic tests are presented on tables 4.4.4 and 4.4.4.1 respectively.
From the table 4.4.3.1 the result shows that the model is generally free from serial correlation. i.e. the residuals are not autocorrelated. Additionally, no evidence of heteroscedasticity was found in the errors of estimated system. While normality of the errors, it was confirmed
Table 4.4.4 VECM OLS Estimates of AGDP
Coefficient Std. Error t-Statistic Prob.
C(37) -4.208074 1.430771 -2.941122 0.0076 C(38) 2.999520 1.321902 2.269094 0.0334 C(39) 1.808751 1.205527 1.500381 0.1477 C(40) 0.321297 0.486791 0.660031 0.5161 C(41) 0.916372 0.422495 2.168957 0.0412 C(42) 5.207874 14.24972 0.365472 0.7182 C(43) -23.21551 12.22982 -1.898270 0.0709 C(44) -0.021495 0.164678 -0.130527 0.8973 C(45) 0.422076 0.133709 3.156666 0.0046 C(46) 6.737067 5.216951 1.291380 0.2100 C(47) -3.958377 4.661118 -0.849233 0.4049 C(48) 31.97180 87.47099 0.365513 0.7182
ECT26 is positive in sign and significant at 0.05, which means that there is a long-run relation from NOR, AGV, GEA, AGDP to NOE.
R-squared is0.76 which means that 76% variation in the dependent variable is explained by the independent variables.
R-squared = 0.761187 Adjusted R-squared = 0.641781 Durbin Watson D* = 2.079657 F statistics == 6.374762 Prob. (F-statistic) = 0.000118
From table 4.4.4, above it can be seen that there are two error correction term i.e. C(37) and C(38), ECT(37) is negative and significant at 0.05, which means that there is a long-run relation from NOR, AGV, GEA, AGDP to NOE or Causality running from AGDP towards NOE.
Diagnostic Test Table 4.4.4.1 Diagnostic test result Test statistics LM version F version 1 Serial correlation CHSQ(2)=0.7112 F(2,20)=0.8167 2 Heteroscedasticity CHS(15)=0.3180 F(15,18)=0.3510
3 Normality JB=0.575322 0.750016
Volume 44, No.4 October - December, 2020

58
Adesoye (2018)who concluded that agriculture productivity had positive impact on economic growth in Nigeria.
5.0 Conclusion and Recommendation
The research aimed at examining the role of agriculture in the diversification of the Nigerian economy during the period 1980-2016. In the empirical exercise, the Augmented Dickey-Fuller (ADF) unit root test for finding out the presence of unit root in all the variables, the Johansen's co-integration test to check for long-run relationship among the variables, as well as the vector error correction model and the ordinary least squares were employed .We found that there was the presence of long-run relationship between non-oil exports (NOE), government expenditure on agriculture (GEA), agricultural GDP (AGDP), and agricultural value added (AGV).
Estimation results indicate that non-oil revenue had a positive and significant relationship with non-oil exports while government expenditure on agriculture had a negative relationship but significant impact on economic diversification in Nigeria over the period of study.
The following recommendations were made from the findings thus:Government should endeavor to increase agricultural productivity by improving its expenditure on the sector so as to enhance the growth of the economy. And given that agricultural output was found to have a positive relationship with non-oil exports (NOE) and given that agricultural sector is the major contributor to gross domestic products (GDP) in Nigeria, which is capable of changing social indicators of the economy, policies aimed at adequate financing of agricultural sector by government in order to boost its output should be vigorously pursued in order to create more job opportunities.Government should intensify its efforts towards the diversification of the economy to increase its non-oil revenue given the
From the table 4.4.4.1 the result shows that the model is generally free from serial correlation. Residuals are not auto c o r r e l a t e d . N o e v i d e n c e o f heteroscedasticity was found in the errors of estimated system and residuals of the errors are normally distributed. Therefore, it can be concluded that the results are not affected by white noise distribution process, enhances efficiency and consistency.
Discussion of Findings
The discussion of findings is done in line with objectives of the study.
Objective 1: To examine the impact of agr icu l tura l output on economic diversification in Nigeria.The result showed that agricultural output had a positive relationship with and significant impact on non-oil exports (NOE) which is in line with the work of Oyetade and Oluwatoyese (2014) who concluded that the agricultural sector could be the determinant for exportation, if given due attention in all ramification in terms of funding and enabling the environment to key actors in the sector.
An increase in agricultural output brings about an increase in non-oil exports (NOE). As agricultural output increases (i.e. the total productivity of the economy, it enhances raw materials for industries and export promotion thereby leading to more employment of labor from both the agricultural sector and the industrial sector, and eventually increase in NOE.
Objective 2: To investigate the role agriculture in the diversification of Nigerian economy. It was found that non-oil revenue had a positive relationship with non-oil exports (NOE). This is in line with the result of most researches as seen in the works of A. A. Awe and S.O Ajayi (2009) where the authors found that non-oil revenue has a positive and significant impact on economic diversification in Nigeria and
Volume 44, No.4 October - December, 2020

59
budgetary allocation, consistent policies and efficient utilization of allocated resources in order to guarantee poverty reduction, sustainable livelihood and enhanced food security which will lead to comprehensive agricultural development as well as economic diversification.
findings that non-oil revenue has a positive and significant impact on the economic diversification of Nigeria.
Moreover, the anticipated benefits from agricultural sector have been minimal in Nigeria. There is therefore an urgent need to revive the sector through sufficient
Volume 44, No.4 October - December, 2020
60
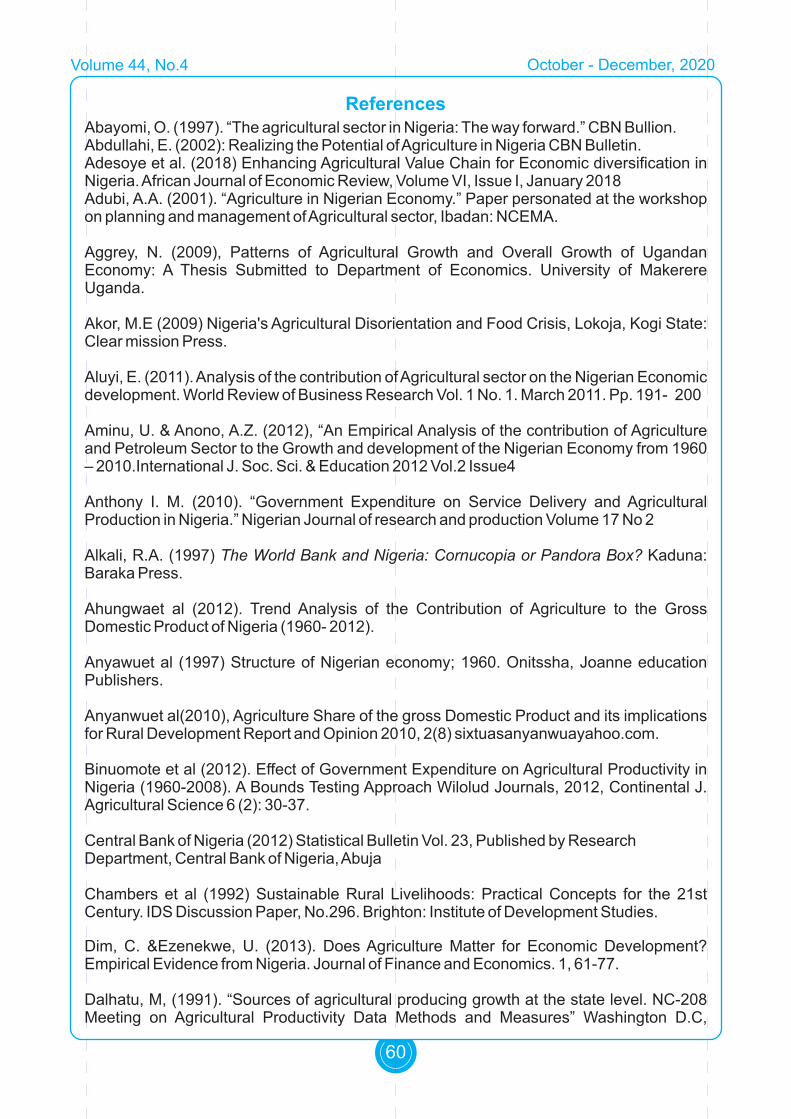
Abayomi, O. (1997). “The agricultural sector in Nigeria: The way forward.” CBN Bullion.Abdullahi, E. (2002): Realizing the Potential of Agriculture in Nigeria CBN Bulletin. Adesoye et al. (2018) Enhancing Agricultural Value Chain for Economic diversification in Nigeria. African Journal of Economic Review, Volume VI, Issue I, January 2018Adubi, A.A. (2001). “Agriculture in Nigerian Economy.” Paper personated at the workshop on planning and management of Agricultural sector, Ibadan: NCEMA.
Aggrey, N. (2009), Patterns of Agricultural Growth and Overall Growth of Ugandan Economy: A Thesis Submitted to Department of Economics. University of Makerere Uganda.
Akor, M.E (2009) Nigeria's Agricultural Disorientation and Food Crisis, Lokoja, Kogi State: Clear mission Press.
Aluyi, E. (2011). Analysis of the contribution of Agricultural sector on the Nigerian Economic development. World Review of Business Research Vol. 1 No. 1. March 2011. Pp. 191- 200
Aminu, U. & Anono, A.Z. (2012), “An Empirical Analysis of the contribution of Agriculture and Petroleum Sector to the Growth and development of the Nigerian Economy from 1960 – 2010.International J. Soc. Sci. & Education 2012 Vol.2 Issue4
Anthony I. M. (2010). “Government Expenditure on Service Delivery and Agricultural Production in Nigeria.” Nigerian Journal of research and production Volume 17 No 2
Alkali, R.A. (1997) The World Bank and Nigeria: Cornucopia or Pandora Box? Kaduna: Baraka Press.
Ahungwaet al (2012). Trend Analysis of the Contribution of Agriculture to the Gross Domestic Product of Nigeria (1960- 2012).
Anyawuet al (1997) Structure of Nigerian economy; 1960. Onitssha, Joanne education Publishers.
Anyanwuet al(2010), Agriculture Share of the gross Domestic Product and its implications for Rural Development Report and Opinion 2010, 2(8) sixtuasanyanwuayahoo.com.
Binuomote et al (2012). Effect of Government Expenditure on Agricultural Productivity in Nigeria (1960-2008). A Bounds Testing Approach Wilolud Journals, 2012, Continental J. Agricultural Science 6 (2): 30-37.
Central Bank of Nigeria (2012) Statistical Bulletin Vol. 23, Published by Research Department, Central Bank of Nigeria, Abuja
Chambers et al (1992) Sustainable Rural Livelihoods: Practical Concepts for the 21st Century. IDS Discussion Paper, No.296. Brighton: Institute of Development Studies.
Dim, C. &Ezenekwe, U. (2013). Does Agriculture Matter for Economic Development? Empirical Evidence from Nigeria. Journal of Finance and Economics. 1, 61-77.
Dalhatu, M, (1991). “Sources of agricultural producing growth at the state level. NC-208 Meeting on Agricultural Productivity Data Methods and Measures” Washington D.C,
References
Volume 44, No.4 October - December, 2020

61
University Press.
Dayo et al. (2009), “constraints to increasing Agricultural Productivity in Nigeria”: A review, International Food Policy Research Institute, Department of Agricultural Economics and farm Management, University of Agriculture Abeokuta, Nigeria.
Ekpo, A. H. & Egwaikhide, F (1994). “Exports and Economic growth in Nigeria, a Reconsideration of the evidence”. Journal of Economic Management.
Emmanuel O.E. (2008) “Macroeconomic Environment and Agricultural sector Growth in Nigerian.” (Electronic Version) World Journal of Agricultural science 4 (6): 781
Eicher,C& Witt, L. (1964). “Agriculture in economic development”. New York: McGraw Hill,London.
Francis, I. U (2013). The Impact of Federal Government Expenditure on the agricultural sector in Nigeria. Publication of Nasarawa State University, Keffi 9(1) available at www.patnsukjournal.net/currentissue
Gustav Ranis et al (2000). Economic Growth and Human Development, World Development, 28, (2), 179-219.
Hesse, Heiko. 2008. “Export Diversification and Economic Growth.” The World Bank Commission on Growth and Development Working Paper No. 21. 3
Iniodu, P. U. (1995). “Diversifying Nigeria's Non-Export Base for Sustainable Development. External Trade and Economic Development in Nigeria”. Annual Conference of the Nigerian Economic SocietyInusa et al (2018) Nigerian economic growth and recovery: role of agriculture. Int J Econ Manag Sci 2018, 7:2 Izuchukwu, O. (2011). Analysis of the Contribution of Agricultural Sector on the Nigerian Economic Development, World Review of Business Research 1(1).
ndJha R. (2003) “Maceconomic for developing countries” 2 edition Routledge London
Jhingan, M.L (2006). “The economics of development and Planning.” Vrinda Publication, Delhi
Lawal, W.A. (2011). “An analysis of government spending on agricultural sector and its contribution to Gdp in Nigeria”. International Journal of Business and Social Science.
Lawal, A.A. (1997) “The Economy and the State from the Pre-colonial Times to the Present” in Osuntokun, A. and Olukoju, A. (eds.) Nigerian Peoples and Cultures. Ibadan: Davidson.
Manyong et al, 2005. Agriculture in Nigeria: Identifying opportunities for increased commercialization and investment.IITA, Ibadan, Nigeria xxii + 190pp
Muhammad et al (2006).Analysis of Agricultural production in Nigeria. African Journal of General Agriculture, 2(1)
Musa M. (2016).“Toward the diversified Nigerian economy, the contribution of agriculture to GDP of Nigeria”. International journals of economics, commerce & management.
Volume 44, No.4 October - December, 2020

62
Mussema et al (2015) Determinants of crop diversification in Ethiopia: Evidence from Oromia regiom. Ethiop. J. Agric Sci. 25(2) 65-76 (2015).Nelson, G.C. 2002. "Introduction to the Special Issue on Spatial Analysis for Agricultural Economists", Agricultural Economics, 27(3): 197-200.
Nelson, R. 1981. Research on productivity growth and productivity differences: dead ends and new departures. Journal of Economic Literature, 19(3): 1029-1064.
Olajide et al (2012) “Agriculture resource and economic growth in Nigeria”. European scientific journal
Oluwasanmi, HA 1966, Agriculture and Nigeria's Economic Development Ibadan:Ibadan. University press.
Ogen,O. (2007). “The Agricultural Sector and Nigeria's Development: Comparative Perspective from the Brazilian Agro-Industrial Sector Economy (1960-1995)”. Nebula March 2007@Noble World Archives.
Ojo, M. O. (1994). “The Effectiveness of Agricultural Policies on Nigeria's Economic Development”. University of Calabar Press.
Oji-Okoro, I., 2011, Analysis of the contribution of agricultural sector on the Nigerian economic development, World Review of Business Research, 1(1), 191 – 200.
Oyinbo, O. (2013) “Agricultural Budgetary Allocation and Economic Growth in Nigeria: Implications for Agricultural Transformation in Nigeria.” (electronic version). The Journal of Sustainable development. Vol. 10pp. 16-27.
Olumide etal.(2013) Economic Diversification in Nigeria: Any Role for Solid Mineral Development? Mediterranean Journal of Social Sciences Published By MCSER- CEMAS-Sapienza University of Rome vol 4 No 6 pp 691-704.
Schumpeter, J. A. (1911), “Theory of Economic Development” Cited in Jhigan, M.L (2006)“ the Economic of Development and Planning” Vrinda Publication Ltd Delhi.
Sheka, G.I. (2011), “Research Methodology in Social science” Ahmadu Bello University Press, Kaduna.
Simeon et al 2009. "The Role of Agriculture in Nigeria's Economic Growth: A General Equilibrium Analysis ," 2009 Conference, August 16-22, 2009, Beijing, China 51787, International Association of Agricultural Economists.
stSiyan, P. (2002). “Introduction to Economic Analysis” Abuja Nigeria: B. Anny Publishers, 1 edition.
Eko et al (2013) Beyond Oil: Dual-Imperatives for Diversifying the Nigerian Economy, Journal of Management and Strategy Vol.4, No. 3; 2013
Ukeje, R.O. (2003). Macroeconomics: An Introduction. Port Harcourt: Davidson Publication. Woolf, S.S & Jones, E.I. (1969). Agrarian Change and Economic Development: the Historical Problem London: Methuen.
Volume 44, No.4 October - December, 2020

63
Uptal N (2001). “Trade Policy Implications of Sustainable Agriculture”, Canadian Journal of Agricultural Economics, Vol.39, No
Wiggins, S. (2009): Can the Smallholder Model Deliver Poverty Reduction and Food Security For A Rapidly Growing Population in Africa? FAO Expert Meeting on How to feed the World in 2050, 24-26 June 2009. FAO, Rome
Volume 44, No.4 October - December, 2020