Embed Size (px)
Citation preview

t
ven at highereass and allS, XRD,
eaching.
the reactivity
the same
sured
Journal of Catalysis 237 (2006) 79–93
www.elsevier.com/locate/jca
The role of Ag–O–Al species in silver–alumina catalysts forthe selective catalytic reduction of NOx with methane
X. She, M. Flytzani-Stephanopoulos∗
Department of Chemical and Biological Engineering, Tufts University, Medford, MA, USA
Received 5 July 2005; revised 21 September 2005; accepted 26 September 2005
Available online 23 November 2005
Abstract
We examined the role of silver and alumina in Ag–alumina catalysts for the selective catalytic reduction (SCR) of NOx by methane in gasstreams containing excess oxygen. A cogelation technique was used to prepare Ag–alumina materials with high dispersion of silver emetal loadings (>10 wt%) and after air calcination at 650◦C. Typically, a part of silver is present as fine nanoparticles on the alumina, whanother part is ionic, bound with the alumina as [Ag–O–Al] species. Dilute nitric acid leaching was used to remove the silver particleweakly bound silver from the surface of these materials. Complementary structural characterization was performed by HRTEM, XPand UV–vis DRS. We found that the higher the initial silver content, the higher the amount of the residual [Ag–O–Al] species after lNO–O2-TPD tests identified that silver does not modify the surface properties of the alumina. The SCR reaction-relevant NOx adsorption takesplace on alumina. Temperature-programmed surface reaction (TPSR) and kinetic measurements at steady state were used to checkof the adsorbed NOx species with methane and oxygen to form dinitrogen. Only the alumina-adsorbed nitrates react with CH4 to produce N2 inthe presence of oxygen, beginning at∼300◦C as found by TPSR. Moreover, the SCR reaction rates and apparent activation energies arefor the leached and parent Ag–alumina catalysts. Thus, metallic silver nanoparticles are spectator species in CH4-SCR of NOx . These catalyzethe direct oxidation of methane at temperatures as low as 300◦C, which explains the lower methane selectivity for the SCR reaction meaover the parent samples. 2005 Elsevier Inc. All rights reserved.
Keywords: Silver; Alumina; Leaching; Silver aluminate; Selective catalytic reduction of NO; Methane oxidation; Selectivity; Nitrogen oxides; TPD;Temperature-programmed surface reaction
tudC
a-sa
uffeingprad aen
ts,thernumd bylay
itedystsam.
bothup-
ered
a-O
1. Introduction
The selective catalytic reduction (SCR) of NO to N2 with hy-drocarbons is a promising technology for NOx removal, havingattracted much attention for nearly two decades. Initial sies were focused on zeolites loaded with metals, such asCo, Ga, In, and Pd[1–12], since zeolites are well known to stbilize metal ions, the presence of which is deemed necesfor the SCR reaction. However, zeolite-based catalysts sfrom deactivation in water vapor- and sulfur dioxide-containexhaust gas streams, which renders them less attractive fortical applications. Metal oxide catalysts have been examinealternatives due to their high hydrothermal stability. A rec
* Corresponding author.E-mail address: [email protected](M. Flytzani-Stephanopoulos).
0021-9517/$ – see front matter 2005 Elsevier Inc. All rights reserved.doi:10.1016/j.jcat.2005.09.036
-u,
ryr
c-s
t
review by Burch et al.[13] discusses these types of catalyswhich include rare earth oxides (REO) and alumina- (or ooxides) supported Pt, Ga, In and Pd catalysts. The platigroup catalysts are active at low temperatures, but are limitea narrow operating temperature window in which they dispgood selectivity. They are also more selective to undesired N2O,a potent greenhouse by-product. Ga and In catalysts are limby loss of activity in the presence of water; and Pd catalare inhibited by excess of oxygen in the exhaust gas streOther reports in the literature point to the enhancement ofactivity and stability using sulfated alumina or zirconia as sports for Pd[14–16], Mn [17] and Co[18,19] for the SCR ofNO with methane. The acidity of these supports was considkey to stabilizing the active state of the metal species.
Since Miyadera et al.[20] reported that silver/alumina catlysts exhibited relatively good activity and selectivity for N
80 X. She, M. Flytzani-Stephanopoulos / Journal of Catalysis 237 (2006) 79–93
sulataareonsrin
u
.p
idegomro
0un
forth
ntader-gataoo
bu
fo
anasanst
atpe
thaionil-
n ood
verer
ionstaver
r a
stehre
by
theres-tion
atediclesthe
i-inns
erAg–vensil-ation
c-redered in
ata-
co-
ndAf-lved
mo-e atap-n
eral
d atreerean
cata-
d.
ue
ov-es,
reduction to N2 and moderate resistance to water andfur dioxide, many studies have been performed on this clyst system[21–41]. The most commonly used reductantspropane/propene[20–27], but there have also been reportsusing higher hydrocarbons[28–33]; oxygenated hydrocarbon[34–40]; and even methane[41] as reducing agents. Highehydrocarbons were found to shift the active temperature wdow to lower values and increase the tolerance to water[28].In particular, using octane as the reductant has attracted minterest in the recent literature[30–33], with reported light-offtemperature as low as 250◦C and optimal C:N ratios of 4–6Interestingly, it has been reported that gas-phase reactionsthe catalyst bed can contribute to the reduction of nitric oxto dinitrogen[30,31]. However, a significant drawback of usinoctane as a reductant is the significant formation of CO accpanying the NO reduction reaction. With oxygenated hydcarbons, high NO conversions can be obtained at 250–40◦C;however, the main problem is the formation of a large amoof harmful nitrogen-containing byproducts[34–40]. An impor-tant finding for the Ag/alumina system is that the activityNO reduction is strongly correlated to the silver loading, andmost active Ag–alumina catalysts have been reported to co1.2–3 wt% Ag[23–26,31,33,41]. Structural analysis identifieoxidized silver in the SCR-active Ag/alumina catalysts of intmediate silver loading, whereas metallic silver particles or An
0
clusters were dominant in the high-silver content alumina clysts, which were less selective for NO reduction and were gfor the direct combustion of hydrocarbons[23–26,29,41]. Thisalso holds true for methane. In their study of methane comtion over Ag/ZrO2, Kundakovic et al.[42] found that metallicAg nanoparticles (oxygen-covered) are excellent catalyststhe direct oxidation of methane.
In addition to the change in the silver oxidation states, Wet al. [43] explained the loading effect of silver on aluminarelating to acidity changes of the alumina surface. Finally,other type of structure, silver–aluminate, has been suggeas important for NO SCR[22,23]. Nakatsuji et al.[44] ob-tained a AgAlO2/Al2O3 catalyst by hydrothermal treatmenthigh temperature that was even more active than the restive Ag/Al2O3 catalyst. However, it has also been observedsilver phases exhibit significant mobility under SCR reactconditions[26,27], thus contradicting the proposal of stable sver aluminate.
The proper synthesis method is crucial to the preparatiocatalysts with desirable silver structures. Impregnation methare limited by silver particle aggregation at relatively high silloadings[23–26], and the catalysts thus prepared have a vnarrow active temperature window. In contrast, coprecipitatgelation methods have been found to better disperse andlize oxidized silver, possibly due to better interaction of silspecies with the alumina during the gelation process[41,45,46]. A broader active temperature window was reported fo5 wt% Ag–Al2O3 prepared by a sol–gel technique[46]. In ourprevious work, Ag–alumina catalysts prepared by a singleco-gelation method[41] were active for the SCR of NO witmethane in excess O2. Silver ions and silver oxide clusters we
--
-
ch
ast
--
t
ein
-d
s-
r
g
-ed
c-t
fs
y-bi-
p
found to dominate in the SCR-active (3.2 wt% Ag) catalystsUV–vis DRS[41].
Thus, evidence points to oxidized silver on alumina asNO-SCR sites and attributes the loss of selectivity to the pence of silver nanoparticles, which catalyze the direct oxidaof the hydrocarbon, including methane[23,41,42]. However,this general picture cannot explain how methane is activon silver aluminate structures. Is the presence of silver partneeded for this? How does the presence of silver modifyalumina surface? In a recent paper[47], the importance of Ag+ions for CH4-SCR of NO was shown using Ag-ZSM-5. Actvation of CH4 was suggested to occur on isolated Ag ionsthe zeolite. It is of interest to investigate the role of silver iofor CH4-SCR of NO in Ag–alumina catalysts with no silvparticles present. To our knowledge, no such particle-freealumina catalysts have been examined in the literature. Ewith the most active, low-content silver–aluminas, somever particles were always present, depending on the preparmethod and calcination temperature.
In this work, dilute nitric acid leaching was used to sucessfully remove metallic silver particles from the as-prepaAg–alumina catalysts. The resulting Ag–O–Al surfaces wcharacterized and compared with unmodified aluminas, ankinetic experiments the role of silver particles for the CH4-SCRof NO was clarified by comparing the leached and parent clysts.
2. Experimental
2.1. Catalyst preparation
2.1.1. One-pot co-gelation methodAg–alumina catalysts were prepared by a one-pot
precipitation-gelation method as described previously[41]. Ac-cordingly, aluminum nitrate (Fluka, 99% or Alfa, 98%) asilver nitrate (Aldrich, 99.995%) were used as precursors.ter the desired amount of these two nitrate salts was dissoin deionized water, the precipitation agent, tetramethylamnium hydroxide solution (25%, Fluka), was added dropwisroom temperature until a yellow/gray-colored precipitantpeared (pH= 10–11). This was left to gel at this conditiofor 12 h, then filtered, washed with deionized water sevtimes, and dried in a vacuum oven (25 in Hg, 60◦C) for 10–12 h. The dried solid was crushed thoroughly, then heatea rate of 2◦C/min up to 650◦C and kept at this temperatufor 5 h. The elemental compositions of the final catalysts wanalyzed by inductively coupled plasma (ICP) using a LeemLabs PS-1000 instrument. The as-prepared Ag–aluminalysts are denoted as AlAg(x,CG), wherex is the wt% of Agand CG denotes the coprecipitation-gelation method applie
2.1.2. Nitric acid leachingLeaching by dilute nitric acid solutions was the techniq
chosen to remove weakly bound silver from the Ag–Al2O3samples by immersing each sample (∼1.5 g) in 100 ml of 10%HNO3 at room temperature for 8 h. After leaching, the recered solids were washed with deionized water several tim
X. She, M. Flytzani-Stephanopoulos / Journal of Catalysis 237 (2006) 79–93 81
.ilveeda
urit-per
opdisctempg i
on
mAverstto
earetheThecn
tedetearm-e o%,
cmelyfrited into atem0%vefloflo
e.pofow
m-
afteratureossi-
lyzed
on-sd by-
e re-ize ofns in
sH
nts inasure-s for
withhase
ds bytiva-the
tionO
-bed
dried in a vacuum oven (25 in Hg, 60◦C) for 10–12 h, andheated at a rate of 2◦C/min to 650◦C and kept there for 3 hAgain, ICP analysis measured the amount of residual sin the leached catalysts. The leached samples are denotAlAg(x, L), where x is the wt% of Ag, and L indicatesleached sample.
2.2. Catalyst characterization
The BET specific surface area of each sample was measby single-point N2 adsorption/desorption on a Micromerics Pulse Chemisorb 2705 instrument. HRTEM/EDS wasformed on a JEOL 2010 instrument equipped with a LaBr6 elec-tron gun source with a resolution of 0.14 nm. The microscwas operated at 200 kV, and had an attachment for X-raypersive spectroscopy (EDS) for elemental analysis of seleareas. The catalyst preparation involved suspending the sain isopropyl alcohol in an ultrasonic bath and then depositinon a carbon-coated 200-mesh Cu grid.
X-Ray powder diffraction (XRD) analysis was performeda Rigaku 300 X-ray diffractometer. Copper-Kα radiation wasused. The tube voltage was 60 kV, and the current was 300
The oxidation states of silver and the atomic ratio of silto aluminum in the surface region of the Ag–alumina catalywere examined on a Perkin–Elmer Model 5200C X-ray phoelectron spectrometer (XPS), with an Al-Kα anode used as thX-ray source. All samples tested by XPS were in as-prepform. Each powder sample was pressed onto a copper foil,placed into the vacuum chamber without any pretreatment.Al 2p signal of Al2O3 was used as internal reference to corrthe XP spectra[25]. The atomic ratio of Ag/Al was based othe core level spectra of Ag 3d and Al 2p.
UV–vis diffuse reflectance spectra (DRS) were collecwith a Hewlett Packard 8052A diode array spectrophotomequipped with a diffuse reflectance attachment (DRA) (Hrick). The UV–vis spectra of alumina and Ag–alumina saples were collected at room temperature in air in the rang190–820 nm with a resolution of 2 nm. MgO powder (99.99Aldrich) was used as a reference.
2.3. Microreactor activity tests
Catalyst activity tests were performed in a quartz tube (1i.d.) packed-bed flow microreactor. The catalyst powder (finground) was held with a layer of quartz wool on a quartzat the center of the reactor. The reactor was heated insid800-W Lindberg furnace. A K-type thermocouple embeddethe catalyst bed from the top of the reactor and connectedOmega temperature controller was used to monitor the bedperature. Four gas mixtures of grade 5 purity (3% NO/He, 1CH4/He, 20% O2/He, and pure He) were blended to achiethe desired reaction gas stream composition. Each feed gasrate was measured and controlled independently by a masscontroller. All tests were performed at atmospheric pressur
Most tests were conducted under a reactant gas comtion of 0.25% NO–2% CH4–5% O2/He and a space velocity o9000 h−1 (NTP). Typically, a 0.4 g sample load and a gas fl
ras
ed
-
e-dle
t
.
s-
dne
t
r-
f
an
n-
ww
si-
rate of 100 ml/min were used at this space velocity. The saples were tested in the temperature range of 300–700◦C in 50◦-steps. At each temperature, data were collected for 1–1.5 hsteady state was established. After the ascending-tempertests, descending-temperature tests were run to check for pble catalyst deactivation. The product gas stream was anaby a gas chromatograph (HP 5890) equipped with a 10-ft×1/8-inch diameter 5A molecular sieve column and a thermal cductivity detector (TCD). NO, CH4, O2, N2, and CO speciecould be separated by this column. Catalysts were rankecomparing the values ofxNO, xCH4, andSCH4, representing conversion of NO to N2, conversion of CH4 to COx , and selectivityof CH4 for NO reduction, respectively, defined as follows:
(1)xNO = 2[amount of N2 produced][initial amount of NO] ,
(2)xCH4 = [amount of reacted CH4][initial amount of CH4] ,
(3)SCH4 = 2[amount of N2 produced][amount of reacted CH4] .
2.4. Reaction rate measurements
Reaction rate measurements were made using the samactor system as described above. Samples with a particle s53–150 µm were used for these tests. To keep the reactiothe kinetic regime, the conversion of NO was kept at<10% andthe conversion of CH4 was<30%. Typically, the reaction ratewere measured in a feed gas mixture of 0.5% NO–0.5% C4–5% O2/He at a temperature range of 425–525◦C. Steady-staterates were recorded at each temperature. After measuremethe ascending mode, temperatures were reduced and mements repeated in the descending mode, which also checkany catalyst deactivation. A blank test was also performedempty reactor at the above conditions to check for gas-preactions.
The rate of NO reduction to N2 (−rNO) and the overall CH4oxidation rate (−rCH4) were calculated as follows:
(4)−rNO = FNOXNO/W (mol/(g s))
and
(5)−rCH4 = FCH4XCH4/W (mol/(g s)),
whereW is the catalyst loading (in g),Fi is the molar flow rate(i = NO, CH4, in mol/s), andXi is the conversion of NO toN2 or CH4 to COx (i = NO, CH4). Reaction rates, normalizeby the surface area, were calculated by dividing these ratethe initial specific surface area of each sample. Apparent action energies were calculated from Arrhenius-type plots ofreaction rate.
2.5. Temperature-programmed desorption (TPD) tests
NO–O2-TPD was performed to study the surface adsorpof NO on the various types of catalysts in the presence of2,as is the case under SCR conditions. NO and O2 were usedas adsorbates. TPD tests were performed in a quartz fixed
82 X. She, M. Flytzani-Stephanopoulos / Journal of Catalysis 237 (2006) 79–93
pecas
emth0m
ndnoiumorp
sly
caesOt fsor-ls
tus
ead
ar tion
re
-
NOasbetry
wa
witss
g
ed
m
tionto
us-tor
inare-m-asnlyterde-
ther
stad-re-ec-gly,com-
ck-igh
redalu-e
ation
rials,ed
at thet
S.arent
flow reactor (1 cm i.d.) coupled to a quadrupole mass strometer (MKS-PPT-200EM). Generally, 0.1 g of catalyst wheld between two layers of quartz wool in the reactor. The tperature was controlled by a thermocouple in contact withupper layer of quartz wool. The sample was pretreated at 50◦Cfor 1.5 h in 50 ml/min of pure helium, then cooled to rootemperature in helium. A gas stream of 1.5% NO–5% O2 at50 ml/min was then flowed over the sample until the NO aO2 signals monitored by the mass spectrometer leveled off,mally around 2.5 h. Then the catalyst was purged with helfor ∼10 h to remove any weakly adsorbed species. Destion was performed by flowing 50 ml/min He or 5% O2/He (tosimulate the lean-burn condition with excess O2) and rampingthe temperature from ambient temperature to 700◦C at a rateof 10◦C/min. The outlet gas composition was continuoumonitored by mass spectrometry; typically, NO (m/e = 30),NO2 (m/e = 46), N2O (m/e = 44), O2 (m/e = 32), and N2(m/e = 28) were monitored. The mass spectrometer wasibrated for NO, and therefore quantitative analysis of the dorbed NO was possible. Whenever desorption of NO and N2appeared together, the NO signal was corrected to accouncracking of NO2 to NO in the chamber. Accordingly, 2.7 timethe NO2 signal was subtracted from the NO signal, in accdance with the literature[48]. Only the corrected NO signaare presented here.
2.6. Temperature-programmed surface reaction (TPSR) tests
TPSR experiments were conducted in the same apparathe TPD tests by first adsorbing NO and O2 on the catalystsand then ramping up the temperature in a flowing gas strcontaining CH4 and O2. A total of 0.1 g of catalyst was usefor TPSR. The adsorption and purging procedure was similthat for the NO–O2-TPD described above. The surface reactwas carried out by flowing a mixture of 2% CH4 and 5% O2over the catalyst and increasing the temperature to 700◦C at arate of 10◦C/min. The following reactants and products wemonitored by mass spectrometry: CH4 (m/e = 15), O2 (m/e =32), NO (m/e = 30), NO2 (m/e = 46), N2/CO (m/e = 28),CO2/N2O (m/e = 44), and H2O (m/e = 18). Them/e ratioof 15 was used for CH4 to distinguish it from atomic O. Similar to the TPD data, the NO signal was corrected (2.7× NO2value was subtracted from the NO recorded) when bothand NO2 were eluted during TPSR. FTIR gas analysis wused to check for CO production under these conditions,cause CO and N2 are indistinguishable by mass spectrome(both havingm/e = 28), and also for distinguishing CO2 fromN2O. The FTIR apparatus (Mattson, Research Series 1)equipped with a 0.75 L/5.6 m cell operating at 150◦C. Gen-erally, 100 scans were used to collect the FTIR spectraa resolution of 4.0 cm−1 and a gain of 4.0. Both the maspectrometer and FTIR device were calibrated for selectedcomponents, to quantify the N2, CO, and CO2 produced.
Reaction light-off in methane combustion was examinover several catalysts by flowing a mixture of 2% CH4–5%O2–He at 50 ml/min and ramping the temperature from rootemperature 700◦C at a rate of 10◦C/min. Generally,∼0.1 g
-
-e
r-
-
l--
or
as
m
o
-
s
h
as
of catalyst was used, after pretreatment in He at 500◦C for1.5 h. Consumption of CH4 (m/e = 15) and O2 (m/e = 32)was monitored by mass spectrometry, along with producof CO (m/e = 28) (after subtracting the amount of CO duecracking of CO2 in the chamber), CO2 (m/e = 44), and H2O(m/e = 18). To check the contribution of gas-phase combtion of CH4, blank tests were performed with an empty reacat the same conditions.
3. Results and discussion
3.1. Catalyst characterization
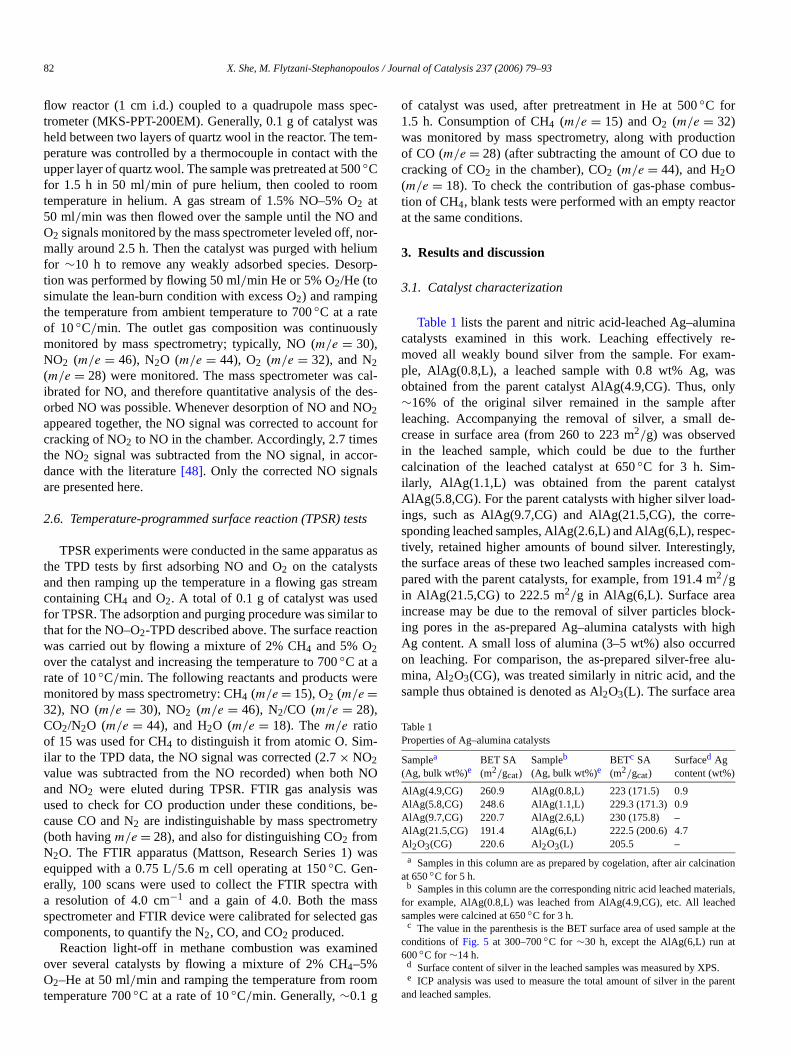
Table 1lists the parent and nitric acid-leached Ag–alumcatalysts examined in this work. Leaching effectivelymoved all weakly bound silver from the sample. For exaple, AlAg(0.8,L), a leached sample with 0.8 wt% Ag, wobtained from the parent catalyst AlAg(4.9,CG). Thus, o∼16% of the original silver remained in the sample afleaching. Accompanying the removal of silver, a smallcrease in surface area (from 260 to 223 m2/g) was observedin the leached sample, which could be due to the furcalcination of the leached catalyst at 650◦C for 3 h. Sim-ilarly, AlAg(1.1,L) was obtained from the parent catalyAlAg(5.8,CG). For the parent catalysts with higher silver loings, such as AlAg(9.7,CG) and AlAg(21.5,CG), the corsponding leached samples, AlAg(2.6,L) and AlAg(6,L), resptively, retained higher amounts of bound silver. Interestinthe surface areas of these two leached samples increasedpared with the parent catalysts, for example, from 191.4 m2/gin AlAg(21.5,CG) to 222.5 m2/g in AlAg(6,L). Surface areaincrease may be due to the removal of silver particles bloing pores in the as-prepared Ag–alumina catalysts with hAg content. A small loss of alumina (3–5 wt%) also occuron leaching. For comparison, the as-prepared silver-freemina, Al2O3(CG), was treated similarly in nitric acid, and thsample thus obtained is denoted as Al2O3(L). The surface area
Table 1Properties of Ag–alumina catalysts
Samplea
(Ag, bulk wt%)eBET SA(m2/gcat)
Sampleb
(Ag, bulk wt%)eBETc SA(m2/gcat)
Surfaced Agcontent (wt%)
AlAg(4.9,CG) 260.9 AlAg(0.8,L) 223 (171.5) 0.9AlAg(5.8,CG) 248.6 AlAg(1.1,L) 229.3 (171.3) 0.9AlAg(9.7,CG) 220.7 AlAg(2.6,L) 230 (175.8) –AlAg(21.5,CG) 191.4 AlAg(6,L) 222.5 (200.6) 4.7Al2O3(CG) 220.6 Al2O3(L) 205.5 –
a Samples in this column are as prepared by cogelation, after air calcinat 650◦C for 5 h.
b Samples in this column are the corresponding nitric acid leached matefor example, AlAg(0.8,L) was leached from AlAg(4.9,CG), etc. All leachsamples were calcined at 650◦C for 3 h.
c The value in the parenthesis is the BET surface area of used sampleconditions ofFig. 5 at 300–700◦C for ∼30 h, except the AlAg(6,L) run a600◦C for ∼14 h.
d Surface content of silver in the leached samples was measured by XPe ICP analysis was used to measure the total amount of silver in the p
and leached samples.

X. She, M. Flytzani-Stephanopoulos / Journal of Catalysis 237 (2006) 79–93 83
er
amos
he).t sth
g–t-ricpl
esrcheredD
r at
lyst,
rti-atureer-
-saerees),ver,
o
inaat
lverugh
theateature
hedhedrAg–
n in
par-
-y beilver
(a)
(b)
Fig. 1. HRTEM of (a) AlAg(4.9,CG); (b) nitric acid–leached AlAg(0.8,L) aftcalcination in air at 650◦C.
of Al2O3(L) was 205.5 m2/g, compared with 220.6 m2/g forAl2O3(CG).
The surface composition of the leached catalysts was exined by XPS, and results are compared with the bulk comption obtained by ICP, as shown inTable 1. Clearly, the surfaceconcentration of Ag is very close to that in the bulk for tleached samples, AlAg(0.8,L), AlAg(1.1,L), and AlAg(6,LBulk analysis was done by ICP. These findings suggest thaver is well dispersed in Ag–alumina catalysts, prepared bycoprecipitation-gelation method used in this work.
A HRTEM picture of a pair of parent and leached Aalumina catalysts is shown inFig. 1. Fig. 1a shows the parensample AlAg(4.9,CG). Silver particles<10 nm in size are observed in good contact with the alumina matrix. After nitacid leaching, no particles remained on the leached samAlAg(0.8,L), as shown inFig. 1b.
XRD was performed to identify the crystalline phaspresent in the Ag–alumina catalysts.Fig. 2shows the results fothe alumina (both as-prepared and nitric acid-treated), leaAlAg(0.8,L), and AlAg(7.7,L) samples, and one as-prepahigh-Ag-content sample AlAg(11,CG). For comparison, XR
-i-
il-e
e,
d
Fig. 2. XRD of alumina and Ag–alumina catalysts after calcination in ai650◦C.
was also used to analyze the other high-silver-content cataAlAg(21.5,CG-850), which was calcined at 850◦C for 5 h in anattempt to form silver aluminate[44]. As can be seen inFig. 2,strong diffraction lines due to metallic silver (2θ ≈ 38.1◦,44.3◦, 64.5◦, 77.6◦) and silver aluminate (2θ ≈ 33.7◦) wereobserved in AlAg(21.5,CG-850C) (line 6), and the silver pacle size was calculated as 30.5 nm. Thus, the high-tempercalcination (850◦C) and high silver loading causes agglomation of silver particles, in comparison with the<10 nm silvernanoparticles shown inFig. 1a for AlAg(4.9,CG). The crystallite size of alumina was calculated as∼5 nm based on peakat 2θ ≈ 45.8◦ and 66.8◦ [49]. For the two leached Ag–aluminsamples, and even for AlAg(11,CG), the diffraction peaks wdue only to the alumina phase (indicated by the dotted linand no metallic Ag was identified in these samples. Howea weak new peak appeared at 2θ ≈ 33◦ for AlAg(7.7,L) whichis assigned to silver aluminate[44,49]. Some new features alsappear around the peaks of alumina at 20◦ and 60◦, where linesdue to silver aluminate also exist. Because the carrier alumis of small crystallite size, it exhibits broad diffraction peaksthese positions, making it difficult to discern peaks due to sialuminate. In the case of the AlAg(0.8,L) sample, even thono silver aluminate lines were detected, this may be due tosmall amount of silver and high dispersion. Silver aluminhas been proposed as an active species for SCR in the liter[22,23,44].
To further examine the oxidation states of silver in leacAg–alumina catalysts, XPS was carried out with three leacsamples, AlAg(0.8,L), AlAg(1.1,L), and AlAg(2.6,L). Focomparison, XPS was also performed on an as-preparedalumina sample, AlAg(4.9,CG). The XP spectra are showFig. 3, which also lists the binding energies of Ag 3d5/2 onthese samples. The binding energy of Ag 3d5/2 (at∼368.0 eV)does not shift much among the leached catalysts and theent catalyst. The binding energies of Ag0 and Ag2O are 368.3and 367.5 eV, respectively[25,50]. It is hard to assign the BEvalues shown inFig. 3 to either metallic silver or oxidized silver, because a more complex electronic environment maconsidered a result of the co-gelation preparation (i.e., s
84 X. She, M. Flytzani-Stephanopoulos / Journal of Catalysis 237 (2006) 79–93
g e
T i
seirtypto
nic
m
f si,L)lys
wbotis
sotero
s irs
sil-an
eh
glytsex-the
ur-R
tra of
to
e anxy-
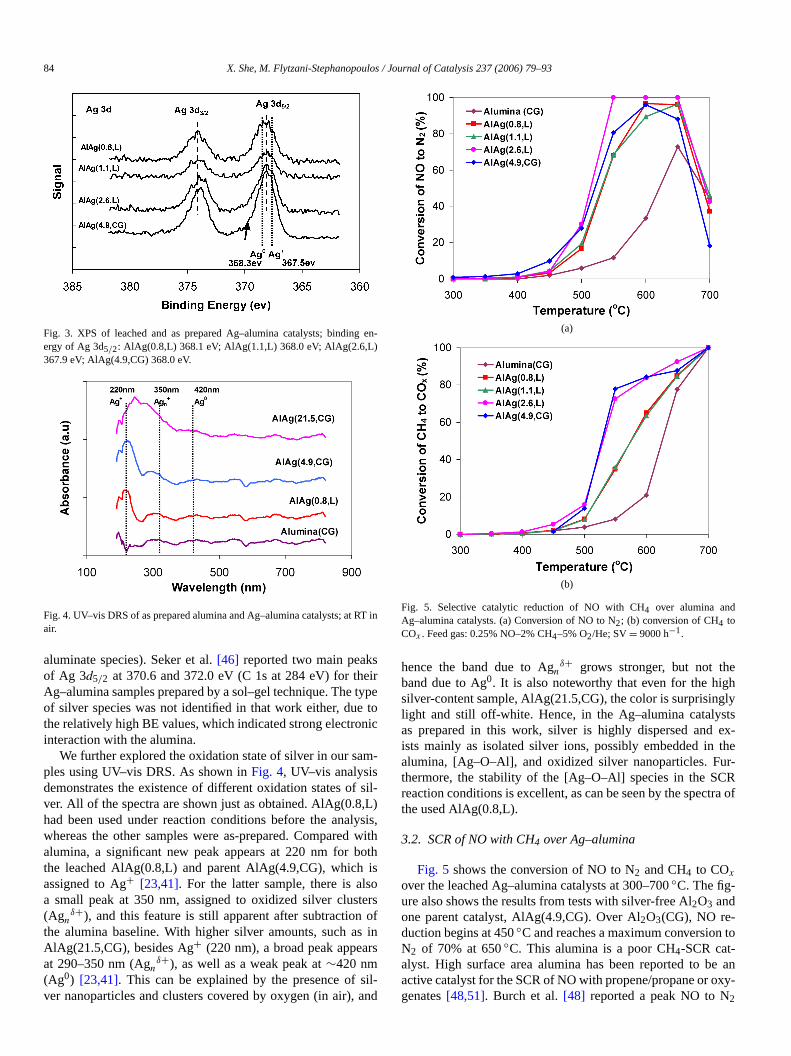
Fig. 3. XPS of leached and as prepared Ag–alumina catalysts; bindinergy of Ag 3d5/2: AlAg(0.8,L) 368.1 eV; AlAg(1.1,L) 368.0 eV; AlAg(2.6,L)367.9 eV; AlAg(4.9,CG) 368.0 eV.
Fig. 4. UV–vis DRS of as prepared alumina and Ag–alumina catalysts; at Rair.
aluminate species). Seker et al.[46] reported two main peakof Ag 3d5/2 at 370.6 and 372.0 eV (C 1s at 284 eV) for thAg–alumina samples prepared by a sol–gel technique. Theof silver species was not identified in that work either, duethe relatively high BE values, which indicated strong electrointeraction with the alumina.
We further explored the oxidation state of silver in our saples using UV–vis DRS. As shown inFig. 4, UV–vis analysisdemonstrates the existence of different oxidation states over. All of the spectra are shown just as obtained. AlAg(0.8had been used under reaction conditions before the anawhereas the other samples were as-prepared. Comparedalumina, a significant new peak appears at 220 nm forthe leached AlAg(0.8,L) and parent AlAg(4.9,CG), whichassigned to Ag+ [23,41]. For the latter sample, there is ala small peak at 350 nm, assigned to oxidized silver clus(Agn
δ+), and this feature is still apparent after subtractionthe alumina baseline. With higher silver amounts, such aAlAg(21.5,CG), besides Ag+ (220 nm), a broad peak appeaat 290–350 nm (Agn
δ+), as well as a weak peak at∼420 nm(Ag0) [23,41]. This can be explained by the presence ofver nanoparticles and clusters covered by oxygen (in air),
n-
n
e
-
l-
is,ithh
sfn
d
(a)
(b)
Fig. 5. Selective catalytic reduction of NO with CH4 over alumina andAg–alumina catalysts. (a) Conversion of NO to N2; (b) conversion of CH4 toCOx . Feed gas: 0.25% NO–2% CH4–5% O2/He; SV= 9000 h−1.
hence the band due to Agnδ+ grows stronger, but not th
band due to Ag0. It is also noteworthy that even for the higsilver-content sample, AlAg(21.5,CG), the color is surprisinlight and still off-white. Hence, in the Ag–alumina catalysas prepared in this work, silver is highly dispersed andists mainly as isolated silver ions, possibly embedded inalumina, [Ag–O–Al], and oxidized silver nanoparticles. Fthermore, the stability of the [Ag–O–Al] species in the SCreaction conditions is excellent, as can be seen by the specthe used AlAg(0.8,L).
3.2. SCR of NO with CH4 over Ag–alumina
Fig. 5 shows the conversion of NO to N2 and CH4 to COx
over the leached Ag–alumina catalysts at 300–700◦C. The fig-ure also shows the results from tests with silver-free Al2O3 andone parent catalyst, AlAg(4.9,CG). Over Al2O3(CG), NO re-duction begins at 450◦C and reaches a maximum conversionN2 of 70% at 650◦C. This alumina is a poor CH4-SCR cat-alyst. High surface area alumina has been reported to bactive catalyst for the SCR of NO with propene/propane or ogenates[48,51]. Burch et al.[48] reported a peak NO to N2

X. She, M. Flytzani-Stephanopoulos / Journal of Catalysis 237 (2006) 79–93 85
ngngow
ed
ini
m-
w-n owit
dinone
ichrti-
ar
rtanughatend
s batu
artior th
nf
ign
asu
,L)
tion
i-
sion
-ltsas-
her-
reas
inedd the
are
inaver
od-s are
na,),
ax-
en-
conversion of∼80% at 550◦C for C3H8-SCR of NO overγ -alumina at C:N ratio of 6 and space velocity of 18,000 h−1.Meunier et al.[51] found that the maximum NO conversio(60%) was reached at 600◦C in propene SCR, and that addina small amount of silver (1.2 wt%) caused no significant chain activity, even though it shifted the active temperature windto slightly lower values. Kung et al.[23] also pointed out theimportant role of alumina sites for SCR of NO in a proposbifunctional mechanism, with metal ions as sites for NO2 oradsorbed nitrate formation and alumina providing sites for dtrogen formation.
With the addition of 0.8 wt% Ag in alumina, as in the saple AlAg(0.8,L), the conversion maximum of NO to N2 shiftsto 600◦C and reaches 95%. AlAg(0.8,L) and AlAg(1.1,L) shovery similar conversions of NO and CH4. When the silver content increases, such as in AlAg(2.6,L), a higher conversioNO and a wider active temperature window are observed,NO to N2 conversion reaching∼100% at 550–650◦C. The con-version of NO to N2 is similar over the pair of leached anparent catalysts, AlAg(0.8,L) and AlAg(4.9,CG), as shownFig. 5a. However, the parent catalyst shows much higher cversion of CH4 (Fig. 5b), i.e. 78% compared to 36% for thleached material at 550◦C. The lower conversion of CH4 is at-tributed to the absence of silver particles on AlAg(0.8,L), whis consistent with literature reports of metallic silver nanopacles catalyzing the direct CH4 combustion reaction[22–26,29,41,42]. Hence, leaching enhances the catalyst selectivity towCH4 oxidation by NOx .
3.3. Surface adsorption of NO/O2 and reactivity with CH4
3.3.1. NO–O2-TPDThe surface interaction of NO and O2 with alumina or
Ag/alumina catalysts has been reported to play an imporole in the mechanism of SCR of NO by hydrocarbons throthe formation of adsorbed species, such as nitrites or nitr[27,29,48,51–55]. Formation of surface nitrates has been fouby FTIR spectra over both alumina[51–53] and Ag/alumina[27,29,51,54,55]catalysts after adsorption of NO and O2. TPDis also useful because it probes different surface structuremonitoring the species desorbed over the range of temperof interest to catalysis[48,54]. Therefore, in this work NO–O2-TPD was performed over alumina and leached and as-prepAg–alumina samples to identify the types of surface adsorpsites of different structures and elucidate their relevance focatalysis of the NO reduction by CH4.
3.3.1.1. NO–O2-TPD in He NO–O2-TPD results are showin Figs. 6 and 7for desorption in flowing He gas. Analysis othe desorbed species was done by mass spectrometry. Sdue to O2 (m/e = 32), NO (m/e = 30), and NO2 (m/e = 46)were detected. No N2O (m/e = 44) or N2 (m/e = 28) was ob-served, in agreement with previous reports for NO–O2-TPDover alumina[48] and Ag–alumina[54]. For most of the datareported here, replicate tests were performed. The TPD-mspectrometry technique is very stable, and reproducible rewere obtained.
e
-
fh
-
d
t
s
yre
edne
als
sslts
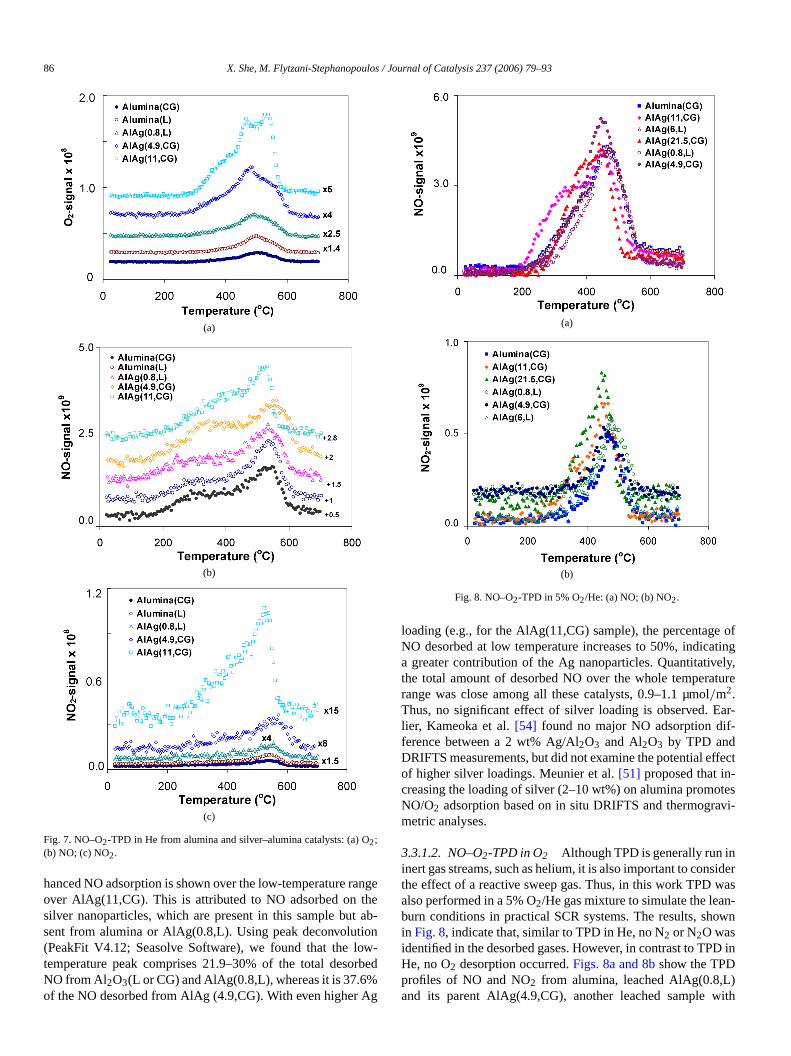
Fig. 6. NO–O2-TPD in He from AlAg(0.8,L).
Fig. 6shows the TPD profiles from the leached AlAg(0.8sample. Desorption of O2 starts at around 300◦C, peaks at497◦C, and levels off at∼620◦C. No production of N2O orN2 is found over the whole temperature range. Two desorppeaks of NO are observed, with the first beginning at 170◦Cand peaking at 300◦C, followed by a second peak with a maxmum at 539◦C. A NO2 peak is also observed at 539◦C. There-fore, the NO peak at 539◦C is accompanied by NO2 and O2desorption. Kameoka et al.[54] reported similar TPD featureover a 2 wt% Ag/alumina. In their case, two NO desorptpeaks were observed, one at low temperature (250◦C) and theother at high temperature (480◦C). The latter peak was accompanied by O2 and NO2 desorption. Based on their FTIR resu(NO–O2 adsorption and then heating in He), these authorssigned three types of surface nitrates on Ag/alumina with tmal stability in the order monodentate> bidentate> bridging-nitrates (NO3
−). Hence, the desorption peaks at 539◦C inFig. 6may be assigned to decomposition of nitrate species, whethe NO desorbed at low temperature (<300◦C) must be dueto weakly bound NO, because neither O2 nor NO2 is observedaccompanying this peak.
To elucidate the role of silver sites and alumina sitesadsorption of NO/O2, similar TPD tests were also conductover bare alumina (both as-prepared and acid-treated) ansilver-containing alumina samples. The desorption patternsshown inFigs. 7a–7cfor O2, NO, and NO2, respectively. Ascan be seen from these figures, the TPD profiles from alumand AlAg(4.9,CG) are in good correspondence with those oAlAg(0.8,L), as described above forFig. 6. Briefly, a similarmain desorption peak for both NO and NO2 is seen at 539◦C inall three samples. The results indicate that silver does not mify the alumina surface, and that the suface nitrate speciebound on the alumina sites rather than on silver.
To probe the effect of adding more silver onto the alumia sample with higher silver content (11 wt%), AlAg(11,CGwas also examined; the results are shown inFig. 7. For thissample, NO begins to desorb from 170◦C and continues upto 400◦C, while the second peak is still present, with a mimum slightly shifted to 529◦C (vs. 539◦C). Thus, the TPDof NO is similar to that of the other samples, except that an
86 X. She, M. Flytzani-Stephanopoulos / Journal of Catalysis 237 (2006) 79–93
angtheab
onowrb
g
e ofting
ely,ture
lar--
ffect-tesvi-
siderwasn-own
D in
)ith
(a)
(b)
(c)
Fig. 7. NO–O2-TPD in He from alumina and silver–alumina catalysts: (a) O2;(b) NO; (c) NO2.
hanced NO adsorption is shown over the low-temperature rover AlAg(11,CG). This is attributed to NO adsorbed onsilver nanoparticles, which are present in this sample butsent from alumina or AlAg(0.8,L). Using peak deconvoluti(PeakFit V4.12; Seasolve Software), we found that the ltemperature peak comprises 21.9–30% of the total desoNO from Al2O3(L or CG) and AlAg(0.8,L), whereas it is 37.6%of the NO desorbed from AlAg (4.9,CG). With even higher A
e
-
-ed
(a)
(b)
Fig. 8. NO–O2-TPD in 5% O2/He: (a) NO; (b) NO2.
loading (e.g., for the AlAg(11,CG) sample), the percentagNO desorbed at low temperature increases to 50%, indicaa greater contribution of the Ag nanoparticles. Quantitativthe total amount of desorbed NO over the whole temperarange was close among all these catalysts, 0.9–1.1 µmo/m2.Thus, no significant effect of silver loading is observed. Elier, Kameoka et al.[54] found no major NO adsorption difference between a 2 wt% Ag/Al2O3 and Al2O3 by TPD andDRIFTS measurements, but did not examine the potential eof higher silver loadings. Meunier et al.[51] proposed that increasing the loading of silver (2–10 wt%) on alumina promoNO/O2 adsorption based on in situ DRIFTS and thermogrametric analyses.
3.3.1.2. NO–O2-TPD in O2 Although TPD is generally run ininert gas streams, such as helium, it is also important to conthe effect of a reactive sweep gas. Thus, in this work TPDalso performed in a 5% O2/He gas mixture to simulate the leaburn conditions in practical SCR systems. The results, shin Fig. 8, indicate that, similar to TPD in He, no N2 or N2O wasidentified in the desorbed gases. However, in contrast to TPHe, no O2 desorption occurred.Figs. 8a and 8bshow the TPDprofiles of NO and NO2 from alumina, leached AlAg(0.8,Land its parent AlAg(4.9,CG), another leached sample w
X. She, M. Flytzani-Stephanopoulos / Journal of Catalysis 237 (2006) 79–93 87
l-).
datof
ythe
,L)
atunaind-
gatuPDith-an30G
ata
-
ed-
on-eam-R
ail-
ork
o co-ng
verden
raPSR-
ome
f-to
G)
f sil-n of
s
es,f 44
O
ere
red
ach-tt-cedthe
CO
,
n-e
n in
vee
-
Table 2N2, CO2, and NO eluted during TPSRa and TPDa,b
Sample Amount ofN2 produced(µmol/m2
cat)
Amount ofCO2 produced(µmol/m2
cat)
NO (TPSR)(µmol/m2
cat)NO (TPD)(µmol/m2
cat)
Al2O3 – 53.6 1.0 1.2AlAg(0.8,L) – 152.5 0.8 1.3AlAg(4.9,CG) – 819 1.2 1.5AlAg(21.5,CG) 0.34 2982.6 1.0 1.7
a In the temperature range 25–700◦C; measured by mass spectrometry.b In O2/He gas mixture.
6 wt% Ag, AlAg(6,L), and two Ag–alumina samples with reatively high Ag loadings, AlAg(11,CG) and AlAg(21.5,CGFor alumina, NO desorption starts at 200◦C, peaks at 460◦C,and then levels off at 600◦C. A similar trend was observefor AlAg(0.8,L), with the desorption peak also positioned460◦C. For the parent catalyst AlAg(4.9,CG), desorptionNO also begins at 200◦C and levels off at 600◦C, even thoughthe peak is slightly shifted to 450◦C and the peak intensitis slightly increased. The amount of NO desorbed fromabove three samples was 1.2–1.5 µmol/m2, as shown inTable 2.A similar desorption pattern is also observed for AlAg(6with a major peak at 460◦C and desorbed NO of 1.6 µmol/m2.Comparing these catalysts, we assign the desorption fewith a peak at∼460◦C to NOx species adsorbed on alumisites. As before, these TPD data also show that the alumbound ionic silver species [Ag–O–Al] do not modify the asorption properties of alumina surface.
As shown inFig. 8, the high-silver-content samples, AlA(11,CG) and AlAg(21.5,CG), have exaggerated low-temperdesorption. Peak deconvolution performed for all of the Tprofiles of Fig. 8a shows a small NO desorption peak wmaximum at 320–350◦C accounting for 11–18% of the total desorbed NO from the alumina, leached Ag–alumina,AlAg(4.9,CG) samples. However, this value increases to45% of the total NO desorbed for the samples AlAg(11,Cand AlAg(21.5,CG), which corresponds very well with the dof Fig. 7. Relatively high total NO desorption (1.7 µmol/m2)is reported inTable 2for AlAg(21.5,CG), attributed to the additional low-temperature adsorption of NOx on the oxidizedsurface of silver nanoparticles.
3.3.2. TPSR testsIn previous work, the reactivity of surface species form
after adsorption of NO/O2 with various hydrocarbons or oxygenates, such as propene/propane[27,48,51,53–56], higher hy-drocarbons (C4–C8) [29,56], and ethanol/methanol[48,54], hasbeen examined over alumina[48,51,53]and silver/alumina[27,29,51,54–56]catalysts by FTIR or TPR measurements. Csistently, different research groups have reported high rtivity of adsorbed NOx species to these reductants, confiring these species importance as intermediates for the SCNO. However, to our knowledge, no such information is avable for the reactivity of adsorbed NOx species with CH4 overalumina or Ag/alumina catalysts. Consequently, in this wTPSR tests were performed by flowing CH4/O2 over the alu-
re
a-
re
d–)
c-
of
mina and silver–alumina samples after they were exposed tadsorption of NO/O2. The TPSR results are compared amocatalysts with different structures (i.e., blank alumina, silparticle—free leached Ag–alumina, and silver particle—laAg–alumina with high silver content).
Figs. 9a–9epresents the TPSR results over Al2O3(CG),AlAg(0.8,L), AlAg(4.9,CG), and AlAg(21.5,CG). The spectwere repeated twice for each sample, and reproducible Tresults were obtained. InFig. 9a, the top part shows the profiles of O2 signal for the above four samples, and the bottpart shows the CH4 profiles. As indicated by the dotted lina, over AlAg(21.5,CG), consumption of O2 and CH4 first ap-pears at 430◦C, followed by a much faster consumption ater 460◦C. For AlAg(4.9,CG), these two temperatures shifthigher values, as shown by the dotted line b at 510 and 578◦C,respectively. Similar profiles are observed over AlAg(4.9,Cand AlAg(0.8,L), although the consumption of O2 and CH4 isweaker for the latter, which could be due to the absence over particles. Alumina exhibits an even weaker consumptiothe two reactants.
Accompanying the consumption of O2 and CH4, m/e sig-nals of 28 for N2/CO and 44 for CO2 were produced, as well adesorption of NO/NO2, as shown inFigs. 9b and 9c. It shouldbe pointed out that no N2O was produced over these samplas verified by FTIR gas analysis. Hence the mass signal owas assigned to CO2 only. Them/e = 28 signal is more diffi-cult, however, because it can be due to both N2 and CO. Twosources of CO are considered: (1) CO from the cracking of C2in the mass spectrometer (at 12% of total CO2 [57]) and (2) COproduced during TPSR. For the first effect, the raw data wcorrected by subtracting this part CO from signalm/e = 28in Fig. 9b. To check for the second effect, CO was monitoby on-line FTIR; the results are presented inFig. 9d. As thisfigure shows, CO is produced from Al2O3(CG) and leachedAlAg(0.8,L) in the temperature range 345–700◦C, with theamount of CO increasing with increasing temperature, reing 333 ppm for Al2O3(CG) and 300 ppm for AlAg(0.8,L) a700◦C. Thus, partial oxidation of CH4 occurs on these two caalysts. Over AlAg(4.9,CG), however, much less CO is producompared with the former two catalysts. This means thatpresence of silver particles is beneficial to burning off theproduced. In view ofFig. 9d, in Fig. 9b, the m/e = 28 sig-nal is denoted as N2/CO for Al2O3(CG), leached AlAg(0.8,L)and AlAg(4.9,CG). For AlAg(21.5,CG), them/e = 28 signalis assigned to N2 only. Also note that no reduced nitrogecontaining products, such as NH3 and HCN, accompany thCO production during TPSR, as checked by IR.
Similar to the NO–O2-TPD results (Fig. 8), NO starts to de-sorb at∼200◦C during TPSR (Fig. 9b). Along with the NOdesorption, NO2 desorption was also observed; the NO2 lev-els produced were measured separately by FTIR, as showFig. 9e. The peak positions of desorbed NO2 by both massspectrometry and FTIR are consistent betweenFigs. 9b and9e. Although the NO2 level decreases with temperature abo460◦C, Fig. 9e shows that NO2 (500 ppm) is present in thgas even at 700◦C. Over AlAg(21.5,CG), them/e = 28 signalstarts to increase from 300 to 400◦C as a small peak, then in

88 X. She, M. Flytzani-Stephanopoulos / Journal of Catalysis 237 (2006) 79–93
(c)
(a) (b)
(c) (d)
(e)
Fig. 9. TPSR in CH4/O2, over alumina and Ag–alumina catalysts pre-exposed to NO–O2: (a) O2 and CH4; (b) NO, NO2, N2/CO and CO(IR); (c) CO2; (d) CO and(e) NO2 profile measured by FTIR. In (b), the NO2 signal was scaled up 2× for alumina, AlAg(0.8,L) and AlAg(4.9,CG) due to the weak signal. The inset inhighlights the CO signal at low temperatures.
2ly;
pat-t
he
creases sharply and peaks at 430◦C and then decreases slowit is still measurable at 700◦C. For them/e = 28 signal overAlAg(4.9,CG), there is also a broad peak at 300–450◦C, anda peak at 510◦C. The profiles form/e = 28 are similar forAl2O3(CG) and AlAg(0.8,L). For AlAg(0.8,L), them/e = 28
signal begins to increase at 320◦C, peaks at 523◦C and thenreaches a valley at 570◦C, however, above 570◦C, the sig-nal keeps going up with temperature. A similar two-stagetern is also found for the Al2O3(CG) sample, with the peak a470◦C and the valley at 540◦C. For the latter three samples, t

X. She, M. Flytzani-Stephanopoulos / Journal of Catalysis 237 (2006) 79–93 89
y
y-,
builitys,
-
rver,L)rti-
at
fileeene
of
Hnd
us
ct
ed-
y os
-lesis-alsrcein
vale tob
NOdur-OSR;is
nt of
CO
siva-
-ptyf
and
the
dsts.din-
anow-
sts,es-
-t forCH
edy by0p-ll
a
oved
m/e = 28 signal may comprise both N2 and CO, as revealed bindependent FTIR gas analysis for CO inFig. 9d. Accordingly,the mass signals of CO corresponding toFig. 9d are also shownin Fig. 9b, denoted as CO(IR), over AlAg(4.9,CG), Al2O3(CG),and AlAg(0.8,L). The net N2 production can be obtained bsubtracting the CO(IR) from them/e = 28 signal; this subtraction has no significant effect on them/e = 28 profile. HenceN2 production continues at high temperatures (up to 700◦C),although the extent is strongly affected by the methane comtion activity of each catalyst and the corresponding availabof methane. (As shown inFig. 9a, very little methane remainover the AlAg(21.5,CG) material at 700◦C.) On all samplestemperatures above∼300◦C are necessary to initiate the CH4activation via adsorbed NOx species for N2 production.
TPSR profiles of CO2 are shown inFig. 9c. The light-offtemperature is 300◦C for CO2 production over all four samples, the same as the light-off temperature for N2/CO shown inFig. 9b. Apparently, much stronger CO2 production occurs oveAlAg(21.5,CG) than over the other samples with lower silloading or without silver. Comparing the leached AlAg(0.8and parent AlAg(4.9,CG), it is clear that removing silver pacles suppresses the direct CH4 oxidation to CO2, whereas theCO2 production over AlAg(0.8,L) is slightly higher than thover Al2O3(CG).
Furthermore, the TPSR profiles ofm/e = 28 and 44 (CO2)for each catalyst are in total correspondence with the proof CH4 and O2. For example, a peak and a valley are sfor N2/CO and CO2 in Figs. 9b and 9cat exactly the samtemperatures as for CH4 and O2 in Fig. 9a, 430 and 460◦Cfor AlAg(21.5,CG) and 510 and 578◦C for AlAg(4.9,CG), re-spectively, as represented by the dotted lines inFigs. 9b and9c. Shi et al.[58] observed a very similar two-stage profileCH4/O2 consumption and accompanying N2/CO2 productionduring TPSR in a CH4–O2 stream after coadsorption of NO/O2over an Ag-ZSM-5 catalyst. The light-off temperature for C4consumption and N2/CO2 production was reported to be arou350◦C, and Shi et al. proposed that CH4 reacted with surfacenitrates by SCR before reaction with oxygen by direct combtion.
The TPSR results ofFig. 9 also reflect the structural effeof silver in Ag–alumina catalysts. From the CO2 productionshown inFig. 9c, the CH4 combustion-dominated range shiftby ∼120◦C to lower temperature over AlAg(21.5,CG) compared with the other samples. The high combustion activitthis sample is attributed to the presence of oxygen-coveredver particles[42] as shown on UV–vis (Fig. 4). Further, comparing the leached AlAg(0.8,L) and parent AlAg(4.9,CG) sampwith similar TPSR, the similarity can be attributed to the extence of [Ag–O–Al] species dominant in both samples, asshown by UV–vis (Fig. 4). However,Fig. 9c shows much loweCO2 on AlAg(0.8,L) than on AlAg(4.9,CG), due to the absenof silver particles on the leached catalyst, verified by TEMFig. 1b.
Table 2 compares the amounts of N2 and CO2 eluted inTPSR. For all of the data presented in this table, theues were obtained by integrating from room temperatur700◦C. For the samples that produce CO during TPSR,
s-
s
-
fil-
,
o
-o-
taining the amount of N2 from the m/e = 28 signal is dif-ficult, and so the numbers are not shown. The desorbedwas also calculated and compared with the NO desorbeding TPD in O2 (Fig. 8). The difference between these two Nvalues should indicate the part of NO consumed during TPfor example, over AlAg(21.5,CG), the difference in NO0.7 µmol/m2, corresponding to 0.35 µmol/m2 of N2 produced(based on stoichiometry), very close to the measured amouN2 (0.34 µmol/m2) produced during TPSR. The trend of CO2values show that the presence of silver particles enhances2production by the direct methane oxidation reaction.
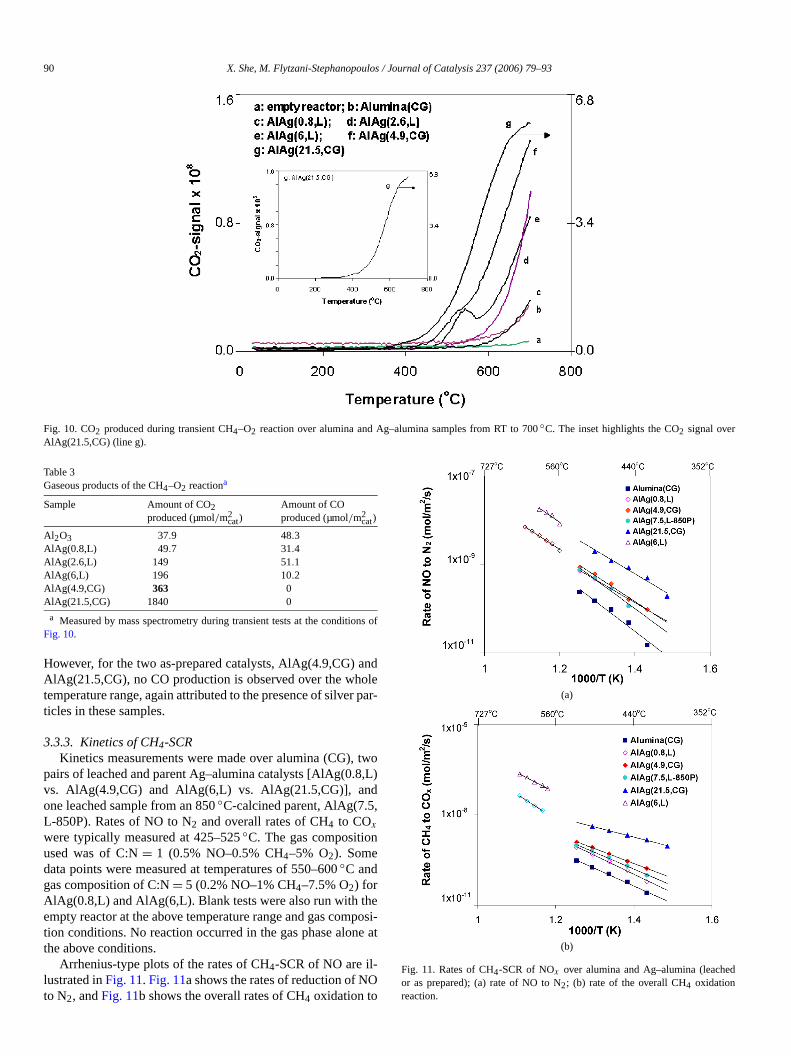
3.3.2.1. Transient methane combustion tests Separate testwith CH4 and O2 were conducted to examine the surface acttion of CH4 without first adsorbing NO–O2 (nitrates). The CO2profiles produced are shown inFig. 10. To check for the possibility of gas-phase reaction, a blank test was run with an emreactor (as shown inFig. 10) in which only a trace amount oCO2 (44) was detected above 600◦C. Therefore, CH4 is notthermally activated at temperature below 600◦C in the pres-ence of O2.
Fig. 10also shows the CO2 profiles obtained over aluminand three leached samples, AlAg(0.8,L), AlAg(2.6,L), aAlAg(6,L). CO2 production starts at∼500◦C over alumina andAlAg(0.8,L) and shifts slightly to∼480◦C for AlAg(2.6,L)and AlAg(6,L). The presence of silver particles promoteslight-off for CO2 at 400◦C in AlAg(4.9,CG) and 300◦C inAg(21.5,CG). Kundakovic et al.[42] reported light-off valuesof 300, 350, and 500◦C for CH4 oxidation over Ag particles(7.9 wt% Ag/ZrO2), Ag clusters (Ag(83)-ZSM-5) and isolatesilver ions (Ag(16)-ZSM-5), respectively, in steady-state teTable 3gives the amounts of CO2 produced for alumina anAg–alumina catalysts. Comparing AlAg(0.8,L) and aluminadicates that the presence of Ag+ enhances CO2 production.Further, the amount of CO2 produced also increases withincreasing amount of silver ions in the leached catalysts, folling the order AlAg(6,L)> AlAg(2.6,L) > AlAg(0.8,L). Muchmore CO2 was produced for the two as-prepared catalyAlAg(4.9,CG) and AlAg(21.5,CG), apparently due to the prence of silver nanoparticles.
Combining the transient reaction results (Fig. 10) and TPSR(Fig. 9) demonstrates that adsorbed nitrates shift the CH4 acti-vation temperature to 300◦C during TPSR, especially for alumina and leached Ag–alumina catalysts. We postulate thaall catalysts, adsorbed surface nitrates are essential for4activation at temperatures as low as 300◦C with concomitantproduction of N2. In contrast, for Ag–alumina catalysts coverwith silver nanoparticles, methane can be activated directladsorbed oxygen, so that methane combustion begins at 30◦C.However, preadsorbed NOx on the silver particles does not apear to contribute to N2 formation at this temperature. As wibecome clear in what follows, all N2 produced in the CH4-SCRof NO comes from the reaction of NOx adsorbed on the aluminsites only.
Table 3also gives the amounts of CO produced for the absamples during transient CH4–O2 reaction. For alumina anall three leached samples, CO accompanies CO2 production.
90 X. She, M. Flytzani-Stephanopoulos / Journal of Catalysis 237 (2006) 79–93
Fig. 10. CO2 produced during transient CH4–O2 reaction over alumina and Ag–alumina samples from RT to 700◦C. The inset highlights the CO2 signal overAlAg(21.5,CG) (line g).
ns
anoler pa
tw,L
d,
n
epoe
O
Table 3Gaseous products of the CH4–O2 reactiona
Sample Amount of CO2produced (µmol/m2
cat)Amount of COproduced (µmol/m2
cat)
Al2O3 37.9 48.3AlAg(0.8,L) 49.7 31.4AlAg(2.6,L) 149 51.1AlAg(6,L) 196 10.2AlAg(4.9,CG) 363 0AlAg(21.5,CG) 1840 0
a Measured by mass spectrometry during transient tests at the conditioFig. 10.
However, for the two as-prepared catalysts, AlAg(4.9,CG)AlAg(21.5,CG), no CO production is observed over the whtemperature range, again attributed to the presence of silveticles in these samples.
3.3.3. Kinetics of CH4-SCRKinetics measurements were made over alumina (CG),
pairs of leached and parent Ag–alumina catalysts [AlAg(0.8vs. AlAg(4.9,CG) and AlAg(6,L) vs. AlAg(21.5,CG)], anone leached sample from an 850◦C-calcined parent, AlAg(7.5L-850P). Rates of NO to N2 and overall rates of CH4 to COx
were typically measured at 425–525◦C. The gas compositioused was of C:N= 1 (0.5% NO–0.5% CH4–5% O2). Somedata points were measured at temperatures of 550–600◦C andgas composition of C:N= 5 (0.2% NO–1% CH4–7.5% O2) forAlAg(0.8,L) and AlAg(6,L). Blank tests were also run with thempty reactor at the above temperature range and gas comtion conditions. No reaction occurred in the gas phase alonthe above conditions.
Arrhenius-type plots of the rates of CH4-SCR of NO are il-lustrated inFig. 11. Fig. 11a shows the rates of reduction of Nto N2, andFig. 11b shows the overall rates of CH4 oxidation to
of
d
r-
o)
si-at
(a)
(b)
Fig. 11. Rates of CH4-SCR of NOx over alumina and Ag–alumina (leachedor as prepared); (a) rate of NO to N2; (b) rate of the overall CH4 oxidationreaction.

X. She, M. Flytzani-Stephanopoulos / Journal of Catalysis 237 (2006) 79–93 91
veG),am
tpleiteticllt
to
rati
1.5.6,L
thhelysva
sut
rer
.edthofs r
e
it
thehy-e
y ac-ants-Oi-ech-the
iningd
d for
theow
ofby
e
hed)
gt%),
toacti-N
ork.Al-lvecha-
Fig. 12. TOF of NO to N2 over leached Ag–alumina catalysts.
COx . Blank alumina exhibits the lowest rates of NO to N2 andoverall CH4 oxidation. Doping with silver enhances the aborates, as shown for the rates over AlAg(0.8,L), AlAg(4.9,Cand AlAg(7.5,L-850P). Interestingly, the rates for these sples are very close to one another. The similar rates of NON2 in the leached sample, AlAg(0.8,L), and the parent samAlAg(4.9,CG), indicate that oxidized silver species are the sresponsible for the SCR, and that silver particles do not parpate in CH4-SCR of NO. AlAg(4.9,CG) displays higher overarates of CH4 oxidation than AlAg(0.8,L), which is consistenwith the literature[42] that silver nanoparticles contributemethane combustion and also with the CO2 elution profiles dur-ing TPSR inFig. 9c.
In Fig. 11a, for AlAg(0.8,L), the rates measured at C:N= 5are comparable with the rates measured at the C:N= 1 condi-tion after extension to lower temperatures. Hence, the C:Ndoes not affect the SCR reaction pathway.
For samples with higher silver amounts, such as AlAg(2CG), significantly enhanced rates of NO to N2 are observedThe rates over the corresponding leached sample AlAg(were similarly enhanced, and the activation energies weresame. For the leached AlAg(0.8,L) and AlAg(6,L), using tamount of silver present on the surface of these two catato scale the rate, we can produce a TOF plot. The TOFues for NO to N2 were calculated from the rates inFig. 11aand the number of surface silver sites based on the XPS re(Table 1). As shown inFig. 12, the TOF plots are in excellenagreement.
Table 4gives the apparent activation energies,Ea, obtainedfrom Fig. 11. For NO reduction to N2, the Ea values for theAg–alumina catalysts are in the range of 94.7–119.7 kJ/mol,whereas for Al2O3(CG), a slightly higher value of 123.8 kJ/molis calculated. TheEa values for overall methane oxidation ain the range of 93.9–128 kJ/mol for alumina and low-silvecontent catalysts and 63.2 kJ/mol for AlAg(21.5,CG).Table 4also lists the activation energies for CH4-SCR of NO reportedfor other catalysts, including Co-ZSM-5, Sr/La2O3, and othersInterestingly, theEa values for Ag–alumina catalysts reporthere are very close to the activation energies reported for overy different CH4-SCR catalysts. Whether this is indicativea common methane activation step over all these catalystmains unclear.
-o,
si-
o
,
)e
tsl-
lts
er
e-
Table 4Apparent activation energies of CH4-SCR of NOx over various catalysts
Sample Ea-NO(kJ/mol)
Ea-CH4(kJ/mol)a
Reductant Referenc
Al2O3(CG) 123.8 111.4 CH4 This workAlAg(0.8,L) 94.7 118.8 CH4 This workAlAg(4.9,CG) 106.4 93.9 CH4 This workAlAg(6,L) 113.0 128.0 CH4 This workAlAg(21.5,CG) 97.2 63.2 CH4 This workAlAg(7.5,L-850P)b 119.7 105.5 CH4 This workCe–Ag-ZSM-5 98 87 CH4 [59]Co-ZSM-5 91 102 CH4 [5]La2O3, Sr/La2O3 111.8 – CH4 [60]Sr/La2O3/Al2O3 103.2 – CH4 [61]Li/MgO 147 – CH4 [62]
a Apparent activation energy of the overall methane oxidation reaction.b This sample is leached from an 850◦C-calcined parent; after leaching,
was calcined again at 650◦C for 3 h.
For HC-SCR of NO, the prevailing mechanisms found inliterature involve adsorbed nitrates and partially oxidizeddrocarbons[63], for which extensive in situ DRIFTS evidencexists. For Ag/alumina, nitrates and acetates are generallcepted as reaction intermediates in SCR of NO with reductother than CH4 [29,51,53,56]. However, the pathway for dinitrogen formation is still unclear, with species such as R–Nx ,isocyanate, cyanide, amines, and NH3 proposed as possibilties[51]. For a reductant such as methane, an important manistic aspect is activation via abstraction of hydrogen fromC–H bond, which has been proposed to be the rate-determstep during CH4-SCR of NO[64]. For Co-ZSM-5, adsorbeNO2 on Co sites is reported to activate CH4 [64], whereas a Pdion can break the C–H bond directly, as has been proposePd/H-ZSM-5[65]. Direct activation of methane on Ag+ ions inAg-ZSM-5 has been proposed by Shi et al.[47].
For the Ag–alumina system, our results show thatSCR-active NOx species are adsorbed on alumina sites. Hmethane activation occurs is also indicated by the dataFigs. 9–12taken collectively. First, methane is activatedadsorbed oxygen on silver nanoparticles at 300◦C, but thispathway leads to CO2 only. No N2 is produced from the nitratspecies adsorbed on silver nanoparticles (seeFigs. 8 and 9). Therate of N2 production is the same for the parent and the leaccatalysts, AlAg(4.9,CG) and AlAg(0.8,L), and AlAg(21.5,CGand AlAg(6,L). But because the amount of strongly bound A+is increased in the leached samples (e.g., from 0.8 to 6 wthe rate increases proportionately (seeFig. 12). We can sur-mise from this that the additional [Ag–O–Al] sites serveactivate more methane; thus, the reaction is limited by thevation of methane on Ag–alumina catalysts. Production of2
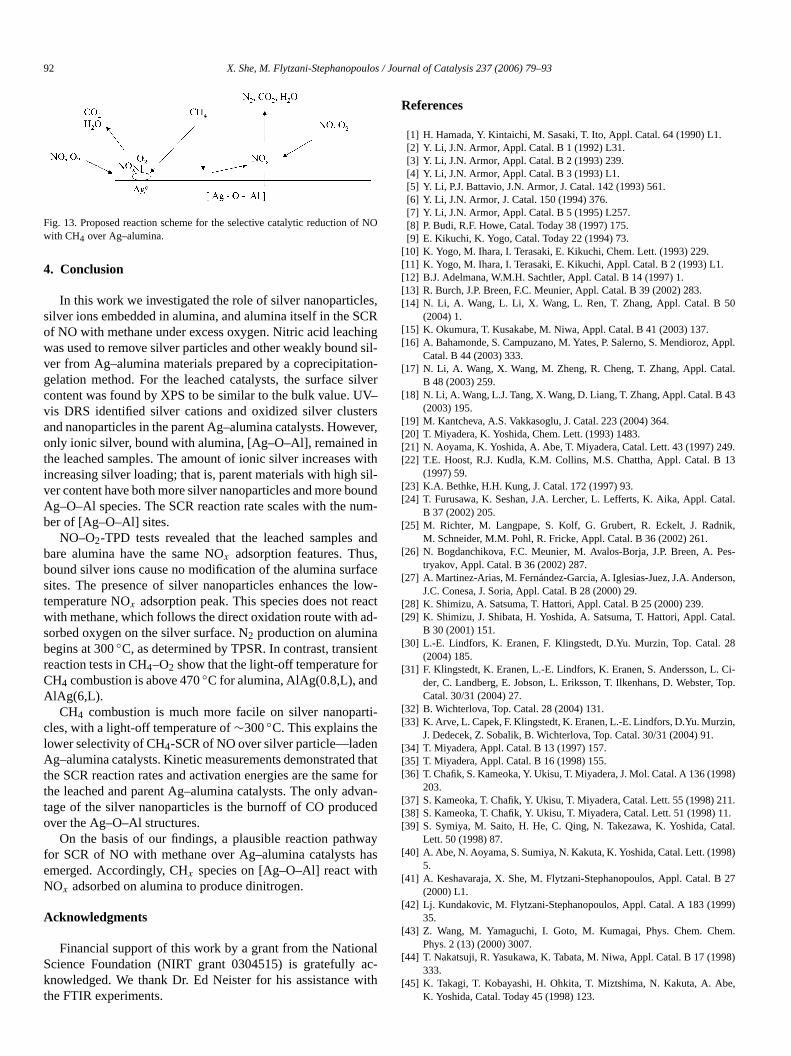
begins at∼300◦C from the interaction of adsorbed NOx onalumina and CHx species on Ag–O–Al groups (seeFig. 9).This scheme explains all of the data presented in this wFig. 13 shows a schematic of the mechanistic pathway.though this pathway is plausible, future work should invospectroscopic verification of the proposed reaction menism.
92 X. She, M. Flytzani-Stephanopoulos / Journal of Catalysis 237 (2006) 79–93
f N
esCRinsi
ionilvV–erseveinwisilounum
ans,facloacd-
ienr
rti-
nthevaced
wahas
alacith
0
Appl.
tal.
43
49.13
tal.
ik,
es-
son,
tal.
28
Ci-Top.
in,
98)
11.1.tal.
98)
27
99)
m.
98)
e,
Fig. 13. Proposed reaction scheme for the selective catalytic reduction owith CH4 over Ag–alumina.
4. Conclusion
In this work we investigated the role of silver nanoparticlsilver ions embedded in alumina, and alumina itself in the Sof NO with methane under excess oxygen. Nitric acid leachwas used to remove silver particles and other weakly boundver from Ag–alumina materials prepared by a coprecipitatgelation method. For the leached catalysts, the surface scontent was found by XPS to be similar to the bulk value. Uvis DRS identified silver cations and oxidized silver clustand nanoparticles in the parent Ag–alumina catalysts. Howonly ionic silver, bound with alumina, [Ag–O–Al], remainedthe leached samples. The amount of ionic silver increasesincreasing silver loading; that is, parent materials with highver content have both more silver nanoparticles and more bAg–O–Al species. The SCR reaction rate scales with the nber of [Ag–O–Al] sites.
NO–O2-TPD tests revealed that the leached samplesbare alumina have the same NOx adsorption features. Thubound silver ions cause no modification of the alumina sursites. The presence of silver nanoparticles enhances thetemperature NOx adsorption peak. This species does not rewith methane, which follows the direct oxidation route with asorbed oxygen on the silver surface. N2 production on aluminabegins at 300◦C, as determined by TPSR. In contrast, transreaction tests in CH4–O2 show that the light-off temperature foCH4 combustion is above 470◦C for alumina, AlAg(0.8,L), andAlAg(6,L).
CH4 combustion is much more facile on silver nanopacles, with a light-off temperature of∼300◦C. This explains thelower selectivity of CH4-SCR of NO over silver particle—ladeAg–alumina catalysts. Kinetic measurements demonstratedthe SCR reaction rates and activation energies are the samthe leached and parent Ag–alumina catalysts. The only adtage of the silver nanoparticles is the burnoff of CO produover the Ag–O–Al structures.
On the basis of our findings, a plausible reaction pathfor SCR of NO with methane over Ag–alumina catalystsemerged. Accordingly, CHx species on [Ag–O–Al] react withNOx adsorbed on alumina to produce dinitrogen.
Acknowledgments
Financial support of this work by a grant from the NationScience Foundation (NIRT grant 0304515) is gratefullyknowledged. We thank Dr. Ed Neister for his assistance wthe FTIR experiments.
O
,
gl--er
r,
th-d-
d
ew-t
t
atforn-
y
-
References
[1] H. Hamada, Y. Kintaichi, M. Sasaki, T. Ito, Appl. Catal. 64 (1990) L1.[2] Y. Li, J.N. Armor, Appl. Catal. B 1 (1992) L31.[3] Y. Li, J.N. Armor, Appl. Catal. B 2 (1993) 239.[4] Y. Li, J.N. Armor, Appl. Catal. B 3 (1993) L1.[5] Y. Li, P.J. Battavio, J.N. Armor, J. Catal. 142 (1993) 561.[6] Y. Li, J.N. Armor, J. Catal. 150 (1994) 376.[7] Y. Li, J.N. Armor, Appl. Catal. B 5 (1995) L257.[8] P. Budi, R.F. Howe, Catal. Today 38 (1997) 175.[9] E. Kikuchi, K. Yogo, Catal. Today 22 (1994) 73.
[10] K. Yogo, M. Ihara, I. Terasaki, E. Kikuchi, Chem. Lett. (1993) 229.[11] K. Yogo, M. Ihara, I. Terasaki, E. Kikuchi, Appl. Catal. B 2 (1993) L1.[12] B.J. Adelmana, W.M.H. Sachtler, Appl. Catal. B 14 (1997) 1.[13] R. Burch, J.P. Breen, F.C. Meunier, Appl. Catal. B 39 (2002) 283.[14] N. Li, A. Wang, L. Li, X. Wang, L. Ren, T. Zhang, Appl. Catal. B 5
(2004) 1.[15] K. Okumura, T. Kusakabe, M. Niwa, Appl. Catal. B 41 (2003) 137.[16] A. Bahamonde, S. Campuzano, M. Yates, P. Salerno, S. Mendioroz,
Catal. B 44 (2003) 333.[17] N. Li, A. Wang, X. Wang, M. Zheng, R. Cheng, T. Zhang, Appl. Ca
B 48 (2003) 259.[18] N. Li, A. Wang, L.J. Tang, X. Wang, D. Liang, T. Zhang, Appl. Catal. B
(2003) 195.[19] M. Kantcheva, A.S. Vakkasoglu, J. Catal. 223 (2004) 364.[20] T. Miyadera, K. Yoshida, Chem. Lett. (1993) 1483.[21] N. Aoyama, K. Yoshida, A. Abe, T. Miyadera, Catal. Lett. 43 (1997) 2[22] T.E. Hoost, R.J. Kudla, K.M. Collins, M.S. Chattha, Appl. Catal. B
(1997) 59.[23] K.A. Bethke, H.H. Kung, J. Catal. 172 (1997) 93.[24] T. Furusawa, K. Seshan, J.A. Lercher, L. Lefferts, K. Aika, Appl. Ca
B 37 (2002) 205.[25] M. Richter, M. Langpape, S. Kolf, G. Grubert, R. Eckelt, J. Radn
M. Schneider, M.M. Pohl, R. Fricke, Appl. Catal. B 36 (2002) 261.[26] N. Bogdanchikova, F.C. Meunier, M. Avalos-Borja, J.P. Breen, A. P
tryakov, Appl. Catal. B 36 (2002) 287.[27] A. Martinez-Arias, M. Fernández-Garcia, A. Iglesias-Juez, J.A. Ander
J.C. Conesa, J. Soria, Appl. Catal. B 28 (2000) 29.[28] K. Shimizu, A. Satsuma, T. Hattori, Appl. Catal. B 25 (2000) 239.[29] K. Shimizu, J. Shibata, H. Yoshida, A. Satsuma, T. Hattori, Appl. Ca
B 30 (2001) 151.[30] L.-E. Lindfors, K. Eranen, F. Klingstedt, D.Yu. Murzin, Top. Catal.
(2004) 185.[31] F. Klingstedt, K. Eranen, L.-E. Lindfors, K. Eranen, S. Andersson, L.
der, C. Landberg, E. Jobson, L. Eriksson, T. Ilkenhans, D. Webster,Catal. 30/31 (2004) 27.
[32] B. Wichterlova, Top. Catal. 28 (2004) 131.[33] K. Arve, L. Capek, F. Klingstedt, K. Eranen, L.-E. Lindfors, D.Yu. Murz
J. Dedecek, Z. Sobalik, B. Wichterlova, Top. Catal. 30/31 (2004) 91.[34] T. Miyadera, Appl. Catal. B 13 (1997) 157.[35] T. Miyadera, Appl. Catal. B 16 (1998) 155.[36] T. Chafik, S. Kameoka, Y. Ukisu, T. Miyadera, J. Mol. Catal. A 136 (19
203.[37] S. Kameoka, T. Chafik, Y. Ukisu, T. Miyadera, Catal. Lett. 55 (1998) 2[38] S. Kameoka, T. Chafik, Y. Ukisu, T. Miyadera, Catal. Lett. 51 (1998) 1[39] S. Symiya, M. Saito, H. He, C. Qing, N. Takezawa, K. Yoshida, Ca
Lett. 50 (1998) 87.[40] A. Abe, N. Aoyama, S. Sumiya, N. Kakuta, K. Yoshida, Catal. Lett. (19
5.[41] A. Keshavaraja, X. She, M. Flytzani-Stephanopoulos, Appl. Catal. B
(2000) L1.[42] Lj. Kundakovic, M. Flytzani-Stephanopoulos, Appl. Catal. A 183 (19
35.[43] Z. Wang, M. Yamaguchi, I. Goto, M. Kumagai, Phys. Chem. Che
Phys. 2 (13) (2000) 3007.[44] T. Nakatsuji, R. Yasukawa, K. Tabata, M. Niwa, Appl. Catal. B 17 (19
333.[45] K. Takagi, T. Kobayashi, H. Ohkita, T. Miztshima, N. Kakuta, A. Ab
K. Yoshida, Catal. Today 45 (1998) 123.
X. She, M. Flytzani-Stephanopoulos / Journal of Catalysis 237 (2006) 79–93 93
pp
ttice
ata
03
103
000
. To-
ys. 3
2)
sou,
[46] E. Seker, J. Cavataio, E. Gulari, P. Lorpongpaiboon, S. Osuwan, ACatal. A 183 (1999) 121.
[47] C. Shi, M. Cheng, Z. Qu, X. Bao, Appl. Catal. B 51 (2004) 171.[48] R. Burch, E. Halpin, J.A. Sullivan, Appl. Catal. B 17 (1998) 115.[49] A commercial software JADE was used for phase identification and la
parameters calculation, which was coupled to ICDD Database.[50] G.B. Hoflund, Z.F. Hazos, Phys. Rev. B 62 (2000) 11126.[51] F.C. Meunier, J.P. Breen, V. Zuzaniuk, M. Olsson, J.R.H. Ross, J. C
187 (1999) 493.[52] G.M. Underwood, T.M. Miller, V.H. Grassian, J. Phys. Chem. A 1
(1999) 6184.[53] K. Shimizu, H. Kawabata, A. Satsuma, T. Hattori, J. Phys. Chem. B
(1999) 5240.[54] S. Kameoka, Y. Ukisu, T. Miyadera, Phys. Chem. Chem. Phys. 2 (2
367.
l.
l.
)
[55] F.C. Meunier, V. Zuzaniuk, J.P. Breen, M. Olsson, J.R.H. Ross, Catalday 59 (2000) 287.
[56] K. Shimizu, J. Shibata, A. Satsuma, T. Hattori, Phys. Chem. Chem. Ph(2001) 880.
[57] Mass spectrometer-library (MKS-PPT v4.24).[58] C. Shi, M. Cheng, Z. Qu, X. Yang, X. Bao, Appl. Catal. B 36 (200
173.[59] Z. Li, Ph.D. Thesis, Tufts University (1998).[60] X. Zhang, A.B. Walters, M.A. Vannice, Appl. Catal. B 7 (1996) 321.[61] C. Shi, A.B. Walters, M.A. Vannice, Appl. Catal. B 14 (1997) 175.[62] X. Zhang, A.B. Walters, M.A. Vannice, J. Catal. 146 (1994) 568.[63] O. Gorce, F. Baudin, C. Thomas, P. Da Costa, G. Djéga-Mariadas
Appl. Catal. B 54 (2004) 69.[64] A.D. Cowan, R. Dumpelmann, N.W. Cant, J. Catal. 151 (1995) 356.[65] H. Kato, C. Yokoyama, M. Misono, Catal. Today 45 (1998) 93.