Embed Size (px)
Citation preview

Policy Research Working Paper 6103
The Risks of Innovation
Are Innovating Firms Less Likely to Die?
Ana M. Fernandes Caroline Paunov
The World BankDevelopment Research GroupTrade and Integration TeamJune 2012
WPS6103P
ublic
Dis
clos
ure
Aut
horiz
edP
ublic
Dis
clos
ure
Aut
horiz
edP
ublic
Dis
clos
ure
Aut
horiz
edP
ublic
Dis
clos
ure
Aut
horiz
ed

Produced by the Research Support Team
Abstract
The Policy Research Working Paper Series disseminates the findings of work in progress to encourage the exchange of ideas about development issues. An objective of the series is to get the findings out quickly, even if the presentations are less than fully polished. The papers carry the names of the authors and should be cited accordingly. The findings, interpretations, and conclusions expressed in this paper are entirely those of the authors. They do not necessarily represent the views of the International Bank for Reconstruction and Development/World Bank and its affiliated organizations, or those of the Executive Directors of the World Bank or the governments they represent.
Policy Research Working Paper 6103
While innovation is a source of competitiveness, it may expose plants to survival risks. Using a rich set of plant-product data for Chilean manufacturing plants during the period 1996–2006 and discrete-time hazard models controlling for unobserved plant heterogeneity, this paper shows that innovating plants have higher survival odds. However, risk plays an important role for the innovation-survival link: only innovators that retain diversified sources of revenues survive longer. Single-product innovators are at greater risk of exiting. In addition, only innovators facing lower market risk, measured by fewer innovative competitors, low-pricing strategies, or lower sales volatility in the new products’ markets, see their odds of survival increase significantly. Technical risk, measured by the proximity of product innovations to the plants’ past expertise, the degree of sophistication of new
This paper is a product of the Trade and Integration Team, Development Research Group. It is part of a larger effort by the World Bank to provide open access to its research and make a contribution to development policy discussions around the world. Policy Research Working Papers are also posted on the Web at http://econ.worldbank.org. The authors may be contacted at [email protected] and [email protected].
products, or their novelty to the Chilean market, does not play a substantial role in the innovation-survival link. Engaging in risky innovation is not an irrational decision, since plants reap big payoffs—higher productivity, employment and sales growth—from such innovations. However, those payoffs are not always higher than those from cautious innovation, suggesting that constraining factors, such as credit constraints, force plants to take on more risk when innovating. An implication of the findings for industry dynamics is that among innovators, only the survival of cautious innovators is guaranteed. Since engaging in cautious innovation may not be feasible for all plants, there could be a role for policy in reducing innovators’ exposure to risks and providing assistance to deal with failed innovations, while setting the right incentives.

The Risks of Innovation: Are Innovating Firms Less Likely to Die?
Ana M. Fernandes a Caroline Paunov b
The World Bank OECD
Keywords: Firm Exit, Firm Survival, Product Innovation, Multi-Product Firms, Chile.
JEL Classification codes: D24, L16, L6, O31.
a Ana Margarida Fernandes. The World Bank. Development Research Group. 1818 H Street NW, Washington DC,
20433. Email: [email protected]. b
Caroline Paunov, OECD, 2, rue André Pascal, 75 775 Paris Cedex 16, France. Email: [email protected]
and [email protected].
The authors would like to thank Dominique Guellec, Jonathan Haskel, Jacques Mairesse, Valentine Millot, Pierre
Mohnen and Piotr Stryszowski, and seminar participants at the 2011 MEIDE Conference in San José, Costa Rica, the
UNU-MERIT/School of Governance in Maastricht, the 2011 Zvi Griliches Seminar at the Barcelona Graduate
School of Economics, the 2011 Meeting of the Latin American and Caribbean Economic and Econometric
Associations in Santiago, Chile, and the 11th
CAED conference in Nürnberg, Germany. We thank Asier Minondo for
sharing do-files to calculate product proximity measures. The findings expressed in this paper are those of the
authors and do not necessarily represent the views of the World Bank, the OECD or their member countries.

1
1. Introduction
Firm exit along with entry are crucial components of the evolution of industries both in
developed and in developing countries (Caves, 1998, Tybout, 2000). Models of industry dynamics
emphasizing producer heterogeneity and market selection such as Jovanovic (1982) and Ericson and
Pakes (1995) suggest that in reasonably efficient markets „superior‟ firms have higher chances to
survive and grow. While being innovative is a central characteristic of „superior‟ firms it also is a
risky venture due to the uncertainties inherent to both the innovations themselves and their
commercialization. The introduction of new products by a firm - an important type of innovation -
involves high and often sunk development and production costs that may fail to bring a sufficiently
high payoff to recover those costs.1 Demand for these new products might not pick up or the products
could be copied or replaced quickly by other new products developed by competitors. The model
proposed by Ericson and Pakes (1995) illustrates the risks associated with innovation. In their model,
firms engage in R&D investments which may improve their efficiency, profits, and survival but can
also lead to firm exit if the outcome is not successful. Given that failed product launches are frequent,
innovators might ultimately face a lower survival probability than other firms.2 In this paper, we
examine the relationship between product innovation and plant survival focusing specifically on the
role of different types of risk for that relationship and on potential differences in performance returns
for riskier types of innovation. We do so using a rich new dataset on Chilean manufacturing plants
and all their products during the period 1996-2003.
Our paper makes several contributions to the empirical literature that studies the relationship
between survival and observable producer characteristics, namely innovation-related variables, as a
way to test the implications of industry dynamics models.3 First, our dataset allows constructing
objective plant-level time-varying measures of product innovation - categorical and continuous -
based on the observation of whether a product is newly manufactured by a plant in any year. This is a
clear advantage relative to previous studies that mostly use measures of innovation based on
subjective perceptions of managers for a cross-section of firms taken from innovation surveys.4
1 See OECD-Eurostat (2005) for a discussion of different types of innovation: product innovation, process
innovation, managerial innovation, and organizational innovation. 2 See Gourville (2006) on the failure of new product introductions. Famous examples of failed product launches
include New Coke by Coca Cola and Sony‟s Betamax. 3 See Doms et al. (1995), Chen (2002), Disney et al. (2003), and Shiferaw (2009) and Manjon-Antolin and Arauzo-
Carod (2008) on the determinants of firm survival and Esteve-Pérez et al. (2004), Hall (1987), Cefis and Marsili
(2006), and Zhang and Mohnen (2011) on the on the role of innovation for firm survival. 4 Mairesse and Mohnen (2010) point to the problems with innovation surveys‟ subjective measures that rely
exclusively on firm perceptions of whether they have introduced innovations at the process or product levels. They

2
Second, our measures capture product innovations that are new to a plant but not necessarily new
to the country nor the world. While these product innovations may be considered „minor‟, their
cumulative effects are important drivers of growth (Puga and Trefler, 2010). More importantly, in
emerging market economies such as Chile „minor‟ innovations account for the lion‟s share of
innovation activities, in contrast to path-breaking innovations associated with research and
development (R&D) and patents that have been considered in previous studies of the innovation-
survival link.5
Third, our analysis goes beyond studying the link between innovation and firm survival by
focusing on the role of risk as a crucial determinant of that link. We test the hypothesis that a positive
innovation-survival link is valid only for cautious innovators who are less exposed to risk. A first
dimension of risk, inspired by the finance literature principles, relates to the lack of diversified
sources of revenue resulting for example from new products accounting for a very large proportion of
plants‟ revenues. A second dimension of risk relates to the multiple technical challenges that need to
be overcome by innovators in order to produce a substantially novel product that is better than the
available products at a competitive cost. A third dimension of risk relates to the market challenges
faced by innovators, i.e., the market conditions and sales strategies required to get the new product to
be successfully sold in the market.6 We explore empirically via several proxies how each of these
dimensions of risk affects the innovation-survival link for Chilean plants.
Fourth, we conduct a more rigorous test of the innovation-survival link than was done in
previous studies on firm survival. Rather than relying on the popular Cox hazard model, we are the
first to apply discrete-time hazard models with random effects to plant survival analysis. In doing so,
we address that model‟s two major shortcomings, the fact that i) it is adequate for continuous-time
survival data only and ii) it does not allow controlling for unobserved plant heterogeneity. We
estimate several discrete-time hazard models for plant survival - complementary log-log (cloglog),
probit and logit - with plant random effects to correct for possible omitted variable biases. Moreover,
note that what is defined as a new or improved product is not always clear to the respondents and the distinction
between an innovation that is “new to the firm” and “new to the market” is also subject to much subjective judgment.
Cefis and Marsili (2006) study the effect of innovation on firm survival relying on a subjective measure of
innovation (a dummy equal to one if a firm self-reports that it introduced either a product or process innovation) for a
cross-section of Dutch firms. Their overly encompassing definition of innovation has the shortcoming
(acknowledged by the authors) of potentially underestimating the effects of innovation on survival. 5 Esteve-Pérez et al. (2004) and Hall (1987) show a positive impact of R&D activities on the survival of firms in
Spain and the U.S., respectively. 6 We thank an anonymous referee for pointing us to the relevance of technical and market risks for innovators and
their potential impact on the innovation-survival link.

3
we consider alternative models including a linear probability model that allows controlling for plant
fixed effects. Finally, we should note that to the best of our knowledge, ours is the first study to
examine the innovation-survival link for an emerging economy.7
Our main findings suggest that engaging in product innovation and introducing a larger number
of new products is beneficial for the survival of Chilean plants. These baseline results are obtained
controlling for a large set of time-varying plant and industry characteristics as well as industry,
region, and year fixed effects and are robust to a variety of alternative specifications. The benefits for
survival are significantly larger when the new products are exported, and for plants engaged in prior
investments in machinery or importing intermediate inputs. Innovators have higher labor
productivity, employment growth, sales growth, as well as profit rates.
Regarding the role of risk for the innovation-survival link, our findings show that only innovators
that retain diversified sources of revenues - i.e., they are not too dependent on new products - benefit
in terms of longer survival rates. In the extreme case of single-product plants, those that innovate are
actually at a significantly higher risk of death than non-innovating plants. Our findings show that
market risk captured by substantial innovation activities by competitors, high-pricing strategies, or
higher sales volatility in the new products‟ markets affects the innovation-survival link in that the link
holds only for the less risky types of innovation. By contrast, our empirical evidence suggests that
technical risk, whether it is captured through the proximity of product innovations to the plants‟ past
expertise, the degree of sophistication of new products, or their novelty to the Chilean market, does
not play a substantial role in the innovation-survival link.
The natural question that arises is why plants would engage in risky innovations if those put their
survival at risk. A plausible explanation would be that the payoffs from risky innovations are
particularly high. Regarding the intriguing finding on single-product plants, our evidence from
quantile regressions of various plant performance measures shows that single-product innovators
exhibit positive payoffs but similar to those of multi-product innovators.8 Thus, the rationale for
engaging in risky innovation must lie in the fact that those plants do not have a choice: market
failures such as limited access to finance or physical infrastructure constraints force them to take on
more risk when innovating. Regarding the other types of risk that affect the innovation-survival link,
7 A more recent study by Zhang and Mohnen (2011) examines the innovation-survival link for Chinese firms.
8 An emerging literature shows the importance of considering the specificities of multi-product plants in studies of
industry dynamics as well as in studies of plant-level responses to trade liberalization (Bernard et al., 2010).
4
our evidence suggests positive payoffs for both risky and cautious types of innovation, indicating a
clearly rational decision by plants when deciding to innovate.
The relationship between innovation and plant survival is important for policy across several
dimensions. Plant exit is a major cause of unemployment; therefore, our findings are important for
implicitly assessing the innovation-employment link. The implications of our findings are twofold.
First, a striking implication for industry dynamics is that risk interferes in the firm selection process
in terms of innovation, differently from what is known for productivity, i.e., that in well-functioning
markets, firms with higher productivity tend to survive and grow under market competition while
others may exit at earlier stages. By contrast, we find that the survival of innovating firms is not
necessarily ensured. Second, while innovators tend to be superior performers and often generate
positive spillovers to the rest of the economy, our evidence shows that only cautious innovators
survive longer. Moreover, despite the incentives, engaging in more cautious types of innovation may
not be feasible for all plants in all types of industries. For example, small plants may be unable to add
products to their product scope - thus engaging in cautious innovation - since they lack the capacity to
maintain a large product range. Moreover, when a radical switch in production is required for
innovation, the introduction of new products can occur only on a large scale. Hence, there could be a
role for public policy in reducing exposure to risks by promoting investments that potentially result in
cautious innovations for certain types of plants and providing guarantees or help to deal with failed
innovations. Obviously, such policy interventions would need to be designed so as to set the right
incentives ensuring that no moral hazard problems arise.
The paper is organized as follows. We describe the data in Section 2. Section 3 discusses the
methodology. Our main results are discussed in Sections 4. Section 5 examines the role of risk and
Section 6 concludes.
2. Data and Descriptive Evidence on Plant Survival and Product Innovation in Chile
We use a unique dataset on Chilean manufacturing plants and their products (ENIA) collected by
the Chilean Statistical Institute (INE) and spanning the 1996-2003 period. The fact that the ENIA is a
census of Chilean plants (with more than 10 employees) is crucial for our analysis of plant survival.9
9 Details on the ENIA are provided in Fernandes and Paunov (2012). Plant survival in the ENIA was studied by
Alvarez and Vergara (2010) and Lopez (2006). The fact that the ENIA covers in principle only plants with more than
10 employees could pose a problem for our analysis in that plants might drop out of the dataset not due to failure but
due to their employment falling below the 10 employee threshold. However, that principle is in practice more
flexible: in our estimating sample for the period 1996-2003 that includes 19439 plant-year observations, 4.8% or 939

5
The unique identifier included in the ENIA allows us to follow plants over time and identify exit of
plant A in year t+1 if plant A is part of the ENIA in year t but is not part of the ENIA in year t+1 and
after. Another advantage of our data is that we can identify multi-plant firms, which may exhibit
important differences relative to single-plant in terms of survival (Disney et al., 2003).10 Table 1
shows that the average yearly exit rate in the Chilean manufacturing sector is about 9%. Exit rates
differ across industries ranging from 6% in the basic metals industry to 11% in textile, wearing
apparel and leather, wood and wood products.
The crucial feature of our dataset is that it provides for each plant and year information on the
entire set of products manufactured and sold classified at the 7-digit ISIC level (revision 2).11 This
information allows us to construct two novel measures of innovation. Our first main measure of
product innovation is a dummy variable that equals one for a plant in year t if the plant sells one or
more new 7-digit products while our second main measure explores the quantitative aspect of
innovation and is a continuous measure capturing the number of new 7-digit products sold by a plant
in year t. For both measures a new 7-digit product is one that the plant has never sold prior to year t-1,
but that product may not be new to the market or the world. Table 1 shows that the average
percentage of plants introducing new products is 14%. The innovation rate is lowest for the food,
beverage, and tobacco industries - where only about 8% of plants innovate - and well-above average
for a diverse set of industries from textiles, wearing apparel and leather, wood and wood products to
chemicals, basic metals and fabricated metal products. The largest numbers of new products are
introduced in the basic metals and fabricated metal products and machinery and equipment industries.
Most product innovators are multi-product plants. For innovating plants overall, their new products
generally account for less than 50% of revenues and they tend to add to the plants‟ existing product
scope in most industries.
To provide a richer characterization of product innovation and assess the role that risk plays for
the innovation-survival link we construct a variety of measures which interact both the dummy and
plant-year observations have less than 10 employees. Of those 939 plant-year observations, in most cases plants
remain in the ENIA survey reporting less than 10 employees for multiple years. Hence, we are confident that plant
exit from the ENIA sample does indicate real failure. Nevertheless, we conduct an econometric exercise focusing on
plants with more than 15 employees in Section 4.2. 10
The INE collects information on which plants in the ENIA survey are part of a multi-plant firm, i.e., a firm with at
least two plants responding to the survey. The information was kindly provided to the authors for the purposes of this
research project. During the 1997-2003 sample period on average 8.3% of firms are multi-plant firms. In the rest of
the paper we will be particularly careful to denote single-unit establishments which are the object of ENIA‟s survey
as „plants‟ and refer to „firms‟ only when this corresponds to units with multiple plants. 11
See Navarro (2012) and Fernandes and Paunov (2009) for details on the products data. Due to a change in product
classification from ISIC Rev. 2 to ISIC Rev. 3 classification in 2001, we omit that year in the econometric analysis.

6
the continuous innovation variables with relevant product and/or plant variables. Details are provided
in Appendix Table 1 and in Sections 4 and 5 when discussing the results.
As preliminary evidence on the relationship between innovation and plant performance in terms
of survival, we examine the univariate relationship between survival and innovation (i.e., ignoring
covariates) by showing in Figure 1 the Kaplan-Meier survival functions for innovating plants versus
non-innovating plants.12 Innovating plants have higher survival odds: after five years, 71% of the
innovating plants survive while only 55% of non-innovating plants survive.
In addition to its effects on survival, product innovation has other positive payoffs for Chilean
plants. We examine differences across innovating and non-innovating plants (defined here as those
who innovate at least once during the sample period) in four outcomes: labor productivity,
employment growth, sales growth, and profit rates. Controlling for 4-digit industry, region and year
fixed effects, the OLS estimates in columns (1)-(4) of Table 2 show that innovating plants exhibit
significantly higher performance according to all four outcome indicators, suggesting a positive
payoff for innovation on average across Chilean plants. Column (5) shows a positive effect of
innovation on a dummy for export market participation, which can be viewed as another performance
indicator, and hence shows a different payoff from innovation.
Since payoffs from innovation will be different depending on whether or not the plant is
successful, we estimate quantile regressions for the four outcomes, controlling for 4-digit industry,
region and year fixed effects.13 Quantile regressions are relevant since they allow us to examine
whether innovation tends to stretch the right tail of the conditional distribution of these outcomes, i.e.,
whether innovation generates a significant number of high labor productivity, high profit, high
employment growth, or high sales growth plants. Figure 2 plots the quantile regression results and
show that the payoffs from innovation differ across quantiles, but interestingly they are positive
across the entire distribution for all four outcomes. The innovation payoffs increase when moving
from lower to higher quantiles of labor productivity but exhibit a U-shaped pattern when it comes to
employment growth and sales growth. The innovation payoffs are relatively stable across quantiles of
12
The Kaplan-Meier function provides an estimator for the survivor function that is the probability of survival up to
period t and after and is obtained as
j
i
iiii nhntS1
/)()(ˆ where n is the population alive in it and h is the number of
failures in it (Kiefer, 1988).
13 See Appendix 2 for a description of quantile regressions, Buchinsky (1998), and Koenker and Hallock (2001) for
surveys and Coad and Rao (2008) and Love et al. (2009) for applications to the analysis of plant-level innovation.
Quantile regressions are robust to outliers and are particularly appropriate for dependent variables with heavy tails -
such as our plant outcomes - for which the OLS assumption of normally distributed errors is unlikely to hold.

7
profit rates. These positive payoffs support evidence that innovation fosters plant performance for the
Chilean dataset in line with the conclusions of the existing literature.14 Importantly, these positive
payoffs provide validation to our novel product innovation measures, as their relationship with plant
performance is consistent with that identified based on more traditionally used R&D and perception-
based innovation indicators.
3. Model Specification
In order to correctly identify the effects of innovation (and other plant characteristics) on plant
survival, it is necessary to consider a hazard or duration model whose dependent variable is the
time/spell between plant entry and exit (the survival spell).15 The use of a hazard model is adequate
for plant survival analysis due to the incomplete nature of the duration information. The hazard
function represents the conditional probability of a plant ending a survival spell after t periods, given
that it survived until t-1, (the elapsed duration of the survival spell) and given plant characteristics.
By contrast, when conventional estimation methods such as probit or OLS - the latter also called
linear probability - are applied to the estimation of a plant exit model, they are in effect studying the
unconditional probability of the event (e.g., the probability that a plant exits after 5 years in
operation) rather than its conditional probability (e.g., the probability that a plant exits after 5 years in
operation conditional on having survived until year 4). Kiefer (1988) introduces a useful sports
analogy to illustrate the substantial difference between concepts and why the conditional probability
approach is conceptually appropriate to address our research questions. In sports team competitions in
which elimination happens when the team loses, the probability of surviving in the second round is
the probability of winning conditional on making it to the second round, whereas the unconditional
probability is defined in terms of a single event, i.e., the probability of winning the second round
match. Similarly, hazard models account for the fact that the data contains not only information on
14
Such evidence has often been shown using the Crépon et al. (1998) or CDM model, which is the most popular
method to estimate the innovation-performance link. The method has been applied to Chile using perception-based
innovation measures for a cross-section of plants in the Chilean Innovation Survey by Crespi and Zuniga (2012).
This method suffers however from problems of weak identification in the estimation of a causal relationship between
innovation and firm performance. For example, as acknowledged by Crespi and Zuniga (2012), in order to be
identified, the model needs to assume that certain firm characteristics such as firm size affect only the decision to
invest in innovation activities but not the amount to be invested, nor the knowledge generated from such investments. 15
See Kiefer (1988), Klein and Moeschberger (1997), and Hosmer and Lemeshow (2008) on hazard models. The use
of hazard models follows the empirical literature on firm survival reviewed by Manjon-Antolin and Arauzo-Carod
(2008). In these models, the key concept is the hazard rate which is the probability that a plant will experience an
event (exit) at time t, given that the plant is at risk for having an event (the plant survived until t-1). The hazard rate
is the unobserved rate at which events occur.

8
plant exit in a given year but also additional information, namely that the plant survived until year t-1
before it was forced to exit. By taking advantage of the information on the duration of plant survival
rather than focusing on exit only, hazard models do not impose the strong assumption that conditional
survival rates are constant over time (i.e., that they are similar whether the plant exits in year 1 or year
4).
Moreover, the use of hazard models avoids producing biased estimates as OLS or probit
regressions would do, given that they ignore the right-censoring of observations. The right-censoring
of observations is due to the fact that at the end of our sample period some of the plants are still in
operation and excluding them would result in sample selection bias. It is thus necessary to explicitly
deal with them within the estimation framework, which hazard models do. Further, using OLS to
estimate exit probabilities has the shortcomings that the resulting predicted probabilities are not
meaningful as they may lie outside the [0,1] interval and the corresponding variances can be negative.
Hence, the magnitudes of the effects of innovation on survival cannot be assessed, which would
introduce a substantial limitation to our empirical analysis.
These aspects point to the use of hazard models as the baseline approach to address our research
questions. However, hazard models have the shortcoming that controlling for unobserved individual
heterogeneity is possible only through the use of plant random effects.16 Hazard models with random
plant effects constitute the most rigorous approach possible to address unobserved heterogeneity in
survival analysis and have been used in recent studies such as Bandick and Görg (2010) to study plant
survival and foreign acquisition, Brenton et al. (2010), Hess and Persson (2011), and Esteve-Pérez et
al. (2012) to study to study the duration of trade flows at the product- or firm-level. The use of
random effects requires that the plant effects be orthogonal to other plant covariates but this condition
frequently does not hold beyond experimental data. Thus, while hazard models with random plant
effects will be our baseline approach - as will be described further below - we will also consider a
more flexible approach to account for unobserved heterogeneity: linear probability model with plant
fixed effects.17
Several hazard models can be used for plant survival analysis, the choice will depend on the
nature of the data and the identification requirements of the analysis. The continuous-time
proportional hazards model proposed by Cox (1972) is very popular in firm survival studies (e.g.,
Audretsch and Mahmood, 1995; Agarwal and Audretsch, 2001; Chen, 2002; Disney et al., 2003;
16
Unobserved individual heterogeneity is designated as frailty in the biostatistics literature. 17
A limitation of that approach is that it cannot estimate the effects of plant-specific time-invariant factors.

9
Girma et al., 2007).18 The popularity of the Cox model is due to its convenient estimation of the
effects of plant characteristics on survival using a partial likelihood approach and making no
assumptions on the shape of the baseline hazard function.19 The effect of plant characteristics on
survival is specified as a proportional shifter of the baseline hazard function. However, a major caveat
of the Cox proportional hazard model is that it requires survival time to be a continuous variable and
plants to be ordered exactly regarding their failure time.20 This does not apply to our data which
groups plant survival times into discrete intervals of one year, as is the case for most survival studies
that use annual plant-level census data. While we know which plants and how many plants exit from
year to year, we are unable to order plants‟ failure times within a year, so there are „ties‟ among
plants. In the presence of a sizeable fraction of tied survival times the coefficient estimates and
standard errors of the Cox model can be biased (Cox and Oakes, 1984).21 This caveat applies also to
continuous-time hazard models with a parametric baseline hazard function. Thus, discrete-time
hazard models are more appropriate for our analysis.
Another major caveat is that the Cox model does not allow controlling for unobserved plant
heterogeneity, namely the fact that plants may have differing duration distributions even after
controlling for a rich set of plant characteristics, due to computational difficulties.22 A failure to
account for unobserved heterogeneity will lead to biases in the estimated effects of plant
characteristics on survival (Van den Berg, 2001) and to spurious negative duration dependence of the
estimated Cox hazard function (Heckman and Singer, 1984).23 Unobserved plant heterogeneity can
however be controlled for in the discrete-time hazard models discussed below, as well as in
continuous-time models with parametric baseline hazard rates that we will consider in robustness
checks. Despite its caveats, we will obtain robustness estimates based on the Cox model for
18
The Cox model is also widely used in studies examining the survival of trade flows at the product level (e.g.,
Besedes and Prusa, 2006; Brenton et al., 2010; Hess and Persson, 2011, 2012). 19
The baseline hazard function summarizes the pattern of duration dependence and is estimated non-parametrically. 20
Since the Cox model partial likelihood estimation requires duration times to be ordered chronologically, that
assumes in effect that plant survival duration can take on any positive observable value (Hess and Persson, 2012). 21
These biases are present even when correcting the Cox partial likelihood function for the existence of „ties‟ using
the method of Breslow (1974), as we do in Section 4.2. 22
A further caveat arises from the Cox model‟s proportional hazards assumption that the effect of plant
characteristics on the hazard rate does not depend on time duration (i.e., on plant age). This assumption may fail due
to unobserved heterogeneity but also because the effect of some plant characteristics on the hazard is inherently non-
proportional (e.g., initial plant size is likely to affect differently the hazard rate of a very young versus a relatively
older plant). This caveat can however be addressed within the model estimation by interacting variables with non-
proportional effects with plant age, as we will do in Section 4.2. 23
The degree of negative duration dependence may be over-estimated when unobserved heterogeneity is not
accounted for, because as time proceeds a selection process implies that only plants better suited to survive remain.

10
comparability with previous studies, correcting the Cox partial likelihood function for the existence of
„ties‟ using the method of Breslow (1974).
The preferred choice for our plant survival analysis are discrete-time hazard models that we
describe next and that address the issue of tied failure times and of unobserved individual
heterogeneity (Lancaster, 1990). Let a plant-survival spell be designated by j that can be either
complete ( 1jc ) or right-censored/incomplete ( 0jc ) and let the number of periods that a plant
survives (i.e., the time to a failure event) be designated by T. The discrete-time survivor function is
the probability of plant survival at least m periods and is given by:
m
k
jkjj hmTmS1
)1()Pr()( (1)
where **,min jjj CTT , *
jT is a latent failure time, *
jC is a latent censoring time for the plant
survival spell j , and h is the discrete-time hazard rate of ending the survival spell in m periods,
conditional on survival up to m-1 periods which is defined as:
)1Pr(/)1Pr()1/1Pr()( mTmTmmTmTmmh iiiij . (2)
Defining a binary dependent variable jmy to take a value of 1 if plant survival spell j ends in
year m and 0 otherwise, its log-likelihood function is given by:24
J
j
m
k
jmjmjmjm hyhyL1 1
)1log()1(loglog (3)
where the contribution to the log-likelihood of: (a) a right-censored plant survival spell j is the
discrete-time survivor function Eq. (1) and (b) a completed plant survival spell j in interval m is the
discrete-time density function (the probability of ending the spell in m periods). Eq. (3) implies that
discrete-time hazard models for grouped duration times can be estimated using standard regression
models for binary choice panel data, as shown by Jenkins (1995).
To be fully estimable, the log-likelihood function requires the specification of a functional
form for the discrete-time hazard rate jmh that links probabilities to explanatory variables (time-
varying plant and industry characteristics). We consider three functional forms - complementary log-
log (cloglog) following Prentice and Gloecker (1978), probit, and logit - allowing in each case
unobserved individual heterogeneity to be accounted for by random plant effects. For the widely used
24
This binary dependent variable is equal to 1 in the year of exit for plants that exit and 0 otherwise.
11
probit and logit models, the discrete-time hazard rate jmh is distributed, respectively, as an inverse
cumulative Gaussian (Normal) and a logistic function (the log of the odds ratio). For the more
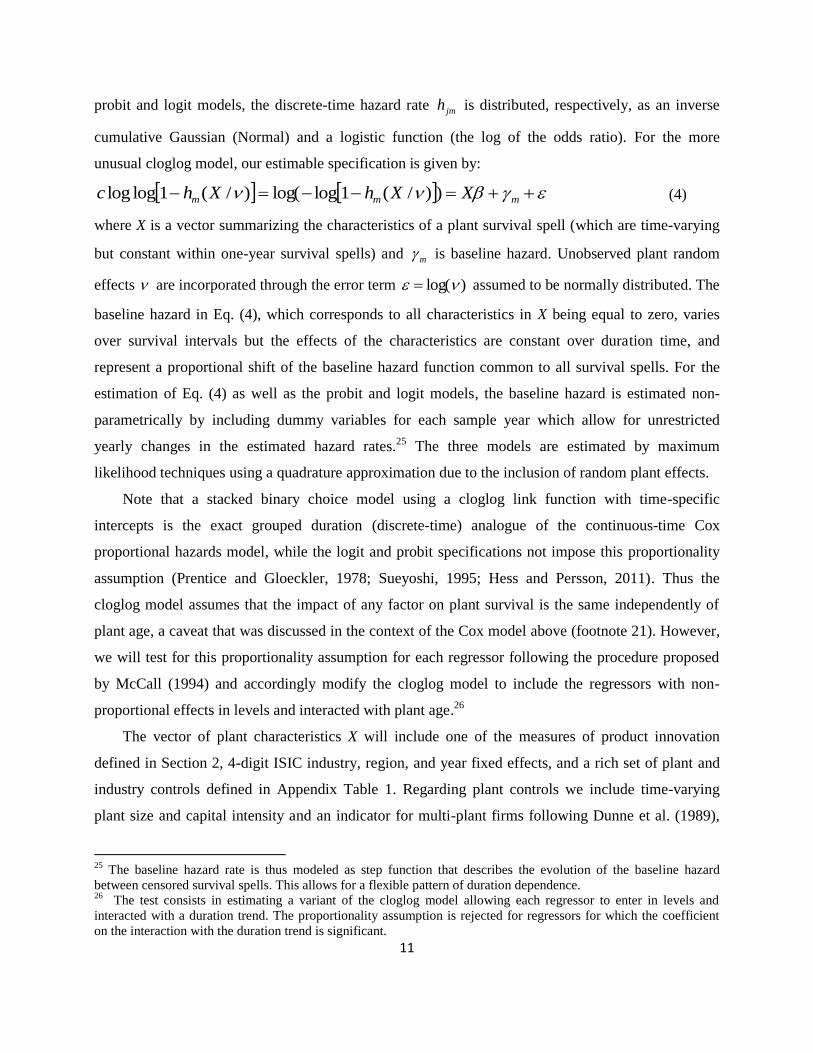
unusual cloglog model, our estimable specification is given by:
mmm XXhXhc ))/(1loglog()/(1loglog (4)
where X is a vector summarizing the characteristics of a plant survival spell (which are time-varying
but constant within one-year survival spells) and m is baseline hazard. Unobserved plant random
effects are incorporated through the error term )log( assumed to be normally distributed. The
baseline hazard in Eq. (4), which corresponds to all characteristics in X being equal to zero, varies
over survival intervals but the effects of the characteristics are constant over duration time, and
represent a proportional shift of the baseline hazard function common to all survival spells. For the
estimation of Eq. (4) as well as the probit and logit models, the baseline hazard is estimated non-
parametrically by including dummy variables for each sample year which allow for unrestricted
yearly changes in the estimated hazard rates.25 The three models are estimated by maximum
likelihood techniques using a quadrature approximation due to the inclusion of random plant effects.
Note that a stacked binary choice model using a cloglog link function with time-specific
intercepts is the exact grouped duration (discrete-time) analogue of the continuous-time Cox
proportional hazards model, while the logit and probit specifications not impose this proportionality
assumption (Prentice and Gloeckler, 1978; Sueyoshi, 1995; Hess and Persson, 2011). Thus the
cloglog model assumes that the impact of any factor on plant survival is the same independently of
plant age, a caveat that was discussed in the context of the Cox model above (footnote 21). However,
we will test for this proportionality assumption for each regressor following the procedure proposed
by McCall (1994) and accordingly modify the cloglog model to include the regressors with non-
proportional effects in levels and interacted with plant age.26
The vector of plant characteristics X will include one of the measures of product innovation
defined in Section 2, 4-digit ISIC industry, region, and year fixed effects, and a rich set of plant and
industry controls defined in Appendix Table 1. Regarding plant controls we include time-varying
plant size and capital intensity and an indicator for multi-plant firms following Dunne et al. (1989),
25
The baseline hazard rate is thus modeled as step function that describes the evolution of the baseline hazard
between censored survival spells. This allows for a flexible pattern of duration dependence. 26
The test consists in estimating a variant of the cloglog model allowing each regressor to enter in levels and
interacted with a duration trend. The proportionality assumption is rejected for regressors for which the coefficient
on the interaction with the duration trend is significant.

12
Disney et al. (2003), and Bernard and Jensen (2007). We include current plant size and size squared
to account for possible non-linearities in the relationship with innovation, as well as the initial size at
which the plant started operations.27 Controlling for capital intensity ensures that the effect of product
innovation is not picking up instead the effect of capital accumulation through process innovation.
We also include a measure of plant sales growth to avoid capturing the effects of „desperate‟
innovators, i.e., plants which switch products in a desperate last attempt to avoid an inevitable
closure. This control is particularly important for our analysis of the role of risk for the innovation-
survival link. Regarding industry controls, we include time-varying sales growth, the Herfindahl
index of concentration of market shares, and the average innovation rate in the industry following
Audretsch and Mahmood (1995), Audretsch (1995), Mata and Portugal (1994), and Strotmann
(2007). We compute these measures at a highly disaggregated level, the 6-digit ISIC level.28 For the
Herfindahl index, we include both its level and its squared to allow for possible non-linear effects of
competition on plant survival.
4. The Effects of Innovation on Plant Survival
4.1 Baseline Results
Table 3 presents our baseline estimates for the relationship between plant survival and product
innovation using the discrete-time hazard models discussed in Section 3: cloglog, probit, and logit
with random plant effects. Columns (1)-(3) present the results for the product innovation dummy
while columns (4)-(6) present the results for the continuous product innovation variable. The
significance of the estimates effects is assessed using heteroskedasticity-robust standard errors. The
tables report the marginal effects (or elasticities) of each regressor on the probability of plant exit,
evaluated at the means of the independent variables.
Columns (1)-(3) show that engaging in product innovation reduces significantly the termination
probability of a survival spell for Chilean plants, i.e., it has a positive effect on plant survival.29
27
While the dataset used for our analysis with information on 7-digit products begins in 1996, we have a
complementary dataset with (non-product) information on all plants since their entry into the ENIA from 1979
onwards. We use this dataset to compute plant age and initial plant size. 28
For multi-product plants, the 6-digit ISIC level used corresponds to that of the plant‟s 7-digit product accounting
for the largest share of total revenues. However, note that our findings are qualitatively unchanged when industry
controls at the 5-digit or the 4-digit ISIC level of disaggregation are included. 29
Our tests for proportionality in the cloglog model mentioned in Section 3 reject the proportionality assumption for
the multi-plant dummy, current plant size, and plant capital intensity variables. Therefore we enter those variables in
levels and interacted with plant age in all cloglog specifications.

13
Columns (4)-(6) show that the higher is the number of new products introduced by a plant the higher
is its survival probability, and the effects are significant at the 5% confidence level. For either of the
innovation measures, the magnitude of the coefficients is very close across the cloglog and logit
specifications and is slightly lower in the probit specifications. The log-likelihood values shown in
Table 3 suggest that the cloglog model provides the best fit to the data. The marginal effect in column
(1) of Table 3 implies that a plant‟s decision to engage in product innovation would decrease its death
probability by 21%, keeping all other variables constant. The marginal effect in column (4) suggests
that the introduction of one additional new product would decrease a plant‟s death probability by
10%, keeping all other variables constant.30 Our results confirm the evidence by Zhang and Mohnen
(2011), Cefis and Marsili (2006), Esteve-Pérez et al. (2004), and Hall (1987) using our improved
estimation methods and our novel measures of product innovation. Our results are consistent with the
hypothesis that innovators are among the group of superior performers and their innovation activities
prolong their existence giving them a further rationale to engage in such activities.
The marginal effects of the time-varying plant-level variables reported in Table 3 show, as
expected, that plants with higher sales growth and higher capital intensity have a higher survival
probability and multi-plant firms are also more likely to survive than single-plant firms. In conformity
with the literature, we find a positive relationship between size and capital intensity and the
probability of survival of Chilean plants (Bernard and Jensen, 2007; Disney et al., 2003; Dunne et al.,
1989; Hopenhayn, 1992; and Jovanovic, 1982). Our evidence also suggests (and differs only in that
dimension from the previous literature) that plants that started operations at a larger size have a higher
death probability. A possible explanation is that larger initial plant size may add substantial
operational costs that reduce plants' flexibility to respond to changes in demand. Finally, with regards
to the time-varying industry variables, higher average innovation has a significant detrimental effect
on plant survival confirming for our improved methodology previous findings for U.S. firms
(Audretsch, 1991, 1995; Audretsch and Mahmood, 1995) and can be explained by the fact that
industries with active innovation are more fast-paced.31 An important aspect to note is that the
30
For the innovation indicator, the marginal effect shows the effect on the exit probability of switching its value from
0 to 1 whereas for the continuous innovation measure the marginal effect shows the effect on the exit probability of
increasing the number of new products by 1. 31
The other industry controls do not affects plant survival significantly. A possible explanation for this lack of
significance is that industry dynamics have theoretically ambiguous effects on survival. On the one hand, fast-
growing industries afford higher survival possibilities as growth of some plants does not necessarily result in market
share losses of rivals, and hence may lead to fewer aggressive reactions by the latter. On the other hand, in fast-
growing industries conditions are more unsettled and higher turnover rates might result. Another explanation for this

14
findings in Table 3 are not due to collinearity between our innovation measures and plant or industry
controls since unreported regressions including only one innovation measure along with industry,
region, and year fixed effects provide the same findings qualitatively. Given the mostly unchanged
effects of the plant and industry controls on survival across specifications, we will not show them in
the rest of the tables.
4.2 Robustness
In Table 4 we verify the robustness of our main findings to the use of models other than the
discrete-time hazard models with plant random effects, following the discussion in Section 2.
Columns (1) and (5) present the results from estimating a Cox proportional hazards model, for
comparability with previous studies, for both dummy and continuous innovation measures.32
Columns (2) and (6) as well as columns (3) and (7) show the results from estimating a linear
probability model, including in the latter two columns plant fixed effects that account for favorable
demand or supply shocks or unobservable plant characteristics that might lead plants to innovate and
remain in business. Columns (4) and (8) present the estimates from a continuous-time parametric
regression survival model, where the distribution of the baseline hazard function is assumed to be a
Weibull and the model is estimated as „frailty‟ model allowing for unobserved heterogeneity.33 The
estimates for all of these specifications show that the positive and significant impact of innovation on
plant survival is maintained.
We conduct a series of additional checks to the validity and strength of our main results and
present the results in Appendix Table 2, Panels A and B for the dummy and continuous innovation
variables, respectively. First, we re-estimate our main specifications for single-plant units only (i.e.,
where plants equal firms) to avoid possible biases related to this source of heterogeneity across plants.
The estimates show that the effects of innovation also hold for firm (rather than plant) survival.
Second, since the ENIA collects information for plants with more than 10 employees, exit could be
lack of significance is the inclusion of 4-digit industry fixed effects which already capture to a large extent slowly-
moving industry characteristics. 32
The coefficient on product innovation in the Cox model shown in Table 4 can be interpreted as the constant
proportional effect of innovation on the conditional probability of completing a survival spell. A negative coefficient
implies that innovation is associated with a lower hazard rate or a higher survival probability. 33
In general, the Weibull distribution is indicated for data with monotone hazard rates, that increase or decrease
exponentially over time and has been used in several studies on firm survival (Manjon-Antolin and Arauzo-Carod,
2008). To account for the unobserved heterogeneity we consider a mixture model where the hazard function is
multiplied by a plant-specific random variable assumed to follow a gamma distribution. The parameter of this
distribution is also estimated though its estimate is not reported in Table 4.

15
mechanically due to the fact that a plant reduces its workforce below 10 employees.34 We address that
concern by re-estimating our specifications for the sub-sample of plants with more than 15
employees. This concern is however not warranted as the findings are qualitatively maintained for
that sub-sample of plants. Third, we modify our measures of innovation to be capture new products at
a more aggregate 6-digit ISIC level. The estimates are qualitatively similar to those for new products
at the 7-digit ISIC level.35 Fourth, we add to our specifications several plant or industry time-varying
characteristics (not considered before for parsimony): dummies for whether plants are exporters or
foreign-owned, plant productivity, the industry advertising to sales ratio, capital intensity and entry
rates (Audretsch and Mahmood, 1995; Geroski et al., 2007). 36 The results confirm our earlier
findings. Finally, we check for nonlinear effects for our continuous innovation variable but find none.
4.3. Characterizing Innovation
To provide some additional insights into what drives the positive innovation-survival link, we
present in Table 5 the results from re-estimating our main specifications splitting the innovation
variables into distinct groups. First, we split the new products into those that are exported and those
that are not exported, based on plant-product-year specific data. The ability to export products is a
very strong indication of the success of the plant‟s innovation as it reveals its ability to compete in
international markets which tend to be very demanding (given the substantial transport and other
trade costs involved) and thus are attainable only by the best products. Columns (1)-(3) show that
whether they are exported or not, new products increase Chilean plants‟ survival odds, but the
benefits are significantly larger for exported new products as indicated by the t-test for the difference
in marginal effects.
Another interesting aspect to examine is what complementary efforts are required for the
innovations that reduce a plant‟s death probability. First, columns (4)-(6) examine the differences
across plants whose product innovations are preceded or not by investments in machinery. Such
investments are likely to be associated with process innovation which is the natural early stage of
innovation. Interestingly, the estimates show that plant survival increases with product innovation
34
See also footnote 8. 35
Unreported results show that the evidence is also upheld for new products introduced at the 5-digit ISIC level. 36
The link between productivity and plant survival has been studied by Shiferaw (2009). We use labor productivity
instead of TFP due to the difficulties for inference that would arise from including an estimated TFP variable in our
regression framework. By using labor productivity we avoid the problems associated with the measurement of TFP
for multi-product plants highlighted by Bernard et al. (2009).

16
only when the plant also engages in prior investments in machinery. Second, columns (7)-(9)
establish the role of imported intermediate inputs as a complement to product innovation. A large
literature shows the importance of imported inputs as a source of technical knowledge (e.g., Kasahara
and Rodrigue, 2008; Paunov, 2011). Our estimates show that product innovations increase plant
survival probabilities in Chile only when accompanied by the use of imported inputs. This may reflect
the specific case of Chile as an emerging economy, as the relationship might not hold to the same
extent for more advanced economies where plants can rely on domestic frontier technical knowledge.
5. The Effects of Risk on the Innovation-Survival Relationship and on Payoffs
5.1 Risk and the Innovation-Survival Relationship
The innovation process poses risks for survival along several dimensions. A first dimension of
risk (or rather of the lack thereof) – inspired by the portfolio theory of finance – is the diversification
associated with a larger number of sources of revenue for a plant. When new products account for a
large share of plant revenues, the innovation strategy is more risky since their success and
sustainability are more uncertain than those of more established products. A second dimension of risk
relates to the technical difficulties faced by innovators. In order to produce a novel successful product
that the plant never manufactured before, it needs to potentially overcome substantial technical
challenges, particularly if it aims at introducing a product beyond its expertise. A third dimension of
risk relates to the market challenges faced by innovators, i.e., the market conditions and sales
strategies required to get the new product to be successfully sold on the market. We will explore
empirically via several proxies how each of these dimensions of risk feeds into the link between
innovation and plant survival in Tables 6-8.37 Our hypothesis is that the positive innovation-survival
link shown in Section 4 is verified only for innovators with less exposure to risk.
We assess the first dimension of risk related to the diversification of sources of plant revenues,
expecting the risk of introducing a new product to be higher if that product accounts for substantial
share of a plant‟s total revenues. That would be the case when a single-product plant introduces one
new product that replaces the previous product it manufactured (thus remaining single-product) and
its only source of revenue is at stake as the market may not take up the new product, while that would
clearly not be the case for a multi-product plant that introduces a new product while retaining other
37
All unreported results in what follows are available from the authors upon request.

17
more established sources of revenue. We estimate our main specifications allowing for differential
effects of innovation on survival for multi-product plants relative to single-product plants. The
estimates in columns (1)-(6) of Table 6 show that only multi-product innovators benefit in terms of
survival, and single-product innovators are actually at a significantly higher risk of death than non-
innovators. The t-tests indicate that the differences across plant categories are statistically significant.
The marginal effects in column (1) of Table 6 suggest that, relative to non-innovating plants, the
probability of death is lower by 29% for innovative multi-product plants while it is higher by 41% for
innovative single-product plants. These negative and significant effects of innovation of innovation
on the survival of single-product plants point to higher risks involved in the introduction of new
products for those plants. Since single-product plants may be „special‟ entities for a variety of
reasons, we examine whether the results are maintained defining „few-product‟ plants as those
producing up to two products and redefining multi-product plants to be plants producing three or
more products. Unreported estimates show that innovation only improves the survival odds of multi-
product plants.
An alternative specification that examines how the innovation-survival relationship is affected by
opportunities for diversification considers explicitly the innovators‟ dependence on revenues from the
new products. Our main specifications are estimated distinguishing across plants that introduce new
products accounting for less than versus more than 50% of revenues. The results reported in columns
(7)-(9) of Table 6 confirm the hypothesis that innovation is beneficial for survival only for cautious
innovators that introduce new products on a small scale and thus retain diversified sources of revenue.
Similar unreported results are obtained when changing the cutoff to 40% or 60% of revenues.
A final specification differentiates across plants that introduce new products that add to the
existing product scope and those that replace previous products, i.e., leaving the product scope
unchanged or reducing it. The evidence reported in columns (10)–(12) of Table 6 shows that the
innovation-survival relationship holds only for new products that add to the existing product scope of
a plant. This finding is consistent with the evidence that product replacements which put plants‟
sources of revenue at risk do not significantly improve survival.
We examine the second dimension of technical risk by considering in Table 7 alternative
measures of innovation that attempt to capture potential technical difficulties faced by innovators i)
because the product differs significantly from the normal or past production of the plant or ii) because
of its inherent complexity. First, a plant undertakes a more risky innovation strategy if it ventures into
product innovation in a completely new industry relative to doing it in a past industry in which it has

18
manufacturing experience. The rationales are intuitive: plants are likely to have less technical (as well
as market knowledge) in a completely new industry. Columns (1)-(3) of Table 7 show the results
from estimating our main specifications considering separately product innovations in a 6-digit
industry where the plant has already manufactured other products and innovations in an entirely new
6-digit industry for the plant. Both types of innovation are associated with higher survival odds but
only innovation in an old 6-digit industry has a statistically significant effect. However, the t-tests
suggest that the difference in marginal effects is insignificant. Moreover, in unreported results we
consider a potentially larger risk, distinguishing the effects of innovations in a new versus an old 3-
digit industry. The findings are qualitatively maintained: more cautious types of innovation in an old
3-digit industry increase plant survival odds significantly while that is not the case for more risky
ventures of manufacturing products in new 3-digit industries. But the difference in marginal effects is
again insignificant.
The categorization of product innovations into known versus new industries is somewhat crude
in that it does not take into account the intensity with which the plant did or did not concentrate in
activities close to the new product. Moreover, that categorization does not take into account the
relative closeness between the plants‟ established past industries and those of the new product(s).
Thus, we introduce a measure that accounts for both these shortcomings: we establish for each new
product its proximity to the plant‟s past production activities by computing product proximity indices
following Hidalgo et al. (2007) and its application by Boschma et al. (2012). The proximity indices
are based on how often countries have comparative advantage in two products simultaneously. The
idea is that if countries with a comparative advantage in product A also have comparative advantage
in product B with high probability, this implies that products A and B demand the same production
capabilities and hence are close to one another. The indices, described in detail in the Appendix, are
obtained for each new 7-digit ISIC product relative to the weighted average of the past products of
the plant, accounting for the relative weights of the different past products in total plant revenues. We
estimate our main specifications allowing differential effects on survival for new products that are
closer versus more distant from the plants‟ past expertise. The results shown in columns (4)-(6) of
Table 7 suggest that new products that are closer to the plants‟ expertise and thus pose lower
technical risks do not impact plant survival any differently than new products that are more distant
from the plants‟ expertise. A shortcoming of this approach is that the product proximity indices do
not cover all Chilean innovators due to difficulties in establishing concordances between the 7-digit
ISIC level and the HS classification of the trade data.

19
Second, regarding technical risk, in addition to the risk of going beyond the plant‟s own
expertise, another important question concerns the intrinsically higher sophistication of product
innovations, especially when they are of a more radical nature. Thus, introducing a product that is
new to the plant and to the country (i.e., that no other plant has introduced before) is likely to be more
risky than introducing a product that is new only to the plant. Columns (7)-(9) of Table 7 show the
results from estimating our main specifications considering separately product innovations that are
new to Chile and those that are new only to the plant. Both types of product innovations increase
survival odds of Chilean plants and the t-tests show that the effects are not significantly different. A
different way to capture technical risk is to consider the degree of sophistication of the new products
introduced by Chilean plants, under the assumption that the higher is that degree the more risky is the
innovation potentially. We use a trade-based proxy to measure the sophistication of each product
following Hausmann et al. (2007) and its application by Jarreau and Poncet (2012). The proxy,
described in detail in Appendix 3, gives a larger score indicating higher sophistication to products that
are mostly exported by countries with higher GDP per capita, thus inferring from observed trade
patterns the products that require greater levels of development to be exported. We estimate our main
specifications splitting product innovations into those that are less versus more sophisticated.
Columns (10)-(12) of Table 7 show that while the innovation-survival relationship is significant only
for plants introducing less sophisticated product innovations, the t-tests indicate that the difference of
coefficients is not significant. Again, a shortcoming of this approach is that the product sophistication
measures do not cover all Chilean innovators due to difficulties in establishing concordances between
the 7-digit ISIC level and the HS classification of the trade data.
We examine the third dimension of market risk by considering in Table 8 alternative measures of
innovation that attempt to capture the various challenges associated with getting new products to be
successfully sold on the market. First, as is widely discussed in the innovation literature, the value of
an innovation depends on the actions of competitors; its value will be much lower if competitors
introduce novel products that are very close to the plants‟ innovations. Columns (1)-(3) show the
results from estimating our main specifications distinguishing across product innovations in a 7-digit
category with more than versus less than 10 competitors who introduce innovations concurrently. The
estimates indicate that product innovation improves Chilean plant survival odds significantly only in
industries with a lower degree of competition.

20
Second, the pricing strategy adopted by a plant for its new products can affect the innovation-
survival link.38 If a plant charges for its new products prices that are higher than those charged by
competitors, it risks lower sales unless consumers are willing to pay extra to have the new product
instead of an old more cost-effective product. New products priced much higher than the common
practice in the industry may not see their sales take-off and may have to be withdrawn from the
market soon after being introduced. Columns (4)-(6) of Table 8 present the results from estimating
our main specifications separating new products into those priced (in their introduction year) above
versus below the median across all plants selling the product. The estimates show a clear benefit for
plant survival of introducing new products priced below the median but no effect for new products
priced above the median.
Third, we assess the role of market risk for the innovation-survival link by examining whether a
recession period hurts innovators by reducing demand for their products relatively more than for non-
innovators. New products are likely to be among the first products that consumers decide to postpone
consuming. Recession periods tend to increase exit rates - with the evidence suggesting that even
superior performers such as innovators might be affected by higher exit risk (Salvanes and Tveteras,
2004) - and innovation rates are often lower (OECD, 2009; forthcoming; Paunov, 2012).39 We
estimate our main specifications interacting the product innovation variables with a dummy for 1999
which was a recession year for the Chilean economy. The results in columns (7)-(9) of Table 8 show
that the impact of innovation on plant survival is insignificant during the recession period but is
significant during growth periods. The differences are however not significant as indicated by the t-
tests. Hence, we cannot establish that such a general shock to sales affects the innovation-survival
link but this could be simply due to the very short duration of this recession.
Fourth, we consider the possibility that innovation is more risky for survival in industries with
higher sales volatility, where plants are less certain of how their innovations will perform in the
market. Columns (10)-(12) of Table 8 present the results from estimating our main specifications
allowing the effects of product innovation to differ across industries with higher versus lower sales
volatility over the sample period. The results show that innovation improves Chilean plants‟ survival
odds significantly only in industries with lower sales volatility.
38
Note that the pricing strategy will also be related to production costs and thus to technical aspects. 39
The studies show these patterns for the financial crisis of 2008-2009 in OECD economies (OECD, 2009,
forthcoming) and in eight Latin American economies (Paunov, 2012).

21
In summary, our findings show that only innovators that retain relatively diversified sources of
revenues - i.e. that are not too dependent on new products - benefit in terms of longer survival rates.
In the extreme case of single-product plants, their survival probability is actually significantly
reduced by innovation. Moreover, our empirical evidence suggests that technical risk does not play a
substantial role for the innovation-survival link, whether it is captured through the proximity of
product innovations to plants‟ past expertise, the degree of sophistication of new products or their
novelty to the Chilean market. By contrast, our findings show that market risk captured by substantial
innovation activities by competitors, higher sales volatility in the industries of the new products, or
high-pricing strategies affects the innovation-survival relationship in that the relationship holds only
for the less risky types of innovation.
5.2 Performance Payoffs to Risky and Cautious Innovations
A question that arises based on the effects of risk on the innovation-survival link is why would
plants engage in risky innovations in the first place if these put their survival at risk? A plausible
explanation would be that the payoffs from risky innovations are particularly high. An alternative
explanation could be that these plants do not actually have a choice: market failures of various types
(such as limited access to finance or physical infrastructure constraints) force them to engage in risky
innovations (for example introducing a new product in spite of being a single-product plant). We
assess the payoffs in terms of the four plant performance outcomes discussed in Section 2 (labor
productivity, employment growth, sales growth, and profit rates) across more risky and more cautious
types of innovations. Since performance payoffs from innovation can (by their nature) be
substantially different across plants due to the inherent uncertainties involved, it is appropriate to
examine the payoffs across performance quantiles for Chilean plants, controlling for 4-digit industry,
region, and year fixed effects.
Our focus is on the intriguing significant negative effect on survival experienced by single-
product plants that innovate. Figure 3 plots the coefficients from quantile regressions allowing for
payoff differences across multi-product and single-product innovators. The payoffs in terms of labor
productivity are positive for multi-product innovators across all percentiles and are increasingly
positive for single-product innovators at higher percentiles of the distribution. By contrast, for
employment growth and for sales growth innovation brings a high and growing benefit for both
single-product and multi-product innovators at higher percentiles of the distributions. The pattern is
22
different for profit rates which are much lower (even negative at most percentiles) for single-product
innovators than for multi-product innovators. Innovations by single-product plants reduce their profit
rates possibly due to the required high fixed development costs that cannot be spread across a broad
product range. Despite the lower profit rates, the positive payoffs in terms of labor productivity,
employment growth, and sales growth explain why even single-product plants engage in innovation
and put their survival at risk. However, these results do not show that risky innovators have higher
payoffs per se, rather, factors other than the prospects of guaranteed higher payoffs must be forcing
these plants to engage in risky innovation strategies. Possible factors well-known to apply in
emerging countries are difficult framework conditions including e.g., limited access to finance needed
to expand production lines and invest in innovation activities.
Regarding the other risky types of innovation, we should note that none is associated with lower
plant survival odds per se in Section 5.1, rather they do not bring a significant benefit in terms of
survival (relative to not innovating at all). A consistent pattern is that the payoffs are generally
positive for both risky and cautious innovations across performance measures and proxies for risk.
This suggests that Chilean plants make a rational decision when innovating, as that activity will in
principle bring higher payoffs in terms of labor productivity, employment growth, sales growth, and
profit rates. With regards to the relative size of the payoffs for risky versus cautious innovations the
results differ across the proxies for risk used. When risk is captured by the plant‟s share of new
products in total revenues, the presence of many competitors introducing concurrent innovations, or
high-pricing strategies for new products, the evidence broadly suggests higher payoffs for risky
innovations.40 This suggests a stronger compensation for risk and is a rationale for plants to choose
risky innovation strategies. This is, however, not verified across all alternative risk types of
innovation which show varied payoff patterns that also differ across the type of performance
measures and percentile ranges.
Several confounding factors are likely to come into play explaining these different findings
which are but a first step towards understanding the role of risk for the innovation-performance link.
Among the limitations of these findings it is worth noting the following. First, some of the proxies for
risk suggest that a risky innovation strategy is not only based on plants‟ choices but depends also on
the actions undertaken by competitors and on the market conditions faced. Controlling for such
conditions and choices, possibly within an industry dynamics model, would be necessary to fully
understand the impact of different innovation strategies on plant performance. Second, performance
40
See Appendix Figures 1 and 2 for the coefficients from quantile regressions for two examples of proxies of risk.

23
payoffs may take much longer to materialize than what can be captured by our six-year panel for
Chile, thus further research using longer panel datasets will be better placed to capture the impacts of
past weak performance on subsequent plant innovation choices.
6. Conclusion
Innovation is not only potentially very costly but can also expose plants to significant survival
risks as the launch of new products may result in lower than expected sales. At the same time,
innovation is a potentially powerful source to allow longer plant survival in the marketplace.
Focusing on Chilean manufacturing plants, this paper shows that product innovation reduces the
probability of plant death under certain circumstances. Risk plays an important role for the
innovation-survival link in that only innovators that retain diversified sources of revenues and
innovators facing lower market risk benefit in terms of longer survival. By contrast, we do not find
the technical risk of innovation leads to differential impacts in terms of survival. In particular single-
product plants that innovate are at greater risk of exiting than non-innovating plants. These are not
irrational decisions since plants reap positive payoffs from such innovations, but those payoffs are not
always higher than those from more cautious types of innovations suggesting that constraining factors
impede these plants from engaging in more cautious types of innovations.
Our findings have several policy implications. First, our results show that while there are positive
micro-level effects of innovation on the survival of some manufacturing plants, these do not hold for
plants engaging in more risky types of innovation. This suggests an additional reason for
underinvestment in innovations from the point of view of the plant, beyond the usual fears of not
appropriating all the benefits from innovation. Second, while cautious innovation is the most
desirable innovation strategy to obtain a survival benefit, it may not be feasible for all types of plants
nor in all types of industries. Policy actions may be required to improve for example the capacity of
small plants to engage in cautious innovation given the desirability of small plant survival in terms of
securing employment. Where risky innovation is the only possibility, an adequate policy mechanism
that avoids moral hazard problems would be required that provides a guarantee to help failed
innovation while setting the right incentives.

24
References
Agarwal, R. and D. Audretsch (2001). “Does Entry size Matter? The Impact of Life Cycle and
Technology on Firm Survival,” Journal of Industrial Economics 49(1), 21-43.
Alvarez, R. and S. Vergara (2010). “Exit in Developing Countries: Economic Reforms and Plant
Heterogeneity,” Economic Development and Cultural Change 58(3), 537-561.
Audretsch, D. (1991). “New-Firm Survival and the Technological Regime,” Review of
Economics and Statistics 73(3), 441-450.
Audretsch, D. (1995). “Innovation, Growth and Survival,” International Journal of Industrial
Organization 13(4), 441-457.
Audretsch, D. and T. Mahmood (1995). “New Firm Survival: New Results Using a Hazard
Function,” Review of Economics and Statistics 77(1), 97-103.
Bandick R. and H. Görg (2010). “Foreign Acquisition, Plant Survival, and employment Growth,”
Canadian journal of Economics 43(2), 547-573.
Bernard, A. and J. Jensen (2007). “Firm Structure, Multinationals, and Manufacturing Plant
Deaths,” Review of Economics and Statistics 89(2), 193-204.
Bernard, A., Redding, S. and P. Schott (2009). “Products and Productivity,” Scandinavian
Journal of Economics 111(4), 681-709.
Bernard, A., Redding, S. and P. Schott (2010). “Multi-Product Firms and Product Switching,”
American Economic Review 100(1), 70-97.
Brenton, P., Saborowski, C., and E. von Uexkull (2010). “What Explains the Low Survival Rate
of Developing Country Export Flows?” World Bank Economic Review 24(3), 474-499.
Breslow, N. (1974). “Covariance Analysis of Censored Survival Data,” Biometrics 30(1), 89-99.
Boschma, R., Minondo, A., and M. Navarro (2012). “Related variety and regional growth in
Spain,” Papers in Regional Science forthcoming.
Buchinsky, M. (1998). “Recent Advances in Quantile Regression Models: A Practical Guideline
for Empirical Research,” Journal of Human Resources 33(1), 88-125.
Caves, R. (1998). “Industrial Organization and New Findings on the Turnover and Mobility of
Firms,” Journal of Economic Literature 36(4), 1947-1982.
Cefis, O. and E. Marsili (2006). “Survivor: The Role of Innovation in Firms‟ Survival,” Research
Policy 35(5), 626-641.
Chen, M. (2002). “Survival Duration of Plants: Evidence from the US Petroleum Refining
Industry,” International Journal of Industrial Organization 20(4), 517-555.
Coad, A. and R. Rao (2008). “Innovation and Firm Growth in High-Tech Sectors: A Quantile
Regression Approach,” Research Policy 37(4), 633-648.
Cox, D. (1972). “Regression Models and Life Tables,” Journal of the Royal Statistical Society
34(2), 187-220.
Cox, D. and Oakes (1984). Analysis of Survival Data. London: Chapman & Hall/CRC.
25
Crépon, B., Duguet, E. and J. Mairesse (1998). “Research, Innovation, and Productivity: An
Econometric Analysis at the Firm Level,” Economics of Innovation and New Technology 7(2),
115-158.
Crespi, G. and P. Zuniga (2012). “Innovation and Productivity: Evidence from Six Latin
American Countries,” World Development 40(2), 273-290.
Disney, R., Haskel, J., and Y. Heden (2003). “Entry, Exit and Establishment Survival in UK
Manufacturing,” Journal of Industrial Economics 51(1), 91-112.
Doms, M., Dunne, T., and M. Roberts (1995). “The Role of Technology Use in the Survival and
Growth of Manufacturing Plants,” International Journal of Industrial Organization 13(4), 523-
542.
Dunne, T., Roberts, M.J. and L. Samuelson (1989). “The Growth and Failure of U.S.
Manufacturing Plants,” Quarterly Journal of Economics, 104(4), 671-698.
Ericson, R. and A. Pakes (1995). “Markov-Perfect Industry Dynamics: A Framework for
Empirical Work,” Review of Economic Studies 62(1), 53-82.
Eslava, M., Haltiwanger, J., Kugler A. and M. Kugler. (2009) “Trade Reforms and Market
Selection: Evidence from Manufacturing Plants in Colombia,” NBER Working Paper 14935.
Esteve Pérez, S., Llopis, A., and J. Llopis (2004). “The Determinants of Survival of Spanish
Manufacturing Firms,” Review of Industrial Organization 25(3), 251-273.
Esteve-Pérez, S., Requena-Silvente, F., and V. Pallardó-Lopez (2012). “The Duration of Firm-
Destination Export Relationships: Evidence from Spain 1997-2006,” Economic Inquiry
forthcoming.
Fernandes, A. and C. Paunov (2009). “Does Tougher Import Competition Foster Product Quality
Upgrading?,” World Bank Policy Research Working Paper 4894.
Fernandes, A. and C. Paunov (2012). “Foreign Direct Investment in Services and Manufacturing
Productivity Growth: Evidence for Chile,” Journal of Development Economics 97(2), 305-321.
Girma, S., Görg, H., and E. Strobl (2007). “The Effects of Government Grants on Plant Survival:
A Micro-Econometric Analysis,” International Journal of Industrial Organization 25(4), 701-720.
Gourville, J. (2006). “The Curse of Innovation: A Theory of Why Innovative New Products Fail
in the Marketplace,” Harvard Business School Marketing Research Papers No. 05-06.
Hall, B. H. (1987). “The Relationship between Firm Size and Firm Growth in the US
Manufacturing Sector,” Journal of Industrial Economics 35(4), 583–605.
Hausmann, R., Hwang, J. and D. Rodrik (2007). “What you Export Matters,” Journal of
Economic Growth 12(1), 1-25.
Heckman, J. and Singer (1984). “The Identifiability of the Proportional Hazard Model,” Review
of Economic Studies 51(2), 231-241.
Hess, W. and M. Persson (2011). “Exploring the Duration of EU Imports,” Review of World
Economics 147(4), 665-692.

26
Hess, W. and M. Persson (2012). “The Duration of Trade Revisited: Continuous-Time vs.
Discrete-Time Hazards,” Empirical Economics forthcoming.
Hidalgo C., Klinger B., Barabási A., and R. Hausmann (2007). “The Product Space Conditions
the Development of Nations,” Science 317(5837) 482–487.
Hopenhayn, H. (1992). “Entry, Exit, and Firm Dynamics in Long Run Equilibrium,”
Econometrica 60(5), 1127-1150.
Hosmer, D., Lemeshow, S., and S. May (2008). Applied Survival Analysis: Regression Modeling
of Time to Event Data, Wiley Series in Probability and Statistics. New Jersey.
Jarreau, J. and S. Poncet (2012). “Export Sophistication and Economic Growth: Evidence from
China,” Journal of development Economics 97(2), 281-292.
Jenkins, S. (1995). “Easy Estimation Methods for Discrete-Time Duration Models,” Oxford
Bulletin of Economics and Statistics 57(1), 129-38.
Jovanovic, B. (1982). “Selection and the Evolution of Industry,” Econometrica 50(3), 649-670.
Kasahara, H. and J. Rodrigue (2008). “Does the Use of Imported Intermediates Increase
Productivity? Plant-Level Evidence,” Journal of Development Economics 87(1), 106-118.
Kiefer, N. (1988). “Economic Duration Data and Hazard Functions,” Journal of Economic
Literature 26(2), 646-679.
Klein, J. P. and M. L. L. Moeschberger. (1997). Survival Analysis. Techniques for Censored and
Truncated Data. New York: Springer.
Koenker, R. and G. Bassett (1978). “Regression Quantiles,” Econometrica 46(1), 33-50.
Koenker, R. and K. Hallock (2001). “Quantile Regression,” Journal of Economic Perspectives
15(4), 143-156.
Lopez, R. (2006). “Imports of Intermediate Inputs and Plant Survival,” Economics Letters 92(1),
58-62.
Love, J., Roper, S., and J. Du (2009). “Innovation, Ownership and Profitability,” International
Journal of Industrial Organization 27(3), 424-434.
Mairesse, J. and P. Mohnen (2010). “Using Innovation Surveys for Econometric Analysis,”
NBER Working Paper Number 15857.
Mairesse, P., Mohnen, P., and M. Dagenais (2006). “Innovativity: a Comparison across Seven
European Countries,” Economics of Innovation and New Technology 15(4), 391-413.
Manjon-Antolin, M. and J. Arauzo-Carod (2008). “Firm Survival: Methods and Evidence,”
Empirica 35(1), 1-24.
Mata, J. and P. Portugal (1994). “Life Duration of New Firms,” Journal of Industrial Economics
42(3), 227-245.
McCall, B. (1994). “Testing the Proportional Hazards Assumption in the Presence of
Unmeasured Heterogeneity,” Journal of Applied Econometrics 9(3), 321-334.
27
Navarro, L. (2012). “Plant Level Evidence on Product Mix Changes in Chilean Manufacturing,”
Journal of International Trade and Economic Development 21(2) 165-195.
OECD-Eurostat (2005). Oslo Manual: Guidelines for Collecting and Interpreting Innovation
Data. Third Edition. OECD, Paris and Eurostat, Luxembourg.
OECD (2009). Policy Responses to the Economic Crisis: Investing in Innovation for Long-Term
Growth. OECD, Paris.
OECD (forthcoming). Innovation in the Crisis and Beyond, Chapter 1 in OECD Science,
Technology and Industry Outlook 2012, OECD (ed.).
Paunov, C. (2011). “Imports, Innovation and Employment after Crisis - Evidence from a
Developing Country,” OECD Science, Technology and Industry Working Paper N° 2011/05.
Paunov, C. (2012), “The Global Crisis and Firms‟ Investments in Innovation”, Research Policy
41(1), 24-35.
Prentice, R. and L. Gloeker (1978). “Regression Analysis of Grouped Survival Data with
Application to Breast Cancer Data,” Biometrics 34(1), 57-67.
Puga, D. and D. Trefler (2010). “Wake Up and Smell the Ginseng: International Trade and the
Rise of Incremental Innovation in Low-Wage Countries,” Journal of Development Economics
91(1), 64-76.
Salvanes, K. and R. Tveteras (2004). “Plant Exit, Vintage Capital and the Business Cycle,”
Journal of Industrial Economics 52(2), 255-276.
Shiferaw, A. (2009). “Survival of Private Sector Manufacturing Establishments in Africa: The
Role of Productivity and Ownership,” World Development 37(3), 572-584.
Strotmann, H. (2007). “Entrepreneurial Survival,” Small Business Economics 28(1), 87–104.
Sueyoshi, G. 91995). “A Class of Binary Response Models for Grouped Duration Data,” Journal
of Applied Econometrics 10(4), 411-431.
Tybout, J. (2000). “Manufacturing Firms in Developing Countries: How Well Do They Do, and
Why?,” Journal of Economic Literature 38(1), 11-44.
van den Berg, G. (2011). “Duration Models: Specification, Identification, and Multiple
Durations,” in J. Heckman and E. Leamer (Eds.) Handbook of Econometrics vol. 5 (pp. 3381-
3460). Amsterdam: North-Holland
Zhang, M. and P. Mohnen (2011). “Innovation and Survival of New Firms in Chinese
Manufacturing, 2000-2006,” UNU-MERIT mimeo.

28
Figure 1: Kaplan-Meier Survival Estimates
0.00
0.10
0.20
0.30
0.40
0.50
0.60
0.70
0.80
0.90
1.00
1 2 3 4 5 6 7 8 9 10 11 12 13 14 15 16 17 18 19 20 21 22 23 24 25
Non-Innovators Innovators
Number of Years
Pro
po
rti
on
Su
rv
ivin
g
Notes: the number of years in the X-axis designates age categories: our sample includes plants that range in age from
1 to 25 years old (where age is measured relative to 1979). The graph assesses for each age category what is the
probability of survival for innovators and for non-innovators (defined year by year).

29
Figure 2. Quantile Regressions – Innovators
2.A Labor Productivity
0
0.01
0.02
0.03
0.04
0.05
0.06
0.07
5 15 25 35 45 55 65 75 85 95
2.B Employment Growth, Sales Growth, and Profit Rates
0.00
0.01
0.02
0.03
0.04
0.05
0.06
0.07
5 15 25 35 45 55 65 75 85 95
Profit Rate Employment Growth Sales Growth
Notes: the figures show the coefficients from quantile regressions of labor productivity (Panel A) and employment
growth, sales growth, and profits rates (Panel B) on a dummy identifying innovators over the sample period for each
percentile ranging from the 5th
to the 95th
. The quantile regressions control for 4-digit industry, region, and year fixed
effects.

30
Figure 3. Quantile Regressions – Multi-Product and Single-Product Innovators
3.A Labor Productivity
-0.1
-0.05
0
0.05
0.1
0.15
5 10 15 20 25 30 35 40 45 50 55 60 65 70 75 80 85 90 95
Productivity Multi Productivity Single
3.B Employment Growth
-0.1
-0.05
0
0.05
0.1
0.15
5 10 15 20 25 30 35 40 45 50 55 60 65 70 75 80 85 90 95
Employment Growth Multi Employment Growth Single
3.C Sales Growth
-0.1
-0.05
0
0.05
0.1
0.15
5 10 15 20 25 30 35 40 45 50 55 60 65 70 75 80 85 90 95
Sales Growth Multi Sales Growth Single
3.D Profit Rates
-0.1
-0.05
0
0.05
0.1
0.15
5 10 15 20 25 30 35 40 45 50 55 60 65 70 75 80 85 90 95
Profit Rates Multi Profit Rates Single
Notes: the figures show the coefficients from quantile regressions of labor productivity (Panel A), employment
growth (Panel B), sales growth (Panel C), and profits rates (Panel D) on dummies identifying multi-product
innovators and single-product innovators for each percentile ranging from the 5th
to the 95th. The quantile regressions
control for 4-digit industry, region, and year fixed effects.
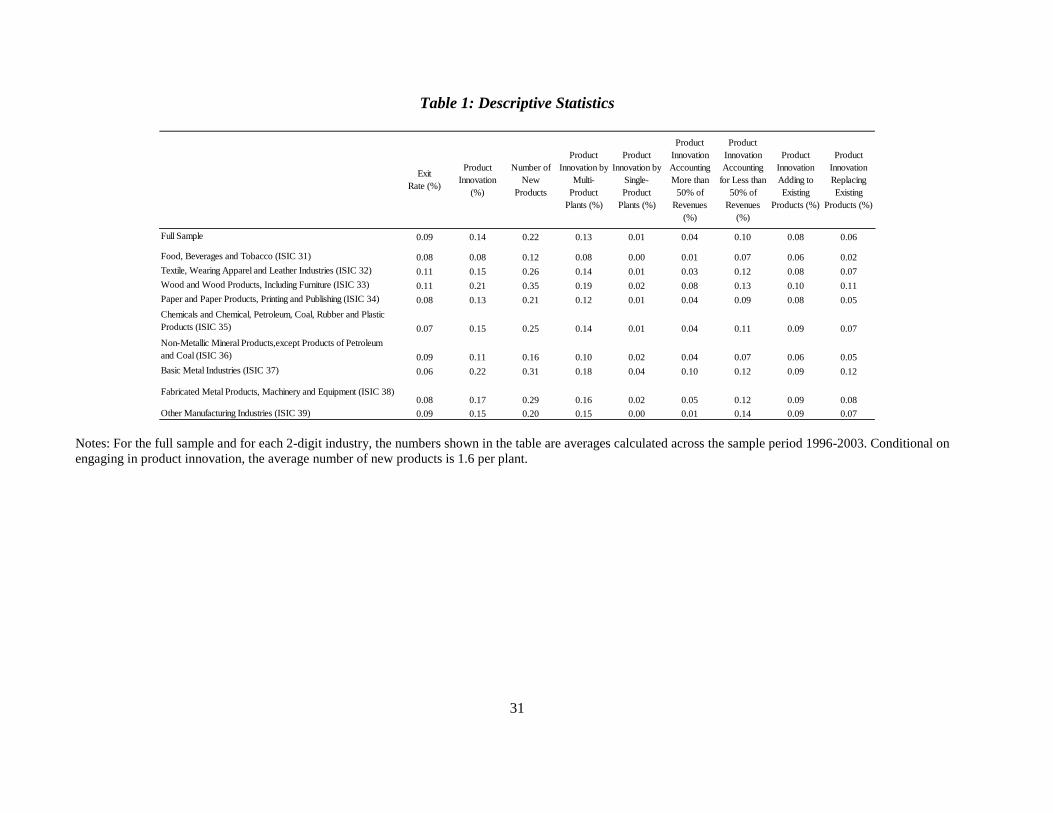
31
Table 1: Descriptive Statistics
Exit
Rate (%)
Product
Innovation
(%)
Number of
New
Products
Product
Innovation by
Multi-
Product
Plants (%)
Product
Innovation by
Single-
Product
Plants (%)
Product
Innovation
Accounting
More than
50% of
Revenues
(%)
Product
Innovation
Accounting
for Less than
50% of
Revenues
(%)
Product
Innovation
Adding to
Existing
Products (%)
Product
Innovation
Replacing
Existing
Products (%)
Full Sample 0.09 0.14 0.22 0.13 0.01 0.04 0.10 0.08 0.06
Food, Beverages and Tobacco (ISIC 31) 0.08 0.08 0.12 0.08 0.00 0.01 0.07 0.06 0.02
Textile, Wearing Apparel and Leather Industries (ISIC 32) 0.11 0.15 0.26 0.14 0.01 0.03 0.12 0.08 0.07
Wood and Wood Products, Including Furniture (ISIC 33) 0.11 0.21 0.35 0.19 0.02 0.08 0.13 0.10 0.11
Paper and Paper Products, Printing and Publishing (ISIC 34) 0.08 0.13 0.21 0.12 0.01 0.04 0.09 0.08 0.05
Chemicals and Chemical, Petroleum, Coal, Rubber and Plastic
Products (ISIC 35) 0.07 0.15 0.25 0.14 0.01 0.04 0.11 0.09 0.07
Non-Metallic Mineral Products,except Products of Petroleum
and Coal (ISIC 36) 0.09 0.11 0.16 0.10 0.02 0.04 0.07 0.06 0.05
Basic Metal Industries (ISIC 37) 0.06 0.22 0.31 0.18 0.04 0.10 0.12 0.09 0.12
Fabricated Metal Products, Machinery and Equipment (ISIC 38)0.08 0.17 0.29 0.16 0.02 0.05 0.12 0.09 0.08
Other Manufacturing Industries (ISIC 39) 0.09 0.15 0.20 0.15 0.00 0.01 0.14 0.09 0.07
Notes: For the full sample and for each 2-digit industry, the numbers shown in the table are averages calculated across the sample period 1996-2003. Conditional on
engaging in product innovation, the average number of new products is 1.6 per plant.

32
Table 2: Regressions of Plant Performance on Innovation
Plant Labor
Productivity
Plant
Employment
Growth
Plant Sales
Growth
Plant Profit
Rates
Plant Export
Status
(1) (2) (3) (4) (5)
Innovator 0.037*** 0.013*** 0.021*** 0.007* 0.055***
(0.010) (0.004) (0.006) (0.004) (0.006)
4-digit Industry Fixed Effects Yes Yes Yes Yes Yes
Region Fixed Effects Yes Yes Yes Yes Yes
Year Fixed Effects Yes Yes Yes Yes Yes
Observations 18,529 19,846 19,623 20,400 21,381
R-squared 0.31 0.01 0.02 0.06 0.22
OLS Estimation
Notes: Robust standard errors in parentheses. *, **, and *** indicate significance at 10%, 5%, and 1% confidence
levels, respectively. Innovators are defined as plants that innovate in any sample year.

33
Table 3: Baseline Results on Innovation and Survival
Cloglog Probit Logit Cloglog Probit Logit
(1) (2) (3) (4) (5) (6)
Product Innovation -0.215*** -0.135*** -0.240**
(0.078) (0.051) (0.094)
Number of New Products -0.100** -0.062** -0.113**
(0.039) (0.025) (0.046)
Plant Controls
Plant Sales Growth -0.131 -0.442*** -0.841*** -0.125 -0.442*** -0.841***
(0.166) (0.042) (0.076) (0.166) (0.042) (0.076)
Plant Capital Intensity -0.0683*** -0.052*** -0.092*** -0.0692*** -0.052*** -0.092***
(0.020) (0.015) (0.028) (0.021) (0.015) (0.028)
Multi-Plant -3.092*** -0.673*** -1.295*** -3.099*** -0.673*** -1.296***
(0.644) (0.111) (0.207) (0.645) (0.111) (0.207)
Plant Size -0.979*** -0.847*** -1.528*** -0.990*** -0.848*** -1.531***
(0.144) (0.109) (0.194) (0.144) (0.109) (0.194)
Plant Size Squared 0.107*** 0.077*** 0.138*** 0.108*** 0.077*** 0.138***
(0.017) (0.013) (0.023) (0.017) (0.013) (0.023)
Plant Initial Size 0.164*** 0.117*** 0.211*** 0.167*** 0.117*** 0.212***
(0.059) (0.043) (0.078) (0.059) (0.043) (0.078)
Industry Controls
Industry Sales Growth -0.031 -0.040 -0.058 -0.034 -0.041 -0.060
(0.084) (0.054) (0.099) (0.084) (0.054) (0.099)
Industry Average Innovation 0.687** 0.475** 0.848** 0.652** 0.444** 0.800**
(0.315) (0.208) (0.379) (0.313) (0.206) (0.377)
Industry Herfindahl Index -0.574 -0.413 -0.778 -0.582 -0.413 -0.780
(0.530) (0.361) (0.659) (0.531) (0.361) (0.659)
Industry Herfindahl Index Squared 0.749 0.541 1.014 0.753 0.537 1.011
(0.658) (0.448) (0.816) (0.659) (0.448) (0.817)
4-Digit Industry Fixed Effects Yes Yes Yes Yes Yes Yes
Region Fixed Effects Yes Yes Yes Yes Yes Yes
Year Fixed Effects Yes Yes Yes Yes Yes Yes
Observations 19,439 19,439 19,439 19,439 19,439 19,439
Log-Likelihood -5,498 -5,537 -5,532 -5,498 -5,538 -5,533
Estimations using Hazard Models with Plant Random Effects
Notes: Robust standard errors in parentheses. *, **, and *** indicate significance at 10%, 5%, and 1% confidence
levels, respectively. The table shows marginal effects from the various specifications. The regressors are defined in
Appendix Table 1.

34
Table 4: Robustness Results on Innovation and Survival
Cox OLS OLS FE Weibull Cox OLS OLS FE Weibull
(1) (2) (3) (4) (5) (6) (7) (8)
Product Innovation -0.198*** -0.014** -0.013* -0.177**
(0.073) (0.006) (0.007) (0.073)
Number of New Products -0.091** -0.006** -0.007** -0.081**
(0.040) (0.003) (0.004) (0.039)
4-Digit Industry Fixed Effects Yes Yes Yes Yes Yes Yes
Region Fixed Effects Yes Yes Yes Yes Yes Yes
Year Fixed Effects Yes Yes Yes Yes Yes Yes
Observations 19,439 19,439 19,439 19,439 19,439 19,439 19,439 19,439
Log-Pseudolikelihood -11,746 -1,797 -11,746 -1,797
Estimations using Alternative Methods
Notes: Robust standard errors in parentheses. *, **, and *** indicate significance at 10%, 5%, and 1% confidence
levels, respectively. The table shows coefficients from the various specifications. The innovation regressors are
defined in Appendix Table 1. The specifications include also the plant controls and industry controls shown in Table
3.
=

35
Table 5: Results on Characterization of Innovation and Survival
Cloglog Probit Logit Cloglog Probit Logit Cloglog Probit Logit
(1) (2) (3) (4) (5) (6) (7) (8) (9)
Product Innovation * Exported -0.623** -0.756** -0.403***
(0.257) (0.294) (0.152)
Product Innovation * Non-Exported -0.175** -0.186* -0.104**
(0.080) (0.097) (0.053)
Product Innovation * Prior Investments in Machinery -0.434*** -0.225*** -0.427***
(0.108) (0.066) (0.124)
Product Innovation * No Prior Investments in Machinery 0.0124 -0.017 -0.016
(0.110) (0.075) (0.136)
Product Innovation * Imported Intermediate Inputs -0.566*** -0.336*** -0.647***
(0.192) (0.112) (0.216)
Product Innovation * No Imported Intermediate Inputs -0.142* -0.085 -0.147
(0.083) (0.056) (0.101)
4-Digit Industry Fixed Effects Yes Yes Yes Yes Yes Yes Yes Yes Yes
Region Fixed Effects Yes Yes Yes Yes Yes Yes Yes Yes Yes
Year Fixed Effects Yes Yes Yes Yes Yes Yes Yes Yes Yes
P-Value for Difference in Product Innovation Marginal
Effects0.09 0.06 0.06 0.00 0.03 0.02 0.04 0.04 0.03
Observations 19,439 19,439 19,439 19,216 19,216 19,216 19,439 19,439 19,439
Log-Likelihood -5,496 -5,535 -5,530 -5,333 -5,373 -5,369 -5,495 -5,535 -5,530
Estimations using Hazard Models with Plant Random Effects
Notes: Robust standard errors in parentheses. *, **, and *** indicate significance at 10%, 5%, and 1% confidence
levels, respectively. The table shows marginal effects from the various specifications. The innovation regressors are
defined in Appendix Table 1. The specifications include also the plant controls and industry controls shown in Table
3. The p-value shown in each column tests the null hypothesis that the difference in the marginal effects of the two
innovation variables included as regressors in the column is statistically insignificant.
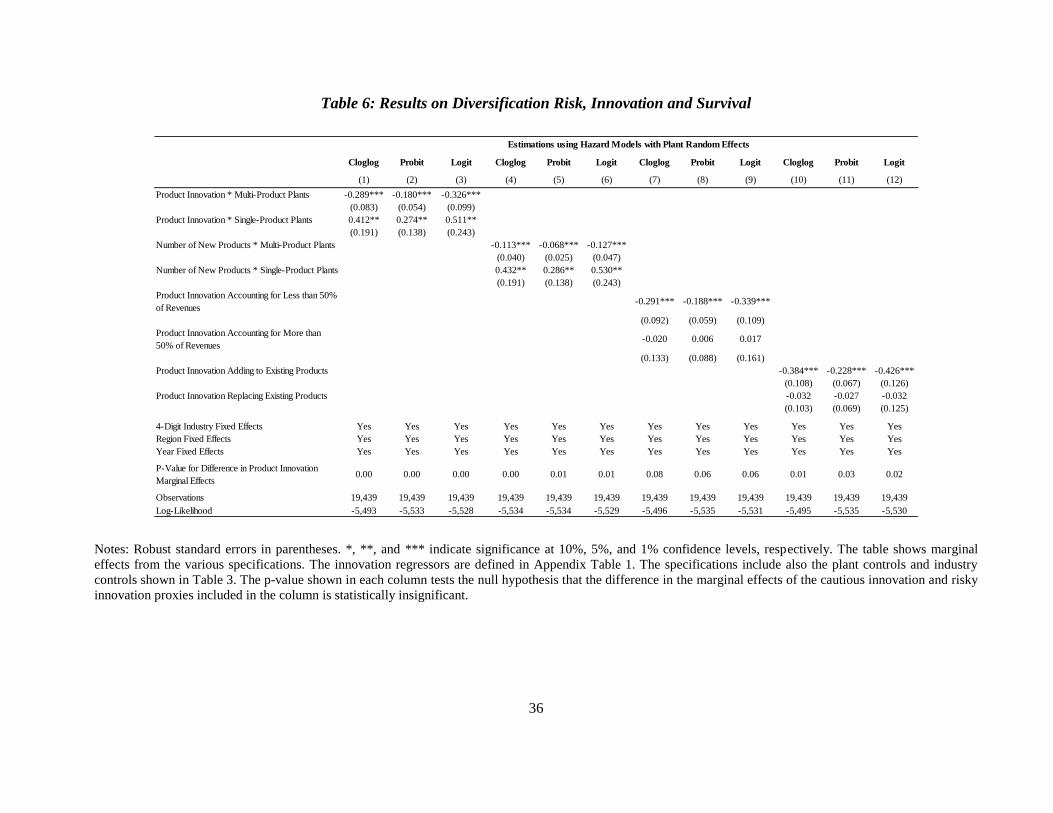
36
Table 6: Results on Diversification Risk, Innovation and Survival
Cloglog Probit Logit Cloglog Probit Logit Cloglog Probit Logit Cloglog Probit Logit
(1) (2) (3) (4) (5) (6) (7) (8) (9) (10) (11) (12)
Product Innovation * Multi-Product Plants -0.289*** -0.180*** -0.326***
(0.083) (0.054) (0.099)
Product Innovation * Single-Product Plants 0.412** 0.274** 0.511**
(0.191) (0.138) (0.243)
Number of New Products * Multi-Product Plants -0.113*** -0.068*** -0.127***
(0.040) (0.025) (0.047)
Number of New Products * Single-Product Plants 0.432** 0.286** 0.530**
(0.191) (0.138) (0.243)
Product Innovation Accounting for Less than 50%
of Revenues-0.291*** -0.188*** -0.339***
(0.092) (0.059) (0.109)
Product Innovation Accounting for More than
50% of Revenues-0.020 0.006 0.017
(0.133) (0.088) (0.161)
Product Innovation Adding to Existing Products -0.384*** -0.228*** -0.426***
(0.108) (0.067) (0.126)
Product Innovation Replacing Existing Products -0.032 -0.027 -0.032
(0.103) (0.069) (0.125)
4-Digit Industry Fixed Effects Yes Yes Yes Yes Yes Yes Yes Yes Yes Yes Yes Yes
Region Fixed Effects Yes Yes Yes Yes Yes Yes Yes Yes Yes Yes Yes Yes
Year Fixed Effects Yes Yes Yes Yes Yes Yes Yes Yes Yes Yes Yes Yes
P-Value for Difference in Product Innovation
Marginal Effects0.00 0.00 0.00 0.00 0.01 0.01 0.08 0.06 0.06 0.01 0.03 0.02
Observations 19,439 19,439 19,439 19,439 19,439 19,439 19,439 19,439 19,439 19,439 19,439 19,439
Log-Likelihood -5,493 -5,533 -5,528 -5,534 -5,534 -5,529 -5,496 -5,535 -5,531 -5,495 -5,535 -5,530
Estimations using Hazard Models with Plant Random Effects
Notes: Robust standard errors in parentheses. *, **, and *** indicate significance at 10%, 5%, and 1% confidence levels, respectively. The table shows marginal
effects from the various specifications. The innovation regressors are defined in Appendix Table 1. The specifications include also the plant controls and industry
controls shown in Table 3. The p-value shown in each column tests the null hypothesis that the difference in the marginal effects of the cautious innovation and risky
innovation proxies included in the column is statistically insignificant.

37
Table 7: Results on Technical Risk, Innovation and Survival
Cloglog Probit Logit Cloglog Probit Logit Cloglog Probit Logit Cloglog Probit Logit
(1) (2) (3) (4) (5) (6) (7) (8) (9) (10) (11) (12)
Product Innovation in a New 6-Digit Industry -0.127 -0.113 -0.181
(0.163) (0.106) (0.194)
Product Innovation in an Old 6-Digit Industry -0.235*** -0.140** -0.254**
(0.085) (0.056) (0.102)
Product Innovation Closer to Past Plant Expertize -0.269* -0.159* -0.280*
(0.146) (0.093) (0.170)
Product Innovation More Distant from Past Plant Expertize -0.244 -0.184* -0.316*
(0.153) (0.097) (0.179)
Product Innovation New to Chile -0.564* -0.374** -0.675**
(0.298) (0.176) (0.336)
Product Innovation Not New to Chile -0.190** -0.116** -0.207**
(0.080) (0.052) (0.096)
Product Innovations More Sophisticated -0.187 -0.108 -0.195
(0.137) (0.086) (0.160)
Product Innovations Less Sophisticated -0.307** -0.195** -0.349**
(0.143) (0.090) (0.167)
4-Digit Industry Fixed Effects Yes Yes Yes Yes Yes Yes Yes Yes Yes Yes Yes Yes
Region Fixed Effects Yes Yes Yes Yes Yes Yes Yes Yes Yes Yes Yes Yes
Year Fixed Effects Yes Yes Yes Yes Yes Yes Yes Yes Yes Yes Yes Yes
P-Value for Difference in Product Innovation Marginal Effects 0.54 0.82 0.73 0.91 0.84 0.88 0.22 0.15 0.17 0.53 0.47 0.49
Observations 19,439 19,439 19,439 18,029 18,029 18,029 19,439 19,439 19,439 18,271 18,271 18,271
Log-Likelihood -5,498 -5,537 -5,532 -5,120 -5,159 -5,154 -5,497 -5,536 -5,531 -5,180 -5,223 -5,217
Estimations using Hazard Models with Plant Random Effects
Notes: Robust standard errors in parentheses. *, **, and *** indicate significance at 10%, 5%, and 1% confidence levels, respectively. The table shows marginal
effects from the various specifications. The innovation regressors are defined in Appendix Table 1. The specifications include also the plant controls and industry
controls shown in Table 3. The p-value shown in each column tests the null hypothesis that the difference in the marginal effects of the cautious innovation and risky
innovation proxies included in the column is statistically insignificant.

38
Table 8: Results on Market Risk, Innovation and Survival
Cloglog Probit Logit Cloglog Probit Logit Cloglog Probit Logit Cloglog Probit Logit
(1) (2) (3) (4) (5) (6) (7) (8) (9) (10) (11) (12)
Innovation with Few Competitor Innovators -0.232** -0.145** -0.255**
(0.094) (0.061) (0.111)
Innovation with Many Competitor Innovators 0.121 0.071 0.136
(0.145) (0.097) (0.173)
Price of New Product Above the Median -0.026 -0.014 -0.015
(0.116) (0.074) (0.135)
Price of New Product Below the Median -0.324*** -0.197** -0.359**
(0.126) (0.078) (0.145)
Product Innovation Introduced in Non-1999 Crisis -0.216*** -0.132** -0.235**
(0.083) (0.055) (0.101)
Product Innovation Introducing During 1999 Crisis -0.204 -0.153 -0.271
(0.201) (0.123) (0.231)
Innovation in Industry with Larger Sales Volatility -0.110 -0.040 -0.080
(0.103) (0.068) (0.124)
Innovation in Industry with Smaller Sales Volatility -0.332*** -0.240*** -0.418***
(0.114) (0.074) (0.136)
4-Digit Industry Fixed Effects Yes Yes Yes Yes Yes Yes Yes Yes Yes Yes Yes Yes
Region Fixed Effects Yes Yes Yes Yes Yes Yes Yes Yes Yes Yes Yes Yes
Year Fixed Effects Yes Yes Yes Yes Yes Yes Yes Yes Yes Yes Yes Yes
P-Value for Difference in Product Innovation
Marginal Effects0.05 0.07 0.07 0.10 0.11 0.10 0.96 0.87 0.88 0.14 0.04 0.06
Observations 15,887 15,887 15,887 16,002 16,002 16,002 19,439 19,439 19,439 19,439 19,439 19,439
Log-Likelihood -4,507 -4,539 -4,535 -4,521 -4,548 -4,543 -5,498 -5,537 -5,532 -5,497 -5,535 -5,531
Estimations using Hazard Models with Plant Random Effects
Notes: Robust standard errors in parentheses. *, **, and *** indicate significance at 10%, 5%, and 1% confidence levels, respectively. The table shows marginal
effects from the various specifications. The innovation regressors are defined in Appendix Table 1. The specifications include also the plant controls and industry
controls shown in Table 3. The p-value shown in each column tests the null hypothesis that the difference in the marginal effects of the cautious innovation and risky
innovation proxies included in the column is statistically insignificant.
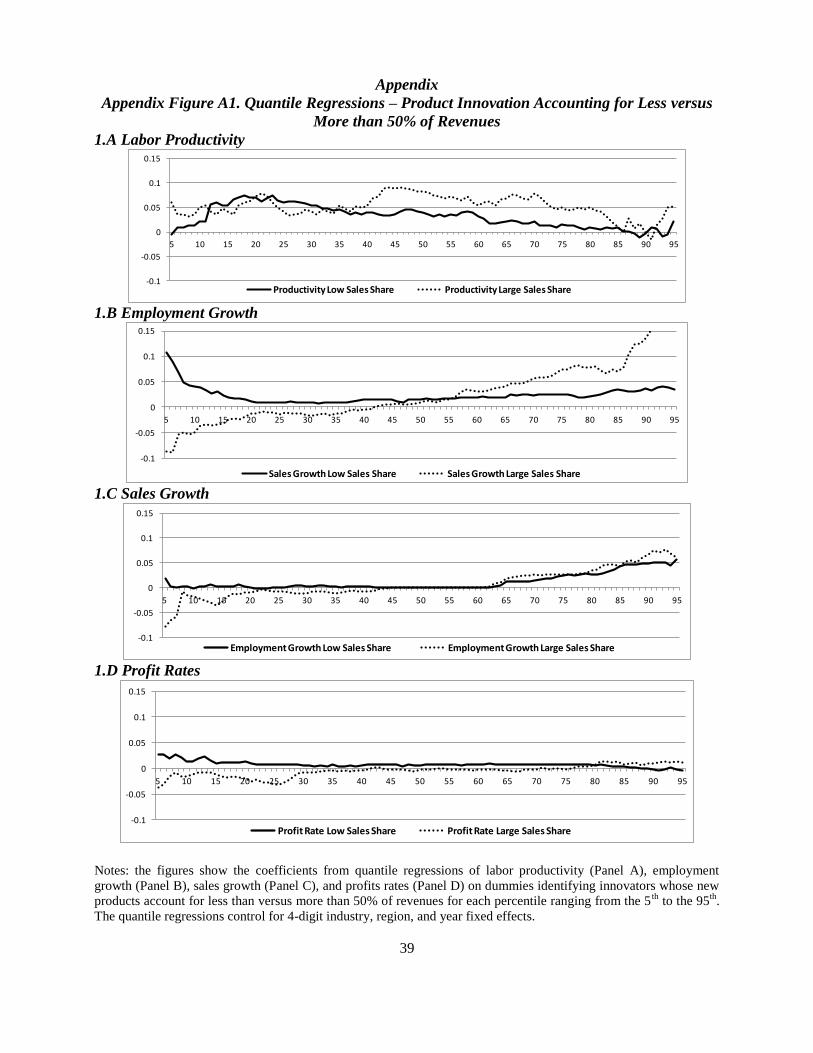
39
Appendix
Appendix Figure A1. Quantile Regressions – Product Innovation Accounting for Less versus
More than 50% of Revenues
1.A Labor Productivity
-0.1
-0.05
0
0.05
0.1
0.15
5 10 15 20 25 30 35 40 45 50 55 60 65 70 75 80 85 90 95
Productivity Low Sales Share Productivity Large Sales Share
1.B Employment Growth
-0.1
-0.05
0
0.05
0.1
0.15
5 10 15 20 25 30 35 40 45 50 55 60 65 70 75 80 85 90 95
Sales Growth Low Sales Share Sales Growth Large Sales Share 1.C Sales Growth
-0.1
-0.05
0
0.05
0.1
0.15
5 10 15 20 25 30 35 40 45 50 55 60 65 70 75 80 85 90 95
Employment Growth Low Sales Share Employment Growth Large Sales Share
1.D Profit Rates
-0.1
-0.05
0
0.05
0.1
0.15
5 10 15 20 25 30 35 40 45 50 55 60 65 70 75 80 85 90 95
Profit Rate Low Sales Share Profit Rate Large Sales Share
Notes: the figures show the coefficients from quantile regressions of labor productivity (Panel A), employment
growth (Panel B), sales growth (Panel C), and profits rates (Panel D) on dummies identifying innovators whose new
products account for less than versus more than 50% of revenues for each percentile ranging from the 5th
to the 95th
.
The quantile regressions control for 4-digit industry, region, and year fixed effects.
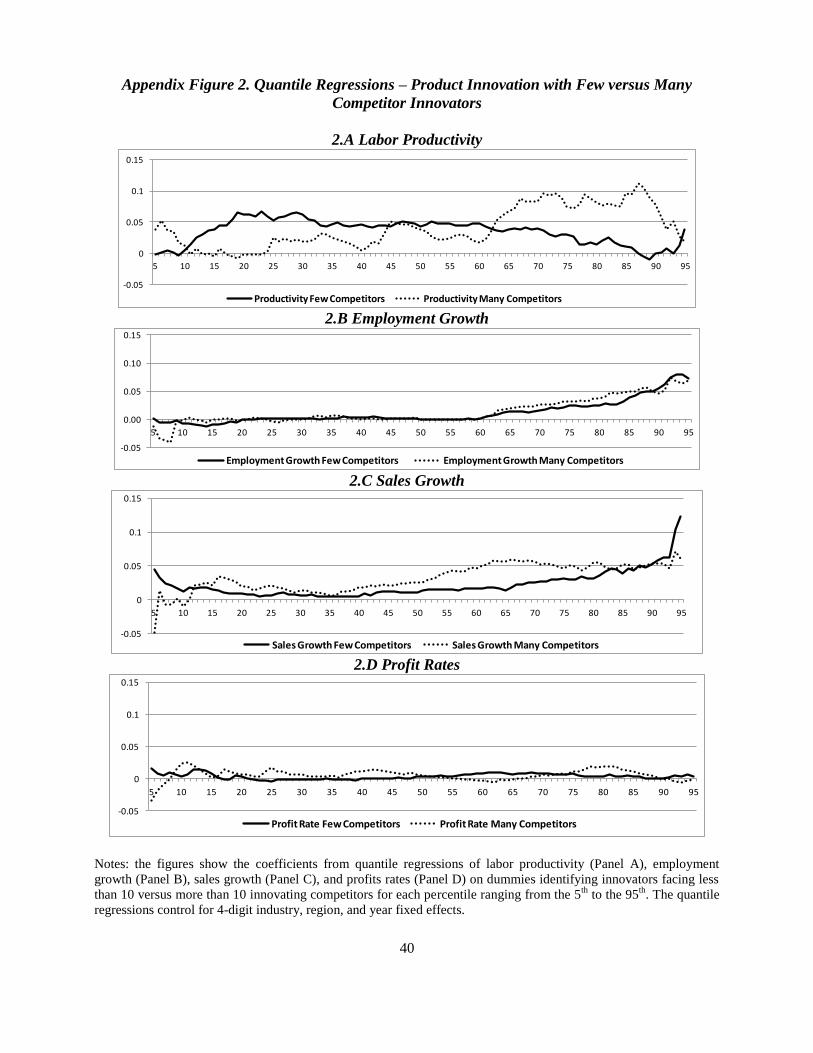
40
Appendix Figure 2. Quantile Regressions – Product Innovation with Few versus Many
Competitor Innovators
2.A Labor Productivity
-0.05
0
0.05
0.1
0.15
5 10 15 20 25 30 35 40 45 50 55 60 65 70 75 80 85 90 95
Productivity Few Competitors Productivity Many Competitors 2.B Employment Growth
-0.05
0.00
0.05
0.10
0.15
5 10 15 20 25 30 35 40 45 50 55 60 65 70 75 80 85 90 95
Employment Growth Few Competitors Employment Growth Many Competitors 2.C Sales Growth
-0.05
0
0.05
0.1
0.15
5 10 15 20 25 30 35 40 45 50 55 60 65 70 75 80 85 90 95
Sales Growth Few Competitors Sales Growth Many Competitors 2.D Profit Rates
-0.05
0
0.05
0.1
0.15
5 10 15 20 25 30 35 40 45 50 55 60 65 70 75 80 85 90 95
Profit Rate Few Competitors Profit Rate Many Competitors
Notes: the figures show the coefficients from quantile regressions of labor productivity (Panel A), employment
growth (Panel B), sales growth (Panel C), and profits rates (Panel D) on dummies identifying innovators facing less
than 10 versus more than 10 innovating competitors for each percentile ranging from the 5th
to the 95th
. The quantile
regressions control for 4-digit industry, region, and year fixed effects.
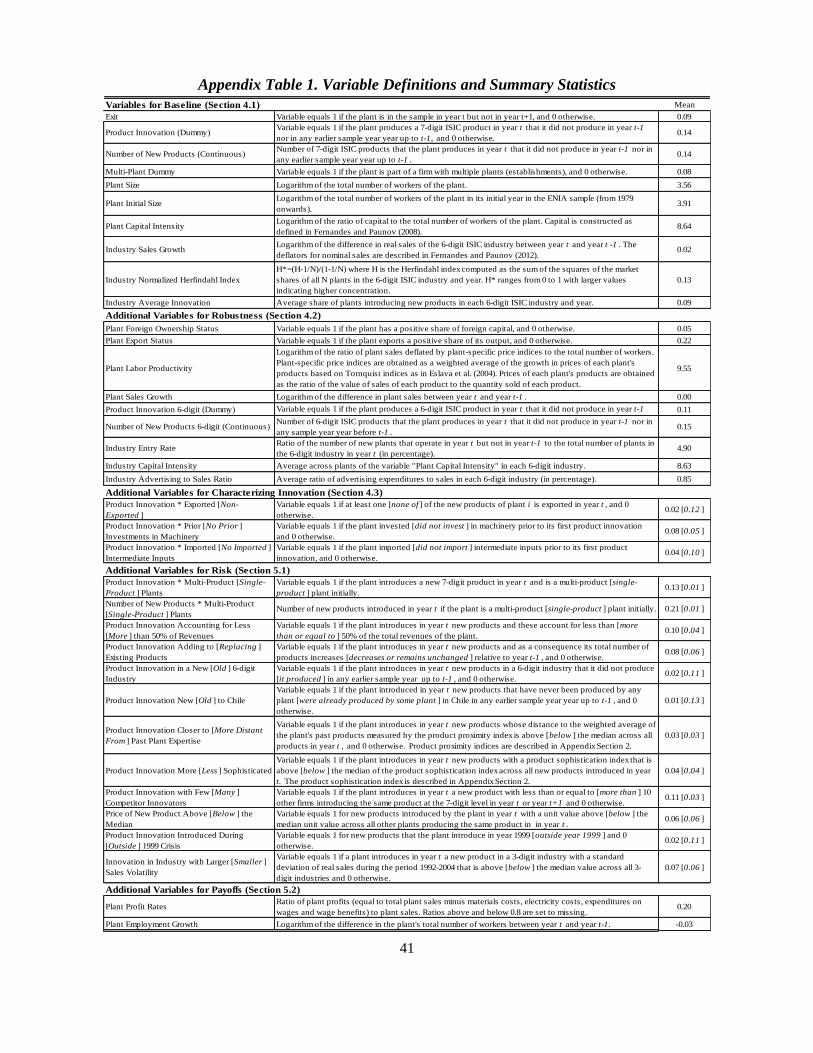
41
Appendix Table 1. Variable Definitions and Summary Statistics
Variables for Baseline (Section 4.1) Mean
Exit Variable equals 1 if the plant is in the sample in year t but not in year t+1, and 0 otherwise. 0.09
Product Innovation (Dummy)Variable equals 1 if the plant produces a 7-digit ISIC product in year t that it did not produce in year t-1
nor in any earlier sample year year up to t-1, and 0 otherwise. 0.14
Number of New Products (Continuous)Number of 7-digit ISIC products that the plant produces in year t that it did not produce in year t-1 nor in
any earlier sample year year up to t-1 . 0.14
Multi-Plant Dummy Variable equals 1 if the plant is part of a firm with multiple plants (establishments), and 0 otherwise. 0.08
Plant Size Logarithm of the total number of workers of the plant. 3.56
Plant Initial SizeLogarithm of the total number of workers of the plant in its initial year in the ENIA sample (from 1979
onwards).3.91
Plant Capital IntensityLogarithm of the ratio of capital to the total number of workers of the plant. Capital is constructed as
defined in Fernandes and Paunov (2008).8.64
Industry Sales GrowthLogarithm of the difference in real sales of the 6-digit ISIC industry between year t and year t -1 . The
deflators for nominal sales are described in Fernandes and Paunov (2012).0.02
Industry Normalized Herfindahl Index
H*=(H-1/N)/(1-1/N) where H is the Herfindahl index computed as the sum of the squares of the market
shares of all N plants in the 6-digit ISIC industry and year. H* ranges from 0 to 1 with larger values
indicating higher concentration.
0.13
Industry Average Innovation Average share of plants introducing new products in each 6-digit ISIC industry and year. 0.09
Additional Variables for Robustness (Section 4.2)
Plant Foreign Ownership Status Variable equals 1 if the plant has a positive share of foreign capital, and 0 otherwise. 0.05
Plant Export Status Variable equals 1 if the plant exports a positive share of its output, and 0 otherwise. 0.22
Plant Labor Productivity
Logarithm of the ratio of plant sales deflated by plant-specific price indices to the total number of workers.
Plant-specific price indices are obtained as a weighted average of the growth in prices of each plant's
products based on Tornquist indices as in Eslava et al. (2004). Prices of each plant's products are obtained
as the ratio of the value of sales of each product to the quantity sold of each product.
9.55
Plant Sales Growth Logarithm of the difference in plant sales between year t and year t-1 . 0.00
Product Innovation 6-digit (Dummy) Variable equals 1 if the plant produces a 6-digit ISIC product in year t that it did not produce in year t-1
nor in any sample year year before t-1 , and 0 otherwise.
0.11
Number of New Products 6-digit (Continuous)Number of 6-digit ISIC products that the plant produces in year t that it did not produce in year t-1 nor in
any sample year year before t-1 . 0.15
Industry Entry RateRatio of the number of new plants that operate in year t but not in year t-1 to the total number of plants in
the 6-digit industry in year t (in percentage). 4.90
Industry Capital Intensity Average across plants of the variable "Plant Capital Intensity" in each 6-digit industry. 8.63
Industry Advertising to Sales Ratio Average ratio of advertising expenditures to sales in each 6-digit industry (in percentage). 0.85
Additional Variables for Characterizing Innovation (Section 4.3)
Product Innovation * Exported [Non-
Exported ]
Variable equals 1 if at least one [none of ] of the new products of plant i is exported in year t , and 0
otherwise. 0.02 [0.12 ]
Product Innovation * Prior [No Prior ]
Investments in Machinery
Variable equals 1 if the plant invested [did not invest ] in machinery prior to its first product innovation
and 0 otherwise. 0.08 [0.05 ]
Product Innovation * Imported [No Imported ]
Intermediate Inputs
Variable equals 1 if the plant imported [did not import ] intermediate inputs prior to its first product
innovation, and 0 otherwise. 0.04 [0.10 ]
Additional Variables for Risk (Section 5.1)
Product Innovation * Multi-Product [Single-
Product ] Plants
Variable equals 1 if the plant introduces a new 7-digit product in year t and is a multi-product [single-
product ] plant initially. 0.13 [0.01 ]
Number of New Products * Multi-Product
[Single-Product ] PlantsNumber of new products introduced in year t if the plant is a multi-product [single-product ] plant initially. 0.21 [0.01 ]
Product Innovation Accounting for Less
[More ] than 50% of Revenues
Variable equals 1 if the plant introduces in year t new products and these account for less than [more
than or equal to ] 50% of the total revenues of the plant. 0.10 [0.04 ]
Product Innovation Adding to [Replacing ]
Existing Products
Variable equals 1 if the plant introduces in year t new products and as a consequence its total number of
products increases [decreases or remains unchanged ] relative to year t-1 , and 0 otherwise.0.08 [0.06 ]
Product Innovation in a New [Old ] 6-digit
Industry
Variable equals 1 if the plant introduces in year t new products in a 6-digit industry that it did not produce
[it produced ] in any earlier sample year up to t-1 , and 0 otherwise.0.02 [0.11 ]
Product Innovation New [Old ] to Chile
Variable equals 1 if the plant introduced in year t new products that have never been produced by any
plant [were already produced by some plant ] in Chile in any earlier sample year year up to t-1 , and 0
otherwise.
0.01 [0.13 ]
Product Innovation Closer to [More Distant
From ] Past Plant Expertise
Variable equals 1 if the plant introduces in year t new products whose distance to the weighted average of
the plant's past products measured by the product proximity index is above [below ] the median across all
products in year t , and 0 otherwise. Product proximity indices are described in Appendix Section 2.
0.03 [0.03 ]
Product Innovation More [Less ] Sophisticated
Variable equals 1 if the plant introduces in year t new products with a product sophistication index that is
above [below ] the median of the product sophistication index across all new products introduced in year
t. The product sophistication index is described in Appendix Section 2.
0.04 [0.04 ]
Product Innovation with Few [Many ]
Competitor Innovators
Variable equals 1 if the plant introduces in year t a new product with less than or equal to [more than ] 10
other firms introducing the same product at the 7-digit level in year t or year t+1 and 0 otherwise. 0.11 [0.03 ]
Price of New Product Above [Below ] the
Median
Variable equals 1 for new products introduced by the plant in year t with a unit value above [below ] the
median unit value across all other plants producing the same product in in year t . 0.06 [0.06 ]
Product Innovation Introduced During
[Outside ] 1999 Crisis
Variable equals 1 for new products that the plant introduce in year 1999 [outside year 1999 ] and 0
otherwise. 0.02 [0.11 ]
Innovation in Industry with Larger [Smaller ]
Sales Volatility
Variable equals 1 if a plant introduces in year t a new product in a 3-digit industry with a standard
deviation of real sales during the period 1992-2004 that is above [below ] the median value across all 3-
digit industries and 0 otherwise.
0.07 [0.06 ]
Additional Variables for Payoffs (Section 5.2)
Plant Profit RatesRatio of plant profits (equal to total plant sales minus materials costs, electricity costs, expenditures on
wages and wage benefits) to plant sales. Ratios above and below 0.8 are set to missing.0.20
Plant Employment Growth Logarithm of the difference in the plant's total number of workers between year t and year t-1. -0.03
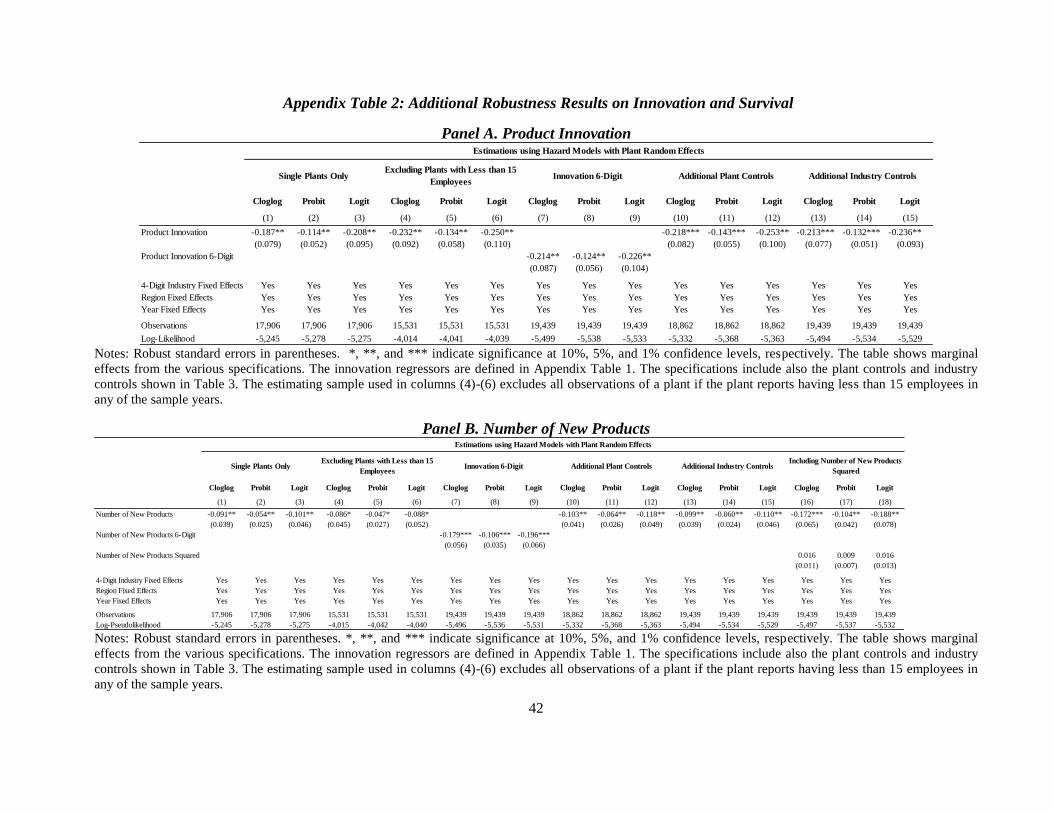
42
Appendix Table 2: Additional Robustness Results on Innovation and Survival
Panel A. Product Innovation
Cloglog Probit Logit Cloglog Probit Logit Cloglog Probit Logit Cloglog Probit Logit Cloglog Probit Logit
(1) (2) (3) (4) (5) (6) (7) (8) (9) (10) (11) (12) (13) (14) (15)
Product Innovation -0.187** -0.114** -0.208** -0.232** -0.134** -0.250** -0.218*** -0.143*** -0.253** -0.213*** -0.132*** -0.236**
(0.079) (0.052) (0.095) (0.092) (0.058) (0.110) (0.082) (0.055) (0.100) (0.077) (0.051) (0.093)
Product Innovation 6-Digit -0.214** -0.124** -0.226**
(0.087) (0.056) (0.104)
4-Digit Industry Fixed Effects Yes Yes Yes Yes Yes Yes Yes Yes Yes Yes Yes Yes Yes Yes Yes
Region Fixed Effects Yes Yes Yes Yes Yes Yes Yes Yes Yes Yes Yes Yes Yes Yes Yes
Year Fixed Effects Yes Yes Yes Yes Yes Yes Yes Yes Yes Yes Yes Yes Yes Yes Yes
Observations 17,906 17,906 17,906 15,531 15,531 15,531 19,439 19,439 19,439 18,862 18,862 18,862 19,439 19,439 19,439
Log-Likelihood -5,245 -5,278 -5,275 -4,014 -4,041 -4,039 -5,499 -5,538 -5,533 -5,332 -5,368 -5,363 -5,494 -5,534 -5,529
Estimations using Hazard Models with Plant Random Effects
Single Plants Only Additional Plant ControlsInnovation 6-Digit Excluding Plants with Less than 15
EmployeesAdditional Industry Controls
Notes: Robust standard errors in parentheses. *, **, and *** indicate significance at 10%, 5%, and 1% confidence levels, respectively. The table shows marginal
effects from the various specifications. The innovation regressors are defined in Appendix Table 1. The specifications include also the plant controls and industry
controls shown in Table 3. The estimating sample used in columns (4)-(6) excludes all observations of a plant if the plant reports having less than 15 employees in
any of the sample years.
Panel B. Number of New Products
Cloglog Probit Logit Cloglog Probit Logit Cloglog Probit Logit Cloglog Probit Logit Cloglog Probit Logit Cloglog Probit Logit
(1) (2) (3) (4) (5) (6) (7) (8) (9) (10) (11) (12) (13) (14) (15) (16) (17) (18)
Number of New Products -0.091** -0.054** -0.101** -0.086* -0.047* -0.088* -0.103** -0.064** -0.118** -0.099** -0.060** -0.110** -0.172*** -0.104** -0.188**
(0.039) (0.025) (0.046) (0.045) (0.027) (0.052) (0.041) (0.026) (0.049) (0.039) (0.024) (0.046) (0.065) (0.042) (0.078)
Number of New Products 6-Digit -0.179*** -0.106*** -0.196***
(0.056) (0.035) (0.066)
Number of New Products Squared 0.016 0.009 0.016
(0.011) (0.007) (0.013)
4-Digit Industry Fixed Effects Yes Yes Yes Yes Yes Yes Yes Yes Yes Yes Yes Yes Yes Yes Yes Yes Yes Yes
Region Fixed Effects Yes Yes Yes Yes Yes Yes Yes Yes Yes Yes Yes Yes Yes Yes Yes Yes Yes Yes
Year Fixed Effects Yes Yes Yes Yes Yes Yes Yes Yes Yes Yes Yes Yes Yes Yes Yes Yes Yes Yes
Observations 17,906 17,906 17,906 15,531 15,531 15,531 19,439 19,439 19,439 18,862 18,862 18,862 19,439 19,439 19,439 19,439 19,439 19,439
Log-Pseudolikelihood -5,245 -5,278 -5,275 -4,015 -4,042 -4,040 -5,496 -5,536 -5,531 -5,332 -5,368 -5,363 -5,494 -5,534 -5,529 -5,497 -5,537 -5,532
Estimations using Hazard Models with Plant Random Effects
Including Number of New Products
Squared Single Plants Only Additional Plant Controls Additional Industry Controls Innovation 6-Digit
Excluding Plants with Less than 15
Employees
Notes: Robust standard errors in parentheses. *, **, and *** indicate significance at 10%, 5%, and 1% confidence levels, respectively. The table shows marginal
effects from the various specifications. The innovation regressors are defined in Appendix Table 1. The specifications include also the plant controls and industry
controls shown in Table 3. The estimating sample used in columns (4)-(6) excludes all observations of a plant if the plant reports having less than 15 employees in
any of the sample years.
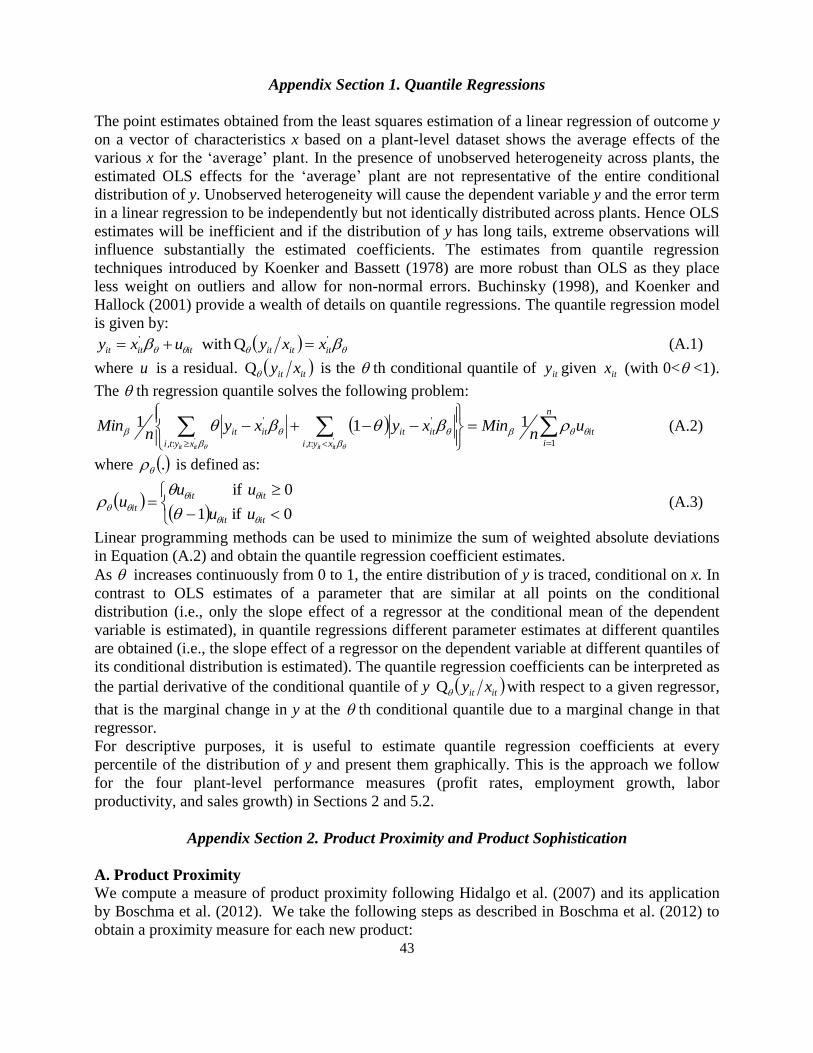
43
Appendix Section 1. Quantile Regressions
The point estimates obtained from the least squares estimation of a linear regression of outcome y
on a vector of characteristics x based on a plant-level dataset shows the average effects of the
various x for the „average‟ plant. In the presence of unobserved heterogeneity across plants, the
estimated OLS effects for the „average‟ plant are not representative of the entire conditional
distribution of y. Unobserved heterogeneity will cause the dependent variable y and the error term
in a linear regression to be independently but not identically distributed across plants. Hence OLS
estimates will be inefficient and if the distribution of y has long tails, extreme observations will
influence substantially the estimated coefficients. The estimates from quantile regression
techniques introduced by Koenker and Bassett (1978) are more robust than OLS as they place
less weight on outliers and allow for non-normal errors. Buchinsky (1998), and Koenker and
Hallock (2001) provide a wealth of details on quantile regressions. The quantile regression model
is given by:
'' Q with itititititit xxyuxy (A.1)
where u is a residual. itit xyQ is the th conditional quantile of ity given itx (with 0< <1).
The th regression quantile solves the following problem:
it
n
ixyti xyti
itititit un
Minxyxyn
Min
itit itit
1:, :,
'' 111' '
(A.2)
where . is defined as:
0 if 1
0 if
itit
itit
ituu
uuu
(A.3)
Linear programming methods can be used to minimize the sum of weighted absolute deviations
in Equation (A.2) and obtain the quantile regression coefficient estimates.
As increases continuously from 0 to 1, the entire distribution of y is traced, conditional on x. In
contrast to OLS estimates of a parameter that are similar at all points on the conditional
distribution (i.e., only the slope effect of a regressor at the conditional mean of the dependent
variable is estimated), in quantile regressions different parameter estimates at different quantiles
are obtained (i.e., the slope effect of a regressor on the dependent variable at different quantiles of
its conditional distribution is estimated). The quantile regression coefficients can be interpreted as
the partial derivative of the conditional quantile of y itit xyQ with respect to a given regressor,
that is the marginal change in y at the th conditional quantile due to a marginal change in that
regressor.
For descriptive purposes, it is useful to estimate quantile regression coefficients at every
percentile of the distribution of y and present them graphically. This is the approach we follow
for the four plant-level performance measures (profit rates, employment growth, labor
productivity, and sales growth) in Sections 2 and 5.2.
Appendix Section 2. Product Proximity and Product Sophistication
A. Product Proximity
We compute a measure of product proximity following Hidalgo et al. (2007) and its application
by Boschma et al. (2012). We take the following steps as described in Boschma et al. (2012) to
obtain a proximity measure for each new product:
44
1) We divide the share of product i in a country's total exports by the share of product i in world
total exports. A ratio above 1 indicates that a country has comparative advantage in that product.
2) We calculate the probability of having comparative advantage in product i, by dividing the
number of countries with comparative advantage in product i by the number of sample countries.
3) We calculate the joint probability of having comparative advantage in product i and product j,
by dividing the number of countries with comparative advantage in both product i and product j
by the number of sample countries.
4) We calculate the probability of having comparative advantage in product i conditional on
having comparative advantage in product j, by dividing the joint probability of having
comparative advantage in both product i and product j by the probability of having comparative
advantage in product j.
5) Following the same steps, we calculate the probability of having comparative advantage in
product j conditional on having comparative advantage in product i.
Hence, for each pair of products (i, j) manufactured by a Chilean plant, we obtain two conditional
probabilities: the probability of having comparative advantage in product i conditional on having
comparative advantage in product j, and the probability of having comparative advantage in
product j conditional on having comparative in product i. The proximity index value for the pair
of products (i, j) equals the lowest value of the two conditional probabilities. In order to obtain a
measure of proximity between each new product and the basket of m=1,…,M past products of the
plant, we compute a weighted average of the values of the proximity index between the new
product and each of the M past products, with weights given by their share in total plant
revenues. For plants that introduce several new products in a given year, a simple average of the
proximity index values for each of the new products and the basket of past products is computed.
To operationalize these measures we use data from WITS on total exports by all countries with
data over the entire period 1996-2003 with more than 3 million inhabitants averaged across 1996-
2003 at the 6-digit level of the Harmonized System (HS) classification and concord it to the 7-
digit ISIC level of our Chilean products. To do so we establish a concordance between HS 6-digit
and 7-digit ISIC level. We exclude Chile from the calculations of the proximity index.
B. Product Sophistication
We compute a measure of intrinsic sophistication of product k following Hausmann et al. (2007)
and its application by Jarreau and Poncet (2012) as the weighted average of the income levels of
the countries that export product k where the weights are given by the revealed comparative
advantage of each country j in product k. Specifically, the sophistication of product k is given by
j
j
j
jk
k
k IE
e
CPRODY *
1 (A.4)
where jke are exports of product k by country j, jE are total exports by country j, jI is per
capita income of country j, and kC is a normalization factor to ensure that the coefficients sum to
1. The more product k weights in the export baskets of richer countries, the higher is its PRODY
and the more sophisticated is it considered.
To operationalize Eq. (A.4), we use data from WITS on exports by all countries in 1996 at the 6-
digit level of the Harmonized System (HS) classification and concord it to the 7-digit ISIC level
of our Chilean products by establishing a concordance between HS 6-digit and 7-digit ISIC level,
and data on GDP per capita in PPP terms from the World Development Indicators for year 1996.