Embed Size (px)
Citation preview
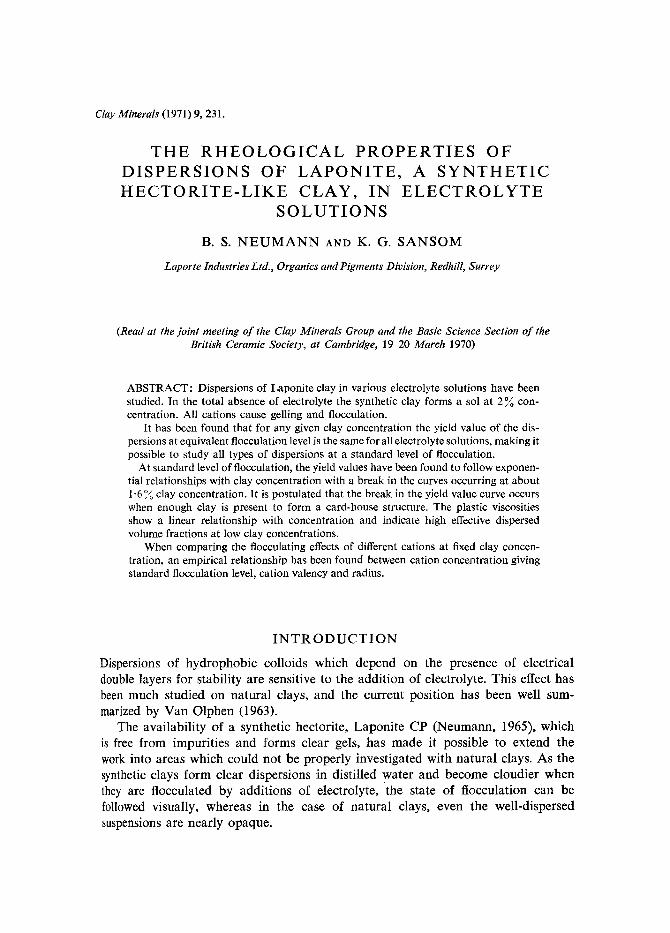
Clay Minerals (1971) 9, 231.
T H E R H E O L O G I C A L P R O P E R T I E S OF D I S P E R S I O N S OF L A P O N I T E , A S Y N T H E T I C H E C T O R I T E - L I K E C L A Y , I N E L E C T R O L Y T E
S O L U T I O N S
B. S. N E U M A N N AND K. G. S A N S O M
Laporte Industries Ltd., Organics and Pigments Division, Redhill, Surrey
(Read at the joint meeting of the Clay Minerals Group and the Basic Science Section of the British Ceramic Society, at Cambridge, 19-20 March 1970)
ABSTRACT: Dispersions of Laponite clay in various electrolyte solutions have been studied. In the total absence of electrolyte the synthetic clay forms a sol at 2 ~ con- centration. All cations cause gelling and flocculation.
It has been found that for any given clay concentration the yield value of the dis- persions at equivalent flocculation level is the same for all electrolyte solutions, making it possible to study all types of dispersions at a standard level of flocculation.
At standard level of flocculation, the yield values have been found to follow exponen- tial relationships with clay concentration with a break in the curves occurring at about l '6 ~ clay concentration. It is postulated that the break in the yield value curve occurs when enough clay is present to form a card-house structure. The plastic viscosities show a linear relationship with concentration and indicate high effective dispersed volume fractions at low clay concentrations.
When comparing the flocculating effects of different cations at fixed clay concen- tration, an empirical relationship has been found between cation concentration giving standard flocculation level, cation valency and radius.
I N T R O D U C T I O N
Dispersions of hyd rophob ic col loids which depend on the presence of electr ical double layers for s tabi l i ty are sensitive to the addi t ion of electrolyte. This effect has been much s tudied on na tu ra l clays, and the current posi t ion has been well sum- marized by Van Olphen (1963).
The avai lab i l i ty of a synthet ic hector i te , Lapon i t e CP (Neumann, 1965), which is free from impur i t ies and forms clear gels, has made it possible to extend the work into areas which could not be p roper ly invest igated with na tu ra l clays. As the synthetic clays form clear dispers ions in dist i l led water and become c loudier when they are f locculated by addi t ions of electrolyte, the state of f locculat ion can be followed visually, whereas in the case of na tu ra l clays, even the wel l -d ispersed suspensions are near ly opaque .

232 B. S. Neumann and K. G. Sansom
In the present work we have used this direct observa t ion of the state of floccula- tion and cor re la ted the results ob ta ined with the theo log ica l proper t ies , as influenced by the add i t ion of var ious electrolytes, and by var ia t ions in c lay concentra t ion.
E X P E R I M E N T A L
Materials
Lapon i t e CP, a synthet ic hector i te- l ike clay manufac tu red by L a p o r t e Indust r ies L t d was used th roughout this work. A p a r t f rom traces of soluble sulphate and ca rbona te it is free f rom de tec tab le impuri t ies . The most impor t an t physical and chemica l proper t ies are shown in Tab le 1.
TABLE 1. Chemical and physical data on Laponite CP (typical values)
Composition ~ (on dry weight basis) SiO2 60"4 Fe203 0"02 MgO 26"0 CaO 0-20 Na20 3"0 H20 (structural) 6-9 CO2 0"29 S03 0-10 LiE0 1" 1
Total 98.01
Formula [Sis Mgs.1 El0.6 H4.6 024] ~
Cation exchange capacity, me/g 0'79
Morphology platy, lath-shaped
Size of average primary particle 40 x 10 x 1 nm 3
Moisture (at 105~ 8
pH of 2 ~ dispersion 8"5
Measured density, g cm -3 2-53
Apparent bulk density at 8 % moisture gcm -3 1.0
Surface area by nitrogen adsorption, m 2 g-1 354
Refractive index 1 "54
This material should not be confused with the Laponite B grade of synthetic clay which contains insoluble impurities, and consequently does not form completely clear dispersions.
Laponite dispersions in electrolyte solutions 233 Cations. The cations studied were:
H +, Li +, Na +, K +, Cs +, NH~ +, Mg ~+, Ca 2+, Ba 2+, AP+.
These were added as soluble analytical reagent grade salts (or acid in the case of H+). The type of anion has no effect.
Methods
The clay dispersions were prepared in solutions of the various electrolytes by adding the clay to the cold solution, stirring at room temperature with a high speed stirrer for 15 min.
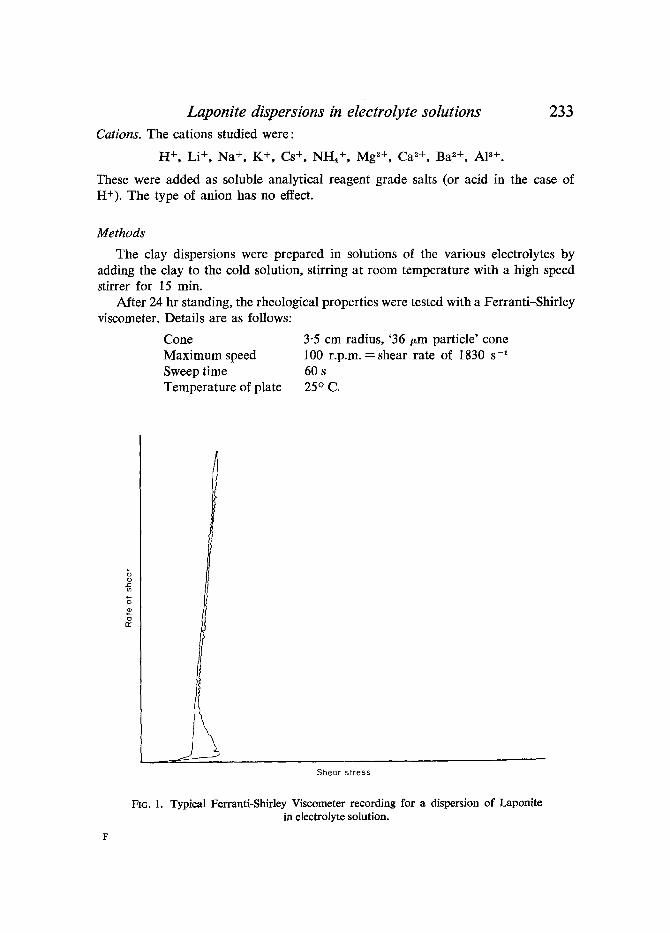
After 24 hr standing, the rheological properties were tested with a Ferranti-Shirley viscometer. Details are as follows:
Cone 3"5 cm radius, '36 t~m particle' cone Maximum speed 100 r.p.m. =sh ea r rate of 1830 s -1 Sweep time 60 s Temperature of plate 25 ~ C.
Sheor stress
FIG. 1. Typical Ferranti-Shirley Viscometer recording for a dispersion of Laponite in electrolyte solution.

234 B. S. Neumann and K. G. Sansom
The flow curve was recorded after reaching equilibrium by applying an initial UP-DOWN cycle. A tangent was drawn to the DOWN curve, and the intercept on the shear stress axis was measured. This Extrapolated Shear Stress is shown in our results as ESS. While it is understood that this is not a true yield value, it is convenient to refer to it as such. It approximates very closely to the minimum shear stress causing detectable flow after elimination of the thixotropic gel strength development. The Plastic Viscosity of the dispersion was calculated from the slope of the same line (Fig. 1).
The clarity of the dispersions was recorded as optical density (O.D.) measured on an EEL Absorption meter using a 2-cm cell and a green-blue filter No. 603 with a distilled water blank.
R E S U L T S
Effect of electrolyte type and concentration
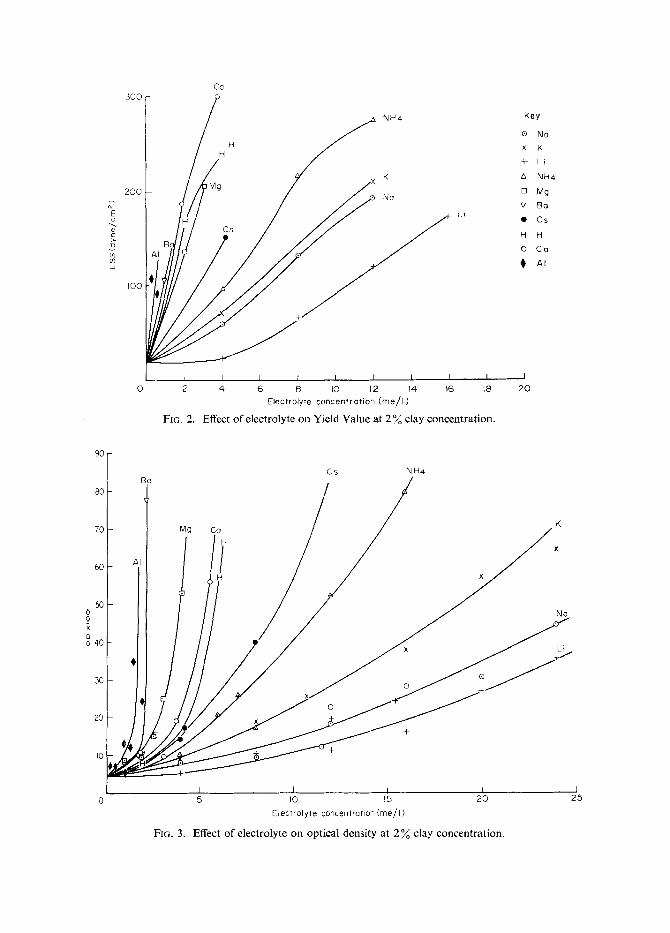
The effect of the electrolyte level on the yield value (ESS) at 2% clay concentra- tion for different cations is shown in Fig. 2. Similar graphs were obtained at 1% and 3 % clay concentrations, but, of course, the actual yield values were different.
The points were only plotted up to the level when gross flocculation occurred. Above this level the yield values measured with the Ferranti-Shirley viscometer continue to rise, but this is an artefact probably caused by the flocs being large enough to bridge the gap between the cone and plate. It can, in fact, be seen that there is no gel formation, and cylindrical viscometers, e.g. the Fann VG with a wider gap, do not register a continuing rise.
The effect of the electrolyte level on the optical density (O.D.) at 2% clay concentration for different cations is shown in Fig. 3. Again, the picture is similar at other clay concentrations with different levels of optical densities. In this case, there was no necessity to stop the curves at the level of gross flocculation, since there is no reason to distrust the higher values.
It can be seen from Figs 2 and 3 that: (1) both ESS and O.D. values increase with electrolyte addition; (2) for a given electrolyte level, both the ESS and the O.D. values are lowest for the monovalent cations. The divalent cations and aluminium give higher results in both cases. (3) Within the monovalent or divalent group, the larger cations give higher values than the smaller ones. Hydrogen is anomalous, but this is probably because it releases magnesium ions from the clay.
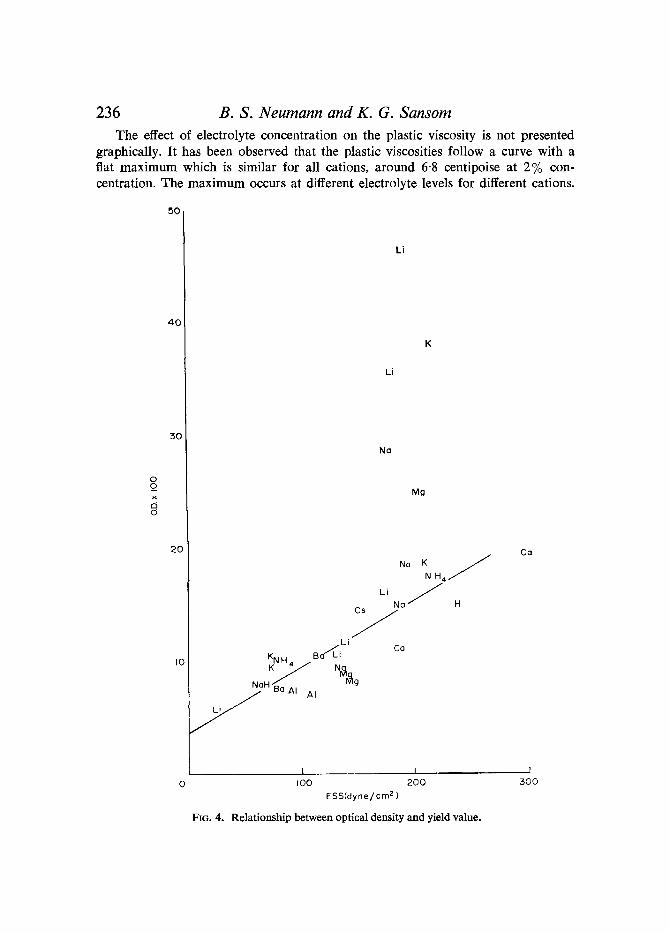
It is apparent from comparison of Figs 2 and 3 that there is a good correlation between yield value and optical density, regardless of the type of cation. This is shown in Fig. 4. Because of the correlation, it is possible to choose a fixed level of flocculation characterized either by optical density or yield value, to compare the various systems. In this work the O.D. value 0'15 was arbitrarily chosen for 2% clay concentration; at this level the suspension is fairly cloudy and the yield value is approaching its highest level before gross flocculation occurs.
t~ E u
c
v
Ld
Ca 3OO
H H NH4
200 Mg X K Na
H Cs ~ Li
B AI
I00
0 2 4 6 8 10 t2 14 16 18 Electrolyte concentration (me/ I )
FIG. 2. Effect o f electrolyte on Y ie ld Value at 2 % clay concentrat ion.
Key
| No
x K
4- Li
A NH4
D Mg
'7 Ba
�9 Cs
H H
0 Ca
@ A~
I
20
90
80
70
60
5O 0 0 K t~ o 40
30
20
Ba Cs NH4
Mg Co /r H
Na
x Li ?cJ
I I I I 5 I0 15 20
Electrolyte concentration (me/I)
FIG. 3. Effect o f electrolyte on optical density at 2 % clay concentrat ion.
r 25
2 3 6 B. S. Neumann and K. G. Sansom
The effect of electrolyte concentration on the plastic viscosity is not presented graphically. It has been observed that the plastic viscosities follow a curve with a flat maximum which is similar for all cations, around 6"8 centipoise at 2% con- centration. The maximum occurs at different electrolyte levels for different cations.
50
o o
P, 0
40
30
20
Li
K
Li
Na
Mg
I0
NoK J N H 4
Li No j H
..~Li Co
L I I00 200
ESS(dyne/cm 2)
FIG. 4. Relationship between optical density and yield value.
Ca
300
800
Laponite dispersions in electrolyte solutions A~
237
E .z.
b3 O3 UJ
7 0 0
600
500
400
300
200
I00
Mg Ca
No Co
Cs
Mg
AI NH4
Cs
8%~ ~
Co
Mg Na Li
B~H 4 KCs
AI
Mg Li Co K
No
C$ Li
Mg K Ca NH4 Na
Cs Li AI
NHa Ba A~
I I
I 2 3
Cloy c o n c e n t r a t i o n (%)
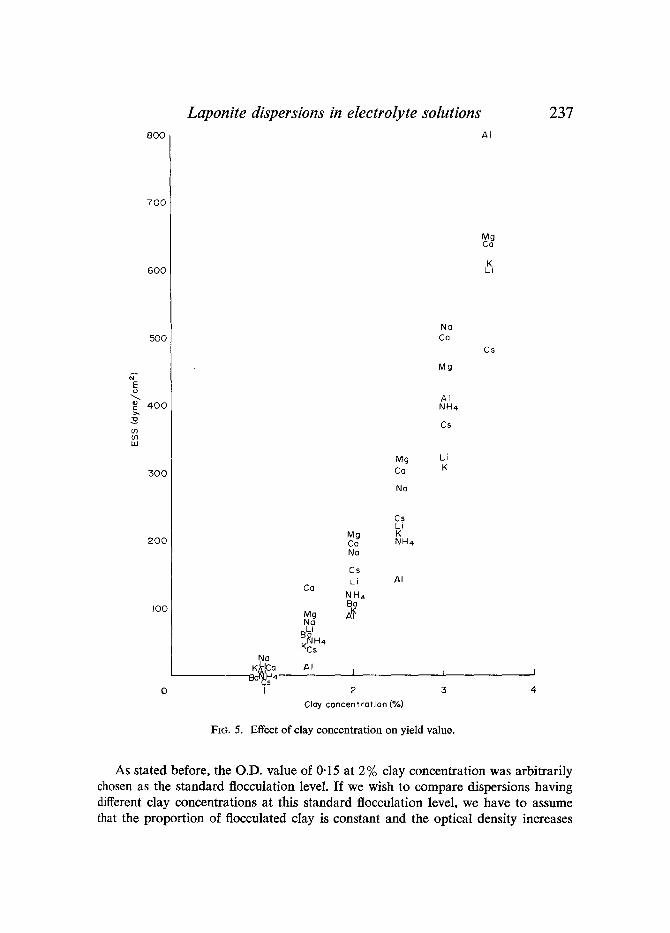
FIO. 5. E f f ec t o f clay concentration on yield value.
As stated before, the O.D. value of 0-15 at 2% clay concentration was arbitrarily chosen as the standard flocculation level. If we wish to compare dispersions having different clay concentrations at this standard flocculation level, we have to assume that the proportion of flocculated clay is constant and the optical density increases
2 3 8 B. S. Neumann and K. G. Sansom
proportionally with clay concentration. Thus, equal states of flocculation should exist when the optical densities are at 0.075c, where e is clay concentration, giving 0"15 for 2%.
The yield values and plastic viscosities for various clay concentrations corres- ponding to the above optical densities have been determined by interpolation between results obtained for various electrolyte concentrations.
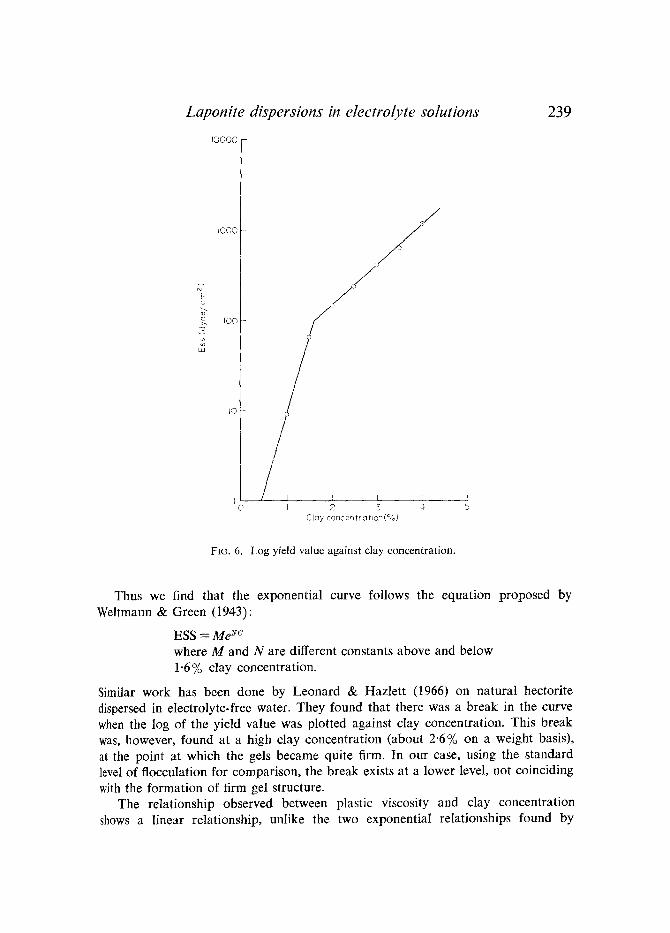
The effect of clay concentration on Yield Value at the standard flocculation level is shown in Fig. 5 where it can be seen that, although there is much scatter, the points seem to follow exponential relationships. Fig. 6, a plot of log ESS vs. clay concentration consists of two straight lines.
The plastic viscosity at O.D. of 0"075c follows a linear relationship with con- centration as shown in Fig. 7.
D I S C U S S I O N
The results given in Figs 2 and 3 show that the divalent ions and aluminium are much more effective for flocculating the dispersion than the monovalent cations, and within each valency group, the larger ions are more effective. This is as expected from the Schulze-Hardy rule and the discussions of Van Olphen (1963).
We have found the following empirical relationship between the electrolyte concentration giving standard flocculation level, cation valency and ionic size:
k l = z 2 ~ �9
Here k is a constant, l is the concentration of electrolyte as me/1 giving standard flocculation at 2% clay concentration, Z is the valency and r is the ionic radius for univalent crystal in cm as calculated by Pauling (1960). This relationship is shown in Fig. 8. The value of k calculated from the straight line drawn is 8"3.10 -8.
We are not attempting, at this stage, to attribute any fundamental physical meaning to this empirical relationship, though we expect it to have fairly general validity for the effects of electrolytes on colloidal dispersions.
The correlation between optical density and yield value, as shown in Fig. 3, provides a very good method for the study of a clay dispersion at a standard state of flocculation regardless of the cause of flocculation. Using this method, the effect of clay concentration on yield value, as shown in Figs 6 and 7, is found to follow two exponential relationships of the form:
ESS = kle k2c
kl and kz are constants. For concentrations above 1-6%, kl = 18-6, k2-- 1 and for concentrations below 1"6%, kl-----0"17 and k2=4 . At zero concentration the equation gives ESS equal to k~, that is 0.17 dyne/cmL a very low value, close to the zero value of water. The break in the curve at 1"6% clay concentration has special significance, as will be discussed later.
Laponite dispersions in electrolyte solutions
I 0 0 0 0
239
E
c
Ld
I 0 0 0
I 0 0
I0
I J 0 5
!
/J I J
I 2 ~ 4 Clay c o n c e n t r a t i o n ( % )
FIG. 6. Log yield value against clay concentration.
Thus we find that the exponential curve follows the equation proposed by Weltmann & Green (1943):
ESS = M e uc
where M and N are different constants above and below 1.6% clay concentration.
Similar work has been done by Leonard & Hazlett (1966) on natural hectorite dispersed in electrolyte-free water. They found that there was a break in the curve when the log of the yield value was plotted against clay concentration. This break was, however, found at a high clay concentration (about 2-6% on a weight basis), at the point at which the gels became quite firm. In our case, using the standard level of flocculation for comparison, the break exists at a lower level, not coinciding with the formation of firm gel structure.
The relationship observed between plastic viscosity and clay concentration shows a linear relationship, unlike the two exponential relationships found by
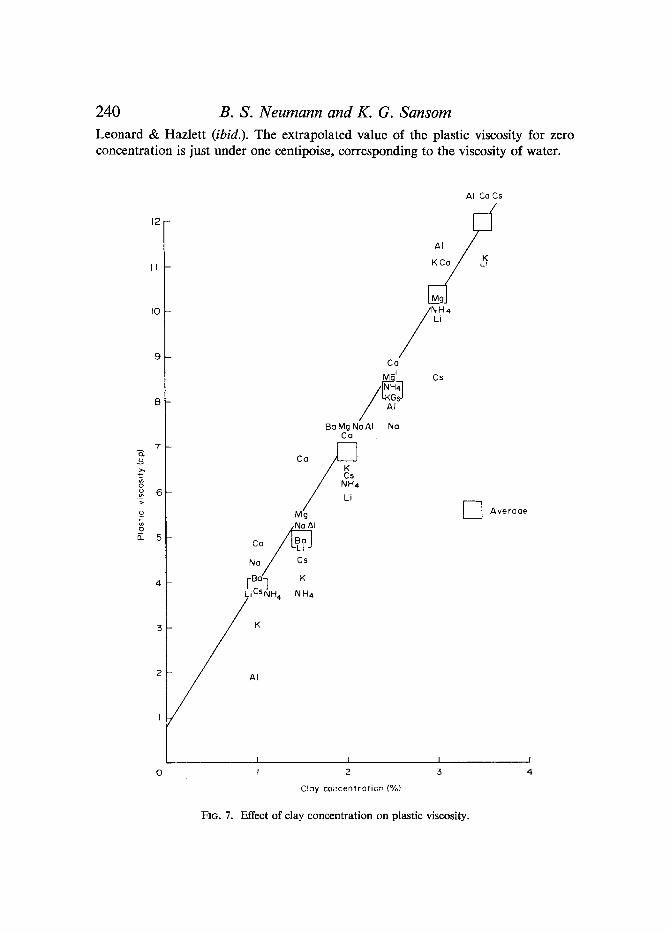
240 B. S. Neumann and K. G. Sansom
Leonard & Hazlett (ibid.). The extrapolated value of the plastic viscosity for zero concentration is just under one centipoise, corresponding to the viscosity of water.
:>
o
o
12
I0
8 -
7 -
6
5
4
5
2
I
M Li
Ba Mg Na AI No Ca
/ Li Mg
Na Cs
Li~SNH4 N H 4
AI Ca Cs
Ca
Cs
"7 A v e r o a e
I I I I 2 5
Clay c0ncenl'ration (%)
PIG. 7. Effect of clay concentration on plastic viscosity.

241
Li
14
12
E I0 ,5 c o
> ,
~ 6 K
, ~ N H 4
B ~ Mg
AI /
I
Laponite dispersions in electrolyte solutions 16
I f 0 0 ' 5 I 0 t '5
• x l O e zT
FIG. 8. Concentration ofelectrolytegivingstandardstateofflocculation against charge and size of cation.
It is interesting to speculate why a break is observed in the Yield Value curve at a clay concentration of about 1"6%, while there is no such break for the plastic viscosities. Leonard & Hazlett found the two properties to vary similarly with concentration, with breaks at the same levels. We think that this was fortuitous, and there is no reason to expect the two properties to follow the same course. The yield value and plastic viscosity determinations relate to different states of the clay dispersion: one to the gel, and the other to the fully sheared, structureless suspension.
In the gel state edge-to-face bonds are operative, and the break occurs at the concentration at which enough particles are present to form a card-house structure. This concentration is very low in the case of Laponite because the particles are small and fully dispersed in aqueous systems.
In the structureless state, the viscosity is dependent on the volume concentration of the disperse phase and, according to the Einstein equation, varies linearly with it. However, since the relative viscosities are high for low clay concentrations, one must assume that the relative volumes of liquid associated with the clay are high.
242 B. S. Neumann and K. G. Sansom
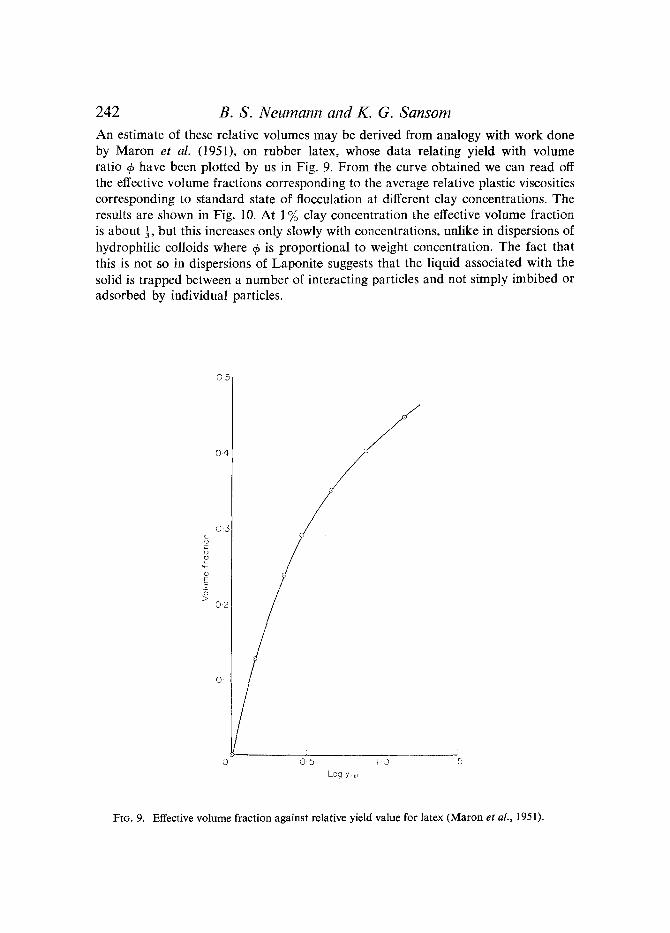
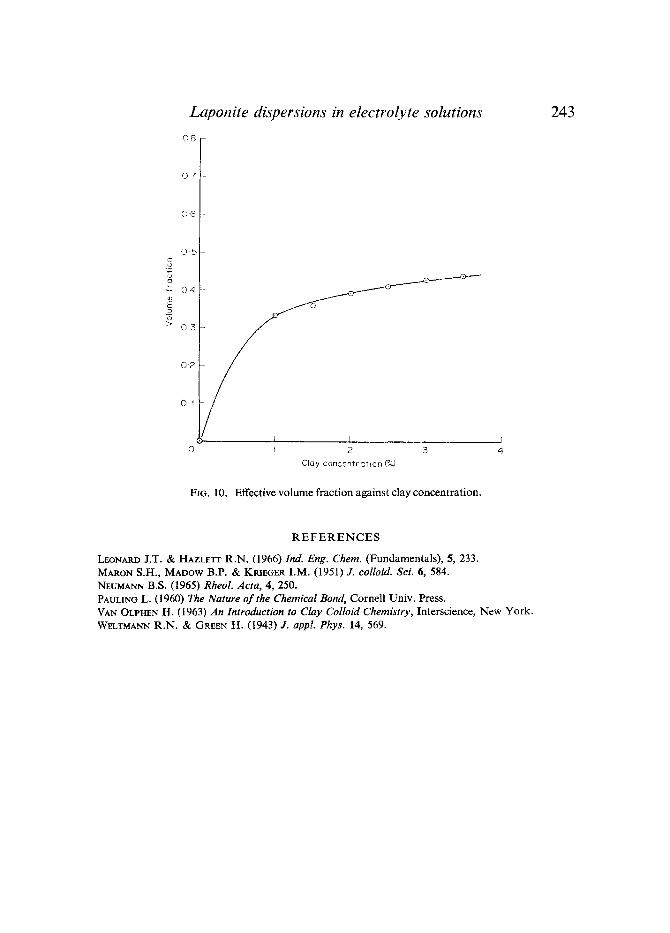
An estimate of these relative volumes may be derived from analogy with work done by Maron e t al. (1951), on rubber latex, whose data relating yield with volume ratio 4' have been plotted by us in Fig. 9. From the curve obtained we can read off the effective volume fractions corresponding to the average relative plastic viscosities corresponding to standard state of flocculation at different clay concentrations. The results are shown in Fig. 10. At 1% clay concentration the effective volume fraction is about 1, but this increases only slowly with concentrations, unlike in dispersions of hydrophilic colloids where 4' is proportional to weight concentration. The fact that this is not so in dispersions of Laponite suggests that the liquid associated with the solid is trapped between a number of interacting particles and not simply imbibed or adsorbed by individual particles.
O5
0 4
O5
0 0.5 i 0 15 Log Y~e,
FI6. 9. Effective volume fraction against relative yield value for latex (Maron et al., 1951).
Laponite dispersions in electrolyte solutions 0 8
243
0 7
O.G
0 5
0-4
0 '3
0 2
0-~
I I I I 0 I 2 3 4
C l a y concentration (%)
FIG. 10. Effective volume fraction against clay concentration.
R E F E R E N C E S
LEONARD J.T. & HAZLETT R.N. (1966) Ind. Eng. Chem. (Fundamentals), 5, 233. MARON S.I-L MADOW B.P. & KRIEGER I.M. (1951) J. colloid. Sci. 6, 584. NEUMANN B.S. (1965) RheoL Acta, 4, 250. PAULING L. (1960) The Nature of the Chemical Bond, Cornell Univ. Press. VAN OLl'H~r~ H. (1963) An Introduction to Clay Colloid Chemistry, Interscience, New York. WELTMANN R.N. & GREEN H. (1943) J. appL Phys. 14, 569.