Embed Size (px)
Citation preview

Response Spectrum Analysis for Structures and the NBCC 2005
University of British ColumbiaVancouver, June 1st & 2nd
Response Spectrum Seminar P5-1
Ron DeVall
Lecture 5
Filename, 1
Response Spectrum Analysis for Structures and
the NBCC 2005
Ron DeVall, PhD., P.Eng. Read Jones Christoffersen Ltd. (RJC)
Incorporating Discussions and Ideas From:Prof. Jag Humar, Ph.D – CarletonProf. Don Anderson, Ph.D. – UBCReza Anjam MA.Sc, P.Eng, RJC
The Canadian Society for Civil Engineering, Vancouver Section
THE RESPONSE SPECTRUM
A Technical Seminar on the Development and Application of the Response Spectrum Method for Seismic Design of Structures
1-2 June 2007 Vancouver, BC
Filename, 2 1-2 June 2007The Response Spectrum - CSCE Vancouver Section
2
Ron DeVall
Introduction
This presentation looks at the Response Spectrum Dynamic Approach to structures and at some issues with respect to:
NBCC 2005 requirements.
Use of computer programs.
Cautionary note – this is a complex topic (both static and dynamic) and computers may give a precise but not accurate solution.
Always engage your own "on board" processor - thinking is encouraged.
Response Spectrum Analysis for Structures and the NBCC 2005
University of British ColumbiaVancouver, June 1st & 2nd
Response Spectrum Seminar P5-2
Ron DeVall
Lecture 5
Filename, 3 1-2 June 2007The Response Spectrum - CSCE Vancouver Section
3
Ron DeVall
Outline
1. Static Method (very brief)
2. Why Do a Dynamic Analysis?
3. Computer Modeling Issues (very brief – headings only)
4. Basic Response Spectrum Dynamic Analysis Issues
5. Basic NBCC 2005 Dynamic Analysis Issues
Filename, 4 1-2 June 2007The Response Spectrum - CSCE Vancouver Section
4
Ron DeVall
1 Static Method
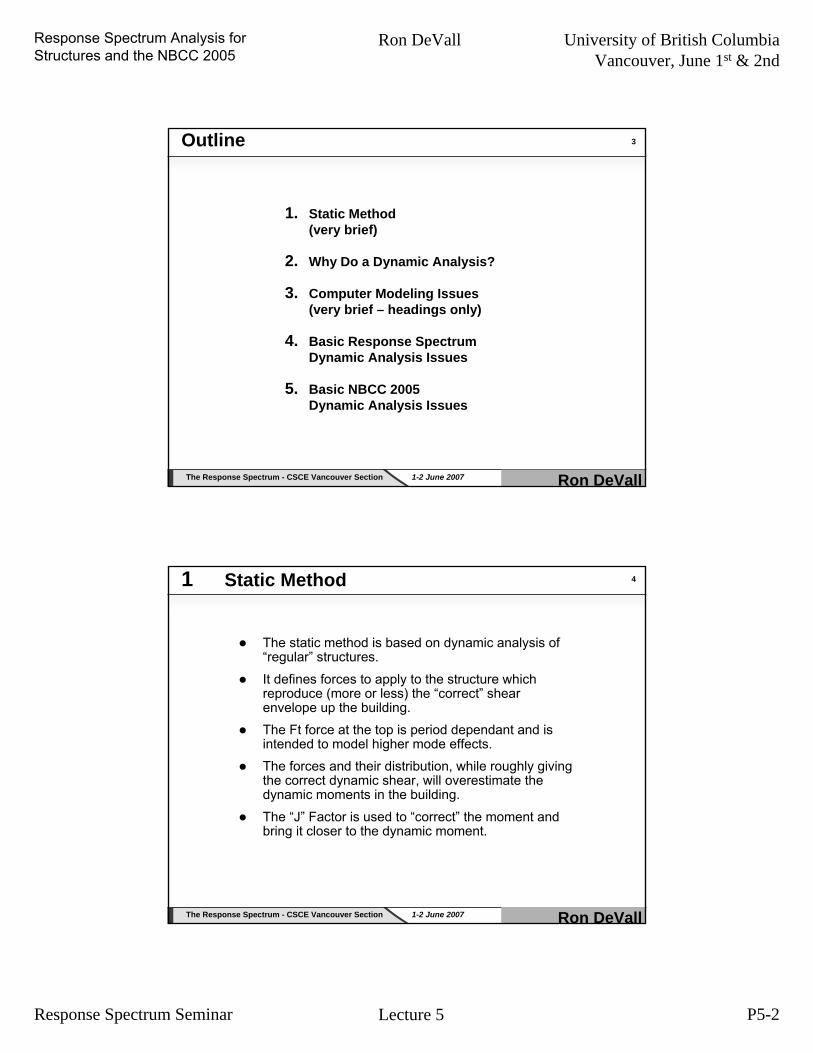
The static method is based on dynamic analysis of “regular” structures.
It defines forces to apply to the structure which reproduce (more or less) the “correct” shear envelope up the building.
The Ft force at the top is period dependant and is intended to model higher mode effects.
The forces and their distribution, while roughly giving the correct dynamic shear, will overestimate the dynamic moments in the building.
The “J” Factor is used to “correct” the moment and bring it closer to the dynamic moment.

Response Spectrum Analysis for Structures and the NBCC 2005
University of British ColumbiaVancouver, June 1st & 2nd
Response Spectrum Seminar P5-3
Ron DeVall
Lecture 5
Filename, 5 1-2 June 2007The Response Spectrum - CSCE Vancouver Section
5
Ron DeVall
2 Why Do A Dynamic Analysis?Earlier Versions of NBCC (even in 1970) urged dynamic analysis be used for irregular buildings and for large eccentricities it was required unless the static torque effects were doubled.
Advantages are:
Dynamic amplification of torque effects is captured.
Changes in mass and stiffness are better modeled in a dynamic analysis. Podium building are a good example of this.
Reductions in base shear in some torsionally eccentric buildingsis captured.
Reductions in overturning moments and displacements for tall, long period buildings when compared to the static approach.
Current computer programs make a dynamic spectrum analysis relatively simple to do once the model is built. However using the results requires a bit of understanding beyond a static analysis and this will be discussed in the next sections.
Filename, 6 1-2 June 2007The Response Spectrum - CSCE Vancouver Section
6
Ron DeVall
While live loads, snow loads, and wind loads tend to be independent of the structure (not quite true for wind loads on tall, long period structures), earthquake loads and displacements vary greatly with:
The building period – basically the earthquake forces decrease and the displacements increase as the period increases.
The structural type – for longer period buildings, uncoupled shear walls behave differently than coupled walls, moment frames, braced frames, and coupled walls – even for the same fundamental period
3 Some Computer Modeling Issues

Response Spectrum Analysis for Structures and the NBCC 2005
University of British ColumbiaVancouver, June 1st & 2nd
Response Spectrum Seminar P5-4
Ron DeVall
Lecture 5
Filename, 7 1-2 June 2007The Response Spectrum - CSCE Vancouver Section
7
Ron DeVall
For this reason it is important to get the model to be as good an approximation as you can. Some of the items to think about in the model are:
shear displacements
finite joint sizes
cracked “I” values in concrete, including the area of coupled walls.
behaviour of tall walls through deep, below grade structures.
diaphragm displacements at discontinuities of the lateral system.
effect of footing rotations.
modeling the diaphragm – rigid? membrane? plate?
how to apply mass and in what units.
how to model complex walls – as a “whole” element or as separate pieces.
3 Some Computer Modeling Issues
Filename, 8 1-2 June 2007The Response Spectrum - CSCE Vancouver Section
8
Ron DeVall
Modeling frames (beams and columns), braced steel frames, and rectangular walls (coupled or uncoupled), is relatively straightforward.
However, irregular shapes (channels etc..) can lead to problems with figuring out where in the section the forces are acting and this makes design difficult. (both static and dynamic analysis)
Consider doing the following, using a channel shaped wall with unequal flanges as an example:
Run once with the “wall” called up as one element. This will give overall shear, moments, torques and axial forces. Useful for checking and design of footings. But – what is going on in the flanges?
Run again with the wall built up out of three separate named elements - two flanges and a web. The output will then be for the shear, moment, torque and axial force in each rectangular element. This makes design a bit more straight forward.
3 Some Computer Modeling Issues

Response Spectrum Analysis for Structures and the NBCC 2005
University of British ColumbiaVancouver, June 1st & 2nd
Response Spectrum Seminar P5-5
Ron DeVall
Lecture 5
Filename, 9 1-2 June 2007The Response Spectrum - CSCE Vancouver Section
9
Ron DeVall
4 Some Computer Dynamic Spectrum Analysis Issues
Understand the program!
The “dynamic” result is a combination of mode shapes, so make sure there are enough to capture the building’s behaviour. Pick 3 times the number of floors up to 15 or so.
Mode shapes are combined to get the “design” values. Pick “CQC” instead of “SRSS” if possible as it is better when eigenvalues (periods) are close together.
Check the mode shapes, and the mass participation factors to make sure at least 90% of the mass has been captured into the analysis.
If not, increase the number of mode shapes used until 90% or more has been captured. Make sure that enough mode shapes (higher modes) are included to pick up the response of podiums at the base.
Filename, 10 1-2 June 2007The Response Spectrum - CSCE Vancouver Section
10
Ron DeVall
4 Some Computer Dynamic Spectrum Analysis Issues
Review the mode shapes, the periods and the participation factors to get a feel for what the building is doing and how it behaves.
“Animate” the lower mode shapes individually and the combined result to see if they look right and get insight into the building behaviour. Often a flaw in the model can be spotted this way.
Do a static run and compare to simple calculations as a check.
Review the total weight and mass printed out as a check.
Powerful graphical generators can be tricky and unexpectedly foul up the model. Check! Check! Check!
Response Spectrum Analysis for Structures and the NBCC 2005
University of British ColumbiaVancouver, June 1st & 2nd
Response Spectrum Seminar P5-6
Ron DeVall
Lecture 5
Filename, 11 1-2 June 2007The Response Spectrum - CSCE Vancouver Section
11
Ron DeVall
4 Some Computer Dynamic Spectrum Analysis Issues
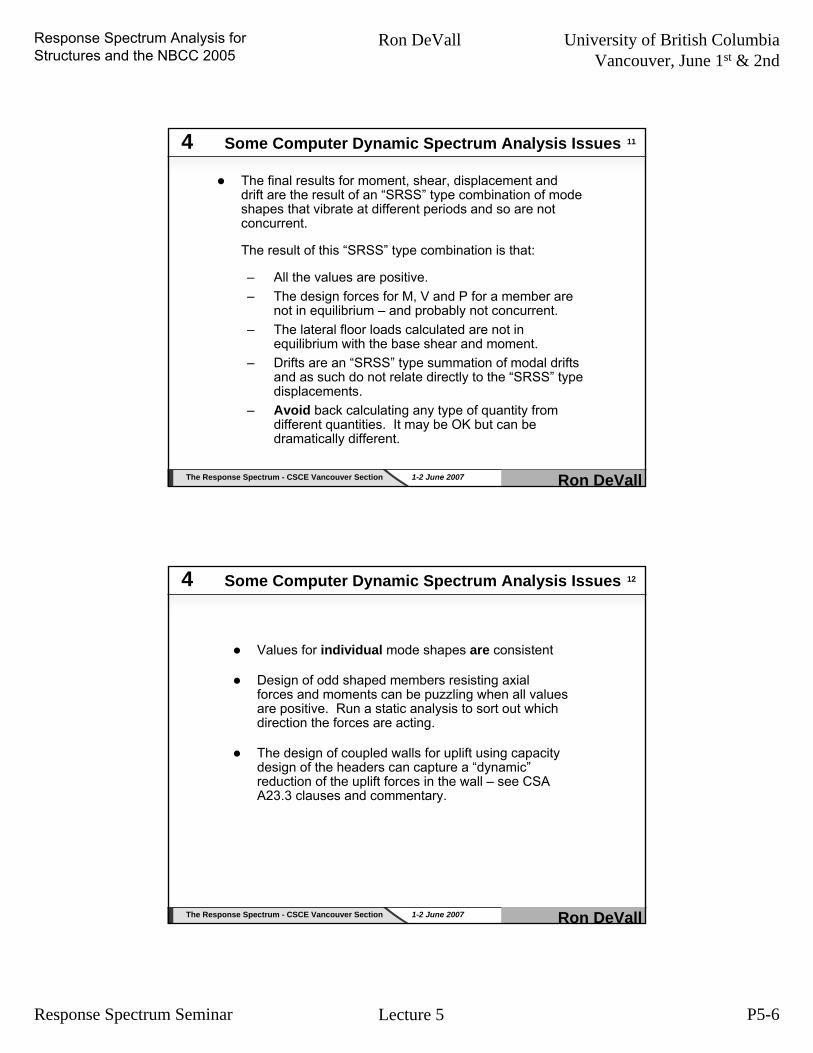
The final results for moment, shear, displacement and drift are the result of an “SRSS” type combination of mode shapes that vibrate at different periods and so are not concurrent.
The result of this “SRSS” type combination is that:
– All the values are positive.– The design forces for M, V and P for a member are
not in equilibrium – and probably not concurrent.– The lateral floor loads calculated are not in
equilibrium with the base shear and moment.– Drifts are an “SRSS” type summation of modal drifts
and as such do not relate directly to the “SRSS” type displacements.
– Avoid back calculating any type of quantity from different quantities. It may be OK but can be dramatically different.
Filename, 12 1-2 June 2007The Response Spectrum - CSCE Vancouver Section
12
Ron DeVall
4 Some Computer Dynamic Spectrum Analysis Issues
Values for individual mode shapes are consistent
Design of odd shaped members resisting axial forces and moments can be puzzling when all values are positive. Run a static analysis to sort out which direction the forces are acting.
The design of coupled walls for uplift using capacity design of the headers can capture a “dynamic”reduction of the uplift forces in the wall – see CSA A23.3 clauses and commentary.

Response Spectrum Analysis for Structures and the NBCC 2005
University of British ColumbiaVancouver, June 1st & 2nd
Response Spectrum Seminar P5-7
Ron DeVall
Lecture 5
Filename, 13 1-2 June 2007The Response Spectrum - CSCE Vancouver Section
13
Ron DeVall
5 NBCC 2005 Response Spectrum Dynamic Analysis
5.1 Spectrum
5.2 Scaling?
5.3 Minimum Force Level (and deflections!)
5.4 Minimum Force Level – Eccentric Building Issues
5.5 Accidental Eccentricity
5.6 P-Delta Effects
Filename, 14 1-2 June 2007The Response Spectrum - CSCE Vancouver Section
14
Ron DeVall
5.1 Response Spectrum – NBCC 2005
Site Properties Clause 4.1.8.4
The Response Spectrum is given on a city by city basis similar to the way snow and wind loads are presented.
The values are in Volume 2 – APP. C. and are given for natural periods of 0.2s, 0.5s, 1.0s and 2.0s.
For Vancouver the values are:
----
0.17g2.0s0.33g1.0s0.64g0.5s0.94g0.0s to 0.25

Response Spectrum Analysis for Structures and the NBCC 2005
University of British ColumbiaVancouver, June 1st & 2nd
Response Spectrum Seminar P5-8
Ron DeVall
Lecture 5
Filename, 15 1-2 June 2007The Response Spectrum - CSCE Vancouver Section
15
Ron DeVall
5.1 Response Spectrum – NBCC 2005
The value at 4.0s and beyond is taken as half that at 2.0s. This produces a flat spectrum past 4.0s, which has some interesting consequences for long period buildings.
Interpolation is used between these values.
These values are multiplied by the soil factors which can increase or reduce them.
This is easily entered into an analysis program. See Fig 1
These values are in “gravity” units and factors must be applied in the program to make them consistent with the "mass units"used in the program.
Filename, 16 1-2 June 2007The Response Spectrum - CSCE Vancouver Section
16
Ron DeVallFig 1
5.1 Response Spectrum – NBCC 2005

Response Spectrum Analysis for Structures and the NBCC 2005
University of British ColumbiaVancouver, June 1st & 2nd
Response Spectrum Seminar P5-9
Ron DeVall
Lecture 5
Filename, 17 1-2 June 2007The Response Spectrum - CSCE Vancouver Section
17
Ron DeVall
5.2 Scaling? – NBCC 2005
In NBCC 1995 (and previous versions) Dynamic Response Spectrum Analysis is an alternate to the static analysis but the results are scaled such that the dynamic base shear is made equal to the static base shear.
If the calculated dynamic analysis first period was larger than the static formulae calculated period, the dynamic period could be used to calculate a reduced static base shear – but not less than 80% of the code formulae approach
Filename, 18 1-2 June 2007The Response Spectrum - CSCE Vancouver Section
18
Ron DeVall
This was done to try and keep the base shear “analysis independent”, maintain a similar level of protection, and prevent designers from analysing very soft, flexible, long period, low force buildings based on “inappropriate”stiffness assumptions.
A few problems with this approach are:
If the building was actually very stiff, the higher dynamic forces could be ignored.
It can lead to very unconservative results for structures with large podiums or soft upper portions and stiff lower portions.
5.2 Scaling? – NBCC 2005

Response Spectrum Analysis for Structures and the NBCC 2005
University of British ColumbiaVancouver, June 1st & 2nd
Response Spectrum Seminar P5-10
Ron DeVall
Lecture 5
Filename, 19 1-2 June 2007The Response Spectrum - CSCE Vancouver Section
19
Ron DeVall
5.2 Scaling? – NBCC 2005
2005 NBCC Approach (4.1.8.11, 4.1.8.12)
The NBCC 2005 Approach is different.
Essentially, the elastic response using the code spectrum is calculated and the results are divided by RdRo
The values cannot be less than 80% of the static base shear for “regular” buildings and 100% of the static base shear for irregular buildings. If this shear is less, it must be scaled up to those minimum values. If the dynamic is higher than the static, then the dynamic results govern the design.
Stiff buildings or podium buildings typically will have higher shears and must be designed for them.
Essentially – the only scaling allowed would be upwards in value.
Filename, 20 1-2 June 2007The Response Spectrum - CSCE Vancouver Section
20
Ron DeVall
5.3 NBCC 2005 – Minimum Force Level
Minimum force level (and deflections) (4.1.8.11, 4.1.8.12)
Previous versions of NBCC raised the static base shear at long periods to account for higher modes and to provide a small degree of conservatism for long period (i.e. tall) buildings. This was done by allowing the design forces to fall of at 1/√T.
However, NBCC 2005 uses a spectrum that falls off at 1/T in the long period range. The seismologists stated they do not have a lot of date for long periods and their confidence in the numbers decreases as the periods increase.

Response Spectrum Analysis for Structures and the NBCC 2005
University of British ColumbiaVancouver, June 1st & 2nd
Response Spectrum Seminar P5-11
Ron DeVall
Lecture 5
Filename, 21 1-2 June 2007The Response Spectrum - CSCE Vancouver Section
21
Ron DeVall
5.3 NBCC 2005 – Minimum Force Level
Three Steps were taken to address this:
The spectrum at 4 seconds was taken as 50% of the 2 second value.
The spectrum runs flat after 4 seconds.
The minimum static force was taken as that at 2 seconds. This becomes the lower bound force (or 80% of it does) for dynamic analysis.
We ran some parametric studies of buildings with heightsof 200’ to 800’ and fundamental periods of 2s to 8s to examine the implications of the above. We also ran the results for a spectrum that kept falling off at 1/T past 4s for interest. The results are given in Table 1 and Table 2.
Filename, 22 1-2 June 2007The Response Spectrum - CSCE Vancouver Section
22
Ron DeVall
5.3 NBCC 2005 – Minimum Force Level
4,3201,428,526
11.762.20
2,160272,967
2.020.76
1,300115,000
0.840.63
VMDispDrift %
Dynamic (2s) (2005 code)Dynamic scaled to .8xStatic(2s)
5,4002,277,000
28.165.28
2,700533,900
6.872.58
1,350137,500
1.481.11
VMDispDrift %
Static (2s) (2005 code)i.e., evaluated at 2 second values
2,280475,000
3.570.67
1,820230,000
1.680.63
1,300115,000
0.840.63
VMDispDrift %
Dynamic2 (2005 code)Spectrum 1/T beyond 4 sec
2,510830,000
6.831.28
1,820230,000
1.700.64
1,300115,000
0.840.63
VMDispDrift %
Dynamic (2005 code)Spectrum flat 4 sec
144,000800
8
72,000400
4
36,000200
2
W, kips H, ftPeriod, s
Vancouver Shear WallsRdRo=5.6
Table 1

Response Spectrum Analysis for Structures and the NBCC 2005
University of British ColumbiaVancouver, June 1st & 2nd
Response Spectrum Seminar P5-12
Ron DeVall
Lecture 5
Filename, 23 1-2 June 2007The Response Spectrum - CSCE Vancouver Section
23
Ron DeVall
5.3 NBCC 2005 – Minimum Force Level
2,8801,421,053
11.082.08
1,440311,172
2.570.96
87095,700
0.790.5925
VMDispDrift %
Dynamic (2s) (2005 code)Dynamic scaled to .8xStatic(2s)
3,6002,191,000
17.23.23
1,800544,000
4.531.70
900131,000
1.10.83
VMDispDrift %
Static (2s) (2005 code)i.e evaluated at 2 second values
857378,000
2.90.54
885188,000
1.550.58
87097,000
0.790.5925
VMDispDrift %
Dynamic2 (2005 code)Spectrum 1/T beyond 4 sec
1,520750,000
5.851.10
870188,000
1.550.58
87095,700
0.790.5925
VMDispDrift %
Dynamic (2005 code)Spectrum flat 4 sec
144,000800
8
72,000400
4
36,000200
2
W, kips H, ftPeriod, s
Vancouver Moment FramesRdRo=6.8(coupled walls)
Table 2
Filename, 24 1-2 June 2007The Response Spectrum - CSCE Vancouver Section
24
Ron DeVall
A few comments about the result:
There is some thought being given to changing the lower bound to 4 second static forces.
Wind and wind drift will be a major factor for the taller long period buildings and will govern in many cases.
For the 8s frame building with a 1/T spectrum the base shear is 0.006 (0.6%) of the weight. (Hmmm!)
Note the flat spectrum past 4s has some effect on base shears but a large effect on moments and deflections.
5.3 NBCC 2005 – Minimum Force Level

Response Spectrum Analysis for Structures and the NBCC 2005
University of British ColumbiaVancouver, June 1st & 2nd
Response Spectrum Seminar P5-13
Ron DeVall
Lecture 5
Filename, 25 1-2 June 2007The Response Spectrum - CSCE Vancouver Section
25
Ron DeVall
5.4 Minimum Force Levels – Eccentric Building Issues
Certain types of eccentric buildings (as well as applying the spectrum along a non-principal axis) will generate out of plane dynamic forces which do not appear in a static analysis. This raises the question as to what to compare to the static base shear:
The component in the direction?The resultant?What???
There has been some discussion about this in CANCEE. The first thought was that using the component is too conservative, and to use the resultant instead. However this has some problems as well.
Filename, 26 1-2 June 2007The Response Spectrum - CSCE Vancouver Section
26
Ron DeVall
5.4 Minimum Force Levels – Eccentric Building Issues
At the moment the suggestion is to restrain the structure to vibrate in one direction only, determine the dynamic shear, and compare that to the static shear.
This is Professor Don Anderson’s suggestion and is supported by Professor Jag Humar; it is based on the following argument (I think):
We compare to the static base shear to make sure the model is not strangely soft compared to “experience”. Therefore check the model by doing this
This may not seem intuitive but the following will show that other methods can give very conservative answers that do not seem appropriate.

Response Spectrum Analysis for Structures and the NBCC 2005
University of British ColumbiaVancouver, June 1st & 2nd
Response Spectrum Seminar P5-14
Ron DeVall
Lecture 5
Filename, 27 1-2 June 2007The Response Spectrum - CSCE Vancouver Section
27
Ron DeVall
5.4 Minimum Force Levels – Eccentric Building IssuesWe will look at a 5 storey building that is 60m by 30m and is analyzed in 3 configurations.
i. Doubly symmetric and concentricii. Symmetric about the Y axis but very eccentric about the X axis.iii. Very eccentric about the X axis and slightly eccentric about the Y axis.
Note that since the height and weight are the same for all buildings, the static base shear is the same for all of them in both the X and Y directions. Also note that for the static results, loads in the X direction only produce a base shear in the X direction, and Y loads only produce a Y direction base shear for all 3 cases.
The data presented is raw dynamic data for the elasticresponse (RdRo=1.0) as it is the comparisons that are of interest
The building with eccentricities in two directions is then analyzed Restrained in the Y direction and the Z rotation direction and it is seen that (not surprisingly) it gives the same result as the symmetric building for the X direction.See the following figures and selected results.
Filename, 28 1-2 June 2007The Response Spectrum - CSCE Vancouver Section
28
Ron DeVall
5.4 Minimum Force Levels – Eccentric Building Issues
Fig 2

Response Spectrum Analysis for Structures and the NBCC 2005
University of British ColumbiaVancouver, June 1st & 2nd
Response Spectrum Seminar P5-15
Ron DeVall
Lecture 5
Filename, 29 1-2 June 2007The Response Spectrum - CSCE Vancouver Section
29
Ron DeVall
5.4 Minimum Force Levels – Eccentric Building Issues
Fig 3
Filename, 30 1-2 June 2007The Response Spectrum - CSCE Vancouver Section
30
Ron DeVall
5.4 Minimum Force Levels – Eccentric Building Issues
Fig 4

Response Spectrum Analysis for Structures and the NBCC 2005
University of British ColumbiaVancouver, June 1st & 2nd
Response Spectrum Seminar P5-16
Ron DeVall
Lecture 5
Filename, 31 1-2 June 2007The Response Spectrum - CSCE Vancouver Section
31
Ron DeVall
5.4 Minimum Force Levels – Eccentric Building Issues
Fig 5
Filename, 32 1-2 June 2007The Response Spectrum - CSCE Vancouver Section
32
Ron DeVall
5.4 Minimum Force Levels – Eccentric Building Issues
Fig 6

Response Spectrum Analysis for Structures and the NBCC 2005
University of British ColumbiaVancouver, June 1st & 2nd
Response Spectrum Seminar P5-17
Ron DeVall
Lecture 5
Filename, 33 1-2 June 2007The Response Spectrum - CSCE Vancouver Section
33
Ron DeVall
5.4 Minimum Force Levels – Eccentric Building Issues
Fig 7
Filename, 34 1-2 June 2007The Response Spectrum - CSCE Vancouver Section
34
Ron DeVall
5.4 Minimum Force Levels – Eccentric Building Issues
Fig 8

Response Spectrum Analysis for Structures and the NBCC 2005
University of British ColumbiaVancouver, June 1st & 2nd
Response Spectrum Seminar P5-18
Ron DeVall
Lecture 5
Filename, 35 1-2 June 2007The Response Spectrum - CSCE Vancouver Section
35
Ron DeVall
5.4 Minimum Force Levels – Eccentric Building Issues
Fig 9
Filename, 36 1-2 June 2007The Response Spectrum - CSCE Vancouver Section
36
Ron DeVall
5.4 Minimum Force Levels – Eccentric Building Issues
Fig 10

Response Spectrum Analysis for Structures and the NBCC 2005
University of British ColumbiaVancouver, June 1st & 2nd
Response Spectrum Seminar P5-19
Ron DeVall
Lecture 5
Filename, 37 1-2 June 2007The Response Spectrum - CSCE Vancouver Section
37
Ron DeVall
5.4 Minimum Force Levels – Eccentric Building Issues
Fig 11
Filename, 38 1-2 June 2007The Response Spectrum - CSCE Vancouver Section
38
Ron DeVall
5.4 Minimum Force Levels – Eccentric Building Issues
Fig 12

Response Spectrum Analysis for Structures and the NBCC 2005
University of British ColumbiaVancouver, June 1st & 2nd
Response Spectrum Seminar P5-20
Ron DeVall
Lecture 5
Filename, 39 1-2 June 2007The Response Spectrum - CSCE Vancouver Section
39
Ron DeVall
5.4 Minimum Force Levels – Eccentric Building Issues
The results are summarized in Table 3.
Base Shear
Periods in
Second
------
15,17526,935
0.035,149
0.035,085
Dynamic YX Axis (kn)Y Axis (kn)
33,975--
21,50915,175
24,1850.0
33,7350.0
Dynamic XX Axis (kn)Y Axis (kn)
0.60----
0.890.6170.494
0.7580.5470.483
(TOR)0.6110.6080.548
123
RestrainedUnsymmetric2 Axes
Y Symmetry Only
Symmetric Building
Mode Shape
Table 3
Filename, 40 1-2 June 2007The Response Spectrum - CSCE Vancouver Section
40
Ron DeVall
Review of Table 3 raises several questions:What period to use for the static calculations? The fundamental period of the symmetric building is torsion. The unsymmetricbuildings are clearly softened by the eccentricities and the lowest periods have large torsions in their mode shapes.
The double unsymmetry produces out of plane forces. This may not be intuitive. However, for the first two buildings, deflection along X, even with rotation about Z, does not produce a C.M. deflection along Y. However, for the doubly unsymmetric building a deflection along X produces a Y displacement due to rotation about Z. For the dynamic case, this generates dynamic forces inthe Y direction. This is not true for the static case.
What to compare to the X static force – the X component or the resultant?
Looking at the “dynamic X” results it seems clear that scaling to the X component of the resultant is conservative and penalizes what is a “real” effect of base shear reduction for eccentric buildings. (This effect is discussed in “Fundamentals of Earthquake Engineering” by Newmark and Rosenblueth, 1971)
5.4 Minimum Force Levels – Eccentric Building Issues

Response Spectrum Analysis for Structures and the NBCC 2005
University of British ColumbiaVancouver, June 1st & 2nd
Response Spectrum Seminar P5-21
Ron DeVall
Lecture 5
Filename, 41 1-2 June 2007The Response Spectrum - CSCE Vancouver Section
41
Ron DeVall
Review of the static calculation also raises some questions. The values are approximately:
For the short period cut off of 0.667 times the 0.2 second spectral value.Vb ≅ 46,000kn (+/-)(NBCC does not address this cut-off if a dynamic is used for a short period building – this is a problem.)
Static code value = 0.05(20)0.75
= 0.47 seconds X 2 = 0.94 seconds
For T = 0.61 secondsVb= 41,300 kn (+/-)
For T = 0.758 secondsVb= 34,920 kn
For T = 0.89 seconds (not really a pure X direction period)Vb= 29,200 kn
For comparison to the static, a lower bound of 80% of the static can be used for regular buildings and 100% for irregular buildings. Table 4 shows a few lower bound checks for the X direction.
5.4 Minimum Force Levels – Eccentric Building Issues
Filename, 42 1-2 June 2007The Response Spectrum - CSCE Vancouver Section
42
Ron DeVall
5.4 Minimum Force Levels – Eccentric Building Issues
1.3621,500 (component)
29,300 (1.0)0.89
1.4424,20034,900 (1.0)0.758Singly Symmetric Use Actual Period (dubious)
1.1126,300 (resultant)
29,300 (1.0)0.89Doubly Symmetric Use Actual Period (dubious)
1.2233,90041,300 (1.0)(Unsymmetricbuildings)
0.61Scale to Restrained Case (Jag Humar, Don Anderson)
1.033,00041,300 (0.8)0.61Symmetric Building
Scale Factor
V DynamicV StaticT
Scale Factor For Lower Bounds Calculated For Various Assumptions - X direction.
Table 4

Response Spectrum Analysis for Structures and the NBCC 2005
University of British ColumbiaVancouver, June 1st & 2nd
Response Spectrum Seminar P5-22
Ron DeVall
Lecture 5
Filename, 43 1-2 June 2007The Response Spectrum - CSCE Vancouver Section
43
Ron DeVall
Recommend:
Use Professors Humar and Anderson’s suggestion
Restrain the structure to determine the period for determinationof the static shear.
This captures “suitability” of the stiffness of the model, which is the main reason for any kind of “comparing to static” approach.
Determine any lower bounds and appropriate “upward” scale factors from this approach.
It removes the uncertainty of how much of the fundamental period is softened by including torsional components.
It allows full capture of the “real” torsional behaviour of the model.For the example buildings, it gives lower scaling values except for the dubious example where the period contains lots of “torsion” – and even here it is only about 10% high.
5.4 Minimum Force Levels – Eccentric Building Issues
Filename, 44 1-2 June 2007The Response Spectrum - CSCE Vancouver Section
44
Ron DeVall
5.5 Accidental Eccentricity
Accidental eccentricities are used by codes to account for torsional amplification and uncertainties in stiffness, mass distribution, and torsional effects of the ground motion.
Earlier pre 1995 NBCC codes and current U.S. codes allow shifting the mass to account for accidental torsional effects.
However, for the buildings that have a torsional fundamental period much greater than the lateral periods, shifting the mass often has little effect on the results. The dynamic effect is torsional de-amplification(see Newmark and Rosenblueth). Design on this basis produces soft and weak buildings in torsion. CANCEE judges this to be undesirable and requires that for this type of building the accidental torques should be applied statically which is difficult for torsionally soft buildings to deal with
The NBCC 2005 proposals allow shifting the mass a reduced amount of 0.05D for “not soft” torsional buildings but applying the accidental eccentricity (0.1D) statically for “torsionally soft” buildings. Since the static approach is quite demanding it allows loads from either the static method or a static load case developed from dynamic analysis. This last approach was not in NBCC 1995.
Response Spectrum Analysis for Structures and the NBCC 2005
University of British ColumbiaVancouver, June 1st & 2nd
Response Spectrum Seminar P5-23
Ron DeVall
Lecture 5
Filename, 45 1-2 June 2007The Response Spectrum - CSCE Vancouver Section
45
Ron DeVall
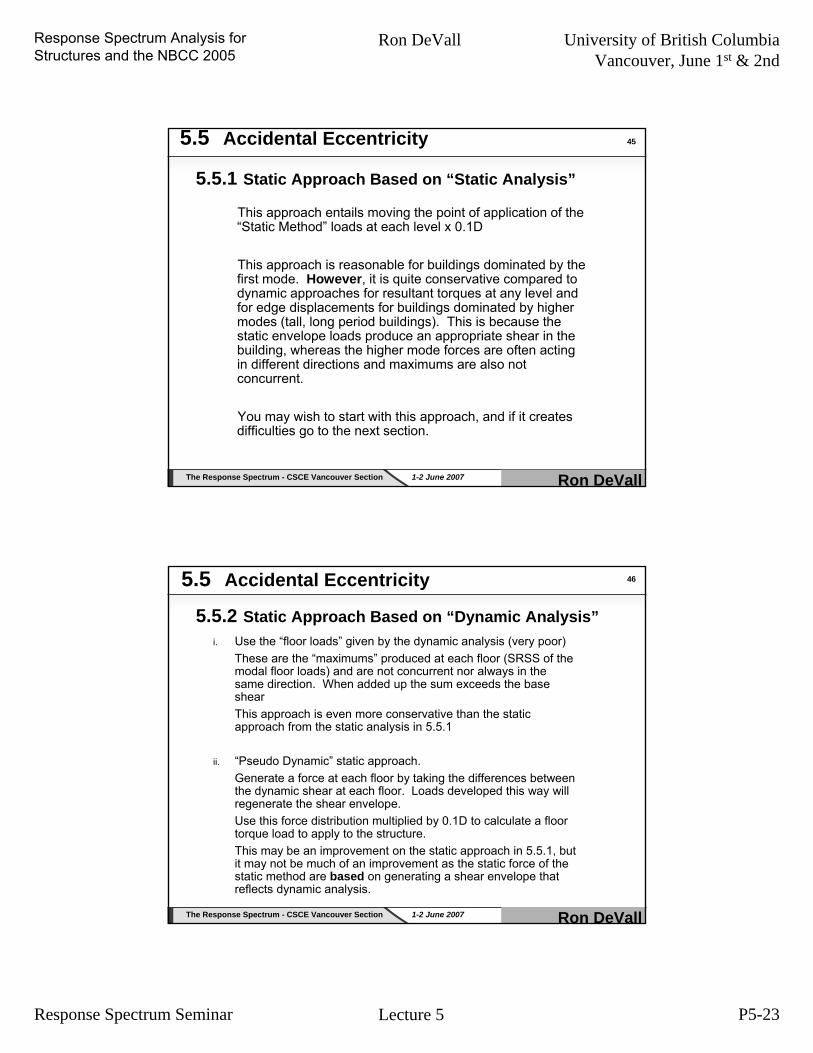
This approach entails moving the point of application of the “Static Method” loads at each level x 0.1D
This approach is reasonable for buildings dominated by the first mode. However, it is quite conservative compared to dynamic approaches for resultant torques at any level and for edge displacements for buildings dominated by higher modes (tall, long period buildings). This is because the static envelope loads produce an appropriate shear in the building, whereas the higher mode forces are often acting in different directions and maximums are also not concurrent.
You may wish to start with this approach, and if it creates difficulties go to the next section.
5.5.1 Static Approach Based on “Static Analysis”
5.5 Accidental Eccentricity
Filename, 46 1-2 June 2007The Response Spectrum - CSCE Vancouver Section
46
Ron DeVall
i. Use the “floor loads” given by the dynamic analysis (very poor)These are the “maximums” produced at each floor (SRSS of the modal floor loads) and are not concurrent nor always in the same direction. When added up the sum exceeds the base shear This approach is even more conservative than the static approach from the static analysis in 5.5.1
ii. “Pseudo Dynamic” static approach.Generate a force at each floor by taking the differences betweenthe dynamic shear at each floor. Loads developed this way will regenerate the shear envelope.Use this force distribution multiplied by 0.1D to calculate a floor torque load to apply to the structure.This may be an improvement on the static approach in 5.5.1, but it may not be much of an improvement as the static force of the static method are based on generating a shear envelope that reflects dynamic analysis.
5.5 Accidental Eccentricity
5.5.2 Static Approach Based on “Dynamic Analysis”

Response Spectrum Analysis for Structures and the NBCC 2005
University of British ColumbiaVancouver, June 1st & 2nd
Response Spectrum Seminar P5-24
Ron DeVall
Lecture 5
Filename, 47 1-2 June 2007The Response Spectrum - CSCE Vancouver Section
47
Ron DeVall
iii. “Real dynamic” static approachThe following assumes that the analysis program (ETABS is one) does not do this automatically.
Export the mode shapes, floor masses, periods, participation factors and spectrum to a spread sheet.Use basic principals and use the spread sheet to combine the above and generate the modal loads for the appropriate direction of spectral excitation.Check the modal base shears against the program. (Check!, Check!)Apply the “scale factors” if required.Calculated the accidental modal torques applied to each level for each mode shape, accounting for sign.
Apply to the structure and sum results for the mode shape “accidental” torques using CQC or SRSS
This is quite an accurate approach but is a lot of work!!
5.5 Accidental Eccentricity
5.5.2 Static Approach Based on “Dynamic Analysis”
Filename, 48 1-2 June 2007The Response Spectrum - CSCE Vancouver Section
48
Ron DeVall
iv. Pseudo “real dynamic” approach
Repeat the steps in (iii.) up to calculation of the modal accidental torques applied to each floor. Then use the spread sheet to continue on as follows:
Sum each of the modal accidental floor torques down the building to get the torsional resultant for each mode at each floor.
Do an SRSS of the modal resultant torsions at each floor to get one value of the accidental torsional resultant at each floor.
Use this envelope of torsion to back figure a single floor torque load at each floor by subtracting the different torsional resultant values at adjacent floors.
These “back figured” floor torques (one per floor) will generate the SRSS torsional resultant at any level when summed over the floors above.
Use these “backfigured” floor torques as a single load case in the analysis program. This is much easier to deal with.
5.5 Accidental Eccentricity5.5.2 Static Approach Based on “Dynamic Analysis”

Response Spectrum Analysis for Structures and the NBCC 2005
University of British ColumbiaVancouver, June 1st & 2nd
Response Spectrum Seminar P5-25
Ron DeVall
Lecture 5
Filename, 49 1-2 June 2007The Response Spectrum - CSCE Vancouver Section
49
Ron DeVall
5.6 P – Delta Effect
While this seminar is for Dynamic Response Spectrum Analysis, many of the topics discussed here apply to a regular “static”earthquake analysis.
The “P” force to be considered is the total gravity effect – not just the vertical load in any element being considered.
We think of P – Delta effects as “non linear”, and they are with P. However for a given value of P, the equations (both differential and matrix) are linear and super position holds forother load cases. This is quite helpful.
It is important to note that all the methods that will be presented are approximations to a very difficult problem –dynamic stability
5.6.1 General Background
Filename, 50 1-2 June 2007The Response Spectrum - CSCE Vancouver Section
50
Ron DeVall
There is a fundamental difference in behaviour between wind loads and earth quake loads.
Wind loads – Increasing P increases displacements and forces, and the usual “P – Delta” analysis works fine.
Earthquake Loads – increasing P does not increase the maximum displacements until a difficult to determine critical value is reached – and then the displacement blows up. This is illustrated by figures from Prof. Bermalat Northwestern University. See Fig 13. It may be these curves that give us the idea that the displacements do not need to be increased for P – Delta effects.
The Canadian code approach is based on work like this and others, such as Jim Montgomory, P.h.D, P.Eng, and work by Tom Paulay. See Fig 14 and 15.
5.6 P – Delta Effect

Response Spectrum Analysis for Structures and the NBCC 2005
University of British ColumbiaVancouver, June 1st & 2nd
Response Spectrum Seminar P5-26
Ron DeVall
Lecture 5
Filename, 51 1-2 June 2007The Response Spectrum - CSCE Vancouver Section
51
Ron DeVallFig 13
5.6 P – Delta Effect
Filename, 52 1-2 June 2007The Response Spectrum - CSCE Vancouver Section
52
Ron DeVall
5.6 P – Delta Effect
Fig 14
P – delta effects for single storey buildings

Response Spectrum Analysis for Structures and the NBCC 2005
University of British ColumbiaVancouver, June 1st & 2nd
Response Spectrum Seminar P5-27
Ron DeVall
Lecture 5
Filename, 53 1-2 June 2007The Response Spectrum - CSCE Vancouver Section
53
Ron DeVall
5.6 P – Delta Effect
Fig 15
Filename, 54 1-2 June 2007The Response Spectrum - CSCE Vancouver Section
54
Ron DeVall
This approach calculates a factor to apply to the design force values. It is based on the “expected, elastic”displacements and when the factor exceeds 1.4 the structure should be stiffened.
Note that while stiffness could be added, the approaches tend to “fix what is there” by adding strength instead. (note that often this results in an increase in stiffness as well.) The displacement is the same for both the P case and the P = 0.0 case.
Note also that the derivation of the equations for this approach tends to be frame based. It also addresses X and Y but no torsional effects. The strength increase required is based on the resistance including the “overstrength” effects. This philosophy holds true for the following discussions as well, i.e., the increase is added to the “actual” strength, not the factored strengths.
5.6 P – Delta Effect

Response Spectrum Analysis for Structures and the NBCC 2005
University of British ColumbiaVancouver, June 1st & 2nd
Response Spectrum Seminar P5-28
Ron DeVall
Lecture 5
Filename, 55 1-2 June 2007The Response Spectrum - CSCE Vancouver Section
55
Ron DeVall
The code requirement is that the P – Delta effects are based on:
(elastic forces/Rd) + P x Deltaelastic
This means that it is not correct to do an elastic run with P-Delta effects and divide the results by RdRo as this also divides the P-Delta component. The appropriate approach is more complicated.
5.6 P – Delta Effect
5.6.2 Complications Introduced by Ductility
Filename, 56 1-2 June 2007The Response Spectrum - CSCE Vancouver Section
56
Ron DeVall
Check the periods, and make sure the torsional period is about the same or less than the X and Y periods.
Use the principals of the NBCC commentary approach by:i. Take the elastic displacement of the centroid of the weight and
calculate the P-Delta base moment about X and Y (M P-Delta)
ii. Calculate the base moment MRd using Rd with Ro = 1.0
iii. Calculate a factor “F” for X and Y
F = (MRd + MP-Delta)/MRd
If “F” is greater than 1.4, stiffen the structure.
iv. Apply to the program forces calculated using RdRo for the respective direction of load.
v. Note this assumes any torsional effects will have multipliers less than or equal to the X and Y factors. The limit on the torsional period may make this so but it is an iffy assumption.
5.6.3 “Rough” Approach For Walls - No P-Delta in Program
5.6 P – Delta Effect

Response Spectrum Analysis for Structures and the NBCC 2005
University of British ColumbiaVancouver, June 1st & 2nd
Response Spectrum Seminar P5-29
Ron DeVall
Lecture 5
Filename, 57 1-2 June 2007The Response Spectrum - CSCE Vancouver Section
57
Ron DeVall
The following approach is based on values determined at the elastic response values. Because super position holds, spectrum values reduced for RdRo can also be used, with differences for P-Delta increased by RdRo
i. Analyze the structure for RdRo = 1 and P = 0
ii. Analyze the structure for RdRo = 1 and P = P
iii. The difference in M, V, and Axial values is due to P-Delta effects at “elastic” displacements.
5.6 P – Delta Effect
5.5.4 Approach for walls – P-Delta in program-force multiplier approach, force increase approach
Filename, 58 1-2 June 2007The Response Spectrum - CSCE Vancouver Section
58
Ron DeVall
iv. These can:• Be reduced by dividing by Ro and adding directly to the design
values to be resisted by factored resistances.
• Or (an approximate shortcut) calculate the difference in moment/axial at the base for each element and determine a multiplier for each element
Factor = (MRd + MP-Delta)/MRd
This should capture torsion effects – but it also assumes the maximum factor is at the base. This may not be too bad an assumption for walls, but it should be confirmed.• Or (an approximate shorter cut)
This is more-or-less the approach in the commentary
Perform the above calculation for the total base overturning moments and torque. Use the largest value of the calculatedfactor for all design values.
These “factors calculated at the base” may be a reasonable approximation for walls but may be poor for frames with a soft storey.
5.6 P – Delta Effect

Response Spectrum Analysis for Structures and the NBCC 2005
University of British ColumbiaVancouver, June 1st & 2nd
Response Spectrum Seminar P5-30
Ron DeVall
Lecture 5
Filename, 59 1-2 June 2007The Response Spectrum - CSCE Vancouver Section
59
Ron DeVall
This approach is handy because the effects at design force levels captures the P-Delta effect using increased displacements. This means all the design forces come out directly, including torsional effects if done properly.
However, a common way of doing this is to modify the stiffness matrix (for Rd=4.0 say) by terms such as P X 4Delta. Unfortunately this seems to be the same as 4P X Delta. Etabs seems to do this, and this really softens up the building stiffness and increases the periods and displacements even as it may reduce the forces.
The question is – what building is being analyzed? Is this effect “correct”?
5.6 P – Delta Effect
5.6.5 P-Delta included in the program which also has a displacement multiplier in it.
Filename, 60 1-2 June 2007The Response Spectrum - CSCE Vancouver Section
60
Ron DeVall
Comment – suggest this is not correct and the structure should be brought back to the original (P=P) periods by tweaking the stiffness by various means such as stiffening elements or modifying E value.
If the change in periods associated with X, Y and Theta are about the same, then it is easy to change the E value to bring them all back to the original value.
However, if this cannot easily be done, then previous methods using factors can be used.
5.6 P – Delta Effect

Response Spectrum Analysis for Structures and the NBCC 2005
University of British ColumbiaVancouver, June 1st & 2nd
Response Spectrum Seminar P5-31
Ron DeVall
Lecture 5
Filename, 61 1-2 June 2007The Response Spectrum - CSCE Vancouver Section
61
Ron DeVall
QUESTIONS ????