Embed Size (px)
Citation preview
The Response of Tropospheric Circulation to Perturbations inLower-Stratospheric Temperature
JOANNA D. HAIGH
Department of Physics, Imperial College, London, United Kingdom
MICHAEL BLACKBURN
Centre for Global Atmospheric Modelling, University of Reading, Reading, United Kingdom
REBECCA DAY
Department of Physics, Imperial College, London, United Kingdom
(Manuscript received 14 April 2004, in final form 21 February 2005)
ABSTRACT
A multiple regression analysis of the NCEP–NCAR reanalysis dataset shows a response to increasedsolar activity of a weakening and poleward shift of the subtropical jets. This signal is separable from otherinfluences, such as those of El Niño–Southern Oscillation (ENSO) and the North Atlantic Oscillation(NAO), and is very similar to that seen in previous studies using global circulation models (GCMs) of theeffects of an increase in solar spectral irradiance. The response to increased stratospheric (volcanic) aerosolis found in the data to be a weakening and equatorward shift of the jets.
The GCM studies of the solar influence also showed an impact on tropospheric mean meridional circu-lation with a weakening and expansion of the tropical Hadley cells and a poleward shift of the Ferrel cells.To understand the mechanisms whereby the changes in solar irradiance affect tropospheric winds andcirculation, experiments have been carried out with a simplified global circulation model. The results showthat generic heating of the lower stratosphere tends to weaken the subtropical jets and the troposphericmean meridional circulations. The positions of the jets, and the extent of the Hadley cells, respond to thedistribution of the stratospheric heating, with low-latitude heating forcing them to move poleward, andhigh-latitude or latitudinally uniform heating forcing them equatorward. The patterns of response aresimilar to those that are found to be a result of the solar or volcanic influences, respectively, in the dataanalysis.
This demonstrates that perturbations to the heat balance of the lower stratosphere, such as those broughtabout by solar or volcanic activity, can produce changes in the mean tropospheric circulation, even withoutany direct forcing below the tropopause.
1. Introduction
The role of the stratosphere in modulating the impactof solar variability on climate has been considered froma range of angles. From the point of view of radiativeforcing of climate, it is clear that the increased strato-spheric ozone concentrations that are present duringperiods of higher solar activity tend to reduce the direct(shortwave) radiative effect, but enhance the infraredcomponent (Haigh 1994). However, the magnitude,
and even the sense of the net effect, is uncertain, withestimates of the amplification by solar-induced ozoneof the net radiative forcing ranging from about �25%(Wuebbles et al. 1998) to �45% (Hansen et al. 1997;Larkin et al. 2000), and being largely dependent onassumptions concerning the distribution of the ozoneincrease. Narrowing these uncertainties is very impor-tant in terms of assessing the relative importance ofsolar radiative forcing in the context of other factorscontributing to climate change; but, a consideration ofradiative forcing alone does not provide a route to un-derstand the atmospheric response, observed in variousmeteorological parameters, which is geographicallynonuniform.
In the troposphere, these observations [e.g., studies
Corresponding author address: Joanna D. Haigh, Space andAtmospheric Physics, Blackett Laboratory, Imperial College,London SW7 2AZ, United Kingdom.E-mail: [email protected]
3672 J O U R N A L O F C L I M A T E VOLUME 18
© 2005 American Meteorological Society
JCLI3472
of Northern Hemisphere (NH) upper-troposphericthickness by van Loon and Shea (2000) or of zonalmean temperature by Haigh (2003)] tend to show thelargest effects in the midlatitudes, suggesting a dynami-cal response to the solar forcing. One theory to explainthese effects has been developed by Kodera andKuroda (2002) who, using data analysis and numericalmodels, have shown that heating perturbations in theNorthern Hemisphere winter stratosphere may modu-late the upward propagation of planetary waves andthat the interaction can move downward to lower lev-els. Other work (e.g., Shindell et al. 2001) has suggestedthat such wave propagation effects may shift the NorthAtlantic Oscillation (NAO) into a more positive phase.Gray et al. (2001) have shown a lagged correlation be-tween equatorial upper-stratospheric winds and polarlower-stratospheric temperatures, again induced bymodulating wave propagation. These ideas provide im-portant routes to understand solar–climate interactions,but are effective only in the Northern Hemisphere win-ter. Other explanations must be found for the effectsthat occur throughout the year in both hemispheres.
In this paper we present an analysis of the observedresponse of zonal winds to solar, and other, influencesand compare this with previously published studies us-ing full global circulation models (GCMs). To aid in theinterpretation of the observational and GCM results,we then investigate, using a simplified climate model,how generic heating to the lower stratosphere influ-ences the circulation of the troposphere.
2. Data analysis
a. The data and the methodology
In a previous study (Haigh 2003) we presented a mul-tiple linear regression analysis of zonal mean tempera-ture data from the National Centers for EnvironmentalPrediction–National Center for Atmospheric Research(NCEP–NCAR) reanalysis dataset, as provided by theClimate Diagnostics Center, in Boulder, Colorado (in-formation available online at http://www.cdc.noaa.gov/). The multiple regression model (M. Allen 1998,personal communication) incorporated an autoregres-sive noise model of the order of one, and was usedwith the following 11 climate indices: a constant; a lin-ear trend; predictors for solar activity [SOL; 10.7-cmflux from the National Geophysical Data Center (in-formation online at ftp://ftp.ngdc.noaa.gov/STP/SOLAR_DATA/)]; the quasi-biennial oscillation[QBO; zonal wind at 40 hPa over Singapore (from B.Naujokat, Free University of Berlin)]; El Niño–Southern Oscillation [ENSO; “cold tongue” index fromthe University of Washington at Seattle (information
online at http://tao.atmos.washington.edu/data_sets/cti/)]; stratospheric aerosol loading [VOL; presumed tobe largely in response to volcanic eruptions, as con-structed by Sato et al. (1993); a background level isassumed since 1996]; the NAO (from the University ofEast Anglia (online at http://www.cru.uea.ac.uk/�timo/projpages/nao_update.htm)]; and four indices repre-senting the amplitude and phase of both the annual andsemiannual cycles.
At periods of maximum, relative to minimum, solaractivity over the 11-yr solar cycle, regions of statisticallysignificant (at the 95% level) warming were detected inthe low-latitude lower stratosphere and in verticalbands extending throughout the troposphere in themidlatitudes. The response to volcanic aerosol wasfound to be rather different, with a heating of the lowerstratosphere occurring across all latitudes and a coolingof the troposphere, especially in the midlatitudes.
Here we apply the same technique to the NCEP–NCAR reanalysis zonal mean zonal winds. The timeperiod that is covered is January 1979–May 2002; ear-lier data are not used because of the well-known prob-lem with the reanalysis in the stratosphere before theincorporation of satellite data in 1979 (see, e.g., Randelet al. 2000; Haigh 2003). All data and indices aremonthly and (where appropriate) zonally averaged,and the analysis is carried out separately at each pointon a grid of 73 latitudes and 17 isobaric levels.
A basic assumption of multivariate regression is thatthe indicators are independent and the effects are lin-early additive. The cross correlations between the indi-ces are shown in Table 1. This shows that the largestvalues occur between VOL and ENSO (0.326), andVOL and QBO (�0.106), so that the responses that arefound for these indices may be mixed. The correlationsbetween the solar index and other indices are small, lessthan 0.1 in all cases, so the scope for mixing these sig-nals is less. Note, however, that the covariances be-tween the indices are formally taken into account in theassessment of the statistical significance of the resultspresented in the next section.
b. Results
Figure 1a shows the zonal mean wind averaged overthe inclusive period of January 1979–May 2002. The
TABLE 1. Cross correlations between the regression indices.
SOL QBO ENSO VOL
NAO 0.088 �0.032 0.010 0.082VOL �0.070 �0.106 0.326ENSO �0.038 �0.019QBO �0.054
1 SEPTEMBER 2005 H A I G H E T A L . 3673

remaining panels show the components ascribed to thedifferent indices as a function of latitude and pressure:(Fig. 1b) a linear trend, (Fig. 1c) the difference betweenminimum and maximum solar activity (which, over theperiod concerned, represents a typical 11-yr activitycycle), (Fig. 1d) a typical QBO cycle; (Fig. 1e) the dif-ference between a period of low-stratospheric aerosoland that following the eruption of Mt. Pinatubo, and(Figs. 1f and 1g, respectively) the effect of large ENSOand NAO cycles. Statistical significance was estimatedusing a Student’s t test, taking into account the tempo-ral autocorrelation of the data and any correlation be-tween the indices. Details of this methodology can befound in standard statistical texts [we found that of vonStorch and Zwiers (1999) to be particularly useful]. Sig-nificance values are not shown in the figure for reasonsof clarity, but the regions of �90% significance largelycorrespond to those that are shown for temperature byHaigh (2003), and generally occur where the signal isgreater than about 0.5 m s�1. The lack of obvious noisein the figures, despite the regression having been car-ried out independently at each grid point, and the hemi-
spheric symmetry at low latitudes provide further reas-surance of the reliability of the results.
The solar signal is seen to be composed of bandedstructures in the midlatitudes. The largest changes, areduction of over 1 m s�1, are present on the equator-ward sides of the jet cores, with positive values, of a fewtenths of 1 m s�1, further poleward. Both the shape andthe amplitude of this pattern are remarkably similar tothose found in the GCM simulations of Haigh (1996,1999) and, using an entirely different model, Larkin etal. (2000). These model studies included the effects ofchanges in solar spectral irradiance where the largestdirect radiative impact, resulting from enhanced solarUV, is found in the stratosphere.
The results clearly show a weakening and polewardshift of the jets when the sun is more active, again, aspredicted by the model studies. The GCMs also pre-dicted a response to higher levels of solar UV in thetropospheric mean meridional circulation. This con-sisted of a weakening and expansion of the Hadley cellsand a poleward shift of the Ferrel cells. It is interestingto note that precisely these features, which are highly
FIG. 1. Amplitudes of the components of the NCEP–NCARzonal mean zonal wind resulting from the (a) mean, (b) trend,(c) solar, (d) QBO, (e) volcanoes, (f) ENSO, and (g) NAO. Theunits are m s�1 decade�1 for the trend, and otherwise are themaximum variation (m s�1) over the data period.
3674 J O U R N A L O F C L I M A T E VOLUME 18
correlated with solar activity, have now been detectedin NCEP–NCAR vertical velocity data (Gleisner andThejll 2003).
The responses to the other indices show differentpatterns; Fig. 1e presents, for the volcanic aerosol, ver-tical bands at different latitudinal positions than thoseappearing in the solar case, which are also of a some-what larger magnitude. As in the solar case, the jets areweaker, but for the volcanic aerosol case they appear toshrink in latitudinal extent, with a greater shift towardthe equator. In the Northern Hemisphere, the NAOsignal (Fig. 1g) is somewhat similar to that resultingfrom the sun, although it is shifted slightly equatorward.The temporal correlation between the SOL and NAOindices is 0.088, so it is feasible that some of the NAOeffect might be ascribed to the sun. The NAO signal inthe Southern Hemisphere, however, is negligible, andthe degree of hemispheric symmetry in the solar signalsuggests that the result is robust; remember that thecalculations are carried out independently at each gridpoint. Furthermore, the deduced solar signal is some-what weaker in the Northern Hemisphere, so that ar-guments based on hemispheric symmetry would suggestthat some of the solar signal might have been mappedonto the NAO, rather than vice versa. Some studieshave suggested that solar activity may induce the NAOinto a more positive phase (Shindell et al. 2001), whichwould mean that the two effects are not linearly inde-pendent, but also suggest that the solar signal that isdeduced here would be a low estimate in the NorthernHemisphere.
3. Investigations with a simplified globalcirculation model
a. The model and the experiments
To understand the mechanisms underlying the ob-served tropospheric variability that are associated withsolar and volcanic forcing, idealized forcing experi-ments have been performed using a simplified globalcirculation model (sGCM).
The model uses the spectral dynamical core, de-scribed by Hoskins and Simmons (1975), that is modi-fied to include the angular momentum–conserving ver-tical discretization of Simmons and Burridge (1981),but retains the original sigma coordinate. All experi-ments use a T42L15 resolution, denoting triangularspectral truncation at a total wavenumber 42, which isequivalent to an equatorial grid spacing that is close to475 km for the equivalent linear transform grid; and 15levels between the surface and � � 0.0185, with thelevel spacing chosen such that it provides particularlygood resolution in the region of the tropopause [the
model levels are at 18.5, 59.6, 106, 152, 197, 241, 287,338, 400, 477, 569, 674, 784, 887, and 967 in units of�(1000�1)].
The model’s climate is maintained using the linearforcing and drag scheme of Held and Suarez (1994), inplace of the moist parameterizations of a full GCM.Orography is omitted. Temperature is relaxed toward azonally symmetric equilibrium distribution, on a timescale that is 40 days above ��0.7 (representing radia-tion and deep, moist processes), but reduces to 4 days atthe equatorial surface (representing the planetaryboundary layer). Rayleigh friction is included belowsigma�0.7, with a time scale of 1 day at the surface.Radiative forcing perturbations are represented bymodifications of the equilibrium temperature distribu-tion in the stratosphere.
The equilibrium temperature Te is a function only oflatitude �, and pressure p:
Te��, p � max��Ttpeq � �Ttp sin2�
�T0 � �Ty sin2� � ���eq cos2�
� ��pl sin2� log� p
p0��� p
p0���,
where p0 is a reference surface pressure, Ttpeq is thetemperature of the equatorial tropopause, �Ttp is thedifference in temperature between the equatorial andpolar tropopause, T0 is the temperature of the surfaceat the equator, �Ty is the difference in surface tempera-ture between equator and poles, and ��eq and ��pl arethe lapse-rate factors (the increase in potential tem-perature with an increase in altitude of one pressurescale height) at the equator and poles, respectively. Inall of the runs discussed here p0 � 1000 hPa, T0 � 315K, �Ty � 60 K, ��eq � 10 K, and ��pl � 0 K. For thecontrol run, Ttpeq � 200 K and �Ttp � 0 K.
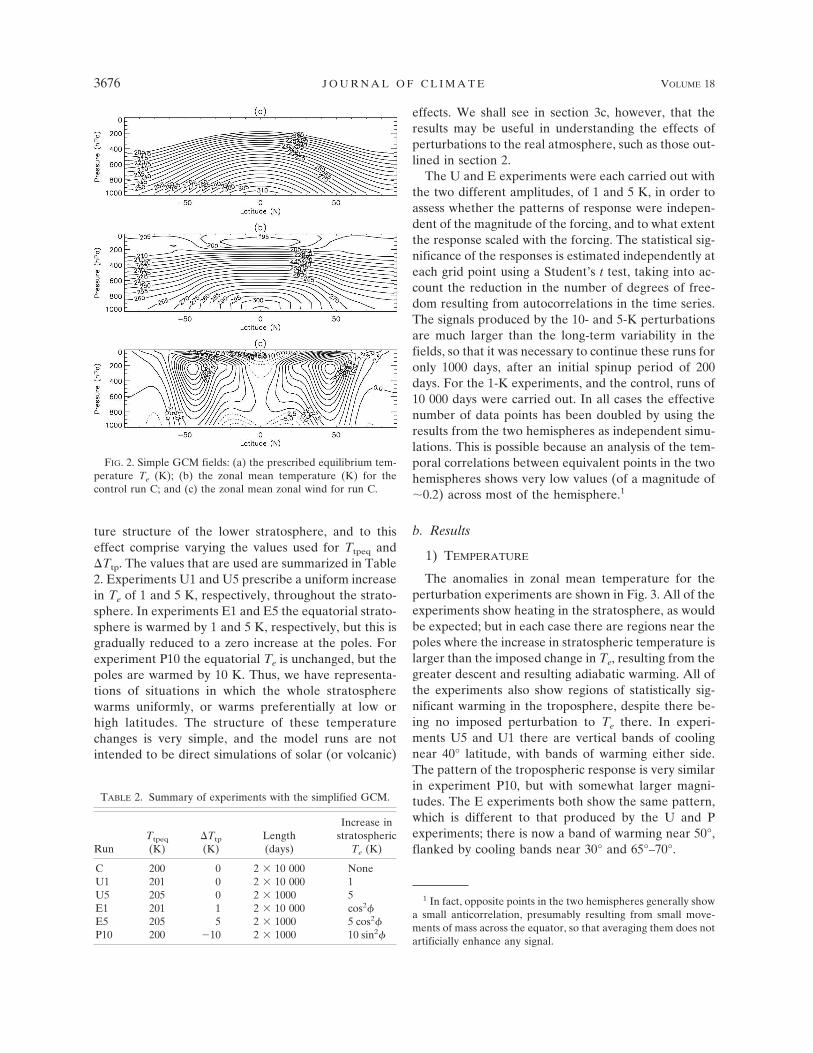
The structure of the equilibrium temperature fieldand the resultant model temperature field for the con-trol run are shown in Figs. 2a and 2b. The dynamicalresponse to the equilibrium structure is such as to causeadiabatic warming at the mid- to high latitudes andcooling at low latitudes, so that although Te is uniformand constant above the tropopause, the model shows apositive latitudinal temperature gradient there, while inthe troposphere the negative temperature gradients arereduced. The model’s zonal wind structure is shown inFig. 2c to aid in the assessment of the results of themodel experiments discussed below.
Experiments with the model have been designed toinvestigate the effects of perturbations to the tempera-
1 SEPTEMBER 2005 H A I G H E T A L . 3675
ture structure of the lower stratosphere, and to thiseffect comprise varying the values used for Ttpeq and�Ttp. The values that are used are summarized in Table2. Experiments U1 and U5 prescribe a uniform increasein Te of 1 and 5 K, respectively, throughout the strato-sphere. In experiments E1 and E5 the equatorial strato-sphere is warmed by 1 and 5 K, respectively, but this isgradually reduced to a zero increase at the poles. Forexperiment P10 the equatorial Te is unchanged, but thepoles are warmed by 10 K. Thus, we have representa-tions of situations in which the whole stratospherewarms uniformly, or warms preferentially at low orhigh latitudes. The structure of these temperaturechanges is very simple, and the model runs are notintended to be direct simulations of solar (or volcanic)
effects. We shall see in section 3c, however, that theresults may be useful in understanding the effects ofperturbations to the real atmosphere, such as those out-lined in section 2.
The U and E experiments were each carried out withthe two different amplitudes, of 1 and 5 K, in order toassess whether the patterns of response were indepen-dent of the magnitude of the forcing, and to what extentthe response scaled with the forcing. The statistical sig-nificance of the responses is estimated independently ateach grid point using a Student’s t test, taking into ac-count the reduction in the number of degrees of free-dom resulting from autocorrelations in the time series.The signals produced by the 10- and 5-K perturbationsare much larger than the long-term variability in thefields, so that it was necessary to continue these runs foronly 1000 days, after an initial spinup period of 200days. For the 1-K experiments, and the control, runs of10 000 days were carried out. In all cases the effectivenumber of data points has been doubled by using theresults from the two hemispheres as independent simu-lations. This is possible because an analysis of the tem-poral correlations between equivalent points in the twohemispheres shows very low values (of a magnitude of�0.2) across most of the hemisphere.1
b. Results
1) TEMPERATURE
The anomalies in zonal mean temperature for theperturbation experiments are shown in Fig. 3. All of theexperiments show heating in the stratosphere, as wouldbe expected; but in each case there are regions near thepoles where the increase in stratospheric temperature islarger than the imposed change in Te, resulting from thegreater descent and resulting adiabatic warming. All ofthe experiments also show regions of statistically sig-nificant warming in the troposphere, despite there be-ing no imposed perturbation to Te there. In experi-ments U5 and U1 there are vertical bands of coolingnear 40° latitude, with bands of warming either side.The pattern of the tropospheric response is very similarin experiment P10, but with somewhat larger magni-tudes. The E experiments both show the same pattern,which is different to that produced by the U and Pexperiments; there is now a band of warming near 50°,flanked by cooling bands near 30° and 65°–70°.
1 In fact, opposite points in the two hemispheres generally showa small anticorrelation, presumably resulting from small move-ments of mass across the equator, so that averaging them does notartificially enhance any signal.
FIG. 2. Simple GCM fields: (a) the prescribed equilibrium tem-perature Te (K); (b) the zonal mean temperature (K) for thecontrol run C; and (c) the zonal mean zonal wind for run C.
TABLE 2. Summary of experiments with the simplified GCM.
RunTtpeq
(K)�Ttp
(K)Length(days)
Increase instratospheric
Te (K)
C 200 0 2 10 000 NoneU1 201 0 2 10 000 1U5 205 0 2 1000 5E1 201 1 2 10 000 cos2�E5 205 5 2 1000 5 cos2�P10 200 �10 2 1000 10 sin2�
3676 J O U R N A L O F C L I M A T E VOLUME 18

For experiments P10, U5, U1, and E5 there is a sta-tistically unambiguous response throughout the tropo-sphere and stratosphere. For E1, the signal in thestratosphere and low-latitude troposphere has a 95%confidence level; for the rest of the troposphere theconfidence interval of the results is about 80%. How-ever, the almost identical patterns shown by the E5 andE1 runs suggest that, in these regions, the response is
real. The contour intervals in the plots have been cho-sen so that the value of the 5-K-amplitude experimentsis a factor 5 larger than that for the respective 1-Kexperiments; from this it is clear that the response isapproximately linear in the stratosphere, but that in thetroposphere the 5-K experiments show a slightly largerthan linear response (factor of 6–7, rather than a factorof 5).
FIG. 3. Difference from the control run of zonal mean tem-peratures in run (a) U1 (contour interval 0.2 K), (b) U5 (1 K),(c) E1 (0.1 K), (d) E5 (0.5 K), and (e) P10 (2 K). Regions inwhich the signal does not reach the 95% confidence level areshaded.
1 SEPTEMBER 2005 H A I G H E T A L . 3677

The pattern of response in zonal mean temperaturesin the E runs is similar to that reported as resultingfrom increased solar activity in both NCEP–NCARdata (Haigh 2003) and full GCM (fGCM) studies(Haigh 1996, 1999; Larkin et al. 2000). The sGCM runscan, in no way, be considered as simulations of solareffects, so a direct comparison of the results is not ap-propriate, but the similarity of the resulting patterns
may allow us to draw conclusions as to a potentialmechanism for solar influence on tropospheric climate.
2) ZONAL WIND
The perturbations in the zonal mean zonal windfound in the sGCM experiments are presented in Fig. 4.As would be anticipated, from thermal wind consider-
FIG. 4. Difference from control run of zonal mean zonal windsin run (a) U1 (contour interval 0.2 m s�1), (b) U5 (1 m s�1), (c)E1 (0.1 m s�1), (d) E5 (0.5 m s�1), and (e) P10 (2 m s�1). Re-gions in which the signal does not reach the 95% confidencelevel are shaded.
3678 J O U R N A L O F C L I M A T E VOLUME 18

ations of the temperature perturbations discussedabove, banded structures appear in the troposphere ineach case.
In runs U1 and U5 (Figs. 4a and 4b), these appear asa band of weaker winds near 55° and a band of strongerwinds near 35°. This represents a weakening of the jetand an equatorward shift. There are some interestingqualitative similarities between the results of the U ex-periments and those shown for the response to strato-spheric aerosol in Fig. 1e in the NCEP–NCAR zonalwinds.
The response of the E experiments (Fig. 4d) is againsomewhat different from the U runs, with a negativeband near 40° flanked by positive bands near 25° and60°, respectively. These correspond to a weakeningand latitudinal expansion, but mainly a poleward shift,of the jets. Now the pattern is more qualitatively similarto the solar signal found in the NCEP–NCAR data(Fig. 1b).
Experiment P10 (Fig. 4e) produces a similar patternof response to U5 in the midlatitudes, but with largermagnitudes. This represents a significant equatorwardshift of the jets, although with no real weakening; theresults of P10 also differ from U5 in that the response inthe tropical lower stratosphere shows a large westerlyacceleration in the former and very little effect in thelatter. Experiment P10 is very similar (apart from achange in sign of the forcing) to that of Polvani andKushner (2002), who presented results of the responseof a similar model to polar stratospheric cooling andpresented an equivalent poleward shift of the jets.
Clearly, the responses seen in the simple model ex-periments U5 (or P10) and E5 are much larger thanthose that are found to be the result of volcanic or solarinfluences in the NCEP–NCAR data analysis. Experi-ments U1 and E1, using forcings that were a factor of 5smaller than U5 and E5, respectively, might be moreappropriate for interpretation in this regard. However,because the patterns of response seen in the 1-K ex-periments are essentially identical to those of the cor-responding 5-K runs, it seems clear that the same pro-cesses are operating. On this basis, and for reasons ofclarity and brevity, our analysis and interpretation ofthe data, below, is based on the 5-K experiments alone.
3) EDDY FLUXES AND FEEDBACKS
Because the sGCM results are in qualitative agree-ment with both the NCEP–NCAR anomalies for solarand volcanic forcing and the fGCM results, we seek tounderstand the mechanisms whereby forcing in thelower stratosphere leads to the modeled responsesthroughout the troposphere. We now ask to what ex-
tent these mechanisms are zonally symmetric or involvefeedbacks from the (transient) eddies.
The fields of poleward eddy momentum flux andpoleward eddy heat flux are shown for control run C inFigs. 5a and 6a, respectively. The anomalies in these
FIG. 5. Poleward flux of westerly momentum by the zonallyasymmetric eddies [u � ] (m2 s�2) for (a) the control run C, (b) theU5�C anomaly, and (c) the E5�C anomaly.
1 SEPTEMBER 2005 H A I G H E T A L . 3679
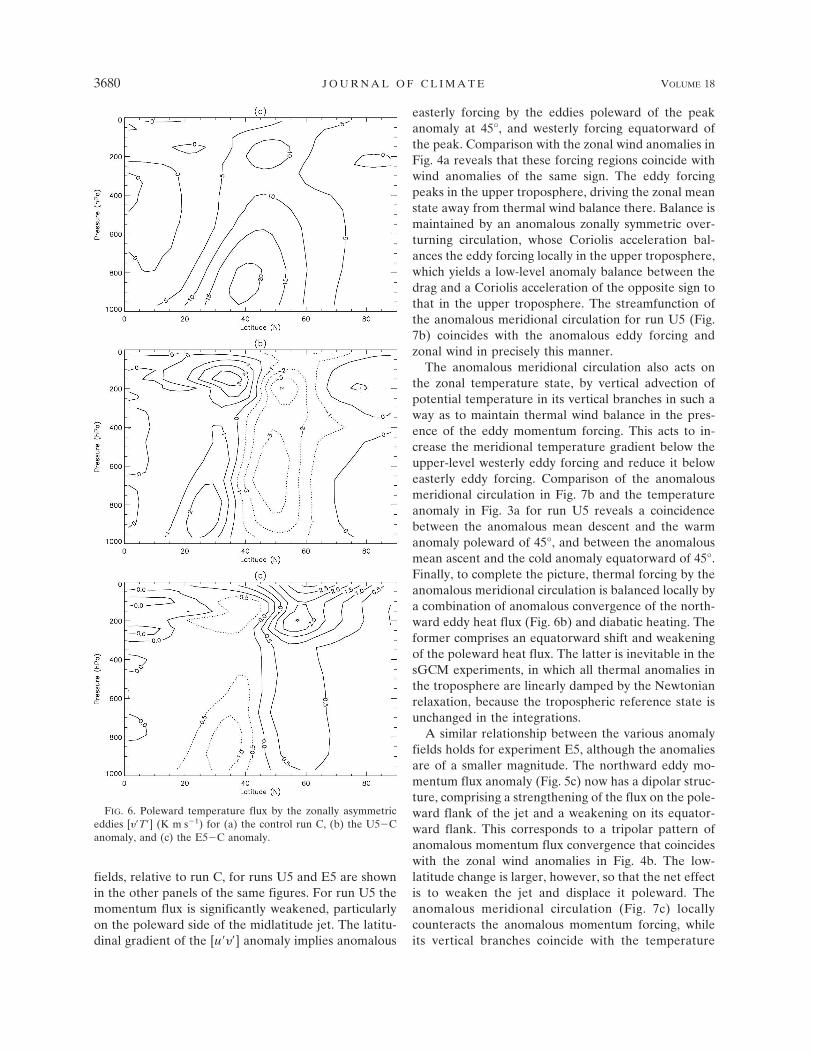
fields, relative to run C, for runs U5 and E5 are shownin the other panels of the same figures. For run U5 themomentum flux is significantly weakened, particularlyon the poleward side of the midlatitude jet. The latitu-dinal gradient of the [u � ] anomaly implies anomalous
easterly forcing by the eddies poleward of the peakanomaly at 45°, and westerly forcing equatorward ofthe peak. Comparison with the zonal wind anomalies inFig. 4a reveals that these forcing regions coincide withwind anomalies of the same sign. The eddy forcingpeaks in the upper troposphere, driving the zonal meanstate away from thermal wind balance there. Balance ismaintained by an anomalous zonally symmetric over-turning circulation, whose Coriolis acceleration bal-ances the eddy forcing locally in the upper troposphere,which yields a low-level anomaly balance between thedrag and a Coriolis acceleration of the opposite sign tothat in the upper troposphere. The streamfunction ofthe anomalous meridional circulation for run U5 (Fig.7b) coincides with the anomalous eddy forcing andzonal wind in precisely this manner.
The anomalous meridional circulation also acts onthe zonal temperature state, by vertical advection ofpotential temperature in its vertical branches in such away as to maintain thermal wind balance in the pres-ence of the eddy momentum forcing. This acts to in-crease the meridional temperature gradient below theupper-level westerly eddy forcing and reduce it beloweasterly eddy forcing. Comparison of the anomalousmeridional circulation in Fig. 7b and the temperatureanomaly in Fig. 3a for run U5 reveals a coincidencebetween the anomalous mean descent and the warmanomaly poleward of 45°, and between the anomalousmean ascent and the cold anomaly equatorward of 45°.Finally, to complete the picture, thermal forcing by theanomalous meridional circulation is balanced locally bya combination of anomalous convergence of the north-ward eddy heat flux (Fig. 6b) and diabatic heating. Theformer comprises an equatorward shift and weakeningof the poleward heat flux. The latter is inevitable in thesGCM experiments, in which all thermal anomalies inthe troposphere are linearly damped by the Newtonianrelaxation, because the tropospheric reference state isunchanged in the integrations.
A similar relationship between the various anomalyfields holds for experiment E5, although the anomaliesare of a smaller magnitude. The northward eddy mo-mentum flux anomaly (Fig. 5c) now has a dipolar struc-ture, comprising a strengthening of the flux on the pole-ward flank of the jet and a weakening on its equator-ward flank. This corresponds to a tripolar pattern ofanomalous momentum flux convergence that coincideswith the zonal wind anomalies in Fig. 4b. The low-latitude change is larger, however, so that the net effectis to weaken the jet and displace it poleward. Theanomalous meridional circulation (Fig. 7c) locallycounteracts the anomalous momentum forcing, whileits vertical branches coincide with the temperature
FIG. 6. Poleward temperature flux by the zonally asymmetriceddies [� T ] (K m s�1) for (a) the control run C, (b) the U5�Canomaly, and (c) the E5�C anomaly.
3680 J O U R N A L O F C L I M A T E VOLUME 18
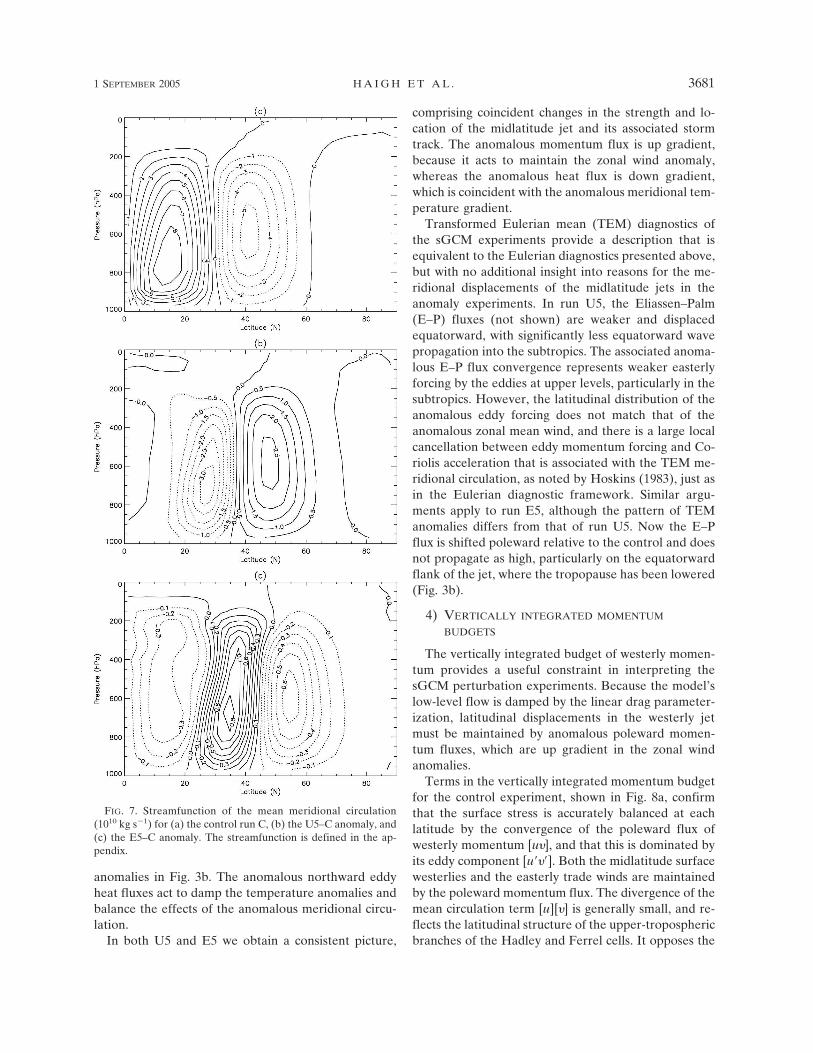
anomalies in Fig. 3b. The anomalous northward eddyheat fluxes act to damp the temperature anomalies andbalance the effects of the anomalous meridional circu-lation.
In both U5 and E5 we obtain a consistent picture,
comprising coincident changes in the strength and lo-cation of the midlatitude jet and its associated stormtrack. The anomalous momentum flux is up gradient,because it acts to maintain the zonal wind anomaly,whereas the anomalous heat flux is down gradient,which is coincident with the anomalous meridional tem-perature gradient.
Transformed Eulerian mean (TEM) diagnostics ofthe sGCM experiments provide a description that isequivalent to the Eulerian diagnostics presented above,but with no additional insight into reasons for the me-ridional displacements of the midlatitude jets in theanomaly experiments. In run U5, the Eliassen–Palm(E–P) fluxes (not shown) are weaker and displacedequatorward, with significantly less equatorward wavepropagation into the subtropics. The associated anoma-lous E–P flux convergence represents weaker easterlyforcing by the eddies at upper levels, particularly in thesubtropics. However, the latitudinal distribution of theanomalous eddy forcing does not match that of theanomalous zonal mean wind, and there is a large localcancellation between eddy momentum forcing and Co-riolis acceleration that is associated with the TEM me-ridional circulation, as noted by Hoskins (1983), just asin the Eulerian diagnostic framework. Similar argu-ments apply to run E5, although the pattern of TEManomalies differs from that of run U5. Now the E–Pflux is shifted poleward relative to the control and doesnot propagate as high, particularly on the equatorwardflank of the jet, where the tropopause has been lowered(Fig. 3b).
4) VERTICALLY INTEGRATED MOMENTUM
BUDGETS
The vertically integrated budget of westerly momen-tum provides a useful constraint in interpreting thesGCM perturbation experiments. Because the model’slow-level flow is damped by the linear drag parameter-ization, latitudinal displacements in the westerly jetmust be maintained by anomalous poleward momen-tum fluxes, which are up gradient in the zonal windanomalies.
Terms in the vertically integrated momentum budgetfor the control experiment, shown in Fig. 8a, confirmthat the surface stress is accurately balanced at eachlatitude by the convergence of the poleward flux ofwesterly momentum [u�], and that this is dominated byits eddy component [u � ]. Both the midlatitude surfacewesterlies and the easterly trade winds are maintainedby the poleward momentum flux. The divergence of themean circulation term [u][�] is generally small, and re-flects the latitudinal structure of the upper-troposphericbranches of the Hadley and Ferrel cells. It opposes the
FIG. 7. Streamfunction of the mean meridional circulation(1010 kg s�1) for (a) the control run C, (b) the U5–C anomaly, and(c) the E5–C anomaly. The streamfunction is defined in the ap-pendix.
1 SEPTEMBER 2005 H A I G H E T A L . 3681

eddy flux convergence in midlatitudes and leads to asmall displacement of the eddy flux convergence andsurface stress in the subtropics.
The momentum budget anomalies in experiments U5and E5, relative to the control, are shown in Figs. 8band 8c. It is clear that the eddy flux convergence domi-nates the anomalies, balancing the surface stress dipoleassociated with the equatorward jet shift in U5 and thetripole associated with the poleward shift in E5. Themean circulation term is small in comparison, but ac-counts for a small displacement between the peak stress
anomaly and peak eddy flux convergence anomaly onthe equatorward side of the jet in each experiment.
We conclude that the jet displacements in the sGCMexperiments are primarily maintained by the changes inthe poleward eddy momentum flux. The anomalouseddy flux convergence is concentrated in the upper tro-posphere, driving an anomalous mean circulation (dis-placement of the Ferrel cell), which acts to transportthe anomalous momentum downward and, so, balancethe surface stress anomaly.
c. Interpretation
We now ask to what extent the diagnostic picturepresented in the preceding section can be interpretedcausally, beyond the statement that the imposed strato-spheric changes lead to the modeled changes in thetroposphere. All of the experiments involve long-term-averaged steady states, in which the anomalous meanflow and eddy forcing terms in the budget equationsmust balance. The vertically integrated momentum bal-ance immediately implies that latitudinal displacementsof the jets necessarily involve up-gradient anomalousmomentum fluxes, which we have found to be domi-nated by the eddy component, while the thermal windbalance implies that the baroclinic component of suchdisplacements will be associated with anomalous tem-perature gradients.
In a study of the extratropical response to tropicalforcing that is associated with ENSO, Seager et al.(2003) observed a similar relationship to that foundhere between anomalous eddy forcing and perturba-tions of the zonal mean state. They used the up-gradient nature of the anomalous momentum fluxesand the down-gradient nature of the anomalous heatfluxes to imply a causality chain, starting with changesto the subtropical upper troposphere that altered theeddy momentum fluxes, with these leading to the heatflux changes. This interpretation was reinforced by adiagnosis of wave propagation in a linear wave model,suggesting that ENSO-driven perturbations of thezonal mean state in the subtropics lead to the changesthat are observed in the meridional wave propagationand, therefore, in the eddy momentum fluxes.
Our sGCM results are consistent with such an inter-pretation, beginning with changes in the thermal struc-ture of the tropopause region that are associated withthe modified stratospheric reference state. However,other sGCM experiments, in which the troposphericbaroclinicity was altered (not shown), exhibit the samerelationship between the eddy and mean flow pertur-bations. Thus, the up- or down-gradient nature of thedifferent eddy fluxes is not, in itself, a sufficient indica-tion of a detailed causality chain. Moreover, the sGCM
FIG. 8. Terms in the vertically integrated budget of the westerlymomentum [see Eq. (A1) in the appendix] for (a) the control runC, (b) the U5–C anomaly, and (c) the E5–C anomaly. Each panelshows the convergence of the flux of the westerly momentumresulting from the zonally asymmetric eddies (CEDDY, dotted),the zonally averaged flow (CZONAL, dash–dot), and their sum(CTOTAL, solid); the surface stress ([�S�], dashed); and the budgetresidual (faint dotted). All quantities are units of Nm�2.
3682 J O U R N A L O F C L I M A T E VOLUME 18
control run (and, indeed, the atmosphere itself) com-prises an extratropical jet stream and associated stormtrack, which exhibits the same qualitative balance, withthe eddies driven by baroclinic instability. The heat fluxis down gradient and the momentum fluxes are up gra-dient, driving a thermally indirect meridional circula-tion (Ferrel cell) in the Eulerian mean, which is neces-sary to maintain the thermal wind balance in the pres-ence of the eddy forcing. The sGCM stratosphericforcing experiments necessarily involve perturbationsto and latitudinal displacements of this basic balance.
What we can conclude from the sGCM experimentsis that imposed changes in the lower-stratospheric tem-perature forcing lead to coherent changes in the latitu-dinal location and width of the midlatitude jet streamand its associated storm track, and that eddy/mean flowfeedbacks are crucial to these changes. Imposed strato-spheric warming and an associated lowering of thetropopause tends to weaken the jet and storm-trackeddies; equatorial stratospheric warming displaces thejet poleward, while uniform or polar warming displacesit markedly equatorward.
We intend to perform further sGCM experiments toinvestigate the more detailed causality chain, includingensemble spinup experiments and the use of a zonallysymmetric version of the sGCM, in which eddy forcingis prescribed. Kushner and Polvani (2004) have recentlyused a similar methodology in an investigation of thehigh-latitude stratosphere–troposphere interaction thatis associated with annular variability.
4. Conclusions
A multiple regression analysis of the NCEP–NCARreanalysis zonal mean zonal wind data reveals a patternof response to solar variability in which the subtropicaljets weaken and move poleward during periods ofhigher solar activity, with the effect transmittedthroughout the vertical extent of the troposphere. Thispattern is similar in both shape and magnitude to thatpreviously estimated to be the result of the sun’s 11-yrcycle in UV radiation using global circulation models.The response in the data to volcanic aerosol is found tobe a weakening and equatorward shift of the jets.
The experiments with the simplified global circula-tion model provide some indications as to how theseresponses arise. All runs in which thermal perturba-tions were applied only in the lower stratosphere showeffects throughout the troposphere, with the verticallybanded anomalies in the temperature and zonal wind,and changes in the tropospheric mean circulation,which is typical of the results of data analysis. Heatingthe lower stratosphere increases the static stability in
this region, lowers the tropopause, and reduces thewave fluxes here. This leads to coherent changesthrough the depth of the troposphere, involving thelocation and width of the jet stream, storm-track, andeddy-induced meridional circulation.
The precise shape of the patterns of response dependon the distribution of the stratospheric heating pertur-bation: heating at mid- to high latitudes causes the jetsto move equatorward and the Hadley cells to shrink,while heating only at the low latitudes results in a pole-ward shift of the jets and an expansion of the Hadleycells. Low-latitude heating also results in a weakeningof the subtropical jets. The results of the low-/high-latitude heating experiments, thus, appear to be quali-tatively similar to the responses found in the observa-tional data to higher solar activity/volcanic aerosol; andthe low-latitude heating experiment is similar to theglobal circulation model simulations of the effects ofenhanced solar UV.
The success of the simplified global circulation modelin reproducing qualitatively the observed troposphericresponse to imposed stratospheric perturbations alsosuggests that moist feedbacks are not a crucial compo-nent of the response; it is eddy/mean flow feedbacksthat are the primary mechanism. It is also interesting tonote that, despite the presence of a uniform strato-sphere, the lack of a stratospheric polar vortex, and theuse of broad latitudinal-scale perturbations, the sGCMis able to reproduce the tropospheric patterns. This sug-gests that a detailed representation of the stratosphereis not necessary for understanding the tropospheric as-pects of solar influence, although the source of thestratospheric heating remains an important factor.
We, therefore, suggest that the observed climate re-sponse to solar variability is brought about by a dy-namical response in the troposphere to heating pre-dominantly in the stratosphere. The effect is small, andfrequently masked by other factors, but is not negligiblein the context of the detection and attribution of cli-mate change. The results also suggest that, at theearth’s surface, the climatic effects of solar variabilitywill be most easily detected in the subtropics and mid-latitudes.
Acknowledgments. The data analysis was carried outby RD as part of an undergraduate vacation workplacement at Imperial College. The modeling work wasfunded by the European Community SOLICE projectand by the U.K. Natural Environment Research Coun-cil. We are grateful to Myles Allen for the regressionprogram, to Brian Hoskins for helpful discussion, andto two anonymous referees whose comments led to im-provements in the paper.
1 SEPTEMBER 2005 H A I G H E T A L . 3683

APPENDIX
Circulation Diagnostics
a. Mean meridional circulation
The zonally averaged divergent circulation may bevisualized by a mass streamfunction � in the meridionalplane, defined by
��� �g
c
����
�p, ��� � �
g
c
����
a��, c � 2a cos�,
where [] denotes a zonal average, � is the northwardvelocity, and � � (Dp/Dt) is the vertical motion inisobaric coordinates. The factor (g/c) produces a massstreamfunction on the sphere in kilograms per second.In practice, � is computed by integrating the zonallyaveraged northward wind downward from the top ofatmosphere in isobaric coordinates, independently ateach latitude:
��� � ���� dM �c
g �0
p
��� dp.
b. Vertically integrated westerly momentum budget
The zonally averaged balance of westerly momentumin isobaric, and spherical coordinates can be written as
��u�
�t� �
1
a cos2�
�
����u�� cos2�� �
�
�p�u�� � f ���
� �F��,
where F� is the zonal friction force, and the other sym-bols have their usual meanings. Integrating over thedepth of the atmosphere and taking a long-time aver-age, the Coriolis term vanishes by mass continuity,while small terms involving the surface pressure varia-tions and the surface vertical momentum flux that areassociated with the resolved flow can be neglected (ashas been confirmed by the model results). The resultingbalance of vertically integrated westerly momentum be-comes
�
�t �0
ps
�u� dp ��1
a cos2�
�
���cos2��0
ps
��u����
��u�� dp���0
ps
�F�� dp,
or
1g
�
�t �0
ps
�u� dp � CZONAL�CEDDY���S��.
�A1
Here, the momentum flux convergence has been parti-tioned into contributions from the zonally averaged andzonally asymmetric flows, [u][�] and [u � ], respectively,where () denotes a local departure from the zonal av-erage. Following Held and Suarez (1994), the sGCMincorporates Rayleigh friction in the lower atmospherewith an inverse time scale
k� � kf max�0, � � b��1 � b�,
where �b � 0.7, and the surface value is kf � 1 day�1.The resulting zonal friction force F� � �k�u in Eq.(A1), integrates to give the zonally averaged zonalcomponent of the surface stress
��S�� �1g �0
ps
k��u� dp,
which is computed as a discrete sum in the model co-ordinates.
REFERENCES
Gleisner, H., and P. Thejll, 2003: Patterns of tropospheric re-sponse to solar variability. Geophys. Res. Lett., 30, 1711,doi:10.1029/2003GL017129.
Gray, L. J., S. J. Phipps, T. J. Dunkerton, M. P. Baldwin, E. F.Drysdale, and M. R. Allen, 2001: The influence of the equa-torial upper stratosphere on Northern Hemisphere strato-spheric sudden warmings. Quart. J. Roy. Meteor. Soc., 127,1985–2003.
Haigh, J. D., 1994: The role of stratospheric ozone in modulatingthe solar radiative forcing of climate. Nature, 370, 544–546.
——, 1996: The impact of solar variability on climate. Science, 272,981–984.
——, 1999: A GCM study of climate change in response to the11-year solar cycle. Quart. J. Roy. Meteor. Soc., 125, 871–892.
——, 2003: The effects of solar variability on the Earth’s climate.Philos. Trans. Roy. Soc. London, 361A, 95–111.
Hansen, J., M. Sato, and R. Ruedy, 1997: Radiative forcing andclimate response. J. Geophys. Res., 102, 6831–6864.
Held, I. M., and M. J. Suarez, 1994: A proposal for the intercom-parison of the dynamical cores of atmospheric general circu-lation models. Bull. Amer. Meteor. Soc., 75, 1825–1830.
Hoskins, B. J., 1983: Modeling of the transient eddies and theirfeedbacks on the mean flow. Large-Scale Dynamical Pro-cesses in the Atmosphere, B. J. Hoskins and R. P. Pearce,Eds., Academic Press, 169–199.
——, and A. J. Simmons, 1975: A multi-layer spectral model andthe semi-implicit method. Quart. J. Roy. Meteor. Soc., 101,637–655.
Kodera, K., and Y. Kuroda, 2002: Dynamical response to the solarcycle. J. Geophys. Res., 107, 4749, doi:10.1029/2002JD002224.
Kushner, P. J., and L. M. Polvani, 2004: Stratosphere–tropospherecoupling in a relatively simple AGCM: The role of eddies. J.Climate, 17, 629–639.
Larkin, A., J. D. Haigh, and S. Djavidnia, 2000: The effect of solarUV irradiance variations on the Earth’s atmosphere. SpaceSci. Rev., 94, 199–214.
3684 J O U R N A L O F C L I M A T E VOLUME 18
Polvani, L. M., and P. J. Kushner, 2002: Tropospheric response tostratospheric perturbations in a relatively simple general cir-culation model. Geophys. Res. Lett., 29, 1114, doi:10.1029/2001GL014284.
Randel, W. J., F. Wu, and D. J. Gaffen, 2000: Interannual vari-ability of the tropical tropopause derived from radiosondedata and NCEP reanalyses. J. Geophys. Res., 105, 15 509–15 524.
Sato, M., J. Hansen, M. P. McCormick, and J. B. Pollack, 1993:Stratospheric aerosol optical depths, 1850–1990. J. Geophys.Res., 98, 22 987–22 994.
Seager, R., N. Harnik, Y. Kushnir, W. Robinson, and J. Miller,2003: Mechanisms of hemispherically symmetric climate vari-ability. J. Climate, 16, 2960–2978.
Shindell, D. T., G. A. Schmidt, M. E. Mann, D. Rind, and A.Waple, 2001: Solar forcing of regional climate change duringthe Maunder Minimum. Science, 294, 2149–2152.
Simmons, A. J., and D. M. Burridge, 1981: An energy and angu-lar-momentum conserving vertical finite-difference schemeand hybrid vertical coordinates. Mon. Wea. Rev., 109, 758–766.
van Loon, H., and D. Shea, 2000: The global 11-year signal inJuly–August. Geophys. Res. Lett., 27, 2965–2968.
von Storch, H., and F. W. Zwiers, 1999: Statistical Analysis inClimate Research. Cambridge University Press, 484 pp.
Wuebbles, D. J., C. F. Wei, and K. O. Patten, 1998: Effect onstratospheric ozone and temperature during the MaunderMinimum. Geophys. Res. Lett., 25, 523–526.
1 SEPTEMBER 2005 H A I G H E T A L . 3685