Embed Size (px)
Citation preview

The Response of Different Soil Types to Precipitation Events over
Contrasting Soil Moisture Conditions
By: Nathan Meyer
CE 394K TERM PROJECT

Task: Analyzing how runoff and vadose zone retention varies over different soil types. Hypothesis: Drier soil are able to hold more precipitation than saturated, tightly packed soils, decreasing the runoff and increasing infiltration
Methods: • A robust dataset of Soil Water Content measurements
over time is key • Compare Inputs and Outputs of a small watershed. • Create a Budget to quantitatively assess the retention
ability of the soils.

Long Term Ecological Research Sites (LTER)
Harvard Forest LTER
Coweeta LTER

1.) NHDPlus • Watershed Area • Streamlines • Gauging Stations • Elevation Data
2.) UC Davis Soil Resource Laboratory • US Soil Survey data (SSURGO) • Google Earth Survey Browser
3.) LTER Localized Data Sets
• Hydrographs • Precipitation • Soil Moisture • Additional GIS Data Sets


Tools: - KML to Feature - Reproject all into North America Albers Equal Area Conic - Use Intersect Tool to join feature classes - Use Calculate Geometry to find area of soil in watershed

Data sets to use: Soil Moisture: HEM Tower HF153-09 Hydrograph: Prospect Hill Hydrological Stations HF070 Dates: 4/26- 7/11/2006 Total Area: 0.51 km2
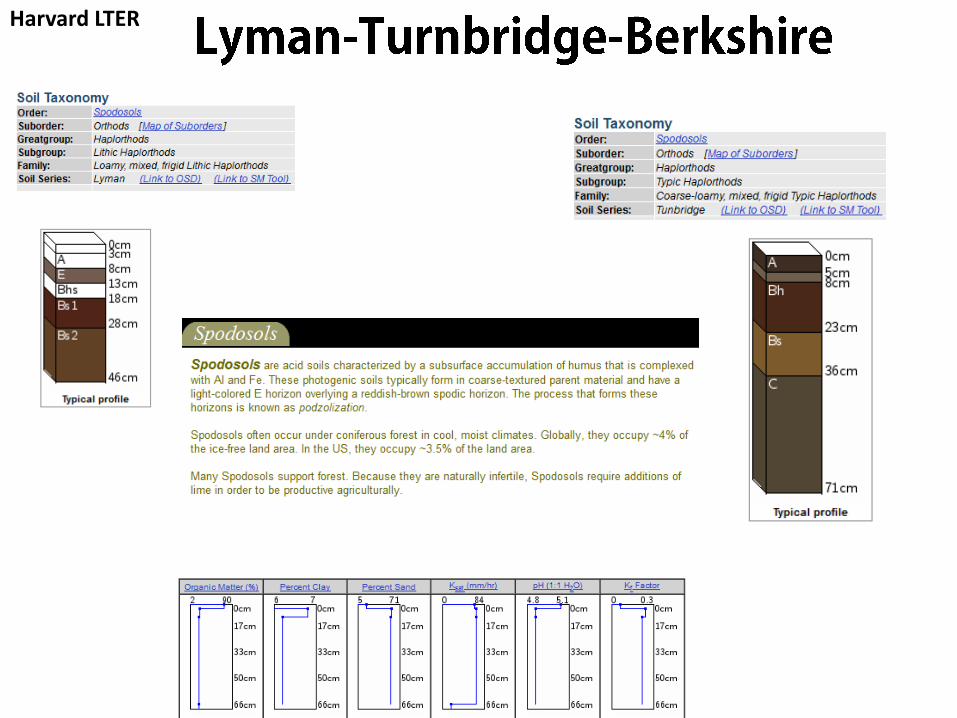
Soil Orders • Spodosols • Inceptisols
Soil Series % Area
Lyman-Tunbridge-Berkshire association 23.05
Becket-Skerry association 21.15
Pillsbury-Peacham association 16.24
Peru-Marlow association 13.68
Tunbridge-Lyman-Berkshire association 13.03
Berkshire-Marlow association 12.41
Bucksport and Wonsqueak mucks 0.48
Note: Several soil series within this watershed are described as very rocky
Harvard LTER Soils
Becket-Skerry association
Berkshire-Marlow association
Bucksport and Wonsqueak mucks
Lyman-Tunbridge-Berkshireassociation
Peru-Marlow association
Pillsbury-Peacham association
Tunbridge-Lyman-Berkshireassociation

Harvard LTER

Harvard LTER

Harvard LTER
0
0.5
1
1.5
2
2.5
3
3.5
4
4.5
5
0
1000
2000
3000
4000
5000
6000
7000
4/26 5/6 5/16 5/26 6/5 6/15 6/25 7/5 7/15
Pre
cip
itat
ion
(cm
/day
)
Dis
chaa
rge
(cm
^3/s
)
Time (days)
Harvard Forest: Hydrograph vs Precipitation
Bigelow Lower Gauge
Precip
0
0.5
1
1.5
2
2.5
3
0
0.05
0.1
0.15
0.2
0.25
0.3
0.35
0.4
0.45
4/26 5/16 6/5 6/25 7/15
Pre
cip
itat
ion
(cm
/day
)
Soil
Wat
er
Co
nte
nt θ
Time (Days)
Soil Moisture Response to Precipitation Site #1
precip

Harvard LTER
0
1000
2000
3000
4000
5000
6000
7000
0
0.05
0.1
0.15
0.2
0.25
0.3
0.35
0.4
0.45
4/13 4/23 5/3 5/13 5/23 6/2 6/12 6/22 7/2 7/12 7/22Time (Day)
Dis
char
ge (
cm^3
/se
c)
Wat
er
Co
nte
nt θ
Harvard LTER: Discharge and Soil Water Content
Water Content
Discharge
Totals
Discharge: 7979.04 m^3
Soil Moisture Change: 1226.77 m^3
Precip: 0.2671 m
Basin Area: 511,000.00 m^2
Input over basin: 136,488.10 m^3
D = P - dSw
Total 135,261.332 m^3

0
0.5
1
1.5
2
2.5
3
0
0.05
0.1
0.15
0.2
0.25
0.3
0.35
0.4
0.45
4/23 5/3 5/13 5/23 6/2 6/12 6/22 7/2 7/12 7/22
Pre
cip
itat
ion
(cm
/day
)
Soil
Wat
er
Co
nte
nt θ
Time (Days)
Soil Moisture Response to Precipitation Site #1
Site #2
Precip
Harvard LTER
• Evapotranspiration • Water Storage Below 20cm • Heterogeneous Soil Conditions • Heterogeneous Precipitation • Lack of Measurements • Accuracy of Measurements • Depression Filling
Introduction of error:

Coweeta LTER
Data sets to use: Soil Moisture: Terrestrial gradient microclimate measurements, 1013, Jennifer Knoep Hydrograph: Watershed 18 daily stream discharge, 3033, Stephanie Laseter Meteorology: Climate Station 1 Climate Data, 1011, Stephanie Laseter Dates: 4/1 - 10/3/06 Area: 123,587 m2
Coweeta LTER Soils
Evard-Cowee complex #1
Evard-Cowee complex #2
Trimont gravelly loam
Saunook gravelly loam
Soil Series % Area
Evard-Cowee complex #1 19.64
Evard-Cowee complex #2 37.24
Trimont gravelly loam 12.14
Saunook gravelly loam 20.10
Soil Orders • Ultisols

Evard - Cowee Complex Coweeta LTER

Coweeta Coweeta LTER
0
1
2
3
4
5
6
0
0.05
0.1
0.15
0.2
0.25
0.3
0.35
1-Jun 1-Jul 31-Jul 30-Aug 29-Sep
Pre
cip
itat
ion
(cm
/day
)
Soil
Mo
istu
re θ
Time (days)
Coweeta LTER Soil Moisture and Precipitation
218
318
Precip

0
2000
4000
6000
8000
10000
12000
0
2000
4000
6000
8000
10000
12000
1-Apr 2-May 2-Jun 3-Jul 3-Aug 3-Sep 4-Oct
Wat
er
Vo
lum
e in
to
p 3
0cm
V
ado
se Z
on
e (
m^3
)
Dif
fere
nce
in W
C (
m^3
) WC calculation differences between 218 and 318
Difference between 218 and 318
Average
Coweeta LTER

Harvard: • Spodosols and Inceptisols • Hill slope
Coweeta: • Ultisols • Hill slope
Area: 123,587m2
Elevation Difference: 230m
Area: 511,000 m2
Elevation Difference: 108m

Errors: • Evapotranspiration • Water Storage Below Measurements • Heterogeneous Soil Conditions • Heterogeneous Precipitation • Depression Filling • Ponding • Intense Precip/Low Conductivity • Terrain aspect / Hillslope • Low Measurement Density • Low Accuracy of Measurements

Further Steps to complete this project - Work more with the Coweeta LTER data set to establish
refined budgets (at different flow volumes)
Ideal Data Set Collection: - Small watersheds key
- More extensive network - Consideration of Hillslope and ET values - Single storm event after dry period.
Current limits on Project - Measurement density, and the exact locations of each measurement
- Although this project did not yield the results I had expected and was MUCH more convoluted than I had originally imagined. It provided a greater insight into the degree the vadose zone plays in local hydrology and how difficult it is to measure quantities that can accurately describe a location larger then the measurement area itself.

Thank You