Embed Size (px)
Citation preview

THE RESIDENTIAL SATISFACTION OF THE LOW-COST HOUSING IN THE NEW SECOND-TIER CITY OF
JIANGSU PROVINCE, CHINA
XI WENJIA
FACULTY OF BUILT ENVIRONMENT
UNIVERSITY OF MALAYA KUALA LUMPUR
2018

THE RESIDENTIAL SATISFACTION OF THE LOW-
COST HOUSING IN THE NEW SECOND-TIER CITY
OF JIANGSU PROVINCE, CHINA
XI WENJIA
THESIS SUBMITTED IN FULFILMENT OF THE
REQUIREMENTS FOR THE DEGREE OF DOCTOR OF
PHILOSOPHY
FACULTY OF BUILT ENVIRONMENT
UNIVERSITY OF MALAYA
KUALA LUMPUR
2018

ii
UNIVERSITY OF MALAYA
ORIGINAL LITERARY WORK DECLARATION
Name of Candidate: XI WENJIA (I.C/Passport No: G34416246)
Matric No: BHA080004
Name of Degree: Doctor of Philosophy
Title of Thesis: The Residential Satisfaction of The Low-Cost Housing in The New
Second-Tier City of Jiangsu Province, China
Field of Study: REAL ESTATE DEVELOPMENT & ENVIRONMENT
I do solemnly and sincerely declare that:
(1) I am the sole author/writer of this Work;
(2) This Work is original;
(3) Any use of any work in which copyright exists was done by way of fair
dealing and for permitted purposes and any excerpt or extract from, or
reference to or reproduction of any copyright work has been disclosed
expressly and sufficiently and the title of the Work and its authorship have
been acknowledged in this Work;
(4) I do not have any actual knowledge nor do I ought reasonably to know that
the making of this work constitutes an infringement of any copyright work;
(5) I hereby assign all and every rights in the copyright to this Work to the
University of Malaya (“UM”), who henceforth shall be owner of the
copyright in this Work and that any reproduction or use in any form or by any
means whatsoever is prohibited without the written consent of UM having
been first had and obtained;
(6) I am fully aware that if in the course of making this Work I have infringed
any copyright whether intentionally or otherwise, I may be subject to legal
action or any other action as may be determined by UM.
Candidate’s Signature Date:
Subscribed and solemnly declared before,
Witness’s Signature Date:
Name:
Designation:

iii
THE RESIDENTIAL SATISFACTION OF THE LOW-COST HOUSING IN
THE NEW SECOND-TIER CITY OF JIANGSU PROVINCE, CHINA
ABSTRACT
The residential satisfaction was not only to tell how the current living situation was
like, but also to tell from which facets the municipal governments should enhance to
improve their expectations of buying homeownerships. However, the current planning
of low-cost housing development which was produced in line with the executive form
of ‘from top to down’ was not able to achieve what real needs were from the low-
income group. There have been very few studies of low-income group’s residential
satisfactions with low-cost housing in China. And no study has been done with the
relationship between residential satisfaction and four residential components consisting
of housing unit characteristics, housing unit supporting services, housing estate
supporting facilities, and neighbourhood characteristics plus individual and household’s
socio-economic characteristics particularly in the latest second-tier city in Jiangsu
province. On the basis of the research background, the unresolved critical questions that
must be answered were: what are the levels of satisfactions with residential environment
between three phases of low-cost housing projects in Xuzhou city and how to improve
dwellers’ residential satisfactions? The aim of this research work was to find out and
compare the determinants, and to explore those determinants in order to enhance
residential satisfactions of Xuzhou’s low-cost houses. An explanatory sequential mixed
mode method design was used, and it involved collecting quantitative data first and then
explaining the quantitative results with in-depth qualitative data. In the first, quantitative
part, the structured questionnaires data were collected from 86, 95, and 80 participants
of Xuzhou’s three phases of low-cost houses to assess their residential satisfactions and
found out 14 determinants of 1st phase, 12 key predictors of 2
nd phase, and 13 mostly
significant variables of 3rd
phase. The second, qualitative part was conducted as a
follow-up to help explain quantitative results that low-cost housing residents wanted a

iv
good social environment and neighbourhood facilities by improving satisfactions of
community relationship, resident’s workplace, nearest school and bus/taxi station.
Moreover, increasing satisfactions of parking facilities, lighting, children’s playground,
and fitness equipment could improve residents’ aspirations of good layout and good
maintenance for public facilities. Furthermore, the bad conditions of staircases, corridor,
garbage disposal, and lighting brought residents’ aspirations of good maintenance for
housing units. The bad ventilation and lighting in the bedroom and toilet made residents
ask for good structure designs for housing units. In short, those residents finally wanted
their houses to be enhanced according to the standard of commodity housing in order to
improve their social economic status in China. Accordingly, the residents’ current living
environment was needed to improve by way of public participation to promote their
residential satisfactions based upon the cooperation amongst their own, property
companies, and local governments.
Keywords: Residential Satisfaction, China’s Low-Cost Housing, Xuzhou City,
Explanatory Sequential Mixed Mode Method, Public Participation in China’s Low-Cost
Housing Development

v
THE RESIDENTIAL SATISFACTION OF THE LOW-COST HOUSING IN
THE NEW SECOND-TIER CITY OF JIANGSU PROVINCE, CHINA
ABSTRAK
Kepuasan kediaman bukan sahaja menunjukan keadaan kehidupan semasa, tetapi
juga memberitahu kerajaan perbandaran di mana aspek yang harus ditingkatkan supaya
harapan untuk pemilikan rumah dapat dicapaikan. Walau bagaimanapun, rancangan
pembangunan perumahan kos rendah yang dihasilkan sejajar dengan bentuk eksekutif
“dari atas ke bawah” tidak dapat mencapai keperluan golongan isi rumah berpendapatan
rendah dan sederhana rendah. Terdapat kekurangan dalam kajian mengenai kepuasan
kediaman dengan perumahan kos rendah bagi kumpulan berpendapatan rendah di
China. Selain itu, tiada kajian dapat dijumpai mengenai hubungan antara kepuasan
kediaman dan empat komponen kediaman yang terdiri daripada ciri-ciri unit rumah,
perkhidmatan sokongan unit rumah, kemudahan penunjang estet perumahan, dan ciri-
ciri kejiranan serta ciri-ciri sosioekonomi individu dan rumah tangga terutamanya dalam
bandar berperingkat kedua terkini di wilayah Jiangsu. Berdasarkan latar belakang
penyelidikan ini, soalan kritikal yang mesti dijawab adalah: apakah tahap kepuasan
dengan persekitaran kediaman antara tiga fasa projek perumahan kos rendah di bandar
Xuzhou dan bagaimana kepuasan penduduk penghuni boleh ditingkatkan? Tujuan kerja
penyelidikan ini adalah untuk mengetahui dan membandingkan penentu-penentu, dan
juga untuk meneroka penentu-penentu tersebut untuk meningkatkan kepuasan kediaman
perumahan kos rendah di Xuzhou. Reka bentuk penyelidikan “explanatory sequential
mixed mode method design” telah digunakan, dan ia melibatkan pengumpulan data
kuantitatif terlebih dahulu sebelum menerangkan hasil kuantitatif dengan data kualitatif
yang mendalam. Dalam bahagian pertama, data soal selidik berstruktur telah
dikumpulkan dari 86, 95, dan 80 orang peserta di tiga fasa projek perumahan kos rendah
di Xuzhou untuk menilai kepuasan kediaman mereka dan kajian ini mendapati 14
penentu fasa 1, 12 prediktor utama pada fasa ke-2, dan 13 pembolehubah bersignifikan

vi
tinggi pada fasa ke-3. Di bahagian kedua, kajian kualitatif telah dijalankan sebagai
tindak lanjut untuk membantu menjelaskan hasil kuantitatif bahawa penduduk
perumahan kos rendah memerlukan persekitaran sosial dan kemudahan kejiranan yang
baik dengan meningkatkan tahap kepuasan perhubungan masyarakat, tempat kerja
penduduk, sekolah dan stesen bas/teksi yang terdekat. Lebih-lebih lagi, meningkatkan
tahap kepuasan kemudahan tempat letak kereta, lampu, taman permainan kanak-kanak,
dan peralatan kecergasan dapat meningkatkan aspirasi penduduk mengenai susun atur
yang baik dan penyelenggaraan yang baik untuk kemudahan awan. Selain itu, keadaan
tangga, koridor, pelupusan sampah dan pencahayaan yang buruk akan membawa
aspirasi penyelenggaraan yang baik bagi unit kediaman. Pengudaraan dan pencahayaan
yang buruk dalam bilik tidur dan tandas mengakibatkan penduduk untuk meminta reka
bentuk struktur yang baik untuk unit kediaman. Secara ringkasnya, penduduk-penduduk
mahu rumah mereka untuk dipertingkatkan mengikut piawaian perumahan komoditi
supaya taraf sosial ekonomi di China dapat ditingkatkan. Sehubungan dengan itu,
persekitaran hidup semasa penduduk perlu dipertingkatkan melalui cara penyertaan
masyarakat supaya kepuasan kediaman mereka dapat diperkenalkan berasaskan
kerjasama antara mereka sendiri, syarikat-syarikat harta tanah, dan kerajaan tempatan.
Keywords: Residential Satisfaction, China’s Low-Cost Housing, Xuzhou City,
Explanatory Sequential Mixed Mode Method, Public Participation in China’s Low-Cost
Housing Development

vii
ACKNOWLEDGEMENTS
It is very exciting for me to have this special chapter where I can deliver my sincere
thanks to those who gave me a lot of helps during my PhD thesis writing.
Firstly, I would like to express my heartfelt thanks to my supervisor, Associate
Professor Dr. Sr. Noor Rosly Hanif for his sharing knowledge and guidance throughout
the research process. Without his constructive comments and consistent supports, I
could not finish my PhD study. To my knowledge, the process of studying PhD was not
only writing papers, the collaborative study between universities or countries was also
more valued because I can meet and learn from different scholars came from different
backgrounds in terms of academic and practical. On this point, Associate Professor Dr.
Sr. Noor Rosly Hanif provided me a lot of platforms to see the different world.
Secondly, my sincere thanks are given to the faculty of the Built Environment (UM)
and staff especially the department of Estate Management for their assistance during my
thesis writing. In particular, I would like to thank Associate Professor Dr. Sr. Anuar Bin
Alias, Dr. Sr. Yasmin Mohd Adnan, and Dr. Nikmatul Adha Binti Nordin who asked
profound questions during candidature defence and thesis seminar to facilitate me in
better amendments of my thesis. In addition, my very special and great appreciation
extends to Madam Sila A/P Balakersnan and Madam Norizan Abd Raji postgraduate
coordinator for their kind help and assistance.
Thirdly, my sincere thanks are given to those low-cost housing residents, property
managers, and government representatives involved in my study for their participations
in my research. Without their kind cooperation, this research could not be easily
completed.
Last but not least, my parents (Xi Jianguo and Bai Fang) not only gave me the life,
but they always support me in every way. In addition, very special thanks go to my

viii
friend, Li Jian who spent a lot of time in teaching me about research design (six ways of
doing mixed mode methods) and SPSS (stepwise method regression analysis).
I could not finish my PhD study without my fiancée (Teng Yun)’s patiently waiting
and her continuous support. I love you, my darling.

ix
TABLE OF CONTENTS
Abstract ............................................................................................................................ iii
Abstrak .............................................................................................................................. v
Acknowledgements ......................................................................................................... vii
Table of Contents ............................................................................................................. ix
List of Figures ................................................................................................................ xvi
List of Tables................................................................................................................. xvii
List of Symbols and Abbreviations .............................................................................. xviii
List of appendix.............................................................................................................. xix
INTRODUCTION .................................................................................. 1 CHAPTER 1:
1.1 Research Background ....................... ...................................................................... 1
1.1.1 Residential Satisfaction (RS) ...................................................................... 1
1.1.2 China’s Low-Cost Housing (LCH) ............................................................ 2
1.1.3 The Significance of RS to China’s LCH .................................................... 3
1.2 Problem Statement and Research Gap ..................................................................... 5
1.2.1 Problem Statement ..................................................................................... 5
1.2.2 Research Gap .............................................................................................. 6
1.3 Research Questions and Objectives .. ...................................................................... 8
1.4 Research Methodology ..................... .................................................................... 10
1.5 Research Scope ................................. .................................................................... 10
1.5.1 Phase 1 of Xuzhou’s LCH ........................................................................ 11
1.5.2 Phase 2 of Xuzhou’s LCH ........................................................................ 12
1.5.3 Phase 3 of Xuzhou’s LCH ........................................................................ 13
1.6 Structure of the Thesis ...................... .................................................................... 14
LITERATURE REVIEW .................................................................... 17 CHAPTER 2:
2.1 Introduction....................................... .................................................................... 17
2.2 Residential Satisfaction .................... .................................................................... 17
2.2.1 The Origin of RS ...................................................................................... 17
2.2.2 The Concept of RS ................................................................................... 21
2.2.3 The Theoretical Model Studying RS ........................................................ 25
2.2.3.1 Habitability System ................................................................... 25
2.2.3.2 Systemic Model of RS ............................................................... 28
x
2.2.3.3 Mohit et al.’s RS Model ............................................................ 30
2.2.3.4 The Components/Variables of Three Models of RS ................. 31
2.2.3.5 Conceptual Model with Components of This Research
Study ........................................................................................ 39
2.3 RS in Different Contexts of Housing in Different Countries ................................ 41
2.3.1 Different Factors Affecting RS in Housing .............................................. 41
2.3.2 Separate Assessment of RS in Different Contexts of Housing ................ 46
2.3.3 Characteristics of China’s LCH ............................................................... 48
2.3.4 RS of Public Housing in the Developed and Developing Countries ........ 52
2.3.4.1 Factors Affecting RS in Public Housing in Developed
Countries ................................................................................... 54
2.3.4.2 Factors Affecting RS in Public Housing in Developing
Countries ................................................................................... 68
2.3.5 RS in Commodity Housing in Developed and Developing Countries ..... 85
2.3.5.1 Four Residential Components and RS ...................................... 85
2.3.5.2 Factors from HUC ..................................................................... 89
2.3.5.3 Factors from NC ........................................................................ 89
2.3.5.4 Factors from Individual and Household’s Socio-Economic
Characteristics ........................................................................... 90
2.3.6 Factors Concluded in Residential Components and IHSC ....................... 91
2.4 Data Collection and Data Analysis in Research Methodology of Studying
RS ..................................................... .................................................................... 93
2.5 Recommendations to Enhance RS .... .................................................................... 96
2.6 Conclusion ........................................ .................................................................... 98
CHINA (XUZHOU)’S LOW-COST HOUSING ............................. 105 CHAPTER 3:
3.1 Introduction....................................... .................................................................. 105
3.2 China’s Low-Income Housing (LCH) ................................................................. 105
3.2.1 Recent Studies on RS of China’s Low-Income Housing ....................... 107
3.2.2 Recent Studies on China’s Low-Income Housing Policy ...................... 109
3.3 Xuzhou’s LCH .................................. .................................................................. 110
3.3.1 Economic Level of Development in Second-Tier Cities in China
especially Xuzhou .................................................................................. 110
3.3.2 Xuzhou in General .................................................................................. 112
xi
3.3.3 Xuzhou to Be Selected Amongst Three New Second-Tier Cities in
Jiangsu Province ..................................................................................... 113
3.3.4 Economic Transformation of Xuzhou City ............................................ 116
3.3.5 New Development of Xuzhou and Xuzhou’s Economic Growth .......... 117
3.3.6 Xuzhou’s Urban Transformation ............................................................ 122
3.3.7 Xuzhou’s LCH ....................................................................................... 124
3.3.7.1 Xuzhou’s Housing ................................................................... 124
3.3.7.2 Xuzhou’s LCH ........................................................................ 128
3.4 The Significance of RS to China’s LCH ............................................................. 131
3.5 The Significance of RS to Xuzhou’s LCH .......................................................... 133
3.6 Conclusion ........................................ .................................................................. 135
METHODOLOGY ............................................................................. 137 CHAPTER 4:
4.1 Introduction....................................... .................................................................. 137
4.2 Explanatory Sequential Mixed Mode Method ..................................................... 137
4.2.1 The Reasons for Mixing Quantitative and Qualitative Methods in a
Single Study ........................................................................................... 137
4.2.2 Decisions in Choosing a Mixed Mode Method Design ......................... 138
4.2.3 Explanatory Sequential Mixed Mode Method ....................................... 139
4.2.4 Prototypical Characteristics of the Explanatory Sequential Design ....... 141
4.2.5 Procedures of the Explanatory Sequential Design ................................. 143
4.3 The Explanatory Sequential Mixed Mode Method Design of this Research ...... 145
4.4 Quantitative Phase ............................ .................................................................. 148
4.4.1 Participants ............................................................................................. 148
4.4.2 Data Collection ....................................................................................... 149
4.4.2.1 Sample Sizes ........................................................................... 149
4.4.2.2 Structured Questionnaires ....................................................... 150
4.4.3 Data Analysis ......................................................................................... 153
4.4.3.1 Method of Regression ............................................................. 153
4.5 Qualitative Phase .............................. .................................................................. 157
4.5.1 Case Selection ........................................................................................ 157
4.5.2 Interview Questions Development ......................................................... 158
4.5.3 Data Collection and Analysis ................................................................. 158
4.6 Conclusion ........................................ .................................................................. 159

xii
QUANTITATIVE RESULTS ........................................................... 161 CHAPTER 5:
5.1 Introduction....................................... .................................................................. 161
5.2 Interpreting Multiple Regression ...... .................................................................. 161
5.3 Validity of Conceptual Model .......... .................................................................. 162
5.4 The Comparisons of Respondents’ IHSC between the Three Phases ................. 164
5.5 Residential Satisfaction .................... .................................................................. 170
5.5.1 The Comparisons of Four Elements’ Satisfactions and RS between
the Three Phases ..................................................................................... 170
5.5.2 The Comparisons of the Correlations between RSIndex and
Respondents’ IHSC between the Three Phases ...................................... 180
5.5.3 The Comparisons of the Determinants between the Three Phases ........ 185
5.6 Conclusion ........................................ .................................................................. 190
QUALITATIVE RESULTS .............................................................. 194 CHAPTER 6:
6.1 Introduction....................................... .................................................................. 194
6.2 Interviewee 1 .................................... .................................................................. 194
6.2.1 Individual and Household’s Socio-economic Characteristics ................ 195
6.2.2 Housing Unit Characteristics .................................................................. 196
6.2.3 Housing Unit Supporting Services ......................................................... 197
6.2.4 Housing Estate Supporting Facilities ..................................................... 199
6.2.5 Neighbourhood Characteristics .............................................................. 200
6.3 Interviewee 2 .................................... .................................................................. 202
6.3.1 Individual and Household’s Socio-economic Characteristics ................ 202
6.3.2 Housing Unit Characteristics .................................................................. 203
6.3.3 Housing Unit Supporting Services ......................................................... 204
6.3.4 Housing Estate Supporting Facilities ..................................................... 205
6.3.5 Neighbourhood Characteristics .............................................................. 206
6.4 Interviewee 3 .................................... .................................................................. 209
6.4.1 Individual and Household’s Socio-economic Characteristics ................ 210
6.4.2 Housing Unit Characteristics .................................................................. 211
6.4.3 Housing Unit Supporting Services ......................................................... 212
6.4.4 Housing Estate Supporting Facilities ..................................................... 213
6.4.5 Neighbourhood Characteristics .............................................................. 214
6.5 Interviewee 4 .................................... .................................................................. 216
6.5.1 Individual and Household’s Socio-economic Characteristics ................ 216

xiii
6.5.2 Housing Unit Characteristics .................................................................. 217
6.5.3 Housing Unit Supporting Services ......................................................... 218
6.5.4 Housing Estate Supporting Facilities ..................................................... 219
6.5.5 Neighbourhood Characteristics .............................................................. 220
6.6 Interviewee 5 .................................... .................................................................. 222
6.6.1 Individual and Household’s Socio-economic Characteristics ................ 222
6.6.2 Housing Unit Characteristics .................................................................. 224
6.6.3 Housing Unit Supporting Services ......................................................... 225
6.6.4 Housing Estate Supporting Facilities ..................................................... 225
6.6.5 Neighbourhood Characteristics .............................................................. 227
6.7 Interviewee 6 .................................... .................................................................. 229
6.7.1 Individual and Household’s Socio-economic Characteristics ................ 229
6.7.2 Housing Unit Characteristics .................................................................. 230
6.7.3 Housing Unit Supporting Services ......................................................... 231
6.7.4 Housing Estate Supporting Facilities ..................................................... 232
6.7.5 Neighbourhood Characteristics .............................................................. 233
6.8 Cross Case Analysis and Conclusion .................................................................. 235
6.8.1 Individual and Household’s Socio-Economic Characteristics ............... 241
6.8.2 Housing Unit Characteristics .................................................................. 242
6.8.3 Housing Unit Supporting Services ......................................................... 244
6.8.4 Housing Estate Supporting Facilities ..................................................... 245
6.8.5 Neighbourhood Characteristics .............................................................. 246
DISCUSSION ..................................................................................... 248 CHAPTER 7:
7.1 Introduction....................................... .................................................................. 248
7.2 RS in Three Phases of LCH .............. .................................................................. 248
7.3 Determinants of RS in Three Phases of LCH ...................................................... 263
7.3.1 Good Social Environment and Neighbourhood Facilities ...................... 264
7.3.1.1 Community Relationship ......................................................... 264
7.3.1.2 Local Crime and Accident Situation ....................................... 267
7.3.1.3 Quietness of the Housing Estate .............................................. 270
7.3.1.4 Resident’s Workplace and Nearest Bus/Taxi Station.............. 271
7.3.1.5 Community Clinic, Nearest General Hospital, and Nearest
School ...................................................................................... 273
7.3.1.6 Local Police Station ................................................................ 275

xiv
7.3.1.7 Nearest Fire Station ................................................................. 276
7.3.2 Good Layout and Maintenance for Public Facilities .............................. 277
7.3.2.1 Open Space .............................................................................. 277
7.3.2.2 Children’s Playground ............................................................. 278
7.3.2.3 Parking Facilities ..................................................................... 280
7.3.2.4 Local Shops ............................................................................. 281
7.3.2.5 Local Kindergarten .................................................................. 282
7.3.3 Good Maintenance for Housing Unit ..................................................... 284
7.3.3.1 Drain and Electrical & Telecommunication wiring ................ 284
7.3.3.2 Staircases, Corridor, and Garbage Disposal ............................ 285
7.3.4 Good Structure Design for Housing Unit ............................................... 288
7.3.4.1 Living Room, Dining Area, Bedroom, Toilet, and Drying
Area ...................................................................................... 288
7.3.5 More Commoditized LCH ...................................................................... 294
7.4 Summary of Discussion .................... .................................................................. 305
CONCLUSION AND RECOMMENDATIONS ............................. 306 CHAPTER 8:
8.1 Introduction....................................... .................................................................. 306
8.2 Summary of Findings ....................... .................................................................. 306
8.2.1 Validated Model and Factors Found in Developed and Developing
Countries ................................................................................................ 306
8.2.2 Levels of Satisfaction/Dissatisfaction between the Three Phases .......... 309
8.2.3 Determinants between the Three Phases ................................................ 310
8.2.4 Explorations on Determinants between the Three Phases ...................... 312
8.2.5 Public Participation Model as Recommendation to Improve RS ........... 322
8.3 Implications ...................................... .................................................................. 323
8.3.1 Low-Cost Housing Residents, NGO, NPC Deputies ............................. 323
8.3.2 Local Government and MSOCC ............................................................ 325
8.4 Recommendations............................. .................................................................. 330
8.4.1 Theory Prepared ..................................................................................... 330
8.4.2 Public Participation in LCH Development Model Proposed ................. 331
8.4.3 Public Participation in LCH Development Contributing to Policy ........ 337
8.4.3.1 Rational Pricing for LCH ........................................................ 337
8.4.3.2 Good Planning for LCH .......................................................... 338
8.4.3.3 Good HESF and HUC for LCH .............................................. 338

xv
8.5 Limitations of This Study ................. .................................................................. 339
8.6 Future study ...................................... .................................................................. 341
References ..................................................................................................................... 344
List of Publications and Papers Presented .................................................................... 356

xvi
LIST OF FIGURES
Figure 2.1: The Habitability System .............................................................................. 27
Figure 2.2: Systemic Model of RS ................................................................................. 30
Figure 2.3: Mohit et al.’s RS Model* ............................................................................. 31
Figure 2.4: Different Variables in Systemic Model of RS ............................................. 36
Figure 2.5: Mohit et al.’s RS Model with Five Components* ........................................ 39
Figure 2.6 Conceptual Model of This Study .................................................................. 40
Figure 2.7 The Ladder of Arnstein ................................................................................. 97
Figure 3.1: Xuzhou (Nantong, and Changzhou) (Three second-tier cities in Jiangsu
Province, China) ............................................................................................................ 112
Figure 3.2: Three Phases of LCH in Xuzhou ............................................................... 128
Figure 4.1: Explanatory Sequential Mixed Mode Method .......................................... 140
Figure 4.2: Flowchart of the Basic Procedures in Implementing an Explanatory
Sequential Mixed Methods Design ............................................................................... 145
Figure 4.3: Research Design ........................................................................................ 147
Figure 8.1 Quantitative & Qualitative Findings Summarised with (LGP: Local
Government Policy) ...................................................................................................... 313
Figure 8.2 Public Participation in the Full Process of LCH Development .................. 333

xvii
LIST OF TABLES
Table 2.1: Selected Attributes of Habitability from the Dwelling .................................. 32
Table 2.2: Selected Attributes of Habitability from the Environment ............................ 33
Table 2.3: Selected Attributes of Habitability from the Management ............................ 33
Table 2.4: Four Dimensions Regarding the Cognitive Aspect ....................................... 34
Table 3.1: Xuzhou City General Statistics .................................................................... 114
Table 3.2: Nantong City General Statistics ................................................................... 114
Table 3.3: Changzhou City General Statistics .............................................................. 115
Table 3.4: Nanjing City General Statistics .................................................................... 115
Table 3.5: Xuzhou City Information (2013) ................................................................. 122
Table 5.1: The Comparisons of Respondents' IHSC between the Three Phases .......... 169
Table 5.2: The Comparisons of Four Elements’ Satisfactions and RS between the Three
Phases ............................................................................................................................ 176
Table 5.3: The Comparisons of Spearman's and Pearson's correlation coefficients (r)
matrix between RSIndices and Respondents' IHSC between the Three Phases ........... 184
Table 5.4: The Comparisons of the Determinants between the Three Phases .............. 189
Table 6.1: Themes, Sub-Themes, and Categories across Cases and across Phases ...... 236

xviii
LIST OF SYMBOLS AND ABBREVIATIONS
LRH : Low-Rent Housing
LCH : Low-Cost Housing
LSPH : Housing with Limited Size and Price
PRH : Public Rental Housing
ECH : Economic and Comfortable Housing
HUC : Housing Unit Characteristics
HUSS : Housing Unit Supporting Services
HESF : Housing Estate Supporting Facilities
NC : Neighbourhood Characteristics
HUCSIndex : Housing Unit Characteristics Satisfaction Index
HUSSSIndex : Housing Unit Supporting Services Satisfaction Index
HESFSIndex :
Housing Estate Supporting Facilities Satisfaction
Index
NCSIndex : Neighbourhood Characteristics Satisfaction Index
MSOCC : Municipal State-Owned Construction Company

xix
LIST OF APPENDICES
Appendix A: Quantitative Questionnaire…………………………………………... 357
Appendix B: Definition of Variables………………………………………………. 365
Appendix C: Qualitative Questionnaire……………………………………………. 368
Appendix D: Interpreting A Stepwise Method Regression Analysis……………… 376
Appendix E: The Comparisons of Variables between the Three Phases…………... 445
Appendix F: Paper Presented at Conference……………………………………….. 459

1
INTRODUCTION CHAPTER 1:
1.1 Research Background
1.1.1 Residential Satisfaction (RS)
Since the first author named Onibokun (1974) did his research by using the formula
of residential satisfaction assessment on the habitability of a housing project, the
residential satisfaction reflected the degree of contentment experienced by an individual
or a family with respect to the existing living situation and the residential satisfaction
was an index of the level of contentment with the existing residential situation. In the
meanwhile, the residential satisfaction was portrayed as the feeling of contentment
when people’s needs or requirements in the houses were fulfilled.
The residential satisfaction should assess the individuals’ conditions of their
residential environment with respect to their needs, anticipations and achievements. The
difference between inhabitants’ actual and anticipated housing and neighbourhood
conditions had been making the concept of residential satisfaction more and more
conceptualised, i.e. the lower residential satisfaction indicated a lower degree of
congruence between inhabitants’ actual and anticipated housing and neighbourhood
conditions.
In other word, the satisfaction was appeared when the existing residential condition
met the inhabitants’ expectations. Otherwise, the dissatisfaction was show-up when the
existing residential situation did not meet the inhabitants’ expected residential
condition.
The residential satisfaction was also defined as a criterion which to examine the
relationships among the characteristics of the inhabitants in terms of cognitive and
behavioural and the characteristics of the environment in terms of physical and social
and was an important indicator and architects, developers, planners and policy makers
2
used in many ways (Amerigo & Aragones, 1997; Galster, 1985; Galster & Hesser,
2016; Jansen, 2013b; Li & Wu, 2013; Mason & Faulkenberry, 1978; McCray & Day,
1977; Mohit, Ibrahim, & Rashid, 2010; Wu, 2008).
1.1.2 China’s Low-Cost Housing (LCH)
In terms of the phrase of ‘public housing’ popularly used across the world
(Fitzpatrick & Stephens, 2008; Hills, 2007; Maclennan & More, 1997; Oxley, 2000;
Tsenkova & Turner, 2004), the critical core of the phrase of ‘public housing’ described
the housing tenure which was either purchased from a local government or allocated
(leased) from a local authority as a two-kind of ‘public housing’ system comprising of
Low-Cost Housing (LCH) and Low-Rent Housing (LRH) was first-time introduced in
China in 1998.
With respect to China’s low-cost housing, a lot of previous articles and journals
defined this type of housing with the function of social housing and having some
characteristics of commodity housing as well such as the partial homeownership shared
with the local housing bureau and named as ‘Economic Comfortable Housing (ECH)’
which was directly translated from Chinese name as ‘Jingji Shiyong Fang’.
According to its characteristics and the specific group of people who was targeted,
the new name of low-cost housing given by Central Compilation & Translation Bureau
of China was more appropriate for it being supposed to provide an economic and
comfortable house with certain conditions of homeownership to a medium-low income
household.
Therefore, before 1998 called ‘public housing’ pre-reform era in China had a very
recognizable feature with only having two types of housing, i.e. state provision (‘public
housing’) and non-state provision and after 1998 called ‘public housing’ post-reform era
3
had much more difficulties in identifying ‘public housing’ from other types of housing
such as low-cost housing being not so different from other types of ‘public housing’ and
commodity housing.
Moreover, as low-cost housing which was the main type of ‘public housing’ in China
before 2007 was not developed and even owned by the local government, only under
the supervisory control of local housing bureau, the ‘public housing’ was no longer
‘public’ developed or owned in China so that the phrase of ‘public housing’ in China
was already replaced with the name of Low-Income Housing also given by Central
Compilation & Translation Bureau of China with very Chinese unique of focusing on
the medium-low and low-income households who had problems of having houses in the
commodity market (Chen, Yang, & Wang, 2014; Guowuyuan guanyu jiejue chengshi di
shouru jiating zhufang kunnan de ruogan yijian, 2007; Hu, 2013; Huang, 2012; Jia,
22nd June 2011; Li, 2013).
1.1.3 The Significance of RS to China’s LCH
Those who currently lived at low-cost homes showed a lower housing satisfaction as
the locations of those low-cost houses in Chinese cities were far away from city centres
and the relatively poor infrastructure provided comparing with commodity houses (Hu,
2013; Huang, 2012). It meant that living at low-cost houses inconveniently and poor
infrastructure were talking about the issue of residential satisfaction.
Therefore, the assessment of residential satisfaction with China’s low-cost houses
was becoming a key to their decisions on whether they would buy their full
homeownership from municipal governments and either they would sell their low-cost
houses back to municipal governments or to give their houses over to those who were
new applicants for low-cost houses.

4
The residential satisfaction was not only to tell how the current living situation was
like, but also to tell from which facets the municipal governments should enhance to
improve their expectations of buying homeownerships.
Besides this, those residents who were living at low-cost houses were underclass and
should be given priority to ensuring their basic needs for housing by municipal
governments. After all, for them, it was not straightforward to purchase commodity
houses by way of selling their low-cost houses on the open market. Then, improving
their residential satisfaction with current low-cost houses would make them to feel their
basic housing needs being deserved protection. Yet perhaps, they would consider
purchasing their full ownership and then to sell and to buy commodity houses by the
time when their living conditions would have been improved. As thus, the low-cost
houses, to some extent, were about to be brought some certain finical compensation for
their buying next houses.
At same time, the assessment of residential satisfaction with low-cost houses was
very important to the municipal governments especially Xuzhou, because they not only
would be aware of how satisfied the residents felt about their current living conditions
and whether those factors had correlations with residential satisfaction, but also would
be aware of which factors were predictor factors and which predictor factors would
most predict the residential satisfaction.
Hence, the municipal governments would understand how to improve their
habitability with the following low-cost houses development from those predictor
factors instead of developers’ previous experiences in building. In the meantime, the
residents would be informed about whether what the municipal governments would deal
with those predictor factors were what factors they really concerned about. Then, the

5
residents would be better cooperating with the municipal governments to enhance their
habitability.
1.2 Problem Statement and Research Gap
1.2.1 Problem Statement
With reference to China’s low-cost housing’s irrational distribution and provision
nationwide, the current goal of total amount numbers of low-cost housing was deployed
not according to what the geographical layout real required, although the total amount
numbers of the low-cost housing-built had been increasing.
Furthermore, the allocation schemes of low-income housing which were made by
each city government with their knowledge of the local current housing market gave
decisions on how many types of low-income housing and how many units in each type
of low-income housing provided for medium-low, low, and lowest-income households.
Consequently, the proportion of low-income housing provision was sometimes
irrational, for instance, Xuzhou city only built low-cost housing between 2004 and
2009.
To put it in another way, the current planning of low-cost housing development
which was produced in line with the executive form of ‘from top to down’ was not able
to achieve what real needs were from the medium-low and low income group of
households.
Thus, the improved planning of low-cost housing development which should be
made consistently with the executive form of ‘from bottom to up’ would let city
government be aware of the medium-low and low income group of households’ real
residential needs in order to produce the qualified planning of low-cost housing

6
development so as to deliver more suitable low-cost housing to medium-low and low
income group of citizens.
Not only did residents consider the numbers of affordable housing provided as
needed, but quality of affordable housing was also concerned as priority (Gur &
Dostoglu, 2011). As what Gur and Dostoglu (2011) emphasized in their studies, to
consider all socio-cultural and physical factors would develop many more affordable
housing with more habitable and higher-quality environments.
Thus, quantity in low-cost housing construction was not one standard to improve
residential satisfaction, the improvement of quality of residential environment was the
core.
1.2.2 Research Gap
There have been very few studies of low-income group’s residential satisfaction with
low-cost housing in China. On exception, Huang and Du (2015) revealed that the
increasing of residential satisfaction with Hangzhou public housing depended more on
the improvement of neighbourhood characteristics, housing estate public facilities and
housing unit characteristics which are taken as significant predictor variables based
upon the household survey.
In addition, the increasing of residential satisfaction with Hangzhou public housing
depended less on the improvement of public housing allocation scheme, social
environment characteristics of neighbourhood and residence comparison which were
also taken as significant predictor variables (Huang & Du, 2015).
Especially, neighbourhood characteristics and housing estate public facilities were
found to be the main factors that influenced the level of residential satisfaction in
Hangzhou low-cost housing. Furthermore, Huang and Du (2015) found that residents

7
are most satisfied with cheap rental housing (also named Lianzu Fang) among the four
types of China’s public housing, followed by public rental housing (also named Gongzu
Fang) and monetary subsidised housing (HuoBi Buzu Fang), on the contrary, residents
were found to be the least satisfied with economic comfortable housing (low-cost
housing).
Most recent studies of overall residential satisfaction of China’s public housing and
public buildings focused on public expectations, quality perceived, public satisfaction,
public participation, and improve measures, and even Indoor Environment Quality
(IEQ) (Cao et al., 2012; Tian & Cui, 2009).
Furthermore, Tian and Cui (2009) found that the residents, who are living at a public
housing in Harbin, north-eastern China, were not satisfied with the layout, appearance,
heat ventilation, lighting, transport facilities, children’s schools, culture and
entertainment facilities.
Given the difficulty of collecting data, fewer studies of low-cost housing have been
conducted in developing countries and no study has been done with the relationship
between residential satisfaction and four residential components consisting of housing
unit characteristics, housing unit supporting services, housing estate supporting
facilities, and neighbourhood characteristics plus individual and household’s socio-
economic characteristics particularly in the latest second-tier city in Jiangsu province.
The step-wise method of Multiple-linear regression will be applied to analysing the
relative importance of different variables in explaining residential satisfaction.
Little is known about the experience of residential satisfaction from the residents’
perspective in China [significant exceptions being Huang and Du (2015), Tian and Cui
(2009), Tao, Wong, and Hui (2014), Li and Wu (2013), Fang (2006), Day (2013), Chen,

8
Zhang, Yang, and Yu (2013), Huang (2012), and Hu (2013)]. In particular, low-income
dwellers in China have few opportunities to express their feelings about their living
environments especially in the context of government’s decisions to increase the
numbers of low-income since 2007 based upon assessments of low-income housing’s
shortages (needs), ownership claims (needs), development mode and cost, and varieties
of low-income housing allocation schemes needs, however, none of which consider the
level of inhabitants’ residential satisfaction of low-income housing in China. As the
low-income dwellers in China have few opportunities to talk about their residential
satisfactions, this study will implement an explanatory sequential mixed methods design
to give their chances to talk by face to face.
Therefore, although the numbers of low-cost housing have been well supplied to
some extent in Chinese cities to meet low-income group’s basic housing needs, the
residential satisfaction and residents’ perspectives (cognition & behaviour) have not
been addressed appropriately in the process of residential assessment on China’s low-
cost housing.
1.3 Research Questions and Objectives
On the basis of the research background, the unresolved critical questions here
regarding the levels of satisfaction of inhabitants with the housing units and the
provided facilities among Xuzhou’s three phases of low-cost housing projects should
have been addressed:
i. What are predictors from previous studies about residential satisfactions of
public and commodity housing in developed and developing countries?
ii. What are levels of satisfaction/dissatisfaction perceived by the dwellers
with the provisions of housing units characteristics, housing units
supporting services, housing estates supporting facilities and
9
neighbourhood characteristics (collectively known as four components
deciding upon the level of residential satisfaction) between the three
phases of low-cost housing projects in Xuzhou city?
iii. What are the determinants/predictor variables that can improve dwellers’
residential satisfactions between the three phases of low-cost housing
projects in Xuzhou city?
iv. How to enhance those determinants based upon comparisons between the
three phases of low-cost housing projects?
v. What are the recommendations that could probably enhance Xuzhou’s
low-cost housing inhabitants’ residential satisfaction?
Led by those research questions, this paper is going to investigate these factors
related to the inhabitants’ residential satisfaction of low-cost housing in China
especially in the context of Xuzhou city and examine their roles in the overall
residential environment satisfaction process. Thus, the following research objectives
have been set for the study:
i. To identify the predictors from the previous studies about residential
satisfactions of public and commodity housing in the developed and
developing countries
ii. To identify and compare the level of residential satisfactions with the
overall and the four residential components perceived by the residents
between the three phases of low-cost housing projects in Xuzhou city,
Jiangsu Province, China
iii. To find out and compare the key predictors/determinants whose
improvements can enhance the inhabitants’ residential satisfactions
between the three phases of low-cost housing projects in Xuzhou city

10
iv. To explore and enhance those determinants based upon comparisons
between the three phases of low-cost housing projects
v. To recommend a development model of low-cost housing which to
probably enhance Xuzhou’s low-cost housing inhabitants’ residential
satisfaction
1.4 Research Methodology
This study will address the residential satisfaction in Xuzhou’s low-cost housing
projects. An explanatory sequential mixed mode method design will be used, and it will
involve collecting quantitative data first and then explaining the quantitative results with
in-depth qualitative data. In the first, quantitative part of the study, the structured
questionnaires data will be collected from 86, 95, and 80 participants at Xuzhou’s three
phases of low-cost housing projects to assess their residential satisfactions and will find
out of which the individual and household’s socio-economic characteristics and
residential environment part consisting of four components named housing unit
characteristics, housing unit supporting services, housing estate supporting facilities,
and neighbourhood characteristics will determine their residential satisfactions. The
second, qualitative part will be conducted as a follow up to the quantitative results to
help explain the quantitative results. In this exploratory follow-up, the tentative plan is
to explore the determinants of residential satisfaction at Xuzhou’s three phases of low-
cost housing projects.
1.5 Research Scope
Only three phases of low-cost housing projects in Xuzhou had been being currently
used as of the date of issue of the questionnaire. The rest of two phases of low-cost
housing projects consisted of Phase 4 (which had been completed construction, but was
not put into service) and Phase 5 (which was under construction). Besides, the type of

11
residents who were living there was only one type fulfilled with low-cost housing
applicants at that time including household per capita income was less than or equal to
600 RMB, urban residence for over 5 years, household per capita housing floor space
below 20 m2, and each low-cost housing applicant had no ability to buy a house.
1.5.1 Phase 1 of Xuzhou’s LCH
The 1st phase of low-cost housing [Chinese name is Yangguang Huayuan, English
known as Sunny (Yangguang) Garden (Huayuan)], which is located at North of
Guozhuang Road, Yunlong district, was built for resolving housing difficulties of local
medium-low income households by municipal party committee and government and
was one of the 2004 municipal key projects. The Yangguang Huayuan’s development
and construction was organised and implemented by Xuzhou Housing Security and Real
Estate Management Bureau with the support of local preferential policy.
Moreover, the Yangguang Huayuan whose development was restricted by the
construction standard made by Xuzhou Housing Security and Real Estate Management
Bureau was actually a policy-supported housing in line with the principal of “affordable
and moderately comfortable” to be sold to the urban medium-low income households
with housing difficulties.
Furthermore, the planned land was around 8.4 hectare with total floor area of about
100,000 square meters and each built-up area was around between 60 and 80 square
meters. This project started on 18th
June, 2004 and was put into use on 1st May, 2005. In
general, the Yangguang Huayuan has two main exits located at south and north
respectively and one minor exit at east. In Yangguang Huayuan, there are 24 blocks of
low-cost house units and another 4 blocks of resettlement house units and there have
some basic public facilities such as street lighting, kindergarten, recreation centre, etc.
("The Brief Introduction to Xuzhou's First Phase of Low-Cost Housing," 2012).

12
1.5.2 Phase 2 of Xuzhou’s LCH
The 2nd
phase of low-cost housing [Chinese name is Chengshi Huayuan, English
known as City (Chengshi) Garden (Huayuan)], which is located at West of Xiangwang
Road next to Jiuli district government and is very close to several parks and scenic
spots, was also built for resolving housing difficulties of local medium-low income
households by municipal party committee and government and was one of the 2005-
2006 municipal key projects. Furthermore, one elementary school, two middle schools,
and one local university are not far away from the Chengshi Huayuan which is located
at the centre of Jiuli district. Furthermore, the planned land was around 10.2 hectare
with almost same total floor area with Phase 1 of about 100,000 square meters and each
built-up area was around between 60 and 90 square meters which is a little bigger than
Phase 1.
Moreover, the Chengshi Huayuan whose development was also restricted by the
construction standard made by Xuzhou Housing Security and Real Estate Management
Bureau was actually a policy-supported housing in line with the principal of
“appropriate standard, functional, affordable, and convenient and energy-saving” and
was sold to the urban medium-low income households with housing difficulties.
This project started in October, 2005 and was put into use in November, 2006. In
Chengshi Huayuan, there are 22 blocks of low-cost house units and there have some
basic public facilities such as local shops, property management, kindergarten,
recreation centre, etc. ("The Brief Introduction to Xuzhou's Second Phase of Low-Cost
Housing," 2012).

13
1.5.3 Phase 3 of Xuzhou’s LCH
The 3rd
phase of low-cost housing [Chinese name is Binhe Huayuan, English known
as Binhe (Binhe) Garden (Huayuan)] which includes low-cost housing, low-rent
housing, and resettlement housing was a project in the public interest to put China’s11th
five-year plan of housing construction planning into effect in Xuzhou in order to
promote municipal party committee and government’s social housing security work and
was one of the 2007 municipal key projects.
Binhe Huayuan locates in the north of main city and its planned area was 18.67
hectare which is more than two times than Phase 1 and more than 1.5 times than Phase 2
with the total floor area of about 200,000 square meters that is two times than both
Phase 1 and Phase 2 and each built-up area was below 90 square meters that is almost
same as Phase 1 and Phase 2 for economic purpose.
In terms of the planned area and total floor area being almost two times bigger than
both Phase 1 and 2, on one hand, 100 units of low-rent housing were introduced for the
first time to enrich Xuzhou’s low-income housing programme (but unfortunately, the
100 units of low-rent housing since the completion of August 2008 were all vacant
based upon the experience and photos that was taken in June 2014), on the other hand,
more resettlement projects were constructed together with low-cost housing projects
comparing with the 1st phase (2
nd phase does not have resettlement houses) so that the
total floor area increased. In addition to the area being enlarged, whether the residential
satisfaction level of the inhabitants living at low-cost housing might have been affected
by this mixed living style (1st and 2
nd phases) should be considered.
Moreover, the Binhe Huayuan whose development was also restricted by the
construction standard made by Xuzhou Housing Security and Real Estate Management
Bureau was also a policy-supported housing according to the same principal as Phase 2
14
had regarding “appropriate standard, functional, affordable, and convenient and energy-
saving” and was sold to the urban medium-low income households with housing
difficulties or relocation matters.
In addition, this project was put into use in August, 2008. In Binhe Huayuan, there
are 23 blocks of low-cost house units with another 34 blocks of resettlement house units
and there have some basic public facilities such as local shops, kindergarten, recreation
centre, etc. ("The Brief Introduction to Xuzhou's Third Phase of Low-Cost Housing,"
2012).
1.6 Structure of the Thesis
The current chapter presents the research background. It states the research problem
and research gap that needs for studying residential satisfaction of China’s low-cost
housing. Then, it raises the research questions and decides on the research objectives.
To achieve the research objectives and answer the research questions will apply a
suitable research method to make a research design for this research work. The research
scope will focus on Xuzhou’s three phases of low-cost housing projects.
Chapter 2 reviews the residential satisfaction first in terms of the origin, concept,
and theoretical models. It deeply studies about three theoretical models with their
components and variables. Based on Mohit et al.’s residential satisfaction model, the
four residential components and individual background will decide the residential
satisfaction index. Then, it is necessary to understand what factors construct each
component to affect the residential satisfaction. As residential satisfaction in different
contexts of housing in different countries is totally different, those factors related to
different types of housing in different countries would be so diverse. Based upon the
characteristics of China’s low-cost housing, it should review those factors affecting
residential satisfaction in public housing in developed and developing countries. At

15
same time, it should also review the past papers studying on those factors affecting
residential satisfaction in commodity housing in developed and developing countries.
Furthermore, the type of data and data analysis in studying residential satisfaction
should also be reviewed.
Chapter 3 reviews China’s low-income housing and reviews the recent studies on
residential satisfaction and policy of China’s low-income housing. And then, it
introduces the city of Xuzhou in terms of economic transformation, economic growth,
and urban transformation and development. Then, it gives a general picture of Xuzhou’s
three phases of low-cost housing projects. In the meanwhile, it states the significances
of studying residential satisfactions of China’s low-cost housing especially Xuzhou’s
low-cost housing.
Chapter 4 chooses the explanatory sequential mixed mode method to guide this
research work based upon the research questions and objectives required. It develops a
suitable research design for this current study consisting of QUANTITATIVE part
(quantitative emphasis) and qualitative part to deeply explore the answers to the
research questions. The quantitative part includes selecting participants, data collection
and data analysis. The qualitative part also comprises case selection, interview questions
development, data collection and data analysis.
Chapter 5 gives the quantitative results came from the stepwise regression method.
The result will present the comparisons of four elements’ satisfactions and residential
satisfactions, the correlations between residential satisfaction index and respondents’
individual and household’s characteristics between the three phases. Then, the result
will display the comparisons of the determinants of residential satisfaction indices
between the three phases.

16
Chapter 6 presents the qualitative results based upon the quantitative findings. It
will highlight the answers came from the participants. And then, it will conclude the
results using the cross case analysis.
Chapter 7 integrates the quantitative (Chapter 5) and qualitative (Chapter 6) results
to answer the research questions regarding the residential satisfactions in three phases of
low-cost housing and determinants of residential satisfactions in three phases of low-
cost housing in terms of four residential components and individual and household’s
characteristics.
Chapter 8 concludes the findings and indicates the contributions of this study. It
develops recommendations for low-cost housing policymakers in Xuzhou based on the
findings of this research work. It also concludes the limitations of this study and
illustrates the future study.
17
LITERATURE REVIEW CHAPTER 2:
2.1 Introduction
This chapter was commenced with studies about the concept of residential
satisfaction which was the mainly discussed theory in this research work. Then, this
research work reviewed the main models to study residential satisfaction in housing.
After that, this research work would give a conceptual model to study China’s low-cost
housing.
As Chinese low-cost housing had the characteristics of commodity housing with the
partial homeownership and the characteristics of public housing as well, the factors
related to the four components plus the individual backgrounds predicting residential
satisfactions of public and commodity housing were discussed in terms of the developed
and developing countries in this chapter. Therefore, the related factors would be
concluded and form this research work’s survey questions in the quantitative part. The
research methodology in studying residential satisfaction in previous research works
would be discussed as well.
Then, the conclusion of this chapter was drawn upon the discussions about
recommendations to enhancing residential satisfaction of low-income housing.
2.2 Residential Satisfaction
2.2.1 The Origin of RS
Michelson (1966), Onibokun (1974) and Moser (2009) pointed out the previous
research works much focused on the urban physical environment that brought the
influences on people’s social life. However, the people’s attitude toward the urban
physical environment was not highly paid attention to.

18
Nevertheless, there were still some authors such as Michelson (1966), Gans (1962);
(Gans, 1967, 1982) and Hartman (1963) studying on the relationship of people’s social
diversities to the urban physical environment.
To challenge the recent research works turning into the studies on the relationship of
people’s social variables to the urban environment, they claimed that the most
concerned question regarding the recent work was which of those social variables such
as social status, stage in the life cycle, etc. were mostly connected with variations in the
urban environment.
Subsequently, Michelson (1966) concluded that two facets of social diversity in the
population such as the value orientations and the nature and extent of social interaction
should be seriously taken into account that affected planning physical aspects of the
city.
To some extent, the concept of Quality-of-Life could conclude the relationship
between people’s social variables and the physical urban environment as the Quality-of-
Life conceived in two ways such as objective and subjective in which Veenhoven
(1996) concluded that the objective Quality-of-Life showed the degree to which the
living conditions encountered the noted criterion of the good life, i.e. good health
centre, safety in where people lived, etc. and the subjective Quality-of-Life indicated
how people enjoyed their life in personal.
In addition, both the objective and subjective Quality-of-Life had the different
conditions of measurements which meant the condition of measurement regarding the
objective Quality-of-Life was based upon the distinct standard of success that could be
applied in everywhere and contrarily, the condition of measurement with regard to the

19
subjective Quality-of-Life might differ from people to people (Andrews, 1974; Andrews
& Withey, 1976).
Therefore, (Onibokun, 1974, 1976); Veenhoven (1996) claimed that the subjective-
appraisals often used ‘satisfaction’ as the judgement to summarise the evaluations on
how well someone liked something and then, ‘satisfaction’ was named as a central
criterion for judgement in the subjective Quality-of-Life.
In the meantime, Onibokun (1974) and Philips (1967) agreed upon what Veenhoven
(1996) said that any societies had to take some basic pre-requisites into serious
considerations such as shelter as Human Nature was to be considered by social welfare
and then argued that only providing shelter or places where people could live was not
enough as people’s mental urges were further required such as people’s feeling respect
or happy in where they lived. So, the habitability came into notice.
Whereas, Onibokun (1974) and Philips (1967) argued about the habitability that the
previous research works were cursory in explaining what the habitability was and what
the factors determined it, because the habitability was exceedingly complicated in the
light of the habitability varied in relevance to the surrounding circumstances.
Michelson (1970) mentioned in his book named “Man and His Urban Environment”,
Onibokun (1974) and Bauer (1951) pointed out that the habitability of a housing that
seemed like the environment of a “city” was affected not only by the physical facets, but
also by social, cultural, behavioural and other facets in the whole societal environmental
system. It meant that a habitation which was fulfilled with the requirement from the
physical part might not satisfy the needs that the inhabitants required.
Therefore, Onibokun (1974) agreed upon what Bauer (1951) said in “Social
Questions in Housing and Community Planning” that the house was the only one that

20
linking a chain of factors which determined the relative satisfaction of inhabitants with
their accommodations.
In terms of satisfaction, the 1960s’ research works placed emphasis on the urban
physical environment that brought a lot of impacts on people’s social life (Michelson,
1966) and (Onibokun, 1974). However, the people’s attitude toward the urban physical
environment was unfortunately not paid attention to. As a result, the relationship
between objective qualities of life and satisfaction was not highly noticed by the authors
(Veenhoven, 1996).
In the 1970s, as more and more researchers joined in studying on the relationship
between the inhabitants’ satisfaction and the urban physical environment, the distinction
of satisfaction-variants were found (Gans, 1962, 1967, 1982; Hartman, 1963;
Michelson, 1966), in which the first differentiated by objects of satisfaction meant the
satisfaction with the habitation elaborating satisfaction with ‘life-domains’ was distinct
from satisfaction with ‘life-as-a-whole’ (Onibokun, 1974; Philips, 1967; Veenhoven,
1996) and the second differentiated by scopes of evaluation meant the satisfaction with
the habitation explaining ‘aspect satisfaction’ was distinguished from ‘overall
satisfaction’ (Onibokun, 1974; Veenhoven, 1996) and the final one differentiated by
ways of appraisal meant that the satisfaction with the habitation applying the ‘affective
satisfaction’ was different from applying the ‘cognitive evaluations’.
As the evaluations on the habitability or habitants’ satisfaction could not barely rely
on the standards of success which meant that the more facilities that the habitation had
could not say the habitants’ satisfaction got higher, in other words, the Relative
Habitability (RH) of a housing or Relative Satisfaction (RS) of inhabitants placed more
emphases on the subjective Quality of Life than objective Quality of Life due to the
satisfaction as the assessment of the habitability targeting on human beings had to be
21
defined only in the relative rather than in the absolute sense (Bauer, 1951; Michelson,
1970; Onibokun, 1974; Philips, 1967; Veenhoven, 1996).
In short, the first and second differentiations of satisfaction-variants with the
habitation brought by the habitability was exceedingly complicated in the light of the
habitability varied in relevance to the surrounding circumstances (Onibokun, 1974;
Philips, 1967).
In addition, the final differentiation of satisfaction-variants with the habitation was
brought not only by the physical facets, but also by social, cultural, behavioural and
other facets in the whole societal environmental system. It meant a full physical part
fulfilled habitation might not satisfy the needs that the inhabitants required (Bauer,
1951; Michelson, 1970; Onibokun, 1974).
Furthermore, Veenhoven (1996) claimed that satisfaction with the habitation
elaborating satisfaction with ‘life-domains’ demonstrated the correlation between the
average satisfaction with housing and quality of housing measured by the average
number of persons per household. As Veenhoven said, that the average satisfaction with
housing was becoming higher indicated that the living condition had definitely been
improved.
2.2.2 The Concept of RS
Based upon Onibokun’s (1974, 1976)’s research studies on the habitability or the
satisfaction of tenants in a housing project, the issue regarding residential satisfaction
was discussed in considerable empirical studies heretofore, such as (Morris, Crull, &
Winter, 1976); Morris, Woods, and Jacobson (1972); (Morris & Winter, 1978) endorsed
what McCray and Day (1977) said that the housing satisfaction reflected the degree of
contentment experienced by an individual or a family with respect to the existing

22
housing situation and also claimed that the housing satisfaction was an index of the
level of contentment with the existing housing situation.
In the meanwhile, Amerigo and Aragones (1997) talked about the residential
satisfaction should assess the individuals’ conditions of their residential environment
with respect to their needs, anticipations and achievements. That is to say, Mohit et al.
(2010) summarised that the residential satisfaction which was portrayed as the feeling of
contentment when people’s needs or requirements in the houses have been fulfilled.
Hence, Mason and Faulkenberry (1978), Galster and Hesser (2016), Galster (1985),
Li and Wu (2013) concluded that the difference between inhabitants’ actual and
anticipated housing and neighbourhood conditions made the concept of residential
satisfaction more and more conceptualised, i.e. the lower residential satisfaction
indicated a lower degree of congruence between inhabitants’ actual and anticipated
housing and neighbourhood conditions.
In other word, the satisfaction was appeared when the existing residential condition
met the inhabitants’ expectations. Otherwise, the dissatisfaction was show-up when the
existing residential situation did not meet the inhabitants’ expected residential
condition. Therefore, Li and Wu (2013) concluded that the residential expectations or
preferences had a profound effect on residential satisfaction.
In addition, based upon what Wu (2008) found that the difference between the
current residential situation and inhabitants’ expected housing and neighbourhood
conditions was scientifically called the have-want divergence, Jansen (2013b) claimed
that the housing satisfaction referred the gap between what inhabitants preferred and
what inhabitants had. In another word, it is more important that the residents appreciate

23
what they already had in the current living situations rather than the current living
situation is not what they prefer (Jansen, 2013b).
Thus, Amerigo and Aragones (1997) and Mohit et al. (2010) claimed that the
residential satisfaction was also defined as a criterion which to examine the
relationships among the characteristics of the inhabitants in terms of cognitive and
behavioural and the characteristics of the environment in terms of physical and social. It
is also an important indicator and the architects, developers, planners and policy makers
use it in many ways (Amerigo & Aragones, 1997; Mohit et al., 2010).
Furthermore, Weidemann and Anderson (1985), Amerigo and Aragones (1997),
Djebarni and Al-Abed (2000) and Mohit et al. (2010) argued that the residential
satisfaction should be categorised into two different groups which were defined
according to residential satisfaction being treated as the criterion variable or the
dependent variable and the predictor variable or the independent variable.
Moreover, the residential satisfaction being treated as the dependent variable was
described as a criterion (Galster & Hesser, 2016; Marans & Rodgers, 1975) or a
particular evaluative measure (Marans & Rodgers, 1975; Rent & Rent, 1978) or an
assessment tool (Michelson, 1977; Weidemann & Anderson, 1985) whereby the current
residential quality or residents’ perceptions on their existing housing environment could
be measured so as to know whether the current residential environment would be
improved (Galster & Hesser, 2016; Marans & Rodgers, 1975; Michelson, 1977;
Weidemann & Anderson, 1985). The residential satisfaction could also be a reference
regarding which can tell what the quality of housing is (Marans & Rodgers, 1975; Rent
& Rent, 1978).

24
In addition, the residential satisfaction being treated as an independent variable was
considered as a predictor (Campbell, Converse, & Rodgers, 1976) or an indicator
(Speare, 1974; Varady, 1983) whereby an individual’s perceptions of general “quality
of life” would be predicted (Andrews, 1974; Andrews & Withey, 1976; Campbell et al.,
1976). An individual’s behaviour of residential mobility would be indicated so as to
know how the housing demands and neighbourhood would be changed then (Speare,
1974; Varady, 1983).
Onibokun (1974); (Onibokun, 1976), Mason and Faulkenberry (1978), Galster
(1985), Amerigo and Aragones (1997), Djebarni and Al-Abed (2000), Wu (2008),
Mohit et al. (2010), Jansen (2013b), Li and Wu (2013), and Galster and Hesser (2016)
concluded that the residential satisfaction has been studied and described as a criterion
variable while the residential satisfaction placed more emphases on the subjective
Quality-of-Life than objective Quality-of-Life.
As the satisfaction as a determinant of the habitability targeting on human beings, it
has to be defined only in the relative rather than in the absolute sense (Bauer, 1951;
Michelson, 1970; Onibokun, 1974; Philips, 1967; Veenhoven, 1996). Furthermore,
Campbell et al. (1976), Speare (1974), and Varady (1983) concluded that the residential
satisfaction was also described as a predictor variable which affecting residential
mobility.
In the following part, three theoretical models which intentionally studied the
residential satisfaction would be explained in detail with reference to the residential
satisfaction was an integrated index which was collectively determined by physical
environment factors and individual socio-economic characteristics.
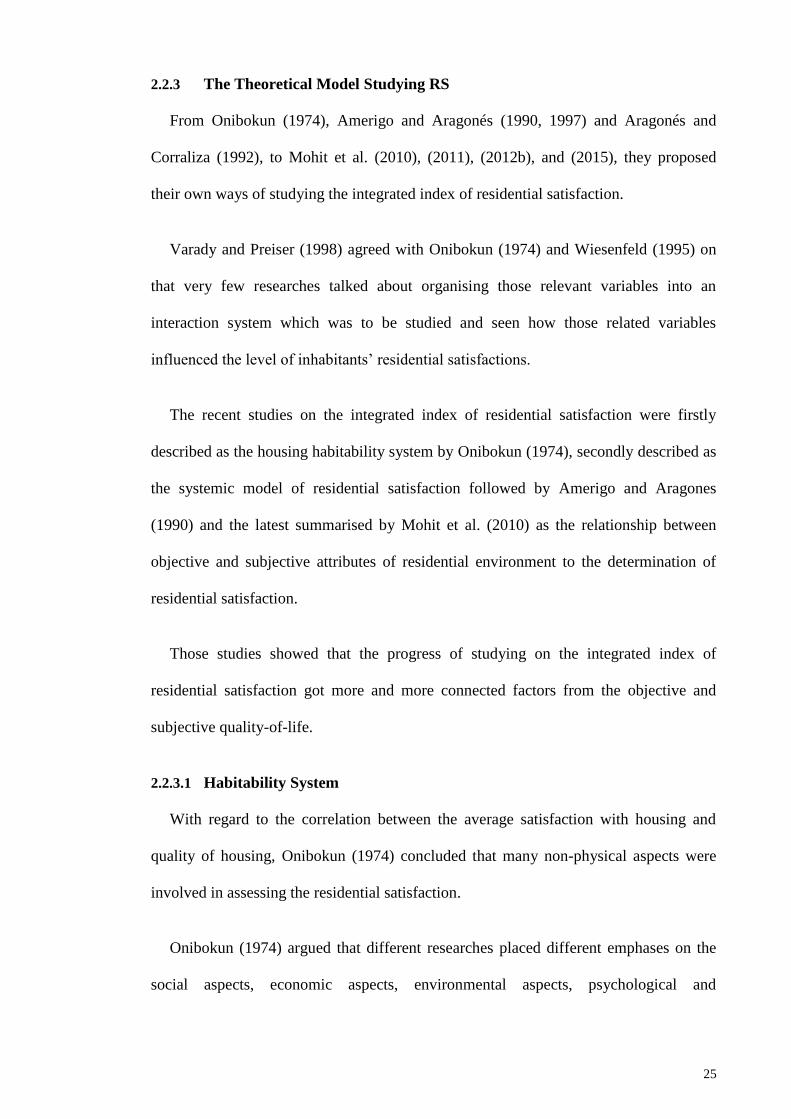
25
2.2.3 The Theoretical Model Studying RS
From Onibokun (1974), Amerigo and Aragonés (1990, 1997) and Aragonés and
Corraliza (1992), to Mohit et al. (2010), (2011), (2012b), and (2015), they proposed
their own ways of studying the integrated index of residential satisfaction.
Varady and Preiser (1998) agreed with Onibokun (1974) and Wiesenfeld (1995) on
that very few researches talked about organising those relevant variables into an
interaction system which was to be studied and seen how those related variables
influenced the level of inhabitants’ residential satisfactions.
The recent studies on the integrated index of residential satisfaction were firstly
described as the housing habitability system by Onibokun (1974), secondly described as
the systemic model of residential satisfaction followed by Amerigo and Aragones
(1990) and the latest summarised by Mohit et al. (2010) as the relationship between
objective and subjective attributes of residential environment to the determination of
residential satisfaction.
Those studies showed that the progress of studying on the integrated index of
residential satisfaction got more and more connected factors from the objective and
subjective quality-of-life.
2.2.3.1 Habitability System
With regard to the correlation between the average satisfaction with housing and
quality of housing, Onibokun (1974) concluded that many non-physical aspects were
involved in assessing the residential satisfaction.
Onibokun (1974) argued that different researches placed different emphases on the
social aspects, economic aspects, environmental aspects, psychological and
26
physiological aspects separately which had not yet been an interaction system
combining those aspects.
On that point, Onibokun (1974) synthesised all those said aspects in order to examine
their correlations. Thus, their collective and individual influencing on consumers’
housing satisfactions was to be found.
Onibokun (1974) firstly agreed with Fraser (1969) on that it was significantly
important for architects, planners and others who concerned about inhabitants’
satisfactions with their housing to propose an appropriate system to study the
comprehensive housing habitability. And then, Onibokun (1974) developed the Housing
Habitability System which described The Proposed Tenant Dwelling Environment
Management Interactive Model to study the comprehensive housing habitability in
terms of RHI (Relative Habitability Index of dwelling) and RSI (Relative Satisfaction
Index of tenants).
The habitability which was firstly described as a human concept was referred to a
type of tenant-dwelling-environment-management interactive model. It produced a type
of dwelling as regards to the tenant component of the system in consideration of the
tenants’ housing needs and expectations Onibokun (1974).
Furthermore, the habitability as a human idea involved four interactive subsystems
consisted of the tenant, dwelling, environment and management subsystem. It
determined the relative habitability level in terms of relative habitability index of
dwelling and relative satisfaction index of tenants (See Figure 2.1, The Habitability
System).

27
Figure 2.1: The Habitability System
RHI = Relative Habitability Index (of dwelling)
RSI = Relative Satisfaction Index (of tenants)
Source: The Tenant-Dwelling-Environment-Management Interaction System, Onibokun
(1974).
The following parts gave the explanations on the Habitability System through
subsystem-by-subsystem. Although the sufficiency of the housing unit was underlined
by some researchers as the housing unit was an important component in the housing
habitability system with the determinants of the structural quality, the internal space, the
housing amenities and the household facilities, the housing unit was argued by some
authors, such as Michelson (1970), Onibokun (1974) because the housing unit was not
the only element in the housing habitability system which meant that the housing unit
was only a subsystem of the whole system (see Figure 2.1).
In addition, with regard to the Housing Habitability System, the environment entity
was treated as a subsystem of the whole system. Thus, the variables of the environment
interactively brought some negative or positive impacts on the residents’ mentality and
on residents’ satisfaction with the dwelling in the context of the housing unit and the
residents both having a lot of contacts with the variables of the environment.
Tenants
Subsystem
Environment
Subsystem Management
Subsystem
Dwelling
Subsystem

28
The following subsystem regarding the management, the relative rules and
regulations were arranged either by the local Housing & Planning Authorities and the
state or the National Housing and Planning Authorities and Ministries or the other arms
of the bureaucratic system. Moreover, the relative rules and regulations were
implemented by appointed officials in order to guide the administration of the housing
unit and also brought some impacts on the inhabitants.
The last one, the most important subsystem or the central focus of the conceptual
model of habitability was the inhabitant who received all the suggestions from all other
subsystems and had the final decisions on what the habitability was. At the same time,
each person whose feeling about the housing habitability was different from the other
person’s because each person was separated by the living environment.
Therefore, the inhabitant’s participation was an indispensable subsystem in the
Housing Habitability System. Without inhabitant’s participation, the residential
satisfaction was hard to be measured because the physical environment could not
explain the levels of satisfactions.
2.2.3.2 Systemic Model of RS
Despite of the fact that the concepts were integratedly gained from the tenant-
dwelling-environment-management interaction system created by Onibokun (1974),
Amerigo and Aragones (1990) and Amerigo and Aragones (1997) mainly focused on
analysing each process in the said interaction system, i.e. the cognitive, the affective and
the behavioural processes on the basis of a proposed conceptual framework.
Furthermore, Amérigo’s (1990, 1992a) conceptual framework was more detailed
than the previous model of residential satisfaction in studying and examining the
dynamic interaction between the individual and his/her living condition.

29
With respect to the residential satisfaction can be a criterion variable or a predictor
variable, Amérigo’s (1990, 1992a) conceptual framework which was presented in
Figure 2.2 showed that the residential satisfaction as the result of this evaluation (as a
criterion variable) stated what the individual got the experiences from his/her residential
environment and also guided (as a predictor variable) the individual’s behaving in
consistent with that environment.
Thus, the interaction system in focus of the residential satisfaction started from the
objective attributes of the residential environment that were evaluated by the inhabitants
in the context of their personal characteristics to become the subjective attributes of
residential environment. Besides, some variables in their personal characteristics, such
as the inhabitants’ social-demographic characteristics affected the inhabitants’ levels of
residential satisfactions.
In the meanwhile, some variables in the inhabitants’ personal characteristics, such as
their ‘residential quality pattern’ (Amérigo, 1990, 1992a) whereby they could compare
their existing residential environment with their ideal one affected the level of
residential satisfaction directly.

30
Figure 2.2: Systemic Model of RS
Source: Amerigo and Aragonés (1990, 1997) and Aragonés and Corraliza (1992)
2.2.3.3 Mohit et al.’s RS Model
The systemic model of residential satisfaction proposed by Amérigo (1990, 1992a)
was the prototype of which Mohit et al. (2010), (2011), (2012b), and (2015) created a
conceptual model of residential satisfaction which to assess the level of residential
satisfaction. Additionally, Mohit et al. (2010) claimed that the level of residential
satisfaction was determined by the relationship between objective and subjective
attributes of residential environment.
In Figure 2.3, it showed that the level of residential satisfaction of the inhabitant was
determined by the subjective attributes of residential environment which came from the
evaluation on the objective attributes of residential environment. In the meanwhile, the
inhabitant’s evaluation was influenced by the individual and household’s socio-
economic characteristics.
Objective Attributes of
Residential Environment
Subjective Attributes of
Residential Environment
Residential
Satisfaction
Satisfaction
with Life in
General
Personal
Characteristics
Adaptive
Behavioural
Behavioural
Intentions

31
Figure 2.3: Mohit et al.’s RS Model*
*Relationship between objective and subjective attributes of residential environment to the determination
of residential satisfaction
Source: Mohit et al. (2010), (2011), (2012b), and (2015)
2.2.3.4 The Components/Variables of Three Models of RS
Commencing with the Habitability System to evaluate the level of residential
satisfaction of the inhabitants in a Canadian public housing project, several variables
from the habitability and non-habitability factors were put into discussions. Those
variables were originally from the dwelling subsystem consisting of the type and the
quality. The environment subsystem in which the dwelling was located included the
physical, psychological, and human factors. The management subsystem comprised the
pattern and the type of management.
Thereafter, the 28 variables as the selected attributes of habitability from the
dwelling subsystem in terms of the type and the quality were displayed in Table 2.1.
Objective
Attributes of Residential
Environment Residents’
impression based
on
individual/family’
s norms and values
Subjective
Attributes of Residential
Environment
Residential Satisfaction
Household’s
socio-economic
characteristics

32
Table 2.2 showed that the 27 variables described as the selected attributes of
habitability from the environment subsystem with respect to the physical, psychological,
and human factors which were surrounding the dwelling.
Table 2.3 indicated the 19 variables as the selected attributes of habitability from the
management subsystem regarding the pattern and the type of management.
Table 2.1: Selected Attributes of Habitability from the Dwelling
1. Your bedrooms 15. Clothes closets in this house
2. Your living-room 16. The storage space in your house
3. Your bathroom (s) 17. The hot water supply in this house
4. Your kitchen 18. The brightness or light in this house during the
daytime
5. Your dining area 19. The exterior noise transmission
6. Your basement, if any 20. The electric lighting in this house
7. The layout of the rooms, that is, the design in
relation to your daily life
21. Heating system in this house
8. The location of the different rooms 22. Space or place for children to play inside this
house
9. The colour and the painting of the rooms 23. Space or place for children to study, read, or
do their homework
10. The quality of the walls of your house 24. Space or place for other family members to do
things on their own
11. The quality of the floor of your house 25. The design and outside appearance of this
building
12. The windows in this house 26. The privacy within this dwelling
13. The doors in this house 27. Type of house
14. The stairs, if any, in this house 28. In-home equipment, such as light fixtures,
laundry facilities
Source: The Habitability System, Onibokun (1974)

33
Table 2.2: Selected Attributes of Habitability from the Environment
1.The location of schools your children attend 15. The amount of common space you and others in
this neighbourhood can use
2. The quality of schools for your children 16. The playground for the children living in this
housing project
3. Location of grocery store 17. The nearby recreational facilities for your
household and other tenants here
4. Location and quality of other shopping facilities 18. Your privacy from the people around here
5. The public transportation facilities and services in
this area
19. Compare the physical condition of this project
with private houses around
6. The location of housing relative to distance from
your place of work
20. Your neighbourhood’s impression of this project
with private houses around
7. The distance from your friends and relatives 21. The impression or opinion that people in this city
have about your house
8. The design and outside appearance of this housing
project
22. The impression or opinion that people at your job
have about your house
9. Physical condition and appearance of your
neighbourhood
23. How you get along with other tenants living in this
project with you
10. The public services available to the people living
here
24. How your co-tenants keep up or maintain their
compound
11. Parking facilities available to people living here 25. Noise in this area
12. The type of people living in this neighbourhood 26. Air pollution
13. The work done by policemen in this area 27. The reputation of this area
14. The outside “private spaces” that you and your
family can use
Source: The Habitability System, Onibokun (1974)
Table 2.3: Selected Attributes of Habitability from the Management
1. The way the management responds to necessary
repairs within your house
11. The officials of the Housing Authority do
not interfere with my privacy
2. The way the officials of the Housing Authority
treat you when they visit your dwelling
12. The superintendent or caretaker of my
apartment does not interfere with privacy
3. The way the superintendent or caretaker
attached to this project deals with you
13. Tenants are free to arrange their
apartments the way they like
4. The manner or the way in which rent is collected
from you
14. The general supervision of this project is
satisfactory
5. The idea of you providing your own stove and
refrigerator
15. The Housing Authority handles my
complaints to my satisfaction
6. Facilities provided for you to keep your garbage
until it is collected
16. It is easy to get in touch with the
management of this project
7. The garbage collection system (pick-up system) 17. Rent paid now
8. The way the houses here are taken care of with
regard to cleanliness and sanitation
18. Rent compared with what co-tenants pay
9. The rules which forbid you from doing certain
things here
19. Rent compared with what people pay in
comparable but privately owned houses
10. The way rules are enforced here
Source: The Habitability System, Onibokun (1974)
Followed by the systemic model of residential satisfaction, mainly focused on
analysing each process in what Onibokun (1974) mentioned about interaction system,
i.e. the cognitive, the affective and the behavioural processes. The variables or the

34
dimensions regarding the cognitive aspect in individual-residential environment
interaction were summarised in Table 2.4.
Table 2.4: Four Dimensions Regarding the Cognitive Aspect
Three Components Four Dimensions
The house A general dimension: the quality or the basic
infrastructure
A more specific dimension: the overcrowding
The neighbourhood or surrounding Residential safety
The internal representation of the residential
environment
the relationships with neighbours
Source: A Systemic Model of Residential Satisfaction, Amerigo and Aragonés (1990,
1997) and Aragonés and Corraliza (1992)
The above four important dimensions with respect to the cognitive aspect in
individual-residential environment interaction respectively showed the three
components consisting of the house, neighbourhood, and internal representation of the
residential environment.
Furthermore, as Onibokun (1974) talked about the type and the quality regarding the
dwelling subsystem, Amerigo and Aragones (1997) concluded that a general and a more
specific dimensions regarding the house took the quality or the basic infrastructure and
the overcrowding into considerations.
In the meanwhile, the neighbourhood or surrounding as Onibokun (1974) defined the
environment subsystem in terms of the physical, the psychological and the human
factors was described by Amerigo and Aragones (1997) as an important dimension
especially the residential safety.
Besides, what Onibokun (1974) talked about the management subsystem in his
interactive model, Amerigo and Aragones (1997) explained the fourth dimension
formed by the relationships with neighbours to represent the internal residential
environment.

35
As empirical research focusing on finding out the determinants of residential
satisfaction, it criticised that Onibokun’s (1974) interactive model of residential
satisfaction could not explain well because the variables in three subsystems were not
defined well.
Therefore, the approach proposed by Amerigo and Aragones (1990) (see Figure 2.4)
gave a good explanation on the variables in residential satisfaction by taking affective
aspect into account. The systemic model of residential satisfaction was established by
the objective and subjective attributes, as well as the individual and household’s
characteristics.
Furthermore, Tognoli (1987) concluded that a lot of variables of residential
satisfaction were found from different residential circumstances at different times.
However, the problem was how to unify those different variables to challenge
Onibokun’s (1974) interactive model.
Nonetheless, the approach built upon the objective and subjective attributes within a
systemic model of residential satisfaction concluded all variables from different studies
to be categorised by two dimensions, i.e. the physical vs. social dimension and the
objective vs. subjective dimension (Amerigo & Aragones, 1997).
Thus, several variables of residential satisfaction which were found from various
studies and were categorised by the approach (Amerigo & Aragones, 1990) were
concluded in Figure 2.4 where it showed the different variables of residential
satisfaction.

36
Subjective
Degree of maintenance of neighbourhood
Appearance of place
Apartment evaluation
Administration of neighbourhood
Safety
Friendship
Relationship with neighbours
Attachment of residential area
Perception of overcrowding
Homogeneity
Social
Physical
Single-family vs multi-family
Electricity
Noise level
Owner-rented
Time living in house
Time living in neighbourhood
Age
Life cycle
Presence of relatives in neighbourhood
Objective
Figure 2.4: Different Variables in Systemic Model of RS
Source: Amerigo and Aragonés (1990, 1997) and Aragonés and Corraliza (1992)
As the relationship between residential behaviour and satisfaction being the focus of
the studying, Fishbein and Ajzen (1974) concluded that the inhabitants’ behaviours
were compliance with their attitudes. It meant that the inhabitants who were satisfied
with their residential environment also had positive attitudes towards their residential
environment in terms of good relations with neighbours or frequent visits to neighbours,
participation in neighbourhood activities, etc.
However, Amerigo and Aragones (1997) did not support that the inhabitants being
satisfied with their residential environment led to the inhabitants’ behaviours were
compliance with their attitudes.
At the same time, Amerigo and Aragones (1997) agreed with Jansen (2013a) on that
the housing satisfaction referred to the gap between what inhabitants preferred and what
inhabitants had, i.e. that inhabitants appreciated what they already had in the current
residential situation which was whether good or not was more important than the
current living situation was not what they preferred even was good.

37
And then, some studies argued and gave their interesting findings that the residents
who did not make any improvements to the house and did not do anything to improve
the surroundings were testified more satisfied than those who already had.
Furthermore, Amerigo and Aragones (1997) agreed with Bauer (1951); Michelson
(1970) and Onibokun (1974) on that a full physical parts fulfilled habitation might not
satisfy the needs that the inhabitants required.
They claimed based upon their studies that participation in neighbourhood activities
and good relations with neighbours or frequent visits to neighbours were related to a
higher level of residential satisfaction of the inhabitants.
Therefore, the level of residential satisfaction of the inhabitants did not have some
certain associations with the relationship between attitudes and specific behaviours.
In addition, as residential satisfaction being considered as a criterion variable in this
current study, the integrated approach of residential satisfaction was learnt from Mohit
et al. (2010), (2011), (2012b), and (2015) whose study about the relationship between
objective and subjective attributes of residential environment to determine the
residential satisfaction (see Figure 2.5). As a matter of fact, the Mohit et al.’s residential
satisfaction model was created on the basis of the components in the interactive model
in terms of tenant, dwelling, environment and management subsystems (Onibokun,
1974) and the approach built upon the objective and subjective attributes towards the
affective aspect within a systemic model of residential satisfaction (Amerigo &
Aragones, 1997).
Furthermore, those factors/variables in the integrated approach of residential
satisfaction were concluded from various studies by Onibokun (1974); Amerigo and
Aragones (1990); Amerigo and Aragones (1997); Tognoli (1987); Fishbein and Ajzen

38
(1974); Jansen (2013a); Bauer (1951); Mohit et al. (2010); Michelson (1970). Those
variables were shown in Figure 2.5.
Regarding those factors/variables grouped into 5 components, Mohit et al. (2010)
claimed that the five components formed the basis of residential satisfaction of the
inhabitants based upon the residential satisfaction was a complicated construct of the
indices of satisfaction in terms of dwelling unit features, dwelling unit support services,
public facilities, social environment and neighbourhood facilities.
Therefore, Mohit et al. (2010); (Mohit & Nazyddah, 2011) put these five components
into their conceptual model of residential satisfaction according to what the past
researches had done with the residential satisfaction in public housing (see Figure 2.5).
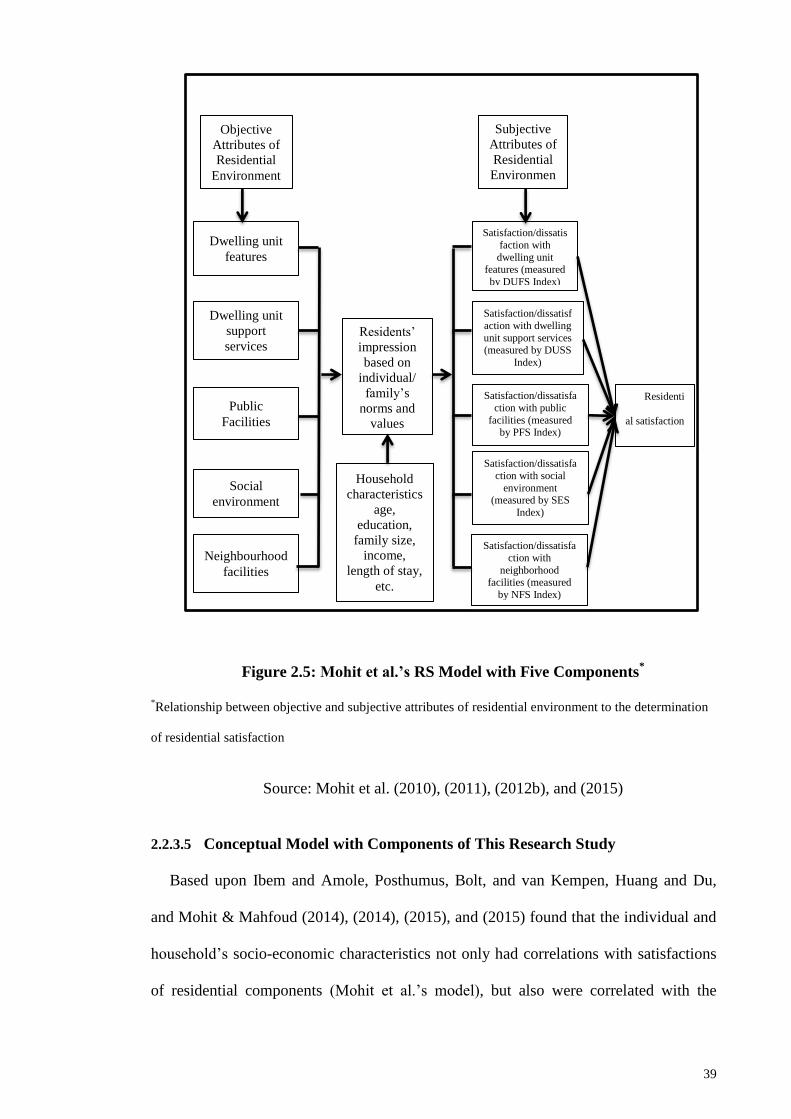
39
Figure 2.5: Mohit et al.’s RS Model with Five Components*
*Relationship between objective and subjective attributes of residential environment to the determination
of residential satisfaction
Source: Mohit et al. (2010), (2011), (2012b), and (2015)
2.2.3.5 Conceptual Model with Components of This Research Study
Based upon Ibem and Amole, Posthumus, Bolt, and van Kempen, Huang and Du,
and Mohit & Mahfoud (2014), (2014), (2015), and (2015) found that the individual and
household’s socio-economic characteristics not only had correlations with satisfactions
of residential components (Mohit et al.’s model), but also were correlated with the
Objective
Attributes of
Residential
Environment
Dwelling unit
features
Dwelling unit
support
services
Public
Facilities
Social
environment
Neighbourhood
facilities
Residents’
impression
based on
individual/
family’s
norms and
values
Household
characteristics
age,
education,
family size,
income,
length of stay,
etc.
Subjective
Attributes of
Residential
Environmen
t
Satisfaction/dissatis
faction with
dwelling unit features (measured
by DUFS Index)
Satisfaction/dissatisf
action with dwelling
unit support services (measured by DUSS
Index)
Satisfaction/dissatisfa
ction with public
facilities (measured by PFS Index)
Satisfaction/dissatisfa
ction with social
environment (measured by SES
Index)
Satisfaction/dissatisfa
ction with
neighborhood facilities (measured
by NFS Index)
Residenti
al satisfaction
(measured by
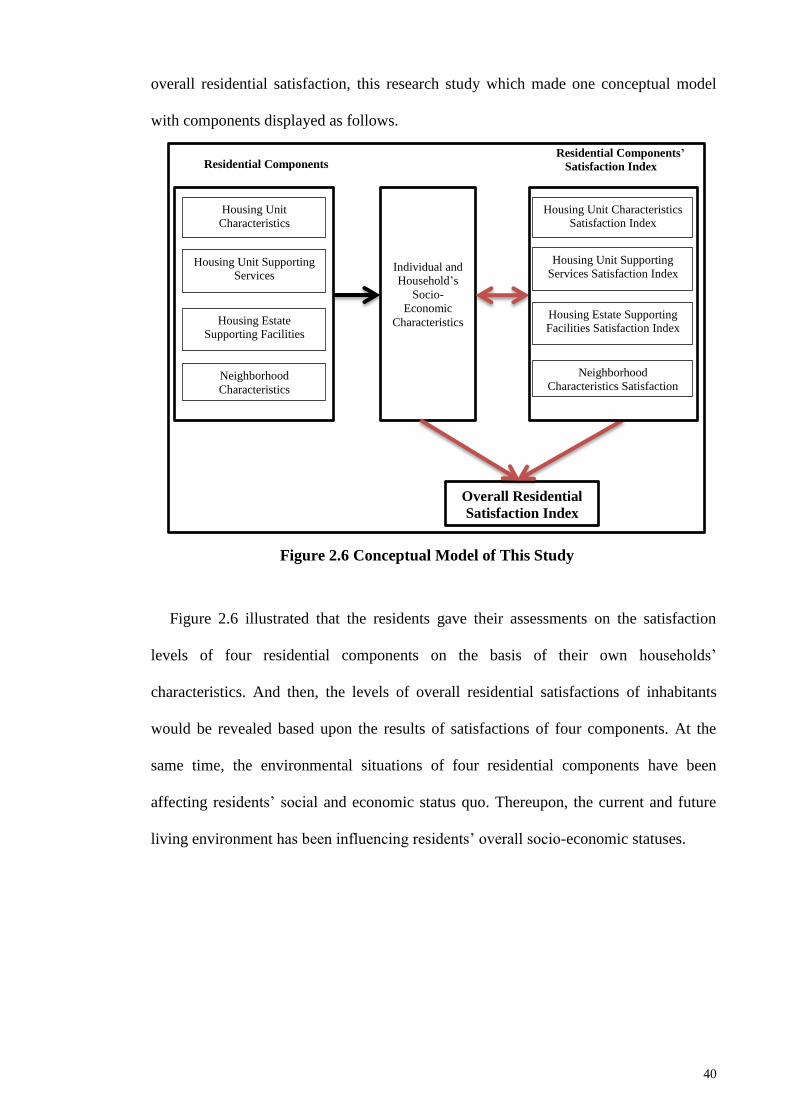
40
overall residential satisfaction, this research study which made one conceptual model
with components displayed as follows.
Figure 2.6 illustrated that the residents gave their assessments on the satisfaction
levels of four residential components on the basis of their own households’
characteristics. And then, the levels of overall residential satisfactions of inhabitants
would be revealed based upon the results of satisfactions of four components. At the
same time, the environmental situations of four residential components have been
affecting residents’ social and economic status quo. Thereupon, the current and future
living environment has been influencing residents’ overall socio-economic statuses.
Individual and
Household’s
Socio-
Economic
Characteristics
Overall Residential
Satisfaction Index
Housing Unit
Characteristics Satisfaction
Housing Unit Supporting Services
Housing Estate Supporting Facilities
Neighborhood
Characteristics Satisfaction Index
Residential Components
Housing Unit Characteristics Satisfaction Index
Housing Unit Supporting
Services Satisfaction Index
Housing Estate Supporting Facilities Satisfaction Index
Neighborhood
Characteristics Satisfaction Index
Residential Components’
Satisfaction Index
Figure 2.6 Conceptual Model of This Study

41
2.3 RS in Different Contexts of Housing in Different Countries
2.3.1 Different Factors Affecting RS in Housing
Although some authors challenged the conventional usage of households’ residential
satisfaction such as Galster (1985) introduced ‘marginal residential improvement
priority’ which made the significant differences from households’ residential
satisfaction, many other authors criticised that the households’ residential satisfaction
was still used as a guide for housing policy and development.
Assessment of residential satisfaction in different types of housing placed more
emphases on the housing orientations and the social values (Hartman, 1963). It was as
Francescato, Weidemann, and Anderson (1989); Fraser (1968); Galster (1980); Galster
and Hesser (2016) concluded that the relative habitability of dwellings and the users’
views on the built environment were applied through the approach of residential
satisfaction so as to indicate the compositional and contextual correlations.
Besides, Bechtel and Churchman (2003); Gifford (1987) suggested that the principles
of environmental psychology should be applied to analysing those psychological factors
that affecting users’ views on the residential environment.
Moreover, Adriaanse (2007) not only agreed on Galster and Hesser’s (2016) theory
of residential satisfaction introducing an integrative and more comprehensive approach
to measuring the residential satisfaction, but Adriaanse’s (2007) findings elicited that
the satisfaction with subdomain ‘residential social climate’ was the most important
component of overall residential satisfaction.

42
Balestra and Sultan (2013) gave further explanations on that the residential
satisfaction was a broad concept which was affected by multidimensional aspects
including physical, social and neighbourhood components, as well as the psychological
and socio demographic characteristics of the residents.
Balestra and Sultan (2013) explored the relationship between households’ residential
satisfaction and a number of multidimensional aspects and found that there had a
complex relationship between residential satisfaction and housing characteristics
consisting of features of neighbourhood, and individual and household’s socio-
demographic characteristics (e.g. age, gender, education, etc.).
Thus, the most authors gave the same conclusion that understanding those factors
was a key to planning a successful and effective housing policy.
Furthermore, many authors found out more factors which more or less affected the
residential satisfaction in the context of the different residential environmental
situations, such as Al-Homoud (2011) studied how the physical and social
neighbourhood attributes influenced the community satisfaction.
In terms of the strongest factors to influence the community satisfaction were
socialising and life satisfaction comparing to other factors such as services, policing,
safety, traffic, local government, school quality, healthcare facilities, public
transportation, and parks, the Badia communities were more affected by social
interactions than the physical features and provision of services. Thus, it recommended
those planners and decision makers to consider the sociocultural environment in the
forthcoming developments in the rural Badia to bring more satisfactions to the local
villagers.
43
Speaking of Turkey, Bekleyen and Korkmaz (2013) found that today’s users did not
accept the similarities between the modern and traditional living spaces in Sanliurfa city
located in south eastern Turkey. Further studies showed that some changes in the design
of their houses regarding the spatial location characteristics of neighbourhood brought
more satisfaction to the users. In the meanwhile, the setting and characteristics of the
settlement were the most concerned.
One more factor described as a crowding issue or inner urban higher-density was
brought into studies of the residential satisfaction (Bonnes, Bonaiuto, & Ercolani,
1991). They proposed a contextual approach to the study of crowding. Their study was
carried out at a specific urban place (a neighbourhood in Rome) inside a large
metropolitan area which had the socio-physical unity and crowding occurs.
Furthermore, on account of the perception of crowding expressed by the residents,
their study aimed to investigate the relationship between negative evaluation of social
density (crowding) and inhabitants’ residential satisfaction. They concluded that there
had a strong saliency of the crowding evaluation within the overall residential
satisfaction and also within the residents’ concerns with the spatiosocial openness-
closeness of the neighbourhood environment.
Based upon what Bonnes et al. (1991) concluded, Buys and Miller (2012) carried out
their study on the predictors of residential satisfaction in inner urban higher-density
environments in view of ‘negative evaluation of social density (crowding)’.
Although increasing the population density of urban areas was a key policy strategy
to sustainable growth, Bonnes et al. (1991), Buys and Miller (2012) found that many
residents often viewed higher-density living as an undesirable long-term housing option.

44
Buys and Miller (2012) revealed that the specific features of housing unit and
neighbourhood that were critical in predicting residential satisfaction in terms of
satisfaction with housing unit location, design and facilities, noise, walkability, safety
and social environment of housing area and social contacts in the neighbourhood.
Thus, Buys and Miller (2012) concluded that knowing those factors could help
planners and designers during the process of developments and also enhance quality and
ensure a lower resident turnover rate. The most important thing was to facilitate
acceptance and understanding of high-density living.
The factors moving to the individual characteristics, life quality and other
requirements influencing housing and the physical and social features of the
environment, Kellekci and Berköz (2006) ascertained that the factors increasing levels
of satisfaction varied regarding the demographic and socio-economic structural
differences of the users.
The factors that led to satisfaction with housing and residential environment
contained so called potential factors which had the influences on the appreciation of
dwelling aspects. S. J. Jansen’s (2013a) research focused on inhabitants’ perceptions of
residential quality concerning 23 different dwelling aspects and 2 additional potential
factors consisting of preference and experience.
It revealed that residents who lived according to their preferences gave higher
appreciation results than residents who did not. Jansen (2013a) considered this kind of
result even to be applied to low quality housing.
Furthermore, as household’s preference was independent, the residential satisfactions
of those households who appreciated their current housing situations based on their
experiences were more satisfied than those households who did not.

45
It was confirmed that the impact of both preference and experience were concluded
as an interaction effect in residential satisfaction assessment.
Based upon the positive effect of experience on appreciation was larger in residents
who lived in a housing situation that they did not prefer, Jansen (2013a) expected the
result to be like that the impact of experience works would decrease the ‘gap’ in
residential satisfaction due to the discrepancy between what residents had and what they
wanted.
Berkoz, Turk, and Kellekci (2009) continued with the conclusion drawn in 2006 and
to give a further study on specifying those factors which reciprocally influenced
residents’ location choices and the level of satisfaction in housing and environmental
quality.
Moreover, the results turned out that on account of the factors of centrality,
accessibility to open areas, accessibility to health institutions, the maintenance of the
mass housing environment, satisfaction in recreational areas, satisfaction in the social
structure and physical features of the settlement contributed most to predicting
residents’ location choices at central and peripheral districts in the Istanbul metropolitan
area, mass housing users preferred central districts over peripheral ones.
Therefore, Berkoz et al. (2009) declared that mass housing users, who lived in
central districts and peripheral areas in Istanbul, Turkey, had to be studied separately.
Moreover, the requirements from their living spaces and their ways of how to look at
their residential surroundings which were outstandingly different in the case of location
choices would influence the level of residential satisfaction of the mass housing users.

46
2.3.2 Separate Assessment of RS in Different Contexts of Housing
As some authors did assessments of residential satisfactions in different types of
housing with different contexts, they found that the findings were significantly different.
Thus, the different types of housing with different contexts should be studied separately
(Adriaanse, 2007; Carvalho, George, & Anthony, 1997; Galster & Hesser, 2016;
Grinstein-Weiss et al., 2011; Hourihan, 1984; James, 2008; Li & Wu, 2013; McCray &
Day, 1977; Mohit & Nazyddah, 2011).
Regarding this point, Adriaanse (2007) found that the findings from a selected
sample of 75,034 respondents represented for the population of Dutch residents in 2002
were in a way similar with Galster and Hesser’s (2016) findings drawn from analysis of
767 households sampled in Wooster, Ohio that the demographic and socio-economic
structural almost similar of the inhabitants were probably supposed to live adjacently.
To elaborate on the inhabitants with almost same background who were probably
supposed to live closely, the residential satisfaction should be examined by housing type
(Hourihan, 1984). The 381 females disaggregated into four housing subgroups in Cork,
Ireland, Hourihan (1984) chose these groups with significant differences in their level of
satisfaction, their perception and evaluation of several neighbourhood attributes, and
their personal characteristics and at first used a regression model of satisfaction for the
entire sample which only explained about 39% of the variation, but it elicited the
intergroup differences.
Thus, the separate regression was asked to be introduced to the four groups which
explained an average of 51% of the variance in residential satisfaction. Therefore, the
residents of public housing and older street-type housing had significant differences
both from each other and from persons living in privately-built homes and speculative
estates.

47
Thereby, Grinstein-Weiss et al. (2011) claimed that the relationship between
homeownership and neighbourhood characteristics satisfaction amongst low- and
moderate-income households should be studied separately.
Grinstein-Weiss et al. (2011) found that most research works on the relationship
between homeownership and neighbourhood characteristics satisfaction used nationally
representative samples of homeowners and ignored the exclusive experience of low-
and moderate-income homeowners.
In terms of subsidised and nonsubsidised renters, James (2008) employed the cross-
tabulation analysis on 43,360 households in the 2005 American Housing Survey
controlling for subsidised/nonsubsidised renters and found that the subsidised renters
showed notably higher satisfaction with their housing unit characteristics and
neighbourhood characteristics satisfaction comparing to those nonsubsidised renters
with similar spatial location characteristics of neighbourhoods.
Furthermore, McCray and Day (1977) gave a research on comparison of identifying
the housing related values, aspirations, and satisfactions between a group of randomly
selected low-income rural residents living at private dwellings and a group of randomly
selected low-income urban residents living at public housing. Thus, they found that the
public housing units provided the residents with the physiological needs, but those
deficiencies in environmental factors such as location, community services, and social
aspects of the environment frustrated satisfaction of the higher order needs comparing to
the private dwellings.
Even Mohit and Nazyddah (2011) claimed that housing satisfaction of Malaysian
Selangor Zakat Board (SZB) social housing programme, which was comprised of the
transit housing, the individual housing, and the cluster housing, had to be studied

48
separately in terms of objective measurement and subjective measurement.
Accordingly, the Selangor Zakat Board (SZB) would understand what the current
situation of each social housing programme was and how to improve its management.
Therefore, the different types of housing with different contexts where the different
residents with different demographic and socio-economic structural differences were
living should be studied separately.
To assess residential satisfaction in different types of housing, understating the
factors was a key to planning successful and effective housing policies.
2.3.3 Characteristics of China’s LCH
The characteristics of China’s low-cost housing have decided this current research
work to review the factors affecting public and commodity housing’s residential
satisfactions.
Before discussing the residential satisfaction in developed and developing countries,
it should be clear about what China’s low-cost housing is. In terms of the characteristics
that China’s socialism had, the definition of China’s low-cost housing is certainly
different from other countries’.
The Chinese low-cost housing (in Chinese, named Jingji Shiyong Fang or JingShi
Fang), before this appellation, most published paper named “economic and comfortable
housing, short form as ECH” (Huang, 2012; Huang & Du, 2015).
Now Central Compilation & Translation Bureau of China which had the highest
level of decision on English translation of any Chinese official documents in China gave
the latest name to this particular type of housing as Low-Cost Housing (LCH) instead of
‘affordable housing’ or ‘economic and comfortable housing’ in consideration of its

49
primary characteristic being as economy, i.e. its price was much lower than the similar
commodity housing (Jia, 22nd June 2011).
Admittedly, the affordable housing overseas was literally described as a commodity
housing whose targeted customers were medium and medium low-income groups and
provided full ownerships to customers (Gur & Dostoglu, 2011; Paris, 2006; Paris &
Kangari, 2005; Wang & Murie, 2011).
In the meanwhile, the Low-Cost Housing was the main type of low-income housing
[in Chinese, named Baozhang Fang (Jia, 22nd June 2011)] in each city comparing to
another two types of low-income housing such as Low-Rent Housing and Public Rental
Housing (Huang, 2012).
The LCH was a unique type of housing in China, because in other countries there
had two types of low-cost housing named public and private low-cost housing whereby
could tell the differentiations in the ownerships of these two types of low-cost housing
(Aziz & Ahmad, 2012; Hashim, Samikon, Nasir, & Ismail, 2012; Mohit et al., 2010;
Salleh, 2008; Teck-Hong, 2012; Wahi, bin Junaini, & Ieee, 2012).
However, the LCH in China was defined by State Council as an ownership-oriented
housing provided by developers on free land allocated by municipal governments and
sold by municipal governments to the eligible households at given prices by
governments from which developers were permitted to get a 3% profit margin
(Guowuyuan guanyu jiejue chengshi di shouru jiating zhufang kunnan de ruogan yijian,
2007).
Accordingly, the LCH actually did not have differences in its ownership in China
and its ownership was divided into two parts of which one part belonged to municipal
government and another part belonged to resident.

50
In terms of the average price of low-cost homes, it was about 50-60% of the average
price of all housing during 1998-2006 (Huang, 2012; Huang & Du, 2015).
Meanwhile, comparing to commodity housing which was sold at the open market
with “full property rights, such as right of occupancy, the right to extract financial
benefits, the right to dispose of the property through resale, and the right to bequeath it
to others” (Huang, 2012; Huang & Du, 2015), the LCH which was sold at subsidised
prices provided those “eligible so-called applicants” with “partial property rights”,
which meant that homeowners only had the right of occupancy and use (Huang, 2012;
Huang & Du, 2015).
In that case, it was said that those residents who lived at low-cost houses were not
allowed to sell their properties on the open market for profit within the first five years
(which might be more than 5 years made by the state-level according to the evaluations
on different situations of real estate markets in different city-level, for example,
Xuzhou’s city government made a temporary decision on the first 10 years that
residents could not sell their houses on open markets (Guowuyuan guanyu jiejue
chengshi di shouru jiating zhufang kunnan de ruogan yijian, 2007).
The reason why the residential satisfaction of China’s low-cost housing needed to be
deeply studied was that China’s LCH had two identities which were compiled by Huang
(2012) based upon various government’s documents to indicate ownership and
subsidies.
In terms of ownership and subsidies, they not only had the differences from other
countries’ public and private low-cost housing, China’s commodity housing, and
China’s another two types of low-income housing, but also did they have to indemnify
households’ residential quality.

51
Regarding those eligible applicants who were low and middle-income households
(before 2007) and after 2007 were low-income households with difficulty in buying
house, their residential quality had to be assured and at same time the low-cost housing
would bring some certain economic benefits to homeowners.
For those who had full ownerships or planned to purchase ownerships, they not only
cared about full ownership, but also further investing money in low-cost houses was
their most concerns because the low-cost housing at very least was a profitable
investment comparing to other two types of low-income housing with only one housing
tenure “rent”.
Meanwhile, when China’s central government at first time introduced low-cost
housing to people, the LCH was built in accordance with a type of commodity housing
with social security function.
Thus, China’s LCH as a type of commodity housing firstly had the characteristics of
commodity housing which meant that it had to fulfil some standards and requirements
made by commodity housing. Secondly, it had something economic value on the open
market in the near future as the normal commodity housing did have.
Besides, China’s LCH also as a type of low-income housing targeted at low-income
households with difficulty in buying house. The selling price was controlled by the
municipal government. In addition, the socio-economic characteristics of these specific
groups, their basic living needs, and LCH’s practicality would be taken into
considerations by the local government (Guowuyuan guanyu jiejue chengshi di shouru
jiating zhufang kunnan de ruogan yijian, 2007).

52
In a word, if China’s low-cost houses and residential environment were not satisfied
by those homeowners, they probably thought that they should have chosen low-rent
houses or public rental houses at the very beginning instead of spending a considerable
amount of money in buying low-cost houses with more dissatisfaction of “partial
ownerships” as the low-rent housing and public rental housing both did not provide
ownerships at the present stage.
Thus, the assessment of residential satisfaction in China’s low-cost housing in a way
could clearly illustrate what situations those current residents were and what those
current residents required. Then, the municipal governments were aware of how to
improve their works in order to fulfil those residents’ requirements.
Hence, the more factors being assessed made more accurate of residential
satisfaction in China’s low-cost housing.
Under the guidance of the integrated approach of residential satisfaction mentioned
above and on the basis of the characteristics of China’s LCH regarding which the
municipal governments more focused on its social security than its economic
characteristics, the factors which affected residential satisfaction of LCH would be
studied from public housing (public low-cost housing, social housing, etc.) and
commodity housing (private low-cost housing, all categories of commodity housing,
etc. ) in developed and developing countries.
2.3.4 RS of Public Housing in the Developed and Developing Countries
Heretofore, rivers of ink had been devoted to the research to discuss the factors
which affected the overall satisfaction of public housing in developed and developing
countries, such as Fauth, Leventhal, and Brooks-Gunn (2004) talked about lifting up the

53
objective attributes of residential environment could change residents’ personal
conditions from self-degradation, sociopath into a better condition.
Thereupon, it could change their subjective attributes of residential environment
based upon a positive life orientation, which was found by Rent and Rent (1978), that
had enormously significant correlations with housing unit characteristics satisfaction.
In their studies, they picked up Yonkers, New York as their case study where the
low-income minority families living in public and private housing in high-poverty
neighbourhoods had chances via lottery to move to publicly funded attached row-houses
in seven middle-class neighbourhoods.
After almost 2 years of observation and interviewing on 173 Black and Latino
families who moved and 142 demographically similar families who remained in high-
poverty neighbourhoods, Fauth et al. (2004) applied multiple regression analysis and
found that the personal conditions of those 173 Black and Latino families were firstly
changed more differently than other 142 families in violence and disorder, experience
health problems, abuse alcohol, receive cash assistance being reduced heavily.
Furthermore, secondly changing of subjective attributes of residential environment
were made by those 173 Black and Latino families in terms of being satisfied with
neighbourhood resources comprising garbage collection, recreational facilities,
transportation, schools and medical care, experience higher housing quality, and be
employed.
Thus, the reason why a considerable number of scholars had been studying about the
factors was because they wanted to find out the significant predictor variables of
residential satisfaction, whereby the governments could be led to know from which

54
factor they should pay very close attention to and would do some improvements to
enhance the residents’ habitability.
For instance, Varady and Preiser (1998) evaluated how this new public housing
programme was by way of assessing satisfaction levels of residents. And then, they
suggested the municipal government to pay very close attention to these three
significantly correlated components containing management, neighbourhood issues, and
physical housing conditions.
Amongst these three components, neighbourhood social interaction, tenant
involvement policies, and age as predictor variables given by multiple regression
analysis would lead the municipal government where to enhance the residential
habitability.
2.3.4.1 Factors Affecting RS in Public Housing in Developed Countries
In developed countries, as diversified types of public housing consisting of public
low-cost housing, social housing, national rental housing, and public rental housing, etc.
caught the scholars’ attention of studying, the scholars should study about which
determinants among those factors in different types of public housing affected the
residential satisfaction.
Four Residential Components and RS (a)
A complicated relationship between residential satisfaction and housing unit
characteristics consisting of neighbourhood’s features was revealed by applying ordered
probit analysis to the result of two household surveys. Furthermore, Balestra and Sultan
(2013) presented that individual and household’s socio-demographic characteristics,
such as age, gender and educational attainment played a secondary role once the
housing unit and neighbourhood characteristics were controlled for.
55
Comparing to Mohit et al.’s (2010), (2011), (2012b), and (2015) five components
and Huang & Du’s (2015) four components and individual and household’s socio-
economic characteristics, Nam and Choi (2007) found that three components of
satisfaction comprising the residential environment satisfaction, social satisfaction and
economic satisfaction determined the residential satisfaction level in Korean national
rental houses.
Furthermore, Nam and Choi (2007) found that residential environment satisfaction
was highly correlated with three factors such as the house structure, educational
environment and the relationship with management staffs.
Meanwhile, the four factors described as the relationship with the neighbours,
confidence on the neighbours and reduction of feeling of social exclusion and
experience of discrimination were found to be significantly correlated with social
satisfaction.
Finally, the four factors containing the appropriateness of rent, management
expenses, and opportunity of income creation, and distance to the workplace were
critically correlated with economic satisfaction.
At same time, Paris and Kangari’s (2005) findings, which were drawn from the
analysis to these factors consisting of safety from crime (also see Adriaanse, 2007),
housing management, maintenance, and resident similarity amongst housing
environment, housing characteristics, and individual and household’s socio-economic
characteristics, were concluded into three components which affected residential
satisfaction of multifamily affordable houses. The component of housing unit support
services was the most concerned followed by another two components of
neighbourhood social environment and housing unit features.

56
Referring to their findings, the factors as property management, tenant selection
policies, enforcing residential rules, communication with residents, maintenance, quality
of building repairs, overall cleanness of property grounds, overall cleanness of the
community were classified as the component of housing unit support services which
mostly affecting residential satisfaction in multifamily affordable housing in Atlanta.
Followed by satisfactions with quality of the community, residents’ perception of
safety in their neighbourhood at night and residents’ perception of safety at night while
inside their units were concluded into the component of social environment and lastly
the component of housing unit features talked about two facets consisting of building
quality and overall satisfaction with their apartment units.
Learnt from Mohit et al.’s (2010), (2011), (2012b), and (2015) five components and
Huang & Du’s (2015) four components and individual and household’s socio-economic
characteristics which had been applied by many scholars to assess the overall residential
satisfaction, the factors affecting the residential satisfactions of public and commodity
housing in developed and developing countries will be discussed next in accordance
with the components of housing unit characteristics (HUC), housing unit supporting
services (HUSS), housing estate supporting facilities (HESF), and neighbourhood
characteristics (NC), and individual and household’s socio-economic characteristics.
They reason why to review these factors determining the residential satisfactions of
public and commodity housing from developed and developing countries was that these
factors would firstly help this research work to constitute the questionnaire. In addition,
this research work’s findings would be discussed with those previous studies about
developed and developing countries’ public and commodity housing satisfactions so
that the Xuzhou’s local government could learn from the revisions.

57
Factors from Housing Unit Characteristics (HUC) (b)
The discussion commenced with the component of HUC comparing to other three
components, because the houses where people lived and on which people relied were
more obviously important than the rest of components which were not always 24 hours
securing your living satisfaction.
James (2008) employed the cross-tabulation analysis on 43,360 households in the
2005 American Housing Survey controlling for subsidised/nonsubsidised renters and
found that the subsidised renters had higher satisfactions with their housing unit
characteristics comparing to nonsubsidised renters with similar spatial location
characteristics of neighbourhoods.
Then, James (2008) suggested by analysing 488,302 AHS-Metropolitan samples
taken between 1985 and 2004 that decreasing the size and the age of the subsidised
housing structures rather than increasing the proportion of subsidised housing could
significantly improve the residential satisfaction of subsidised residents in the
metropolitan area.
A cumulative logit analysis being applied by James (2007) on 7,206 rented
multifamily units found that bathroom, garage/carport, or balcony were highly
significantly correlated with tenants’ satisfaction.
Likewise, a group of 5,170 units undergoing modifications from 1997 to 2005 were
analysed and revealed that renters’ satisfaction was apparently positively correlated with
the addition of a bathroom or central air conditioning, followed by the addition of a
balcony, other room, dishwasher, or garage/carport having a lower degree of positive
correlation with renters’ satisfaction.

58
On the other hand, James (2007) affirmed that renters’ satisfaction was noticeably
negatively correlated with violation of space separation by noise intrusion through
walls, floors, or ceilings. Furthermore, James (2007) found a bit difference from the
result of the tracking period which was that other amenities such as a fireplace, disposal,
or dishwasher had no statistically significant correlation with tenants’ satisfaction.
Factors from Housing Unit Supporting Services (HUSS) (c)
Furthermore, the discussion moved to the component of HUSS which was the
secondly considerable issue, because residents would better know whether those
property management services provided by non-profit organisations directly such as
some government agencies were more convenient or those services provided by private
management companies were more expedient.
As a matter of fact, the public housing residents did not really concern who would
provide services, but they truly concerned whether those services provided were
inexpensive and convenient.
As is often the case, the non-profit organisations such as government agencies who
were in charge of property management services of public housing were delighted to
sign the contract with those private management companies when they were under the
pressure from municipal government and local housing authorities such as some
regulations of affordable housing, tenant turnover and vacancy rates having to be
decreased, and the physical building structure had to be maintained.
In addition, the non-profit organisations had several problems of managing
affordable houses such as meeting financial and budgeting constraints just like what the
US did with property management services in affordable housing in Atlanta, Georgia.
59
However, whether the private management company could supply good property
management services for residents who lived at Defoors Ferry Manor, a non-profit
multifamily affordable housing community that was owned by Atlanta Mutual Housing
Association, Paris (2006) found that the residents were least satisfied with convenience
as the high turnover rate in property management staff resulted in the high frequent
new-coming staffs who were not familiar with residents’ current living situations.
Thus, based upon China’s low-cost housing had its unique characteristics consisted
of social and commodity housing, their property management services should be
provided by some government agencies in order to deliver cheap and convenient
services to low-cost housing residents.
Factors from Housing Estate Supporting Facilities (HESF) (d)
Furthermore, the discussion moved to the component of HESF which was the thirdly
considerable issue. However, not so many scholars were found to be interested in
studying this component in developed countries’ public housing.
The tenants who lived in public housing projects in certain areas of Canada severely
felt dissatisfied with the lack of open space, playgrounds, and private yards (Onibokun,
1974).
Factors from Neighbourhood Characteristics (NC) (e)
The Neighbourhood characteristics component was comprised of social environment
and spatial location characteristics (Dekker, de Vos, Musterd, & van Kempen, 2011).
Grinstein-Weiss et al. (2011) asserted that neighbourhood characteristics satisfaction
index had an exceedingly significant correlation with overall quality of life.

60
Thus, most western authors gave the explicit answer that the component of
neighbourhood characteristics should be paid more attention by the municipal
government, than other components, such as housing unit characteristics, housing unit
supporting services, and housing estate supporting facilities when they were dealing
with residential satisfaction (Adriaanse, 2007; Amerigo & Aragones, 1990; Dekker et
al., 2011); Dennis Lord and Rent (1987); (Fauth et al., 2004; Fried, 1973; Fried &
Gleicher, 1961; Galster & Hesser, 2016; Grinstein-Weiss et al., 2011; HaSeongKyu,
2006; Kleit, 2001a, 2001b; Onibokun, 1974; Rent & Rent, 1978; Varady & Preiser,
1998).
Rent and Rent (1978), interviewed how these 257 respondents living at 33 different
low-income housing estates throughout South Carolina felt about their residences and
found that the level of neighbourhood characteristics satisfaction was much lower than
housing unit characteristics satisfaction.
As the component of neighbourhood characteristics had more complicated
factors/variables comparing to the other three components when assessing residential
satisfaction in any types of residences, Onibokun (1974) not only agreed with Rent and
Rent (1978) on paying more attention on neighbourhood characteristics, Onibokun
(1974) also gave very detailed explanations on which factors in neighbourhood
characteristics to make the tenants who living at public housing projects in certain areas
of Canada dissatisfied.
The public transportations linking the main shopping centres and recreational areas
to the location of the public housing projects were not adequate and efficient. Moreover,
high levels of noise and high probability of interference from neighbours generated by
many large-sized households on a small piece of property mainly made the tenants feel
dissatisfied.

61
Furthermore, the bad image of public housing projects which was sometimes created
by the tenants or sometimes was imagined by outside residents had perpetuated a
stereotyped bad image in the minds of the public, and thus, it also made the tenants feel
dissatisfied with living in this environment (Onibokun, 1974).
With respect to the small and privately managed subsidised housing estates in
Charlotte, North Carolina, which had been built dispersedly since 1976 when those
large and publicly owned projects were built centrally between 1950s and 1960s, it was
found by way of interviewing 160 residents in eight dispersed public housing projects
that the residents did not care about the issue of spatial location characteristics of
neighbourhoods, however, the residents were clearly satisfied with an improvement
over previous residences in terms of the quality of the dwelling unit and feeling at home
in the neighbourhoods (Dennis Lord & Rent, 1987; James, 2008).
However, as a matter of fact, the change from living centrally into living dispersedly
actually brought some implications on residents in terms of they were separated from
former neighbourhoods of friends, relatives, and often jobs. As they moved into the
scattered-site public housing projects, the different locations of public housing projects
had different social-spatial characteristics of the neighbourhoods with their different
levels of residential satisfaction (Dennis Lord & Rent, 1987; James, 2008).
Moreover, some social-spatial characteristics of the neighbourhoods amongst these
eight scattered-site public housing projects were found to win residents’ high level of
satisfaction with access to school and presence of “good people”. On the contrary, some
social-spatial characteristics of the neighbourhoods lost residents’ satisfaction and made
the noblest differences regarding access to public transportation, shopping and jobs.

62
In terms of the relocation, (Fried, 1973); Fried and Gleicher (1961) at first strongly
agreed with Dennis Lord and Rent (1987) and Varady and Preiser (1998) on that public
housing had to be built centrally, not dispersedly.
However, (Fried, 1973); Fried and Gleicher (1961) claimed that it was not
substantiated that public housing could resolve relocation problems which meant the
public housing was the only part of urban renewal planning, because most residents
were overwhelmingly satisfied with where they lived before than relocated area in terms
of the close associations maintained among the local people and strong sense of identity
to the local places.
Likewise, Varady and Preiser (1998) did a comparative research about whether
Public Housing Authorities raising satisfaction levels of residents by means of pursuing
a scattered-site policy or revitalising existing central projects.
Then, the cross-tabular analysis was employed to the results of 211 residents of the
Cincinnati Metropolitan Housing Authority family housing by telephone interviewing
and indicated that residents chose revitalising existing central neighbourhoods instead of
choosing scattered-site neighbourhoods.
The fact of the matter was to resolve relocation problems should pay very attention
to these two elements consisting of localised social networks and a sense of belonging
which to combine into the context of the residential area (Amerigo & Aragones, 1990;
Fried, 1973; Fried & Gleicher, 1961).
In addition, Adriaanse (2007) strongly followed what (Amerigo & Aragones, 1990;
Fried, 1973); Fried and Gleicher (1961) found and claimed that the satisfaction with
residential social climate was the most significant factor based on multivariate analysis
63
to the result of 75,034 respondents representing the population of Dutch residents in
2002.
Furthermore, both Amerigo and Aragones (1990) and Varady and Preiser (1998)
agreed and applied the multiple regression analysis to the results of 447 housewives
living at council housing in Madrid, 211 respondents living at scattered-site public
houses in Cincinnati, and 257 respondents of 33 different low-income houses in South
Carolina and found the similar answers which were that attachment to the
neighbourhood (a sense of belonging, social inclusion) and relationships with
neighbours (more neighbourhood social interaction, more tenant involvement, and more
friendly to neighbours) to a certain extent could explain the greatest variance in
residential satisfaction and also promoted satisfaction levels of residents.
Except for Dennis Lord and Rent (1987) claimed that the spatial location
characteristics of neighbourhood was more important when the residents moved to eight
dispersed public housing estates in Charlotte, North Carolina, however, they were
clearly satisfied with social environment characteristics of neighbourhoods, such as
feeling at home in new neighbourhoods.
HaSeongKyu (2006) firmly agreed with Fried (1973); (Fried & Gleicher, 1961;
Varady & Preiser, 1998) on that most residents were tremendously satisfied with where
they lived before than relocation area with respect to close associations maintained
amongst the local people and strong sense of identity to the local places.
Furthermore, Kleit (2001b) and Kleit (2001a) admitted the fact that the personal
conditions with self-degradation, sociopath of those 173 Black and Latino families who
moved into publicly funded attached row-houses in seven middle-class neighbourhoods

64
for almost two years had been greatly reduced in terms of violence and disorder,
experience health problems, and abuse alcohol.
In terms of those 173 Black and Latino families gradually got more satisfied with
neighbourhood public facilities including garbage collection, recreational facilities,
transportation, schools and medical care, Kleit (2001b) and Kleit (2001a) claimed that
the residents living at dispersed public houses surrounded by non-poor households knew
their more diverse neighbours with greater diverse social networks so that they could
enjoy varied sources of information.
On the contrary, HaSeongKyu (2006) agreed with what Fauth et al. (2004) found that
those 173 Black and Latino families were lower frequency of informal socialisation
with their new neighbours than those 142 demographically similar families who
remained in high-poverty neighbourhoods continued with their higher frequency of
communications with their neighbours.
At the same time, Kleit (2001a) and Dennis Lord and Rent (1987) claimed that
residents lived at dispersed public houses in Washington, DC, such as single- and multi-
family houses and public townhouses which were located in rich areas felt less
enthusiastically close to their neighbours than their counterparts who lived at small
clusters of public housing.
Simultaneously, Galster & Hesser and Adriaanse’s (2016) and (2007) findings
concluded HaSeongKyu’s (2006) discussions that those respondents’ satisfaction
ratings were more strongly tied to the similarity of neighbours so that social exclusion
existed amongst these sorts of high-low income mixed-groups and social mixing
residences.
65
Regarding this, HaSeongKyu’s (2006) study was a pioneer of elaborating the causes
and consequences brought by social exclusion which had been happening between
residents who lived in public rental housing estates and residents who lived in
surrounding non-public housing in Korea.
Furthermore, the relationship between social exclusion and residential satisfaction in
public rental houses and surrounding non-public houses was analysed via interviewing
with household heads and field surveys and found that residents living at public houses
adjacent to non-public housing had a strong feeling of social exclusion.
Thus, it came out from a reason that was explained by Onibokun (1974) about the
bad image of public housing projects which was sometimes created by the tenants or
was imagined by outside residents had perpetuated a stereotyped bad image in the
minds of the public.
Moreover, the feeling of residential exclusion and discrimination were two predictor
variables found by HaSeongKyu (2006) which were significantly correlated with
residential satisfaction of inhabitants in public housing and adjacent to non-public
housing.
Accordingly, the number of residents who opposed to social mixing residence was
much higher than the number of residents who supported social mixing residence
(HaSeongKyu, 2006).
Regardless of low-income residents living in high-poverty neighbourhoods had
chances via lottery, or were subsidised by ‘tenant-based’ assistance programmes aimed
at decentralising poverty to move to middle-class or non-poor neighbourhoods, all kinds
of above mentioned poverty residence decentralising only employed the changes of
spatial locations characteristics of neighbourhoods so that it neglected that the residents’

66
social networks were changed since they were (not) forced to be relocated to
somewhere else.
Although the changes of spatial locations characteristics of neighbourhoods brought
some improvements in the quality of the housing unit, housing supporting services, and
housing estate supporting facilities, the residents were still considered as the new
neighbours in the housing area where they did not have such a sense of belonging due to
the social exclusion being as the main factor of social environment characteristics of
neighbourhoods existed and critically affected satisfaction levels of residents and their
communications with non-poor neighbourhoods (Dennis Lord & Rent, 1987; Fauth et
al., 2004; Fried, 1973; Fried & Gleicher, 1961; HaSeongKyu, 2006; Kleit, 2001a).
Thereupon, to solve social exclusion could be done by municipal government to
minimise the problems of social-mixed residences within the same community. In the
meantime, it could be fixed by NGOs by way of promoting social capital such as social
networks, norms, and social trust which were considerable important to the poor people.
The social capital could be taken as an asset which was used by the poor people to
facilitate coordination and communication for mutual understanding between poor and
non-poor neighbourhoods so as to enhance social inclusion (HaSeongKyu, 2006; Kleit,
2001b).
Factors from Individual and household’s Socio-Economic Characteristics (f)
Varady and Preiser (1998) found that the age as one of predictor variables
determined satisfaction levels of Cincinnati Metropolitan Housing Authority family
housing residents.
67
Moreover, Rent and Rent (1978) found in their study of low-income housing
neighbourhood satisfaction in 33 different housing estates by interviewing 257 residents
in South Carolina that the length of residence had no relationship with neighbourhood
satisfaction, however, the short period of staying in length of residence had very
significant correlation with housing unit characteristics satisfaction.
Before talking about homeownership, the issue of the “right to housing” of the low-
and moderate-income groups was the criteria of the provision of public housing,
however, some disturbing situations circumscribed some certain degree of the “right to
housing” so as to affect residential satisfaction.
In Hong Kong, the five different dimensions which were concluded by Yung and Lee
(2012) consisting of the “right to sufficient housing”, the “right to affordable housing”,
the “right to enjoy” one’s housing without indiscriminate interference, freedom from the
threat of indiscriminate forced eviction, and “the right of choice” were essential to the
satisfaction of the “right to housing”.
However, although the provision of public rental housing in Hong Kong almost
protected the “right to housing” of the low-income residents, the high-density buildings
and crowding situation fairly restricted the levels of satisfaction in the “right to enjoy
housing” and the “right to privacy” (Yung & Lee, 2012).
Since the policymakers were interested in promoting homeownership amongst low
and moderate income groups of households in US over the past two decades, Rent and
Rent (1978) and Grinstein-Weiss et al. (2011) found that the homeownership was not
only significantly correlated with the housing unit characteristics satisfaction, but also
was a significant predictor variable to determine the neighbourhood characteristics

68
satisfaction. In another word, promoting homeownership amongst low- and moderate-
income households could improve their levels of residential satisfaction.
2.3.4.2 Factors Affecting RS in Public Housing in Developing Countries
Mohit and Azim (2012b) found that a majority of the residents living at the public
housing in Hulhumalé were only slightly satisfied.
Furthermore, Mohit et al. (2010) and Mohit and Nazyddah (2011) had the same
conclusion that the residents, who lived at newly designed public low-cost housing in
Kuala Lumpur and lived at three types of low-cost housing in Selangor State, Malaysia,
were moderately satisfied with their housing units.
Moreover, both the mean satisfaction score of 3.21 calculated on 452 household-
heads and 61% of the respondents respectively living at nine public housing estates and
10 public houses in urban areas of Ogun State, Southwest Nigeria revealed that the
residents were generally satisfied (Ibem & Amole, 2013b; Ibem, Opoko, Adeboye, &
Amole, 2013).
On the contrary, Ibem and Aduwo (2013) highlighted that the respondents were
generally dissatisfied with their housing conditions in Ogun State, Nigeria.
Zanuzdana, Khan, and Kraemer (2013) found that rural residents, who were with
90% house ownership, were much more satisfied with their housing situation comparing
to urban slum dwellers in Dhaka, Bangladesh.
Four Residential Components and RS (a)
Berkoz et al. (2009) discovered that these components including housing unit
characteristics, housing estate supporting facilities, social environment characteristics of
neighbourhood, and spatial location characteristics of neighbourhood were found to be

69
significantly correlated with residents’ requirements and satisfactions in planned mass
housing areas at central and peripheral districts in the Istanbul metropolitan area.
Furthermore, Wahi et al. (2012) agreed with Berkoz et al. (2009) and found the
answer given by the low cost house owners residing in Kuching, Sarawak, East
Malaysia about that the component of HUSS had the most principally correlation with
low-cost housing owners’ residential satisfactions.
The correlation between HUC and spatial location characteristics of neighbourhood
which was same as the correlation between HUSS and social environment
characteristics of neighbourhood had a low degree of positive correlation with respect to
one newly designed public low-cost housing estate in Sungai Bonus, Kuala Lumpur,
Malaysia (Mohit et al., 2010).
On the other hand, Mohit and Nazyddah (2011) found that satisfactions with HUC in
Malaysian Selangor State cluster, individual and transit houses were positively
correlated with HUSS, HESF, and social environment characteristics of neighbourhoods
only in individual and transit houses. Conversely, the satisfactions with HUC in all
housing types had no correlation with spatial location characteristics of neighbourhoods.
Besides, the satisfactions with HUSS in all social housing programmes of Malaysian
Selangor State were found to be positively correlated with HESF and social
environment characteristics of neighbourhoods as well as spatial location characteristics
of neighbourhoods only in individual and transit houses.
Likewise, the satisfactions with HESF of all social housing programmes in Selangor
State had positive correlations with social environment characteristics of
neighbourhoods as well as spatial location characteristics of neighbourhoods only in
cluster and transit houses.

70
Otherwise, the satisfactions with social environment characteristics of
neighbourhoods were not found any correlations with spatial location characteristics of
neighbourhoods amongst Malaysian Selangor State social housing programmes (Mohit
& Nazyddah, 2011).
The residential satisfaction indices of public housing both in Kuala Lumpur and
Hulhumalé, and Selangor State individual and transit houses were found to be
exceedingly positively correlated with social environment characteristics of
neighbourhood and HUC (Mohit & Azim, 2012a, 2012b); Mohit et al. (2010); (Mohit &
Nazyddah, 2011).
In terms of the HUC, Ibem et al. (2013) found that the privacy and sizes of living and
sleeping areas were significantly correlated with the level of satisfaction of residents
living at nine previously-built public housing estates in Ogun State, Nigeria.
Contrariwise, satisfaction levels of inhabitants in Selangor State cluster housing had
a low degree of positive correlation with social environment and housing unit features
(Mohit & Nazyddah, 2011).
Furthermore, HUSS and HESF indices were also found to be highly positively
correlated with residential satisfaction indices of public low-cost housing in Kuala
Lumpur, Selangor State cluster, individual and transit houses (Mohit et al., 2010; Mohit
& Nazyddah, 2011).
By comparison, HUSS and HESF indices were found to be a bit poorly positively
correlated with residential satisfaction indices of public housing estates in Hulhumalé
(Mohit & Azim, 2012a); Mohit and Azim (2012b).

71
Furthermore, Ibem et al. (2013) discovered that the availability of water and
electricity in the buildings did not have much more significant correlations with the
level of satisfaction of residents living at public housing estates in Ogun State, Nigeria.
Moreover, comparing to the spatial location characteristics of neighbourhood indices
had low degree of positive correlations with residential satisfaction indices of public
low-cost housing in Kuala Lumpur and Selangor State individual houses (Mohit et al.,
2010; Mohit & Nazyddah, 2011), the neighbourhood facilities indices were highly
positively correlated with overall Selangor State cluster and transit houses satisfaction
indices (Mohit & Nazyddah, 2011).
At same time, the relationship between the physical characteristics of the residence
and residents’ satisfaction undoubtedly presented that 62 percent of the physical
characteristics of the residences were significantly correlated with residents’ satisfaction
and determined the level of residential satisfaction and simultaneously guided the
housing architects and administrators to know what kinds of specific skills and actions
to maximise more satisfactory housing provisions to low-income and medium-income
public housing residents (Ilesanmi, 2010).
Furthermore, once the residential satisfaction was proposed to be used as a guideline
for planning a housing area to settle the middle-income population in Medan city,
Indonesia, Aulia and Ismail (2013); (Byrnes-Schulte, Lichtenberg, & Lysack, 2003)
identified the criterion of residential satisfaction not only comprised housing design,
public facilities, and housing location which were belonged to the physical satisfaction
criteria, but also included social interaction, security, and housing tenure which were
classified into the non-physical criteria.
72
Aziz and Ahmad (2012) not only agreed upon Aulia & Ismail’s (2013) findings that
assessing the conditions of low-cost housings in Malaysia mostly employed the
residential satisfaction as a measurement marked by low-cost housing residents, but also
Aziz and Ahmad (2012) suggested combining some more new factors according to
environment-behaviour studies consisting of appropriation, attachment and identity to
supplement the comprehensive attributes of residential satisfaction measurement.
Thus, Ibem and Amole (2013a) asserted that to improve residential satisfaction in the
OGD Workers’ housing estate in Abeokuta, Ogun State, Nigeria could be enhanced by
providing good housing design and management practices, good access to basic services
and social infrastructure and more numbers of bedrooms in the housing units.
What Ibem and Aduwo (2013) and Mohit and Nazyddah (2011) found were utterly
distinct from what Ukoha and Beamish (1997) and Mohit et al. (2010) found at that the
residents living at public housing estates in Ogun state and Malaysian Selangor state
were highly satisfied with HUC.
Furthermore, 452 respondents living at 10 newly-constructed public housing estates
in urban areas of Ogun State Southwest Nigeria showed their satisfactory with their
HUC (Ibem & Amole, 2013b). The residents living at public housing estates in
Hulhumalé were slightly satisfied with physical space within the housing unit due to the
respectively several factors caused low level of residential satisfaction consisting of
toilets, size and condition of washing and drying area, and number of electrical sockets
(Mohit & Azim, 2012b).
In contrast, Kaitilla (1993) found that urban households living at public housing in
West Taraka, the city of Lae, Papua New Guineans were severely dissatisfied with their
HUC. Furthermore, the reasons of their being significantly dissatisfied with houses were

73
because of the sizes of houses, number of rooms and living/dining areas, lack of storage
space, and poorly lay out and badly designed kitchen, toilet, and bathroom facilities.
Moderately satisfied by the 100 respondents living at single-storey cluster housing
and another 100 respondents living at Selangor State individual houses were feeling the
same way as 452 household heads living at public housing in Ogun State and 102
respondents in Kuala Lumpur were slightly satisfied with HUSS (Ibem & Aduwo, 2013;
Mohit et al., 2010; Mohit & Nazyddah, 2011).
Moreover, satisfaction level of public housing estates in Hulhumalé was generally
higher for service provided within the housing unit except for cleaning services for
corridors and staircases, street lighting, garbage collection.
In contrast, the residents from public houses in Ogun State were unfortunately found
to be dissatisfied with HUSS (Ibem & Amole, 2013b). Furthermore, the respondents
living at transit houses were dissatisfied with HUSS as well due to the effects of lift and
lift lobby, firefighting and cleanliness of drains (Mohit & Nazyddah, 2011). Moreover,
the 1,089 federal employees represented 19,863 public housing units living in Abuja
also expressed dissatisfied with housing management (Ukoha & Beamish, 1997).
The situation of housing estate supporting facilities and infrastructural facilities in
public low-cost housing in Kuala Lumpur, Selangor State individual houses and even in
nine previously-built and ten newly-constructed public housing estates in Ogun State
made the respondents feel slightly satisfied or even dissatisfied (Ibem & Aduwo, 2013;
Ibem & Amole, 2013b; Mohit et al., 2010; Mohit & Nazyddah, 2011).
Furthermore, those respondents who lived in urban slums and rural areas in Dhaka,
Bangladesh showed their low satisfaction with HESF especially in education and health
services (Zanuzdana et al., 2013).

74
On the contrary, Mohit and Nazyddah (2011), Mohit and Azim (2012b), and Mohit
and Zaiton (2012) asserted that the respondents living at Selangor State transit houses,
the respondents living at public housing estates in Hulhumalé, and the respondents
living at Selangor State cluster houses showed highly satisfied with public facilities
within the housing area.
With respect to the cultural background in Yemeni society, Djebarni and Al-Abed
(2000) interviewed 180 occupants living at the three low-income public housing
schemes in Sanaa, Yemen and found that the component of neighbourhood
characteristics had noteworthy correlation with the level of residential satisfaction of
inhabitants. Thus, the factor of privacy was mostly correlated with NC satisfaction.
The residents living at public housing estates in Hulhumalé were slightly satisfied
with the social environment within the housing area due to one factor of security level
within the housing area causing low level of residential satisfaction (Mohit & Azim,
2012a); Mohit and Azim (2012b).
However, the respondents living at Selangor State transit houses expressed
marginally moderate level of satisfaction with social environment due to effects of noise
level and crime situation, and even the public housing respondents both living in Ogun
State and Kuala Lumpur were feeling dissatisfied with social environment
characteristics of neighbourhood (Ibem & Aduwo, 2013; Mohit et al., 2010; Mohit &
Nazyddah, 2011).
On the other hand, the respondents living at Selangor State cluster housing had
moderate level of satisfaction with social environment and the respondents living at
Selangor State individual houses even had moderately high level of satisfaction with
social environment (Mohit & Nazyddah, 2011).

75
Moreover, the respondents living at public housing in Abuja showed satisfied with
the neighbourhood facilities (Ukoha & Beamish, 1997). Almost, the public housing
respondents both living in Ogun State and Kuala Lumpur as well as the respondents
living at Selangor State transit houses were slightly satisfied with spatial location
characteristics of neighbourhood as the location of transit houses being within the
Malaysian Selangor State urban area (Ibem & Aduwo, 2013; Mohit et al., 2010; Mohit
& Nazyddah, 2011).
In addition, Ibem and Amole (2013b) also found that residents living at public
housing estates in urban areas of Ogun State were satisfied with spatial location
characteristics of neighbourhood. Contrariwise, the respondents both living at Selangor
state cluster and individual houses were dissatisfied with neighbourhood facilities by
inadequacy of provision of public transport facilities, such as distance to fire station, as
well as LRT and taxi stations in cluster housing type and distance to work place and
town centre in individual housing type respectively (Mohit & Nazyddah, 2011).
Moreover, the respondents living in rural areas and urban slums in Dhaka,
Bangladesh were reported of dissatisfaction with spatial location characteristics of
surrounding neighbourhood especially in the distance and convenience of clinic or
general hospital (Zanuzdana et al., 2013).
Factors from HUC (b)
Mohit et al. and Mohit & Azim’s (2010) and (2012b) conclusions were that the high
and moderate beta coefficients of the models highlighted the necessities of exploring
residential satisfactions in specific housing units characteristics comprising dry area,
bedroom-1, socket points, bedroom-3 as well as dining space.

76
Moreover, Mohit and Nazyddah’s (2011) conclusion was that the high and moderate
beta coefficients of the models underlined the essential of exploring residential
satisfactions in specific housing units characteristics including kitchen space, socket
points and Dry area.
Furthermore, the increasing of subjective life satisfaction in public houses in Ogun
State and the improving of performance of the buildings in meeting residents’ needs and
expectations in nine previously-built public housing also in Ogun State, Nigeria
depended more on the enlarging the size of main activity areas in HUC (Ibem & Amole,
2013b; Ibem et al., 2013).
In the meanwhile, Ibem and Aduwo (2013) gave the similar answer which was like
what Mohit et al. (2010), Mohit and Nazyddah (2011), Mohit and Azim (2012b), and
Mohit and Zaiton (2012) gave was that satisfactions with sizes of living and sleeping
areas in the residences as predictor variables contributed most to predicting residential
satisfaction of public housing.
Furthermore, Ibem et al. (2013) claimed that the type and aesthetic appearance of
housing were the most predominant factors that determined the level of residential
satisfaction of inhabitants in public housing in Ogun State.
Factors from HUSS (c)
The result of examining the accessibility of services provisions to the public housing
estates in urban centres in Ogun State turned out that accessibility to refuse bins, treated
water, electricity and drainage was poor, although the accessibility to human waste
disposal system might satisfy the most residents (Ibem, 2013).

77
Moreover, Ibem and Amole (2013b) found that housing services mostly predicted
their subjective life satisfaction in public housing estates in urban areas of Ogun State.
Mohit et al. and Mohit & Nazyddah’s (2010) and (2011) conclusions illustrated that
the high and moderate beta coefficients of the models predicted that cleanliness of
garbage house and garbage collection were major predictor variables of residential
satisfaction of public low-cost housing in Kuala Lumpur and also the minor predictor
variables of residential satisfactions in Selangor State individual, cluster, and transit
housing.
Furthermore, the satisfactions with cleanliness of drains, the lift lobby, and street
lighting, contributed moderately to predicting residential satisfactions of Selangor State
cluster, individual, and transit housing (Mohit & Nazyddah, 2011), but the satisfaction
with street lighting contributed most to residential satisfaction of Selangor State
individual type of housing.
Moreover, Mohit and Azim (2012b) and Mohit and Zaiton (2012) explicated that the
moderate beta coefficient of the model highlighted the necessities of exploring
residential satisfaction in specific HUSS, such as cleaning services for corridors and
staircases.
Thus, Ibem and Aduwo (2013) and Ibem and Amole (2013b) explained that
satisfaction of management of the public housing estates contributed most to predicting
residential satisfaction in public housing estates in Ogun State, Southwest Nigeria.
78
Factors from HESF (d)
The increasing of residential satisfaction in the newly designed public low-cost
housing estates in Kuala Lumpur depended more on the improvement of perimeter
roads (Mohit et al., 2010).
Likewise, Mohit and Nazyddah (2011) illustrated that the high beta coefficients of
the models predicted that public phone and pedestrian walkways were the major
predictor variables of residential satisfaction of Selangor State cluster and transit
housing. And then, the satisfactions with parking facilities, pedestrian walkways, and
the multi-purpose hall contributed moderately to residential satisfactions of Selangor
State cluster, individual, and transit housing.
However, Mohit and Azim (2012b) and Mohit and Zaiton (2012) considered the
factor of kindergarten as a predictor variable to determining the residential satisfaction
in public housing in Hulhumalé.
Factors from NC (e)
Berkoz et al. (2009) claimed that the factors of centrality, accessibility to open areas,
accessibility to health institutions, and satisfaction in recreational areas contributed most
to predicting residents’ location choices at central and peripheral districts in the Istanbul
metropolitan area. Thus, the mass housing users preferred central districts over
peripheral ones.
Mohit and Nazyddah (2011) mentioned that the public housing respondents living at
Selangor State transit houses were satisfied with spatial location characteristics of
neighbourhood because of the location of transit houses being within the urban area of
Malaysian Selangor State.

79
Accordingly, Ibem et al. (2013) asserted that to increase the performance of Ogun
State’s public housing in meeting users’ needs and expectations depended more on
enriching location choices. It evidently turned out how important the location of living
area was for residents.
Moreover, the respondents living at planned mass housing in Istanbul metropolitan
area constantly considered the location as the top priority beyond the rest of physical
characteristics of housing.
Thus, the location critically affected the level of residential satisfaction of the
inhabitants in terms of various public facilities provided within the housing area, social
environment characteristics of neighbourhood differences amongst the different places,
and spatial location characteristics of neighbourhood various among the diverse
locations.
Therefore, Berkoz et al. (2009) asserted that the accessibility was one grave
component to influence both residential satisfactions of respondents living in central
and outlying districts. In other words, it was suggested that the development of public
transport systems in peripheral districts being bettered should improve the quality of
social and physical infrastructure of sub centres and the competence of accessibility in
outlying areas. Accordingly, the demand of housing located in the proposed suburban
areas, the housing users both who lived in central and suburban districts would prefer to
choosing to live in suburban areas.
Both James (2001) and Ibem and Aduwo (2013) agreed on Mohit et al.’s (2010)
conclusion, which was that the high beta coefficients of the model predicted that
residential satisfaction in three renovated buildings and public housing in Kuala Lumpur

80
and Ogun State could be enhanced through improving the management of security
control.
Furthermore, Mohit and Nazyddah (2011) brought out that the moderate beta
coefficient of the model gave weight to the prerequisites of discovering residential
satisfaction of Selangor State transit housing in specific neighbourhood characteristics,
such as the noise level.
The Healthcare facilities and public transportation were found to have moderate or
less influences on community satisfaction in As-Salhiyyah in the northern Badia of
Jordan (Al-Homoud, 2011).
Moreover, Ibem (2013) reported that the respondents living at public housing estates
in urban centres confirmedly elucidated that the accessibilities to public transport
services, educational, shopping centres, recreational and healthcare were inadequate.
Furthermore, Zanuzdana et al. (2013) interpreted that satisfaction with the
reachability of medical care contributed most to predicting residential satisfaction of
urban slums and rural areas in Dhaka, Bangladesh in the context of a complex
relationship between housing satisfaction and the quality of basic neighbourhood
facilities.
In the meantime, satisfaction with distance to shopping centre contributed
moderately to predicting residential satisfaction of the newly designed public low-cost
housing estates in Kuala Lumpur (Mohit et al., 2010).
In addition, Mohit and Nazyddah (2011) expounded that the moderate beta
coefficient of the models accentuated the essentials of investigating residential

81
satisfactions of Selangor State cluster and transit housing in specific neighbourhood
characteristics, such as distance to police station.
Moreover, the increasing of residential satisfactions in Selangor state cluster,
individual, and transit housing depended more on the increasing numbers of market,
school and the workplace (Mohit & Nazyddah, 2011).
In terms of a study carried out by Al-Homoud (2011) found in the village of As-
Salhiyyah in the northern Badia that socialising and life satisfaction as being part of
social environment characteristics of neighbourhood contributed most to predicting
community satisfaction comparing to (safety), traffic, school quality, healthcare
facilities, public transportation, and parks as being parts of spatial location
characteristics of neighbourhood doing moderately or less.
Furthermore, it was explained that the community satisfaction was due to reasonably
high because of Badia communities being more profoundly motivated by social
interactions (community relationship) originating from kinship relations than by
housing attributes in spite of the fact that the physical environment of residential
situation was low in quality.
Factors from Individual and Household’s Socio-Economic Characteristics (f)
i. Factors from IHSC Correlated with Each Residential Component
Berkoz et al. (2009) found in the Istanbul metropolitan area, there evidently proved
interactions between the individual and household’s characteristics of respondents and
HUC, HESF, and social-spatial characteristics of neighbourhoods.
Satisfaction with HUC of public low-cost housing in Kuala Lumpur was found to be
positively correlated with race, whereas it was discovered to be negatively correlated

82
with the household size, i.e. 28.4% of respondents with large (6p+) families were not
satisfied with the size of housing unit (Mohit et al., 2010).
Thus, Ibem and Aduwo (2013) concluded that the sizes of living and sleeping areas
in the residences should be paid very attention to according to how many people they
lived together.
In the same way, the satisfaction with HUSS was also found to be positively
correlated with residents’ floor levels (Mohit et al., 2010).
Besides that, respondents’ length of residency and employment type had positive
correlations with HESF, yet the satisfaction with HESF was found to be negatively
correlated with residents’ previous housing types.
Likewise, respondents’ age and marital status had negative correlations with social
environment characteristics of neighbourhood satisfaction which was, in contrast,
positively correlated with floor levels (Mohit et al., 2010).
ii. IHSC Correlated with (Determining) Residential Satisfaction
Kellekci and Berköz (2006) asserted that the perspectives on satisfaction of HUC,
HUSS, HESF, and social-spatial characteristics of neighbourhood given by the residents
were certainly influenced by the residents’ individual and household’s characteristics
and other requirements.
Furthermore, the higher income, higher age, and a smaller family, higher education,
being female and being an owner of a housing were found to be highly associated with
higher satisfaction with housing in population of urban slums and rural areas in Dhaka,
Bangladesh (Zanuzdana et al., 2013).

83
Moreover, Mohit et al. (2010) found that the age, marital status, and previous
residence were negatively correlated with the overall housing satisfaction, however,
there were positive correlations of residential satisfaction with respondents’ race,
employment type, floor level.
Thus, Kellekci and Berköz (2006) finally ascertained that the differences in
residents’ individual and household’s characteristics must have made those residential
components factors be distinct.
James (2001) found that the age of residents who lived at three renovated buildings
had a significant relationship with their residential satisfaction calculated by a Pearson
correlation.
In addition, the factor and categorical regression analysis to the result of randomly
selected 156 household heads indicated that respondents’ educational attainment,
employment sector, gender and age were found to be predictors contributing most to
foretelling the residential satisfaction in the OGD workers’ housing estate in Abeokuta
(Dekker et al., 2011; Ibem & Amole, 2013a).
Mohit and Azim (2012b) and Mohit and Zaiton (2012) agreed with Mohit et al.
(2010) on that there was a significant positive correlation of the overall satisfaction in
public housing estates in Hulhumalé and public low-cost housing estates in Kuala
Lumpur with the respondents’ length of residency. On the other hand, Mohit & Azim’s
(2012b) conclusions diverged from what Mohit et al. (2010) drew from their study in
terms of the family size being negatively significantly correlated with residential
satisfaction in Malaysian public low-cost housing comparing to being positively in
Hulhumalé.

84
The factor of income had a negatively significant correlation with residential
satisfaction (Mohit & Azim, 2012b), whereas Mohit et al. (2010) claimed that the
variable of income had a nonsignificant correlation with the overall housing satisfaction
and the additional factor of gender did not have any correlation with residential
satisfaction as well.
Furthermore, Ibem and Amole (2013b) concluded that the high beta coefficient of the
model underlined the essential of exploring residents’ satisfaction with life in Ogun
State’s public housing estates in specific individual and household’s characteristics
consisting of income, marital status, and housing delivery strategy (participation of
users in housing delivery process).
Mohit and Azim (2012b) and Mohit and Zaiton (2012) did the correlation analysis to
the result given by 100 households living at public housing estates in Hulhumalé and
found that the type of tenure had a positively significant correlation with residential
satisfaction, i.e. the tenure influenced the overall housing satisfaction, whereas the
owners were lower levels of satisfaction comparing to tenants.
Moreover, Ibem and Amole (2013b) found that the high beta coefficient of the model
highlighted the essential of exploring the subjective life satisfaction of residents of
public housing in Ogun State urban areas in Nigeria in specific individual and
household characteristics such as tenure.
As mentioned earlier, the characteristic of Chinese low-cost housing was unique in
the case of it simultaneously having characteristics of public housing and commodity
housing to meet the needs of Chinese eligible low-income citizens.

85
In effect, as Chinese low-cost housing predominantly had the function of public
housing, those factors affecting the level of residential satisfaction of inhabitants living
at public houses in developed and developing countries were concluded above in terms
of four residential elements/components and individual and household’s socio-economic
characteristics.
Furthermore, another characteristic of Chinese low-cost housing was from the
commodity housing. In the next paragraph, in which those following factors affecting
the level of residential satisfaction of dwellers living at commodity houses in developed
and developing countries were summarised, would enrich this current assessment on
Chinese low-cost housing from only studying about the factors affecting public
housing’s satisfactions
2.3.5 RS in Commodity Housing in Developed and Developing Countries
Vera-Toscano and Ateca-Amestoy (2008) claimed that residential satisfaction was
affected by inhabitant’s individual and household’s characteristics, housing
characteristics, neighbourhood attributes, and social interactions.
Furthermore, Carvalho et al. (1997) concluded that the residents who lived in an
Exclusive Condominium in Brazil were highly satisfied with their unique spatial
differentiation of residential environment that was surrounded by walls or fences, and
was access-controlled by their-trusted security guards, and was also located in a
strategic place.
2.3.5.1 Four Residential Components and RS
Sirgy and Cornwell (2002) indicated that satisfaction with the physical features
affected both neighbourhood satisfaction and housing satisfaction in terms of activation
of community spaces, activation of community programmes, activation of participation

86
in the community, and activation of ecological living and design in the high-rise and
high-density apartment complexes in Korea (Cho & Lee, 2011).
Furthermore, the correlation analysis was employed to the relationship between the
four components of living programmes and the level of residential satisfaction of
inhabitants and found by Cho and Lee (2011) that the community spaces, community
programmes, and participation in the community had significantly positive correlations
with the overall residential satisfaction.
Furthermore, Hong (2004) found that the satisfaction of sense of community was
significantly positively correlated with satisfaction of residential management services
and satisfaction of common spaces. At same time, the satisfaction of sense of
community was found to be an important component to notably affect the level of
residential satisfaction of inhabitants living at high-rise mixed-use residential building
constructed at the end of 1990s in Korea.
A social survey with questionnaire from 178 subjects collected by the snow ball
sampling showed that the factors of fitness space and business service were found to be
substantially positively correlated with the level of satisfaction of residential
management services (Hong, 2004).
In addition, the factors of swimming pool, and shower and sauna facilities had
drastically positive correlations with the level of satisfaction of common spaces for
residents living at high-rise mixed-use residential building in Korea (Hong, 2004).
Regarding the current situations of people living at private low-cost housing in fast-
growing state of Penang and less-developed state of Terengganu in Malaysia and people
living at commodity houses in Guangzhou and Beijing, China, Salleh (2008) and Wong
and Siu (2002) assessed their levels of residential satisfactions by way of the factor

87
analysis and the Perceived Environmental Quality Scale (PEQS) applied to those
components comprising HUC, HUSS, and neighbourhood facilities and environment.
As a result, the satisfaction levels of HUC and HUSS provided by the private
housing developers were found to be overall higher than the satisfaction levels of
neighbourhood facilities and environment due to the profit-motivated private developers
only providing poor public transportation, shortage of children playgrounds, car parks,
security and disability facilities, and absence of community halls which also determined
the level of residential satisfaction of inhabitants living at private low-cost housing
projects in Penang and Terengganu in Malaysia (Salleh, 2008).
On the contrary, Wong and Siu (2002) found that the satisfaction level of
neighbourhood quality was profoundly higher than the satisfaction level of housing unit
quality in commodity housing in Guangzhou and Beijing due to Chinese money and
carelessness-motivated private developers, who were almost same as Malaysian private
developers, did badly in lack of privacy, the insufficient lighting, and ventilation of
housing units.
Comparing to neighbourhood quality which was mostly provided by municipal level
of urban planning and construction, its satisfaction level was certainly higher than
housing unit quality in Guangzhou and Beijing’s commodity houses (Wong & Siu,
2002).
Moreover, the residents living at commodity housing in Guangzhou and Beijing were
also dissatisfied with the management of housing estates provided by the private
property management corporations.

88
Pertaining to Malaysian middle-class city residents currently preferring to living at
high-rise condominiums than their traditional-way of living at terrace housing, Mohit
and Zaiton (2012) found that the 100 respondents residing in older (>10 years) high-rise
condominiums showed dissatisfied with HUSS and housing estate neighbourhood
facilities and management as compared with another 100 respondents living at younger
(<10 years) high-rise condominiums.
In addition, the Spearman correlation analysis applied to these 200 respondents both
living at older (>10 years) and younger (<10 years) high-rise condominiums indicated
that all factors from three components of satisfaction consisting of HUC, HUSS, and
housing estate neighbourhood facilities and management had more significantly positive
correlations with the overall housing satisfaction in the older (>10 years) as compared
with the younger (<10 years) due to the age differences.
Thus, the housing estate neighbourhood facilities and management should be urged
to be improved to enhance residential satisfaction both in older and younger. Otherwise,
the current over 40% of respondents living at older high-rise condominiums showed that
a certain proportion of residents were planning to move.
Mohit and Zaiton (2012) also did a continuous research regarding double-storey
terrace housing which was considered as popular housing type among the middle-
income people living in urban areas indicating that the design brought about the
increasing of crime rate and also brought some effects on the level of residential
satisfaction.
And then, the results of each 110 randomly selected residents in Taman Sri Rampai
(TSR) and Taman Keramat Permai (TKP) in Greater Kuala Lumpur came out of the
descriptive and inferential analyses given by Mohit and Zaiton (2012) to indicate that

89
the levels of residential satisfaction were mostly low with HUC, HUSS, and social
environment characteristics of neighbourhood as compared with residential satisfaction
levels being high with housing estate public facilities.
Furthermore, the level of satisfaction was high with neighbourhood facilities in TKP.
However, the satisfaction with neighbourhood facilities was moderate in TSR.
2.3.5.2 Factors from HUC
Carvalho et al.’s (1997) findings based upon a structured questionnaire used for
collecting their residential assessments elaborated that the increasing of subjective life
satisfaction in one exclusive condominium in Brazil depended more on the
improvement of unique housing unit characteristics, which was taken as a substantial
predictor variable.
2.3.5.3 Factors from NC
The high beta coefficients of the model was concluded by Carvalho et al. (1997) to
emphasize on the essentials of exploring residential satisfactions of Brazilian exclusive
condominiums in specific neighbourhood characteristics consisting of location and
safety.
As above mentioned regarding what some authors found in terms of neighbourhood
characteristics in public housing in the developed and developing countries, some
factors from social environment characteristics of neighbourhood went into maintaining
more attention than other factors from spatial location characteristics of neighbourhood,
such as community relationship depending upon residents involvement and social
inclusion, quietness counting on interference from neighbours and noise level of
housing estate, and crime and accident situations being depended on how many times

90
and how serious (McClure, Schwartz, & Taghavi, 2015; Mohit & Mahfoud, 2015; Tan,
Zhou, Li, & Du, 2015; Wang, Zhang, & Wu, 2015).
What it amounted to, then, was that the neighbourhood influenced various aspects of
life satisfaction. In effect, Dittmann and Goebel (2010) found that neighbourhood with
socioeconomic status had a principally positive correlation with residents’ life
satisfaction.
Moreover, the individual gap between a person’s economic status and the status of
the neighbourhood also was primarily positively correlated with individual well-being
(Dittmann & Goebel, 2010). Furthermore, the increasing of their respective residential
environment in a representative sample of private households in Germany depended
more on the improvement of social networks, which was taken as a substantial predictor
variable.
However, in the context of neighbourhood and housing types characterised by
distinctive built-environment features and socio-occupational mixes caused by the
transition from a socialist centrally-planned economy to a socialist market economy, Li,
Zhu, and Li (2012) found that even though locally social networks were mostly weaker
in commodity housing areas in Guangzhou, the inhabitants showed their higher level of
satisfaction with community attachment due to the gated community bringing about
very minimal influences on community attachment.
2.3.5.4 Factors from Individual and Household’s Socio-Economic Characteristics
As a matter of fact, the resident’s ownership status was principally concerned,
nonetheless housing ownership was still very meaningful to the household when the
inhabitants lived in those areas mixed with commodity and public houses (Vera-
Toscano & Ateca-Amestoy, 2008).
91
Furthermore, Vera-Toscano and Ateca-Amestoy (2008) found that the fact of being a
renter surrounded by owners did not feel more satisfied with their housing, and in the
meanwhile, the individuals’ housing satisfaction was negatively affected by the fact of
being an owner surrounded by renters.
As a result, the residents of commodity housing surrounded by public housing were
less likely to feel satisfied with their commodity houses, specifically, what it amounted
to, then, was that the intensity of social interaction did not bring about higher level of
individual housing satisfaction amongst residents who lived in the mixed residential
environment due to the higher social relations did not provide other things equally.
What is more, even though the property value was found to be positively related to
housing satisfaction, era-Toscano and Ateca-Amestoy (2008) found in their case of
Spain that the property value was not very significantly affecting individual’s housing
satisfaction.
Then, something happened which put the matter beyond all doubt, because the
composite commodity housing to give the high and increasing price to the existing
owners as an investment good was much more noteworthy than whether to bring about
more or less housing satisfaction to users.
2.3.6 Factors Concluded in Residential Components and IHSC
In a word, those factors/predictors determining residential satisfaction which had
been reviewed from the studies about residential satisfactions of public and commodity
housing in developed and developing countries would be concluded as below.
Housing Unit Characteristics (HUC) (a)
In HUC, there were seven key factors that should be more concerned such as living
room, dining area, master bedroom, bedroom, kitchen, toilet, and balcony. Those factors

92
which were mentioned above had several interior characteristics affecting their
satisfaction levels in terms of size, location, ceiling height, ventilation, daylighting, and
power sockets.
Housing Unit Supporting Services (HUSS) (b)
With respect to HUSS, the literature strongly suggested these two factors consisting
of drain and electrical & telecommunication wiring which talking about the supporting
services provided within the housing unit. The situations of drain and wiring of when
moving into the room and the maintenance after moving into affected each factor’s
satisfaction level.
Furthermore, in terms of the supporting services provided around the housing unit,
the numbers of firefighting equipment and training course for how to use firefighting
equipment decided upon the satisfaction level of firefighting equipment. Moreover, the
numbers and brightness determined the satisfaction level of street lighting. The size,
location, lighting, and cleanness decided on the satisfaction levels of staircases and
corridor. In addition, the garbage collection and management of garbage (house)
determined the satisfaction level of garbage disposal.
Housing Estate Supporting Facilities (HESF) (c)
Regarding HESF, the factors were concluded from the studies about residential
satisfactions of public and commodity housing in developed and developing countries
such as open space, children’s playground, parking facilities, perimeter road, pedestrian
walkways, and local shops. Their satisfactions were affected by each number, condition,
location, and cleanness.

93
Neighbourhood Characteristics (NC) (d)
Speaking of NC divided by social environment and spatial location characteristics of
neighbourhood, the residents’ involvement and social exclusion decided upon the
satisfaction level of community relationship. Furthermore, the levels of neighbourhood
noise and crowd noise from open space determined the satisfaction level of quietness of
housing estate. The frequency of occurrence, and seriousness decided on the satisfaction
level of local crime and accident situations. In addition, the number of security guards
and frequency of security patrols determined the satisfaction of local security control.
In terms of the spatial location characteristics of neighbourhood, the factors which
were discussed previously consisted of resident’s workplace, nearest general hospital,
local police station, nearest fire station, and urban centre. Their satisfaction levels were
determined by the distance from each housing area to each outside destination and
convenience of arriving over the destination.
Individual and Household’s Socio-Economic Characteristics (IHSC) (e)
There were ten factors correlated with the four residential components (HUC, HUSS,
HESF, and NC) and overall residential satisfaction of each housing area such as gender,
age, educational attainment, marital status, household size, occupation sector and type,
household’s monthly net income, floor level, and length of residence.
2.4 Data Collection and Data Analysis in Research Methodology of Studying
RS
Except for the studies about the theoretical model and factors of residential
satisfaction, the types of data and data analyses in previous studies’ research
methodologies are also needed to pay very close attention to.

94
In the context of the quantitative research methodology had been applied in mostly
previous studies about assessment of residential satisfaction, Li and Wu (2013)
criticised the national data which Corrado, Corrado, and Santoro (2013) used could not
fulfil satisfactory answers to which were challenged by those very localised and
conditional questions with respect to the characteristics of satisfaction and attachment
assessed by a cognitive judgement and an affective evaluation.
Thus, Galster (1987) commented on the empirical studies of residential satisfaction
should be studied by household type and should make allowance for non-linear
relationship between residential context and their associated levels of satisfaction.
Moreover, Galster (1987) applied a multivariate regression analysis of residential
satisfaction to the result of various levels of a 1980 sample of Minneapolis homeowners
and found that the results strongly support for the studies of residential satisfaction
being disaggregated by household type and non-linear relationship being taken into
considerations.
The scientific and reliable results of residential satisfaction would not be only
depended on the collected data, but also be relied on the scientifically statistical
methods (Li & Wu, 2013; Lu, 1999).
Lu (1999) and Howley (2009)criticised that the regression models should be used
conditionally where they required data with low multi-collinearity. The reliability of
their results depended more upon which method of regression models that the author
would apply to according to what type of dependent variable was.
In addition, Lu (1999) reinvestigated the effects of housing unit, neighbourhood, and
individual and household characteristics on individuals’ satisfaction with residential
environment by using ordered logit models to analyse the data drawn from the

95
American Housing Survey to get the results which to resolve the discrepancies caused
by the regression models in which the nature of independent variables making sure to be
consistent with the nature of dependent variables would bring more exact results.
In his case, it was concluded that the ordered logit models was more applicable than
the most widely available method of regression models under this kind of situation
when the ordinal nature of the dependent variables representing satisfaction which were
not a single category attributes such as continuous and non-continuous and were
inconsistent with a single category attribute of independent variables such as continuous
would damage the final results by using regression technique (Lu, 1999).
In addition, in spite of the result that indicated the actual effects of the variables
supported the earlier findings in previous literature, the significant differences between
the results from the ordered logit models and regression models were found due to
residential satisfaction was a complicated theory/concept/paradigm affected by a
variable amount of housing environmental and individual and household socio-
demographic variables/factors.
However, Permentier, Bolt, and van Ham (2011) considered that a lot of authors only
arguing about which kind of statistical method would apply to what kind of data to get
the different results were not enough. Permentier et al. (2011) strongly suggested using
the subjective and objective assessments on neighbourhood satisfaction that would bring
the whole picture to the residents. Thus, the assessments made both by the local
residents and by the outside people would comprehensively indicate where to improve
their neighbourhood satisfaction.

96
2.5 Recommendations to Enhance RS
As the determinants were found by different authors in their studies about residential
satisfactions of public and commodity housing in developed and developing countries,
each local government was suggested to follow those determinants as policy
implications to enhance their residential satisfactions of public and commodity housing.
On the downside, the determinants only talked about which facet had been currently
and mostly affecting their residential satisfactions and only suggested these
improvements of determinants to the local government when they improved the current
living conditions or planned to build a new public housing.
Apart from this, some authors such as Sheng, Grillo et al., Liang & Fang, Ammar et
al., and Li (1990), (2010), (2012), (2013), and (2013) strongly recommended the public
participation among the citizens, developers, and local authorities to enhance the
inhabitants’ residential satisfactions during the public housing development process.
Guided by those determinants which told of residents’ most concerns about
residential environment, the public participation in the public housing development
process would pay very close attention to the residents’ requirements.
According to ‘a ladder of citizen participation’ (Arnstein, 1969) (See Figure 2.7)
explaining the different levels of participation from non-participation to citizen control,
Arnstein (1969) described the public participation as a deliberative process in which the
citizens, NGOs, and government delegates got involved in negotiating for their own
interests to make a final policy.

97
Source: Arnstein (1969, p. 217)
Macnaghten & Jacobs, Cleaver, Poindexter, Webler et al., Barton et al., and Davy
(1997), (1999), (1999), (2001), (2005), and (2006) applied Arnstein’s ‘a ladder of
citizen participation’ (Arnstein, 1969) to analyse the development process of public
housing. Poindexter (1999) and Barton et al. (2005) concluded Arnstein’s (Arnstein,
1969) ladder into three levels of participations in the development process of public
housing such as access to information, consultation, and active engagement by way of
dialogue and partnership. And then, they found that the European countries encouraged
their citizens to actively get engaged in the public housing development by means of
sharing their understandings of issues and solutions instead of only giving and taking
views in the consultation part.
8. Citizen control
7. Delegated power
6. Partnership
5. Placation
4. Consultation
3. Informing
2. Therapy
1. Manipulation
Nonparticipation
Citizen power
Tokenism
Figure 2.7 The Ladder of Arnstein
98
However, some authors from Asia especially China, such as Sheng, Liang & Fang,
Ammar et al., and Li (1990), (2012), (2013), and (2013) argued that some countries still
manipulated the whole process of public housing development without any
participations. At same time, they also argued that China’s local government informed
the citizens and asked for their consultations in the current situation of China’s low-cost
housing development according to China’s regulations of low-cost housing
development. Unfortunately, just like Arnstein’s ladder of citizen participation
described the second stage of participation as placation or tokenism, China should
increase the citizen’s power in the partnership with the local government to carry out a
dialogue in which they would negotiate for their more interests during the development
process of low-cost housing (Li, 2013; Liang & Fang, 2012).
2.6 Conclusion
Under the conduct of residential satisfaction employed as a criterion to assess the
residential environment of housing, Onibokun (1974) firstly introduced the Habitability
System to study the components of residential satisfaction in terms of dwelling,
environment, management, and tenants subsystems in order to calculate the exact
residential satisfaction index.
Amerigo and Aragonés (1990, 1997) and Aragonés and Corraliza (1992) continued
studying the processes of residential satisfaction based upon those components given by
Onibokun (1974) in order to make the concept of residential satisfaction have more
practicability in different contexts of housing.
At the same time, Mohit et al. (2010), (2011), (2012b), and (2015) concluded
Amerigo & Aragonés and Aragonés & Corraliza’s (1990, 1997) and (1992) findings on
the basis of Onibokun’s (1974) model, and proposed and validated their conceptual

99
model of residential satisfaction applied to assessing the residential satisfactions in
public & private low-cost housing and commodity housing.
Accordingly, the four components which were drawn on the basis of three models
talked about the housing unit characteristics (HUC), housing unit supporting services
(HUSS), housing estate supporting facilities (HESF), and neighbourhood characteristics
(NC).
Fewer studies of low-cost housing have been conducted in developing countries and
very little have been done with the relationship between residential satisfaction and four
components plus individual and household’s socio-economic characteristics except for
Lane and Kinsey (1980), McCrea, Stimson, and Western (2005), Kang and Lee (2007),
Hipp (2009), Lovejoy, Handy, and Mokhtarian (2010), Dekker et al. (2011), Ibem and
Amole (2013b), Ibem and Amole (2014), and Posthumus et al. (2014) even did not
include all components.
Lane and Kinsey (1980) found that the individual and household’s socio-economic
characteristics was less important determinant of residential satisfaction than housing
characteristics. On the contrary, Dekker et al. (2011) claimed that the individual and
household’s socio-economic characteristics was more important determinant of
residential satisfaction than housing unit characteristics.
Posthumus et al. (2014) analysed the collected data from four Dutch cities and found
that those residents with low incomes were less satisfied with their homes. Dekker et al.
(2011) discovered that the number of children was found to be negatively correlated
with residential satisfaction. However, McCrea et al. (2005) reported that the factor of
gender of respondents in urban living in Brisbane-South East Queensland had no
correlation with residential satisfaction.

100
Furthermore, Lane & Kinsey, Hipp, and Dekker et al.’s (1980), (2009), and (2011)
findings showed that the owners were more satisfied with residential satisfaction than
the renters. Thus, McCrea et al.’s (2005) findings about satisfaction with home
ownership as an essential predictor variable contributed most to predicting satisfaction
of housing in the Brisbane-South East Queensland region. However, the duration of stay
was found to be negatively correlated with residential satisfaction (Dekker et al., 2011).
Posthumus et al. (2014) asserted that housing delivery strategy contributed most to
predicting residential satisfaction with life in public houses. In the meanwhile, Ibem and
Amole (2013b) and Ibem and Amole (2014) suggested that public housing developers
should encourage the participation of users in housing delivery process with the
intention of enhancing the subjective life satisfaction in public housing in Ogun State,
Southwest Nigeria.
Unfortunately, Hipp (2009) found that single-parent households, and social or
physical disorder had negative correlations with neighbourhood satisfaction and even
the crime had a significantly negative effect on satisfaction.
Accordingly, Kang and Lee (2007) claimed that the increasing of surveillance
opportunity through the adjustments of night lighting interval to decide the visual
accessibility about the habitats, the improvement of type of alley and housing layout
from the street, and even the decreasing of non-housing proportion in urban residential
area had significant correlations with controlling vandalism and vehicles-related crime
victimisation. In addition, the level of fear of crime was found to be negatively
correlated with the social network reinforcement by way of interaction and participation
(Kang & Lee, 2007).

101
Furthermore, McCrea et al. (2005) and Kang and Lee (2007) claimed that to increase
neighbourhood and residential satisfaction of residents living in the Brisbane-South East
Queensland region depended more on the improvement of neighbourhood interaction
especially for the older people. At same time, Turkoglu’s (1997) studies about the more
tenant involvements, more neighbourhood social interactions and more activations of
participations in the community would bring along the higher residential satisfactions.
Turkoglu (1997) and Varady and Carrozza (2000) simultaneously criticised that the
housing ventilation affected the level of residential satisfaction of planned and squatter
environments in Istanbul. Posthumus et al. (2014) found that the resident’s satisfaction
with the size of main activity areas in housing units and housing services and
management of the housing estates contributed most to predicting residential
satisfaction with life in public houses.
In addition, Varady & Carrozza’s (2000) studies about 1,300 residents living in
CMHA housing presented a higher level of satisfaction with Neighbourhood
Characteristics. Furthermore, Lovejoy et al. (2010) pointed out that to increase
neighbourhood satisfaction both in traditional and suburban neighbourhoods in eight
California neighbourhoods depended more on the improvements of innovative
neighbourhood designs in the features of attractive appearance and perceived safety of
neighbourhoods. On the contrary, the features such as parking, yards, and school quality
were not found to contribute to predicting neighbourhood satisfaction (Lovejoy et al.,
2010).
Therefore, with reference to Ibem and Amole, Posthumus, Bolt, and van Kempen,
Huang and Du, and Mohit & Mahfoud (2014), (2014), (2015), and (2015) argued that
the individual backgrounds had correlations with satisfactions of residential components
(Mohit et al.’s model) and the overall residential satisfactions as well, this research

102
study made one conceptual model with four residential components and individual and
household’s socio-economic characteristics.
On the basis of characteristics of Chinese low-cost housing, the factors in each four
components plus the individual background which would be appeared as questions in
the questionnaire of the quantitative part were suggested by those determinants found
from the studies about residential satisfactions in public and commodity houses in
developed and developing countries.
In a word, residential satisfaction of public housing in the western context, the
element of neighbourhood characteristics (social and spatial characteristics of
neighbourhood) was found to be more influencing the level of residential satisfaction of
inhabitants such as the public transportations linking the main shopping centres and
recreational areas to the location of the public housing projects were not adequate and
efficient. Moreover, high levels of noise and high probability of interference from
neighbours generated by many large-sized households on a small piece of property
mainly made the tenants feel dissatisfied.
The residential satisfaction of public housing in the developing countries, except for
the element of neighbourhood characteristics being the mostly concerned by the
residents, the housing estate supporting facilities was the second component about that
the residents concerned in terms of perimeter roads, pedestrian walkways, parking
facilities, public phone, multi-purpose hall, and kindergarten. In addition, the
components of housing unit supporting services and characteristics were also important
due to the factors of electricity, water, cleanliness of drains, cleaning services for
corridors and staircases, garbage disposal, street lighting, living room, dining space,
bedroom, dry area, kitchen space, and socket points affected residential satisfactions of
inhabitants.

103
However, the factors determining residential satisfaction of commodity housing in
developed and developing countries would also be taken into considerations based upon
Chinese low-cost housing having another characteristic of commodity housing. Some of
those factors affecting residents’ satisfactions were entirely different from public
housing such as a unique design for housing in terms of type and appearance, location
and safety, and gated community increasing community attachment. What is more, the
composite commodity housing to give the high and increasing price to the existing
owners as an investment good was much more noteworthy than whether to bring along
more or less housing satisfaction to users.
Despite the different factors from public and commodity housing in developed and
developing countries, the same feeling that the residents had regarding living in the
mixed residences was not satisfied especially the public housing residents were still
considered as the outsiders in the mixed housing area where they did not have such a
sense of belonging due to the social exclusion existed and critically affected satisfaction
levels of residents and their communications with non-poor neighbourhoods, although
the mixed residence brought some improvements in the quality of neighbourhood public
facilities.
In addition, in spite of the factors of gender, age, education, income, family size,
marital status, employment type, floor level, previous residence, length of residency,
and housing delivery strategy affecting residential satisfaction, the ownership was
concerned by all residents from public and commodity housing in developed and
developing countries. In particular, promoting homeownership amongst low- and
moderate-income households could improve their levels of residential satisfaction.

104
After conclusion about the factors, the data collection and data analysis in previous
studies were discussed. Finally, this chapter was concluded with Arnstein’s ‘A Ladder
of Citizen Participation’ as a basic model applied to many recommendations for
enhancing residential satisfactions in low-income/public housing developments.

105
CHINA (XUZHOU)’S LOW-COST HOUSING CHAPTER 3:
3.1 Introduction
This chapter would be divided by two parts consisted of China’s low-income housing
and Xuzhou’s low-cost housing. It began with the elaborations on types of China’s low-
income housing and would discuss about those recent studies on residential satisfaction
and policy of China’s low-income housing. Next, Xuzhou’s low-cost housing would be
elaborated in terms of Xuzhou’s economic status in Jiangsu province, Xuzhou’s
economic and urban transformations, Xuzhou’s housing status quo, and three phases of
low-cost housing projects in Xuzhou. It would discuss the significance of residential
satisfaction applied to assessing residential satisfactions of China’s (Xuzhou)’s low-cost
housing.
3.2 China’s Low-Income Housing (LCH)
With respect to the social housing whose accessibility was controlled by the local
authority by means of the diverse allocation rules (Aziz & Ahmad, 2012; Chen,
Stephens, & Man, 2013; Fitzpatrick & Stephens, 2008; Hills, 2007; Maclennan & More,
1997; Oxley, 2000; Tsenkova & Turner, 2004), the low-income housing in China was
defined to provide social security housing aimed at facilitating those whom had troubles
in having places to live. The local government put some limits on the purchaser, the
standard of the construction, and the selling price or the standard of rental in order to
protect those different medium-low, low, and lowest-income groups of citizens (Chen,
2016; Chen et al., 2014; Chen, Zhang, et al., 2013; Huang, 2012; Wang & Murie, 2011).
The post-reform public housing projects in China for medium-low, low, and lowest-
income groups of citizens consisted of urban low-rent housing (LRH), urban low-cost
housing (LCH), house with limited size and price (LSPH), public rental housing (PRH)
(Wang & Murie, 2011).
106
In terms of the ownership and allocation, the LRH is owned and allocated directly by
local housing bureau, on the contrary, the other three types of low-income housing are
built and delivered by property developers under the supervisory control of municipal
housing bureau. Thus, it was easy to understand why the central government was urgent
to introduce the low-cost housing to medium-low income group of households as
‘predominant’ type amongst four types of low-income housing because the LCH was
designed to be a fast way to deal with homeownership and sold at below-market price to
local eligible households comparing to low-rent and public rental housing only for
renting (Chen, 2016; Wang & Murie, 2011).
However, as the homeownership acquired by way of purchasing low-cost housing
was more competitive than the homeownership acquired by purchasing the commodity
housing, a lot of commodity housing developers, who were designated by the municipal
governments to develop the low-cost housing, criticised about the sale price being
restricted and only earned 3% profit margin, and also covered the construction cost in
spite of the land of low-cost housing scheme was freely allocated to developers.
Therefore, they wanted to quit developing low-cost housing (Chen, 2016).
In the meanwhile, under the situation of a lot of commodity housing developers
being not intended to do so, some cities like Xuzhou and Changzhou established a
municipal state-owned development company directly led by the respective mayor of
Xuzhou and Changzhou and only developed the projects related to low-cost and low-
rent houses. The local governments did not want the commodity housing developers to
get involved in the low-cost housing development. In addition, the medium-low income
group of households in some first-, second-, and third-tier cities, who were not able to
purchase the commodity houses, were targeted by low-cost housing to let them have
homeownerships. Xuzhou is such an example.

107
The LCH [named in Chinese “Jingjixing Shiyong Fang” (‘Jingjixing’ translated into
English as ‘the price of housing is lower than the current price of commodity housing’
and ‘Shiyong’ as ‘affordable and comfortable’ and ‘Fang’ as ‘housing’] is built for
selling to medium-low income residents with a certain paying capability at government
guided price.
In terms of LCH was defined as a commodity housing with the characteristics of
social security, it had economic and applicable attributes. The economic attribute of
LCH reflected that the pricing of low-cost housing was comparatively moderate which
was seasoned with medium-low income households’ housing affordability. The
applicable attribute of LCH indicated that it placed emphases on the effectiveness of
housing by way of housing design and the standard construction.
In terms of the dwelling space of LCH, it was strictly controlled as medium-small
sized housing construction within 80 square meters and the small-sized dwelling space
was controlled within 60 square meters.
In addition, this group of people with medium-low income had a certain ability-to-
pay or the prospective ability-to-pay and besides, they possessed the limited home
ownership which would be owned after 5 years’ purchasing (which was actually
conditioned according to each municipal government, e.g. the ownership of Xuzhou’s
low-cost housing had not been fully purchased since they moved in 2005).
3.2.1 Recent Studies on RS of China’s Low-Income Housing
Little is known about the experience of residential satisfaction from the residents’
perspective in China. In particular, the low-income dwellers in China have few
opportunities to express their feelings about their living environments especially in the
context of government’s decisions to increase the numbers of low-income housing since

108
2007 based upon assessments of low-income housing’s shortages, ownership claims,
development mode and cost, and varieties of low-income housing allocation schemes
needs, however, none of which considered the level of inhabitants’ residential
satisfaction of low-income housing in China.
There have been very few studies about medium-low and low-income groups’
residential satisfactions with low-income housing in China. On exception, Tian and Cui
(2009) found that the residents, who lived at a public housing in Harbin, north-eastern
China, were not satisfied with the layout, appearance, heat ventilation, lighting,
transport facilities, children’s schools, and culture and entertainment facilities.
Moreover, Huang and Du (2015) revealed that the increasing of residential
satisfaction of Hangzhou’s public housing depended more on the improvement of
neighbourhood characteristics, housing estate public facilities and housing unit
characteristics. It depended less on the improvement of public housing allocation
scheme, social environment characteristics of neighbourhood and residence comparison.
In addition, Huang and Du (2015) found that the residents were most satisfied with
cheap rental housing among the four types of China’s public housing, followed by
public rental housing and monetary subsidised housing, on the contrary, residents were
found to be the least satisfied with economic comfortable housing.
Fang (2006) assessed the level of residential satisfaction of original residents living
in four redeveloped inner-city neighbourhoods of Beijing at different time periods in the
past 15 years. An overall level of residential satisfaction across all four neighbourhoods
was found to be low on the basis of a questionnaire survey conducted in Beijing and the
size of housing unit and length of staying were found to be significantly correlated with
residential satisfaction.

109
3.2.2 Recent Studies on China’s Low-Income Housing Policy
Tao et al. (2014) found that the effects of institutional factors were not significant in
improving residential satisfaction of migrant workers in Shenzhen, China who lived at
overcrowded rental housing with poor conditions. As a matter of fact, understanding
current residents’ perspectives on informal settlements villages are better than
straightforward demolitions to improve their residential satisfaction and neighbourhood
quality (Li & Wu, 2013).
In point of fact, as it was very essential to shed light on people’s diversified
residential preferences, demands, perceptions and evaluations of their residential
environments, Fang, Ge and Hokao, Haliloglu Kahraman (2006), (2006), and (2008)
and (2013) asserted that better understanding of people’s characteristics of residential
preferential patterns, residential choice factors and residential satisfaction for local
governments would adjust their housing policies to adapt residents’ constantly
diversified housing needs.
Under the backdrop of rapid socio-economic development in China bringing about
social inequalities in various areas especially the differences in residents’ satisfactions,
Chen, Zhang, et al. (2013) found that the residential situation of a higher proportion of
low-income group were not only less satisfied with their lower rate of homeownership
than high-income group, but they were also less satisfied with their residential
environments than high-income group due to their residential environments had less
liveable neighbourhoods and smaller housing spaces in Dalian, China.
Thus, Chen, Zhang, et al. (2013) suggested that the sufficient provisions of low-
income and low-rent housing together with a strict implementation of income criteria to
be qualified for applying subsidised housing would be helpful to reduce residential
disparities between low-income and high-income groups.

110
3.3 Xuzhou’s LCH
3.3.1 Economic Level of Development in Second-Tier Cities in China especially
Xuzhou
Almost one-third of global economic outputs were produced by only around one-
eighth of global population who were from the world’s 123 largest metropolitan areas
that were grouped into the seven types of global cities consisting of global giants, Asian
anchors, emerging gateways, factory China, knowledge capitals, American
middleweights, and international middleweights (Trujillo & Parilla, 2016).
According to Trujillo & Parilla’s (2016) research, the 22 second- and third-tier
Chinese cities grouped in the Factory China type including Chinese manufacturing hubs
were pointed out that increasing their global engagement and their local economy
mainly relied on export-intensive production such as Xuzhou, Nantong, and Changzhou.
Furthermore, their diversely geographical locations indicated their varieties of industrial
transformations in terms of the cities from the same region showing almost same such
as the cities of Xuzhou, Nantong, and Changzhou locating on China’s east coast
indicating differently from the cities locating at the inland regions and at the Pearl River
Delta region.
Compared to other six types of global cities, the type of Factory China had been
growing most fast in terms of their population, GDP, GDP per capita, output, and
employment. Thus, the cities like Xuzhou, Nantong, and Changzhou with other 19 cities
not only brought a lot of changes to their local citizens and governments, i.e. from 2000
to 2015 the GDP per capita had been increased five times from $2500 to $12,000, but
they also changed the global middle class structure (Schuurman & He, 2013; Trujillo &
Parilla, 2016).

111
Furthermore, from the year 2000 to the year 2015, the manufacturing sector had been
becoming their advantage to connect the global economy day by day and to link the
domestic to the international (to become international manufacturing supply chains)
such as Caterpillar and Golden Concord Holdings Limited (GLC) in Xuzhou with the
productions from only 30% of their GDP to around 40% of total output, for instance,
around 500 foreign companies (Schuurman & He, 2013) located and operated
businesses in Xuzhou Economic and Technological Development Zone (1992) which
was the national level for foreign investment. Then, the utilised foreign direct invest
(FDI) in Xuzhou city had risen 26.6% up to US$ 1.5 billion in 2013 ("Xuzhou Major
Economic Indicators (2013)," 2013), and FDI per capita from 2009 to 2015 had risen to
$164 (Trujillo & Parilla, 2016).
Thus, Trujillo and Parilla (2016) concluded that the 22 second- and third-tier Chinese
cities with only 25% of Chinese population made one-third of China’s total productions.
However, the city like Xuzhou has to pay a painful price for highly polluting the water,
air, and soil during the process of industrialisation and due to the use of coal as fuel for
heavy industry development (Schuurman & He, 2013). Hence, Xuzhou’s city
government had already made a decision on the industrial transformation from the
heavy industry to the light industry. Furthermore, the strict environmental policies that
were introduced by Xuzhou’s city government strictly standardised the companies’
behaviours and the protecting environment special funds that were kept in Xuzhou’s
city government’s annual budget used for solving the problems of pollution (Schuurman
& He, 2013).

112
3.3.2 Xuzhou in General
The Xuzhou city (Figure 3.1), which is located in the upper north-western part of
Jiangsu province (Ma, Qiu, Li, Shan, & Cao, 2013) that is an east coastal province of
China, is connected to another two big provinces, i.e. Shandong and Anhui provinces
and is probably located halfway between Beijing and Shanghai.
Furthermore, Xuzhou city is the largest city of the Huaihai Economic Region
amongst more than 30 cities from 4 provinces consisting of Jiangsu, Shandong, Henan,
and Anhui. In terms of Xuzhou’s critically and economically strategic location since
ancient times, it is one of China’s most renowned transportation hubs with the bases of
water, land, and railway transportations and is leading economic growth of Huaihai
Economic Region. Moreover, Xuzhou city also is a member of Yangtze Delta Economic
Region (Geng, Long, & Chen, 2016) to easily connect with southern Jiangsu, Shanghai
and Zhejiang provinces.
Figure 3.1: Xuzhou (Nantong, and Changzhou) (Three second-tier cities in
Jiangsu Province, China)
Source: Google Map

113
3.3.3 Xuzhou to Be Selected Amongst Three New Second-Tier Cities in Jiangsu
Province
The reasons why Xuzhou city was selected as an example of new second-tier cites to
study residential satisfaction of low-cost housing were because the first of the 2nd
largest
registered population ("The Data of Sampling Survey on 1% population of Xuzhou in
2015," 2016; Trujillo & Parilla, 2016) in Jiangsu province having 8.66 million (Table
3.1) until 2015 comparing to Nanjing (which is the capital city of Jiangsu province)
having 8.245 million (Table 3.4) by the year 2015 (Cui, Geertman, & Hooimeijer, 2016;
"The Data of Sampling Survey on 1% population of Nanjing in 2015," 2016; Trujillo &
Parilla, 2016) and comparing to Nantong (which is another new second-tier city) having
7.357 million (Table 3.2) and comparing to Changzhou (which is another new second-
tier city) only having 4.727 million (Table 3.3) by the year 2015 ("The Data of
Sampling Survey on 1% population of Changzhou in 2015," 2016; Trujillo & Parilla,
2016).
Secondly, Xuzhou city had the 2nd
largest area (Total area is 14, 296 km2 consisting
of prefecture-level 11,259 km2 and urban 3,037 km
2) (Ma et al., 2013) which was bigger
than Nanjing city (Total area 6,598 km2) (Cui et al., 2016) and was also bigger than
Nantong city (Total area 8,544 km2), and of course, was much bigger than Changzhou
(Total area is 6,256.68 km2 consisting of prefecture-level 4,384.58 km
2 and urban
1,872.1 km2).
In terms of regional GDP, Xuzhou city was quite similar with Changzhou city at
$149,682 million (Table 3.1) to $147,281million (Table 3.3), but was slightly lower
than Nantong city at $169,781 million (Table 3.2) and was very different from Nanjing
city with $271,934 million (Nanjing is the first-tier city) (Table 3.4) (Trujillo & Parilla,
2016).

114
Table 3.1: Xuzhou City General Statistics
Xuzhou, China
Type: Factory China
Ranks
Metric Value Overall Within
type
Population (Ths),2015 8,660 33/123 8/22
GDP (millions PPP$), 2015 $149,68
2 93 19
GDP per capita (PPP$), 2015 $17,284 116 19
GDP per worker (PPP$), 2015 $85,697 77 14
GDP growth (ann.), 2000-2015 +12.6% 20 15
GDP per capita growth (ann.), 2000-2015 +12.8% 2 2
GDP per worker growth (ann.), 2000-2015 +5.9% 25 17
Traded sector productivity diff., 2015 N/A N/A N/A
FDI per capita, 2009-2015 $164 116 17
University research impact, 2010-2013 N/A N/A N/A
Patents per 1,000 inhabitants, 2008-2012 0.00 122 21
Venture capital per capita (Ths.), 2006-2015 N/A N/A N/A
Higher educational attainment (%) 4.6 120 20
Air passengers, 2014 2,166,02
0 116 17
Internet speed (Mbps), 2014 33.3 39 2
Source: Trujillo and Parilla (2016)
Table 3.2: Nantong City General Statistics
Nantong, China
Type: Factory China
Ranks
Metric Value Overall Within type
Population (Ths),2015 7,357 45/123 15/22
GDP (millions PPP$), 2015 $169,781 77 13
GDP per capita (PPP$), 2015 $23,079 104 13
GDP per worker (PPP$), 2015 $109,576 40 4
GDP growth (ann.), 2000-2015 +12.7% 19 14
GDP per capita growth (ann.), 2000-2015 +12.8% 1 1
GDP per worker growth (ann.), 2000-2015 +6.5% 22 15
Traded sector productivity diff., 2015 N/A N/A N/A
FDI per capita, 2009-2015 $405 99 12
University research impact, 2010-2013 N/A N/A N/A
Patents per 1,000 inhabitants, 2008-2012 0.00 117 16
Venture capital per capita (Ths.), 2006-2015 $0.01 94 7
Higher educational attainment (%) 6.0 117 18
Air passengers, 2014 2,049,895 117 18
Internet speed (Mbps), 2014 25.0 75 8
A rank of 1 indicates the largest value in the group of metro areas being compared
Source: Trujillo and Parilla (2016)

115
Table 3.3: Changzhou City General Statistics
Changzhou, China
Type: Factory China
Ranks
Metric Value Overall Within type
Population (Ths),2015 4,727 71/123 21/22
GDP (millions PPP$), 2015 $147,281 94 20
GDP per capita (PPP$), 2015 $31,155 86 6
GDP per worker (PPP$), 2015 $66,988 99 18
GDP growth (ann.), 2000-2015 +12.5% 22 16
GDP per capita growth (ann.), 2000-2015 +10.8% 18 14
GDP per worker growth (ann.), 2000-2015 +5.3% 28 18
Traded sector productivity diff., 2015 N/A N/A N/A
FDI per capita, 2009-2015 $1,386 40 2
University research impact, 2010-2013 N/A N/A N/A
Patents per 1,000 inhabitants, 2008-2012 0.00 119 18
Venture capital per capita (Ths.), 2006-2015 $0.01 95 8
Higher educational attainment (%) 10.0 105 10
Air passengers, 2014 3,889,019 112 15
Internet speed (Mbps), 2014 33.5 38 1
A rank of 1 indicates the largest value in the group of metro areas being compared
Source: Trujillo and Parilla (2016)
Table 3.4: Nanjing City General Statistics
Nanjing, China
Type: Factory China
Ranks
Metric Value Overall Within
type
Population (Ths),2015 8,245 37/123 14/28
GDP (millions PPP$), 2015 $271,93
4 43 12
GDP per capita (PPP$), 2015 $32,983 81 6
GDP per worker (PPP$), 2015 $78,121 85 5
GDP growth (ann.), 2000-2015 +12.5% 21 6
GDP per capita growth (ann.), 2000-2015 +10.3% 26 7
GDP per worker growth (ann.), 2000-2015 +6.7% 20 5
Traded sector productivity diff., 2015 +255.7
% 5 5
FDI per capita, 2009-2015 $1,386 39 9
University research impact, 2010-2013 8.5% 82 9
Patents per 1,000 inhabitants, 2008-2012 0.41 63 3
Venture capital per capita (Ths.), 2006-2015 $0.05 69 7
Higher educational attainment (%) 22.1 81 9
Air passengers, 2014 27,263,9
88 63 12
Internet speed (Mbps), 2014 34.5 34 2
Source: (Trujillo & Parilla, 2016)

116
3.3.4 Economic Transformation of Xuzhou City
With the development of transformation from the old economic model to the new
economic model across the country of China, i.e. the single-pattern of only state-owned
companies operating in the ‘market’ under the national guidance were transforming to
the coexistence of diversified-owned companies operating in the market economy, all
state-owned enterprises around the country were doing bankruptcy liquidation to
achieve the outcome of the planned economy transforming to the market economy. For
instance, in February of 1992, the city government of Xuzhou announced to reform the
recruitments and distributions of personnel systems of State-Owned-Enterprises (SOEs),
i.e. the employees’ lifelong labour contract from SOEs were terminated which meant
that the employees of SOEs were fired when their performances were not satisfied by
SOEs’ managers, hence, their salaries got along with efficiency and performance of the
company. Accordingly, this was the first time of China’s central government to start
State-Owned-Enterprises reforms from the lowest level of employees of SOEs since
Chinese economic reform of 1978.
In the case of social security had not been established in each city when the city
government of Xuzhou reformed and shut down the state-owned companies, a large
number of ‘laid-off’ workers had been eliminated by the society because they had not
learnt too much knowledge about working skills during the period of their working at
state-owned companies on account of no competition in state-owned companies’
working environment.
Furthermore, this previous much secured working environment in their work units
blocked employees from learning about outside world from one side; another side was
that the employees were lazy about learning new things as they thought they had a
never-loss job.

117
As a result, when the reform came suddenly, they were pushed into the market and
they could not survive especially for the poorest and lowest levels of workers who even
did not have places to live in. Furthermore, this unprecedented situation led to a series
of social crises such as some ‘laid-off’ workers eventually committing suicide when
they did not have a way to go. Taking Xuzhou Sock Factory which was a state-run
company to go bankruptcy liquidation more early than others, a lot of people were
forced to lose their jobs to become the group of ‘laid-off’ workers who were considered
as the lowest level of society at that time.
As the above mentioned in terms of the social security had not been established in
Xuzhou, the ‘laid-off’ workers were neglected by the society during the process of the
planned economy transforming to the market economy and were left behind at that time.
No matter in terms of their ages or their financial advantages, they did not have any
chances of re-starting their businesses. Eventually, the ‘laid-off’ workers had to become
a member of who relied on the minimum subsistence in Xuzhou and they had to pay
their pension insurance by their own until the age of retirement, and of course, a certain
numbers of ‘laid-off’ workers were still staying with their parents at their parents’ work
units’ distribution houses during the process of this research investigation in Xuzhou.
3.3.5 New Development of Xuzhou and Xuzhou’s Economic Growth
After the establishment of the basic economic system in China that the diversified
ownership economy was coexistence as the public ownership was the main body, the
industrialisation development around China had been enhanced and the urbanisation
process had also been developing so fast. Xuzhou is such an example.

118
Along with Xuzhou city’s resources exhaustion gradually since 1990s, Xuzhou city
had been facing some critically serious problems at that time such as the structure of
industry was quite simplified, urban function was not strong enough, and ecological
environmental degradation.
In terms of the real situations of Xuzhou, Xuzhou’s city government proposed to
develop with respects to the industrial transformation, urban transformation and
ecological transformation with the support of National Development and Reform
Commission and the provincial government.
Through the constant efforts, Xuzhou had been changing the previous of a single-
industrial-structure in terms of enlarging food and agricultural products processing
industry represented by Xuzhou Weiwei Group that bringing along the development of
green agricultural industry and organic food industry in terms of the principal farming
products consisting of rice, wheat, fruit, cotton, oil seed, etc. instead of the traditionally
agricultural economy model so as to boost Xuzhou’s process of urbanisation from rural
area to urban area at the same time ascribed to the new agricultural development mode
that can free a lot of traditional farmers from their traditional land.
Thus, the city’s economy formerly dominated by the agricultural income had been
changed into only 3% of the Xuzhou city’s GDP until 2015 ("The Statistical Bulletin of
National Economy and Social Development of Xuzhou 2015," 2016). It indicated that
some certain numbers of modern farmers moved into the urban area as the traditionally
agricultural economic model only relying on the productivity of the land had been
changed into the new modern of agricultural economic model with the improvements of
new agricultural technology. Thus, it showed a new strength getting involved with the
urbanisation process to bring a lot of pressures to medium-low income group of local
residents, because the price of housing had been pushed up by them.

119
In terms of the urbanisation process, the housing demands had been increasing
sharply in a short time and the housing prices had been boosting as well. As more and
more housing construction projects, Xuzhou’s construction machinery industry had
been enhancing such as Xuzhou Construction Machinery Group (XCMG) led this area
around China even around the world. Thus, the numbers of local skilled workers had
been getting larger and larger compared with those ‘laid-off’ workers who did not have
much more skills during the period of their working under the old economic model (Cui
et al., 2016).
With regard to the fast growing economic sector like new energy, Golden Concord
Holdings Limited (GLC) is the world’s leading manufacturer of high quality
photovoltaic material in terms of Xuzhou GLC Photovoltaic Power Co., Ltd being
current one of China’s largest solar farms. Furthermore, Xuzhou GLC carried out a
national new level of project to bring a lot of significant economic and environmental
benefits to the local market. Accordingly, the available positions of new jobs attracted
high- and medium-talented applicants across the Jiangsu province and beyond.
Moreover, as the migratory talented workers more and more moved into Xuzhou city,
they had been bringing a lot of prosperities to Xuzhou’s real estate market. In terms of
their salaries were quite satisfied paid by those big local and international companies in
Xuzhou, the local housing developers were engaged in medium-high and high-end
commodity housing developments to meet their housing needs. In the meanwhile, the
migratory talented workers brought too much pressure on the local medium-low
households who prepared to buy commodity houses.
With respect to the featured industries developing comprised of the new modern
agricultural economic model, construction industry, new energy industry, and real
estate, the logistics industry, of course, got improved so fast not only on account of

120
Xuzhou’s economically strategic geographical-location but also ascribed to all
economic sectors got boosted. For instance, with the development of Chinese electronic
commerce, a lot of courier companies were emerged and the numbers of local sorting
stations had also been increasing. Therefore, a certain number of unemployed, lower-
educated, and previous ‘laid-off’ workers joined as couriers to deliver Taobao goods
and they could earn fairly good wages. The electronic commerce not only created
locally numerous young entrepreneurs, but also created a great deal of working
opportunities for unemployed, lower-educated, and previous ‘laid-off’ workers. Thus,
some certain percentages of local businessmen and businesswomen doing businesses by
electronic commerce and some certain percentages of local people doing as couriers had
already increased their purchasing power for commodity housing compared to when
they got laid off.
According to the above mentioned, Xuzhou city government had already promoted
the industrial transformation in terms of accelerating the transformation from the old
industrial bases to the modern industrial and commercial city.
In the process of transformation, the new-type industrialisation based upon the
mergers and acquisitions about that Xuzhou city government always mentioned was to
transform and promote Xuzhou’s traditional industries such as Xuzhou Weiwei Group
in order to covert the industrial structure from heavy-industry to light-industry by means
of the implementation of technological innovation.
Furthermore, the new-type industrialisation was also asked to develop hi-tech
industries in order to stimulate the industry level from low to high by way of increasing
the investments in science and technology to building an innovation platform for
studying on the elements of innovation in order for enhancing scientific research
abilities. Xuzhou GLC Photovoltaic Power Co., Ltd is such an example.

121
In terms of the shortages of each industry in Xuzhou, the industrial chain should be
extended so as to increase job opportunities such as Xuzhou’s logistics industry.
Moreover, the new-type industrialisation was asked to develop like Jinshanqiao
development zone which was the earliest and the most comprehensive industrial park
with full function and full equipment where the industrial distribution would be changed
from dispersed allocation to be put together, i.e. the same industry sector could meet
their suppliers at the same time in this industrial park in order to adjust the industrial
structure and enlarge the industrial scale.
Therefore, in terms of the process of Xuzhou’s economic transformation increasing
the local GDP, Table 3.5 indicated that the GDP of Xuzhou annually rose 12.6% from
2000 to 2015 and the GDP per capita of Xuzhou annually grew 12.8% from 2000 to
2015 (Trujillo & Parilla, 2016). As Xuzhou’s economic developments mainly relied on
the equipment manufacturing, food processing and new energy, the industrial output
and the food processing had achieved RMB 275.73 billion and RMB 245.8 billion in
2013, respectively ("Xuzhou Major Economic Indicators (2013)," 2013). Thus, the
value-added output from the industry sector was reported to take up 47.8% (Table 3.5)
of Xuzhou’s GDP in 2013 which meant that the industry sector had contributed the
most in the past ("Xuzhou Major Economic Indicators (2013)," 2013).
For instance, the established companies in Xuzhou such as Xuzhou Construction
Machinery Group (XCMG) which was founded in 1989 and is leading China’s
construction machinery production and supplying and another top state-owned mining
group named Xuzhou Mining Group which was established in 1880s and is playing a
major role in eastern China’s coal production and supplying, had achieved RMB 1.51
billion net profit and RMB 26.99 billion sales revenue for XCMG in 2013 and had

122
achieved 20 million tons annually coal production capacity for Xuzhou Mining Group
until 2013.
What is more, the main export products comprising of construction materials
electronic and mechanical products, base metals and products and agricultural products
that were produced by those established companies in Xuzhou had gained US$ 4900
million in 2013 (Table 3.5). Therefore, the revenue of Xuzhou’s city government got
increased.
Table 3.5: Xuzhou City Information
(2013)
Land Area (km2) 11,258
Population (million) 8.59
GDP (RMB billion) 443.58
GDP Composition
Primary Industry (Agriculture) 9.70%
Secondary Industry (Industry & Construction) 47.80%
Tertiary Industry (Service) 42.50%
GDP Per Capita (RMB) 51,714
Unemployment Rate 2.14%
Fixed Asset Investment (RMB billion) 309.01
Actually Utilised FDI (USD million) 1,500
Total Import & Export (USD million) 6,290
Export (USD million) 4,900
Import (USD million) 1,390
Sales of Social Consumer Goods (RMB billion) 147.36
Source: Xuzhou Economic and Social Development Report 2013 ("Xuzhou Major Economic Indicators
(2013)," 2013)
3.3.6 Xuzhou’s Urban Transformation
When Xuzhou’s government revenues had been remaining stably increasing from
2000-2015 (Trujillo & Parilla, 2016), the city government decided to carry forward the
urban transformation from the resource-based city to the regional central city.
As Xuzhou not only is the country’s major integrated transportation hub but also is
the central city in the Huaihai Economy Region, Xuzhou kept optimising urban spatial

123
structure to enhance urban functions in order to strengthen city’s public appeal and
influence when promoting the urban transformation.
Since the urbanisation movement going fast from 2000 in Xuzhou, with the
objectives of Xuzhou’s city government of making a very dynamic and liveable city, the
city government had been expanding the area of the city urban by increasing the
numbers of districts instead of counties in order for a lot of migrant workers from the
following counties and villages coming and working in Greater Xuzhou so as to boost
Xuzhou’s economy.
In terms of a liveable city and the requests from those migrant workers (not so many
from other cities due to the large number of Xuzhou’s population) regarding the
increasing of housing numbers and residential environment, the city government had
been restructuring the shanty towns, urban villages, and old quarters since 2000 to
constantly improve their residential environment which were the medium-low and low-
income local residents and migrant workers’ choices for living, however, this group of
migrant workers from Xuzhou’s following counties and villages was not kind of big
comparing to most migrant workers coming to Xuzhou for doing their own businesses
due to Xuzhou city previously having a certain number of ‘laid-off’ workers to do those
low-required jobs. As a result, those migrant workers actually promoted Xuzhou’s real
estate development and drove up local housing price (Cui et al., 2016; "Xuzhou Major
Economic Indicators (2013)," 2013; "Xuzhou Transformation and Development
Practices," 2016).
With the city government’s constant efforts, the old industrial bases of Xuzhou got
revitalised by promoting ecological transformation in which a lot of ecological
rehabilitation projects were carried out such as devoting more efforts to
comprehensively controlling mining subsidence and reclaiming the industrial and

124
mining wasteland. Hence, the ecological environment of Xuzhou had been greatly
improved comparing to the year of 2000 so that the housing price would be increased
rationally ("The Data of Sampling Survey on 1% population of Xuzhou in 2015," 2016;
"Xuzhou Major Economic Indicators (2013)," 2013; "Xuzhou Transformation and
Development Practices," 2016).
On the whole, after Xuzhou city’s urban transformation and city’s functions being
considerably improved, the issue of social security especially housing security gradually
entered into city government’s attention when the local citizens inclusive of migrant
workers had been constantly buying housing for their own using and investing so as to
increase the housing price three times between 2005 and 2016 (Chen, 2016; "The Data
of Sampling Survey on 1% population of Xuzhou in 2015," 2016; Trujillo & Parilla,
2016; "Xuzhou Transformation and Development Practices," 2016). Consequently, the
local medium-low income citizens, most of who were ‘laid-off’ workers, low-educated,
and aged, had a lot of pressures of buying housing since 2000 ("Xuzhou Transformation
and Development Practices," 2016).
3.3.7 Xuzhou’s LCH
3.3.7.1 Xuzhou’s Housing
In terms of Chinese economic transformation since the late 1990s bringing about the
termination of welfare housing provision in 1998 and Chinese housing commodification
since the late 1990s, the people’s social values had been changed on account of a certain
number of workers were laid off and at the same time they had no capabilities of buying
new houses when some SOEs did not provide staff quarters to all of their employees. At
the time of either buying their staff quarters or buying commodity housing under the
context of no more welfare housing provision, the low-income housing programmes
were just introduced to those who were laid-off workers or medium-low or low-income

125
urban citizens and did not have staff quarters to live at and were not afford to buy new
commodity houses.
Furthermore, the role of housing reshaped Chinese social welfare system from just
giving a basic living need based upon the urban welfare housing system which was
implemented until the early 1990s when Chinese housing was not taken as a commodity
to giving an exchange value of commodity housing (purchased from free market or
purchased from local governments not from private developers such as low-cost
housing) and a basic living need (allocated/leased from local governments such as low-
rent housing) based on free market system and low-income housing programmes
system.
In another word, the Chinese public housing (low-income housing) not only had
changed itself from a state-owned to private homeownership (either purchased from free
markets or purchased from local governments) since 1998 (Chen et al., 2014), but it had
also significantly reshaped the local welfare system in China especially in terms of the
urban housing security system that was taken as an importantly indispensable element in
Chinese social security system.
In terms of the urban welfare housing system, it impeded Chinese commodity
housing development, because the state-provision housing which was freely delivered to
SOEs’ workers made them reluctant to purchasing the market housing. Furthermore, as
the demand for the market housing was relatively low, the numbers of commodity
housing developers were very limited and all of them were state owned developers.
Thus, the serious problem of housing shortage was around China not only because of
the limit numbers of commodity housing developers but also the costs of development
that were very high for SOEs. Accordingly, the welfare housing system actually halted
Chinese economic development (Chen, 2016; Chen et al., 2014; "Full text: Report on

126
China's economic, social development plan," 2015; Stephens, 2010; Wang & Murie,
1999; Wang & Murie, 2011; Wu, 1996).
With regard to the medium-low and low-income households in less-developed
countries like China, Chinese government were recommended to devote to the low-
income housing programmes which were officially introduced in 1998 as a critical
solution to improving each local social security system especially the urban housing
security system.
As Chen et al. (2014) concluded that the role of low-income housing is playing
critically significant during all industrialised countries’ doing urbanisation process,
Xuzhou was that kind of industrialised city with the industry sector leading its industrial
GDP growth at 14-17% annually between 2009 and 2013 (Schuurman & He, 2013) and
faced the urbanisation process which was brought by the new modern agricultural
economy, industry and construction, and new energy and real estate in terms of some
certain numbers of modern farmers moving into the urban area, the more and more
migratory talented workers moving into Xuzhou city, and some certain percentages of
local businessmen and businesswomen doing businesses by electronic commerce and
some certain percentages of local people doing as couriers.
However, the continuously increasing housing price brought a lot of changes to
people’s normal lives and to city government’s welfare system, although Xuzhou did
very well in enlarging the urban housing stock (Schuurman & He, 2013; "The Statistical
Bulletin of National Economy and Social Development of Xuzhou 2015," 2016;
"Xuzhou Major Economic Indicators (2013)," 2013; "Xuzhou Transformation and
Development Practices," 2016). Consequently, the people of Xuzhou had been totally
changed with their ways of looking at this city and the changes of Xuzhou had been
always reshaping their social values. Furthermore, those social forces and trends had

127
been leading to Xuzhou’s social structure changing where a broadening polarity
between different tenures and different groups produced by Xuzhou’s housing market
after Xuzhou’s housing commodification of the late 1990s made a severe housing
affordability crisis to such an extent amongst the group of medium-low and low-income
urban citizens that formed rapidly declines of Xuzhou’s social stabilities ("The Data of
Sampling Survey on 1% population of Xuzhou in 2015," 2016; Liu, Song, & Liu, 2016;
Schuurman & He, 2013; "The Statistical Bulletin of National Economy and Social
Development of Xuzhou 2015," 2016; Trujillo & Parilla, 2016; "Xuzhou's Annual
GDP," 2015; "Xuzhou Transformation and Development Practices," 2016). At the time
of either buying their staff quarters or buying commodity housing in Xuzhou,
unfortunately, some ‘laid-off’ workers did not have the staff quarters to buy and
medium-low and low-income people did not have more capabilities of buying new
houses.
With respect to the social pressures and corresponding to Chinese central
government calling on each local government to promote the low-income housing
programmes that was a necessary instrument to satisfy those medium-low and low-
income urban households’ basic housing needs and were considered as the most
essentially for Chinse long-term development strategy in terms of promoting Chinese
urbanisation stably and promoting Chinese urban development sustainably, in 2004 the
Xuzhou’s first low-cost housing programme was just introduced to those who were
‘laid-off’ workers or medium-low or low-income urban citizens and did not have staff
quarters to live and were not afford to buy new commodity houses under Xuzhou’s new
economic transformation.

128
3.3.7.2 Xuzhou’s LCH
Figure 3.2: Three Phases of LCH in Xuzhou
Source: Xuzhou Bureau of Land and Resources
Phase 1 (a)
The 1st phase of low-cost housing [Chinese name is Yangguang Huayuan, English
known as Sunny (Yangguang) Garden (Huayuan), Figure 3.2], which is located at North
of Guozhuang Road, Yunlong district, was built for resolving housing difficulties of
local medium-low income households by municipal party committee and government
and was one of the 2004 municipal key projects. The Yangguang Huayuan’s
development and construction was organised and implemented by Xuzhou Housing
Security and Real Estate Management Bureau with the support of local preferential
policy.
Moreover, the Yangguang Huayuan whose development was restricted by the
construction standard made by Xuzhou Housing Security and Real Estate Management

129
Bureau was actually a policy-supported housing in line with the principal of “affordable
and moderately comfortable” to be sold to the urban medium-low income households
with housing difficulties.
Furthermore, the planned land was around 8.4 hectare with total floor area of about
100,000 square meters and each built-up area was around between 60 and 80 square
meters. This project started on 18th
June, 2004 and was put into use on 1st May, 2005. In
general, the Yangguang Huayuan has two main exits located at south and north
respectively and one minor exit at east. In Yangguang Huayuan, there are 24 blocks of
low-cost house units and another 4 blocks of resettlement house units and there have
some basic public facilities such as street lighting, kindergarten, recreation centre, etc.
("The Brief Introduction to Xuzhou's First Phase of Low-Cost Housing," 2012).
Phase 2 (b)
The 2nd
phase of low-cost housing [Chinese name is Chengshi Huayuan, English
known as City (Chengshi) Garden (Huayuan), Figure 3.2], which is located at West of
Xiangwang Road next to Jiuli district government and is very close to several parks and
scenic spots, was also built for resolving housing difficulties of local medium-low
income households by municipal party committee and government and was one of the
2005-2006 municipal key projects.
Furthermore, one elementary school, two middle schools, and one local university
are not far away from the Chengshi Huayuan which is located at the centre of Jiuli
district.
Furthermore, the planned land was around 10.2 hectare with almost same total floor
area with Phase 1 of about 100,000 square meters and each built-up area was around
between 60 and 90 square meters which is a little bigger than Phase 1.
130
Moreover, the Chengshi Huayuan whose development was also restricted by the
construction standard made by Xuzhou Housing Security and Real Estate Management
Bureau was actually a policy-supported housing in line with the principal of
“appropriate standard, functional, affordable, and convenient and energy-saving” and
was sold to the urban medium-low income households with housing difficulties.
This project started in October, 2005 and was put into use in November, 2006. In
Chengshi Huayuan, there are 22 blocks of low-cost house units and there have some
basic public facilities such as local shops, property management, kindergarten,
recreation centre, etc. ("The Brief Introduction to Xuzhou's Second Phase of Low-Cost
Housing," 2012).
Phase 3 (c)
The 3rd
phase of low-cost housing [Chinese name is Binhe Huayuan, English known
as Binhe (Binhe) Garden (Huayuan), Figure 3.2] which includes low-cost housing, low-
rent housing, and resettlement housing was a project in the public interest to put
China’s11th
five-year plan of housing construction planning into effect in Xuzhou in
order to promote municipal party committee and government’s social housing security
work and was one of the 2007 municipal key projects.
Binhe Huayuan locates in the north of main city and its planned area was 18.67
hectare which is more than two times than Phase 1 and more than 1.5 times than Phase 2
with the total floor area of about 200,000 square meters that is two times than both
Phase 1 and Phase 2 and each built-up area was below 90 square meters that is almost
same as Phase 1 and Phase 2 for economic purpose.

131
In terms of the planned area and total floor area being almost two times bigger than
both Phase 1 and 2, on one hand, 100 units of low-rent housing were introduced for the
first time to enrich Xuzhou’s low-income housing programme (but unfortunately, the
100 units of low-rent housing since the completion of August 2008 were all vacant
based upon my own experience and photos that I took in June 2014), on the other hand,
more resettlement projects were constructed together with low-cost housing projects
comparing with the 1st phase (2
nd phase does not have resettlement houses) so that the
total floor area increased. In addition to the area being enlarged, whether the residential
satisfaction level of the inhabitants living at low-cost housing might have been affected
by this mixed living style (1st and 2
nd phases) should be considered.
Moreover, the Binhe Huayuan whose development was also restricted by the
construction standard made by Xuzhou Housing Security and Real Estate Management
Bureau was also a policy-supported housing according to the same principal as Phase 2
had regarding “appropriate standard, functional, affordable, and convenient and energy-
saving” and was sold to the urban medium-low income households with housing
difficulties or relocation matters.
In addition, this project was put into use in August, 2008. In Binhe Huayuan, there
are 23 blocks of low-cost house units with another 34 blocks of resettlement house units
and there have some basic public facilities such as local shops, kindergarten, recreation
centre, etc. ("The Brief Introduction to Xuzhou's Third Phase of Low-Cost Housing,"
2012).
3.4 The Significance of RS to China’s LCH
According to Hu’s (2013) research, it enlightened that the homeownership status in
urban China had a great positive effect on both resident’s housing satisfaction and
overall happiness. It followed that the existing residents at low-cost housing in urban

132
China were paying very close attention to when and how they could buy their full
homeownership.
However, those who currently lived at low-cost homes showed a lower housing
satisfaction as the locations of those low-cost houses in Chinese cities were far away
from city centres and the relatively poor infrastructure provided comparing with
commodity houses (Hu, 2013; Huang, 2012). It meant that living at low-cost houses
inconveniently and poor infrastructure were talking about the issue of residential
satisfaction.
Thereby, the assessment of residential satisfaction with China’s low-cost houses was
becoming a key to their decisions on whether they would buy their full homeownership
from municipal governments and either they would sell their low-cost houses back to
municipal governments or to give their houses over to those who were new applicants
for low-cost houses.
In spite of this, as the existing residents in low-cost houses were still expecting their
houses to be sold later on the open market at much higher prices comparing with their
buying prices, the residential satisfaction was not only to tell how the current living
situation was like, but also to tell from which facets the municipal governments should
enhance to improve their expectations of buying homeownerships.
Besides this, those residents who were living at low-cost houses were underclass and
should be given priority to ensuring their basic needs for housing by municipal
governments. After all, for them, it was not straightforward to purchase commodity
houses by way of selling their low-cost houses on the open market. Then, improving
their residential satisfaction with current low-cost houses would make them to feel their
basic housing needs being deserved protection. Yet perhaps, they would consider
133
purchasing their full ownership and then to sell and to buy commodity houses by the
time when their living conditions would have been improved. As thus, the low-cost
houses, to some extent, were about to be brought some certain finical compensation for
their buying next houses.
3.5 The Significance of RS to Xuzhou’s LCH
In the context of this reality, once their living conditions were not satisfied, the
residents would illegally rent in private for commercial purposes while they chose to
live in rental houses with better living environment (some cases happened in Xuzhou).
What seemed more exaggerated in Xuzhou, some residents already had rented
another houses and lived there, but they still held their occupancy of low-cost houses
and used for commercial purposes and also they did not want to sell back to the local
government within the first ten years. Even some residents already illegally sold their
low-cost houses in private before not having full homeownership at negotiated prices
under very conditional situation (some cases were exposed on local government’s
website) (by June 2015 interviewing closed, Xuzhou had not officially given any
announcements regarding when they could buy their full homeownership of low-cost
houses).
As a result of their non-legal effect and illegal renting or selling, it not only affected
my field survey about residential satisfaction with low-cost houses in Xuzhou from who
were the real households of these low-cost houses to how many exactly the number of
real households were living around, but also was it challenging the exit mechanism of
Chinese low-cost houses particular in Xuzhou.

134
In terms of the exit mechanism in low-cost housing, it said when the residents’
family income reached to a certain level whereby they could afford to buy commodity
houses, they should quit living at low-cost houses and municipal governments had top
priority of buying back their partial homeownership rather than their further purchasing
another part of ownership (Guowuyuan guanyu jiejue chengshi di shouru jiating
zhufang kunnan de ruogan yijian, 2007).
Unfortunately, as the time of low-cost houses going to open market not being
confirmed in Xuzhou and the exit mechanism not being perfectly applied to the human
conditions which meant that residents’ real family income was quite hard to get, the
municipal government of Xuzhou had been ordering to build more low-cost houses to
meet the demands. Nevertheless, the vacancy rate of low-cost houses in Xuzhou had
been going higher year after year, because new-built low-cost houses were expensive
and located much far away from the city centre.
Thus, the assessment of residential satisfaction with low-cost houses was very
important to the municipal governments especially Xuzhou, because they not only
would be aware of how satisfied the residents felt about their current living conditions
and whether those factors had correlations with residential satisfaction, but also would
be aware of which factors were predictor factors and which predictor factors would
most predict the residential satisfaction.
Hence, the municipal governments would understand how to improve their
habitability with the following low-cost houses development from those predictor
factors instead of developers’ previous experiences in building. In the meanwhile, the
residents would be informed about whether what the municipal governments would deal
with those predictor factors were what factors they really concerned about. Then, the

135
residents would be better cooperating with the municipal governments to enhance their
habitability.
3.6 Conclusion
The post-reform public housing projects in China for medium-low, low, and lowest-
income groups of citizens consisted of urban low-rent housing (LRH), urban low-cost
housing (LCH), house with limited size and price (LSPH), public rental housing (PRH).
The low-cost housing was a ‘predominant’ type amongst four types of low-income
housing because the LCH was designed to be a fast way to deal with homeownership
and sold at below-market price to local eligible households.
The factors which were suggested by the recent studies on residential satisfaction of
China’s low-income housing have already increased the total numbers of independent
variables and also increased the accuracy of residential satisfaction index of China’s
low-cost housing. Together with the previous factors found in public and commodity
housing’s residential satisfactions studies in developed and developing countries, the
factors of housing layout, appearance, heat ventilation, lighting, transport facilities,
children’s schools, and culture and entertainment facilities were suggested to be added
onto the questionnaire.
Xuzhou city was selected as an example of new second-tier cities to study residential
satisfaction of low-cost housing, because it had the 2nd
largest registered population and
the 2nd
largest area in Jiangsu Province, and its regional GDP was quite big in the new
second-tier cities.
With Xuzhou’s economic transformation and growth bringing Xuzhou’s urban
transformation and development, the needs of Xuzhou’s low-cost housing became more
and more necessary to deal with those medium-low and low-income citizens’ living

136
problems. With the introductions of Xuzhou’s three phases of low-cost housing projects
provided, it was easy to understand the research subjects before going to the next
chapter of methodology.

137
METHODOLOGY CHAPTER 4:
4.1 Introduction
This chapter started with elaborating the reasons why this research work would
choose the explanatory sequential mixed mode method for this current research design.
In light of the explanatory sequential method required, the quantitative part would
prepare the participants, collect the data, and then analyse the data. The result which
would be found from the quantitative part would make the questions of qualitative part.
Furthermore, the qualitative part would prepare the case selection, interview
development, collect the data, and then analyse the data for further deeply answering the
research questions.
4.2 Explanatory Sequential Mixed Mode Method
This study adopted the mixed methods, no matter which is the fixed or emergent or
combing both fixed and emergent mixed methods design, aimed to further and deeply
account for the research questions with reference to one method is normally considered
not adequate when doing a social and behavioural research (Clark & Creswell, 2011, p.
54; Creswell, 2014; Fowler Jr, 2013; Johnson & Onwuegbuzie, 2004; Knight &
Ruddock, 2009; Morse, 2003; Tashakkori & Teddlie, 2010).
4.2.1 The Reasons for Mixing Quantitative and Qualitative Methods in a Single
Study
As Clark & Creswell’s (2011) suggestion of having at least one well-defined reason
to carry out the mixed methods research, Bryman (2003); (Bryman, 2006, 2007;
Bryman, 2015; Bryman, Becker, & Sempik, 2008; Bryman & Cramer, 1994; Lewis-
Beck, Bryman, & Liao, 2003) concluded 16 reasons for mixing the quantitative and
qualitative methods in a single study such as triangulation, offset, completeness,
process, different research questions, explanation, unexpected results, instrument

138
development, sampling, credibility, context, illustration, improving the usefulness of
findings, discover, diversity of views, and building upon quantitative and qualitative
findings in short based upon 5 reasons given by Greene (2006); (Greene, 2007; Greene,
Caracelli, & Graham, 1989; Johnson, Onwuegbuzie, & Turner, 2007) and also cited by
Clark and Creswell (2011) talking about triangulation, complementarity, development,
initiation, and expansion.
Thus, the reason why this study chose to mix quantitative and qualitative methods
was because the research problems and questions which had already decided the mixed
methods research design required to be answered by way of complementarity,
explanation, and illustration of mixed methods. At this point, the illustration gave
further conclusions on the complementarity and explanation that using qualitative data
to further help explain, elaborate, enhance, clarify, and illustrate the quantitative
findings as (Bryman, 2015); Clark and Creswell (2011); (Creswell, 2014; Fowler Jr,
2013) described as putting “meat on the bones” of “dry” quantitative findings.
4.2.2 Decisions in Choosing a Mixed Mode Method Design
After clarifying the reasons why this study chose to use the mixed research methods,
Bryman (2015); (Clark & Creswell, 2011; Creswell, 2014; Knight & Ruddock, 2009;
Tashakkori & Teddlie, 2010) strongly recommended four key decisions composed of
interaction, priority, timing, and mixing whereby this study chose one kind of mixed
methods design to guide this study in order to better answer those research questions.
As those examples given by Clark and Creswell (2011); (Creswell, 2014) to illustrate
what kind of study should pick up what kind of mixed methods design to be guided, this
study’s research problems and questions required a mixed methods design of the
quantitative and qualitative research methods being mixed before the final interpretation
which included a direct interaction between the quantitative and qualitative components
139
that mixed during the data collection in light of the sequential timing based upon a
quantitative priority in which a greater focus was placed upon the quantitative methods
and the qualitative methods were used as a supportive role.
With respect to the timing covering the whole process of the quantitative and
qualitative components not only the process of data collection, the sequential timing
occurred in this study when implementing to collect and analyse the quantitative data
first and then to employ the interviews to answer the qualitative research questions
designed by the quantitative results. In terms of the quantitative and qualitative
components mixing during data collection, Clark and Creswell (2011); (Creswell, 2014;
Greene, 2008) suggested using a strategy to connect where the results of the quantitative
component built on to the collection of the qualitative data such as this study gained the
quantitative results that would lead to the subsequent collection of qualitative data in a
second component.
Accordingly, this mixing connection occurred in this study between the quantitative
and qualitative in terms of using the results of the quantitative component to specify the
research questions, to select participants, to shape the collection of data, and to develop
the data collection protocols in the qualitative component.
4.2.3 Explanatory Sequential Mixed Mode Method
Some authors strongly suggested researchers to carefully pick up one typology-based
mixed mode method research design amongst the six major mixed methods inclusive of
a rigorous framework and persuasive logic to give a direction on the implementation of
the quantitative and qualitative research methods to ensure the resulting design would
be a high quality one.

140
The explanatory sequential mixed mode method design (displayed in Figure 4.1) was
employed in this study with two distinct interactive components where this study started
with the quantitative research component as the priority of collecting and analysing the
quantitative data in order to firstly give a general conclusion of this study’s research
problems and questions and this study then applied the subsequent qualitative research
component that was designed in light of the first quantitative component results to
develop the collected and analytical results to help to explain the initial quantitative
results in more detail.
Figure 4.1: Explanatory Sequential Mixed Mode Method
In terms of the name of the ‘explanatory sequential design’ mixed methods, the
second component of qualitative data which was “sequentially” produced following the
instructions made by the first component of quantitative data “explains” the initial
quantitative component results in greater detail.
Furthermore, with respect to the prototypical version of the explanatory sequential
mixed methods design, Morse, Tashakkori & Teddlie, Clark & Creswell, Fowler,
Creswell, and Bryman (2003), (2010), (2011), (2013), (2014), and (2015) claimed that
this study was a strong quantitative-orientated mixed methods research.
Quantitative
Data Collection
and Analysis
(QUAN)
Follow
up with
Qualitative
Data
Collection
and Analysis
(qual)
Interpretation
Source: Creswell (2014, p. 220)

141
However, they also reminded that the challenges for using the explanatory sequential
mixed methods were to identify and determine what kinds of quantitative results would
be further explored and explained by the second component, qualitative research in
order to better answer this study’s research questions.
4.2.4 Prototypical Characteristics of the Explanatory Sequential Design
The explanatory design was redefined as a qualitative follow-up approach on the
basis of the qualitative method as a second part or a follow-up tactic purposefully and
detailedly explaining the initial results that were produced by the quantitative method.
Furthermore, the purpose of the qualitative follow-up approach was to explicate
quantitative determinants (or nonsignificant predictors) and less representative or small
group of population values results by way of the qualitative data collected under guide
of the quantitative results to purposefully select the interviewees regarding their
characteristics.
In terms of this study not only assessed the relationships with quantitative data but
also explained the reasons or the details behind the quantitative results, the explanatory
sequential design should be the most suited on account of its typical paradigm
foundation changing and shifting from part one of postpositivist to part two of
constructivist in line with the development process of this study. Furthermore, these
research problems and objectives of this study were more quantitatively-oriented
(postpositivist orientations) and those important independent variables were ready to
measure the dependent variable by way of the questionnaire instrument and then assess
the quantitative data by the stepwise-method multiple regression engineered by SPSS.
However, the typical paradigm foundation of the explanatory sequential design asked
the researcher to change the earlier phase of postpositivist orientations into the
perspectives of constructivism while doing in-depth evaluations through interviews at

142
the second stage (the qualitative phase). In this way, the explanatory sequential design
required more time for a second round of collecting the qualitative data amongst the
earlier group of participants who did their quantitative surveys to answer the newly
qualitative questions that were developed in the light of the quantitative results and
couldn’t be settled by the previous data.
The explanatory sequential design had three main challenges as follows:
The way of implementing two parts of analyses (Quantitative & qualitative)
took much longer time
The way of selecting quantitative results (which was considered as designing
the objectives of the qualitative part for) i.e. picking up the significant results
and strong predictors
The way of selecting participants (interviewees) i.e. from the same earlier
groups of participants for the best explanations to the quantitative part and
even this whole research study with reference to the household’s socio-
economic characteristics’ differences and interviewees who varied on the key
determinants
At all events, the many strengths of the explanatory sequential design made this
mixed-method research study more focused on fulfilling this whole research objective
and more easily comprehended.
Thus, the explanatory sequential design’s two-stage structure by giving two
separated methods and collecting two separated data definitely gave more convenient
for those single researchers to implement instead of a research team. In the meanwhile,
a strong quantitative-orientated design not only made it more easily to write for
researchers, but also made it more easily understood for the readers.

143
4.2.5 Procedures of the Explanatory Sequential Design
Furthermore, the explanatory sequential design procedures (displayed in Figure 4.1)
about which Creswell (2014) gave more details in his book guided this research work.
Speaking of the explanatory sequential design, a lot of authors had something in
common saying that it was the most easy-understanding and typical comparing to other
mixed methods designs.
In terms of this study procedures customised by the explanatory sequential design, it
should start with the quantitative element (Quantitative part in Figure 4.2) in order to
answer the proposed (quantitative) research questions/to fulfil the expected
(quantitative) research objectives by means of the stepwise-method regression approach.
To achieve the results of the quantitative part firstly identified the samples by the
stratified random sampling and collected structured questionnaires and finally assessed
the data by descriptive statistics, correlation statistics, and stepwise-method multiple
regression analysis.
Moreover, the results of the quantitative part facilitated and redefined the selection of
interviewees amongst those earlier groups of participants for the qualitative part.
In terms of the qualitative part preparation which was about to give the direction of
the second part of the qualitative and further mixed analysis according to the qualitative
part counting on the quantitative results , firstly identified the determinants of each
phase of low-cost housing in Xuzhou city, wider interval and negative interval
indicating less representative and small group of population values, and the same
determinants of the three phases of low-cost housing, and secondly used these
quantitative results to further design the qualitative research questions and to determine
which interviewees were eligibly selected for the qualitative sample and to design
144
qualitative data collection protocols using individual in-depth interviews and telephone
follow-up interviews.
As for the qualitative part, it began with proposing the qualitative part by describing
the qualitative research questions/objectives based upon the quantitative results and
determining the thematic analysis as the qualitative approach to explore the
determinants within each phase and between the three phases of low-cost housing
projects.
Moreover, to fulfil the expected qualitative/mixed methods research objectives
intentionally selected a qualitative sample that could further facilitate to explain the
quantitative results at the beginning of implementing the qualitative part and collected
open-ended data that depended on the quantitative results and finally analysed the
qualitative data using procedures of theme development to get the results in order to
fulfil the expected (qualitative/mixed methods) research objectives.
In regard to the final stage of the interpretations, interpreted the quantitative results
firstly and interpreted the qualitative results then and further deeply explained the mixed
results and answered the mixed research questions with the support of the quantitative
and qualitative results. Moreover, it further discussed the mixed results with reference to
the integration of the quantitative and qualitative results to fulfil this research study’s
final purpose.
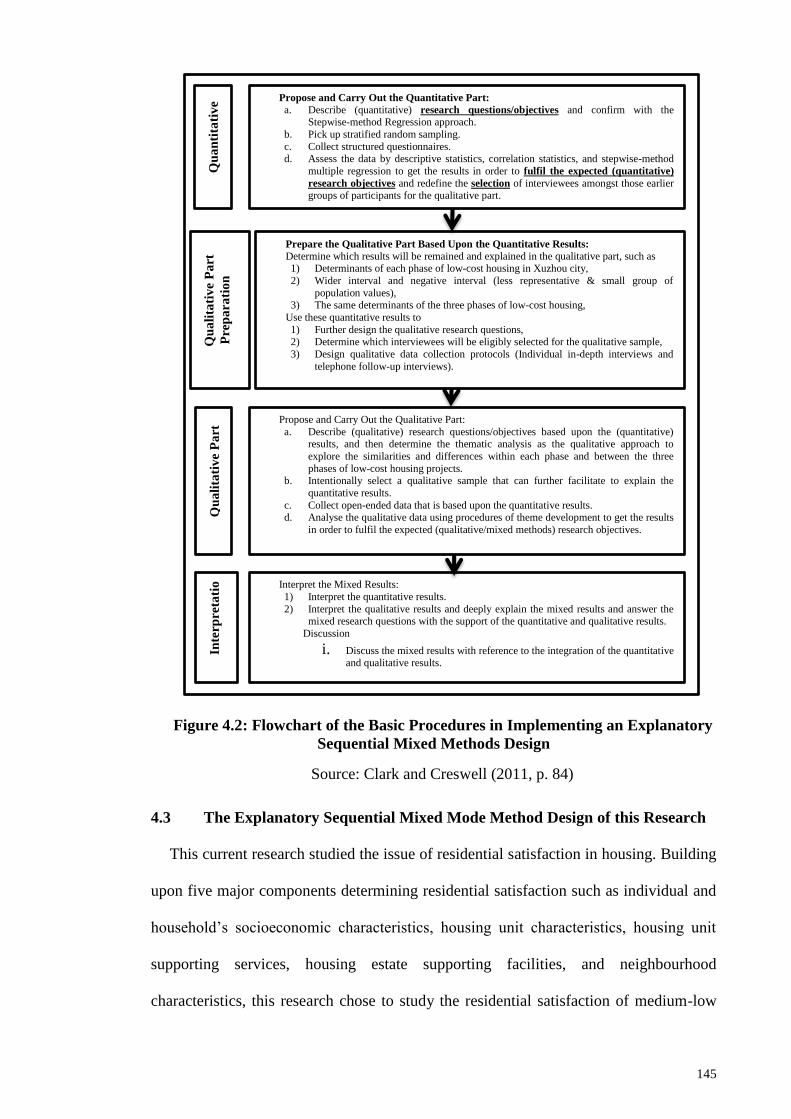
145
Figure 4.2: Flowchart of the Basic Procedures in Implementing an Explanatory
Sequential Mixed Methods Design
4.3 The Explanatory Sequential Mixed Mode Method Design of this Research
This current research studied the issue of residential satisfaction in housing. Building
upon five major components determining residential satisfaction such as individual and
household’s socioeconomic characteristics, housing unit characteristics, housing unit
supporting services, housing estate supporting facilities, and neighbourhood
characteristics, this research chose to study the residential satisfaction of medium-low
Propose and Carry Out the Quantitative Part:
a. Describe (quantitative) research questions/objectives and confirm with the Stepwise-method Regression approach.
b. Pick up stratified random sampling.
c. Collect structured questionnaires. d. Assess the data by descriptive statistics, correlation statistics, and stepwise-method
multiple regression to get the results in order to fulfil the expected (quantitative)
research objectives and redefine the selection of interviewees amongst those earlier groups of participants for the qualitative part.
Prepare the Qualitative Part Based Upon the Quantitative Results:
Determine which results will be remained and explained in the qualitative part, such as 1) Determinants of each phase of low-cost housing in Xuzhou city,
2) Wider interval and negative interval (less representative & small group of
population values), 3) The same determinants of the three phases of low-cost housing,
Use these quantitative results to
1) Further design the qualitative research questions,
2) Determine which interviewees will be eligibly selected for the qualitative sample,
3) Design qualitative data collection protocols (Individual in-depth interviews and
telephone follow-up interviews).
Propose and Carry Out the Qualitative Part:
a. Describe (qualitative) research questions/objectives based upon the (quantitative) results, and then determine the thematic analysis as the qualitative approach to
explore the similarities and differences within each phase and between the three
phases of low-cost housing projects. b. Intentionally select a qualitative sample that can further facilitate to explain the
quantitative results.
c. Collect open-ended data that is based upon the quantitative results. d. Analyse the qualitative data using procedures of theme development to get the results
in order to fulfil the expected (qualitative/mixed methods) research objectives.
Interpret the Mixed Results:
1) Interpret the quantitative results.
2) Interpret the qualitative results and deeply explain the mixed results and answer the mixed research questions with the support of the quantitative and qualitative results.
Discussion
i. Discuss the mixed results with reference to the integration of the quantitative and qualitative results.
Qu
an
tita
tiv
e
Pa
rt
Qu
ali
tati
ve P
art
Pre
pa
rati
on
Qu
ali
tati
ve
Pa
rt
In
terp
reta
tio
ns
Source: Clark and Creswell (2011, p. 84)
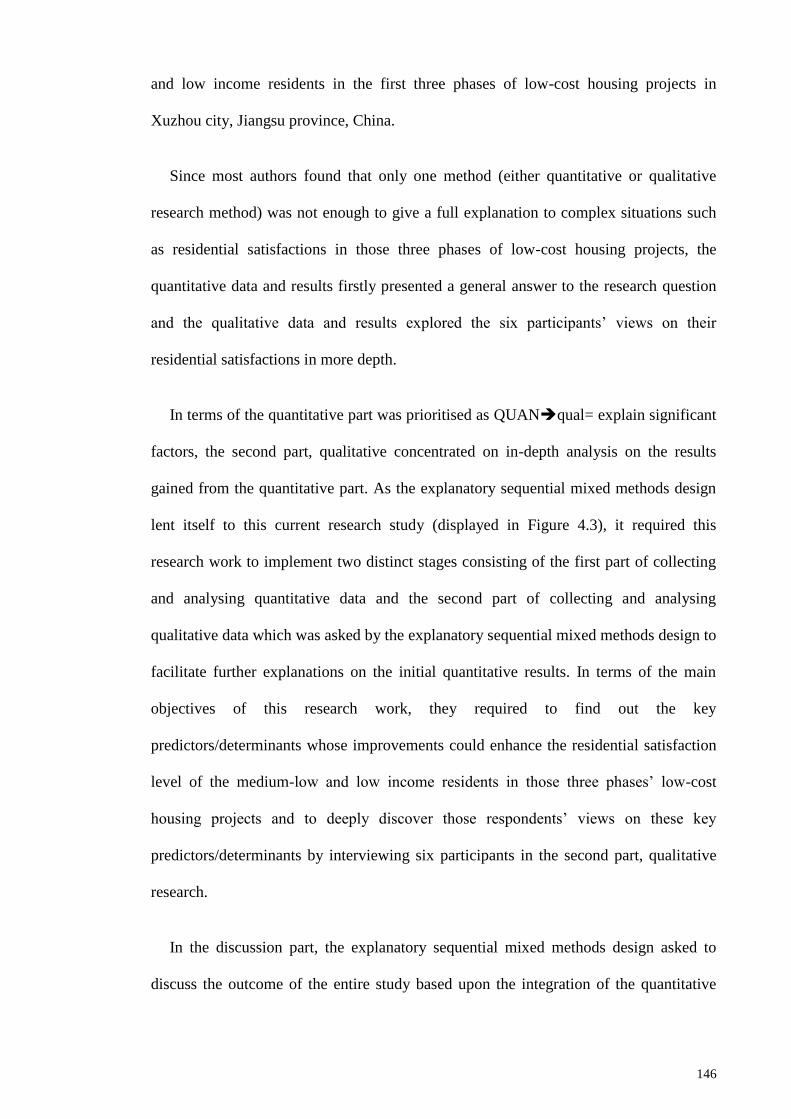
146
and low income residents in the first three phases of low-cost housing projects in
Xuzhou city, Jiangsu province, China.
Since most authors found that only one method (either quantitative or qualitative
research method) was not enough to give a full explanation to complex situations such
as residential satisfactions in those three phases of low-cost housing projects, the
quantitative data and results firstly presented a general answer to the research question
and the qualitative data and results explored the six participants’ views on their
residential satisfactions in more depth.
In terms of the quantitative part was prioritised as QUANqual= explain significant
factors, the second part, qualitative concentrated on in-depth analysis on the results
gained from the quantitative part. As the explanatory sequential mixed methods design
lent itself to this current research study (displayed in Figure 4.3), it required this
research work to implement two distinct stages consisting of the first part of collecting
and analysing quantitative data and the second part of collecting and analysing
qualitative data which was asked by the explanatory sequential mixed methods design to
facilitate further explanations on the initial quantitative results. In terms of the main
objectives of this research work, they required to find out the key
predictors/determinants whose improvements could enhance the residential satisfaction
level of the medium-low and low income residents in those three phases’ low-cost
housing projects and to deeply discover those respondents’ views on these key
predictors/determinants by interviewing six participants in the second part, qualitative
research.
In the discussion part, the explanatory sequential mixed methods design asked to
discuss the outcome of the entire study based upon the integration of the quantitative
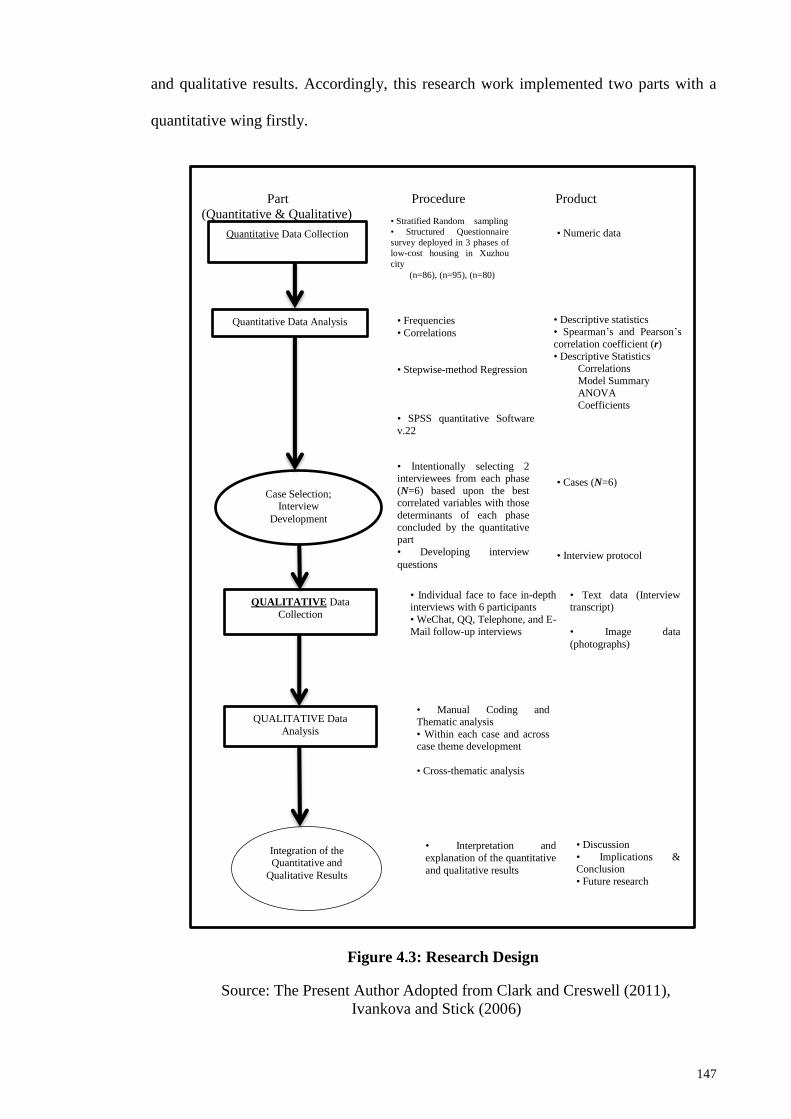
147
and qualitative results. Accordingly, this research work implemented two parts with a
quantitative wing firstly.
Figure 4.3: Research Design
Part Procedure Product
(Quantitative & Qualitative)
Quantitative Data Collection
• Stratified Random sampling
• Structured Questionnaire
survey deployed in 3 phases of
low-cost housing in Xuzhou
city
(n=86), (n=95), (n=80)
• Numeric data
Quantitative Data Analysis • Frequencies
• Correlations
• Stepwise-method Regression
• SPSS quantitative Software
v.22
• Descriptive statistics
• Spearman’s and Pearson’s
correlation coefficient (r)
• Descriptive Statistics Correlations
Model Summary
ANOVA Coefficients
Case Selection; Interview
Development
QUALITATIVE Data
Collection
• Intentionally selecting 2 interviewees from each phase
(N=6) based upon the best correlated variables with those
determinants of each phase
concluded by the quantitative part
• Developing interview
questions
• Cases (N=6)
• Interview protocol
QUALITATIVE Data
Analysis
Integration of the Quantitative and
Qualitative Results
• Individual face to face in-depth interviews with 6 participants
• WeChat, QQ, Telephone, and E-
Mail follow-up interviews
• Text data (Interview transcript)
• Image data
(photographs)
• Manual Coding and Thematic analysis
• Within each case and across case theme development
• Cross-thematic analysis
• Interpretation and
explanation of the quantitative
and qualitative results
• Discussion
• Implications & Conclusion
• Future research
Source: The Present Author Adopted from Clark and Creswell (2011),
Ivankova and Stick (2006)

148
4.4 Quantitative Phase
4.4.1 Participants
The target respondents in this study were all permanent residents who were living at
these three phases of low-cost housing projects in Xuzhou city. Those residents, who
had their permanent living rights, had already illegally rented out or sold their houses to
other people and they had rented better commodity houses outside (A lot of cases
happened, but only few cases were disclosed).
In terms of the criteria for selecting the participants, he or she was a permanent
resident living at a low-cost housing project at first and he or she was more cooperated
without any pressures based upon our country’s special circumstances.
In terms of the stratified random sampling which was strongly recommended by a lot
of authors (Bulsara, 2015; Huang & Du, 2015; Mertens et al., 2016; Mohit & Mahfoud,
2015; Xi & Hanif, 2016) being aimed at this sort of studies such as residential
satisfaction, neighbourhood cohesion, etc. to find samples for data collection, the local
residents of the three phases of low-cost houses in Xuzhou city were stratified in
accordance with blocks in order to make sure the sample could represent each block’s
condition. Accordingly, refer to their having 24 blocks of low-cost house units and
another 4 blocks of resettlement house units in Yangguang Huayuan (1st Phase of Low-
Cost House Project in Xuzhou city), every block of low-cost house units must be
involved in participants selection to ensure the residents had same opportunity to be
selected i.e. at least 3 households were selected from each block of low-cost house units
in Yangguang Huayuan.
By that analogy, at least 4 households were selected from each block of 22 blocks in
Chengshi Huayuan (2nd
Phase of Low-Cost House Project in Xuzhou city), and at least
3 households were selected from each block of 23 blocks of low-cost house units with

149
another 34 blocks of resettlement house units in Binhe Huayuan (3rd
Phase of Low-Cost
House Project in Xuzhou city). In addition, in the case of floor levels that all low-cost
housing projects in Xuzhou had a standard with 6 floors distributed as 1-2 (lower level),
3-4 (middle level), and 5-6 (upper level), the way of selecting the respondents mainly
came from the lower and upper levels followed the results from most previous studies
indicating that residents who lived at lower and upper levels felt dissatisfied with their
residential environment (Djebarni & Al-Abed, 2000; Ibem & Amole, 2013a, 2013b;
Mohit & Azim, 2012a, 2012b; Mohit et al., 2010; Mohit & Mahfoud, 2015; Mohit &
Nazyddah, 2011), in other words, floor level as a predictor affected residential
satisfaction to some extent.
4.4.2 Data Collection
4.4.2.1 Sample Sizes
Furthermore, in the light of the sample sizes on that most authors had reached an
agreement in a way to borrow the mathematical formula from Yamane 1967, who
explained how to probably calculate the numbers (Hamersma, Tillema, Sussman, &
Arts, 2014; Huang & Du, 2015; Ibem & Amole, 2014; Mohit & Mahfoud, 2015; Tao et
al., 2014; Xi & Hanif, 2016), a sample of 86 households (n=86) from 1st phase, a sample
of 95 households (n=95) from 2nd
phase, and a sample of 80 households (n=80) from 3rd
phase were selected from different total numbers of low-cost housing households living
in those three phases of low-cost housing projects with a total of 879 low-cost house
units (N=879) with other almost 200 resettlement house units of Yangguang Huayuan, a
total of 1189 low-cost house units (N=1189) of Chengshi Huayuan, and a total of 733
low-cost house units (N=733) with other almost 800 resettlement house units of Binhe
Huayuan.

150
Furthermore, each sample size represented 9.8%, 8%, and 10% of each total housing
population respectively with an assumed 90% confidence level denoting that the results
are guaranteed not to diverge more than 10% in 90 out of 100 repetitions of the survey.
Here is the equation.
𝑛 =𝑁
1 + 𝑁 × (𝒆)2
According to (Hamersma et al., 2014; Huang & Du, 2015; Ibem & Amole, 2014;
Mohit & Mahfoud, 2015; Tao et al., 2014; Xi & Hanif, 2016)’s publications, they
defined “n” is the sample size of the selected household, “N” is the total number of
households in each phase, and “e” is the acceptable sampling error which is normally
0.1.
4.4.2.2 Structured Questionnaires
The reason why using a structured questionnaire and interview to get a great deal of
information from the respondents was because most authors considered this type of
collecting data from the medium-low and low income residents was most efficient than
other ways particularly in China as China’s local media was not very keen on
investigating the details of residents’ lives in low-cost housing projects and the
municipal government only managed those low-cost housing projects from macroscopic
aspect, and the most important reason was that the residents who were living in those
low-cost housing projects were medium-low and low income groups showing very low
interests and motivations when being interviewed and confidently believing that they
had already been ignored by the local government and any forms of interviews with
questionnaires were not worth trying (Hamersma et al., 2014; Huang & Du, 2015; Ibem
& Amole, 2014; Mohit & Mahfoud, 2015; Tao et al., 2014; Xi & Hanif, 2016).

151
Furthermore, this research developed and managed a structured survey to
interviewees that measured 47 predictor variables (see p.358-365 & p.366-368)
constructed by individual and household’s socio-economic characteristics and
residential environment part consisting of four components named HUC, HUSS, HESF,
and NC to determine the level of residential satisfactions of the inhabitants living in
those three phases of low-cost housing projects.
Moreover, the individual and household’s socio-economic characteristics contained
gender, age, educational attainment, marital status, household size, occupation sector,
occupation type, household’s monthly net income, floor level, length of residence, and
main means of transportation.
In this current research, the level of housing satisfaction were measured by using a 5
point Likert scale, i.e. “1” = very dissatisfied; “2” = dissatisfied; “3” = slightly satisfied;
“4” = satisfied; “5” = very satisfied. Those 36 variables came from residential
components would calculate the residential satisfaction index according to Onibokun,
Mohit et al. and Mohit & Mahfoud’s (1974), (2010) and (2015) formulas (see Equation
4.1). The RSI (Residential Satisfaction Index) of an inhabitant living at low-cost
housing with one residential component displayed as a percentage which was calculated
by the sum of the inhabitant’s real scores about one component divided by the
maximum scores of this component. Here is the equation.
𝑅𝑆𝐼𝐶 =∑ 𝑦𝑖
𝑁𝑖=1
∑ 𝑌𝑖𝑁𝑖=1
× 100 (Equation 4.1) (Onibokun, 1974, p. 192) and (Mohit et al.,
2010, p. 22)
Where RSIc is the Residential Satisfaction Index of an inhabitant with one
Residential Component; C implies one of the four residential components; N refers to
the number of variables selected for scaling under C; yi refers to the real score by an

152
inhabitant on the “i”th
variable; Yi implies the maximum possible score that variable “i”
could have.
Furthermore, the overall residential satisfaction of an inhabitant living at low-cost
housing displayed as a percentage which was calculated by the sum of the inhabitant’s
real scores about all four residential components divided by the maximum scores of all
components.
Here is the equation.
𝑅𝑆𝐼4𝑐 =∑ ℎ𝑖+∑ 𝑠𝑖+
𝑁2𝑖=1
∑ 𝑓𝑖𝑁3𝑖=1
𝑁1𝑖=1 +∑ 𝑛𝑖
𝑁4𝑖=1
∑ 𝐻𝑖+𝑁1𝑖=1
∑ 𝑆𝑖+𝑁2𝑖=1
∑ 𝐹𝑖+∑ 𝑁𝑖𝑁4𝑖=1
𝑁3𝑖=1
× 100 (Equation 4.2)
Where RSI4c is the residential satisfaction index of an inhabitant with the overall
residential environment (four components); N1, N2, N3 and N4 refer to the number of
variables selected for scaling under each component of residential environment, while hi,
si, fi, and ni represent the real score by an inhabitant on the “i”th
variable in the
component; Hi, Si, Fi, and Ni imply the maximum possible scores that variable “i” could
have in the Housing unit characteristics, housing unit supporting Services, housing
estate supporting Facilities and Neighbourhood characteristics, respectively.
In addition, these 47 variables (36 variables from residential components plus 11
variables from individual background) were used as independent variables to find out
the determinants which predicting each phase’s residential satisfaction.
The data collection from participants face to face took place at those three phases of
low-cost housing projects between April 12th
and June 20th
, 2014. The questionnaires
were printed in Chinese and the survey was conducted by Chinese.

153
4.4.3 Data Analysis
The responding residents, who came from those three phases of low-cost housing
projects, put their thoughts on these questionnaires and the assessments of residential
satisfaction were measured respectively and analysed and compared together.
Afterwards, to fulfil the quantitative objectives applied SPSS quantitative software
v.22 to analyse the collected data from three phases and then got the first set of result
came from the descriptive statistics of respondents’ individual and household’s socio-
economic characteristics of three separated phases of low-cost housing projects and
compared with each other.
With regard to the correlations between each phase of respondents’ individual and
household’s socio-economic characteristics and each phase of four components’
satisfaction indices and the total of residential satisfaction index, this research applied
correlation analysis with Spearman’s and Pearson’s correlation coefficient (r) on the
collected data to find out more details in these three separated phases of low-cost
housing projects.
In addition to the frequencies and correlations, the most important analysis upon here
which was applied to determine the key predictors of each phase of low-cost housing
project was the stepwise-method regression.
4.4.3.1 Method of Regression
Hierarchical (blockwise entry) (a)
Field (2009, 2013) found that predictors are selected based upon past research in
hierarchical regression and the order of entering the predictors into the model is decided
by the experimenter in accordance to known predictors (from past research) being firstly
entered into the model in order of their importance in predicting the outcome and then

154
any new predictors can be added into the model by either all in one go in one of
stepwise methods or in hierarchical manner, i.e. the new predictor which is considered
to be the most important is entered firstly.
Forced entry (b)
Forced entry (mentioned in SPSS as Enter) is a method like hierarchical method
depending on good theoretical models for selecting predictors and forces all predictors
to be entered into the model simultaneously, but what’s the difference from the
hierarchical method is no order of variables’ entering (Field, 2009). What’s more, Field
(2009, 2013) agreed with some researchers on that this method is the only appropriate
method for theory testing.
Stepwise methods vs. Hierarchical and Forced entry methods (c)
Field (2009, 2013) criticized that comparing with stepwise methods being influenced
by random variation in the data which results in rarely giving replicable results if the
model is retested, hierarchical and forced entry methods of regression could take
advantage of random sampling variation to derive the slight differences in variables’
semi-partial correlation deciding on which predictors should be included, however,
these slight statistical differences might contrast significantly with the theoretical
importance of a predictor to the model and also could result in the danger of over-fitting
(having too many variables in the model that essentially make little contribution to
predicting the outcome) and under-fitting (leaving out important predictors) the model.
Consequently, for this reason stepwise methods are best avoided. In addition, the
forward, backward and stepwise methods all come under the general heading of
stepwise methods, because stepwise methods counted on the computer selecting
variables dependent on a purely mathematical criterion (Field, 2009).

155
Furthermore, as the model based upon what past research told was from a sound
theoretical literature available, Field (2009, 2013) suggested to apply SPSS stepwise
methods to predicting the outcome (dependent variable) based on the selected
meaningful variables (independent variables) in the model.
Stepwise methods (d)
i Forward method
The forward method is defined that searches for the predictor out of the available
variables that best predicts the dependent variable by selecting the highest simple
correlation with the dependent variable (Field, 2009).
Simply put, if the first predictor can explain 40% of the variation in the dependent
variable, there is still 60% left unexplained. Next step, the computer, which is not
interested in the 40% that has been already explained, searches for the second predictor
that can explain the biggest part of the remaining 60% by selecting the variable with the
largest semi-partial correlation with the outcome from measuring of each remaining
predictor that can explain how much new variance in the dependent variable as the
criterion (Field, 2009).
Moreover, as the predictor is proved that significantly contributes to the predictive
power of the model by explaining the most new variance is added to the model, it is
retained and another predictor is considered.
ii Backward method
Field (2009, 2013) claimed that the backward method is the opposite of the forward
method by virtue of the computer begins by placing all predictors in the model and then

156
calculating the contribution of each one in accordance with the significance value of the
t-test for each predictor.
In addition, if a predictor meets the removal criterion which is made of either an
absolute value of the test statistic or a probability value for that test statistic, in other
words, if it is not making a statistically significant contribution to how well the model
predicts the dependent variable, this predictor is removed from the model and then the
model is re-estimated for the remaining predictors and the contribution of the remaining
predictors needs to be reassessed as well (Field, 2009).
iii Stepwise method
As forward selection based upon that one predictor significantly improves the ability
of the model to predict the outcome, then this predictor is retained in the model and the
computer searches for a second predictor according to whose semi-partial correlation
with the dependent variable is the largest in the remaining predictors, Z. G. Li and Wu
(2013) fully agreed with Field (2009, 2013) on that forward selection is more likely than
backward elimination to exclude predictors and Z. G. Li and Wu (2013) published their
journal regarding residential satisfaction in China’s informal settlements by using
“forward” stepwise regression in SPSS with the purpose of decreasing the impacts of
data collinearity by starting with no predictors and then adding them in order of
significance in order to eventually identify the significant predictors as the
“determinants” of the regression.
Nevertheless, the recent authors such as Tao et al. (2014), Huang and Du (2015),
Mohit and Mahfoud (2015), Cui et al. (2016), Galster and Hesser (2016), Xi and Hanif
(2016) published their journals regarding residential satisfaction in housing by using the
stepwise method selection. Those authors verified what Field’s (2009) comments were
157
correct about the stepwise method in SPSS not only having the advantage of what the
forward method had, the stepwise method also having the regression equation
constantly reassessed to see whether any redundant predictors could be removed when
each time a predictor was added to the equation, a removal test was made of the least
useful predictor. Thus, the stepwise method regression is the most suitable for this
research.
Accordingly, with reference to the conceptual model concluded in the chapter 2, the
stepwise-method regression based upon the figures from descriptive statistics,
correlations, model summary, ANOVA, and coefficients fulfilled the final objective of
quantitative phase to identify the key predictors of each phase of low-cost housing
project to determine its residential satisfaction such as the 14 determinants of 1st phase,
the 12 key predictors of 2nd
phase, and the 13 mostly significant variables of 3rd
phase.
4.5 Qualitative Phase
4.5.1 Case Selection
Before the second, qualitative phase was carried out, the first, quantitative phase had
been completed. And then the process of case selection for the in-depth interview
mainly depended upon the quantitative results especially those key
predictors/determinants of each phase of low-cost housing produced by the stepwise-
method regression.
Using the quantitative results of the inclusions of determinants and other variables
best correlated to the determinants concluded at p.446-459 indicating the comparisons
between the three phases of low-cost housing, within the earlier groups of participants
in answering the questionnaires, this research intentionally identified and selected 6
interviewees (2 per phase of low-cost housing) fulfilled with the requirements from
determinants in terms of the respondents’ individual and household’s socio-economic

158
characteristics and implemented 6 in-depth interviews regarding their personal
experiences in living at these three phases of low-cost housing and their personal views
about the current and future plan of low-cost housing. Two females and four males
agreed to participate.
4.5.2 Interview Questions Development
With regard to the main objective of the qualitative part was to explore the results
generated by the stepwise regression analysis, the content of the interview questions
was circling round the quantitative results from the first part to facilitate this research in
deeply understanding the similarities and differences amongst the six participants
regarding their residential satisfactions (qualitative questionnaire, see p.366-373).
There were five open-ended questions more focused upon the quantitative results
which actually covered the five components including individual and household’s socio-
economic characteristics, housing unit characteristics, housing unit supporting services,
housing estate supporting facilities, and neighbourhood characteristics to significantly
affect residential satisfaction.
There was one more open-ended question which was not a part of the quantitative
results might have affected inhabitants’ housing satisfactions such as the six
participants’ considerations on how to enhance the residential satisfaction of Xuzhou’s
current and future low-cost housing.
4.5.3 Data Collection and Analysis
The way of data collection for the qualitative part was suggest by a lot of authors
(Babbitt, Burbach, & Pennisi, 2015; Bryman, 2015; Bulsara, 2015; Creswell, 2014;
Mertens et al., 2016) that it used direct and indirect ways such as 1-on-1 face to face
interviews with a manual protocol as a very popular direct way to better explore those

159
key predictors/determinants mentioned in the quantitative results and social networking
software like WeChat and QQ, telephone, and e-mails as many familiar indirect-ways to
collect qualitative data in China. The data collection from participants face to face took
place at those three phases of low-cost housing projects during June to July of 2015.
The questionnaires were printed in Chinese and the interviews were conducted by
Chinese.
The qualitative analysis used a manual coding and thematic analysis to develop the
themes within case and across cases and used the cross thematic analysis to find out the
similarities and differences between the six participants.
4.6 Conclusion
In a word, the reason why this study chose to mix quantitative and qualitative
methods was concluded as the research problems and questions had already decided the
mixed methods research design. At this point, the illustration gave further conclusions
on the complementarity and explanation that using qualitative data to further help
explain, elaborate, enhance, clarify, and illustrate the quantitative findings.
The explanatory sequential mixed mode method design was employed in this study
with two distinct interactive components where this study started with the quantitative
research component as the priority of collecting and analysing the quantitative data in
order to firstly give a general conclusion of this study’s research questions and this
study then applied the subsequent qualitative research component that was designed in
light of the first quantitative component results to develop the collected and analytical
results to help to explain the initial quantitative results in more detail.
Followed by the research design, the quantitative part was concluded by the
stepwise-method regression based upon the figures from descriptive statistics,
correlations, model summary, ANOVA, and coefficients fulfilled the final objective of

160
quantitative phase to identify the key predictors of each phase of low-cost housing
project to determine its residential satisfaction such as the 14 determinants of 1st phase,
the 12 key predictors of 2nd
phase, and the 13 mostly significant variables of 3rd
phase.
In addition, the qualitative part was concluded by a manual coding and thematic
analysis to develop the themes within case and across cases. The conclusion of
qualitative part would be drawn by the cross thematic analysis to find out the
similarities and differences between the six participants from Xuzhou’s three phases of
low-cost housing projects.
161
QUANTITATIVE RESULTS CHAPTER 5:
5.1 Introduction
This chapter began with the explanations of the validities of three models. Then, the
result of quantitative part would be explained in terms of the comparisons of
respondents’ individual and household’s socio-economic characteristics between the
three phases and residential satisfaction. Regarding the residential satisfaction, the
research questions would be answered roughly in terms of the comparisons of four
elements’ satisfactions and residential satisfactions and the determinants of residential
satisfaction indices between the three phases.
5.2 Interpreting Multiple Regression
“…Things to note are: (1) I have rounded off to 2 decimal places throughout
(3 decimal places also can be accepted); (2) for the standardized betas there is
no zero before the decimal point (because these values cannot exceed 1) but for
all other values less than 1 the zero is present; (3) the significance of the
variable is denoted by an asterisk with a footnote to indicate the significance
level being used (if there is more than one level of significance being used you
can denote this with multiple asterisks, such as *p < .05, **p < .01, and ***p <
.001); and (4) the R2 for the initial model and the change in R
2 (denoted as ∆R
2)
for each subsequent step of the model are reported below the table” (Field,
2009, p. 252).
The result of interpreting multiple-regression was concluded at p.377-445.
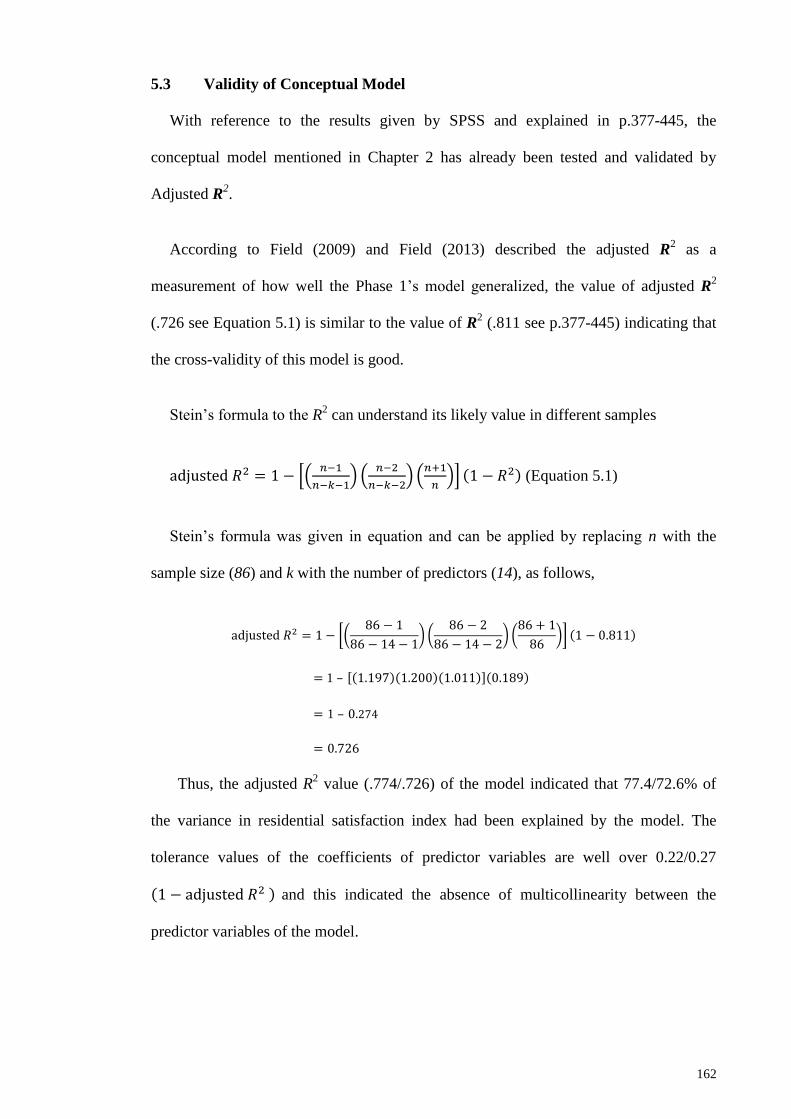
162
5.3 Validity of Conceptual Model
With reference to the results given by SPSS and explained in p.377-445, the
conceptual model mentioned in Chapter 2 has already been tested and validated by
Adjusted R2.
According to Field (2009) and Field (2013) described the adjusted R2 as a
measurement of how well the Phase 1’s model generalized, the value of adjusted R2
(.726 see Equation 5.1) is similar to the value of R2 (.811 see p.377-445) indicating that
the cross-validity of this model is good.
Stein’s formula to the R2 can understand its likely value in different samples
adjusted 𝑅2 = 1 − [(𝑛−1
𝑛−𝑘−1) (
𝑛−2
𝑛−𝑘−2) (
𝑛+1
𝑛)] (1 − 𝑅2) (Equation 5.1)
Stein’s formula was given in equation and can be applied by replacing n with the
sample size (86) and k with the number of predictors (14), as follows,
adjusted 𝑅2 = 1 − [(86 − 1
86 − 14 − 1) (
86 − 2
86 − 14 − 2) (
86 + 1
86)] (1 − 0.811)
= 1 – [(1.197)(1.200)(1.011)](0.189)
= 1 – 0.274
= 0.726
Thus, the adjusted R2 value (.774/.726) of the model indicated that 77.4/72.6% of
the variance in residential satisfaction index had been explained by the model. The
tolerance values of the coefficients of predictor variables are well over 0.22/0.27
(1 − adjusted 𝑅2 ) and this indicated the absence of multicollinearity between the
predictor variables of the model.
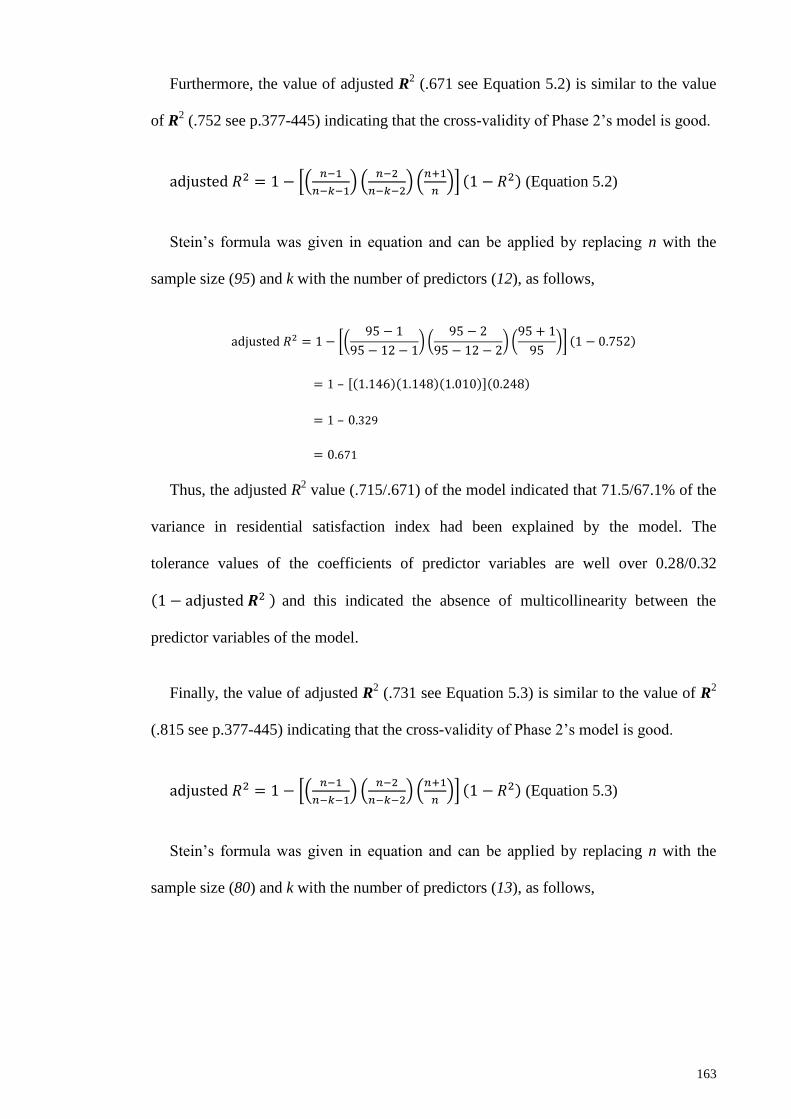
163
Furthermore, the value of adjusted R2 (.671 see Equation 5.2) is similar to the value
of R2 (.752 see p.377-445) indicating that the cross-validity of Phase 2’s model is good.
adjusted 𝑅2 = 1 − [(𝑛−1
𝑛−𝑘−1) (
𝑛−2
𝑛−𝑘−2) (
𝑛+1
𝑛)] (1 − 𝑅2) (Equation 5.2)
Stein’s formula was given in equation and can be applied by replacing n with the
sample size (95) and k with the number of predictors (12), as follows,
adjusted 𝑅2 = 1 − [(95 − 1
95 − 12 − 1) (
95 − 2
95 − 12 − 2) (
95 + 1
95)] (1 − 0.752)
= 1 – [(1.146)(1.148)(1.010)](0.248)
= 1 – 0.329
= 0.671
Thus, the adjusted R2 value (.715/.671) of the model indicated that 71.5/67.1% of the
variance in residential satisfaction index had been explained by the model. The
tolerance values of the coefficients of predictor variables are well over 0.28/0.32
(1 − adjusted 𝑹2 ) and this indicated the absence of multicollinearity between the
predictor variables of the model.
Finally, the value of adjusted R2 (.731 see Equation 5.3) is similar to the value of R
2
(.815 see p.377-445) indicating that the cross-validity of Phase 2’s model is good.
adjusted 𝑅2 = 1 − [(𝑛−1
𝑛−𝑘−1) (
𝑛−2
𝑛−𝑘−2) (
𝑛+1
𝑛)] (1 − 𝑅2) (Equation 5.3)
Stein’s formula was given in equation and can be applied by replacing n with the
sample size (80) and k with the number of predictors (13), as follows,

164
adjusted 𝑅2 = 1 − [(80 − 1
80 − 13 − 1) (
80 − 2
80 − 13 − 2) (
80 + 1
80)] (1 − 0.815)
= 1 – [(1.197)(1.2)(1.013)](0.185)
= 1 – 0.269
= 0.731
Thus, the adjusted R2 value (.779/.731) of the model indicated that 77.9/73.1% of the
variance in residential satisfaction index had been explained by the model. The
tolerance values of the coefficients of predictor variables are well over 0.22/0.26
(1 − adjusted 𝑹2 ) and this indicated the absence of multicollinearity between the
predictor variables of the model.
5.4 The Comparisons of Respondents’ IHSC between the Three Phases
The individual and household’s characteristics of respondents from Xuzhou’s three
phases of low-cost housing were displayed in Table 5.1.
First of all, speaking of the each factor from Table 5.1, it was mostly appeared in a
lot of studies on medium-low or low-income inhabitants living at low-cost housing. In
respect of the results illustrated in Table 5.1, they indicated that the respondents in three
phases of low-cost housing chose the same option from each of factors such as gender,
marital status, household size, and occupation sector. For instance, amongst respondents
from phase one to phase three of low-cost housing, it apparently presents that they were
all dominantly by male (59.3% comparing to 40.7% female, 69.5% comparing to 30.5%
female, and 65.0% comparing to 35.0% female, respectively). Referring to marital
status and household size, most of respondents coming from three phases were married
(86%, 92.6%, and 65%, respectively) with 3 people in one family (54.7%, 60%, and
58.8%, respectively) and with 2 people in one family more or less the same in their
responses (33.7%, 37.9%, and 25.0%, respectively) comparing to no respondent with 5
people and above in their family across the three phases and the minor percentage taken

165
by one family with 1 people in all three residential areas indicating 8.1%, 2.1%, and
11.3% and only 3.5% and 5% of respondents from phase 1 and 3 had 4 people in one
family with zero percentage from phase 2.
Moreover, in regard of occupation sector, the great majority of the respondents were
working in private business sector (58.1%, 52.6%, and 60.0%, correspondingly)
comparing to the very low percentage of the respondents’ working in the government
(4.7%, 3.2%, and 0.0%, respectively). The rest of numbers of respondents across these
three phases were almost distributed on average by working in the State-Owned
Enterprise SOE (18.6%, 13.7%, and 18.8% respectively) and in the Collective-Owned
Enterprise COE (14.0%, 27.4%, and 17.5%). However, only a tiny minority of
respondents who had their own business took 4.7%, 3.2%, and 3.8% respectively.
In regard to age, a high proportion of respondents in phase 2 and 3 were between age
51 and 60 (29.5% and 30.0%) followed by phase 1 (26.7%), while the majority of the
respondents in phase 1 were between age 41 and 50 (38.4%) followed by phase 2
(28.4%). In terms of the age group of above 60, the respondents from phase 3 had a
large amount (27.5%) followed by phase 2 (23.2%) and phase 1 (15.1%). In addition,
the proportion of respondents from two age groups of 31-40 and 21-30 had almost the
same percentages’ distribution across the three phases.
In view of educational attainment, the respondents living in these three phases of
low-cost housing shared some similarities in the great number of residents with junior
and senior middle school education background (61.7%, 42.1%, and 47.6%,
respectively). On the other hand, the highest education level of the respondents with
diploma (32.6%) was living in phase 2. Not surprisingly, the number of respondents
with higher level of education background such as bachelor degree or master degree or
even higher were relatively low at 9.3%, 10.6%, and 7.6%, respectively.

166
Accordingly, it was straightforward to reflect on their occupation type which they
chose for making a living. In terms of the above-mentioned occupation sector that the
respondents were mostly working in private (business) sector, the numbers of
occupation type displayed in Table 5.1 indicated that most of the respondents (39.5%,
38.9%, and 33.8%, respectively) were employed to do services or operation that were
considered as the very basic and repetitive jobs in Chinese occupation type of
segmentation. In addition to that, the occupation type of others such as some jobs paid
by daily-settlement (no fixed contract), retired, and laid-off/unemployed comprised a
relatively high proportion (27.9%, 41.1%, and 37.5%, respectively) of the respondents’
employment status at the same time. On the contrary, the smallest numbers (9.3%,
2.1%, and 12.5%, respectively) of respondents were employed to do management or
professional jobs and the numbers (23.3%, 17.9%, and 16.3%, respectively) of the
respondents doing as a technical & administrative support had a bit higher than the
numbers of the respondents doing management or professional works.
In this manner, the factors of educational attainment, occupation sector and
occupation type comparatively affect the residents’ monthly net income of their families
at certain degree, for example, what a comparatively large percentage of the respondents
(36.0%) of phase 1 earned monthly net income of their households is between RMB
2,000 (US$294) and 3,999 (US$588), followed by 31.4% whose monthly net incomes
were between 4,000 (US$588) and 5,999 (US$882).
In the meantime, majority of the respondents (58.9% and 58.8%) of phase 2 and 3
also made between 4,000 (US$588) and 5,999 (US$882) of monthly income of each of
their family. In addition to the two ranges from RMB 2,000 to RMB 3,999 and from
RMB 4,000 to RMB 5,999, certain proportions of respondents (19.8%, 23.2%, and
167
16.3%, respectively) earned monthly net income between RMB 6,000 (US$882) and
RMB 7,999 (US$1,176).
In contrast, the proportions of the highest monthly income in these respondents
(0.0%, 2.1%, and 0.0%, respectively) across the three phases were hardly to see. In
addition, the proportions of the lowest monthly income in phase 2 and 3 were very low
in the same manner (1.1% and 2.5%). However, in phase 1, there still had 12.8% of
residents with the lowest monthly income, i.e. RMB 0 and 1,999 (US$294).
With reference to the factor of main means of transportation, based upon the results
of the age, occupation sector and type, and monthly income given by the respondents
across the three phases, it is not hard to see that the residents mainly relied on using bus
and riding bicycle as their main means of transportations.
Furthermore, the majority of the respondents (58.1% and 46.3%) from phase 1 and 2
went outside by bus, while the majority of those (51.6%) in phase 2 went outside by
cycling, followed by 34.7% who went outside by bus as well. Likewise, the percentages
(36.0% and 38.8%) of going outside by cycling were more enough in phases 1 and 2.
In contrast, it (Table 5.1) was reported that most of respondents were not afford to
buy and to use cars as their main means of transportation (4.7%, 2.1%, and 1.3%,
respectively) to go outside throughout the three phases. Moreover, very few of residents
(1.2%) from phase 1 chose to go outside by foot, while the certain proportions of
residents (11.6% and 13.8%) from phase 2 and 3 preferred to walk on foot. In respect of
the fair result that has been achieved by nearly covering the respondents who were
living in all floor levels from all of block units, Table 5.1 showed that the proportion of
floor levels were almost distributed on average with a bit difference in which the larger
percentages of respondents from phase 1 living on the 5th
and 6th
floor (24.4% and

168
24.4%), the bigger group of respondents from phase 2 living on the 5th
floor (24.2%),
while the bigger proportion of respondents from phase 3 staying on the 1st floor
(23.8%). In terms of length of residence, it is along with when they were moving into
their new houses since the three projects completed in different periods.
Thus, the majority of residents in each project had been living more than 7 years, but
less than 9 years (90.7%), more than 5 years, but less than 7 years (82.1%), and more
than 3 years, but less than 5 years (88.8%).

169
Table 5.1: The Comparisons of Respondents' IHSC between the Three Phases
3 Phases of Low-cost housing Phase 1
(Yangguang Huayuan)
Phase 2
(Chengshi Huayuan)
Phase 3
(Binhe Huayuan)
Individual and Household characteristics n = 86 (%) n = 95 (%) n = 80 (%)
Gender
Male 51 (59.3) 66 (69.5) 52 (65.0)
Female 35 (40.7) 29 (30.5) 28 (35.0)
Age
Age21-30 7 (8.1) 8 (8.4) 3 (3.8)
Age31-40 10 (11.6) 10 (10.5) 16 (20.0)
Age41-50 33 (38.4) 27 (28.4) 15 (18.8)
Age51-60 23 (26.7) 28 (29.5) 24 (30.0)
Above Age60 13 (15.1) 22 (23.2) 22 (27.5)
Educational attainment
Primary School 7 (8.1) 14 (14.7) 17 (21.3)
Junior Middle School 20 (23.3) 21 (22.1) 17 (21.3)
Senior Middle School 33 (38.4) 19 (20.0) 21 (26.3)
Diploma 18 (20.9) 31 (32.6) 19 (23.8)
Bachelor Degree 7 (7.0) 7 (7.4) 5 (6.3)
Master Degree and above 2 (2.3) 3 (3.2) 1 (1.3)
Marital status
Single 6 (7.0) 5 (5.3) 1 (1.3)
Married 74 (86.0) 88 (92.6) 65 (81.3)
Widowed/Divorced 6 (7.0) 2 (2.1) 14 (17.5)
Household size
1 people 7 (8.1) 2 (2.1) 9 (11.3)
2 people 29 (33.7) 36 (37.9) 20 (25.0)
3 people 47 (54.7) 57 (60.0) 47 (58.8)
4 people 3 (3.5) 0 (0.0) 4 (5.0)
5 people and above 0 (0.0) 0 (0.0) 0 (0.0)
Occupation sector
Government 4 (4.7) 3 (3.2) 0 (0.0)
State-Owned Enterprise (SOE) 16 (18.6) 13 (13.7) 15 (18.8)
Collective-Owned Enterprise (COE) 12 (14.0) 26 (27.4) 14 (17.5)
Private business 50 (58.1) 50 (52.6) 48 (60.0)
Own business 4 (4.7) 3 (3.2) 3 (3.8)
Occupation type
Management & Professional 8 (9.3) 2 (2.1) 10 (12.5)
Technical & Administrative Support 20 (23.3) 17 (17.9) 13 (16.3)
Services & Operation 34 (39.5) 37 (38.9) 27 (33.8)
Others 24 (27.9) 39 (41.1) 30 (37.5)
Monthly net income of Household
RMB0 - 1,999 11 (12.8) 1 (1.1) 2 (2.5)
RMB2,000 - 3,999 31 (36.0) 14 (14.7) 18 (22.5)
RMB4,000 - 5,999 27 (31.4) 56 (58.9) 47 (58.8)
RMB6,000 - 7,999 17 (19.8) 22 (23.2) 13 (16.3)
Above RMB8,000 0 (0.0) 2 (2.1) 0 (0.0)
Floor level
1stFloor 10 (11.6) 11 (11.6) 19 (23.8)
2ndFloor 8 (9.3) 15 (15.8) 14 (17.5)
3rdFloor 11 (12.8) 18 (18.9) 16 (20.0)
4thFloor 15 (17.4) 11 (11.6) 11 (13.8)
5thFloor 21 (24.4) 23 (24.2) 13 (16.3)
6thFloor 21 (24.4) 17 (17.9) 7 (8.8)

170
Table 5.1, continued
3 Phases of Low-cost housing Phase 1 (Yangguang
Huayuan)
Phase 2 (Chengshi
Huayuan)
Phase 3
(Binhe Huayuan)
Individual and Household characteristics n = 86 (%) n = 95 (%) n = 80 (%)
Length of Residence
<=3 years 0 (0.0) 0 (0.0) 7 (8.8)
>3, <=5 years 0 (0.0) 17 (17.9) 71 (88.8)
>5, <=7 years 8 (9.3) 78 (82.1) 2 (2.5)
>7, <=9 years 78 (90.7) 0 (0.0) 0 (0.0)
Main Means of Transportation
By Cycling (Electric Bicycle/Bicycle) 31 (36.0) 49 (51.6) 31 (38.8)
By Driving 4 (4.7) 2 (2.1) 1 (1.3)
By Bus 50 (58.1) 33 (34.7) 37 (46.3)
By Foot 1 (1.2) 11 (11.6) 11 (13.8)
Source: Field Survey (2014-2015)
5.5 Residential Satisfaction
5.5.1 The Comparisons of Four Elements’ Satisfactions and RS between the
Three Phases
There were 36 variables displayed in Table 5.2 determining the levels of four
elements satisfactions which to further influence the overall residential satisfactions
throughout the three phases of low-cost housing.
In terms of the last three lines of Table 5.2 displaying those three phases of
respondents’ levels of satisfactions with residential environment, the respondents of
Yangguang Huayuan (Phase 1) whose average residential satisfaction was 64.397%
[which was perceived as the moderate level of satisfaction due to the proportion of
respondents with moderate level of satisfaction was large (87.2%)] had almost the same
answer with the respondents of Binhe Huayuan (Phase 3) whose average residential
satisfaction was 62.845% [the proportion of respondents with moderate level of
satisfaction was quite big (77.5%)].

171
However, the respondents of Chengshi Huayuan (Phase 2) were dissatisfied
[56.947% which was perceived as the low level of satisfaction due to the proportion of
respondents with low level of satisfaction was large (87.4%)] with their overall
residential environment.
In terms of the four elements’ satisfactions which determine the overall residential
satisfaction, the respondents of Yangguang Huayuan, Chengshi Huayuan, and Binhe
Huayuan shared some similarities in evaluating the satisfaction of housing unit
characteristics in their corresponding projects with the highest average satisfaction
among four elements (69.257%, 61.519%, and 66.792%, respectively), followed by
65.233%, 58.008%, and 62.259% which presented the satisfaction levels of housing unit
supporting services in respective project, and followed by 62.841% and 55.564% which
were the satisfaction levels of neighbourhood characteristics in Yangguang and
Chengshi Huayuan, and followed by 62.137% and 54.441% which indicated the lowest
average satisfaction of housing estate supporting facilities comparing to other three
elements’ satisfactions in Yangguang and Chengshi Huayuan.
On the contrary, the lowest average satisfaction (61.723%) was given by the
respondents from Binhe Huayuan (Phase 3) to neighbourhood characteristics comparing
to Binhe Huayuan’s other three elements, whereas, when they evaluated housing estate
supporting facilities, the satisfaction index (61.867%) was a little bit better than
neighbourhood characteristics’ satisfaction index (61.723%).
Pertaining to satisfactions indices of four elements throughout three phases of low-
cost housing, with the exception of satisfaction index with housing unit characteristics
(61.519%) Chengshi Huayuan (Phase 2) had three elements with low level of
satisfactions in terms of housing unit supporting services, neighbourhood

172
characteristics, and housing estate supporting facilities and the rest of two phases
(Phase1 and 3) had all moderate level of satisfactions with four elements.
In terms of the proportions of respondents from each element across three phases of
low-cost housing, the proportion of respondents with moderate level of satisfaction was
the highest (74.4%, 57.9%, and 77.5%, respectively) in housing unit characteristics
across three phases followed by 70.9% in neighbourhood characteristics of Phase 1,
while 37.9% in housing unit supporting services of Phase 2, while 61.3% in housing
estate supporting facilities of Phase 3, and followed by 66.3% in housing unit
supporting services of Phase 1, while 25.3% and 57.5% in neighbourhood
characteristics of Phase 2 and 3, and followed by 58.1% and 22.1% in housing estate
supporting facilities of Phase 1 and 2, while 50.0% in housing unit supporting services
of Phase 3.
In addition, the percentage of respondents with low level of satisfaction is the largest
(40.7% and 74.7%) in housing estate supporting facilities of Phase 1 and 2, while 42.5%
in housing unit supporting services of Phase 3, followed by 29.1%, 73.7%, and 42.5%
in neighbourhood characteristics of all phases, and followed by 25.6% and 61.1% in
housing unit supporting services of Phase 1 and 2 while 36.3% in housing estate
supporting facilities of Phase 3, and followed by 16.3%, 40.0%, and 18.8% in housing
unit characteristics of all phases.
With respect to the ratio of respondents with very low and high levels of satisfaction
that need to be especially concerned, the proportion of respondents with very low level
of satisfaction is none (0.0%) in housing unit characteristics and any percentage of
respondents with very low level of satisfaction did not appear across four elements in
Phase 1 (Table 5.2).

173
Moreover, the percentage of respondents with very low level of satisfaction is 2.5%
in housing unit supporting services of Phase 3 while the other two phases of low-cost
housing did not have any percentage of respondents with very low level of satisfaction
in this element. Furthermore, 3.2% and 1.3% of respondents of Phase 2 and 3 were very
dissatisfied with housing estate supporting facilities and another 1.1% of respondents of
Phase 2 were very dissatisfied with neighbourhood characteristics as well. Nevertheless,
the proportion of respondents of Phase 1 with high level of satisfaction is large (9.3%)
in housing unit characteristics followed by 3.8% of respondents of Phase 3 and 2.1% of
respondents of Phase 2. Furthermore, respondents with high level of satisfaction are
high (8.1%) in housing unit supporting services followed by 5.0% of respondents of
Phase 3 and (1.1%) of respondents of Phase 2.
In addition to that, 1.3% of respondents of Phase 3 were satisfied and very satisfied
with housing estate supporting facilities followed by 1.2% of respondents of Phase 1,
and none of respondents of three phases were satisfied or very satisfied with
neighbourhood characteristics.
With reference to 3.2% and 1.3% of respondents of Phase 2 and 3 feeling very
dissatisfied with housing estate supporting facilities, and 2.5% of respondents with very
low level of satisfaction in housing unit supporting services of Phase 3 and another
1.1% of respondents of Phase 2 being very dissatisfied with neighbourhood
characteristics as well, the habitability indices on the level of satisfaction indicated that
both 58.1% and 38.8% of respondents from Phase 1 and 3 were very dissatisfied with
parking facilities that was significantly correlated with the element of housing estate
supporting facilities (r = .351**
and .421**
, respectively), followed by 22.1 % of
respondents from Phase 2 revealing very low level of satisfaction with children’s

174
playground that is significantly correlated with the element of housing estate supporting
facilities (r = .418**
).
Furthermore, 19.8 % of respondents from Phase 1 perceived very low level of
satisfaction with corridor that is significantly correlated with the element of housing unit
supporting services (r = .526**
), followed by 18.8 % of respondents from Phase 3 with
very low level of satisfaction with garbage disposal that is significantly correlated with
the element of housing unit supporting services (r = .481**
), and followed by 14.7 % of
respondents from Phase 2 with very low level of satisfaction with firefighting
equipment that is significantly correlated with the element of housing unit supporting
services (r = .290**
).
Moreover, very low level of satisfactions were perceived by 34.9%, 32.6% and
25.0% of respondents from Phase 1, 2 and 3 with nearest general hospital that is only
significantly correlated with the element of neighbourhood characteristics of Phase 2 (r
= .388**
), and is insignificantly correlated with neighbourhood characteristics of Phase 1
and 3 (r = positive).
In terms of resident’s workplace, quietness of housing estate, and urban centre,
31.6% of respondents living in Phase 2, 29.1% of respondents of Phase 2, and 17.5% of
respondents from Phase 3 showed their very low level of satisfactions with insignificant
correlations with the element of neighbourhood characteristics.
With regard to the low level of satisfactions with factors across four elements, the
habitability indices on the level of satisfaction indicated that both 61.6% and 46.3% of
respondents from Phase 1 and 3 were dissatisfied with children’s playground that was
significantly correlated with the element of housing estate supporting facilities (r =
.324**
and .375**
, respectively), followed by 48.4 % of respondents from Phase 2 with

175
low level of satisfaction with open space that was significantly correlated with the
element of housing estate supporting facilities (r = .562**
), and followed by 30.0% of
respondents of Phase 3 being dissatisfied with local kindergarten with significant
correlation coefficients (r = .279*).
Regarding the factors being correlated with housing unit supporting services element,
low level of 45.3% of respondents (Phase 2)’ satisfaction was perceived with their
electrical & telecommunication wiring with significant positive correlation coefficient
(r = .413**
), followed by 32.6% of respondents of Phase 1 with low level of satisfaction
with staircases (r = .451**
) and followed by 30.0% of respondents of Phase 3 with low
level of satisfaction with street lighting (r = .439**
).
Relating to the factors being correlated with the element of neighbourhood
characteristics, satisfaction with the convenience from their living to their workplaces
indicates low habitability perceived by 52.3% of respondents of Phase 1 with
insignificant correlation, followed by 47.4% of respondents of Phase 2 with low level of
satisfaction with nearest bus/taxi station (r = positive), and followed by 42.5% of
respondents of Phase 3 with low level of satisfaction with local police station (r =
.266*).
In terms of the factors being correlated with housing unit characteristics element,
46.3% of respondents of Phase 2 were dissatisfied with toilet with significant
correlation coefficient (r = .269**
), followed by 30.2% of respondents of phase 1 with
low level of satisfaction with kitchen (r = .623**
), and followed by 23.8% of
respondents of phase 3 with significant correlation coefficient (r = .315**
).
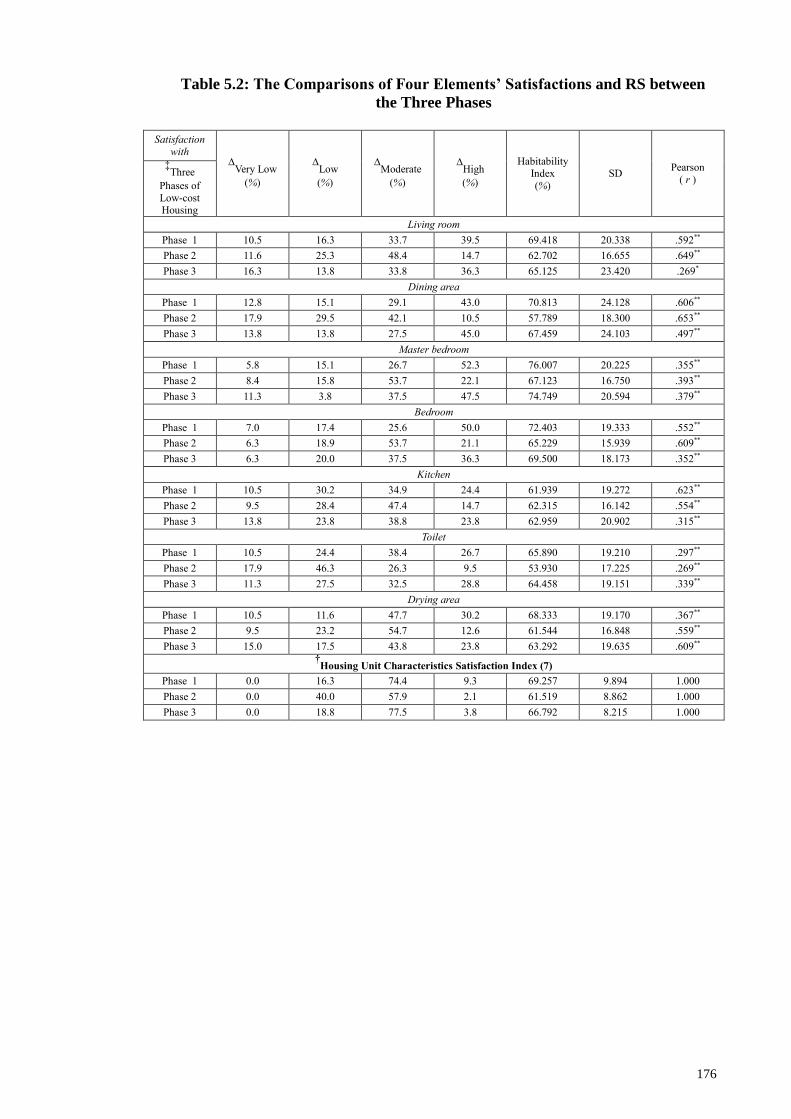
176
Table 5.2: The Comparisons of Four Elements’ Satisfactions and RS between
the Three Phases
Satisfaction
with ∆
Very Low
(%)
∆Low
(%)
∆Moderate
(%)
∆High
(%)
Habitability Index
(%)
SD Pearson
( r )
‡Three
Phases of
Low-cost Housing
Living room
Phase 1 10.5 16.3 33.7 39.5 69.418 20.338 .592**
Phase 2 11.6 25.3 48.4 14.7 62.702 16.655 .649**
Phase 3 16.3 13.8 33.8 36.3 65.125 23.420 .269*
Dining area
Phase 1 12.8 15.1 29.1 43.0 70.813 24.128 .606**
Phase 2 17.9 29.5 42.1 10.5 57.789 18.300 .653**
Phase 3 13.8 13.8 27.5 45.0 67.459 24.103 .497**
Master bedroom
Phase 1 5.8 15.1 26.7 52.3 76.007 20.225 .355**
Phase 2 8.4 15.8 53.7 22.1 67.123 16.750 .393**
Phase 3 11.3 3.8 37.5 47.5 74.749 20.594 .379**
Bedroom
Phase 1 7.0 17.4 25.6 50.0 72.403 19.333 .552**
Phase 2 6.3 18.9 53.7 21.1 65.229 15.939 .609**
Phase 3 6.3 20.0 37.5 36.3 69.500 18.173 .352**
Kitchen
Phase 1 10.5 30.2 34.9 24.4 61.939 19.272 .623**
Phase 2 9.5 28.4 47.4 14.7 62.315 16.142 .554**
Phase 3 13.8 23.8 38.8 23.8 62.959 20.902 .315**
Toilet
Phase 1 10.5 24.4 38.4 26.7 65.890 19.210 .297**
Phase 2 17.9 46.3 26.3 9.5 53.930 17.225 .269**
Phase 3 11.3 27.5 32.5 28.8 64.458 19.151 .339**
Drying area
Phase 1 10.5 11.6 47.7 30.2 68.333 19.170 .367**
Phase 2 9.5 23.2 54.7 12.6 61.544 16.848 .559**
Phase 3 15.0 17.5 43.8 23.8 63.292 19.635 .609** †Housing Unit Characteristics Satisfaction Index (7)
Phase 1 0.0 16.3 74.4 9.3 69.257 9.894 1.000
Phase 2 0.0 40.0 57.9 2.1 61.519 8.862 1.000
Phase 3 0.0 18.8 77.5 3.8 66.792 8.215 1.000

177
Table 5.2, continued Satisfaction
with ∆
Very Low
(%)
∆Low
(%)
∆Moderate
(%)
∆High
(%)
Habitability
Index (%)
SD Pearson
( r )
‡Three
Phases of
Low-cost
Housing
Drain
Phase 1 9.3 17.4 25.6 47.7 69.419 21.494 .393**
Phase 2 6.3 27.4 35.8 30.5 62.947 17.678 .303**
Phase 3 12.5 16.3 32.5 38.8 65.750 23.045 .612**
Electrical & Telecommunication wiring
Phase 1 4.7 14.0 15.1 66.3 76.395 21.470 .420**
Phase 2 11.6 45.3 28.4 14.7 55.053 18.843 .413**
Phase 3 16.3 16.3 27.5 40.0 66.500 26.053 .654**
Firefighting equipment
Phase 1 9.3 23.3 50.0 17.4 59.767 18.660 .227*
Phase 2 14.7 37.9 36.8 10.5 52.947 18.955 .290**
Phase 3 17.5 21.3 45.0 16.3 56.125 20.837 .402**
Street lighting
Phase 1 9.3 30.2 43.0 17.4 60.465 20.053 .327**
Phase 2 11.6 28.4 44.2 15.8 57.684 18.010 .587**
Phase 3 15.0 30.0 35.0 20.0 59.000 23.090 .439**
Staircases
Phase 1 16.3 32.6 23.3 27.9 61.105 24.751 .451**
Phase 2 9.5 32.6 34.7 23.2 60.684 18.887 .540**
Phase 3 17.5 28.8 27.5 26.3 60.875 24.427 .386**
Corridor
Phase 1 19.8 19.8 15.1 45.3 66.570 24.773 .526**
Phase 2 14.7 37.9 29.5 17.9 55.789 19.342 .479**
Phase 3 16.3 20.0 31.3 32.5 64.438 22.920 .467**
Garbage disposal
Phase 1 16.3 22.1 27.9 33.7 62.907 24.632 .513**
Phase 2 9.5 24.2 46.3 20.0 60.947 18.627 .473**
Phase 3 18.8 17.5 30.0 33.8 63.125 25.734 .481** †Housing Unit Supporting Services Satisfaction Index (7)
Phase 1 0.0 25.6 66.3 8.1 65.233 9.301 1.000
Phase 2 0.0 61.1 37.9 1.1 58.008 8.216 1.000
Phase 3 2.5 42.5 50.0 5.0 62.259 11.732 1.000

178
Table 5.2, continued Satisfaction
with ∆
Very Low
(%)
∆Low
(%)
∆Moderate
(%)
∆High
(%)
Habitability
Index (%)
SD Pearson
( r )
‡Three
Phases of
Low-cost
Housing
Open Space
Phase 1 8.1 14.0 62.8 15.1 65.988 17.453 .329**
Phase 2 9.5 48.4 38.9 3.2 54.158 14.779 .562**
Phase 3 6.3 21.3 52.5 20.0 66.313 18.362 .461**
Children's Playground
Phase 1 12.8 61.6 11.6 14.0 53.140 18.630 .324**
Phase 2 22.1 44.2 26.3 7.4 50.053 18.328 .418**
Phase 3 16.3 46.3 25.0 12.5 53.563 18.947 .375**
Parking facilities
Phase 1 58.1 11.6 12.8 17.4 46.105 24.691 .351**
Phase 2 22.1 36.8 30.5 10.5 51.316 18.119 .348**
Phase 3 38.8 15.0 22.5 23.8 53.500 25.450 .421**
Perimeter road
Phase 1 7.0 51.2 23.3 18.6 59.477 19.251 .455**
Phase 2 6.3 36.8 46.3 10.5 58.789 14.870 .490**
Phase 3 12.5 28.8 35.0 23.8 62.313 21.873 .540**
Pedestrian walkways
Phase 1 20.9 15.1 46.5 17.4 59.244 20.730 .372**
Phase 2 17.9 33.7 35.8 12.6 54.211 17.615 .404**
Phase 3 22.5 16.3 36.3 25.0 59.438 22.628 .332**
Local Shops
Phase 1 5.8 11.6 29.1 53.5 76.163 21.125 .376**
Phase 2 9.5 29.5 47.4 13.7 59.579 16.172 .461**
Phase 3 8.8 17.5 25.0 48.8 72.063 22.399 .501**
Local Kindergarten
Phase 1 5.8 24.4 30.2 39.5 70.814 20.592 .241*
Phase 2 21.1 47.4 20.0 11.6 50.158 19.136 .494**
Phase 3 7.5 30.0 26.3 36.3 66.625 21.784 .279*
Fitness Equipment
Phase 1 20.9 17.4 16.3 45.3 66.163 24.789 +
Phase 2 13.7 25.3 48.4 12.6 57.263 18.332 .244*
Phase 3 20.0 27.5 18.8 33.8 61.125 24.675 .441**
†Housing Estate Supporting Facilities Satisfaction Index (8)
Phase 1 0.0 40.7 58.1 1.2 62.137 6.860 1.000
Phase 2 3.2 74.7 22.1 0.0 54.441 7.256 1.000
Phase 3 1.3 36.3 61.3 1.3 61.867 9.226 1.000

179
Table 5.2, continued
Satisfaction
with ∆
Very Low
(%)
∆Low
(%)
∆Moderate
(%)
∆High
(%)
Habitability
Index
(%)
SD Pearson
( r )
‡Three
Phases of Low-cost
Housing
Community Relationship
Phase 1 8.1 18.6 41.9 31.4 66.163 19.169 .311**
Phase 2 14.7 6.3 48.4 30.5 63.684 18.740 .406**
Phase 3 8.8 22.5 42.5 26.3 63.250 19.859 .384**
Quietness of housing estate
Phase 1 29.1 43.0 14.0 14.0 46.744 21.279 +
Phase 2 16.8 29.5 44.2 9.5 52.842 18.661 .565**
Phase 3 21.3 30.0 23.8 25.0 55.750 24.119 .296**
Local Crime situation
Phase 1 4.7 19.8 15.1 60.5 76.163 22.553 .367**
Phase 2 7.4 23.2 51.6 17.9 60.211 16.630 .505**
Phase 3 8.8 22.5 26.3 42.5 69.125 23.395 .257*
Local Accident situation
Phase 1 3.5 9.3 32.6 54.7 76.744 19.849 .326**
Phase 2 6.3 21.1 47.4 25.3 62.947 18.899 .367**
Phase 3 2.5 18.8 25.0 53.8 75.625 20.918 .348**
Local Security control
Phase 1 7.0 11.6 55.8 25.6 66.744 17.180 +
Phase 2 10.5 35.8 43.2 10.5 54.632 16.873 .370**
Phase 3 8.8 16.3 53.8 21.3 62.375 16.932 .272*
Resident's Workplace
Phase 1 14.0 52.3 19.8 14.0 51.744 19.232 +
Phase 2 31.6 42.1 20.0 6.3 44.632 16.810 +
Phase 3 17.5 40.0 28.8 13.8 53.250 20.362 +
Community Clinic
Phase 1 10.5 11.6 32.6 45.3 67.907 20.644 .213*
Phase 2 12.6 17.9 32.6 36.8 62.842 20.663 .473**
Phase 3 11.3 16.3 27.5 45.0 67.250 22.388 .383**
Nearest General Hospital
Phase 1 34.9 39.5 10.5 15.1 47.209 21.944 +
Phase 2 32.6 42.1 13.7 11.6 46.421 19.782 .388**
Phase 3 25.0 36.3 17.5 21.3 52.625 22.878 +
Local Police Station
Phase 1 8.1 45.3 17.4 29.1 59.767 21.854 .335**
Phase 2 13.7 26.3 50.5 9.5 56.421 16.368 .385**
Phase 3 13.8 42.5 22.5 21.3 57.750 22.103 .266*
Nearest School
Phase 1 9.3 39.5 12.8 38.4 64.884 26.110 .436**
Phase 2 11.6 24.2 45.3 18.9 57.474 18.848 .446**
Phase 3 11.3 35.0 27.5 26.3 59.625 22.583 +
Local Market
Phase 1 10.5 26.7 14.0 48.8 68.488 26.724 .286**
Phase 2 6.3 31.6 35.8 26.3 61.053 18.989 .269**
Phase 3 10.0 23.8 25.0 41.3 65.125 22.558 .345**
Nearest Fire Station
Phase 1 9.3 16.3 52.3 22.1 63.372 18.059 +
Phase 2 8.4 32.6 42.1 16.8 57.895 17.619 .386**
Phase 3 10.0 23.8 42.5 23.8 61.875 19.297 .232*

180
Table 5.2, continued Satisfaction
with Very Low
(%)
Low
(%)
Moderate
(%)
High
(%)
Habitability
Index (%) SD
Pearson
( r ) ‡
Three Phases
of Low-cost Housing
Nearest Bus/Taxi Station
Phase 1 20.9 33.7 12.8 32.6 59.302 26.603 .225*
Phase 2 13.7 47.4 30.5 8.4 50.947 17.869 +
Phase 3 16.3 28.8 18.8 36.3 61.875 24.188 .369**
Urban Centre
Phase 1 12.8 23.3 25.6 38.4 64.535 22.889 .243*
Phase 2 26.3 46.3 20.0 7.4 45.895 17.166 .420**
Phase 3 17.5 32.5 25.0 25.0 58.625 22.656 + †Neighbourhood Characteristics Satisfaction Index (14)
Phase 1 0.0 29.1 70.9 0.0 62.841 5.478 1.000
Phase 2 1.1 73.7 25.3 0.0 55.564 6.817 1.000
Phase 3 0.0 42.5 57.5 0.0 61.723 5.960 1.000 •Residential Satisfaction Index
Phase 1 0.0 12.8 87.2 0.0 64.397 3.957 ——
Phase 2 0.0 87.4 12.6 0.0 56.947 2.728 ——
Phase 3 0.0 22.5 77.5 0.0 62.845 3.816 ——
Note: ‡: Three Phases of Low-cost Housing, i.e. Phase 1 = Yangguang Huayuan; Phase 2 = Chengshi Huayuan; Phase 3 = Binhe Huayuan. ∆: Range of the level of satisfaction (i.e. very low = 20-39; low = 40-59; moderate = 60-79; high = 80-100) stem from the level of housing satisfaction
measured by a five-point Likert scale, i.e. 1 = very dissatisfied; 2 = dissatisfied; 3 = slightly satisfied; 4 = satisfied; 5 = very satisfied. †: Four elements of Residential Satisfaction, i.e. housing unit characteristics, housing unit supporting services, housing estate supporting facilities, and
neighbourhood characteristics. ◦: Residential Satisfaction Index of the Low-cost Housing.
*. Correlation is significant at the 0.05 level (2-tailed). **. Correlation is significant at the 0.01 level (2-tailed).
“0” = Non-correlation; “+” = Positive correlation, but Non-significant; “-” = Negative correlation, but Non-significant.
Source: Field Survey (2014-2015)
5.5.2 The Comparisons of the Correlations between RSIndex and Respondents’
IHSC between the Three Phases
The Table 5.3, which presented the comparisons of Spearman’s and Pearson’s
correlation coefficients (r) matrix between residential satisfaction indices (four
elements’ satisfaction indices) and respondents’ individual and household socio-
economic characteristics between the three phases, indicated that both residential
satisfaction indices of Yangguang Huayuan (Phase 1) and Binhe Huayuan (Phase 3)
were highly positively correlated with housing unit supporting services satisfaction
index, with correlation coefficient (r) values of .628**
and .582**
, respectively, and
followed by residential satisfaction index of Phase 2 having the highest positive
correlation (r = .422**
) with neighbourhood characteristics satisfaction index comparing
to other three elements’ indices within Phase 2.

181
Furthermore, the residential satisfaction indices of Phase1, 3, and 2 had considerably
higher positive correlations (r = .572**
, .457**
, and .363**
, respectively) with housing
unit characteristics satisfaction index, neighbourhood characteristics satisfaction index,
and housing estate supporting facilities satisfaction index than the same residential
satisfaction indices having positive correlations (r = .554**
, .449**
, and .352**
,
respectively) with neighbourhood characteristics satisfaction index, housing estate
supporting facilities satisfaction index, and housing unit supporting services satisfaction
index.
At last, the residential satisfaction index of Phase 1 had a relatively lower positive
correlation (r = .355**
) with housing estate supporting facilities satisfaction index, and
followed by both residential satisfaction indices of Phase 3 and Phase 2 having
comparatively lower positive correlations (r = .319**
and .268**
, respectively) with
housing unit characteristics satisfaction index.
In terms of the correlations between the elements, Table 5.3 indicated that only
housing unit characteristics satisfaction index of the Phase 2 had lower negative
correlations (r = -.227* and -.330
**) with housing estate supporting facilities satisfaction
index and neighbourhood characteristics satisfaction index comparing to a negative
correlation (r = -.418**
) of housing unit supporting services satisfaction index with
neighbourhood characteristics satisfaction index. In addition to that, the rest of
correlations between the elements across three phases had positive and negative
correlations, but insignificant ones (It indicated that there were less collinearity in these
variables).

182
With respect to the correlations between the respondents’ individual and household
socio-economic characteristics and residential satisfaction indices, Table 5.3 indicated
the longer the respondents of the Phase 2 lived, the more satisfied with residential
environment that they felt [with correlation coefficient (r) value of .206*].
Moreover, the more choices on main means of transportation were provided to the
respondents of the Phase 3, they felt more satisfied with residential environment [with
correlation coefficient (r) value of .362**
]. On top of that, the rest of correlations
between the respondents’ individual and household socio-economic characteristics and
residential satisfaction indices throughout three phases had positive and negative
correlations, but insignificant ones.
In terms of the correlations between the respondents’ individual and household
characteristics and each element index of residential environment, Table 5.3 illustrated
that the respondents’ ages and occupation type had positive correlations [with
correlation coefficient (r) values of .272* and .234
*, respectively] with housing estate
supporting facilities satisfaction index of Phase 1 which, on the other hand, decreased
with the increases in household sizes, decreased with the promoting in residents’
occupation sector, and decreased with the increases in their incomes [with correlation
coefficient (r) values of -.275*, -.260
*, and -.230
*, respectively].
Moreover, neighbourhood characteristics satisfaction index of Phase 1 declines with
the increases in respondents’ ages [with correlation coefficient (r) value of -.227*].
However, neighbourhood characteristics satisfaction index of Phase 3 increased with the
increase in choices about the main means of transportation provided to the respondents
[with correlation coefficient (r) value of .232*].

183
Apart from this, the rest of correlations between the respondents’ individual and
household characteristics and each element index of residential environment throughout
three phases had positive and negative correlations, but insignificant ones.
Therefore, with reference to the above mentioned results, the respondents’ individual
and household socio-economic characteristics such as marital status and main means of
transportation were positively correlated with residential satisfaction indices throughout
three phases of low-cost housing which, however, declined with the increases in
household sizes, promoting in residents’ occupation sector, and increases in their
incomes.
Furthermore, the residential satisfaction indices of Phase 1 and 2 had negative
correlations with the respondents’ gender which, however, was positively correlated
with residential satisfaction index of Phase 3. Moreover, the older the respondents of
Phase 2 and 3 were, they felt more satisfied with residential environment, in contrast,
the older the respondents from Phase 1 were, the less satisfied with residential
environment that they felt. What is more, the higher educated the respondents of the
Phase 2 and 3 received, the less satisfied with residential environment that they felt, on
the contrary, the higher educated the respondents of the Phase 1 received, they felt more
satisfied with residential environment.
In the way of respondents’ occupation type, it has positive correlations with
residential satisfaction indices of Phase 2 and 3, while the same respondents’ attribute is
negatively correlated with residential satisfaction index of Phase 1. In the case of floor
level, the higher floor level the respondents of the Phase 2 and 3 lived on, the less
satisfied with residential environment that they felt, on the other hand, the higher floor
level the respondents of the Phase 1 lived on, they felt more satisfied with residential
environment.

184
Table 5.3: The Comparisons of Spearman's and Pearson's correlation coefficients (r) matrix between RSIndices and Respondents' IHSC
between the Three Phases
Variables HUCS
Index
HUSSS
Index
HESFS
Index
NCS
Index Gender Age
Educational
attainment
Marital
Status
Household
size
Occupation
sector
Occupation
type Income
Floor
Level
Length of
Residence
Main Means of
Transportation 3 phases
Housing Unit Characteristics Satisfaction (HUCS) Index
Phase 1 1.000 + + + - - + - + - - - - - +
Phase 2 1.000 + -.227* -.330** + + + + - - - - - + -
Phase 3 1.000 + - - + - + - + + - + + - +
Housing Unit Supporting Services Satisfaction (HUSSS) Index
Phase 1 + 1.000 + + - - + + 0.000 - - - + + +
Phase 2 + 1.000 + -.418** - - + + + + - - - + +
Phase 3 + 1.000 - - + + - + - - + - + - +
Housing Estate Supporting Facilities Satisfaction (HESFS) Index
Phase 1 + + 1.000 - - .272* - + -.275* -.260* .234* -.230* + + -
Phase 2 -.227* + 1.000 - - - + - + + + - + - +
Phase 3 - - 1.000 - + + - + - - + - - + +
Neighbourhood Characteristics Satisfaction (NCS) Index
Phase 1 + + - 1.000 - -.227* + + + + - + + - +
Phase 2 -.330** -.418** - 1.000 - + - - - - + + - + +
Phase 3 - - - 1.000 - - + + - - + - + - .232*
Residential Satisfaction Index
Phase 1 .572** .628** .355** .554** - - + + - - - - + - +
Phase 2 .268** .352** .363** .422** - + - + - - + - - .206* +
Phase 3 .319** .582** .449** .457** + + - + - - + - - - .362**
Notes: *. Correlation is significant at the 0.05 level (2-tailed). **. Correlation is significant at the 0.01 level (2-tailed). "0" = Non-correlation; "+" = Positive correlation, but Non-significant; "-" = Negative correlation, but Non-significant.
Significant Variables definitions: Age (1 = age21-30, 2 = age31-40, 3 = age41-50, 4 = age51-60, 5 = above age60); Household size (1 = 1 people, 2 = 2 people, 3 = 3people, 4 = 4 people, 5 = 5 people and above); Occupation Sector (1 = Government servant, 2
= State-Owned Enterprise (SOE), 3 = Collective-Owned Enterprise (COE), 4 = Private business, 5 = Own business); Occupation Type (1 = Management & Professional, 2 = Technical & Administrative Support, 3 = Services & Operation, 4 = Others); Income =
Monthly net income of Household (1 = RMB 0-1,999, 2 = RMB 2,000-3,999, 3 = RMB 4,000-5,999, 4 = RMB 6,000-7,999, 5 = above RMB 8,000); Length of Residence (1 = <=3 years, 2 = >3, <=5 years, 3 = >5, <=7 years, 4 = >7, <=9 years); Main Means
of Transportation (1 = By Cycling (Electric Bicycle/Bicycle), 2 = By Driving, 3 = By Bus, 4 = By Foot)
Source: Field Survey (2014-2015)

185
In addition to that, the longer the respondents of the Phase 1 and 3 lived, the less
satisfied with residential environment that they felt, however, the respondents of the
Phase 2 felt in completely different ways from respondents of Phase 1 and 3.
5.5.3 The Comparisons of the Determinants between the Three Phases
In terms of the dependent and independent variables of this study, each phase of low-
cost housing’s residential satisfaction index, which was defined as one or only one
dependent variable of this study delivering the analyses of the determinants, was
worked out by means of the total scores of the 36 residential satisfaction variables
divided by the sum of actual scores on the 36 variables and was displayed as a
percentage that was also a continuous variable with normal distribution. Furthermore,
the algorithm of the residential satisfaction index was stemmed from the calculation of
habitability index introduced by Onibokun (1974); (Onibokun, 1976).
As the above mentioned, the multiple linear regression analysis was defined as the
best way for this social experiment study to explain variations in each phase of
residential satisfaction index due to assessing the simultaneous effects of the 36
variables from the four elements of residential environment measured by the
respondents with their own different individual variations (the additional 11 personal
attributes of respondents’ individual and household socio-economic characteristics)
from their own each three phases of low-cost housing based upon their perceptions of
their own living experiences along with the previous literature review that mentioned
about the total of residential satisfaction variables plus respondents’ individual and
household characteristics might have influenced residential satisfaction.

186
In terms of a multiple linear regression model, it assessed to determine the best linear
combination of the 36 residential environment variables from HUC, HUSS, HESF, and
NC plus the 11 personal attributes for predicting each phase of the overall residential
satisfaction.
As a result, Table 5.4, which presented the comparisons of the determinants of
residential satisfaction indices between the three phases of low-cost housing in Xuzhou
city, indicated that the combination of predictor (independent) variables of each phase
of low-cost housing significantly predicted the respective residential satisfaction, with F
(14, 71) = 21.741, p < .001, F (12, 82) = 20.669, p < .001, F (13, 66) = 22.405, p < .001,
respectively, with all 14 determinants, 12 key predictors, and 13 determinants
separately and significantly contributing to the each prediction of residential
satisfaction.
In respect of those determinants from each phase to predicting residential satisfaction
of each phase of low-cost housing, in general the separate regression on the three phases
of low-cost housing drew the conclusion that the three phases of low-cost housing had
the same determinants and the diverse ones to contribute each phase of residential
satisfaction.
Furthermore, Table 5.4 indicated that the residents of three phases simultaneously
raised one fact that to improve satisfactions with corridor and local shops could enhance
residential satisfactions over there together with other determinants. Furthermore, the
residents of Phase 1 and 2 were simultaneously very concerned about the improvements
of satisfactions with bedroom and the nearest schools. Meanwhile, the residents of
Phase 1 and 3 were much concerned about the enhancements of satisfactions with open
space and the floor level, for instance, the residents of Phase 1 who lived on the 5th
floor
were more satisfied than those who lived on the 2nd
floor, and similarly, the residents

187
who lived on the 3rd
floor were more satisfied than those who lived on the 4th
floor in
Phase 3.
Nevertheless, Xuzhou’s local authority should pay very attention to enhancing
residents’ satisfactions with local kindergarten and children’s playground that were the
common determinants to improving residential satisfactions of Phase 2 and 3.
Furthermore, the main means of transportation was one of key predictors also to
significantly determine the residential satisfactions of Phase 2 and 3. The explanation
for the group of residents of Phase 2 who went outside frequently by foot were found to
be more satisfied than those who went outside frequently by driving might be that
everyday using private cars must be costly for the low-cost residents due to their
medium-low level of income and the faraway distance from their Phase 2 to down town,
and might be that the surrounding facilities such as farmer’s market, mini supermarket,
and some restaurants were not varieties, but could fulfil residents’ daily demands.
Moreover, with the same variable (main means of transportation) to significantly
affect residential satisfaction of Phase 3, however, the different explanation from Phase
2 saying was given to an answer to the group of residents of Phase 3 who went outside
frequently by cycling seemed to be less satisfied than those who went outside frequently
by driving which was probably stemmed from the residents’ income being higher and
the geographic location of Phase 3 being better compare to Phase 2, and the parking
areas being built larger than Phase 2.
In regard to the rest of determinants of three phases of low-cost housing, Table 5.4
indicated that the satisfactions with the dining room, drain, resident’s workplace, and
community clinic had the most impact on residential satisfaction of Yangguang
Huayuan, and the satisfactions with the nearest general hospital and Yangguang

188
Huayuan’s parking facilities, and the floor level (2nd
floor vs. 5th
floor) had the
moderately impact, whereas the satisfaction with the garbage disposal had less impact
on Yangguang Huayuan’s residential satisfaction.
Moreover, the predictor of occupation type was significant to Yangguang Huayuan’s
residential satisfaction. This further denoted that the explanation for the small group of
residents of Phase 1 whose occupation type with management & professional appeared
to be less satisfied than those whose occupation type with others such as some jobs paid
by daily-settlement (no fixed contract), retired, and laid-off/unemployed might be that
the income level of residents with management & professional was far more earned than
residents with others such as some jobs paid by daily-settlement (no fixed contract),
retired, and laid-off/unemployed so as to make them ask for more from the existing low-
cost housing, on the contrary, the main characteristics of low-cost housing were to fulfil
the basic needs not high-end needs (not based upon market-driven) of medium-low
income residents such as farmer’s market, mini supermarket, and some restaurants that
were not varieties, but could fulfil medium-low income residents’ daily demands.
Furthermore, the satisfactions with the local crime situation, staircases, drying area,
nearest bus/taxi station, and local accident situation contributed the most to predicting
Chengshi Huayuan’s residential satisfaction, and the main means of transportation (by
driving vs. by foot) contributed moderately to predicting the residential satisfaction.
Finally, the satisfactions with the electrical & telecommunication wiring, corridor,
quietness of housing estate, Binhe Huayuan’s children’s playground and Binhe
Huayuan’s open space had the most impact and the satisfactions with the police station,
nearest fire station, local kindergarten, local shops, living room, community
relationship, and main means of transportation (by driving vs. by cycling) had the

189
moderately impact, whereas the floor level (4th
floor vs. 3rd
floor) had less impact on the
Binhe Huayuan’s residential satisfaction index.
Table 5.4: The Comparisons of the Determinants between the Three Phases
Phase 1 Yangguang Huayuan
Determinants Unstandardized Coefficients
Standardized
Coefficients t-statistic Significance
B Std. Error Beta
(Constant) 33.121 2.098 15.790 .000 P < .001
Bedroom .072 .012 .350 5.935 .000 P < .001
Dining .051 .009 .309 5.567 .000 P < .001
Nearest Schools .058 .009 .383 6.620 .000 P < .001
Yangguang Huayuan's Parking facilities
.027 .009 .168 2.951 .004 P < .01
Drain .038 .010 .205 3.778 .000 P < .001
#Floor level
(2ndFloor vs. 5thFloor) 1.596 .502 .174 3.180 .002 P < .01
Community Clinic .037 .010 .194 3.546 .001 P < .001
Resident's Workplace .043 .012 .207 3.684 .000 P < .001
Corridor .038 .009 .239 4.278 .000 P < .001
Nearest General Hospital .036 .011 .197 3.256 .002 P < .01
#Occupation type (Others vs. Management &
Professional)
-1.590 .768 -.117 -2.070 .042 P < .05
Yangguang Huayuan's Open Space
.034 .013 .150 2.686 .009 P < .01
Local Shops .026 .011 .140 2.445 .017 P < .05
Garbage disposal .023 .009 .141 2.476 .016 P < .05
Dependent Variable = Yangguang Huayuan's Residential Satisfaction Index (RSIndex)
Note: d.f. = 14, F = 21.741 (p < .001), Adjusted R2 = .774, #:dummy variable
Phase 2 Chengshi Huayuan
Determinants Unstandardized Coefficients
Standardized
Coefficients t-statistic Significance
B Std. Error Beta
(Constant) 29.312 1.897 15.452 .000 P < .001
Local Crime situation .075 .010 .456 7.172 .000 P < .001
Staircases .055 .009 .379 5.909 .000 P < .001
Local Kindergarten .037 .009 .260 4.123 .000 P < .001
Nearest Schools .051 .009 .352 5.742 .000 P < .001
#Main Means of
Transportation (By Driving vs. By Foot)
1.505 .483 .177 3.114 .003 P < .01
Bedroom .035 .011 .205 3.314 .001 P < .01
Local Shops .045 .010 .265 4.529 .000 P < .001
Local Accident situation .035 .009 .240 3.814 .000 P < .001
Drying area .049 .010 .304 5.080 .000 P < .001
Nearest Bus/Taxi Station .039 .009 .254 4.333 .000 P < .001
Chengshi Huayuan's Children's Playground
.031 .009 .209 3.449 .001 P < .001
Corridor .021 .008 .146 2.511 .014 P < .05
Dependent Variable = Chengshi Huayuan's Residential Satisfaction Index (RSIndex)
Note: d.f. = 12, F = 20.669 (p < .001), Adjusted R2 = .715, #:dummy variable
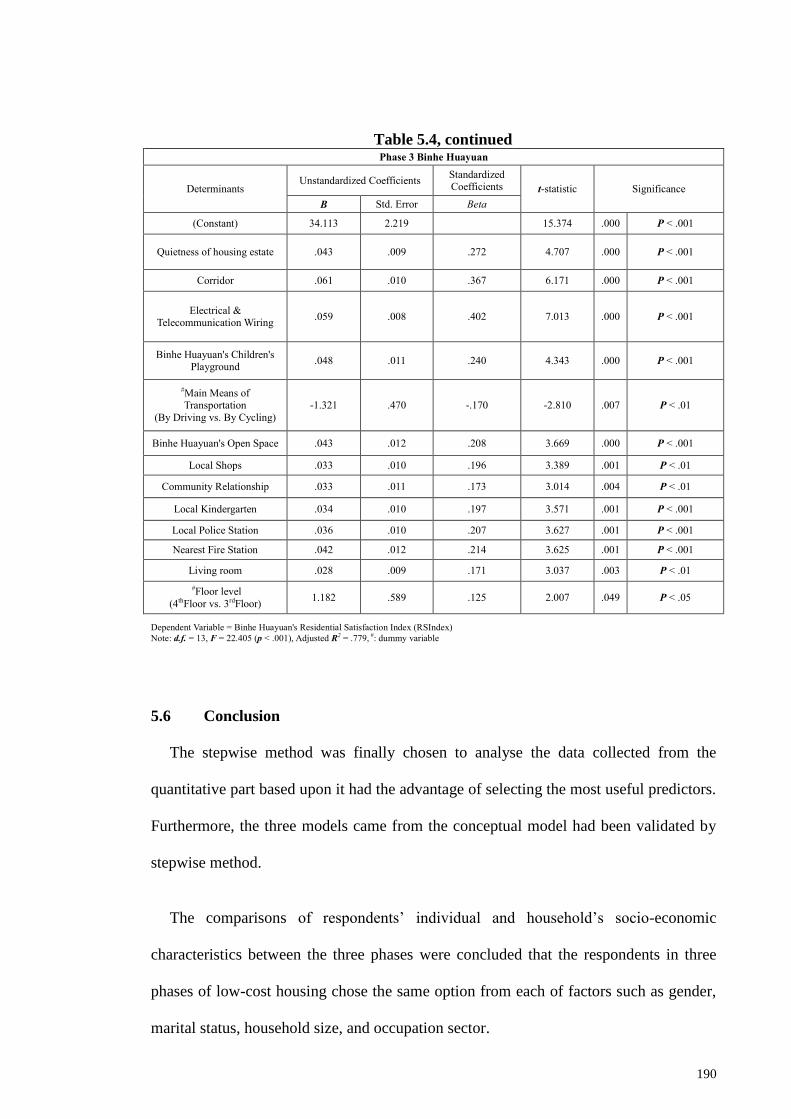
190
Table 5.4, continued Phase 3 Binhe Huayuan
Determinants Unstandardized Coefficients
Standardized Coefficients t-statistic Significance
B Std. Error Beta
(Constant) 34.113 2.219 15.374 .000 P < .001
Quietness of housing estate .043 .009 .272 4.707 .000 P < .001
Corridor .061 .010 .367 6.171 .000 P < .001
Electrical & Telecommunication Wiring
.059 .008 .402 7.013 .000 P < .001
Binhe Huayuan's Children's Playground
.048 .011 .240 4.343 .000 P < .001
#Main Means of Transportation
(By Driving vs. By Cycling)
-1.321 .470 -.170 -2.810 .007 P < .01
Binhe Huayuan's Open Space .043 .012 .208 3.669 .000 P < .001
Local Shops .033 .010 .196 3.389 .001 P < .01
Community Relationship .033 .011 .173 3.014 .004 P < .01
Local Kindergarten .034 .010 .197 3.571 .001 P < .001
Local Police Station .036 .010 .207 3.627 .001 P < .001
Nearest Fire Station .042 .012 .214 3.625 .001 P < .001
Living room .028 .009 .171 3.037 .003 P < .01
#Floor level
(4thFloor vs. 3rdFloor) 1.182 .589 .125 2.007 .049 P < .05
Dependent Variable = Binhe Huayuan's Residential Satisfaction Index (RSIndex)
Note: d.f. = 13, F = 22.405 (p < .001), Adjusted R2 = .779, #: dummy variable
5.6 Conclusion
The stepwise method was finally chosen to analyse the data collected from the
quantitative part based upon it had the advantage of selecting the most useful predictors.
Furthermore, the three models came from the conceptual model had been validated by
stepwise method.
The comparisons of respondents’ individual and household’s socio-economic
characteristics between the three phases were concluded that the respondents in three
phases of low-cost housing chose the same option from each of factors such as gender,
marital status, household size, and occupation sector.

191
Moreover, in regard of occupation sector, the great majority of the respondents were
working in private business sector (58.1%, 52.6%, and 60.0%, correspondingly)
comparing to the very low percentage of the respondents’ working in the government
(4.7%, 3.2%, and 0.0%, respectively).
With respect to age, a high proportion of respondents in phase 2 and 3 were between
age 51 and 60 (29.5% and 30.0%) followed by phase 1 (26.7%), while the majority of
the respondents in phase 1 were between age 41 and 50 (38.4%) followed by phase 2
(28.4%).
In view of educational attainment, the respondents living at these three phases of
low-cost housing shared some similarities in the great number of residents with junior
and senior middle school education background (61.7%, 42.1%, and 47.6%,
respectively).
The numbers of occupation type indicated that most of the respondents (39.5%,
38.9%, and 33.8%, respectively) were employed to do services or operation that were
considered as the very basic and repetitive jobs in Chinese occupation type of
segmentation.
In this manner, the factors of educational attainment, occupation sector and
occupation type comparatively affect the residents’ monthly net income of their families
at certain degree, majority of the respondents (58.9% and 58.8%) of phase 2 and 3 also
made between 4,000 (US$588) and 5,999 (US$882) of monthly income of each of their
family.
With reference to the factor of main means of transportation, based upon the results
of the age, occupation sector and type, and monthly income given by the respondents

192
across the three phases, it is not hard to see that the residents mainly relied on using bus
and riding bicycle as their main means of transportations.
The comparisons of four components’ satisfactions and residential satisfactions
between the three phases were concluded that the respondents of Phase 1 whose average
residential satisfaction was 64.397% which was perceived as the moderate level of
satisfaction had almost the same answer with the respondents of Phase 3 whose average
residential satisfaction was 62.845%. However, the respondents of Phase 2 were
dissatisfied (56.947% which was perceived as the low level of satisfaction) with their
overall residential environment.
The comparisons of the determinants of residential satisfaction indices between the
three phases were concluded that the combination of predictor (independent) variables
of each phase of low-cost housing significantly predicted the respective residential
satisfaction, with F (14, 71) = 21.741, p < .001, F (12, 82) = 20.669, p < .001, F (13, 66)
= 22.405, p < .001, respectively, with all 14 determinants, 12 key predictors, and 13
determinants separately and significantly contributing to the each prediction of
residential satisfaction.
The residents of three phases simultaneously raised one fact that to improve
satisfactions with corridor and local shops could enhance residential satisfactions.
Furthermore, the residents of Phase 1 and 2 were simultaneously very concerned about
the improvements of satisfactions with bedroom and the nearest schools. Meanwhile,
the residents of Phase 1 and 3 were much concerned about the enhancements of
satisfactions with open space and the floor level.

193
Nevertheless, Xuzhou’s local authority should pay very attention to enhancing
residents’ satisfactions with local kindergarten and children’s playground that were the
common determinants to improving residential satisfactions of Phase 2 and 3.
Furthermore, the main means of transportation was one of key predictors also to
significantly determine the residential satisfactions of Phase 2 and 3.

194
QUALITATIVE RESULTS CHAPTER 6:
6.1 Introduction
The continued analysis of each case and across six cases from three phases further
explored the quantitative results which covered the five themes determining the
participants’ residential satisfactions in these three phases of low-cost housing in terms
of individual and household’s socio-economic characteristics, housing unit
characteristics, housing unit supporting services, housing estate supporting facilities,
and neighbourhood characteristics. The following description of each case involved
his/her comments on these five themes in detail emphasizing on the quantitative results.
6.2 Interviewee 1
Interviewee 1 was 45 years old and she had a sweet family with her husband and one
son. At her age, most people chose to work after graduation from senior middle school.
In terms of the chances of entering universities being very low, most people, like her,
chose to work so early as to reduce the burden of her parents’ as much as she could.
With the development of China, more and more high educated people joined in
different sectors and their wages had been being increased recently. Comparing to them,
she said: “As I had my abundant experiences in selling products in private companies, I
have more diversified ways of treating customers and more techniques of leading a sales
team.”
Although she worked hard in a private company, her monthly income was still
medium-low due to she could not easily find a job in local government, in any state-
owned enterprises, and even in any collective-owned companies with her secondary
school’s certificate. In the meantime, she was not capable of running her own business
under the current increasingly competitive market environment.

195
Besides, with the housing price in Xuzhou soaring in recent years, she could not
afford to buy a new commodity house. Instead, she was eligible to apply a set of low-
cost house at that time and she lived at Yangguang Huayuan (1st Phase of low-cost
housing in Xuzhou) for almost 9 years. Block 22 was where she lived at and she lived
on the 5th
floor. In her daily life, she used an electric bicycle as her main means of daily
transportation.
6.2.1 Individual and Household’s Socio-economic Characteristics
Interviewee 1’s residential satisfaction in Yangguang Huayuan was positively
affected by the floor level (2nd
floor vs. 5th
floor) and she said: “My experience told me
that living on the higher floor level can stay away from the crowd noise and the rubbish
left at the housing estate.”
Moreover, for those who were using electric bicycles and cars for the main means of
transportation, Interviewee 1 requested: “We need a proper parking place where we can
leave our electric bicycles and cars freely and never worry about bicycles lost and where
to park my car.”
On the other hand, Interviewee 1’s residential satisfaction in Yangguang Huayuan
was negatively affected by the occupation type (others vs. management & professional)
and she gave an explanation: “Since those eligible households moved into Yangguang
Huayuan in 2005 and 2006, some households have been changing too much in these
almost 10 years regarding their occupations and income through their efforts. And then,
the higher position of occupation that they will achieve and they have more
dissatisfaction with their living environment, for example, people like me, when I
applied for a low-cost housing, I only wanted a place to live at that time. However, with
my lots of efforts put on work, my occupation type has been changing from a normal
saleswoman to a sales manager.

196
After that, only wanting a place to live has not been satisfying me a lot and I need the
current living environment to be enhanced so as to fulfil my current requirements.” In
terms of improving the current living environment, Interviewee 1 said: “As the local
government said the low-cost housing project was firstly to fulfil the basic housing
needs of the medium-low and low income group of people and also to provide the half
housing ownership to residents requiring all residents cannot sell their houses within 5
or 10 years and cannot purchase their left housing ownership from the local government
as well, the low-cost housing finally will be a commodity housing with a full housing
ownership.
For the residents who want to purchase the left housing ownerships in order to sell to
change a new house, the current living environment of Yangguang Huayuan is their
main concerns about how much more they can sell to the second-hand housing market.
In addition, for the most residents, like me, really want our living environment to be
improved and the housing ownerships are comprehensively important because of not
selling to change new houses (most of residents are still cannot afford to buy new
commodity houses), but fully owning houses and selling later.”
6.2.2 Housing Unit Characteristics
Interviewee 1’s residential satisfaction in Yangguang Huayuan was positively
affected by the bedroom and dining area, i.e. she said: “Compared to the master room,
the bedroom is slightly smaller than the master room and the location is not facing south
which means that the bedroom is not a well ventilated and bad lighting.
In addition, there has fewer power sockets in the bedroom, for instance, my son is
studying while using a computer in winter and he cannot use a heater simultaneously.

197
Speaking of the dining area, it has a proper location in this house with an appropriate
size and it is a well-ventilated especially during spring and summer when we have lunch
together and we can feel a lovely breeze throughout the whole dining area, of course,
the whole living room as well because it is connected with each other. Moreover, it has
a good lighting; however, it unlikely has fewer power sockets, either.”
Regarding the drying area which was importantly mentioned in the 2nd
phase of low-
cost housing, Interviewee 1 answered: “The drying area in the low-cost housing is
actually a balcony which has a proper space with a well-ventilated design and a good
lighting. Unfortunately, the same problem with other areas had is lack of power
sockets.”
Referring to the living room which was significantly mentioned in the 3rd
phase of
low-cost housing, Interviewee 1 also commented on the living room, such like “The
living room also has a proper location, just like the dining area, and has an appropriate
size with a well-ventilated design throughout the house. In addition to the good lighting
that the living room has, the problem of fewer power sockets also troubles me a lot.”
Additionally, Interviewee 1 added some words on the toilet, she said: “In spite of
how bad the ventilation and the very limited numbers of power sockets are, the very
small size and very bad lighting make me very inconvenient all the time.”
6.2.3 Housing Unit Supporting Services
In terms of housing unit supporting services, Interviewee 1’s residential satisfaction
was positively affected by the corridor, drain, and garbage disposal. Interviewee 1 said:
“The space of corridor is quite narrow between neighbours. And then, it is quite noisy.
Sometimes when we had a lunch on Saturday or Sunday, we can hear many noises from
the corridor, probably from the children’s playing, the couple’s arguments, etc.

198
Furthermore, the corridor is unclean because we don’t very often clean by ourselves and
the cleaner from the property management company don't frequently clean, either. By
contrast, the lighting of corridor is not bad, it is good.”
Interviewee 1 continued talking: “The drain in this house was good when we moved
in. After that, the drain was plugged several times and we called the staff from the
maintenance department and they came to fix. It is a normal thing (I think).”
Regarding the garbage disposal, Interviewee 1 said: “Although the rubbish left at the
designated garbage can is collected in time and most time disposed efficiently, the
rubbish left at the corridor is not collected immediately (but I think, most residents have
to take these responsibilities of disposing their left corridor’s rubbish and have to bring
it down to the designated garbage can).”
Referring to the staircases which were importantly mentioned in the 2nd
phase of
low-cost housing as the determinant, Interviewee 1 commented on it like “The space of
the staircases is quite narrow, for instance, we cannot carry a big luggage concurrently.
The lighting condition is satisfied, however, the clean condition is not very good.”
Moreover, she added: “The number of stairs in each floor is different from the other and
each floor has its unique numbers of stairs. Besides, that each stair has its own height
which is different from others will easily result in people’s falling down.”
Referring to the electrical & telecommunication wiring (fixed-line telephone,
television, and internet) which was importantly mentioned in the 3rd
phase of low-cost
housing as the determinant, Interviewee 1 answered: “The wiring in this house was
normal when we moved in. After that, we called the staff from the maintenance
department to install more power sockets for us since the numbers of power sockets in

199
this house are very few. But they refused to do it according to their procedures (I
understand that, it is normal).”
6.2.4 Housing Estate Supporting Facilities
In terms of housing estate supporting facilities, Interviewee 1’s residential
satisfaction was positively affected by the parking facilities (electric
bicycle/bicycle/car), open space, and local shops, Interviewee 1 responded: “…I am so
mad about the parking place because of its very limited space. Last time, one of my
friends visited me and she got no place to park her car and then she left her car at the
bicycles’ parking place. After supper, we found a very long scratch on her car side
maybe due to her car occupied their bicycles’ parking places. Moreover, it is very
common here that the parking place is diversely filled with cars and bicycles. Then, the
condition is very bad and chaotic. In addition, the parking place is not clean. Thus, only
increasing the space of parking place is not enough and enhancing the quality of parking
facilities management is very urgent to do.”
Interviewee 1 responded to my asking regarding the open space by saying that “The
open space has a very good location, which is located at the centre of Yangguang
Huayuan, and it has an enough space with a good condition and it is quite clean.
However, sometimes some electric bicycles and small cars park at the open space and
disturbed people’s daily life.”
With respect to the local shops, Interviewee 1 said: “The locations of local shops are
very strategically surrounded the whole Yangguang Huayuan with a large numbers of
diverse shops.”

200
Interviewee 1 responded to my asking regarding the local kindergarten as the
determinant from the 2nd
and 3rd
phases by saying that: “There are two kindergartens
located in this housing area and their conditions are very good and at the same time they
are well maintained and very clean.”
Referring to the children’s playground which was importantly mentioned in the 2nd
and 3rd
phases of low-cost housing as the determinant, Interviewee 1 commented:
“Comparing to the open space, the children’s playground has a limited space and a not-
bad condition and also it is clean. Moreover, its location is quite good which is
connected with fitness equipment area. When the children are playing around, their
parents never feel dull because they can do exercises at the fitness equipment area while
they are watching what their children are doing right there.”
6.2.5 Neighbourhood Characteristics
Speaking of the neighbourhood characteristics, the factors of the nearest school,
resident’s workplace, community clinic, and the nearest general hospital positively
determined Interviewee 1’s residential satisfaction, as she said: “A lot of schools such as
the elementary school, the junior middle school, and even the senior middle school all
are around here within one kilometre. To go to those schools are very convenient.” She
added: “For my workplace around 12 kilometres, it is very long distance and is not
convenient.” Moreover, she talked about the community clinic and she said: “To go to
community clinic (if you had small physical problems) is not far from here and is quite
convenient.” Comparing to the community clinic, the nearest general hospital was
commented by Interviewee 1 like: “The distance from here to the nearest general
hospital is not very far and you can easily get a public bus to go there.”
201
Referring to the local crime situation as the determinant which was most
significantly mentioned in the 2nd
phase of low-cost housing, Interviewee 1 highlighted
and said: “The local crime and accident situations are both very bad such as stealing
electric bicycles, car accidents, etc. The frequencies of happening in terms of crime and
accident are very high. We urgently need a professional property management team to
control it.”
In terms of the nearest bus/taxi station positively determining the 2nd
phase’s
residential satisfaction, Interviewee 1 said: “…It is not convenient to get a public bus to
go to downtown and it is not near to the bus/taxi station.”
The quietness of the housing estate positively determining the 3rd
phase’s residential
satisfaction, Interviewee 1 commented: “The noise came from the open space is I can
tolerate because the place where I am staying is far from there, but the noise came from
the corridor made by the neighbours made me sometimes feel crazy.” Moreover,
regarding the local police station which is the determinant from the 3rd
phase,
Interviewee 1 said: “The local police station is very near here and is very convenient to
go to.” With respect to the community relationship that is the determinant from the 3rd
phase, Interviewee 1 said: “With my references, there is no social exclusion and most
residents are willing to involve all activities arranged by the community committee.”
When we talked about the nearest fire station which is the determinant from the 3rd
phase, Interviewee 1 was getting angry and claimed: “We are quite far away from the
fire station and it is totally inconvenient. This is not the key point; by the way, the most
important thing in here is we don't have any firefighting equipment. You cannot
imagine when we had a big fire…we…how to do…”

202
6.3 Interviewee 2
Interviewee 2 was 47 years old and he had a family with his wife and his daughter,
22 years old. It is easy to tell that he is an honest man. He is working at a private
company as an assembly worker. He said: “I did not like to study since I was a boy. I
finished my junior middle school and I went to a factory to work. After the state-owned
company commercialised, I went to a private company and worked there until today. I
am an ordinary person and I don't need too much and my household’s monthly income
is under 4000 RMB. Happiness is very important for me.” Interviewee 2 lived on the 1st
floor and he lived at Yangguang Huayuan for almost 9 years. He used a bicycle to go to
work and go shopping.
6.3.1 Individual and Household’s Socio-economic Characteristics
Interviewee 2’s residential satisfaction in Yangguang Huayuan was positively
affected by the floor level and he explained: “My experiences teach me not to choose
the first floor again if I have another chance to buy a new commodity house. Although
living on the first floor brings me a lot of conveniences and joys such as no need to
climb higher floors and we have a small yard (each first floor house has one small yard)
to use for enjoying the breeze and cool during spring and summer, sometimes living on
the lower floor level is mostly affected by the smelling of garbage and crowd noise
comparing to living on the higher floor level.”
For those who were using bicycles and cars for the main means of transportation,
Interviewee 2 complained: “People who are living in Yangguang Huayuan are not so
rich enough to use cars and everyday worry about where can park their cars. We
understand this Yangguang Huayuan is not a high-end housing property which cannot
provide a lot of car parks for us. On the contrary, the electric bikes and bicycles are our
main means of transportations and a lot of people accuse of the electric bikes and new

203
bikes losses in this housing area. So I think this housing estate needs to build more
space for car parking and more proper parking facilities management skill.”
Interviewee 2 thought that the people with higher position in their jobs living in this
area were not more satisfied with the people with lower position, because he said: “The
social exclusion existing between residents with high position and residents with low
position of occupations in this housing area results in the residents with higher position
in their occupations accusing of the behaviours of lower position of residents. However,
the majority living in this area is the residents with medium-low and low position in
their occupations who ignore what the residents with high position in their occupations
accuse of and they are happier than them.”
Referring to the housing ownership, Interviewee 2 had his plan and he said: “The
reason why I look at the housing ownership is very important to me is because I am
planning to change a new commodity house after my daughter will get married soon and
I can use the dower money and another amount of money that I sold my current house,
and my savings together to buy a new cheaper apartment. That’s why I need this house
ownership immediately.”
6.3.2 Housing Unit Characteristics
Interviewee 2 thought the improvements of the bedroom and dining area could
enhance his residential satisfaction of Yangguang Huayuan and he said: “The bedroom,
comparing to the whole size of this house, is slightly smaller and has a bad location with
a bad lighting and bad ventilation. My daughter lives at that room and it seems okay to
her regarding the numbers of power sockets because the time she spends on works is
much more than the time she stays at home…ha-ha…it is enough for her, I think…”

204
Interviewee 2 continued saying: “The size of the dining area is lovely, but the
location is improper connected with the living room which I don't like because Chinese
traditional culture teaches us eating and entertaining should be separated and they are
conflicted each other. The lighting is good, but the ventilation is not enough and the
numbers of power sockets are enough for me.”
Regarding the drying area which was highlighted in the 2nd
phase of low-cost
housing, Interviewee 2 replied: “The drying area in my house has a plenty space with
good ventilation and a good lighting and the numbers of power sockets are very enough
when my wife is ironing clothes.”
With respect to the living room which was highlighted in the 3rd
phase of low-cos
housing, Interviewee 2 said: “As I just commented on the dining area, the size of the
living room is very good, but the location is improper connected with dining area. The
living room is like the dining area with not good ventilation, but the lighting is good by
the way. For me, the numbers of power sockets are just enough for using.”
6.3.3 Housing Unit Supporting Services
In terms of housing unit supporting services, Interviewee 2 claimed that the
improvements of the corridor, drain, and garbage disposal could enhance his residential
satisfaction and he said: “…The space of corridor is just enough for normal using and
the lighting condition is good and the cleanness that we maintain is so far good.”
With respect to the drain, Interviewee 2 wanted to say more words on that: “When I
moved into this house, many kinds of problems came from this drain system. I tried to
fix it by myself, but I failed. And then, I called someone from the property management
to come and fix, but the result is not good enough. It is very headache…”

205
Interviewee 2 gave some comments on the garbage disposal like that: “The rubbish
that we left at the garbage can is collected on time, but the garbage house is sometimes
not cleaned thoroughly and the smelling sometimes is blown by the wind into the lower
floor of houses such as my house.”
Referring to the factor of staircases which was highlighted in the 2nd
phase of low-
cost housing as the determinant, Interviewee 2 said: “Except for not clean, the space of
the staircases is just enough for using and the lighting is good.”
With respect to the factor of the electrical & telecommunication wiring (fixed-line
telephone, television, and internet) which was highlighted in the 3rd
phase of low-cost
housing as the determinant, Interviewee 2 gave a high comment on it: “When we moved
into this house, all wiring is under good condition and during my stay we called the staff
from the maintenance department twice to come over to fix those small problems and
the experiences were good.”
6.3.4 Housing Estate Supporting Facilities
In terms of housing estate supporting facilities, the factors such as the parking
facilities (electric bicycle/bicycle/car), open space, and local shops positively
determined Interviewee 2’s residential satisfaction. To illustrate, he said: “As I
answered the previous question regarding the main means of transportation, except for
the cleanliness of parking area, the space and the condition are all dissatisfactions, for
example, the space is very limited for cars and the bicycles are parking everywhere and
it is very chaotic.”
Interviewee 2 continually pointed out: “The open space is not very enough space, but
has a good condition and a good location; by the way, it is also clean. However, when
the open space is fully filled with many different facilities to attract a lot of residents,

206
the many noises from the open space are going to the lower floor level of houses such as
my house and I feel very noisy especially Saturday and Sunday and I cannot take a nap
after Saturday and Sunday’s lunch.”
In terms of the local shops, Interviewee 2 explained: “…the numbers of local shops
are okay and their locations are normal…”
Interviewee 2 responded to my asking regarding the local kindergarten as the
determinant from the 2nd
and 3rd
phases by saying that: “The kindergarten, actually we
have two kindergartens in Yangguang Huayuan, both are okay with environment and
location and the cleanness is good.”
Referring to the children’s playground which was importantly mentioned in the 2nd
and 3rd
phases of low-cost housing as the determinant, Interviewee 2 replied: “The space
for children’s playing in Yangguang Huayuan is not very big, but the environment and
cleanness are good. On the contrary, the location is very bad which is connected with
the perimeter road. It will probably bring some accidents by the residents’ riding their
bicycles on the perimeter road.”
6.3.5 Neighbourhood Characteristics
In terms of the neighbourhood characteristics, Interviewee 2’s residential satisfaction
was positively affected by the nearest school, resident’s workplace, community clinic,
and the nearest general hospital. Furthermore, Interviewee 2 explained: “A lot of
schools surrounding this area within 2 kilometres are very convenient to reach there
because this district is quite maturing filled with a lot of education institutes.”
Interviewee 2 continually said: “…the community clinic is also convenient and it is not
far from here.” On the contrary, Interviewee 2 criticised: “…However, my workplace
from here is around 18 kilometres because this Yangguang Huayuan constructed for the
207
medium-low and low income group of people having a unit of low-cost housing or a
unit of resettlement housing under a certain kind of municipal subsidies especially for
the low-cost housing is therefore located far away from the downtown due to the land
cost. Most people are working in the downtown (I am also), therefore, it is a very long
distance for my riding a bicycle to go to work and it is not convenient.” Moreover, he
added: “The nearest general hospital from here is around 7 kilometres and I think it is
not convenient, am I right?”
With respect to the local crime situation and local accident situation which positively
determined the 2nd
phase’s residential satisfaction, Interviewee 2 said: “To more
illustrate this kind of situation happening in Yangguang Huayuan, let me give you a real
example. I had lost three bikes within one month, so how do you think of the safety in
Yangguang Huayuan? Regarding the accident situation, there are a lot of kindergarten
kids and pupils running everywhere after school, a lot of accidents are happening in this
period of time by the electric bicycles colliding with cars. Thus, the situation is very bad
with medium frequency of occurrence. This needs to be controlled by either district
government or our own strength such as residents’ involvements (public participation)
to form a community defence team to protect ourselves.”
In the 2nd
phase, the nearest bus/taxi station also positively determined their
residential satisfaction. Interviewee 2 said: “Comparing to taking a bus to go to work, I
choose riding a bicycle in spite of having some risks of losing bicycles. It is still
convenient comparing to taking a bus and the nearest bus/taxi station is not that near
enough, i.e. around 1.5 kilometres from here.”
Interviewee 2 responded to how to look at the factor of quietness of the housing
estate which positively determining the 3rd
phase’s residential satisfaction by saying that
“…So many noises not only came from the corridor (neighbours) but also came from

208
the open space trouble me a lot especially Saturday and Sunday afternoon when I was
on lunch break, it is so annoying.” Interviewee 2 had few words about the local police
station “…it is near here and we can see they are doing patrolling several times per
day…” On the contrary, Interviewee 2 talked a bit more about the factor of the nearest
fire station, such like “In spite of how far between the nearest fire station and
Yangguang Huayuan is, in fact, the distance is actually quite far from here, there is no
such a piece of firefighting equipment and firefighting prevention equipment assembled
in this housing area. How dangerous it is, we don't have any methods to prevent a fire
happening and we don't have any solutions to put out a fire (if we had a big fire) except
for calling 119 (Chinese fire emergency call). I have been so frustrated.” Interviewee 2
went on with some stern words on the community relationship “(Maybe this is only my
experience), there has a strong social exclusion existing in this housing area between the
low-income group and the medium-income group, for example, the medium-income
group of residents who is not satisfied with the current living environment, but, has no
money to buy a new commodity housing dislikes the low-income group of residents in
terms of their behaviours such as some activities and their ways of lives. Furthermore,
they stay away from any activity involvements and they try their best to avoid any
connections in this housing area, for instance, they park their cars very far away from
their bicycles because they worry about any scratches made by them can trigger their
quarrelling and they don't want any arguments with them and they thought finally they
had no money to pay for repairing, therefore, they chose to stay far and far away from
them and they don't want any troubles with them. Some activities arranged by the
community committee force them to take part; the whole process is no talking between
these two groups of residents. I am one of them who are low-income group of residents,
but I understand what the medium-income group of residents think. Nevertheless, I
don't like this kind of situation happening in this housing area.”

209
6.4 Interviewee 3
Interviewee 3 was 49 years old and he had a lovely family with his wife and his son,
23 years old. It was unfortunate for him to have a cancer of the liver in 2011. Luckily he
did a successful operation in 2013 and at the same time, he was away from work for
illness. Before 2011, his body had not been in good condition for many years and he
only could do what he was capable of. Thus, his wage was very low. Nevertheless, he
was constantly saying he was a lucky man over and over again when I was interviewing
him. He said: “…apparently, having such a disease is a kind of misfortune for me. But, I
am so lucky. When I first time was aware of my body was not as good as before in
2006, I was working at a collective-owned company and I lived with my wife and my
son in the factory’s dormitory (I bought this dormitory during Chinese housing
commercialisation in the end of 1990s). I thought I would be fired due to my physical
condition. Fortunately, I could continue staying at the company and continue working.
The company did not fire me, instead, arranged me to do some light works because they
thought that I needed money more than others to pay for the medication. In 2007, (I am
lucky), when the 2nd
phase of low-cost housing opened for applying, I was eligible, but I
don't have money, even I sold that factory’s dormitory. After that, my whole siblings
gave me money to pay for the 2nd
phase of low-cost housing plus my own money from
the selling of that factory’s dormitory (not too much due to the many years of using and
the small-sized house), I feel I am lucky. I have been working at this company since I
graduated from the senior middle school. Additionally, many thanks go to our
government to launch this low-cost housing programme which although has some
problems that cannot satisfy all residents, it can fulfil some people’s housing needs.”
Interviewee 3 lived on the 2nd
floor, block 13, and he lived at Chengshi Huayuan (the
2nd
phase of low-cost housing in Xuzhou city) for almost 6 years. Since he had a cancer

210
of the liver, his eyesight had been falling for a long time, most of his time he walked
around by foot and he also took bus to do some shopping.
6.4.1 Individual and Household’s Socio-economic Characteristics
Interviewee 3’s residential satisfaction in Chengshi Huayuan was positively affected
by the main means of transportation (by driving vs. by foot) and he explained: “Living
in Chengshi Huayuan is very convenient for the age of retiring to go to local market by
foot because the local market is the right at the entrance of this housing estate. I can see
a lot of retired residents including me to go to the local market for daily shopping. On
the other hand, the public transportation has to be enhanced immediately according to
the current situation is that only one shuttle bus going to the downtown takes around
one hour single-trip and the waiting period between two shuttle buses is around 20-25
minutes. For those who are driving to work, the parking facilities in Chengshi Huayuan
are very poor and the parking area is also overlapped with the children’s playground.
You can see a lot of quarrelling regarding the parking facilities.
Regarding whether the occupation type affects residents’ housing satisfactions,
Interviewee 3 said: “Different people with different occupation types have their
different aspirations of housing satisfactions. No matter how different, the basic living
requirements have to be achieved or fulfilled.”
In terms of the factor of floor level affecting residents’ housing satisfactions,
Interviewee 3 replied: “People who are living on the different floors have different
feelings, even living on the same floor but living in the opposite unit (it is standard:
there are two units in each floor) probably has a different feeling about it, but the
physical design (it is the standard: the basic design for the low-cost housing in the 2nd
phase is the same) bringing to residents, I think, is the same basically.”
211
A lot of residents concern about their homeownership, Interviewee 3 said: “My
experience told me that enjoy the present and leave your worries behind you. The
homeownership is every resident living in Chengshi Huayuan wants, but the time when
we can purchase another half of homeownership from the local government is decided
by the local government based upon the law of local market economy. Thanks our
central government for having this low-cost housing programme to give me a chance to
live at a bigger house.”
6.4.2 Housing Unit Characteristics
Interviewee 3’s residential satisfaction in Chengshi Huayuan was positively
influenced by the drying area, he said: “The size of the drying area is too small and no
wind passes through so that the washed clothes are not easy to dry up. Moreover, the
numbers of power sockets are enough. However, the lighting there is bad.”
Continually with bedroom also determining Interviewee 3’s residential satisfaction,
he responded: “…for the whole house, the bedroom seems to be slightly smaller and its
location is not good without any ventilation…the lighting is also not good…”
Regarding the dining area which was importantly mentioned in the 1st phase of low-
cost housing, Interviewee 3 answered: “The first thing related to the dining area is the
improper location which is badly connected with kitchen. This house does not have a
real kitchen which means that the kitchen is located at the balcony and after balcony is
the dining area. The size of ‘kitchen’ is very small and not well ventilated. After
cooking, the cooking oil fume goes to the dining area where we are having a meal. As
the size of the dining area is small and not well ventilated, the cooking oil fume in the
dining area does not easily volatilise. By the way, the lighting is not good. The numbers
of power sockets are enough.”

212
Referring to the living room which significantly determined the 3rd
phase’s
residential satisfaction, Interviewee 3 commented: “The living room is very big.
However, the location like the dining area is improper due to being influenced by that
kitchen especially when doing cooking. Moreover, it also is not well ventilated and has
a bad lighting. The numbers of power sockets are just enough for using.
In terms of the toilet, Interviewee 3 was a bit emotional and said: “The toilet is the
worst part in this house due to its very small size, very bad location, no ventilation, and
it is very dark without turning on the lamp.
6.4.3 Housing Unit Supporting Services
In terms of the staircases positively determining Interviewee 3’s residential
satisfaction, he said: “The staircases and corridor are quite narrow and there is no single
lamp at all. The staircases and corridor are cleaned once a week. They are not clean.”
Referring to the drain as the determinant which positively determined the 1st phase’s
residential satisfaction, Interviewee 3 responded: “The drain was not good when we
moved in. After that, frequently changing Chengshi Huayuan’s property management
company has been bringing a lot of troubles in maintenance. Therefore, they are dealing
with the bad maintenance.”
The factor of garbage disposal also significantly determining the 1st phase’s
residential satisfaction, Interviewee 3 answered: “…they come and clean the garbage in
time and most of time they clean thoroughly. Sometimes they don't…”
With respect to the electrical & telecommunication wiring (fixed-line telephone,
television, and internet) which was one of determinants in the 3rd
phase of low-cost
housing, Interviewee 3 complained: “When we moved into the new house, the quality of

213
wiring was not so good. The maintenance due to they changed the property management
company frequently is also not good.”
6.4.4 Housing Estate Supporting Facilities
The factor of local shops drew people’s attention in the 2nd
phase of low-cost housing
and was one of key predictors to determine Interviewee 3’s residential satisfaction. He
said: “The numbers of local shops are usual. However, the location is so bad conflicted
with Chengshi Huayuan’s open space which is affecting residents’ after-dinner walk in
some way.”
Furthermore, Interviewee 3 commented on the local kindergarten such like
“…comparing with other kindergartens located in the urban area, Chengshi Huayuan
kindergarten is very normal with normal condition because those good teachers
definitely go to urban area to teach there and here the teachers mostly come from the
surrounding countryside…the sanitary condition is good…”
The children’s playground positively determined Interviewee 3’s residential
satisfaction, he replied: “…most space of the children’s playground is occupied by the
parking facilities in Chengshi Huayuan to cause a danger to those children who are
playing at the so-called children’s playground…of course…the space is reduced and the
condition is very complicated with the conflictions involved with the parking issues and
is not clean…”
In terms of the parking facilities (electric bicycle/bicycle/car) positively determining
the 1st phase’s residential satisfaction, Interviewee 3 pointed out: “…like above
mentioned, the parking facilities (area) in Chengshi Huayuan had conflicts with the
children’s playground and with the fitness equipment (area) as well. In addition, there is
no special lamps installed at the parking area and only has the aid of the street lighting

214
to light up the parking area. The parking area is very limited space without any car park
facilities and most of time cars and bicycles are mixed together to park there. It is very
chaotic…and it is not clean at all…”
Regarding the open space determining the 1st phase and 3
rd phase’s residential
satisfactions, Interviewee 3 said: “As I said (just now) regarding the local shops
occupying a lot of spaces from the open space, its space is not big enough for residents’
leisure and the condition is not so good and is not clean as well. The most important
thing that has to be concerned is the lighting problems. In the evening, very few lamps
are working. I think it is very dangerous especially people like me does not have a good
eyesight.”
6.4.5 Neighbourhood Characteristics
The local crime situation in Chengshi Huayuan drew a lot of residents’ attention and
also determined Interviewee 3’s residential satisfaction, he said: “The main crime
happening in Chengshi Huayuan is the bicycle-stealing, for instance, last month one
milkman stopped his electric tricycle at the front of Block 13 and he distributed the milk
from door to door. After one block’s distribution, he found his electric tricycle was
stolen with the left undelivered milk missing. Only around 10 minutes in the early
morning, the whole thing is stolen. I don't think this thing is premeditated by someone.
It happened randomly. Thus, you can see how bad the local crime situation is…this
thing happens quite often, but not very often…”
The nearest school to Chengshi Huayuan was not near said by Interviewee 3 and this
factor affected 2nd
phase’s residential satisfaction a lot. Wang said: “Sending children to
the nearest school is a big headache for most parents living in Chengshi Huayuan
because of the long distance with around 5 kilometres and the lack of public
transportation. No matter how good or bad the school is, going to school cannot be a

215
difficult thing basically. Actually, the quality of the nearest school is of course not
good.”
Interviewee 3 complained regarding the bus/taxi station “…the bus/taxi station is not
only far from here, but only one shuttle bus passes by and the waiting time is around 20-
25 minutes and very few taxies wait over there. Besides, from home to the bus/taxi
station, more than 1 kilometre, takes around 10 minutes or more. The time of the last
shuttle bus is before 6 pm. After 6 pm you only can take a taxi or ride a bicycle back
home. It is expensive to take a cab because of the long distance from the downtown. So,
you only have one choice left to ride a bicycle…”
After talking about the bus/taxi station, Interviewee 3 forgot telling one more thing
and he said: “Many accidents happened at near the bus/taxi station because the location
of Chengshi Huayuan is far away from the urban area and the cars pass by at high
speed. Thus, the accident situation is bad…it is not very often to happen…”
The factor of the resident’s workplace positively determined the 1st phase’s
residential satisfaction, Interviewee 3 said: “…it is a long distance with 12 kilometres
from home to my working place (after I had an operation, I retired and opened a kiosk)
and it is not convenient to reach there…” Luckily, there has a new and fully equipped
community clinic (hospital) around Chengshi Huayuan, and Interviewee 3 said: “…it is
very and very convenient for me to take medication at the nearby community
clinic…actually that is not a clinic…I think…it is a hospital with fully equipment and it
is very clean…” On the contrary, Interviewee 3 said: “…the nearest general hospital is
very far and very inconvenient…”

216
With respect of the quietness of the housing estate, Interviewee 3 said: “…it is very
normal about the quietness in Chengshi Huayuan…” Furthermore, he commented on the
local police station “It is not far and is convenient.” With respect to the nearest fire
station, Interviewee 3 said: “It is far from the fire station to Chengshi Huayuan and we
don't have the firefighting equipment…” Talking about the community relationship,
Interviewee 3 said: “The residents here are more active involvement and we don't have
a feeling of social exclusion…”
6.5 Interviewee 4
Interviewee 4 was 50 years old and he had an ordinary family with his wife and his
son, 25 years old. He went to work directly after completing his senior middle school
and now he worked at a private company as an after-sale service supervisor and his
currently monthly income made him quite satisfactory. Interviewee 4 lived on the 4th
floor, block 18, and he lived at Chengshi Huayuan for almost 6 years. He rode an
electric bicycle to go to work daily.
6.5.1 Individual and Household’s Socio-economic Characteristics
In the light of the factor of the main means of transportation (by driving vs. by foot)
as one of determinants predicted Interviewee 4’s residential satisfaction in Chengshi
Huayuan, he illustrated: “As the location of Chengshi Huayuan is quite far away from
the urban area, a lot of residents take bus to go to work or send their children to school.
However, here is the only one shuttle bus and each shuttle you have to wait is around 30
minutes. Accordingly, I abandoned taking a bus instead of using an electric bicycle to
go to work. Unfortunately, on account of the long distance between my workplace and
Chengshi Huayuan, my electric bike only can run a single way on a single charge. In
addition, the parking place in Chengshi Huayuan is very limited and is not well
managed causing a lot of electric bicycles stolen and some cars being scratched. On the

217
contrary, I think a lot of the retired residents are enjoying their lives, for instance, they
don't need to go to the urban area for shopping because here we have a relative big local
market in which a lot of fresh vegetables are supplied by the neighbouring villages. The
distance is very near around 200 metres, so they walk there and in the meantime, they
also can do exercises…”
According to the factor of floor level positively affecting the 1st and 3
rd phases’
residential satisfactions, Interviewee 4 said: “Except for the top floor and the first floor,
the others are almost same because the top floor is very cold during winter and is very
hot during summer and the first floor has a lot of mosquitoes during summer and the
smelly garbage is blown into the house during summer.”
Although the factor of occupation type negatively influenced the residential
satisfaction of Yangguang Huayuan, Interviewee 4 replied: “…different occupation
types could not affect residents’ housing satisfactions too much in Chengshi
Huayuan…”
Interviewee 4 said: “Comparing with these mentioned factors, what most residents
concern about is the homeownership. We need the full homeownership for the next
purchase of the second commodity housing.”
6.5.2 Housing Unit Characteristics
Interviewee 4’s residential satisfaction in Chengshi Huayuan was positively affected
by the drying area, he said: “The design of drying area in Chengshi Huayuan comparing
to Yangguang Huayuan and Binhe Huayuan (3rd
Phase) is very bad with its limited size
and it’s no ventilation. Besides, the lighting is not good. The numbers of power sockets
are enough for daily use.”

218
Li continually talked about the bedroom “Comparing with the 1st phase, the quality
of bedroom in the 2nd
phase is not good such as its smaller size, and a western exposure
location causing a bad lighting and no ventilation; and cold in winter and hot in
summer. The worst thing is due to the location of bedroom is facing west the wooden
furniture has already gone mouldy. Additionally, the numbers of power sockets are not
enough.”
Regarding the dining area positively determining the 1st phase’s residential
satisfaction, Interviewee 4 said: “The size of the dining area is not big and the location
is not satisfied due to its bad lighting and bad air flow. In addition, fewer power points
make me dissatisfied as well.”
With respect of the living room which significantly determined the 3rd
phase’s
residential satisfaction, Interviewee 4 said: “It is better than the dining area basically
due to its good size. However, the location is also not satisfied to bring lighting and
ventilation problems. The numbers of power sockets are fewer.”
Speaking of the toilet, Interviewee 4 said: “The toilet has a lot of problems, for
example, it has a very small size and is located at a small corner without any ventilation
and the lighting is very bad. The worst toilet (I think) belongs to the first floor house,
i.e. the water closet is sometimes clogged and it overflows.
6.5.3 Housing Unit Supporting Services
Regarding housing unit supporting services, Interviewee 4 gave a same comment on
the staircases and corridor. He said: “Both staircases and corridor are quite narrow and
don't have any lamps at all. In addition, these two places are very dirty.”

219
In terms of the drain in Chengshi Huayuan, Interviewee 4 said: “It has not been good
since I moved into this house…” On the contrary, the electrical & telecommunication
wiring (fixed-line telephone, television, and internet) was different like Interviewee 4
said: “…the electrical wiring has been okay since I lived here…” Furthermore, he
commented on the garbage disposal such as “…they leave the garbage can uncleaned
and never clean thoroughly…”
6.5.4 Housing Estate Supporting Facilities
Although the factor of the local shops as one of the determinants affected the 2nd
phase’s residential satisfaction, Interviewee 4’s commentary was very ordinary, such
like “…the numbers of local shops are sufficient…the locations are okay…surrounding
the living area…” Furthermore, the commentary on the local kindergarten was almost
same as the comment on the local shops, i.e. Interviewee 4 said: “…in light of our
current situation, it is nearly impossible that a good kindergarten will open a new branch
here unless the local government will assign a good kindergarten or even more good
elementary school, junior middle school, and senior middle school to be opened
here…therefore, the current local kindergarten is a normal one with normal condition
and it is clean (by the way)…”
Interviewee 4’s residential satisfaction was positively affected by the children’s
playground, he said: “…the priority thing related to the children’s playground is to
install more lamps as soon as possible for their safety consideration. Secondly, the space
is not big enough for them and the condition is very complicated. Thirdly, the cleanness
is another issue which has to be paid more attention to…”
In terms of the parking facilities (electric bicycle/bicycle/car), Interviewee 4 said:
“The lighting is the priority which has to be considered. The current lighting is from the
street lamp. It is very weak. Secondly, the space of parking area is very limited for car

220
and bicycle especially for car. Thirdly, the condition is not good and very chaotic.
Lastly, it is not clean.”
In regard to the open space, Interviewee 4 said: “The space is not big enough for
residents’ recreations and the condition is not satisfied. The lack of lighting also has to
be paid attention to because a lot of people are dancing in the evening and their safety is
the priority. And the cleanness has also to be paid attention to…”
6.5.5 Neighbourhood Characteristics
How to improve the local crime and accident situation of Chengshi Huayuan were
what a lot of residents concerned about. Interviewee 4 said: “To enhance the safety and
prevent the accident happening should ask all residents to join together and work
together in order to protect each other. ‘Know your neighbours to prevent the crime’ is a
very good slogan. Furthermore, to improve the public participation can bring down the
rate of crime and accident happening. However, the current local crime and local
accident situation is not good, such as bicycle stealing, burgling, car and electric bicycle
accident, etc. Actually the frequency of occurrence is often, but not very often.”
As the factor of the nearest school positively and significantly determining the 2nd
phase’s residential satisfaction, the reason was explained by Interviewee 4: “…as I
mentioned regarding the kindergarten, due to the location of Chengshi Huayuan couldn't
attract any high-qualified teachers, a lot of kids are trying their best to enter those key
senior middle schools (before senior middle school, the kids cannot enter different
districts’ elementary and junior middle schools, they must enter the nearest schools)
which mostly locate at urban areas. Therefore, the distance from here to those good
senior schools are very far and very inconvenient. Comparatively speaking, the nearest
schools to Chengshi Huayuan are relatively near (but still not near) around 4 kilometres.

221
Moreover, it is not convenient to go there due to the condition of local public
transportation is seldom.”
The factor of the nearest bus/taxi station positively determined Interviewee 4’s
residential satisfaction, he said: “As I mentioned previously, here is the only one shuttle
bus and each shuttle you have to wait is around 30 minutes. The numbers of taxies
waiting at the bus/taxi station are quite few (the taxi driver knows those residents who
live here are medium-low income group of people and very seldom take taxies).
Furthermore, from home to the bus/taxi station is a very long way took around 8-10
minutes. It is very inconvenient.”
As the factor of the resident’s workplace positively determined the 1st phase’s
residential satisfaction, Interviewee 4 said: “It has around 20 kilometres from home to
my working place and it is not convenient to reach there due to the very limited means
of transportation, i.e. only one shuttle bus and very few taxies. For me, I take an electric
bike to go to work and I leave the battery at the office for charging while I am working.
If I don't come home directly, I won’t use this electric bike because it cannot reach
home on one single charge. What a pity…”
A lot of facilities were criticised by Interviewee 4, but he gave a high comment on
the community clinic. He said: “We have a very good community clinic; actually I think
it is a (community) hospital, it is very near and it has a lot of doctors and the condition
is very comfortable. On the contrary, if some residents must go for emergencies, this
(community) hospital does not have an emergency department and they have to go to
the nearest general hospital which is around 20 kilometres away from here. It is very far
and inconvenient.”

222
Referring to the quietness of the housing estate, Li said: “It is a very normal
condition in Chengshi Huayuan. We can hear the noises from the open space and from
our neighbours as well. It is very normal for this price of housing without sound-
proofing walls (I think)…”
With respect to the local police station, Li said: “It is not far from here around 3
kilometres and reach there easily. However, we have a police station around here, but
we still have some certain numbers of crimes and accidents. That is my curiosity.” On
the contrary, Interviewee 4 said: “Chengshi Huayuan is very far away from the fire
station. Besides, we don't have the firefighting equipment to prevent and to put out a
fire. It is very dangerous for us.”
Regarding the community relationship in Chengshi Huayuan, Interviewee 4 said: “I
hope that residents’ more involvements and more public participations will better
prevent the occurrence of crimes and will better decrease accident rates.
6.6 Interviewee 5
Interviewee 5 was 53 years old and he had a family with his wife and his daughter,
25 years old. He previously had been working at a state-owned company for around 30
years since he graduated from the senior middle school. As the company did downsizing
in 2009, he was laid off. And then, until now he has been working at another state-
owned enterprise as a temporary worker. Therefore, his payment is not very high.
Interviewee 5 lived on the 2nd
floor, block 54, and he lived at Binhe Huayuan (3rd
phase
of low-cost housing) for 3 years. He daily used an electric bike to go to work.
6.6.1 Individual and Household’s Socio-economic Characteristics
With respect of the factor of main means of transportation (by driving vs. by cycling)
negatively affecting Interviewee 5 residential satisfaction in Binhe Huayuan, he

223
expounded his opinion “Most residents who are riding bicycles to go to work or to go
shopping are not satisfied due to the distance between the downtown and Binhe
Huayuan is quite far. Secondly, they don't have enough savings for buying cars and they
envy those people who have cars. They do believe that driving to work or somewhere is
a very happy thing. Thirdly, due to few shuttle buses stop at this station, they have only
one choice left here which is to ride bicycles to workplaces.”
Interviewee 5 responded to my asking regarding the factor of floor level (4th
floor vs.
3rd
floor) positively affecting his residential satisfaction by saying: “Those residents who
are living on the top floor and on the first floor are mostly not satisfied due to the top
floor is very cold in winter and is very hot in summer and the first floor is very easy to
get dirty, and especially in summer has a lot of flies and mosquitoes. Accordingly,
residents living on the middle floors are more satisfied, such as 3rd
floor and 4th
floor…”
Interviewee 5 responded to my asking referring to the factor of occupation type
negatively influencing the residential satisfaction of Yangguang Huayuan by saying:
“…I don't think it is happening in Binhe Huayuan. Different people have different
occupation types, but more affecting their residential satisfactions is the living
environment itself…” Interviewee 5 continued saying: “The homeownership is a
probably main issue which affecting residents’ housing satisfactions to some extent. As
for me, I need my full homeownership as soon as possible so that I can sell this house to
buy the next one. The good thing is that the price of the current houses that we bought
was much lower than the commodity housing market and even later we have to pay the
land transfer fund to the local government, we definitely make some money. So we can
use the extra money to pay the next commodity house with better living conditions.”

224
6.6.2 Housing Unit Characteristics
Interviewee 5’s residential satisfaction in Binhe Huayuan was positively affected by
the living room, he said: “The most satisfaction place in the housing unit is the living
room which has an appropriate size space and a proper location. However, it is not good
in ventilation and lighting. In addition, the numbers of power sockets are just enough for
using.”
Referring to the bedroom determining the 1st and 2
nd phases’ residential satisfactions,
Interviewee 5 said: “Comparing with the master bedroom, it is slightly smaller one with
a normal location. The ventilation is not as good as the master bedroom has due to the
direction of facing. The lighting is normal and the numbers of power sockets are
shortage.” In the meantime, the 1st phase’s residential satisfaction was positively
affected by the dining area, Interviewee 5 said: “The size of the dining area is not big.
Not just this, the location is improper which is badly closer to the toilet. The ventilation
is not good with a bad lighting. Fortunately, the numbers of power sockets are just
enough for using.
The drying area was significantly highlighted in Chengshi Huayuan, Interviewee 5
responded: “…the drying area has an appropriate space with a well-ventilated design
and a good lighting. Yet amazingly, there has no power socket in this area…”
Moreover, Interviewee 5 also commented on the toilet, he said: “The size is very
normal. The bad location which is very near to the dining area troubles me (maybe some
people think it is normal, but I do mind). The ventilation design and the lighting are all
bad. In addition, it is very inconvenient for using any electrical devices in the toilet such
as hair dryer, heater, etc. due to only one power socket installed in the toilet.”
225
6.6.3 Housing Unit Supporting Services
In terms of housing unit supporting services, Interviewee 5’s residential satisfaction
was positively affected by the electrical & telecommunication wiring (fixed-line
telephone, television, and internet) and corridor. Interviewee 5 said: “The wiring in this
house was normal when we moved in. After that, I wanted to install more power
sockets, but I failed and called the staff from the property management company to help
me install more power sockets. Their services are normal…” With respect to the
corridor, Interviewee 5 complained: “The corridor is quite narrow and is unclean. There
has no lighting at all. Sometimes, many noises from neighbours disrupt our rests.”
Referring to the drain and garbage disposal determining the 1st phase’s residential
satisfactions, Interviewee 5 said: “The drain in this house was normal when we moved
in. The maintenance is normal as well.” Interviewee 5 complained about the garbage
disposal “…one block’s garbage collection spot is at the children’s playground and
brings a lot of troubles to the children. In general, most of the time they clean the
garbage can in time, but they never clean thoroughly…”
Referring to the staircases which were significantly highlighted in the 2nd
phase of
low-cost housing, Interviewee 5 said: “The space of the staircases is just enough for
using. However, there has no single lamp at all. In addition, it is very unclean.”
6.6.4 Housing Estate Supporting Facilities
As the factor of children’s playground positively determined Interviewee 5’s
residential satisfaction, he replied: “The space of children’s playground is not big with a
bad location. One block’s garbage collection spot is at the children’s playground
causing the condition not clean and not satisfied and bringing a lot of troubles to
children at same time. The most important thing is the lighting issue which currently
uses the street lamps to light up the area of children’s playground. As a result, due to the

226
defects and shortages of street lamps only can light up very small area of children’s
playground. Thus, we need a specific lighting only for the children’s playground and
then it can enhance children’s safety there.”
With respect of the open space positively determining Interviewee 5’s residential
satisfaction, he responded: “…it is not a very big place with a normal location. The
condition is not good with the lighting problems which have been lying on the table for
a long time due to the property management companies have been being changed
frequently…by the way…it is not clean at all…in addition, the numbers of fitness
equipments comparing with Yangguang and Chengshi Huayuan are much fewer…we
need more fitness equipments…due to our open space is very limited comparing with
Yangguang Huayuan’s, we need more recreation places where we can have chats with
friends and play chess with friends…”
In terms of the factor of local kindergarten significantly affecting the 3rd
phase’s
residential satisfaction, Interviewee 5 said: “The local kindergartens are very normal
comparing with those kindergartens located in the city centre which have a lot of good
teachers. The conditions are also very normal because the small number of enrolment
decides upon their small amount of investment. Luckily, these local kindergartens are
well maintained and very clean.”
With reference to the local shops which significantly determined Interviewee 5’s
residential satisfaction, he said: “The location of local shops is very bad because they
are located at the first floor of the first row of the houses. And then, many noises came
from those shops disturb residents especially who are living on the second floor in those
same blocks. Except for these shops, we need more diversified shops.”

227
Regarding the problem of parking facilities (electric bicycle/bicycle/car) seriously
affecting Yangguang Huayuan’s residential satisfaction, Interviewee 5 responded: “The
parking space in Binhe Huayuan is very enough and the condition of parking facilities is
very good. The parking area is clean.”
6.6.5 Neighbourhood Characteristics
Apart from some local shops locating at the first floor of the first row of the houses
affecting the quietness of the housing estate, Interviewee 5 continually explained:
“Many noises come from our neighbours such as children’s playing and fighting,
couple’s quarrelling, and sound of television, etc. The noise came from the open space
is normal.”
Regarding the local police station which influencing 3rd
phase’s residential
satisfaction, Interviewee 5 said: “The nearest police station is quite far from here around
10 kilometres and is not convenient.”
Comparing with the 1st and 2
nd phases regarding the nearest fire station which
significantly determined Interviewee 5’s residential satisfaction, he said: “We are far
away from the fire station and it is absolutely inconvenient. In addition, all three phases
don't have any firefighting equipments. It is very dangerous.”
In terms of the community relationship (community committee-residents/social
cohesion/social harmony) significantly determining Interviewee 5’s residential
satisfaction, he responded: “…according to my knowledge, there is no social exclusion
and most residents are willing to involve all activities arranged by Binhe Huayuan’s
community committee…”
228
With respect to the factor of the nearest school which positively determined 1st and
2nd
phases’ residential satisfactions, Interviewee 5 said: “A lot of schools such as the
elementary school, the junior middle school, and even the senior middle school all are
not far from here around 4 kilometres. It is convenient to go to those schools.”
Referring to the factor of resident’s workplace determining the 1st phase’s residential
satisfaction, Interviewee 5 said: “From my workplace to home is about 2.5 kilometres
and it is convenient to go there.”
The factor of community clinic which positively determining the Yangguang
Huayuan’s residential satisfaction, Interviewee 5 said: “…going to community clinic is
very convenient and the community clinic is nearby…” Comparing with the community
clinic, the nearest general hospital was complained by Interviewee 5 “The distance from
here to the nearest general hospital is not very far around 6 kilometres. However, it is
not convenient to get there due to the numbers of shuttle buses are quite few.”
With respect to the local crime and local accident situation as the determinants which
significantly predicted the Chengshi Huayuan’s residential satisfaction, Interviewee 5
said: “The local crime and local accident situations are both very bad such as stealing,
car accidents, etc. The frequencies of happening in terms of crime and accident are not
very high, but quite high. Therefore, a professional property management team is
immediately needed to manage it.”
In terms of the nearest bus/taxi station positively affected the Chengshi Huayuan’s
residential satisfaction, Interviewee 5 said: “…it is not far to get to the bus/taxi station
and it is convenient to get a public bus to go to downtown. However, the numbers of
shuttle buses are still not many; we need more buses to come here…”

229
6.7 Interviewee 6
Interviewee 6 was 52 years old and she got divorced when her daughter was 8 years
old. Now she lived with her daughter, 26 years old, with her parents as well. She retired
from a state-owned company and now she worked at a private company as a janitor. On
account of her educational attainment only finished junior middle school, her monthly
income is not high. Interviewee 6 lived on the 1st floor, block 56, and she lived at Binhe
Huayuan for 3 years. She daily used a bicycle to go to work.
6.7.1 Individual and Household’s Socio-economic Characteristics
With respect to the factor of main means of transportation (by driving vs. by cycling)
negatively determining Interviewee 6’s residential satisfaction in Binhe Huayuan, she
said: “…riding a bicycle to my workplace is a terrible thing especially in winter and
summer…driving to workplaces is better and Binhe Huayuan has a lot of places where
you can park your car comparing to Yangguang and Chengshi Huayuan…riding a
bicycle to my workplace is at very least better than taking a bus to my workplace
because there is no one bus to go directly to my company, even if there only has around
3 kilometres between Binhe Huayuan and my workplace. Thus, very few shuttle buses
coming and stopping at this station is another very serious problem currently…”
In addition, Interviewee 6 residential satisfaction was positively affected by the
factor of floor level (4th
floor vs. 3rd
floor), she explained: “…living on the first floor like
me is convenient for the aging people such as my parents to walk into the house though,
the house on the first floor is quite easy to get dirty and in summer the garbage smell
floated into the room by wind, and a lot of mosquitoes and flies easily got into the room
during summer. Similarly, the feeling of living on the top floor is not good either,
because in summer the whole ceiling was burnt in the sun all day long and in winter it
was very cold…if the local government allows me to choose again, I will definitely

230
choose 3rd
floor…because the 3rd
floor is not high and stays away from that smell and
the flies as well…”
With respect to the factor of occupation type which negatively affected Yangguang
Huayuan’s inhabitants’ residential satisfaction, Interviewee 6 said: “…in my
experience, those people with higher positions at companies are more difficultly to get
satisfied. On the contrary, people with lower positions at companies like me, are more
easily to get satisfied because I need fewer…”
6.7.2 Housing Unit Characteristics
Ms Interviewee 6’s residential satisfaction in Binhe Huayuan was positively affected
by the living room, she said: “There are two places in this house with which I am so
satisfied such as the living room and kitchen. The living room’s space is good and its
location is quite nice. Due to its location, the ventilation is good and the lighting is good
as well during the day. The numbers of power sockets are just enough for using.
With reference to the factor of bedroom which positively determined Yangguang and
Chengshi Huayuan’s residents’ housing satisfactions, Interviewee 6 said: “…comparing
with the living room, the size of bedroom is normal and the location is normal with the
normal ventilation and normal lighting. The numbers of power sockets are enough for
using…”
The factor of dining area positively influenced Yangguang Huayuan’s residents’
housing satisfaction, Interviewee 6 said: “…on account of the four people having each
meal together at the dining area, the space seems quite narrow with an improper
location. The dining area is well ventilated and has a good lighting. However, the
numbers of power sockets are very few.”

231
The factor of drying area positively affected Chengshi Huayuan’s inhabitants’
residential satisfaction, Interviewee 6 said: “The drying area has a proper size of space
and its ventilation design is also good and it has a good lighting. But… no power socket
at all…”
With respect to the toilet, Interviewee 6 said: “…the size is very normal. The
location is normal with a normal ventilation design. The lighting is good. There has
only one power socket which is very few and very inconvenient.”
6.7.3 Housing Unit Supporting Services
Interviewee 6’s residential satisfaction was positively affected by the electrical &
telecommunication wiring (fixed-line telephone, television, and internet), she said: “The
wiring in this house was normal when we moved in. After that, their maintenance
services are also normal.”
Referring to the corridor which determined Interviewee 6’s residential satisfaction,
she said: “…the corridor is quite narrow. It is unclean and has no lighting at all. In
summer, sometimes the big smell from the garbage floats into the corridor and affects
our daily life…”
With reference to the drain and garbage disposal determining the 1st phase’s
residents’ housing satisfactions, Interviewee 6 said: “The drain in this house was normal
when we moved in. After that, their maintenance services are also normal.” Interviewee
6 continually said: “…generally speaking, most of the time they clean the garbage can
in time, however, due to they never clean thoroughly, the big smell from the garbage is
affecting the corridor during summer…”

232
With reference to the staircases affecting the 2nd
phase’s residents’ housing
satisfactions, Interviewee 6 said: “…the space of the staircases is just enough for using.
It is unclean and has no lighting at all. Moreover, according to my experience (a lady in
medium height), each staircase is high for me (fortunately, I live on the first floor) and I
think, is high for those aging people either. In addition, a lot of people in similar with
my height and a lot of children will have this similar problem as well…”
6.7.4 Housing Estate Supporting Facilities
The factor of children’s playground positively determined Binhe Huayuan’s
inhabitants’ residential satisfaction, Interviewee 6 commented: “The space is not big
enough for this whole Binhe Huayuan’s children with a bad location. The condition is
not good due to a lot of weeds in children’s playground. In addition, the lighting
problems directly bring along the safety issues while the children were playing in the
evening. We need a special lighting only for the children’s playground.”
The factor of open space predicted Interviewee 6’s residential satisfaction, she said:
“…like children’s playground, it is not big enough for the whole Binhe Huayuan’s
residents who are mainly relocated households and the location is normal. The condition
is also like the children’s playground with full of weeds and is not clean. The most
important thing is the lighting problems which are related to the safety issues. As a lot
of residents take a walk or dance at the open space after dinner, it is very dangerous
without lighting in the evening. We need the local government to enhance the condition
of open space in order to improve residents’ quality life.”
Interviewee 6’s residential satisfaction was positively affected by the local
kindergarten, she said: “…comparing with the kindergartens in Chengshi Huayuan, (I
think) Binhe Huayuan’s kindergartens are well maintained and have good conditions.
However, comparing with other kindergartens located at the commodity housing areas,

233
Binhe Huayuan’s kindergartens are far more behind. Thus, in general, (I think) the local
kindergartens are very normal…”
With reference to the local shops which significantly determined Binhe Huayuan’s
residents’ housing satisfactions, Interviewee 6 responded: “…the local shops are very
normal providing our daily use. However, the price of commodities that you are selling
is not cheap. You’d better buy commodities at some hyper markets which are located at
the city centre. As we are actually poor family, every single dollar that we spent is
countable. So, sometimes, we are going to hyper market instead of our local shops to
buy a lot of commodities in order to save some money. Comparing with the long
distance to the city centre, we care more about the price of commodity.”
With reference to the factor of parking facilities (electric bicycle/bicycle/car)
significantly affecting Yangguang Huayuan’s residential satisfaction, Interviewee 6
responded: “…we have two parking lots for motor vehicles and three parking areas for
bicycles and electric bicycles…it is very enough. The conditions are good and quite
clean.”
6.7.5 Neighbourhood Characteristics
Interviewee 6’s residential satisfaction was significantly affected by the quietness of
the housing estate, she said: “As I live on the first floor, I hear many noises not only
come from our neighbours but also come from the open space such as children’s
playing, the shouts of vendors, neighbourhood chatting voices, and the quarrelling…”
With respect to the local police station that influencing Binhe Huayuan’s residents’
housing satisfaction, Interviewee 6 responded: “The distance between local police
station and Binhe Huayuan is quite far around 8 kilometres. It is not convenient to get
there.” Interviewee 6 continually said: “The distance between the nearest fire station
234
and Binhe Huayuan is quite far around 6 kilometres. It is not convenient. (According to
my knowledge)…all three phases don't have any firefighting equipments. We urgently
require local government to play its role to solve this problem as soon as possible.”
With respect of the community relationship (community committee-residents/social
cohesion/social harmony) that influencing Binhe Huayuan’s residents’ housing
satisfaction, Interviewee 6 responded: “There is no social exclusion in Binhe Huayuan
and most residents are willing to involve all activities. In contrast, people who live at
the commodity houses (just opposite Binhe Huayuan) look down upon us and
sometimes have conflicts with each other, for example, as that condominium which is
quite expensive with fully equipped has two outdoor swimming pools, the residents
from Binhe Huayuan went there to go swimming in summer. In the beginning, they did
not get blocked by their security. After their security received their own residents’
complaints, they started to block them. The complaints are more about the numbers of
people from outside coming and swimming are getting bigger and bigger and they are
not wearing swimsuits, and most their children are naughty and noisy. Thereafter,
between the residents from Binhe Huayuan and the residents form the condominium has
had a lot of conflicts.”
With reference to the factor of the nearest school which positively determined
Yangguang and Chengshi Huayuan’s residents’ housing satisfactions, Interviewee 6
said: “A lot of schools are not far from here around 4 kilometres. It is convenient to go
to those schools.”
Most residents from Yangguang Huayuan concerning about the conveniences of
going to their workplaces, Interviewee 6 said: “…it is about 3 kilometres from here to
my workplace, I think it is a medium distance, and it is convenient for me to get
there…”

235
Interviewee 6 talked about the community clinic and she said: “The community
clinic is very near and very convenient to get there.” On the contrary, the nearest
general hospital was commented by Interviewee 6 “The distance from here to the
nearest general hospital is very far around 10 kilometres and it is inconvenient to get
there.”
According to two factors of the local crime and local accident situation significantly
determining Chengshi Huayuan’s residents’ housing satisfactions, Interviewee 6 said:
“The frequencies of crime and accident happening are quite high particularly during
afternoon and evening. The local crime and accident situations are both very bad.
Accordingly, we urgently require local government to play its role to resolve this
problem as soon as possible.”
Regarding the nearest bus/taxi station positively affecting residential satisfaction of
Chengshi Huayuan, Interviewee 6 said: “…it is not very far (around 2 kilometres) to get
to the bus/taxi station. However, it is inconvenient to get a public bus to go to
downtown due to the numbers of shuttle buses are still not many. We need more shuttle
buses to come and stop here.”
6.8 Cross Case Analysis and Conclusion
Five themes which together determined the participants’ residential satisfactions in
these three phases of low-cost housing projects and were examined in the quantitative
part (see tables 5.2 and 5.3 in Chapter 5) appeared in the analysis across six cases from
three phases: individual and household’s socio-economic characteristics, housing unit
characteristics, housing unit supporting services, housing estate supporting facilities,
and neighbourhood characteristics. The following table 6.1 illustrated the similarities
and differences in talking about those themes between the six participants and across

236
three phases of low-cost housing in terms of the similarities and differences in sub-
themes and categories.
Table 6.1: Themes, Sub-Themes, and Categories across Cases and across Phases
Themes,
Sub-Themes
Yangguang Huayuan (1st Phase)
Chengshi Huayuan (2nd Phase)
Binhe Huayuan (3rd Phase)
Interviewee 1 (F)
Interviewee 2 Interviewee 3 Interviewee 4 Interviewee 5 Interviewee 6
(F)
Individual and Household's Socio-Economic Characteristics
Occupation
Type
The higher
position of occupation and
the lower
satisfaction
Social exclusion
existing between
residents with higher position
and residents with
lower position of occupation
Almost same Almost same Almost same
The higher
position of occupation
and the lower
satisfaction
Floor Level
Higher floor level far away
from the noise
and clean
lower floor level
affected by the smelling of
garbage and
crowd noise sometimes
Almost same
except for the top floor and the
first floor, the
others are OK
except for the
top floor and
the first floor, the others are
OK
except for the
top floor and
the first floor, the others are
OK
The Main
Means of
Transportation
Not enough parking space
and lack of
property management
Not enough
parking space and lack of property
management
Only one shuttle
bus and not
enough parking space and lack
of property
management
Only one shuttle
bus and not
enough parking space and lack
of property
management
More shuttle buses needed
More shuttle buses needed
Housing
ownership
For the next commodity
housing
purchase
For the next
commodity housing purchase
Important, but
not so important
For the next commodity
housing
purchase
For the next commodity
housing
purchase

237
Table 6.1 Continued
Themes,
Sub-Themes
Yangguang Huayuan
(1st Phase)
Chengshi Huayuan
(2nd Phase)
Binhe Huayuan
(3rd Phase)
Interviewee 1 (F)
Interviewee 2 Interviewee 3 Interviewee 4 Interviewee 5 Interviewee 6
(F)
Housing Unit Characteristics
Living room
Appropriate
size Appropriate size
Appropriate
size Appropriate size
Appropriate
size
Appropriate
size
Proper location
Improper location
Improper location
Improper location Proper
location Proper
location
Badly connected
with dining area
Badly connected
with kitchen
Well-ventilated
Not-well ventilated
Not-well ventilated
Not-well ventilated Not-well ventilated
Well-ventilated
Good-lighting Good-lighting Bad-lighting Bad-lighting Bad-lighting Good-lighting
Fewer power sockets
Just-enough power sockets
Just-enough power sockets
Fewer power sockets
Just-enough power sockets
Just-enough power sockets
Dining area
Appropriate
size Appropriate size Improper size Improper size Improper size Improper size
Proper
location
Improper
location
Improper
location Improper location
Improper
location
Improper
location
Badly
connected with kitchen
Badly closer to
toilet
Well-
ventilated
Not-well
ventilated
Not-well
ventilated Not-well ventilated
Not-well
ventilated
Well-
ventilated
Good-lighting Good-lighting Bad-lighting Bad-lighting Bad-lighting Good-lighting
Fewer power
sockets
Enough power
sockets
Enough
power sockets
Fewer power
sockets
Just-enough
power sockets
Fewer power
sockets
Bedroom
Slightly
smaller size
Slightly smaller
size
Slightly
smaller size
Slightly smaller
size
Slightly
smaller size Normal size
Bad location Bad location Bad location Bad location Normal
location
Normal
location
Not-well
ventilated
Not-well
ventilated
Not-well
ventilated Not-well ventilated
Not-well
ventilated
Normal
ventilated
With a western exposure, cold in
winter, hot in
summer and the furniture goes
mouldy
Bad-lighting Bad-lighting Bad-lighting Bad-lighting Normal
lighting
Normal
lighting
Fewer power sockets
Enough power sockets
Enough power sockets
Fewer power sockets
Fewer power sockets
Enough power sockets
Toilet
Very small
size
Very small
size Very small size Normal size Normal size
Very bad location
Very bad location Very bad location
Normal location
No
ventilation No ventilation No ventilation No ventilation
Normal
ventilation
Bad-lighting Bad-lighting Bad-lighting Bad-lighting Good lighting
Fewer power sockets
The 1st floor house has the worst toilet
Fewer power sockets
Fewer power sockets
Drying area (Balcony)
Appropriate size
Appropriate size Improper size Improper size Appropriate
size Appropriate
size
Well-
ventilated Well-ventilated No ventilation No ventilation
Well-
ventilated
Well-
ventilated
Good-lighting Good-lighting Bad-lighting Bad-lighting Good-lighting Good-lighting
Fewer power sockets
Enough power sockets
Enough power sockets
Enough power sockets
No power socket
No power socket

238
Table 6.1 Continued
Themes,
Sub-Themes
Yangguang Huayuan
(1st Phase)
Chengshi Huayuan
(2nd Phase)
Binhe Huayuan
(3rd Phase)
Interviewee 1 (F)
Interviewee 2 Interviewee 3 Interviewee 4 Interviewee 5 Interviewee 6
(F)
Housing Unit Supporting Services
Drain
Good
original Bad original Bad original Bad original
Normal
original
Normal
original
Normal
maintenance
Bad
maintenance Bad
maintenance
Bad
maintenance
Normal
maintenance
Normal
maintenance
High-frequency
damage
Electrical &
Telecommunication Wiring
Normal original
Good original Bad original Normal original
Normal original
Normal original
Normal
maintenance Good
maintenance Bad
maintenance
Normal
maintenance
Normal
maintenance
Normal
maintenance
Staircases
Quite narrow Just-enough
space Quite narrow Quite narrow
Just-enough
space
Just-enough
space
Good
lighting Good lighting
No lighting
at all
No lighting
at all
No lighting
at all
No lighting at
all
Just okay Unclean Unclean Unclean Unclean Unclean
Different numbers of
stairs in
different floor levels
& different
stairs with different
heights
Each stair is
high
Corridor
Quite narrow Just-enough
space Quite narrow Quite narrow Quite narrow Quite narrow
Good
lighting Good lighting
No lighting
at all
No lighting
at all
No lighting
at all
No lighting at
all
Unclean Just okay Unclean Unclean Unclean Unclean
Quite noisy Quite noisy Big smell from the
garbage
Garbage disposal
Timely
collection
Timely
collection
Timely
collection
Not timely
collection
Timely
collection
Timely
collection
Efficiently
managed (Most time)
Sometimes do
not clean thoroughly
Sometimes
do not clean thoroughly
Never clean
thoroughly
Never clean
thoroughly
Never clean
thoroughly
A garbage can at
children's
playground
Big smell
affecting the corridor

239
Table 6.1 Continued
Themes,
Sub-Themes
Yangguang Huayuan
(1st Phase)
Chengshi Huayuan
(2nd Phase)
Binhe Huayuan
(3rd Phase)
Interviewee 1 (F)
Interviewee 2 Interviewee 3 Interviewee
4 Interviewee 5
Interviewee 6 (F)
Housing Estate Supporting Facilities
Open space
Enough space Not very
enough space
Not very enough
space
Not very
enough space
Not very enough
space
Not very
enough space
Good
condition Good condition Bad condition
Bad
condition Bad condition
Bad
condition
Lighting
problems
Lighting
problems Lighting problems
Lighting
problems
Good location Good location Improper location Normal
location Normal location
Normal
location
Clean Clean Unclean Unclean Unclean Unclean
Not enough
fitness equipment
and space
Sometimes many
noises from the
open space
So much space
occupied by the
local shops
Need more fitness
equipments and
recreation places
Children's
playground
Very-limited space
Not very enough space
Not very enough space
Not very
enough
space
Not very enough space
Not very
enough
space
Not-bad condition
Good condition Bad condition Bad
condition Bad condition
Bad condition
Good location Bad location Bad location Bad location Bad
location
Conflicts with
perimeter road
Occupied by
parking facilities
One block's garbage
collection spot is at
the children's
playground
Lighting problems
Lighting problems Lighting problems
Clean Clean Unclean Unclean Unclean Unclean
Parking
facilities
Very-limited
space
Very-limited
space
Very-limited
space
Very-limited
space Enough space
Enough
space
Bad and
chaotic condition
Bad and chaotic
condition
Bad and chaotic
condition
Bad and
chaotic condition
Good condition Good
condition
Unclean Clean Unclean Unclean Clean Clean
No car parking
space
No car parking
space
No car parking
space
Lighting
problems
Very poor street
lighting light up
parking area
Conflicts with
children's
playground and
fitness equipment
Local shops
Sufficient numbers
Normal numbers
Normal numbers Sufficient numbers
Normal numbers Normal numbers
Good location Normal location Bad location Normal
location Bad location
Normal
location
Conflicts with
open space
Located at the first
floor of the first row
of the houses
disturbing residents
More shops needed
Local
kindergarten
Sufficient
numbers
Normal
numbers Normal numbers
Normal
numbers Normal numbers
Normal
numbers
Good condition
Normal condition
Normal condition Normal
condition Normal condition
Normal condition
Good location Normal location Normal location Normal
location Normal location
Normal
location
Clean Clean Clean Clean Clean Clean

240
Table 6.1 Continued
Themes,
Sub-Themes
Yangguang Huayuan
(1st Phase)
Chengshi Huayuan
(2nd Phase)
Binhe Huayuan
(3rd Phase)
Interviewee 1 (F)
Interviewee 2 Interviewee 3 Interviewee 4 Interviewee 5 Interviewee 6
(F)
Neighbourhood Characteristics
Community
Relationship
Active involvement
No participation
Active involvement
Active involvement
Active involvement
Active involvement
No social
exclusion
Social exclusion
existing
No social
exclusion
No social
exclusion
No social
exclusion
No social
exclusion
Quietness of
the housing estate
Many noises
from
neighbours
Many noises
from
neighbours
Normal Normal
Many noises
from
neighbours
Many noises
from
neighbours
Many noises
from open space
Many noises
from open space
Normal Normal Normal
Many noises
from open space
Local Crime
situation
High
frequency of
occurrence
Medium
frequency of
occurrence
Medium
frequency of
occurrence
Medium
frequency of
occurrence
Medium
frequency of
occurrence
Medium
frequency of
occurrence
Very bad
situation
Very bad
situation
Very bad
situation
Very bad
situation
Very bad
situation
Very bad
situation
Local Accident
situation
High
frequency of occurrence
Medium
frequency of occurrence
Medium
frequency of occurrence
Medium
frequency of occurrence
Medium
frequency of occurrence
Medium
frequency of occurrence
Very bad situation
Very bad situation
Very bad situation
Very bad situation
Very bad situation
Very bad situation
Resident's Workplace
Long distance Long distance Long distance Long distance Medium
distance
Medium
distance
Not convenient Not convenient Not convenient Not convenient convenient convenient
Community
Clinic
Medium
distance
Medium
distance Very near Very near Very near Very near
Convenient Convenient Convenient Convenient Convenient Convenient
Nearest
General
Hospital
Medium
distance
Medium
distance Long distance Long distance
Medium
distance Long distance
Quite convenient
Not convenient Not convenient Not convenient Not convenient Not convenient
Local Police
Station
Short distance Short distance Short distance Short distance Long distance Long distance
Convenient Convenient Convenient Convenient Not convenient Not convenient
Nearest School
Short distance Short distance Long distance Long distance Medium distance
Medium distance
Convenient Convenient Not convenient Not convenient Convenient Convenient
Nearest Fire Station
Medium distance
Medium distance
Long distance Long distance Long distance Long distance
Not convenient Not convenient Not convenient Not convenient Not convenient Not convenient
No firefighting
equipment
No firefighting
equipment
No firefighting
equipment
No firefighting
equipment
No firefighting
equipment
No firefighting
equipment
Nearest
Bus/Taxi Station
Medium
distance
Medium
distance Long distance Long distance
Medium
distance
Medium
distance
Not convenient Not convenient Not convenient Not convenient Convenient Not convenient
Source: Interview in June 2015
On the whole, in spite of any improvements between the three phases made by the
local government, there were more similarities in their comments on those sub-themes
(see categories in Table 6.1) between the participants who all lived at Xuzhou’s low-

241
cost housing projects, although they lived at three different low-cost housing projects,
than differences which were related to the individual’s circumstances. The factors which
were deemed by these six participants to be very significant to the local government as
related to their residential satisfactions in these three phases of low-cost housing were
concluded as follows:
6.8.1 Individual and Household’s Socio-Economic Characteristics
In terms of the occupation type negatively determining the Yangguang Huayuan’s
inhabitants’ residential satisfaction, there are two different views came out of three
phases such as two interviewees from Yangguang Huayuan sharing the same view of
“the higher position of occupation with the lower satisfaction” and oppositely, two
interviewees from Chengshi Huayuan having a same view of “almost same”, and Binhe
Huayuan had one interviewee with a view of “almost same” and another view of “the
higher position of occupation with the lower satisfaction”.
Furthermore, Interviewee 2 added some his own opinions that the social exclusion
existed in Yangguang Huayuan between residents with higher position at company and
residents with lower position of occupation.
Regarding the factor of floor level positively affected the Yangguang and Binhe
Huayuan’s inhabitants’ residential satisfactions, the four participants had the same
opinion, i.e. all floors were almost same except for people’s lower residential
satisfactions in living on the top and the first floors because the top floor was very cold
during winter and was very hot during summer and the lower floor was affected by the
smelling of garbage and crowd noise explained by Interviewee 2 from Yangguang
Huayuan. On the contrary, Interviewee 1 also from Yangguang Huayuan explained that
the higher floor level was far away from the noise and also was clean. At the same time,

242
Interviewee 3 from Chengshi Huayuan held a different opinion such as all floors were
almost same.
With reference to the factor of main means of transportation affected the Chengshi
and Binhe Huayuan’s residents’ housing satisfactions, the four participants had the same
view which was not enough parking space and lack of property management in
Yangguang and Chengshi Huayuan. In addition, the parking space was enough in Binhe
Huayuan. However, two participants form Binhe Huayuan and two participants from
Chengshi Huayuan complained about the number of shuttle bus was very few especially
Chengshi Huayuan.
With respect to the housing ownership which was an added sub-theme while I was
sorting participants’ transcripts, due to the whole low-cost housing projects in Xuzhou
were not allowed the residents to buy the left homeownerships as of the day I
interviewed, I did not prepare this question in the quantitative and qualitative parts.
Nonetheless, the four participants amongst three phases took this factor very seriously
because most residents like them wanted to purchase the next commodity housing using
the current house ownership. However, Interviewee 3 showed a different view, i.e. it is
important, but not so important. Interviewee 6 did not care so much about it.
6.8.2 Housing Unit Characteristics
In regard to the factor of living room which positively determined residential
satisfaction, all six participants preferred the size of living room over the location, for
example, three participants from Yangguang and Chengshi Huayuan thought the
locations of their living rooms were not proper. Interviewee 2 thought that the living
room should be separated from the dining area and Interviewee 3 thought that the living
room should be separated from the kitchen. Furthermore, the four interviewees from
three phases thought that their living rooms did not have good ventilations and the three

243
interviewees from Chengshi and Binhe Huayuan complained about their living rooms
having bad lighting. The four participants from three phases thought the numbers of
power sockets in their living rooms were just enough for using.
Regarding the dining area, the four participants from the 2nd
and 3rd
phases thought
that the size of their dining areas were small. Similarly, the five participants from three
phases thought that the location of their dining areas were not proper, for instance,
Interviewee 3 also suggested that the dining area should be separated from the kitchen.
Furthermore, Interviewee 5 from 3rd
phase complained about his dining area being
badly very closer to the toilet. By the same token, the four interviewees from three
phases thought that their dining areas were not well ventilated. The three participants
from Chengshi and Binhe Huayuan complained about the lighting of dining area were
not good. The four interviewees from three phases complained about the number of
power sockets were fewer.
With regard to the bedroom which positively determined Yangguang and Chengshi
Huayuan’s residents’ housing satisfactions, the five participants thought that their
bedroom size was slightly smaller than their master bedroom. With the exception of the
3rd
phase, the four interviewees considered that their bedroom had a bad location. At the
same time, the five interviewees thought that their bedroom was not well ventilated
particularly Interviewee 4 gave a specific detail regarding his bedroom with a western
exposure was cold in winter and hot in summer and his furniture in bedroom went
mouldy. In the meanwhile, the four interviewees from the 1st and 2
nd phases had the
same problem of lighting in bedroom. The half interviewees found that the power
sockets in bedroom were very few.

244
The factor of toilet, which was not a determinant in these three phases, was a critical
issue when interviewing, three participants amongst five from the 1st and 2
nd phases
complained about their toilets had a very small size. The three participants from the 2nd
and 3rd
phases amongst four complained about the locations. The four participants said
that there was no ventilation in their toilets and had a bad lighting. They also
complained about the fewer power sockets especially Interviewee 4 said the 1st floor
house had the worst toilet.
Regarding the drying area, the four interviewees from the 1st and 3
rd phases believed
that the drying area had an appropriate size with good ventilation and with a good
lighting. On the contrary, the two interviewees from the 3rd
phase complained about no
power socket in their drying areas.
6.8.3 Housing Unit Supporting Services
With respect to the drain, the three participants from the 1st and 2
nd phases thought
that when they moved into their new houses, the drain system was not good and the
maintenance was also bad particularly Interviewee 2 reported that his house’s drain
system had problems very frequently. Comparing with the drain, the five interviewees
thought that they had a normal condition of electrical & telecommunication wiring with
a normal maintenance.
Regarding the staircases, all six participants complained that their staircases were
quite narrow or just enough space for using and were unclean. Except for the 1st phase
having a good lighting in staircases, the 2nd
and 3rd
phases had no lighting at all in their
staircases. Interviewee 1 gave a special comment on staircases in which different
numbers of stairs were in different floor levels and different stairs had different heights.
Interviewee 6 also gave a similar comment like that each staircase was very high for
her.

245
The corridor had a similar result given by those six interviewees especially
Interviewee 1 and Interviewee 5 complained about the corridor was quite noisy and
Interviewee 6 complained about the corridor was affected by the big smell from the
garbage sometimes.
Regarding the garbage disposal, the five interviewees gave the same conclusion such
as timely collection and did not clean thoroughly especially the 3rd
phase. Interviewee 5
and Interviewee 6 both from the 3rd
phase gave their comments that a garbage can was
put at the children’s playground and the big smell from the garbage affected the
corridor.
6.8.4 Housing Estate Supporting Facilities
With respect of the open space, most participants believed that it was not a very
enough space with a bad condition. The 2nd
and 3rd
phases’ open spaces had lighting
problems and sanitation problems. In addition, Interviewee 1 and Interviewee 5
suggested that the property management company should buy some more fitness
equipments and build more recreation places. Interviewee 2 complained about many
noises came from the open space. Interviewee 3 complained about so much space was
occupied by the local shops.
In terms of children’s playground, all participants complained about the very limited
space. Most of them especially from the 2nd
and 3rd
phases complained about the bad
condition and the bad location, for example, Interviewee 2 said that the location had
conflicts with the perimeter road. Interviewee 3 said that the location was occupied by
the parking facilities. Interviewee 5 said that one block’s garbage collection spot was at
the children’s playground. The 2nd
and 3rd
phases both had lighting problems and
sanitation problems.

246
Referring to the parking facilities, the four participants from the 1st and 2
nd phases
complained that the parking areas were very limited with bad and chaotic conditions
and also had sanitation problems, for example, Interviewee 1, Interviewee 2 and
Interviewee 3 said that there had no car parking space. Interviewee 3 and Interviewee 4
said that there had many lighting problems and the location had conflicts with children’s
playground and fitness equipment.
In regard of the local shops, although the numbers of shops were sufficient, the 2nd
and 3rd
phases had some problems with locations, for example, Interviewee 3 said that
the locations had conflicts with the open space. Interviewee 5 said that some shops
located at the first floor of the first row of the houses disturbed residents.
With reference to the local kindergarten, all six interviewees shared almost same
conclusions regarding the normal numbers with normal conditions and normal locations
and all local kindergartens were clean.
6.8.5 Neighbourhood Characteristics
In regard of the community relationship, except for Interviewee 2 giving an opposite
answer such as residents’ no participation and social exclusion existing in Yangguang
Huayuan, the rest of 5 participants gave the same answer such as residents’ active
involvements and no social exclusion existing.
With regard to the quietness of the housing estate, the four participants from the 1st
and 3rd
phases believed that many noises were generated from the neighbours and from
the open spaces.
With respect of the local crime and local accident situations, the majority of the six
participants complained about the frequencies of crimes and accidents’ occurrences
were medium with very bad situations.

247
Referring to the factor of resident’s workplace which determined residential
satisfaction, except for the two participants from the 3rd
phase claimed that the distance
between Binhe Huayuan and their workplaces were medium distance and it was
convenient, the rest four participants complained about between their workplaces and
their houses were long distances and they were not convenient.
Comparing with the community clinics located at these three phases having good
locations and easy accesses, the nearest general hospitals to these three phases
unfortunately had long distances and they were not convenient to get there.
With reference to the local police station, the only two interviewees from Binhe
Huayuan complained about the distance between Binhe Huayuan and the local police
station was long and it was not convenient. Similarly, referring to the nearest school, the
only two interviewees from Chengshi Huayuan complained about the distance between
Chengshi Huayuan and the nearest school was long and it was not convenient.
In regard of the nearest fire station, the all six participants complained about the
distances between their houses and the fire stations were long and they were not
convenient. The worst part was that there was no one housing estate had their own
firefighting equipment.
In regard to the nearest bus/taxi station, the five interviewees gave their bad
comments on this factor such as the distances between their houses and the nearest
bus/taxi stations were medium and long and they were not convenient at all.

248
DISCUSSION CHAPTER 7:
7.1 Introduction
Based upon the results concluded according to the explanatory sequential mixed
mode method study, the purpose of this research work was to identify residents’ levels
of satisfactions in each phase of low-cost housing and explore the factors which
predicted/determined these three phases of low-cost housing projects in Xuzhou city.
Accordingly, it was obviously to find out which problems were still existences from 1st
phase to 3rd
phase and which problems were made some improvements from 1st phase to
3rd
phase.
In the first part of the explanatory sequential mixed mode method, quantitative, the
14, 12, and 13 determinants (referring to the individual and household’s socio-economic
characteristics and the four residential elements) were found from the three respective
phases of low-cost housing as the predictors to their residential satisfactions.
In the second part of the explanatory sequential method, qualitative, it revealed that
the five themes which were the core statements concluded based upon the participants’
interviews would be the five critical reasons displayed as follows which affecting those
three phases of low-cost housing’s inhabitants’ levels of residential satisfactions from
the strongest influencing to the weakest influencing: (a) good social environment and
neighbourhood facilities; (b) good layout and maintenance for public facilities; (c) good
maintenance for housing unit; (d) good structure design for housing unit; (e) more
commoditized low-cost housing.
7.2 RS in Three Phases of LCH
In terms of the four elements’ satisfactions which affecting the overall residential
satisfaction, the respondents of the three phases shared some similarities in evaluating
the satisfaction of housing unit characteristics (HUC) in their corresponding projects

249
with the highest average satisfaction among the four elements (69.257%, 61.519%, and
66.792%, respectively), these findings were tended to support James, M. A. Mohit &
Nazyddah, E. O. Ibem & Aduwo and E. O. Ibem & Amole’s (2008) (2011), (2013) and
(2013b) propositions of the subsidised renters in the US, the residents living at nine
previously-built and 10 newly-constructed public housing estates in urban areas of
Ogun state were highly satisfied with HUC and households living at Malaysian
Selangor state social houses conveyed moderately high level of satisfaction with HUC.
Moreover, these findings also supported Varady & Carrozza and M. A. Mohit & Azim’s
(2000) and (2012) studies about the residents living at public housing estates in
Hulhumalé were slightly satisfied with HUC and approximately 1,300 residents living
at Cincinnati Metropolitan Housing Authority (CMHA) housing had a high level of
satisfaction with HUC in four consecutive years of 1995, 1996, 1997, and 1998.
However, these findings were tended to be contrary to Ukoha & Beamish and M. A.
Mohit, Ibrahim, & Rashid’s (1997) and (2010) propositions regarding the 1,089
households randomly selected from residents in 19,863 public housing units in Abuja
and the higher percentage of respondents living at one of the 24 newly designed public
low-cost housing estates in Sungai Bonus, Kuala Lumpur showing dissatisfied with
HUC. Furthermore, these findings were also opposite to Kaitilla and James’ (1993) and
(2008) studies about the urban households living at public housing in the city of Lae,
Papua New Guineans and the nonsubsidised renters in the US were severely dissatisfied
with their HUC.
In terms of 65.233%, 58.008%, and 62.259% which presented the satisfaction levels
of housing unit supporting services (HUSS) in respective project, it showed the
moderate level of satisfaction in Phase 1 and 3, but the low level of satisfaction in Phase
2. These findings were tended to support M. A. Mohit et al., M. A. Mohit & Nazyddah,
250
M.A. Mohit & Zaiton, and E. O. Ibem & Aduwo’s (2010), (2011), (2012) and (2013)
conclusions about that the 102 respondents in Kuala Lumpur, the 100 respondents living
at single-storey cluster housing, another the 100 respondents living at Selangor state
individual houses, and 100 respondents living at younger (<10 years) high-rise
condominiums in Kuala Lumpur were feeling the same way as 452 household heads
living at nine previously-built public housing in Ogun state were slightly and highly
satisfied with HUSS.
However, in spite of the low level of satisfaction in Phase 2, these conclusions were
tended to be contrary to Ukoha & Beamish, Varady & Carrozza, M. A. Mohit &
Nazyddah, M.A. Mohit & Zaiton and E. O. Ibem & Amole’s (1997), (2000), (2011),
(2012) and (2013b) findings of the 1,089 federal employees living in Abuja, 1,300
residents living in CMHA housing, 50 respondents living at Malaysian transit houses,
100 respondents residing at older (>10 years) high-rise condominiums in Kuala
Lumpur, and the residents from 10 newly-constructed public houses in Ogun state were
unfortunately found to be dissatisfied with HUSS.
With respect to 62.841% and 55.564% of satisfaction levels in neighbourhood
characteristics (NC) and followed by 62.137% and 54.441% which indicated the lowest
average satisfaction of housing estate supporting facilities (HESF) in Phase 1 and 2, it
showed the moderate level of satisfaction of NC and HESF in Phase 1, but the low level
of satisfaction in Phase 2.
Regarding Phase 3, although the lowest average satisfaction (61.723%) was given to
NC, whereas, when they evaluated HESF, the satisfaction index (61.867%) was a little
bit better than NC satisfaction index (61.723%), the moderate level of satisfactions of
HESF and NC was shown. These conclusions of Phase 1 and 3 with moderate level of
satisfactions in NC and HESF were contrary to, but the conclusion of Phase 2 with

251
dissatisfaction of NC and HESF were tended to support M. A. Mohit et al., M. A. Mohit
& Nazyddah, E. O. Ibem & Aduwo, and E. O. Ibem & Amole’s (2010), (2011), (2013),
and (2013b) studies about the situation of HESF and infrastructural facilities in public
low-cost housing in Kuala Lumpur, Selangor state individual houses and even in nine
previously-built and newly-constructed public housing estates in Ogun state, Southwest
Nigeria made the respondents feel slightly satisfied or even dissatisfied. Furthermore,
these findings also supported James, M.A. Mohit & Zaiton and Zanuzdana et al.’s
(2008), (2012) and (2013) studies about the public housing residents in the US, those
respondents who lived in urban slums and rural areas in Dhaka, Bangladesh and the 100
respondents residing in older (>10 years) high-rise condominiums in Kuala Lumpur
showed their low satisfaction with NC and HESF, respectively.
However, these conclusions of Phase 1 and 3 with moderate level of satisfactions in
NC were tended to support, but the conclusion of Phase 2 with dissatisfaction of NC
was contrary to Varady & Carrozza, James and Zanuzdana et al.’s (2000), (2008) and
(2013) studies about 1,300 residents living in Cincinnati Metropolitan Housing
Authority (CMHA) housing, the subsidised renters in the US, and 100 respondents
living at younger (<10 years) high-rise condominiums in Kuala Lumpur presenting a
moderate, or even higher level of satisfaction with NC.
With the exception of satisfaction index with HUC (61.519%), the Phase 2 had three
elements with low level of satisfactions in terms of HUSS, NC, and HESF. This
findings tended to support Tian & Cui, Huang & Du, Lu, and Djebarni & Al-Abed’s
(2009) (2015), (1999), and (2000) propositions that the improvements of neighbourhood
characteristics and housing estate public facilities could enhance the inhabitants’
residential satisfactions in public housing.

252
The phase1 and 3 had all moderate level of satisfactions with four elements. This
findings were inclined to support Mohit, Ibrahim, & Rashid, Mohit & Nazyddah, Ibem
& Aduwo, and Ibem & Amole’s (2010), (2011), (2013), and (2013a) propositions.
In terms of the percentage of respondents with low level of satisfaction, there was the
largest (40.7% and 74.7%) in HESF of Phase 1 and 2, while 42.5% in HUSS of Phase 3,
followed by 29.1%, 73.7%, and 42.5% in NC of all phases, and followed by 25.6% and
61.1% in HUSS of Phase 1 and 2 while 36.3% in HESF of Phase 3, and followed by
16.3%, 40.0%, and 18.8% in HUC of all phases.
With respect to the ratios of respondents with very low and high levels of satisfaction
that were needed to be especially concerned, the proportion of respondents with very
low level of satisfaction was none (0.0%) in HUC and any percentage of respondents
with very low level of satisfaction did not appear across four elements in Phase 1.
Moreover, the percentage of respondents with very low level of satisfaction was
2.5% in HUSS of Phase 3 while the other two phases of low-cost housing did not have
any percentage of respondents with very low level of satisfaction in this element.
Furthermore, 3.2% and 1.3% of respondents of Phase 2 and 3 were very dissatisfied
with HESF and another 1.1% of respondents of Phase 2 were very dissatisfied with NC
as well.
Nevertheless, the proportion of respondents of Phase 1 with high level of satisfaction
was the largest (9.3%) in HUC followed by 3.8% of respondents of Phase 3 and 2.1% of
respondents of Phase 2. Furthermore, the respondents of Phase 1 with high level of
satisfaction were the highest (8.1%) in HUSS followed by 5.0% of respondents of Phase
3 and (1.1%) of respondents of Phase 2.

253
In addition to that, 1.3% of respondents of Phase 3 was satisfied and very satisfied
with HESF followed by 1.2% of respondents of Phase 1, and none of respondents of
three phases were satisfied or very satisfied with NC.
With reference to 3.2% of respondents of Phase 2 feeling very dissatisfied with
HESF, and 2.5% of respondents with very low level of satisfaction in HUSS of Phase 3
and another 1.1% of respondents of Phase 2 being very dissatisfied with NC as well, the
habitability indices on the level of satisfaction indicated that 58.1% of respondents from
Phase 1 were very dissatisfied with parking facilities that was significantly correlated
with the element of HESF (r = .351**
), this findings supported Mohit & Nazyddah’s
(2011) conclusion about Selangor State cluster, individual, and transit housing in
Malaysia.
Furthermore, 22.1 % of respondents from Phase 2 revealed very low level of
satisfaction with children’s playground that was significantly correlated with the
element of HESF (r = .418**
). In addition, both 61.6% and 46.3% of respondents from
Phase 1 and 3 showed low level of satisfactions with children’s playground that was
significantly correlated with the element of HESF (r = .324**
and .375**
, respectively),
this finding supported Salleh’s (2008) study about private low-cost housing projects in
fast-growing state of Penang and less-developed state of Terengganu in Malaysia, and
Onibokun’s (1974) study of public housing projects in certain areas of Canada.
Furthermore, 19.8 % of respondents from Phase 1 perceived very low level of
satisfaction with corridor that was significantly correlated with the element of HUSS (r
= .526**
), the finding was tended to support M.A. Mohit & Zaiton’s (2012) study about
satisfaction level of public housing estates in Hulhumalé being generally higher for
HUSS except for cleaning services for corridors.

254
With respect to 18.8 % of respondents from Phase 3 with very low level of
satisfaction with garbage disposal that was significantly correlated with the element of
HUSS (r = .481**
), the finding was tended to support M.A. Mohit & Zaiton’s (2012)
study about satisfaction level of public housing estates in Hulhumalé, and Onibokun’s
(1974) study of public housing projects in certain areas of Canada. However, the finding
was tended to be contrary to Fauth, Leventhal, & Brooks-Gunn’s (2004) conclusions
about the 173 Black and Latino families who moved and stayed at publicly funded
attached row-houses with seven middle-class neighbourhoods for almost two years
gradually got more satisfied with public facilities in terms of garbage collection.
and followed by 14.7 % of respondents from Phase 2 with very low level of
satisfaction with firefighting equipment that was significantly correlated with the
element of HUSS (r = .290**
). This finding also supported M. A. Mohit & Nazyddah’s
(2011) conclusion about the poor households who lived at the rented high-rise transit
houses in urban areas of Selangor, Malaysia were dissatisfied with firefighting
equipment.
Moreover, very low level of satisfactions were perceived by 34.9%, 32.6% and
25.0% of respondents from Phase 1, 2 and 3 with nearest general hospital that was only
significantly correlated with the element of neighbourhood characteristics of Phase 2 (r
= .388**
), and was insignificantly correlated with neighbourhood characteristics of
Phase 1 and 3 (r = none). These findings were inclined to confirm with what Zanuzdana
et al. (2013) found that the respondents living in rural areas and urban slums in Dhaka,
Bangladesh were reported of dissatisfaction with spatial location characteristics of
surrounding neighbourhood especially in the distance and convenience of clinic or
general hospital.

255
In terms of resident’s workplace, quietness of housing estate, and urban centre,
31.6% of respondents living in Phase 2, 29.1% of respondents of Phase 2, and 17.5% of
respondents from Phase 3 showed their very low level of satisfactions with insignificant
correlations with the element of NC. These findings were tended to confirm with M. A.
Mohit & Nazyddah’s (2011) studies about residential satisfactions in Selangor state
cluster, individual, and transit housing, Onibokun’s (1974) findings regarding high
levels of noise and high probability of interference from neighbours generated by many
large-sized households on a small piece of property mainly made the tenants feel
dissatisfied, M. A. Mohit & Mahfoud’s (2015) analysis of residential satisfaction in two
double-storey terrace neighbourhoods – Taman Sri Rampai and Taman Keramat Permai
in Greater Kuala Lumpur, Wang, Zhang, & Wu’s (2015) study of the variation of
intergroup neighbouring in the city of Nanjing, and Onibokun, James and E. Ibem’s
(2008), (2013) and (1974) findings referring to the residents were not satisfied with the
location of shopping facilities to the public housing projects.
With regard to the low level of satisfactions with factors across four elements, 48.4
% of respondents from Phase 2 showed low level of satisfaction with open space that
was significantly correlated with the element of HESF (r = .562**
), this proposition was
tended to be similar with Onibokun’s (1974) findings about the tenants who lived in
public housing projects in certain areas of Canada severely felt dissatisfied with the lack
of open space. Furthermore, 30.0% of respondents of Phase 3 felt dissatisfied with local
kindergarten with significant correlation coefficients (r = .279*).
Regarding the factors being correlated with HUSS element, low level of 45.3% of
respondents (Phase 2)’ satisfaction was perceived with their electrical &
telecommunication wiring with significant positive correlation coefficient (r = .413**
),
followed by 32.6% of respondents of Phase 1 with low level of satisfaction with

256
staircases (r = .451**
), and followed by 30.0% of respondents of Phase 3 with low level
of satisfaction with street lighting (r = .439**
), these results were inclined with M. A.
Mohit & Azim’s (2012) findings of residents living at public housing estates in
Hulhumalé feeling dissatisfied with cleaning services for staircases and street lighting.
Relating to the factors being correlated with the element of NC, satisfaction with the
convenience from their living to their workplaces indicated low habitability perceived
by 52.3% of respondents of Phase 1 with insignificant correlation, followed by 47.4% of
respondents of Phase 2 with low level of satisfaction with nearest bus/taxi station (r =
positive), and followed by 42.5% of respondents of Phase 3 with low level of
satisfaction with local police station (r = .266*), these results were tended to support M.
A. Mohit & Nazyddah’s (2011) findings about the respondents both living at Selangor
state cluster and individual houses being dissatisfied with neighbourhood facilities by
inadequacy of provision of public transport facilities, such as bus/taxi stations in cluster
housing type and distance to work place in individual housing type respectively.
In terms of the factors being correlated with HUC element, 46.3% of respondents of
Phase 2 were dissatisfied with toilet with significant correlation coefficient (r = .269**
),
followed by 30.2% of respondents of phase 1 with low level of satisfaction with kitchen
(r = .623**
), and followed by 23.8% of respondents of phase 3 with significant
correlation coefficient (r = .315**
), these findings were tended to support Kaitilla’s
(1993) conclusions about urban households living at public housing in West Taraka
which was one of the low-income housing suburbs in the city of Lae, Papua New
Guineans were severely dissatisfied with badly designed kitchen and toilet.

257
Furthermore, the findings were tended to be similar with M. A. Mohit & Azim’s
(2012) results regarding the residents living at public housing estates in Hulhumalé were
slightly satisfied with physical space within the housing unit due to the factor of toilet
causing low level of residential satisfaction.
In terms of those three phases of respondents’ levels of satisfactions with the overall
residential environment, the respondents of Phase 1 whose average residential
satisfaction was 64.397% was perceived as the moderate level of satisfaction due to the
proportion of respondents with moderate level of satisfaction was large (87.2%). In the
meanwhile, the respondents of Phase 3 whose average residential satisfaction was
62.845% was also perceived as the moderate level of satisfaction due to the proportion
of respondents with moderate level of satisfaction was quite big (77.5%).
Moreover, the results of both residential satisfaction indices (RS indices) of Phase 1
and phase 3 being highly positively correlated with HUSS satisfaction index (HUSSS
index), with correlation coefficient (r) values of .628 and .582, respectively were tended
to support Paris & Kangari and Vera-Toscano & Ateca-Amestoy’s (2005) and (2008)
findings about the multifamily affordable housing resident satisfaction was mainly
affected by the element of HUSS. Furthermore, these findings supported Berkoz et al.
and Wahi et al.’s (2009) and (2012) studies about the component of HUSS had the most
principally correlations with RS index of low cost housing owners residing in Kuching,
Sarawak, East Malaysia.
However, the respondents of Phase 2 were dissatisfied [56.947% which was
perceived as the low level of satisfaction due to the proportion of respondents with low
level of satisfaction was large (87.4%)] with their overall residential environment.

258
Furthermore, the RS index of Phase 2 had the highest positive correlation (r = .422**
)
with NC satisfaction index (NCS index). In the meanwhile, the RS indices of phase 3
and Phase 1 also had the relatively high correlations with NCS index (r = .457**
and r =
.554**
). Accordingly, these results regarding the NCS index highly affecting RS index
of Phase 2 and affecting RS indices of phase 3 and Phase 1 in a way confirmed what
Carvalho et al., Sirgy & Cornwell, Hong, Paris & Kangari, Nam & Choi, and Cho &
Lee’s (1997), (2002), (2004), (2005), (2007), and (2011) found in their research works.
Furthermore, the residential satisfaction indices of Phase1, 3, and 2 had considerably
higher positive correlations (r = .572**
, .457**
, and .363**
, respectively) with HUC
satisfaction index (HUCS index), NCS index, and HESF satisfaction index (HESFS
index) than the same residential satisfaction indices having positive correlations (r =
.554**
, .449**
, and .352**
, respectively) with NCS index, HESFS index, and HUSSS
index. These findings were tended to support Rent & Rent’s (1978) study about the
subjective attributes of residential environment was found to have enormously
significant correlations with HUC satisfaction.
At last, the RS index of Phase 1 had a relatively lower positive correlation (r =
.355**
) with HESFS index, and followed by both RS indices of Phase 3 and Phase 2
having comparatively lower positive correlations (r = .319**
and .268**
, respectively)
with HUCS index. These findings were contrary to Salleh’s (2008) conclusion about the
inhabitants’ satisfaction levels of housing unit characteristics and housing unit
supporting services provided by the private housing developers were found to be overall
higher than the satisfaction levels of neighbourhood facilities and environment in
private low-cost housing projects in fast-growing state of Penang and less-developed
state of Terengganu in Malaysia.

259
With respect to the correlations between the respondents’ individual and household
socio-economic characteristics and RS indices, the longer the respondents of the Phase
2 lived, the more satisfied with residential environment that they felt [with correlation
coefficient (r) value of .206]. This result was tended to support Fang, M. A. Mohit et al.,
and M. A. Mohit et al.’s (2006), (2010), and (2012) findings about there was a
significant positive correlation of the overall satisfaction in public housing estates in
Hulhumalé, in public low-cost housing estates in Sungai Bonus, and in the four
redeveloped inner-city neighbourhoods in Beijing with the respondents’ length of
residency. However, this result was completely different from Rent & Rent’s (1978)
findings.
Moreover, the more choices on main means of transportation were provided to the
respondents of the Phase 3, they felt more satisfied with residential environment [with
correlation coefficient (r) value of .362]. On top of that, the rest of correlations between
the respondents’ individual and household socio-economic characteristics and RS
indices throughout three phases had positive and negative correlations, but insignificant
ones. These findings were tended to support many authors’ propositions such as J. P. e.
a. James, Fang, Kellekci & Berköz, Salleh, M. A. Mohit et al., M. A. Mohit &
Nazyddah, Day, E. O. Ibem & Aduwo, Li & Wu, Zanuzdana et al., Huang & Du, M. A.
Mohit & Mahfoud, and Wang et al.’s (2001), (2006), (2006), (2008), (2010), (2011),
(2013), (2013), (2013), (2013), (2015), (2015), and (2015).
In terms of the correlations between the respondents’ individual and household
characteristics and each element index of residential environment, the respondents’ ages
and occupation type had positive correlations [with correlation coefficient (r) values of
.272 and .234, respectively] with HESFS index of Phase1 which, on the other hand,
decreased with the increases in household sizes, decreased with the promoting in

260
residents’ occupation sector, and decreased with the increases in their incomes [with
correlation coefficient (r) values of -.275, -.260, and -.230, respectively]. These findings
were tended to support M. A. Mohit et al.’s (2010) study about the respondents’
employment type had a positive correlation with HESF.
Moreover, NCS index of Phase 1 declines with the increases in respondents’ ages
[with correlation coefficient (r) value of -.227]. This finding supported M. A. Mohit et
al.’s (2010) study about the respondents’ age having a negative correlation with social
environment characteristics of neighbourhood satisfaction. However, NCS index of
Phase 3 increased with the increase in choices about the main means of transportation
provided to the respondents [with correlation coefficient (r) value of .232].
Apart from this, the rest of correlations between the respondents’ individual and
household characteristics and each element index of residential environment throughout
three phases had positive and negative correlations, but insignificant ones.
Therefore, with reference to the above mentioned results, the respondents’ individual
and household socio-economic characteristics such as marital status and main means of
transportation were positively correlated with RS indices throughout three phases of
low-cost housing. These findings were contrary to M. A. Mohit et al.’s (2010) study
about the marital status of residents living at public low-cost housing in Kuala Lumpur
were negatively correlated with the overall housing satisfaction.
However, the RS indices throughout three phases of low-cost housing declined with
the increases in household sizes, promoting in residents’ occupation sector, and
increases in their incomes. These results found in this research were similar with M. A.
Mohit et al., M. A. Mohit & Azim, and Zanuzdana et al.’s (2010), (2012), and (2013)
findings in terms of the household size, family size and income being negatively

261
significantly correlated with residential satisfactions in Malaysian public low-cost
housing, in Hulhumalé’s public housing, and in urban slums and rural areas in Dhaka,
Bangladesh
However, these results were opposite to M. A. Mohit et al., M. A. Mohit & Azim, E.
O. Ibem & Amole, Zanuzdana et al., and E. O. Ibem & Amole’s (2010), (2012),
(2013a), (2013), (2013b) and (2014) findings about the respondents’ household size in
Hulhumalé’s public housing, the respondents’ employment sector in Malaysian public
low-cost housing, the 156 households’ employment sector at the OGD workers’ housing
estate in Abeokuta, and the respondents’ income in urban slums and rural areas in
Dhaka, Bangladesh and in Ogun state 10 newly-built public housing estates were
positively correlated with residential satisfaction. Furthermore, these results were
contrary to M. A. Mohit et al. (2010) claimed that the variable of income had a
nonsignificant correlation with the overall housing satisfaction
Furthermore, the RS indices of Phase 1 and 2 had negative correlations with the
respondents’ gender which, however, was positively correlated with residential
satisfaction index of Phase 3. These findings were tended to support Dekker et al. and E.
O. Ibem & Amole’s (2011) and (2013a) studies about the respondents’ gender being
found to be significantly correlated with residential satisfaction in the OGD workers’
housing estate in Abeokuta. On the contrary, these findings were completely different
from McCrea et al. and M. A. Mohit et al.’s (2005) and (2010) reports that the factor of
gender of respondents in urban living in Brisbane-South East Queensland and Kuala
Lumpur’s public low-cost housing had no correlation with residential satisfactions.
Moreover, the older the respondents of Phase 2 and 3 were, they felt more satisfied
with residential environment, in contrast, the older the respondents from Phase 1 were,
the less satisfied with residential environment that they felt. These results were inclined

262
to support Varady & Preiser, J. P. e. a. James, Dekker et al., E. O. Ibem & Amole and
Balestra and Sultan’s (1998), (2001), (2011), (2013a), and (2013) findings about that the
age of residents who lived at scattered-site public housing, lived at three renovated
buildings and lived at the OGD workers’ housing estate in Abeokuta, respectively was
found to be significantly correlated with their residential satisfactions. Moreover, the
results came from Phase 2 and 3 were similar with Zanuzdana et al.’s (2013) findings
regarding the higher age being found to be highly associated with higher satisfaction
with housing in population of urban slums and rural areas in Dhaka, Bangladesh. In
addition, the result of Phase 1 was tended to support M. A. Mohit et al.’s (2010)
findings about the age of 102 respondents being found to be negatively correlated with
the overall housing satisfaction.
What is more, the higher educated the respondents of the Phase 2 and 3 received, the
less satisfied with residential environment that they felt, on the contrary, the higher
educated the respondents of the Phase 1 received, they felt more satisfied with
residential environment. These findings supported Dekker et al., E. O. Ibem & Amole’s,
and Balestra and Sultan’s (2011), (2013a), and (2013) studies about the factor of
educational attainment being found to be significantly correlated with residential
satisfaction. Moreover, the result of Phase 1 was tended to support Zanuzdana et al.’s
(2013) findings about the higher education being found to be highly associated with
higher satisfaction.
In the way of respondents’ occupation type, it had positive correlations with
residential satisfaction indices of Phase 2 and 3, while the same respondents’ attribute
was negatively correlated with residential satisfaction index of Phase 1. These results
were tended to support Dekker et al., E. O. Ibem & Amole, E. O. Ibem & Amole, and E.
O. Ibem & Amole’s (2011), (2013a), (2013b), and (2014) findings in terms of the factor

263
of employment type being found to be significantly correlated with residential
satisfaction. Furthermore, the results of Phase 2 and 3 were inclined to support M. A.
Mohit et al.’s (2010) findings about there was a positive correlation of residential
satisfaction with respondents’ occupation type.
In the case of floor level, the higher floor level the respondents of the Phase 2 and 3
lived on, the less satisfied with residential environment that they felt, on the other hand,
the higher floor level the respondents of the Phase 1 lived on, they felt more satisfied
with residential environment. The result of Phase 1 was similar with M. A. Mohit et
al.’s (2010) finding about there being a positive correlation of residential satisfaction
with respondents’ floor level.
In addition to that, the longer the respondents of the Phase 1 and 3 lived, the less
satisfied with residential environment that they felt, however, the respondents of the
Phase 2 felt in completely different ways from respondents of Phase 1 and 3. These
results of Phase 1, 2, and 3 were similar illustrations with Fang’s (2006) findings about
the factor of length of staying being found to be significantly correlated with residential
satisfaction. Furthermore, the result of Phase 2 was tended to support M. A. Mohit et al.
and M. A. Mohit & Azim’s (2010) and (2012) findings about there was a significant
positive correlation of the overall satisfaction in public housing estates in Hulhumalé
and public low-cost housing estates in Sungai Bonus with the respondents’ length of
residency.
7.3 Determinants of RS in Three Phases of LCH
With respect to those determinants from each phase, in general the separate
regression on the three phases of low-cost housing drew the conclusion that the three
phases of low-cost housing had the same determinants and the diverse ones to
contribute each phase of residential satisfaction.

264
On the basis of the qualitative results came from the six participants, the five reasons
as the main themes were generated and would be discussed as follows from the most
concerned (low level of satisfaction and more highly correlated to residential
satisfaction) to the less concerned (high level of satisfaction and less significantly
correlated to residential satisfaction). Correspondingly, the following factors not only
were very significant to the local government, they also obviously indicated which
problems were still existences from 1st phase to 3
rd phase and which problems were
already improved from 1st phase to 3
rd phase.
7.3.1 Good Social Environment and Neighbourhood Facilities
The first theme, which was mostly concerned by all residents living at three phases
of low-cost housing projects in Xuzhou, mainly talked about residents needing a good
social environment and better neighbourhood facilities.
7.3.1.1 Community Relationship
With respect to the community relationship, it had a moderately impact on the Binhe
Huayuan’s residential satisfaction index. This result firstly was tended to support
Amerigo & Aragones’, Turkoglu’s, Varady & Preiser’s, Byrnes-Schulte et al.’s, Al-
Homoud’s, Cho & Lee’s, and Aulia & Ismail’s (1990), (1997), (1998), (2003), (2011),
(2011), and (2013) studies about the more tenant involvements, more neighbourhood
social interactions and more activations of participations in the community bringing
along the higher residential satisfactions of planned and squatter environments in
Istanbul, scattered-site public housing, middle-income housing in Medan city,
Indonesia, Badia communities, and high-rise and high-density apartment complexes in
Korea, respectively comparing with the improvements in physical environment of
residential situations.

265
Secondly, back to Xuzhou’s three phases of low-cost housing projects, the 5
participants gave the same answer such as residents’ active involvements and no social
exclusion existing. These findings almost confirmed with some achievements made by
the community committee that was the first tier of government controlled by the local
government in terms of increasing social cohesion within the housing areas.
Unfortunately, something missed by the local government regarding how to get the
mixed communities involved together by means of regional housing planning between
the commodity and low-cost housing was elaborated by Interviewee 2 and Interviewee 6
that giving an opposite answer such as residents’ no participation and social exclusion
existing in Phase 1 supported from p.446-459 presenting monthly income of RMB
4,000-5,999 being negatively correlated with community relationship (r = -.217*), and
people who lived at the commodity houses (just opposite to Phase 3) looked down upon
the residents living at low-cost housing and sometimes had conflicts with each other.
These findings were also found in Vera-Toscano & Ateca-Amestoy’s (2008) studies
talking about the residents of commodity housing surrounded by public housing in
Spain were less likely to feel satisfied with their commodity houses and the intensity of
social interaction did not bring along higher level of individual housing satisfaction
amongst residents who lived in the mixed residential environment.
Furthermore, based upon Interviewee 6’s description of the residents from Phase 3
going to the opposite condominium to use their two outdoor swimming pools and
receiving their rejections due to their bad manners such as not wearing swimsuits while
swimming and children making a lot of noises and Interviewee 2’s description of
feeling excluded in Phase 1 brought by the comparatively higher income group of
residents in Phase 1 not involving their activities and being dissatisfied with community
relationship, this result was tended to verify Onibokun’s (1974) findings about the bad

266
image of public housing projects which was sometimes created by the tenants or was
imagined by outside residents had perpetuated a stereotyped bad image in the minds of
the public and also to support HaSeongKyu’s (2006) findings about residents living at
public houses adjacent to non-public housing and between lower and higher income
group of residents had a strong feeling of social exclusion.
Thus, from the local residents’ points of views concluded by some authors, the
number of residents who opposed to social mixing residence was much higher than the
number of residents who supported social mixing residence (Dennis Lord & Rent, 1987;
Fauth et al., 2004; Fried, 1973; Fried & Gleicher, 1961; HaSeongKyu, 2006; Kleit,
2001a).
From Xuzhou’s local government’s point of views, except for Phase 2 only having
low-cost housing alone, the social-mixed residences (Phase 1 and Phase 3 having low-
cost housing and resettlement projects as well, and both located in low-cost and
commodity mixed housing neighbourhoods) could be reducing the chances of low-cost
housing area turning into a slum (or another type of urban village) and simultaneously
enhancing the living safety and quality of life of residents who were living at low-cost
housing by means of sharing the improved regional neighbourhood facilities with
commodity housing residents, and was suggested by Wenjia & Hanif’s (2016) studies
about social-mixed residences involved by Malaysian locals and medium-low income
migrant workers at Mentari community Bandar Sunway, Selangor to improve their more
mutual understandings and help each other in order to better neighbourhood cohesion
and Malaysian social cohesion rather than isolating those medium-low and low income
migrant workers at specific places to easily cause a foreign refugee camp.

267
In addition to Xuzhou’s municipal government minimising the problems of social-
mixed residences with the same neighbourhood to solve social exclusion, the NGOs
were suggested by many authors such as HaSeongKyu (2006); (Kleit, 2001b) to
enhance social inclusion by promoting low-income group of people’s social capital such
as social networks, norms, and social trust which were considerable important to the
poor people and could be taken as an asset used by the poor people to facilitate
coordination and communication for mutual understanding between low-cost and non-
low-cost housing neighbourhoods.
7.3.1.2 Local Crime and Accident Situation
With regard to the local crime and accident situation, they contributed the most to
predicting Chengshi Huayuan’s residential satisfaction. Moreover, p.446-459 presented
the factor of local crime and accident situation having significantly positive correlations
with Phase 1 and Phase 2’s residential satisfactions with r = .297**
and r = .414***
( r =
.304**
), respectively. This result initially was tended to support Weidemann and
Anderson’s, Bonnes et al.’s, Paris and Kangari’s, Adriaanse’s, and Buys & Miller’s
(1982), (1991), (2005), (2007), and (2012) findings about the factor of safety from
crime significantly affecting residential satisfaction of multifamily affordable houses
and public housing in Brisbane. Furthermore, this result also supported Hipp’s (2009)
finding about crime being found to have a significantly negative effect on residential
satisfaction.
Unfortunately, in terms of local crime and accident situations of Xuzhou’s three
phases of low-cost housing projects, the majority of the six participants complained
about the frequencies of crimes and accidents’ occurrences were medium with very bad
situations. These experiences were similar with M. A. Mohit et al.’s, M. A. Mohit &
Nazyddah’s, and E. O. Ibem & Aduwo’s (2010), (2011), and (2013) conclusions about

268
the public housing respondents living at Kuala Lumpur newly design low-cost housing,
living at Selangor State transit houses, and living in Ogun State expressing low level of
satisfaction with residential environment due to the effects of crime situation. Moreover,
these findings were also tended to support Hipp’s (2009) conclusion about the social
disorder having a negative correlation with neighbourhood satisfaction.
Furthermore, based upon six participants’ descriptions of high and medium
frequencies of local crime and accident’s occurrences with bad situations that bringing
along low level of neighbourhood and residential satisfaction, a lot of authors
particularly McCrea et al. (2005) and Kang and Lee (2007) suggested increasing
neighbourhood and residential satisfaction of residents living in the Brisbane-South East
Queensland region depended more on the improvement of neighbourhood interaction
especially for the older people (that was supported by the current research in which
p.446-459 displayed the respondents with Age51-60 in Phase 3 having negative
correlations with satisfaction of community relationship with r = -.274**
) and building a
sense of community connected to crime-safe environment through focusing on the
relationship between neighbourhood relationships and residents’ fear of crime in urban
residential area in Korea.
Thus, from the three phases’ residents’ points of views, a professional property
management team was their prioritised requirement to deal with the current happening
such as bicycle stealing, burgling, car and electric bicycle accident.
Nevertheless, on account of the level of fear of crime being found by Kang and Lee
(2007) to be negatively correlated with the social network reinforcement by way of
interaction and participation (that was supported by the current research in which p.446-
459 presented free from local crime and accident situation having significantly positive
correlations with community relationship in Phase 2 with r = .233*, .230
*, respectively),

269
some authors recommended to improve the sense of community by way of increasing
the reinforcements of social cohesion and social interaction amongst neighbours so as to
create a crime-safe environment in urban residential area.
In addition, in terms of the design of housing estate, Kang and Lee (2007) claimed
that the increasing of surveillance opportunity through the adjustments of night lighting
interval to decide the visual accessibility about the habitats, the improvement of type of
alley and housing layout from the street, and even the decreasing of non-housing
proportion in urban residential area had significant correlations with controlling
vandalism and vehicles-related crime victimisation.
In the light of the 2nd
phase of low-cost housing being located at the isolated housing
area comparing to Phase 1 and Phase 3 located at the mixed housing area, the residential
satisfaction level of inhabitants of Phase 2 were even lower than Phase 1 and 3’s in
terms of lack of neighbourhood facilities and less concerns from local government.
Accordingly, the low-cost and commodity housing mixed neighbourhoods were
recommended to enhance the living safety and quality of life of residents who were
living at low-cost housing by means of sharing the improved regional neighbourhood
facilities with commodity housing residents.
Therefore, from Xuzhou’s local government’s point of views, two ways of
enhancements that the local government was doing and would do consisted of the low-
cost and commodity housing mixed neighbourhoods and professional property
management teams to improve the better community relationship in three phases and to
deal with the current happening such as bicycle stealing, burgling, car and electric
bicycle accident so as to get the situations of crime and accident better (p.446-459
presented free from local crime situation having a significantly positive correlation with
free from local accident situation in Phase 2 with r = .367**
).

270
7.3.1.3 Quietness of the Housing Estate
With respect of the quietness of the housing estate, it contributed the most to
predicting Binhe Huayuan’s residential satisfaction. Moreover, p.446-459 presented the
factor of quietness of the housing estate having significantly positive correlations with
three phases’ residential satisfactions with r = .229*, r = .196
*, and r = .407
***,
respectively. This result at first was tended to support Bonnes et al.’s, Buys & Miller’s,
and M. A. Mohit & Nazyddah’s (1991), (2012), and (2011) findings about the factor of
noise significantly predicting the residential satisfaction of public housing in Brisbane
and residential satisfaction of Selangor State transit housing. Furthermore, this result
was also inclined to support M. A. Mohit & Nazyddah’s, M. A. Mohit et al.’s, and E. O.
Ibem & Aduwo’s (2011), (2010), and (2013) findings about 50 respondents living at
Selangor State transit houses showing marginally moderate level of satisfaction with
social environment due to effects of noise level, and even the public housing
respondents both living in Ogun State and Kuala Lumpur feeling dissatisfied with social
environment characteristics of neighbourhood.
With regard to the quietness of the housing estate, the four participants from the 1st
and 3rd
phases believed that many noises were generated from the neighbours and from
the open spaces (p.446-459 presented the factor of quietness of the housing estate
having significantly positive and negative correlations with three phases’ satisfactions
of corridor, open space, and local shops with r = .260**
, r = -.230* & r = .261
**, and r =
.236*, respectively). These experiences were similar with Onibokun’s, R. N. James’
(1974), (2007) affirmations about small-sized tenants feeling dissatisfied with high
levels of noise and high probability of interference from neighbours generated by many
large-sized households and renters’ satisfaction being noticeably negatively correlated
with violation of space separation by noise intrusion through walls, floors, or ceilings.

271
Thus, regarding the current situation of low-cost housing residents who felt hopeless
in terms of the issue of quietness, on one hand, the residents understood this price of
housing not having sound-proofing walls and the design of public area of housing estate
not being a resident-friendly, on the other hand, the residents really wanted the local
government to do some improvements.
Accordingly, the local government was suggested that it should improve the quality
of housing unit design at each floor to meet the standard of commodity housing that had
a standard of sound insulation and afterwards should diversify each block of residents in
future’s projects by low-cost, resettlement, and medium-income commodity residents to
build up a good environment where the diverse residents with different education
backgrounds could learn from each other and improve the quietness of corridor by
reducing the noises of children’s playing and fighting, couple’s quarrelling, and sound
of television, etc.
In addition, the local government was suggested to ask each phase of property
management company to redesign the public area of housing estate where the places of
open space, children’s playground, and local shops should be kept a certain distance to
residential blocks so as to enhance the quietness from the public area of housing estate.
7.3.1.4 Resident’s Workplace and Nearest Bus/Taxi Station
In regard to the satisfaction with resident’s workplace having the most impact on
residential satisfaction of Yangguang Huayuan, this finding was intended to support M.
A. Mohit & Nazyddah’s (2011) results about the increasing of residential satisfactions
in Selangor state cluster, individual, and transit housing depending more on increasing
the convenience of going to workplaces for residents.

272
Referring to the factor of resident’s workplace which determined residential
satisfaction, except for the two participants from the 3rd
phase claimed that the distance
between Binhe Huayuan and their workplaces were medium distance and it was
convenient, the rest four participants complained about between their workplaces and
their houses were long distances and they were not convenient. Table 5.2 presented
73.7% of respondents of Phase 2 with low and very low level of satisfaction with
resident’s workplace, followed by 66.3% in Phase1 and 57.5% in Phase 3.
Nevertheless, most residents might have understood their low-cost housing’s
locations that had a certain distance from the downtown because of three phases having
a certain kind of municipal subsidies especially on the land cost. On account of most
residents went to downtown for working, their basic requirements were to get to work
easily by way of using public transports.
However, the current situations of their nearest bus/taxi stations were not satisfied
according to Table 5.2 presenting 61.1% of respondents of Phase 2 with low and very
low level of satisfaction with nearest bus/taxi station, followed by 54.6% in Phase1 and
45.1% in Phase 3. Moreover, the factor of nearest bus/taxi station contributed the most
to predicting Phase 2’s residential satisfaction. This result supported M. A. Mohit &
Nazyddah’s (2011) findings again about the respondents both living at Selangor state
cluster and individual houses feeling dissatisfied with neighbourhood facilities by
inadequacy of provision of public transport facilities in terms of bus/taxi station.
Moreover, this result also supported Tian & Cui’s (2009) findings about the residents,
who lived at a public housing in Harbin, north-eastern China, being not satisfied with
transport facilities.
Coincidentally, two participants form Binhe Huayuan and two participants from
Chengshi Huayuan complained about the number of shuttle bus was very few especially
273
Chengshi Huayuan not only having a problem with the distance between the station and
residential area (which was more than 1 kilometre), but there being only one shuttle bus
with around 30 minutes of each shuttle and the operating hours only from 6am to 6pm.
Thus, the distance between Xuzhou’s low-cost housing and residents’ workplaces did
not matter their satisfactions too much comparing to the nearest bus/taxi stations (public
transports provided) not only mattering their satisfactions with convenience of
workplaces but also deciding their satisfactions in terms of the distances between their
houses and the nearest bus/taxi stations and the numbers of public buses. Accordingly,
the local government should improve their concerns about how to re-plan the bus routes
around Xuzhou’s low-cost housing areas in order to save their time on going to work.
7.3.1.5 Community Clinic, Nearest General Hospital, and Nearest School
The satisfactions with community clinic and the nearest general hospital had the
most and moderate impacts on residential satisfaction of Yangguang Huayuan.
Furthermore, the residents of Yangguang and Chengshi Huayuan were simultaneously
very concerned about the improvements of satisfactions with the nearest schools. These
findings were tended to support Dennis Lord & Rent’s and M. A. Mohit & Nazyddah’s
(1987) and (2011) conclusions about the increasing of residential satisfactions in those
eight scattered-site public housing projects and in Selangor state cluster, individual, and
transit housing depended more on the access to school and increasing numbers of the
nearest school. However, these conclusions were tended to be contrary to Lovejoy,
Handy, & Mokhtarian’s and Al-Homoud’s (2010) and (2011) findings about the factor
of nearest school being not found to contribute to predicting neighbourhood satisfaction
both in traditional and suburban neighbourhoods and this factor being found to
moderately or less impact residential satisfaction in the village of As-Salhiyyah in the
northern Badia.

274
Table 5.2 presented 45.3% of respondents of Phase 1, followed by 45.0% in Phase 3
and 36.8% in Phase 2 with high level of satisfaction with community clinics. However,
74.7% of respondents of Phase 2 had low and very low level of satisfactions with the
nearest general hospital, followed by 74.4% in Phase 1 and 61.3% in Phase 3. In terms
of the level of satisfaction with the nearest school, 38.4% of respondents of Phase 1
showed high level of satisfaction, followed by 26.3% in Phase 3 and 18.9% in Phase 2.
Equally, 11.6% of respondents of Phase 2 showed very low level of satisfaction,
followed by 11.3% of Phase 3 and 9.3% in Phase 1.
Moreover, the results from the interview were inclined to support those above
percentages in terms of the community clinics located at these three phases having good
locations and easy accesses, but the nearest general hospitals to these three phases
unfortunately having long distances and they were not convenient to get there. Referring
to the nearest school, the only two interviewees from Phase 2 complained about the
distance between Phase 2 and the nearest school was long and it was not convenient.
On this basis, these findings were intended to support Zanuzdana et al.’s (2013)
results about the respondents living in rural areas and urban slums in Dhaka,
Bangladesh feeling dissatisfied with the nearest general hospital because of the distance
and convenience. However, these findings regarding community clinics throughout
three phases with good locations and easy accesses were tended to be contrary to
Zanuzdana et al.’s (2013) conclusion about respondents’ dissatisfactions with the
community clinic with the same reason as their dissatisfactions of the nearest general
hospital. In terms of the respondents from Phase 1 and Phase 3 giving moderate and
high level of satisfactions with the nearest schools, these findings were tended to
support Fauth et al.’s (2004) conclusion about those 173 Black and Latino families
living at publicly funded attached row-houses in seven middle-class neighbourhoods

275
feeling satisfied with schools. Moreover, the reason why the two interviewees from
Phase 2 with dissatisfaction of the nearest school was similar with Tian & Cui’s (2009)
findings about the residents, who lived at a public housing in Harbin, north-eastern
China, being not satisfied with children’s schools ascribed to the distance between
residential area and the nearest school being long and bad transport facilities resulting in
inconvenience.
Thus, the distance and convenience caused the low level of satisfactions of the
general hospital and nearest school which were related with the numbers and
convenience of public buses provided by the local government. In addition, the local
government was suggested by low-cost residents to build at least one general hospital
and one elementary, junior, and senior middle school within each phase of low-cost
housing area as the way of building community clinics at each phase of low-cost
housing.
7.3.1.6 Local Police Station
The satisfaction with the local police station had the moderately impact on Phase 3’s
residential satisfaction index. This result was tended to support M. A. Mohit &
Nazyddah’s (2011) findings about residential satisfactions of Selangor State cluster and
transit housing depending more on distance to police station. Accordingly, except for
two interviewees from Phase 3 complaining about the distance between residential area
and local police station being long and not convenient, the other four interviewees from
Phase 1 and 2 claimed that the distance between residential areas and local police
stations being short and convenient.

276
Thus, the local government was suggested by low-cost residents to set up more local
police stations to ensure their safety in residential areas where a lot of crimes happened
due to lack of good property management having financial problems based on the
characteristics of low-cost housing.
7.3.1.7 Nearest Fire Station
The satisfaction with the nearest fire station had the moderately impact on Phase 3’s
residential satisfaction index. Moreover, 41.0% of respondents of Phase 2 had low and
very low level of satisfactions with the nearest fire station, followed by 33.8% in Phase
3 and 25.6% in Phase 1 (Table 5.2 presented). The reason why the most residents from
three phases were dissatisfied with this was because all six participants complained
about the distances between their houses and the fire stations were long and they were
not convenient. This result was inclined to support M. A. Mohit & Nazyddah’s (2011)
findings about the respondents both living at Selangor state cluster and individual
houses feeling dissatisfied with distance to fire station.
In addition to the fire station with long distance and inconvenience, 52.6% of
respondents of Phase 2 showed low and very low level of satisfactions with the
firefighting equipment, followed by 38.8% in Phase 3 and 32.6% in Phase 1 (Table 5.2
presented). Accordingly, all six participants from three phases were angry with no such
a low-cost housing estate having their own firefighting equipment. This result was also
tended to support M. A. Mohit & Nazyddah’s (2011) findings about 50 respondents
living at transit houses in urban areas being dissatisfied with firefighting equipments.
Thus, the local government should install the firefighting equipments at each phase
of low-cost housing as soon as possible and ask the fire department to organise the fire
drills through which all of low-cost housing residents would have increased their
awareness of fire prevention.

277
7.3.2 Good Layout and Maintenance for Public Facilities
7.3.2.1 Open Space
The residents of Phase 1 and 3 were much concerned about the enhancements of
satisfaction with the open space. p.446-459 presented the factor of open space having
significantly positive correlations with Phase 2 and Phase 3’s residential satisfactions
with r = .236* and r = .292
**, respectively. This result was similar with Berkoz et al.’s
(2009) findings about the factor of open area contributing most to predicting mass
housing users’ residential satisfactions in Istanbul.
Based upon Table 5.2 presenting 57.9% of respondents of Phase 2 with low and very
low level of satisfactions of the open space, followed by 27.6% in Phase 3 and 22.1% in
Phase 1, most participants criticised that it was not a very enough space with a bad
condition. This problem was similar with what Onibokun (1974) found in public
housing projects in certain areas of Canada where the tenants severely felt dissatisfied
with the open space due to lack of space.
In addition, the 2nd
and 3rd
phases’ open spaces had lighting problems and sanitation
problems. Interviewee 1 and Interviewee 5 suggested that the property management
company should buy some more fitness equipments and build more recreation places.
Interviewee 2 complained about many noises came from the open space (p.446-459
presented the factor of open space having significantly positive and negative
correlations with quietness of housing estate and residents living on the 1st Floor in
Phase 3 and Phase 1 with r = .261**
and r = - .272**
, respectively). Interviewee 3
complained about so much space was occupied by the local shops (p.446-459 presented
the factor of open space having a significantly positive correlation with local shops in
Phase 2 with r = .232**
).

278
Thus, the local government was suggested by local low-cost residents that should ask
the property management company to provide some more fitness equipments and to
build more recreation places. Moreover, the lighting and sanitation problems should be
fixed as soon as possible especially the lighting problem caused a lot of safety issues in
terms of accidents and bicycles stolen.
With respect to the quietness of housing estate in terms of the open space, the
residents living on the 1st Floor at Phase 1 were dissatisfied with the open space,
because many noises came from the open space disturbed the residents who lived on the
lower levels of floors. Accordingly, the layout of open space would be redesigned, for
example, the activities area should be far away from the residential area. In terms of
Phase 2, the local shops should be separated from the open space so as to reduce a lot of
noises from local shops.
7.3.2.2 Children’s Playground
The factor of children’s playground was one of key predictors to significantly
determine the residential satisfactions of Phase 2 and 3. This result was tended to
support Salleh’s (2008) finding about the factor of children playgrounds determining the
level of residential satisfaction of inhabitants living at private low-cost housing projects
in fast-growing state of Penang and less-developed state of Terengganu in Malaysia.
Based upon 74.4% of respondents of Phase 1 having low and very low level of
satisfactions of children’s playground, followed by 66.3% in Phase 2 and 62.6% in
Phase 3 (Table 5.2 displayed), all participants complained about the very limited space.
This result was similar with what Onibokun (1974) found that the tenants who lived at
public housing projects in certain areas of Canada severely felt dissatisfied with the
children’s playgrounds because of lack of space.

279
Most of them especially from the 2nd
and 3rd
phases complained about the bad
condition and location, for example, Interviewee 2 said that the children’s playground
had conflicts with the perimeter road (P.446-459 presented the factor of children’s
playground having significantly positive correlations with perimeter road in Phase 1 and
3 with r = .270**
and r = .221*, respectively). Moreover, Interviewee 3 said that the
children’s playground was occupied by the parking facilities (P.446-459 presented the
factor of children’s playground having a significantly positive correlation with parking
facilities in Phase 2 with r = .238*). Interviewee 5 said that one block’s garbage
collection spot was at the children’s playground (P.446-459 presented the factor of
children’s playground having a significantly positive correlation with Garbage disposal
in Phase 3 with r = .452***
). In addition, the 2nd
and 3rd
phases both had lighting and
sanitation problems (P.446-459 presented the factor of children’s playground having a
significantly positive correlation with street lighting in Phase 3 with r = .298**
).
Thus, the local government was suggested by local low-cost residents that should ask
the property management company to redesign the location of children’s playground
due to it had conflicts with the perimeter road in Phase 1, was occupied by the parking
facilities in Phase 2, and was affected by one block’s garbage collection spot in Phase 3.
In addition, the local government should ask the property management company to fix
the lighting and sanitation problems in Phase 2 and 3 as quickly as they could, because
the lighting problem caused a lot of safety issues regarding when the children were
playing during the night and the sanitation problem caused a lot of children’s health
issues.
280
7.3.2.3 Parking Facilities
The satisfaction with parking facilities had the moderately impact on Yangguang
Huayuan’s residential satisfaction. This result was tended to support M. A. Mohit &
Nazyddah’s (2011) findings about the satisfaction with parking facilities contributing
moderately to predicting residential satisfactions of Selangor State cluster, individual,
and transit housing. On the contrary, the result was opposite to Lovejoy et al.’s (2010)
findings about parking being not found to contribute to predicting neighbourhood
satisfaction both in traditional and suburban neighbourhoods.
Based upon 69.7% of respondents of Phase 1 having low and very low level of
satisfactions of parking facilities, followed by 58.9% in Phase 2 and 53.8% in Phase 3
(Table 5.2 displayed), the four participants from the 1st and 2
nd phases complained that
the parking areas were very limited with bad and chaotic conditions and also had
sanitation problems, for example, Interviewee 1, Interviewee 2 and Interviewee 3 said
that there had no car parking space. Furthermore, Interviewee 3 and Interviewee 4 said
that there had many lighting problems in Phase 2 (P.446-459 presented the factor of
parking facilities having a significantly positive correlation with street lighting in Phase
2 with r = .249**
) and the location of parking area had conflicts with children’s
playground and fitness equipment in Phase 2 (P.446-459 presented the factor of parking
facilities having significantly positive correlations with children’s playground and
fitness equipment in Phase 2 with r = .238* and r = .247
**, respectively).
With comparison to Phase 3 had a good car park environment with enough space,
good condition, and a clean area, the local government should ask the property
management company to plan an area only for car park in Phase 1 and 2 which would
not occupy the places of children’s playground and fitness equipment especially in
Phase 2. Hence, the residents’ cars would be arranged systematically for parking at

281
Phase 1 and 2 to deal with the current chaotic conditions. Additionally, to keep car
parking area’s cleanness was also very necessary for the residents. Besides, the lighting
problems in the currently mixed bicycle & car parking area of Phase 2 would be dealt as
soon as possible to reduce the risk of bicycle and auto thefts.
7.3.2.4 Local Shops
The residents of three phases simultaneously raised one fact that to improve
satisfaction of local shops may enhance their residential satisfactions (P.446-459
presented the factor of local shops having significantly positive correlations with all
three phases’ residential satisfactions with r = .184*, r = .255
**, and r = .278
**
respectively). This result was tended to support Onibokun’s (1974) finding about the
satisfaction with location and quality of shopping facilities around the housing area
contributing to predicting residential satisfaction of the tenants who lived in public
housing projects in certain areas of Canada.
Although the numbers of shops were sufficient, the certain numbers of residents
came from Phase 2 and 3 had low and very low level of satisfactions with local shops
(Table 5.2 showed 39% of respondents in Phase 2 and 26.3% of respondents in Phase 3
with low and very low level of satisfactions), because they thought that the local shops
in Phase 2 and 3 had some problems with locations, for example, Interviewee 3 said that
the locations of local shops in Phase 2 had conflicts with the open space (P.446-459
showed the factor of local shops having a significantly positive correlation with Phase
2’s open space with r = .232*). In addition, Interviewee 5 said that some shops located
at the first floor of the first row of the houses in Phase 3 disturbed residents (P.446-459
showed the factor of local shops having a significantly positive correlation with
quietness of housing estate with r = .236*).

282
Consequently, the local government would ask the property management company to
relocate those local shops located at Phase 2 which occupied some places of public area
and affected those residents’ spaces of playing. Additionally, the property management
company would relocate some shops located at the first floor of the first row of houses
in Phase 3 so as to reduce many noises generated by those shoppers to keep quiet
environment as much as they could.
7.3.2.5 Local Kindergarten
Xuzhou’s local authority should pay very attention to enhancing residents’
satisfaction with local kindergarten that was the common determinants to improving
residential satisfactions of Phase 2 and 3 (P.446-459 presented the factor of local
kindergarten having significantly positive correlations with Phase 2 and 3’s residential
satisfactions with r = .249**
and r = .261**
, respectively). This result was inclined to
support M. A. Mohit & Azim’s (2012) findings about the factor of kindergarten as a
predictor variable determining the residential satisfaction in public housing in
Hulhumalé.
Based upon Table 5.2 presenting 39.5% of respondents in Phase 1 having high level
of satisfaction with local kindergarten followed by 36.3% in Phase 3 and 11.6% in
Phase 2, all six interviewees shared almost same conclusions regarding the normal
numbers with normal conditions and normal locations and all local kindergartens were
clean.
Contrarily, in spite of the numbers, conditions, locations, and cleanness of local
kindergartens being at normal level, 47.4% of respondents in Phase 2 having low level
of satisfaction with local kindergarten followed by 30.0% in Phase 3 and 24.4% in
Phase 1 still worried about the teaching quality in those local kindergartens as other
elementary, junior and senior middle schools not having good teaching qualities due to

283
those good teachers were not willing to come to those low-income residential areas for
teaching and they were willing to go to schools with higher reputation and get higher
payment.
Although the low-cost and commodity mixed housing neighbourhoods designed by
Xuzhou’s local authority aimed at bringing along low-cost housing residents to share
commodity housing’s neighbourhood facilities (except for Phase 2 which was isolated
from the commodity housing area, therefore, the overall residential satisfaction of Phase
2 was shown low level) especially the education in terms of good schools with high
qualified teachers, as a matter of fact, the medium-high and high-income groups of
residents did not really want their children to study with other children came from the
low-cost housing, because most low-cost households did not pay very attention to their
children’s education and they were busy with their works.
As a result, those renowned schools were in need of certain numbers of students to
make profits so as to attract more and more high qualified teachers. In another way,
those renowned schools increased their tuition fees to attract those high qualified
teachers to come over here to teach. Sadly, those low-income households could not
afford to pay these high tuition fees to get their children into these better kindergartens,
elementary school, junior, and senior middle schools equipped with better teachers and
better teaching facilities.
To solve this kind of problem, the local government was suggested to set aside a
special fund for those low-income households’ children education consisted of
education allowances for those better full-day schools and better extra-curricular tutorial
classes (non-governmental training organisations) in order to improve their overall
education levels.

284
7.3.3 Good Maintenance for Housing Unit
7.3.3.1 Drain and Electrical & Telecommunication wiring
The satisfactions with drain and electrical & telecommunication wiring had the most
impacts on residential satisfactions of Phase 1 and Phase 3, respectively (P.446-459
showed the factor of drain having significantly positive correlations with Phase 1 and
3’s residential satisfactions with r = .331***
and r = .207*, respectively, and the factor of
electrical & telecommunication wiring had significantly positive correlations with Phase
1, 2, and 3’s residential satisfactions with r = .378***
, r = .279**
, and r = .400***
). These
results were tended to support M. A. Mohit & Nazyddah’s (2011) findings about the
satisfaction with cleanliness of drains contributing moderately to predicting residential
satisfactions of Selangor State cluster, individual, and transit housing and also supported
Zanuzdana et al.’s (2013) findings about the electricity contributing most to predicting
residential satisfaction of urban slums and rural areas in Dhaka, Bangladesh. However,
these results were tended to be contrary to Eziyi Offia Ibem et al.’s (2013) findings
about the electricity not having much more significant correlation with the level of
satisfaction of residents living at nine previously-built public housing estates in Ogun
State, Nigeria.
With respect to the views given by those participants, the three participants from the
1st and 2
nd phases thought that when they moved into their new houses, the drain system
was not good and the maintenance was also bad particularly Interviewee 2 reported that
his house’s drain system had problems very frequently. These comments on the drain
were inclined to support M. A. Mohit & Nazyddah’s (2011) findings about the 50
respondents living at transit houses in urban areas feeling dissatisfied with cleanliness of
drains and were also tended to support E. Ibem’s (2013) findings about residents living
at nine newly constructed public housing estates between 2003 and 2010 in urban
centres in Ogun State believing their drainage system being very poor.

285
Comparing to the drain, the five interviewees thought that they had a normal
condition of electrical & telecommunication wiring with a normal maintenance.
However, this result was tended to be contrary to E. Ibem’s (2013) findings about
residents living at nine newly constructed public housing estates in urban centres in
Ogun State feeling dissatisfied with electricity in their housing.
On the basis of the quality of low-cost housing was not relatively higher comparing
to the quality of commodity housing, most residents required local government to
improve the work efficiency of property management company in doing maintenance
work and repairs for cleaning drains and redoing electrical wiring layout to give some
more electrical sockets to fulfil their needs.
7.3.3.2 Staircases, Corridor, and Garbage Disposal
The satisfactions with staircases contributed the most to predicting Phase 2’s
residential satisfaction (P.446-459 showed the factor of staircases having a significantly
positive correlation with Phase 2’s residential satisfaction with r = .215*). Moreover, the
residents of three phases simultaneously raised one fact that to improve satisfaction with
corridor could enhance residential satisfactions of three phases (P.446-459 presented the
factor of corridor having significantly positive correlations with Phase 1 and 3’s
residential satisfactions with r = .314**
and r = .374***
, respectively). These findings
were tended to support M. A. Mohit & Azim’s (2012) results about cleaning services for
corridors and staircases moderately determining resident satisfaction of public housing
estates in Hulhumalé.
On the basis of Table 5.2 showing 48.9% of respondents from Phase 1 having low
and very low level of satisfactions with staircases followed by 46.3% in Phase 3 and
42.1% in Phase 2, all six participants complained that their staircases were quite narrow
or just enough space for using and were unclean. Except for the 1st phase having a good

286
lighting in staircases, the 2nd
and 3rd
phases had no lighting at all in their staircases.
Interviewee 1 gave a special comment on staircases in which different numbers of stairs
were in different floor levels and different stairs had different heights. Interviewee 6
also gave a similar comment like that each staircase was very high for her.
As a matter of course, the local government should have checked low-cost housing’s
quality when it just completed construction and was ready to be introduced to low-
income housing market. Currently, the local government would ask their local property
management companies to re-measure the numbers and heights of staircases in order to
make sure that the numbers of stairs would be the same in all floor levels and each
staircase would have the same height with a limit height. Moreover, the property
management companies of Phase 2 and 3 should learn from Phase 1 to install timers for
lights so as to enhance their safeties during the night. In addition, the uncleanness of
staircases making all of three phases’ residents’ headache must be fixed as soon as
possible. The property management companies would ask their janitors to increase the
frequencies of cleaning. Finally, to increase the space of staircases throughout three
phases would not easily change its physical design, but should easily clear up all
occupied residents’ leftovers to increase current space.
On the basis of 52.6% of respondents from Phase 2 having low and very low level of
satisfactions with corridor followed by 36.6% in Phase 3 (4.17 presented), the corridor
had a similar result given by those six interviewees especially Interviewee 1 and
Interviewee 5 complained about the corridor was quite noisy (P.446-459 presented the
factor of corridor having a significantly positive correlation with quietness of housing
estate in Phase 1 with r = .260*) and Interviewee 6 complained about the corridor was
affected by the big smell from the garbage sometimes (P.446-459 presented the factor of

287
corridor having a significantly positive correlation with garbage disposal in Phase 3
with r = .236*).
In terms of the factor of garbage disposal, the satisfaction with the garbage disposal
had less impact on Yangguang Huayuan’s residential satisfaction (P.446-459 presented
the factor of garbage disposal having significantly positive correlations with Phase 1
and 3’s residential satisfactions with r = .341***
and r = .326**
, respectively). This result
was inclined to support Mohit & Nazyddah’s (2011) findings about the moderate beta
coefficient of the model predicting that cleanliness of garbage house and garbage
collection were the minor predictor variables of residential satisfactions in Selangor
State individual, cluster, and transit housing. However, this result was tended to be
contrary to Mohit et al.’s (2010) findings about the high beta coefficient of the model
predicting that cleanliness of garbage house and garbage collection were the major
predictor variables of residential satisfaction of public low-cost housing in Kuala
Lumpur.
On the basis of Table 5.2 showing 38.4% of respondents in Phase 1 having low and
very low levels of satisfactions with garbage disposal followed by 36.3% in Phase 3 and
33.7% in Phase 2, the five interviewees gave the same conclusion such as timely
collection and did not clean thoroughly especially the 3rd
phase. Interviewee 5 and
Interviewee 6 both from the 3rd
phase gave their comments that a garbage can was put at
the children’s playground (P.446-459 presented the factor of garbage disposal having a
significantly positive correlation with Phase 3’s children’s playground with r = .452***
)
and the big smell from the garbage affected the corridor (P.446-459 presented the factor
of garbage disposal having a significantly positive correlation with Phase 3’s corridor
with r = .236*).

288
Accordingly, the above mentioned dissatisfactions with staircases, corridors, and
garbage disposal found in this study were tended to support M. A. Mohit & Azim’s
(2012) findings about the residents living at public housing estates in Hulhumalé feeling
dissatisfied with cleaning services for corridors and staircases and garbage collection.
The property management companies would strongly suggest all of residents not to
play at the corridors especially their children to reduce their noises that disturbed some
neighbours’ lunch breaks. In addition, the spot of garbage collection which was
normally located in front of each block was believed to be quite near to the corridor and
the first and second floors of some units. Thus, it brought along some bad smell to the
corridor and some units especially during summer due to most garbage cans were not
covered and were not cleaned thoroughly and those extra rubbishes were thrown out of
garbage cans. Moreover, one garbage can was put at Phase 3’s children’s playground to
make the whole place smelly and make the children find other places for fun.
In spite of timely collection of rubbish from garbage collection spots, the property
management companies should make a covered garbage house (regarding all of garbage
collection spots not being covered and even most garbage cans not being covered and
not cleaned thoroughly and those extra rubbishes being thrown out of garbage cans) on
the side of each block (not in front of each block) to prevent the bad smell coming into
the corridor and some units.
7.3.4 Good Structure Design for Housing Unit
7.3.4.1 Living Room, Dining Area, Bedroom, Toilet, and Drying Area
The satisfaction with living room moderately contributed to predicting Phase 3’s
residential satisfaction. Moreover, the satisfaction with dining area had the most impact
on Phase 1’s residential satisfaction (P.446-459 showed the factor of dining area having
a significantly positive correlation with Phase 1’s residential satisfaction with r =

289
.374***
). This result was tended to support Mohit et al.’s (2010) findings about the high
beta coefficient of the model highlighting the necessity of exploring residential
satisfaction in dining space. However, this result was contrary to M. A. Mohit & Azim’s
(2012) findings about the moderate beta coefficient of the model highlighting the
necessity of exploring residential satisfaction in dining space.
With regard to the residents of Phase 1 and 2 being simultaneously very concerned
about the improvements of satisfactions with bedroom (P.446-459 showed the factor of
bedroom having significantly positive correlations with Phase 1 and 2’s residential
satisfactions with r = .527***
, r = .180*, respectively), these findings were tended to
support Paris & Kangari’s (2005) results examined from a group of 5,170 rented
multifamily units from 1997 to 2005 revealing that renters’ satisfaction improvements
were correlated with bedrooms. Furthermore, these findings were also inclined to
support Mohit et al.’s and M. A. Mohit & M. Azim’s (2010) and (2012) conclusions
about the high and moderate beta coefficients of the models highlighting the necessities
of exploring residential satisfactions in specific housing units characteristics including
bedroom-1 and bedroom-3. What’s more, these findings also support E. O. Ibem &
Amole’s (2013a) results about providing more numbers of bedrooms in the housing
units so as to improve residential satisfaction in the OGD Workers’ housing estate in
Abeokuta, Ogun State, Nigeria.
In spite of the factor of toilet being none of any predictors in three phases, it was a
critical factor to determine three phases’ residential satisfactions. This finding was
tended to support Zanuzdana et al.’s (2013) conclusions about satisfaction with toilet
contributing to predicting residential satisfaction of urban slums and rural areas in
Dhaka, Bangladesh.

290
Regarding satisfaction with drying area contributing the most to predicting Phase 2’s
residential satisfaction to support Mohit et al.’s and M. A. Mohit & M. Azim’s (2010)
and (2012) findings about the factor of dry area, the four interviewees from the 1st and
3rd
phases believed that the drying area had an appropriate size with good ventilation
and with a good lighting. At same time, Table 5.2 also gave a similar answer saying
54.7% of respondents from Phase 2 having a moderate level of satisfaction with drying
area followed by 47.7% in Phase 1 and 43.8% in Phase 3. These findings were tended to
support M. A. Mohit & Azim’s (2012) conclusions about residents living at public
housing estates in Hulhumalé being slightly satisfied with size and condition of washing
and drying area.
In regard to 36.9% of respondents from Phase 2 having low and very low levels of
satisfactions with living room followed by 30.1% in Phase 3 and 26.8% in Phase 1 and
47.4% of respondents from Phase 2 having low and very low levels of satisfactions with
dining area followed by 27.9% in Phase 1 and 27.6% in Phase 3 (Table 5.2 displayed),
these results were tended to support Kaitilla’s (1993) findings about urban households
living at public housing in West Taraka which was one of the low-income housing
suburbs in the city of Lae, Papua New Guineans being severely dissatisfied with their
living/dining areas.
In terms of dissatisfaction with living room, all six participants preferred the size of
living room over the location. Regarding the dining area, the four participants from the
2nd
and 3rd
phases thought that the size of their dining areas were small. On the basis of
26.3% of respondents from Phase 3 having low and very low levels of satisfactions with
bedroom followed by 25.2% in Phase 2 and 24.4% in Phase 1 (Table 5.2 displayed), the
five participants thought that their bedroom size was slightly smaller than their master
bedroom. With respect to the results of 64.2% of respondents from Phase 2 having low

291
and very low levels of satisfactions with toilet followed by 38.8% in Phase 3 and 34.9%
in Phase 1 (Table 5.2 displayed) being similar with Kaitilla’s and M. A. Mohit &
Azim’s (1993) and (2012) findings about urban households living at public housing in
West Taraka in the city of Lae, Papua New Guineans and residents living at public
housing estates in Hulhumalé being severely dissatisfied with toilet, three participants
amongst five from the 1st and 2
nd phases complained about their toilets had a very small
size.
Regarding the size of housing unit, these above results found in this study supported
Galster’s (1985) findings about interior condition and room size being given the high
priority to improving households’ residential satisfaction. These were also tended to
support Fang’s (2006) finding about the size of housing unit being also found to be
significantly correlated with residential satisfaction in Beijing. Moreover, these were in
line with Eziyi Offia Ibem et al.’s, E. O. Ibem & Amole’s, and E. O. Ibem & Amole’s
(2013), (2013b), and (2014) findings about the increasing of subjective life satisfaction
in 10 newly-constructed public houses in Ogun state and the improving of performance
of the buildings in meeting residents’ needs and expectations in nine previously-built
public housing also in Ogun state, Nigeria depending more on the enlarging the size of
main activity areas in housing unit characteristics.
With respect to those dissatisfactions with the size of living room, dining area,
bedroom, and toilet, these were generally confirmed with Kaitilla’s (1993) findings
about urban households living at public housing in West Taraka in the city of Lae,
Papua New Guineans feeling severely dissatisfied with sizes of houses. In particular,
these results supported M. A. Mohit et al.’s, M. A. Mohit & Nazyddah’s, M. A. Mohit
& Azim’s, and E. O. Ibem & Aduwo’s (2010), (2011), (2012), and (2013) findings
about satisfaction with size of living room in the residences as a predictor variable

292
contributing most to predicting residential satisfaction of public housing. Moreover, it
was also tended to support Eziyi Offia Ibem et al.’s (2013) findings about satisfactions
with size of living room and sleeping area being significantly correlated with the level
of satisfaction of residents living at nine previously-built public housing estates in Ogun
State, Nigeria.
With respect to three participants from Phase 1 and 2 thinking of the locations of
their living rooms being not proper, Interviewee 2 thought that the living room should
be separated from the dining area (P.446-459 presented the factor of living room having
a significantly positive correlation with Phase 1’s dining area with r = .664***
).
Moreover, Interviewee 3 from Phase 2 thought that the living room should be separated
from the kitchen. Similarly, the five participants from three phases thought that the
locations of their dining areas were also not proper, for instance, Interviewee 3 also
suggested that the dining area should be separated from the kitchen (P.446-459 showed
the factor of dining area having a significantly positive correlation with Phase 2’s
kitchen with r = .221*). Furthermore, Interviewee 5 from 3
rd phase complained about his
dining area being badly very closer to the toilet. With the exception of the 3rd
phase, the
four interviewees considered that their bedroom had a bad location. The three
participants from the 2nd
and 3rd
phases amongst four complained about the locations of
toilets. These findings were inclined with Onibokun’s (1974) conclusion about the
location of the different rooms contributing most to predicting residential satisfaction of
public housing projects in certain areas of Canada. Simultaneously, the results of
dissatisfactions with living room, dining area, bedroom, and toilet’s locations explained
Kaitilla’s and Tian & Cui’s (1993) and (2009) findings about urban households living at
public housing in West Taraka, the city of Lae, Papua New Guineans and living at a
public housing in Harbin, north-eastern China both being severely dissatisfied with their
houses’ poorly layout.
293
In addition, the four interviewees from three phases thought that their living rooms
and dining areas did not have good ventilations. At the same time, the five interviewees
thought that their bedroom was not well ventilated particularly Interviewee 4 gave a
specific detail regarding his bedroom with a western exposure was cold in winter and
hot in summer and his furniture in bedroom went mouldy. The four participants said
that there was no ventilation in their toilets as well. These results were tended to support
Turkoglu’s (1997) finding about housing ventilation affecting the level of residential
satisfaction of planned and squatter environments in Istanbul. Furthermore, these results
also supported Tian & Cui’s (2009) findings about urban households living at a public
housing in Harbin, north-eastern China being not satisfied with their houses’ heat
ventilation.
Furthermore, the three interviewees from Phase 2 and 3 complained about their
living rooms and dining areas having bad lightings. In the meanwhile, the four
interviewees from the 1st and 2
nd phases had the same problem of lighting in bedroom.
The four participants said that there had a bad lighting in their toilets as well. These
results supported Tian & Cui’s (2009) findings about urban households living at a
public housing in Harbin, north-eastern China being not satisfied with their houses’
lighting.
On the basis of Mohit et al.’s, Mohit and Nazyddah’s, and M. A. Mohit & M. Azim’s
(2010), (2011), and (2012) findings regarding the high and moderate beta coefficients of
the models highlighting the necessities of exploring residential satisfactions in specific
housing units characteristics particularly socket points, the four participants from three
phases thought the numbers of power sockets in their living rooms were just enough for
using and at the same time the numbers of power sockets in their dining areas were
fewer. Similarly, the half interviewees found that the power sockets in bedroom were

294
very few. They also complained about the fewer power sockets especially Interviewee 4
said the 1st floor house had the worst toilet. On the contrary, the two interviewees from
the 3rd
phase complained about no power socket in their drying areas. These results
were tended to support M. A. Mohit & Azim’s (2012) findings about residents living at
public housing estates in Hulhumalé being dissatisfied with number of electrical
sockets.
Therefore, Wong & Siu’s (2002) findings regarding Guangzhou’s and Beijing’s
studies explained the reasons why those above results regarding lower satisfaction level
of housing unit characteristics found in this current study brought by Chinese money
and carelessness-motivated private developers, who were almost same as Malaysian
private developers, did badly in the insufficient lighting, and ventilation of housing
units.
Accordingly, E. O. Ibem & Amole’s (2013a) conclusions about to improve
residential satisfaction in the OGD Workers’ housing estate in Abeokuta, Ogun State,
Nigeria by way of providing good housing structure design in the housing units strongly
suggested Xuzhou’s local government to pay very attention to the housing design and
layout in terms of the sizes, locations, ventilation, and lighting of rooms. In addition, the
local residents required their property management companies to add some more useful
devices such as electrical sockets to improve the conveniences in their daily life.
7.3.5 More Commoditized LCH
With respect to the factor of floor level being significant to the residents of Phase 1
and 3 at the same time, this finding supported M. A. Mohit et al.’s (2010) conclusion
about there being a positive correlation of overall residential satisfaction with
respondents’ floor level.

295
In terms of the residents of Phase 1 who lived on the 5th
floor were more satisfied
than those who lived on the 2nd
floor, the four participants had the same opinion, i.e. all
floors were almost same except for people’s lower residential satisfactions in living on
the top and the first floors because the top floor was very cold during winter and was
very hot during summer and the lower floor was affected by the smelling of garbage and
crowd noise explained by Interviewee 2 from Phase 1 (P.446-459 showed the factor of
1st floor having a significantly negative correlation with Phase 1’s open space with r = -
.272**
).
In terms of the residents of Phase 3 who lived on the 3rd
floor were more satisfied,
Interviewee 5 from Phase 3 explained that residents living on the middle floors were
more satisfied, such as 3rd
floor and 4th
floor and Interviewee 6 agreed and preferred to
choose 3rd
floor because the 3rd
floor was not high and stayed away from disgusting
smell of garbage and very few numbers of mosquitoes and flies were around.
On the contrary, Interviewee 1 from Phase 1 explained that the higher floor level was
far away from the noise and also was clean. At the same time, Interviewee 3 from Phase
2 held a different opinion such as all floors were almost same.
The predictor of occupation type (Others vs. Management & Professional) negatively
determining the Phase 1’s inhabitants’ residential satisfaction explained that the small
group of residents of Phase 1 whose occupation type with management & professional
turned to be less satisfied than those whose occupation type with others such as some
jobs paid by daily-settlement (no fixed contract), retired, and laid-off/unemployed. This
finding was tended to support Dekker et al.’s, E. O. Ibem & Amole’s (2011), (2013a)
and (2013b), and (2014) conclusions about respondents’ employment being found to be
a predictor contributing to foretelling the residential satisfaction in the OGD workers’
housing estate in Abeokuta and subjective life satisfaction in public houses. However,

296
this finding was tended to be contrary to M. A. Mohit et al.’s (2010) conclusion about
there being a positive correlation of residential satisfaction with respondents’
employment type.
On the basis of Zanuzdana et al.’s and E. O. Ibem & Amole’s (2013) and (2013b)
findings about the factor of income being found to be a predictor to contribute most to
predicting residents’ satisfaction with life in Ogun State 10 newly-built public housing
estates in specific individual and household characteristics and satisfaction with housing
in population of urban slums and rural areas in Dhaka, Bangladesh and Posthumus,
Bolt, & van Kempen’s (2014) findings about the factor of income having a negatively
significant correlation with residential satisfaction, the reason why there were three
interviewees from Yangguang and Binhe Huayuan sharing the same view of “the higher
position of occupation with the lower satisfaction” (Table 5.3 presented the factor of
income having negative correlations with three phases’ residential satisfactions) was
that the income level of residents with occupation type of management & professional
made them ask for more from the existing low-cost housing comparing to the income
level of residents with occupation type of others. However, these findings were tended
to be contrary to M. A. Mohit et al.’s (2010) conclusions about the variable of income
having a nonsignificant correlation with the overall housing satisfaction. Nevertheless,
M. A. Mohit et al.’s (2010) conclusions were similar with the current findings regarding
three interviewees from Phase 2 and 3 having a same view of “almost same” which
meant that some certain numbers of local habitants’ levels of residential satisfactions
had nothing relationship with the factors of occupation type and income.
However, the main characteristics of low-cost housing which were far different from
commodity housing’s were to fulfil the very basic needs of medium-low and low
income group of residents. Nevertheless, in fact, those low-cost housing residents

297
considered their houses as commodity housing because they expected to sell their
properties for buying another real commodity houses after being allowed to purchase
their rest of home ownerships.
In this vein, the housing ownership was mostly concerned by local low-cost housing
residents because on one hand they would have a full homeownership of housing, on the
other hand, they would have a legal right to deal with their low-cost housing such as to
rent or to deposit or to sale.
The fact of the matter was that the factor of housing ownership should be a
determinant which on some level must have contributed to predicting three phases’
residential satisfactions. However, technically speaking, it was meaningless to put this
independent variable of homeownership into the SPSS calculation because the answer
given by local residents would be the same as “no completed homeownership yet”,
instead, it would increase its collinearity to damage the result.
Regarding this, Chinese low-cost housing had its special characteristics with “partial
homeownership” which was totally different from some countries, such as Gur and
Dostoglu (2011); (Paris, 2006; Paris & Kangari, 2005; Y. P. Wang & Murie, 2011)
literally described their affordable housing as a commodity housing which provided full
ownerships to medium and medium-low income groups of customers.
Therefore, the result of homeownership as a predictor was tended to support Rent &
Rent’s, Lane & Kinsey’s, and Grinstein-Weiss et al.’s (1978), (1980) and (2011)
findings about promoting homeownership amongst low- and moderate-income
households to improve their levels of residential satisfaction in low-income housing
estates.

298
Moreover, this result also supported McCrea et al.’s and Vera-Toscano & Ateca-
Amestoy’s (2005) and (2008) findings about satisfaction with home ownership as an
essential predictor variable contributed most to predicting satisfaction of housing in the
Brisbane-South East Queensland region and inhabitants’ residential satisfaction in those
areas mixed with commodity and public houses.
Furthermore, this result also supported E. O. Ibem & Amole’s (2013b) and (2014)
findings about the high beta coefficient of the model highlighting the essential of
exploring the subjective life satisfaction of residents of public housing in Ogun State
urban areas in Nigeria in specific individual and household characteristics such as
respondents’ tenure status.
In spite of the whole current low-cost housing projects in Xuzhou being not allowed
the residents to buy the rest of homeownerships, the four participants amongst three
phases took this issue very seriously because most residents like them wanted to
purchase the next commodity housing using the current house ownership.
Thus, the higher satisfaction with homeownership was presumed to bring along their
higher levels of residential satisfaction in Xuzhou’s three phases of low-cost housing
and they were obviously dissatisfied with the current status of their housing tenure.
These findings were inclined to support M. A. Mohit & Azim’s (2012) conclusions
about the type of tenure having a significantly positive correlation with residential
satisfaction in public housing estates in Hulhumalé. These findings were proved to be
mostly similar with Hu’s and Zanuzdana et al.’s (2013) and (2013) conclusions about
the homeownership status in urban China and in rural Dhaka, Bangladesh having
greatly positive correlations with both resident’s housing satisfaction and overall
happiness. These current findings also found out a same result with Hu’s (2013)

299
conclusions about the existing residents at low-cost housing in urban China paying very
close attention to when and how they could buy their full homeownership.
On the contrary, some local residents did not consider the issue of low-cost housing’s
homeownership as a top problem comparing to other problems which they were
currently facing with, such as Interviewee 3 from Phase 2 showing a different view, i.e.
the homeownership was important, but not so important and Interviewee 6 from Phase 3
did not care so much about it comparing to other satisfactions of neighbourhood
characteristics, housing estate supporting facilities, housing unit supporting services,
and housing unit characteristics.
Thus, despite having a partial homeownership or a full homeownership after 5 or 10
years’ purchasing, their current or future concerns were more about that the low-cost
housing should be physically constructed or improved as the procedure of commodity
housing’s construction in order to satisfy those local medium-low income households
because some certain numbers of them would not have capabilities of buying their next
commodity houses in the near future. They had to rely more on their current residential
environment rather than thinking of moving out.
Therefore, these findings were tended to support Chen et al.’s (2013) conclusions
about a higher proportion of low-income group in Dalian, China not only being less
satisfied with their lower rate of homeownership, but they also being less satisfied with
their residential environments in terms of less liveable neighbourhoods and smaller
housing spaces.
In addition, another two more issues to which should be paid more attention by local
authority talked about residential disparities between lower and relatively higher income
groups either within the same low-cost housing area mixed by low-cost housing and

300
resettlement housing or within the same community mixed by low-cost (medium-low
income) housing and commodity housing, for instance, except for Phase 2 being alone,
Phase 1 and 3 were mixed residences, such as Interviewee 2 complained that the social
exclusion existed in Phase 1 between residents with comparatively higher position at
company and residents with lower position of occupation (P.446-459 presented that
residents with monthly income of RMB 4,000-5,999 in Phase 1 and 2 had lower
satisfactions with community relationship, local crime situation, and local accident
situation than residents with monthly income of RMB 2,000-3,999 in Phase 1 and 2
having with r = - .217*, r = - .271
**, and r = - .256
**, respectively).
Furthermore, Interviewee 6 complained that the residents from Phase 3 went to the
opposite condominium to use their two outdoor swimming pools and finally received
their rejections due to some of low-cost housing residents’ previously bad manners in
terms of not wearing swimsuits while swimming and their children making a lot of
noises.
Accordingly, although some of low-cost housing residents had good manners, the
social exclusion still existed and caused some problems especially in this mixed
residences due to the bad image of their previously bad manners being embedded in
commodity residents’ mind. This result supported George C. Galster & Hesser’s,
HaSeongKyu’s, and Adriaanse’s (1981), (2006), and (2007) findings about those
respondents’ satisfaction ratings being more strongly tied to the similarity of neighbours
so that social exclusion existed amongst these sorts of high-low income mixed-groups
and residents who lived at public rental housing estates which were surrounded by non-
public housing in Korea.

301
Hence, the level of social exclusion would determine those Xuzhou’s low-cost
housing inhabitants’ levels of residential satisfactions. This finding was tended to
support HaSeongKyu’s and Nam & Choi’s (2006) and (2007) conclusions about the
reduction of feeling of residential exclusion and experience of discrimination as two
predictor variables being significantly correlated with residential satisfaction of
inhabitants at public housing and adjacent to non-public housing.
Consequently, on the basis of what a lot of authors understood, the facet of
residential disparities between residents living at commodity housing and low-cost
housing, e.g. , Phase 1 and 3 were mixed residences must have caused the problem of
social exclusion. Then, S. M. Li, Zhu, and Li (2012) took a Chinese example to
elaborate. In the context of neighbourhood and housing types characterised by
distinctive built-environment features and socio-occupational mixes, the inhabitants
living at commodity housing estates in Guangzhou, China showed their higher level of
satisfaction with community attachment and neighbourhood satisfaction under the
effects from gating bringing about very minimal influences on community attachment.
Thus, the residents of commodity housing surrounded by public housing were less
likely to feel satisfied with their commodity houses, specifically, what it amounted to,
then, was that the intensity of social interaction did not bring about higher level of
individual housing satisfaction amongst residents who lived in the mixed residential
environment.
Nevertheless, Xuzhou’s local government learnt some lessons in which building the
mixed residences in terms of low-cost and commodity housing could let local low-cost
housing residents enjoy commodity housing’s better neighbourhood facilities, e.g.
public transportation. Except for Phase 2 being alone and its only one shuttle bus line
with around 30 minutes of each shuttle and the operating hours only from 6am to 6pm,
302
Phase 1 and Phase 3’s satisfaction levels of nearest bus/taxi station were higher than
Phase 2’s (Table 5.2 showed 36.3% of respondents from Phase 3 had high level of
satisfaction, followed by 32.6% in Phase 1 and only 8.4% in Phase 2) in terms of Phase
1 and 3’s locations at the mixed residences area with commodity housing areas.
On the basis of the factor of main means of transportation contributing moderately to
predicting Phase 2 and Phase 3’s residents’ housing satisfactions (Table 5.3 displayed
the factor of main means of transportation having a positive correlation with phase 3’s
residential satisfaction with r = .362**
), local residents’ main means of transportation
was not only affected by neighbourhood facilities such as nearest bus/taxi station, it also
was affected by the development of design of low-cost housing estate supporting
facilities. These findings were unique comparing to other articles reviewed in this study
from 1980s to 2016 in which this factor of residents’ main means of transportation
treated as a very concerned by Xuzhou’s low-cost housing residents was first time put
into residential satisfaction’s mathematical modelling.
Then, with respect to P.446-459 presented that residents (Phase 2)’ main means of
transportation by foot was positively correlated with Phase 2’s residential satisfaction (r
= .224*) and residents (Phase 3)’ main means of transportation by cycling was
negatively correlated with Phase 3’s residential satisfaction (r = - .384***
), above age 60
of residents in Phase 2 went outside, for example, for buying some commodities and
food preferring to walking there because there was only one shuttle bus line passed by
and they did not have other choices, but, at very least, there was a quite big food market
nearby which was not a formal market (P.446-459 presented that the factors of above
age 60 and local market had positive correlations with residents (Phase 2)’ main means
of transportation by foot with r = .425***
and r = .241**
, respectively). Furthermore,

303
residents from Phase 3 who rode bicycles to go outside were not satisfied due to the
location of Phase 3 being a bit far away from Xuzhou’s downtown.
At this point, the mixed residences indeed enhanced the whole average of living
standard of low-cost housing especially in housing estate supporting facilities and also
improved local low-cost housing residents’ confidences with having commodity
housing’s residents as neighbours, for instance, Phase 3’s basic parking facilities got
much improved by Xuzhou’s local authority compared to Phase 1 and 2 according to the
increased average standard which was evaluated together with surrounded commodity
housing.
However, there still had some shortages of living in mixed-residential areas, for
instance, due to the features of built environment were different between low-cost and
commodity housing, two participants form Phase 3 complained about the number of
shuttle bus was very few as most of commodity housing residents went outside by
driving instead of by public transportations and they did not rely too much on public
transportations comparing to low-cost housing residents.
Therefore, the residential disparities happened in Xuzhou’s low-cost housing and
commodity housing mixed residences caused a lot of dissatisfactions not only felt by
commodity housing residents, but also felt by low-cost housing residents in terms of
social exclusion and relatively lower expectations for future low-cost housing
purchasing based on the current situations of low-cost housing. These findings were
tended to support Chen et al.’s (2013) conclusions about the significant income-based
disparities and inequalities in residential environments existing in Dalian where the low-
cost housing residents having lower level of satisfactions with their residential
environments in terms of less liveable neighbourhoods and smaller housing spaces
compared to commodity housing residents.

304
Accordingly, to enhance housing estate supporting facilities of Xuzhou’s low-cost
housing especially the recreational facilities e.g. to build swimming pools mentioned
during the survey was a response to local low-cost housing residents’ requests which
were asked to improve the whole quality of low-cost housing in accordance with the
building standard of commodity housing. In addition, to enrich the types of Xuzhou’s
low-income housing in terms of different needs of different housing would increase not
only low-cost housing inhabitants’ residential satisfaction, but also increase low-income
housing’s residential satisfaction. These conclusions were inclined to support Chen et
al.’s (2013) findings about that sufficient provisions of low-income and low-rent
housing together with strict implementation of income criteria to be qualified for
applying subsidised housing would be helpful to reduce residential disparities between
low-income and high-income groups under the housing market mechanism to provide
their much needed housing supply and choices which would likely increase their
residential satisfactions.
In a few words, to improve the whole residential environment of Xuzhou’s current
low-cost housing in line with their requirements particularly more towards commodity
housing would not only reduce some certain degrees of residential disparities in the
mixed residences, but would also increase low-cost housing residents’ confidences with
this type of mixed living environment.

305
7.4 Summary of Discussion
In a word, this chapter of discussion found out the similarities and differences
between the results came out of this current work and the results came out of those
previous research works. Through deep discussions based upon the level of their
concerns, it found that the residents’ current living environment was needed to improve
by way of cooperation amongst their own, property companies, and the local
government.

306
CONCLUSION AND RECOMMENDATIONS CHAPTER 8:
8.1 Introduction
In the final chapter, it would firstly conclude what this research work found to
achieve the objectives of the quantitative and qualitative researches. Then, it would
elaborate how those research findings implicated the individuals and local government
such as the low-cost housing residents, NGO, NPC (National People’s Congress)
deputies at all levels, property company and local government, municipal state-owned
construction company (MSOCC), design company and construction enterprise, and
supervision company. On the basis of the findings, the public participation in the low-
cost housing development was found to be a severe recommendation which would be
explained in detail. After that, the limitations of this research work would be described
in terms of the research methodology and lack of studies about China’s low-cost
housing satisfaction. Finally, it would talk about the further study which continued with
the recommendation and would narrow down this research work’s limitations.
8.2 Summary of Findings
It would conclude the above findings which had already answered to those research
questions and achieved those research objectives as well.
8.2.1 Validated Model and Factors Found in Developed and Developing
Countries
With reference to the results given by SPSS and explained in p.377-445, the
conceptual model mentioned in Chapter 2 has already been tested and validated by
Adjusted R2.
The adjusted R2 value (.779/.731) of the 1
st model indicated that 77.9/73.1% of the
variance in residential satisfaction index had been explained by the model. The
tolerance values of the coefficients of predictor variables are well over 0.22/0.26

307
(1 − adjusted 𝑹2 ) and this indicated the absence of multicollinearity between the
predictor variables of the model.
Moreover, the adjusted R2 value (.715/.671) of the 2
nd model indicated that
71.5/67.1% of the variance in residential satisfaction index had been explained by the
model. The tolerance values of the coefficients of predictor variables are well over
0.28/0.32 (1 − adjusted 𝑹2 ) and this indicated the absence of multicollinearity
between the predictor variables of the model.
Furthermore, the adjusted R2 value (.774/.726) of the model indicated that
77.4/72.6% of the variance in residential satisfaction index had been explained by the
model. The tolerance values of the coefficients of predictor variables are well over
0.22/0.27 (1 − adjusted 𝑅2 ) and this indicated the absence of multicollinearity
between the predictor variables of the model.
In addition, those factors/predictors determining residential satisfaction which had
been reviewed from the studies about residential satisfactions of public and commodity
housing in developed and developing countries were found and concluded according to
the components/elements.
Housing Unit Characteristics (HUC) (a)
In HUC, there were seven key factors that should be more concerned such as living
room, dining area, master bedroom, bedroom, kitchen, toilet, and balcony. Those factors
which were mentioned above had several interior characteristics affecting their
satisfaction levels in terms of size, location, ceiling height, ventilation, daylighting, and
power sockets.

308
Housing Unit Supporting Services (HUSS) (b)
With respect to HUSS, the literature strongly suggested these two factors consisting
of drain and electrical & telecommunication wiring which talking about the supporting
services provided within the housing unit. The situations of drain and wiring of when
moving into the room and the maintenance after moving into affected each factor’s
satisfaction level.
Furthermore, in terms of the supporting services provided around the housing unit,
the numbers of firefighting equipment and training course for how to use firefighting
equipment decided upon the satisfaction level of firefighting equipment. Moreover, the
numbers and brightness determined the satisfaction level of street lighting. The size,
location, lighting, and cleanness decided on the satisfaction levels of staircases and
corridor. In addition, the garbage collection and management of garbage (house)
determined the satisfaction level of garbage disposal.
Housing Estate Supporting Facilities (HESF) (c)
Regarding HESF, the factors were concluded from the studies about residential
satisfactions of public and commodity housing in developed and developing countries
such as open space, children’s playground, parking facilities, perimeter road, pedestrian
walkways, and local shops. Their satisfactions were affected by each number, condition,
location, and cleanness.
Neighbourhood Characteristics (NC) (d)
Speaking of NC divided by social environment and spatial location characteristics of
neighbourhood, the residents’ involvement and social exclusion decided upon the
satisfaction level of community relationship. Furthermore, the levels of neighbourhood
noise and crowd noise from open space determined the satisfaction level of quietness of
housing estate. The frequency of occurrence, and seriousness decided on the satisfaction

309
level of local crime and accident situations. In addition, the number of security guards
and frequency of security patrols determined the satisfaction of local security control.
In terms of the spatial location characteristics of neighbourhood, the factors which
were discussed previously consisted of resident’s workplace, nearest general hospital,
local police station, nearest fire station, and urban centre. Their satisfaction levels were
determined by the distance from each housing area to each outside destination and
convenience of arriving over the destination.
Individual and Household’s Socio-Economic Characteristics (e)
There were ten factors correlated with the four residential components (HUC, HUSS,
HESF, and NC) and overall residential satisfaction of each housing area such as gender,
age, educational attainment, marital status, household size, occupation sector and type,
household’s monthly net income, floor level, and length of residence.
8.2.2 Levels of Satisfaction/Dissatisfaction between the Three Phases
With regard to the overall residential satisfaction, the respondents of Phase 1 whose
average residential satisfaction was 64.397% was perceived as the moderate level of
satisfaction due to the proportion of respondents with moderate level of satisfaction was
large (87.2%). In the meanwhile, the respondents of Phase 3 whose average residential
satisfaction was 62.845% was also perceived as the moderate level of satisfaction due to
the proportion of respondents with moderate level of satisfaction was quite big (77.5%).
However, the respondents of Phase 2 were dissatisfied [56.947% which was perceived
as the low level of satisfaction due to the proportion of respondents with low level of
satisfaction was large (87.4%)] with their overall residential environment.

310
The respondents of the three phases shared some similarities in evaluating the
satisfaction of housing unit characteristics (HUC) in their corresponding projects with
the highest average satisfaction among the four elements (69.257%, 61.519%, and
66.792%, respectively).
In terms of 65.233%, 58.008%, and 62.259% which presented the satisfaction levels
of housing unit supporting services (HUSS) in respective project, it showed the
moderate level of satisfaction in Phase 1 and 3, but the low level of satisfaction in Phase
2.
With respect to 62.841% and 55.564% of satisfaction levels in neighbourhood
characteristics (NC) and followed by 62.137% and 54.441% which indicated the lowest
average satisfaction of housing estate supporting facilities (HESF) in Phase 1 and 2, it
showed the moderate level of satisfaction of NC and HESF in Phase 1, but the low level
of satisfaction in Phase 2.
Regarding Phase 3, although the lowest average satisfaction (61.723%) was given to
NC, whereas, when they evaluated HESF, the satisfaction index (61.867%) was a little
bit better than NC satisfaction index (61.723%), the moderate level of satisfactions of
HESF and NC was shown.
8.2.3 Determinants between the Three Phases
The residents of three phases simultaneously raised one fact that to improve
satisfactions with corridor and local shops could enhance residential satisfactions over
there together with other determinants.

311
Furthermore, the residents of Phase 1 and 2 were simultaneously very concerned
about the improvements of satisfactions with bedroom and the nearest schools.
Meanwhile, the residents of Phase 1 and 3 were much concerned about the
enhancements of satisfactions with open space and the floor level.
Xuzhou’s local authority should pay very attention to enhancing residents’
satisfactions with local kindergarten and children’s playground that were the common
determinants to improving residential satisfactions of Phase 2 and 3. Additionally, the
main means of transportation was one of key predictors also to significantly determine
the residential satisfactions of Phase 2 and 3.
In regard to the rest of determinants of three phases of low-cost housing, the
satisfactions with the dining room, drain, resident’s workplace, and community clinic
had the most impact on residential satisfaction of Phase 1, and the satisfactions with the
nearest general hospital and Yangguang Huayuan’s parking facilities, and the floor level
had the moderately impact, whereas the satisfaction with the garbage disposal had less
impact on Phase 1’s residential satisfaction. Moreover, the predictor of occupation type
was significant to Yangguang Huayuan’s residential satisfaction.
The satisfactions with the local crime situation, staircases, drying area, nearest
bus/taxi station, and local accident situation contributed the most to predicting Phase 2’s
residential satisfaction, and the main means of transportation contributed moderately to
predicting the residential satisfaction.
Finally, the satisfactions with the electrical & telecommunication wiring, corridor,
quietness of housing estate, Binhe Huayuan’s children’s playground and Binhe
Huayuan’s open space had the most impact and the satisfactions with the police station,
nearest fire station, local kindergarten, local shops, living room, community
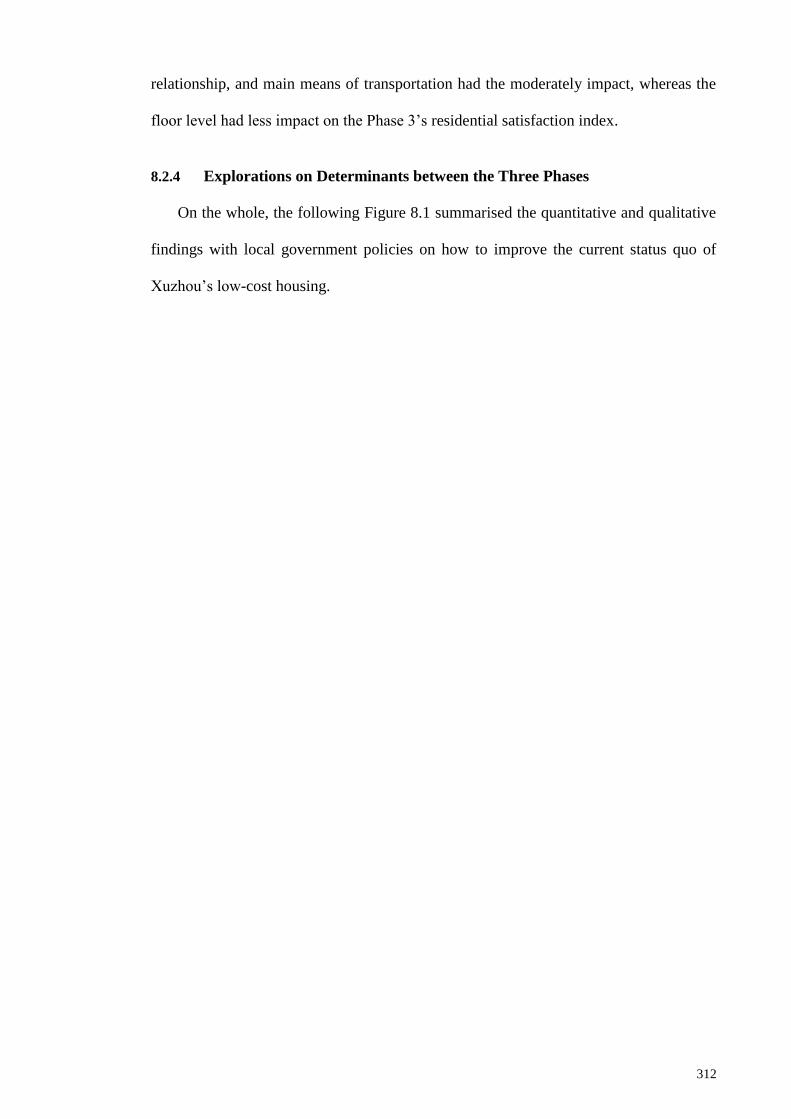
312
relationship, and main means of transportation had the moderately impact, whereas the
floor level had less impact on the Phase 3’s residential satisfaction index.
8.2.4 Explorations on Determinants between the Three Phases
On the whole, the following Figure 8.1 summarised the quantitative and qualitative
findings with local government policies on how to improve the current status quo of
Xuzhou’s low-cost housing.
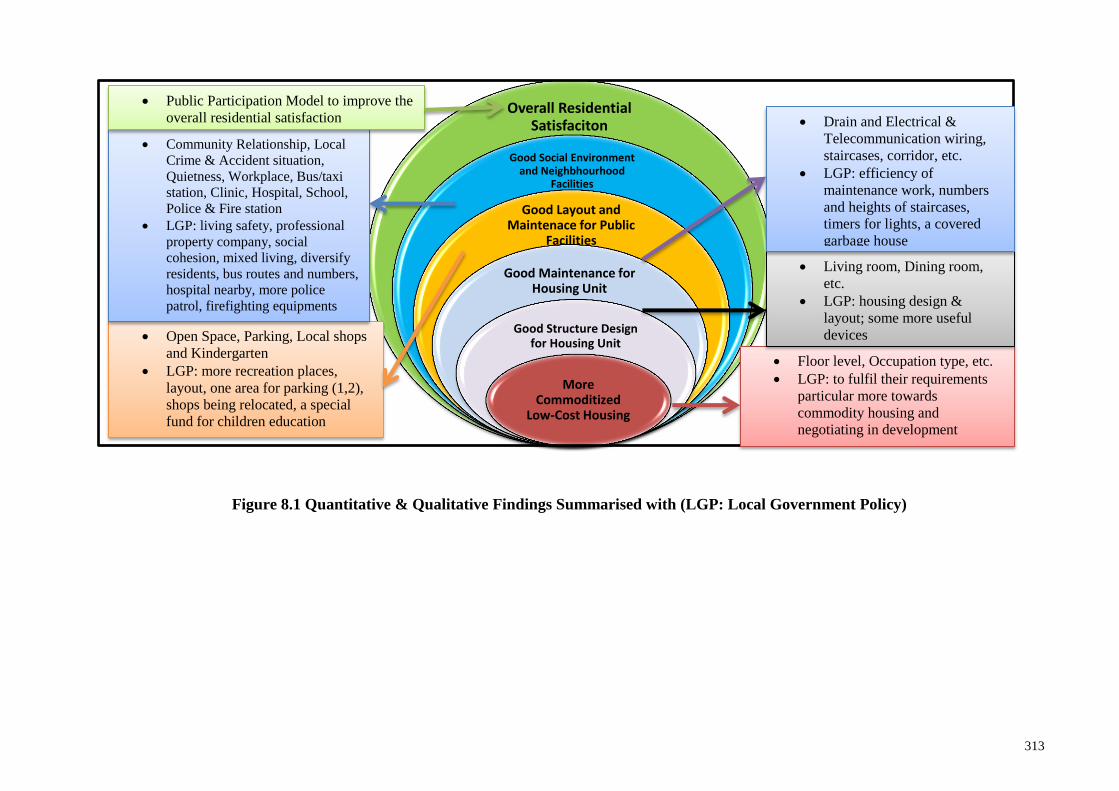
313
Figure 8.1 Quantitative & Qualitative Findings Summarised with (LGP: Local Government Policy)
Overall Residential Satisfaciton
Good Social Environment and Neighbhourhood
Facilities
Good Layout and Maintenace for Public
Facilities
Good Maintenance for Housing Unit
Good Structure Design for Housing Unit
More Commoditized
Low-Cost Housing
Floor level, Occupation type, etc.
LGP: to fulfil their requirements
particular more towards
commodity housing and
negotiating in development
process
Living room, Dining room,
etc.
LGP: housing design &
layout; some more useful
devices
Drain and Electrical &
Telecommunication wiring,
staircases, corridor, etc.
LGP: efficiency of
maintenance work, numbers
and heights of staircases,
timers for lights, a covered
garbage house
Open Space, Parking, Local shops
and Kindergarten
LGP: more recreation places,
layout, one area for parking (1,2),
shops being relocated, a special
fund for children education
Community Relationship, Local
Crime & Accident situation,
Quietness, Workplace, Bus/taxi
station, Clinic, Hospital, School,
Police & Fire station
LGP: living safety, professional
property company, social
cohesion, mixed living, diversify
residents, bus routes and numbers,
hospital nearby, more police
patrol, firefighting equipments
Public Participation Model to improve the
overall residential satisfaction

314
With respect to those five concluded themes which consisting of some improved
conditions and unsolved problems from Phase 1 to Phase 3, the most concerned element
which related to neighbourhood characteristics satisfactions mainly described the low-
cost housing residents’ aspirations of good social environment and neighbourhood
facilities (see Figure 8.1).
Amongst those eleven sub-themes, the sub-themes of community relationship,
resident’s workplace, nearest school, and nearest bus/taxi station had been improved in
a sort of way amongst the comparisons of three phases of local low-cost housing
projects.
With respect to the sub-themes of resident’s workplace and nearest bus/taxi station,
the degree of convenience of going to work (most of them nearly every day took public
transports) was more important than the location of low-cost housing. Accordingly, the
convenience of going to work of the 3rd
phase had been much improved compared to the
previous two phases especially the 2nd
phase which not only had a problem with its
distance between the residential location and down town, but also only had one shuttle
bus with around 30 minutes of each shuttle and the operating hours only from 6am to
6pm.
Referring to the sub-theme of nearest school, except for the distance between Phase 2
and its nearest school was long and it was not convenient due to bad transport facilities,
the rest two phases gave moderate and high level of satisfactions with the nearest
schools.
However, the Xuzhou’s local government had not been doing so well in getting the
mixed communities involved in terms of the commodity and low-cost housing by a way
of regional housing planning, although the social-mixed residences could be reducing
315
the chances of low-cost housing area turning into a slum (or another type of urban
village) and simultaneously enhancing the living safety and quality of life of residents
living at low-cost housing by means of sharing the improved regional neighbourhood
facilities with commodity housing residents.
Regarding the sub-theme of community clinic, all of community clinics located at
these three phases of low-cost housing had good locations and easy accesses in order to
provide good and initial medical services.
On the contrary, these sub-themes of quietness of the housing estate, local crime and
accident situations, nearest general hospital, local police station, and nearest fire station
had not been enhanced since the 1st phase of low-cost housing until the 3
rd phase.
The quietness of the housing estates in three phases were broken by many noises
generated from the neighbours and the open spaces. Moreover, the local crime and
accident situations were complained about the frequencies of crimes and accidents’
occurrences were medium with very bad situations throughout Xuzhou’s three phases of
low-cost housing projects. Furthermore, the nearest general hospitals to these three
phases unfortunately had long distances and they were not convenient to get there.
Unfortunately, Phase 3 was complained about the distance between residential area
and local police station being long and not convenient compared to Phase 1 and 2. What
was worse, all of three phases’ residents complained that the distances between their
houses and the fire stations were long and they were not convenient. In the meantime,
the residents from three phases were also angry with no such a low-cost housing estate
having their own firefighting equipment.
316
The second most concerned element which related to housing estate supporting
facilities satisfaction mainly described the low-cost housing residents’ aspirations of
good layout and good maintenance for public facilities (see Figure 8.1).
Amongst those five sub-themes, the sub-theme of parking facilities had already been
much enhanced in the 3rd
phase of low-cost housing project. The 1st and 2
nd phases were
complained about their parking areas being very limited with bad and chaotic conditions
and also having sanitation problems, Furthermore, there also had many lighting
problems in Phase 2 and the location of parking area had conflicts with children’s
playground and fitness equipment in Phase 2. Contrarily and luckily, Phase 3 made an
improvement on building two isolated car parks with good environment, enough space,
good condition, and clean areas.
With respect to the sub-theme of local kindergarten, all of kindergartens located at
nearby or within the three phases of low-cost housing projects had normal conditions
and normal locations and all local kindergartens were clean.
In contrast, these sub-themes of open space, children’s playground, and local shops
had not been enhanced or even were worse than previous phases amongst these three
phases of low-cost housing projects. Firstly, the three phases’ open spaces were mostly
criticised regarding not having enough space and having bad conditions. However, the
2nd
and 3rd
phases’ open spaces were reported to be much worse than the 1st phase’s
open space due to they had lighting and sanitation problems.
Secondly regarding the sub-theme of children’s playground, all of three phases’
children’s playgrounds were criticized about their very limited spaces especially they
had bad conditions and locations at Phase 2 and 3. Additionally, the 2nd
and 3rd
phases
both had lighting and sanitation problems.

317
Furthermore, with respect to the sub-theme of local shops, the certain numbers of
residents came from Phase 2 and 3 had low and very low level of satisfactions with
local shops compared to Phase 1 where the local shops had sufficient numbers with
good locations, because they thought that the local shops in Phase 2 and 3 had some
problems with locations, for instance, the locations of local shops in Phase 2 had
conflicts with the open space. In Phase 3, some shops located at the first floor of the
first row of the houses actually disturbed residents.
The third most concerned element which related to housing unit supporting services
satisfaction mainly described the low-cost housing residents’ aspirations of good
maintenance for housing unit (see Figure 8.1).
Amongst those five sub-themes, the sub-theme of drain had already been much
improved in the 3rd
phase of low-cost housing project with good maintenances.
However, the 1st and 2
nd phases still had dissatisfactions with drain due to the drain
system was not good and the maintenance was also bad.
With respect to the sub-theme of electrical & telecommunication wiring, all of three
phases of low-cost housing projects had a normal condition of electrical &
telecommunication wiring with a normal maintenance.
On the contrary, these sub-themes of staircases, corridor, and garbage disposal had
been worsening in Phase 2 and 3 compare to Phase 1. Regarding the sub-theme of
staircases, all three phases’ staircases were complained about quite narrow or just
enough space for using and unclean. Except for the 1st phase having a good lighting in
staircases, the 2nd
and 3rd
phases had no lighting at all in their staircases.

318
Moreover, with respect to the sub-theme of corridor, what all three phases’ corridors
were criticized was similar with those complaints about the staircases regarding the
space, lighting, and cleanness. In addition, Phase 1 and 3’s corridors had a same
problem with noise and Phase 3 had another problem with the big smell from the
garbage.
Furthermore, with respect to the sub-theme of garbage disposal, three phases almost
had the same situation which was timely collection of garbage, but the garbage cans
were not cleaned thoroughly particularly Phase 3.
The fourth most concerned element which mentioned about housing unit
characteristics satisfaction mainly talked about the low-cost housing residents’ requiring
of good structure design for housing unit (see Figure 8.1).
In the middle of those five sub-themes, the sub-themes of living room, bedroom, and
drying area were almost same design from Phase 1 to Phase 3 which nearly satisfied
those residents. For instance, the sub-theme of living room was given a highly comment
on the size over the location throughout three phases of low-cost housing projects.
What’s more, most residents from three phases thought that their living rooms did not
have good ventilations. Furthermore, most residents from Phase 2 and 3 complained
about their living rooms having bad lighting. Additionally, most residents from three
phases thought the numbers of power sockets in their living rooms were just enough for
using.
Furthermore, the sub-theme of bedroom was criticised about its size which was
slightly smaller than their master bedroom. In the meanwhile, most residents thought
that their bedrooms were not well ventilated. In addition, the residents from Phase 1 and

319
2 had the same problem of lighting in bedroom. Additionally, the power sockets were
found in bedroom was very few.
Moreover, the sub-theme of drying area received a good comment with having an
appropriate size with good ventilation and with a good lighting from Phase 1 and 3.
However, some residents from Phase 3 complained about no power socket in their
drying areas.
In terms of the sub-theme of dining area, it dissatisfied most residents from three
phases. For example, most residents from Phase 2 and 3 thought that the size of their
dining areas were small and also had bad lightings. And most residents from three
phases thought that the locations of their dining areas were also not proper and did not
have good ventilations. In addition, the numbers of power sockets in their dining areas
were fewer.
With respect to the sub-theme of toilet, except for some residents from Phase 3
thought that the conditions of their toilets were in a way acceptable, most residents from
Phase 1 and 2 complained about their toilets had a very small size and a bad location.
Furthermore, they complained that there was no ventilation in their toilets and there had
a bad lighting in their toilets as well. In addition, the problem with fewer power sockets
in their toilets had also been seriously taken into considerations.
In short, those residents living at three phases of low-cost housing projects in
Xuzhou finally wanted their houses to be enhanced according to the standard of
commodity housing in order to improve their social economic status in China based
upon their households’ socio-economic characteristics affecting their judgements on
assessing their residential satisfactions (see Figure 8.1). Thus, those above mentioned

320
four sub-themes were the keys to affecting their measurements in terms of occupation
type, floor level, main means of transportation, and housing ownership.
In relation to the sub-theme of floor level, all floors were almost same except for
people’s lower residential satisfactions in living on the top and the first floors because
the top floor was very cold during winter and was very hot during summer and the
lower floor was affected by the smelling of garbage and crowd noise. Thus, the
residents who were living on the middle floors were more satisfied than others, because
the middle floors were not high and stayed away from disgusting smell of garbage and
very few numbers of mosquitoes and flies were around.
Advert to the sub-theme of occupation type, the small group of residents of Phase 1
whose occupation type with management & professional were less satisfied than those
whose occupation type with others such as some jobs paid by daily-settlement (no fixed
contract), retired, and laid-off/unemployed. This indicated that the reason why most
residents from Phase 1 and 3 thought of “the higher position of occupation with the
lower satisfaction” was that the income level of residents with occupation type of
management & professional made them ask for more from the existing low-cost housing
comparing to the income level of residents with occupation type of others.
With respect to the sub-theme of homeownership, most residents from three phases
took this issue very seriously because they wanted to purchase the next commodity
housing using the current house ownership. Thus, the higher satisfaction with
homeownership was presumed to bring along their higher levels of residential
satisfaction in Xuzhou’s three phases of low-cost housing and they were obviously
dissatisfied with the current status of their housing tenure.

321
However, there was a group of certain numbers of residents from three phases did
not consider the issue of low-cost housing’s homeownership as a top problem
comparing to other problems, such as satisfactions of neighbourhood characteristics,
housing estate supporting facilities, housing unit supporting services, and housing unit
characteristics.
Accordingly, their current or future concerns were more about that the low-cost
housing should be physically constructed or improved as the procedure of commodity
housing’s construction in order to satisfy those local medium-low income households
due to they would not have capabilities of buying their next commodity houses in the
near future. Hence, they had to rely more on their current residential environment rather
than thinking of moving out.
Regarding the sub-theme of residential disparities which was additionally mentioned
above, the social exclusion existed in Phase 1 and 3 not only between residents with
comparatively higher position at company and residents with lower position of
occupation, but also between the low-cost housing residents and the commodity housing
residents, although Xuzhou’s local government learnt some lessons in which building
the mixed residences in terms of low-cost and commodity housing could let local low-
cost housing residents enjoy commodity housing’s better neighbourhood facilities, e.g.
public transportation.
With respect to the sub-theme of main means of transportation, local residents’ main
means of transportation was not only affected by neighbourhood facilities such as
nearest bus/taxi station, it also was affected by the development of design of low-cost
housing estate supporting facilities. For instance, above age 60 of residents in Phase 2
went outside for buying some commodities and food preferring to walking there,
because there was only one shuttle bus line passed by and they did not have other

322
choices, but, at very least, there was a quite big food market nearby which was not a
formal market. Furthermore, residents from Phase 3 who rode bicycles to go outside
were not satisfied due to the location of Phase 3 being a bit far away from Xuzhou’s
downtown.
Regarding this, the mixed residences surely enhanced the whole average of living
standard of low-cost housing especially in housing estate supporting facilities and also
improved local low-cost housing residents’ confidences with having commodity
housing’s residents as neighbours, for instance, Phase 3’s basic parking facilities got
much improved by Xuzhou’s local authority compared to Phase 1 and 2 according to the
increased average standard which was evaluated together with surrounded commodity
housing. Therefore, to improve their current living environment of low-cost housing
was suggested to construct according to the standard of commodity housing.
8.2.5 Public Participation Model as Recommendation to Improve RS
On the basis of the results came from the last question of qualitative part, all six
participants sincerely hoped that they could express their requirements by way of
getting involved in the whole process of low-cost housing projects construction. It was
confirmed that a lot of authors cited in this research work also recommended their local
governments and property management companies to get their residents publicly
participated in managing their properties in accordance with Arnstein’s (1969) ‘a ladder
of citizen participation’. Therefore, the local residents wanted to get more engaged in
the whole process of low-cost housing development by means of dialogue and
partnership than only being informed and consulted.

323
8.3 Implications
Recognising that all new second-tier cities in Jiangsu province nearly provided the
low-cost housing in the city level which belonged to the low-income housing project
and the municipal government concerned about their residential satisfactions via their
own way of evaluations in terms of the numbers of low-income houses provided and the
general living environment, the findings of this current research work were aimed at
several interested participants: low-cost housing residents, NGO, NPC (National
People’s Congress) deputies at all levels, property company and local government,
municipal state-owned construction developing & investment company and design
company, construction enterprise and supervision company.
Knowing the predictive power of physical/objective and non-physical/subjective
factors to the inhabitants’ residential satisfactions in their low-cost housing projects may
assist the local government in developing strategies to enhance the dwellers’ residential
satisfactions in the low-cost houses. The implications of this study described as follows.
8.3.1 Low-Cost Housing Residents, NGO, NPC Deputies
On the part of the low-cost housing residents, the findings of this study told of how
their current living situations were and which factors in the survey were the most
concerned by residents.
In addition, on the basis of the low-cost housing project was meant to protect those
medium-low and low-income group of people’s living rights, the currently implemented
low-cost housing projects in those second-tier cities in Jiangsu province especially in
Xuzhou city should not only ensure a living place to them, but should also satisfy them
to some extent.

324
To the residents, they could get benefits from the scientific findings of this current
study in which they could practically understand their current residential environment in
terms of which parts were already improved and which parts were needed to further
enhance. At same time, this study might build a platform for low-cost housing residents
whereby they could express their comments directly to the local authority instead of
informing their property management companies or the NPC deputies. Accordingly, this
study might improve the efficiency of reporting their living situations to the local
authority.
With regard to the NGO, the numbers of NGOs in the second-tier cities of Jiangsu
province were very limited and they have not been a formation of industry chain. As the
low-cost housing project which was initiated and supervised by the local authority was
developed by the municipal state-owned construction developing & investment
company and designed and built by the design and construction enterprises which were
both designated by the municipal state-owned construction company, all of construction
activities did not get the medium-low and low-income group of people and the NGOs
involved in the preparation and construction processes of low-cost housing projects.
After the completion of low-cost housing, there was no interview from any NGOs or
any government’s work units to ask about how their current residential environments
were according to their qualitative results.
Therefore, this study indicated the theory of residential satisfaction and presented
how to apply this theory to assessing the residential satisfactions of Xuzhou’s three
phases of low-cost housing projects based upon the questionnaire survey and interviews.
Hence, this study might benefit the local government from finding the NGOs which
were the third party and isolated party to do the similar assessments of low-cost

325
housing’s inhabitants’ residential satisfactions which should be taken into more
considerations than the numbers of low-cost houses.
With respect to the NPC deputies, they are the representatives of Chinese citizens in
different levels and help them voice out their comments when their public interests were
violated. However, the issue of the decreasing of low-cost housing’s inhabitants’
residential satisfactions was not considered as a violation of their public interests.
Although the residents of low-cost housing could report their dissatisfactions to the
NPC deputies, the NPC deputies could not easily deliver the reports to the related
superior departments due to their complaints were not detailed and validated by way of
the scientific experiment.
Thus, the NPC deputies might be suggested to cooperate with the NGOs in collecting
and analysing the residents’ complaints by way of a scientific research which was
brought the implications by this current work. After then, the scientific reports would be
delivered to the local authority.
8.3.2 Local Government and MSOCC
With respect to the relationship between the local government and the municipal
state-owned construction developing & investment company in terms of constructing
low-cost housing projects, the municipal state-owned construction company is asked
and supervised by the local government to fully take in charge of the construction work
of low-cost housing project and subcontract the design and construction works to the
third party of design and construction enterprises. In the meanwhile, the whole process
of construction is supervised by the independent supervision institution. After
completion, the municipal state-owned construction company will hand the whole
project over to the local government for further distribution to those qualified
applicants. Since the qualified residents move and live here, except for the quality of

326
houses being ensured by the municipal state-owned construction company, their
residential properties are managed by the property management company which is
either recommended by the municipal state-owned construction company or found in
the market and later is under the supervision of the local government.
However, the whole process of construction and the system of property management
did not involve the local residents, the NGOs, and the NPC deputies to do the decision
makings or the supervisions on the low-cost housing projects. Consequently, there is a
misunderstanding between the local residents and the local government which has been
found in this research work talking about what the local government concerned was not
exactly what the local residents wanted such as some factors being found and discussed
in the above findings consisting of community relationship, local crime and accident
situation, quietness of the housing estate, nearest fire station, open space, staircases,
corridor, garbage disposal, etc.
Furthermore, some researchers who were mentioned in the literature review part
criticised that improving the residential satisfaction of low-cost housing required
specific analysis of specific cases instead of general low-cost housing policy.
It turned out that this study might be a bridge built for the mutual understanding
between the local residents and the local government. The Xuzhou’s local government
might get benefits from this work to improve their understandings about where to
enhance the residential satisfactions of Xuzhou’s three phases of low-cost housing.
For instance, in the light of the 2nd
phase of low-cost housing being located at the
isolated housing area, the residential satisfaction level of inhabitants of Phase 2 was
even lower than Phase 1 and 3’s in terms of lack of neighbourhood facilities and less
concerns from local government.

327
However, although Xuzhou’s local government considered that the social-mixed
residences of Phase 1 and 3 could be reducing the chances of low-cost housing area
turning into a slum (or another type of urban village) and concurrently enhancing the
living safety and quality of life of low-cost housing’s residents by way of sharing the
improved regional neighbourhood facilities with commodity housing residents, it was
unfortunate that the social contradiction between the residents who lived at the
commodity housing estates and the residents who lived at the low-cost housing estates
often occurred in these mixed communities when they had some social interactions.
In spite of the fact that the local government provided each bus/taxi station around
each phase of low-cost housing project, the issues of the distances between their houses
and the nearest bus/taxi stations and the numbers of public buses going to different
places such as the downtown, general hospital, and schools were not taken into account
when the local government planed the each phase of low-cost housing project’s
surrounding transportation environment.
Regarding the satisfactions of the situations of accident and crime around the three
phases of low-cost housing, it was easy for the local government and property
management company to build more neighbourhood facilities for the residents,
however, they ignored their surrounding environment such as bicycle stealing, burgling,
car and electric bicycle accident which were found and brought into discussion in this
research work.
Moreover, the local government had no idea about the local residents wanted their
houses to meet the standard of commodity housing that had a standard of sound
insulation in order to low some noises from the outside. In the meanwhile, the residents
also required each phase of property management company to redesign the public area
of housing estate where the places of open space, children’s playground, and local shops

328
should be kept a certain distance to residential blocks so as to enhance the quietness
from the public area of housing estate.
Despite of the local government building the supporting facilities for low-cost
housing estates, the numbers and locations of those supporting facilities were seriously
neglected based upon the findings of this research work, for instance, some more fitness
equipments and recreation places were needed from the residents’ requirements.
Additionally, both Phase 1 and 2 needed a parking area.
Moreover, the location of children’s playground needed to be redesigned due to it
had conflicts with the perimeter road in Phase 1, was occupied by the parking facilities
in Phase 2, and was affected by one block’s garbage collection spot in Phase 3. In
addition, those local shops located at Phase 2 which occupied some places of public
area and affected those residents’ spaces of playing needed to be relocated.
Furthermore, some shops located at the first floor of the first row of the houses in Phase
3 also needed to be relocated in order to reduce many noises generated by those
shoppers.
Regarding the lighting and sanitation problems, the lighting problems in the currently
mixed bicycle & car parking area of Phase 2 would be dealt as soon as possible to
reduce the risk of bicycle and auto thefts. In addition, the lighting problem caused a lot
of safety issues regarding when the children were playing during the night and the
sanitation problem caused a lot of children’s health issues.
In addition, the most overlooked aspect of housing estate supporting facilities was
the firefighting equipment which was not installed in any of three phases of low-cost
housing projects.
329
Under the circumstance of the quality of low-cost housing being comparatively
lower, the property management company’s work efficiency of doing maintenance work
needed to be improved. Additionally, their satisfactions of staircases and corridors
needed to be paid very attention to.
With respect to the housing unit characteristics, the local government was suggested
by this research work to pay very attention to the housing design and layout in terms of
the sizes, locations, ventilation, and lighting of rooms.
In addition, the local residents required their property management companies to add
some more useful devices such as electrical sockets to improve the conveniences in
their daily life.
In short, despite of the fact that Xuzhou’s local government built the mixed
residences in order to let local low-cost housing residents enjoy commodity housing’s
better neighbourhood facilities, the local government did not know exactly what they
wanted based upon their understandings and experiences learnt from other cities or the
secondary data.
Through the findings of this research work, it could fill the gap of understandings
between the local government and the low-cost housing residents, i.e. all the residents
wanted was a low-cost housing met with the standard of commodity housing. This is the
Chinese common sense that the residents living at low-cost housing thought the
residents living at commodity housing would look down upon them.

330
8.4 Recommendations
8.4.1 Theory Prepared
Based upon the results given by Xuzhou’s low-cost housing residents showed they
wanted to take part in the whole process of low-cost housing development, a lot of
authors have studied about the public participation in low-income housing development
with reference to Arnstein’s (1969) ‘a ladder of citizen participation’(Cui et al., 2016;
Galster & Hesser, 2016; Healey, 2015; Huang & Du, 2015; McClure et al., 2015; Tao et
al., 2014; Xi & Hanif, 2016).
In addition to the residents being suggested to publicly participate in managing their
properties with the professionals, in this research work, the local residents wanted to
participate since the project was in the process of preparations. Accordingly, under the
conduct of Healey’s institutional model (Patsy Healey, 1992, 2011) which was the
actors-centred and applicable to all types of development projects and was workable
under different economic and political regimes (Patsy Healey, 2008, 2012; Zöllig &
Axhausen, 2011), the institutional model should provide an understanding and
explanation of the nature of the negotiating processes embedded in the specific housing
development process in any other particular context (Ennis, 1997; Patsy Healey, 2016)
based upon the fundamental shift of planning thought changing from a procedural
conception to the communicative planning theory involving the public actors in any
types of planning to facilitate the development process by way of the inter-personal
communication and negotiation (Craig, 1999; Habermas, 1984; Taylor, 1999).
In terms of this consolidated model indicating the different actors to pursue their
strategies and interests through a negotiating framework initiated by the local authority
(Patsy Healey, 2007; P. Healey, 2015; Patsy Healey et al., 2008), the different roles
such as the qualified applicants, NGOs, NPC deputies, municipal state-owned

331
construction company, design company, construction enterprise, and supervision
Company would be introduced by the local government into a proper institutional model
of housing development to negotiate and pursue their own interests when preparing and
building the low-cost housing project.
8.4.2 Public Participation in LCH Development Model Proposed
On the basis of the public participation in low-cost housing development promoting
the equity in order to improve the low-cost housing residents’ acceptances of local
government’s decisions, some Chinese scholars proposed different models of public
participation in low-cost housing development.
Sheng’s, Patsy Healey et al.’s, Grillo, Teixeira, & Wilson’s, Liang & Fang’s,
Ammar, Ali, & Yusof’s and Li’s (1990), (2008), (2010), (2012), (2013), and (2013)
summarised those previously proposed theoretical-models and recommended their
public participation mode in public projects development. In combination with the
findings found in this research work, the way of public participation in the full process
of China’s low-cost housing development (see Figure 8.1) initiated by the local
government and applied by the municipal state-owned construction company
(MSOCC), design company, construction enterprise, supervision company, qualified
applicants of low-cost housing, NGO, NPC deputies to negotiate for their own interests
would substantially improve the inhabitants’ residential satisfactions to a certain extent.
In terms of Figure 8.1, the first public participation happened at the initial stage of
low-cost housing’s project establishment which was led by Housing Security Centre of
Municipal Housing Administration Bureau and was reviewed by the departments of
land administration, environmental protection, planning, and was supervised by
National People’s Congress from top to bottom in order to ensure practicability and
equity of the low-cost housing project. In the first public participation in the project

332
establishment of low-cost housing, the NPC deputies supervised the process of project
establishment by way of regular inspection organised by the committee of experts.
With respect to the second public participation happened at the second stage of low-
cost housing’s project site selection, the qualified applicants of low-cost housing was
suggested and introduced to join in government’s discussion for the first time. On
account of the low-cost housing ensuring the living rights of medium-low and low-
income group of citizens, those qualified applicants who would finally move into the
low-cost housing should be brought into the joint decision-making part as soon as
possible.
Regarding the joint decision-making part, the local government was intended to
enhance the acceptance of low-cost housing policy through negotiations with the
qualified applicants in order to improve their confidences in low-cost housing projects.
However, due to the conflicts of interests among the different groups of interests were
far different, the negotiation between the government departments & municipal state-
owned construction company and the general public would be held repeatedly so as to
raise their mutual understandings.
In the past, the qualified applicants and other citizens did not have that kind of
opportunity to take part in the government’s discussion since the beginning of the
project site selection.
In contrast, the findings of this paper indicated that the local residents really wanted
to take part in the government’s discussions about the site selection in accordance with
their lower level of satisfactions with neighbourhood characteristics.

333
Municipal State-Owned Construction Company & Private
Companies
Full Process of Low-Cost
Housing Development
Initiated and Jointly
Supervised by Local
Government
General Public
Municipal State-Owned
Construction Company
(MSOCC) (Only One
Designated Contractor Decided
by Local Government)
Design
Company
(Contracted
with
MSOCC)
Construction
Enterprise
(Contracted
with MSOCC)
Supervision
Company
(Independent)
Qualified
Applicants of
Low-Cost
Housing
NGO NPC
Deputies
Project Establishment
Supervising
& Auditing
Project Site Selection Joint Decision-
Making Advising
Supervising
& Auditing
Joint Decision-Making
Advising
Project Planning Joint Decision-
Making Advising
Supervising
& Auditing
According to The Contracts & Listening to Advices & To Accept Supervisions
Project Implementation
Joint Decision-Making & Advising
& Supervising
Advising &
Supervising Supervising
Information Providing
Project Assessment
Information
Providing
Assessing &
Advising Supervising
Figure 8.2 Public Participation in the Full Process of LCH Development
Reference: proposed by Liang & Fang’s and Li’s (2012) and (2013) and modified by the writer

334
Therefore, the local government should invite the qualified applicants and citizens to
make the joint decision on the site selection by way of negotiation. On the platform of
negotiation, the local government should try their best to meet those medium-low and
low-income group of citizens’ requirements regarding their residential satisfactions.
Furthermore, the applicants and residents would understand those difficulties that the
government had by listening to their report such as the land use policy for low-cost
housing development, the future planning for the low-cost housing area, etc.
In addition, the roles of NGOs and NPC deputies playing were to advise and
facilitate the citizens and qualified applicants in collecting their complaints to report to
those related departments. The roles of NGOs and NPC deputies acting were like a
bridge connecting the local government and the qualified applicants & citizens in order
to advise and facilitate them to make the final joint decision.
Regarding the third public participation happened at the third stage of low-cost
housing’s project planning, the current qualified applicants, residents, and citizens were
very seldom or never invited by the local authorities to participate in the low-cost
housing’s project planning.
Thus, the qualitative results of this current work told that some misunderstandings of
low-cost housing policy planning dissatisfied them such as the local residents had not
yet had their full homeownerships due to Xuzhou’s local government had already
postponed two times, i.e. the first five years regarding which the local government
postponed selling another leftover homeownership from after 5 years’ purchasing to
after 10 years’ buying and the second postponing was reported that the local
government had not yet confirmed exactly which date the 1st phase of low-cost housing
residents could buy the rest of homeownerships from the local government.

335
By comparison, if the Xuzhou’s local government had applied the negotiation
process before the project implementation, the residents might understand why the local
government postponed the time of purchasing homeownerships and then they would
find some alternatives through negotiation.
In addition, the municipal state-owned construction company (MSOCC) which was
the only one contractor designated and supervised directly by the local government and
the design company which was on the contract with MSOCC and was also supervised
by MSOCC came into the discussion with the citizens and residents to make a joint
decision by means of expert and high technical report seminar.
Besides, the roles of NGOs and NPC deputies playing were to advise and facilitate
the citizens and qualified applicants in collecting their complaints to report to those
related departments. Moreover, the NOGs and NPC deputies also supervised and
audited the low-cost housing development process.
In regard to the fourth public participation occurred at the fourth stage of low-cost
housing’s project implementation, Liang & Fang’s and Li’s (2012) and (2013) claimed
that the major negotiation occurred between the government departments and the
municipal state-owned construction company (design and construction companies) in
the low-cost housing’s project implementation. Moreover, the private companies which
were introduced by the MSOCC into the low-cost housing construction could help the
local government to ease fund shortages in building low-cost housing. At same time, the
risk of cooperating with local government in China was considered lower comparing to
working with private sectors.
336
On the contrary, it has been criticised that the findings came from this current study
challenged the public participation mode at the 4th
stage of building low-cost housing in
terms of the qualified applicants, residents, and citizens were intended to take part in the
public-private partnership of construction based upon the joint decision rather than only
advising and supervising.
In addition, the roles of the qualified applicants & residents & citizens, NGOs and
NPC deputies playing were to advise and supervise the process of project
implementation. Sometimes, the NGOs and NPC deputies should find the consulting
organisation and public media which were the professionals in the construction field to
facilitate the citizens and qualified applicants in delivering their dissatisfactions with the
project implementation to those related government departments. Furthermore, the
reputation of local government would be increased by means of publicising the process
of project implementation and the local government would be better supervised by the
independent supervision company and the general public.
With regard to the fifth public participation taken place at the fifth stage of low-cost
housing’s project assessment, this public participation model suggested that the local
government should do the overall assessment on the new project based upon the
information provided by the qualified applicants and the MSOCC.
However, the results from this research work argued that the assessment on the
overall residential environment which would be made after the qualified households
moved into should be paid more attention by the local government rather than the
assessment made before their moving into new low-cost houses, because the qualified
households had no choice of living elsewhere once they felt dissatisfied with the new
housing environment. Accordingly, to improve their living experiences looked like
337
much more important. Moreover, it was criticised that the assessment had to be done by
the independent supervision company.
Additionally, the NGOs and NPC deputies should try their best to find a good and
suitable residential satisfaction scale with scientific questions to help the local residents
enhance their living environments and to facilitate the local government to make more
scientific policies on low-cost housing.
8.4.3 Public Participation in LCH Development Contributing to Policy
The public participation in low-cost housing development would bring the following
benefits to its policy i.e. rational pricing, good planning, and Good Housing Estate
Supporting Facilities and Housing Unit Characteristics for Low-Cost Housing.
8.4.3.1 Rational Pricing for LCH
The rational pricing for low-cost housing was more concerned by the local
government and medium-low and low-income group of citizens. If the pricing of low-
cost housing was made higher, the medium-low and low-income group of citizens did
not afford to buy low-cost housing. Instead, the local government could not recover the
construction costs and those private companies would lose their enthusiasms in getting
involved in building low-cost housing.
During the interview, it was found that the price of new low-cost housing in some 2nd
tier cities in Jiangsu province was higher than the local citizens’ affordability. As a
result, a lot of qualified households finally did not have enough money to buy low-cost
houses.

338
It was assumed that the negotiation between the local government and qualified
households which was already introduced in low-cost housing development would make
the pricing more rationally by way of the local government publicising their
construction costs and their development details.
8.4.3.2 Good Planning for LCH
With regard to the public participation in the site selection, the good location of low-
cost housing would enhance the inhabitants’ residential satisfaction to a great extent.
Currently, the local government planned the mixed residences in terms of the low-cost
and commodity housing in order to improve the quality of neighbourhood facilities of
low-cost housing by sharing the public facilities of commodity housing.
However, those residents who lived at low-cost housing had social problems with
those residents living at commodity housing such as social discrimination. Not only
that, the commodity housing’s residents thought that the price of their housing would be
severely affected by the surrounding low-cost housing. More than that, the Xuzhou’s
low-cost housing of Phase 2 also failed for its isolated location in terms of lack of
neighbourhood facilities.
Thus, by way of negotiation between the residents and local government, the local
government would know exactly what they wanted and the local government would not
waste time and resources to build some useless facilities.
8.4.3.3 Good HESF and HUC for LCH
The findings of this research indicated that the most residents were dissatisfied with
the housing estate supporting facilities in terms of the local shops and recreational
facilities.
339
Thus, the local government would know exactly how to improve their housing estate
supporting facilities by way of negotiation between the residents and local government.
The findings of this research indicated that the local residents dissatisfied with their
toilets in terms of the size and ventilation. In addition, they wanted the dining area and
living area to be redesigned by separating.
As for the developer, the housing design of low-cost housing had to be different from
the commodity housing, because the developer actually wanted to sell more commodity
houses for more profits. They had to build better designed commodity houses than low-
cost houses.
Thus, the negotiation might improve their mutual understandings regarding the
differences between these two types of houses and try to help the low-cost housing
residents to fix up their problems.
8.5 Limitations of This Study
Despite of the fact that this research work finally has already answered those
research questions, objectives and fulfilled the research gap that was indicated at the
beginning of the research, some limitations of this research work as follows which was
contained in the methodology part might affect the results which would bring along
some influences into the discussions.
Each city’s low-cost housing project has its unique circumstances
Data collection had been still criticised by other authors, although those ways
that this research adopted and applied were all common ones
Stepwise regression method (criticised & higher qualified data)
Case selection (no conclusive theory about the numbers of case selecting)
Recommendations (limited)

340
First of all, although the Xuzhou city which is the largest city in Jiangsu province
and could represent all of the new 2-tier cities in Jiangsu province to a certain extent,
each city’s low-cost housing project has its unique circumstances. Under the almost
same low-cost housing’s building standard throughout the new 2-tier cities in Jiangsu
province in terms of the physical living environment, the determinants to each city’s
low-cost housing satisfaction would be slightly different based upon the calculations
made by the mathematical model of residential satisfaction. Therefore, the study of
three phases of low-cost housing in Xuzhou city only could indicate the status quo of
the low-cost housing programme in those new 2-tier cities of Jiangsu province and
describe & investigate the inhabitants’ residential satisfactions with that programme in
Xuzhou city.
Secondly, on the basis of this research work applying the explanatory sequential
mixed mode method, the way of stratified random sampling for selecting participants,
the Yamane’s mathematical formula of calculating the sample size, and the structured
questionnaire being deployed to collect the quantitative data at the first part of mixed
mode method were all common ways of collecting data and were learned from the
literature reviews. However, these ways of data collection had been still criticised by
other authors. For example, the sample size is a much debated issue whereby it would
bring along a very different result. The Yamane’s model claimed that doing a predictive
model better apply the Yamane’s model to calculate the sample size. Instead, knowing
the percentage better use the national survey or the actual numbers.
Furthermore, the stepwise-method regression which was used for analysing the
quantitative data had been still criticised by some authors when they were doing the
same topic. For instance, comparing to the stepwise-method regression, some authors

341
recommended the logit or the categorical regressions because the stepwise-method
regression required the higher qualified data.
With respect to the second part of mixed mode method, qualitative, so far there was
no conclusive theory about how many cases would be exactly selected for further
qualitative analysis. Some authors claimed that one or two cases would be picked up
according to the quantitative results. However, some researchers argued that the
numbers of cases should be the same as the sample size from the quantitative part.
In addition, the way of data collection and analysis in the qualitative part which
would be either done by manual work or done by software work has been being
discussed, for instance, some social science researchers thought that the information
recorded by manual work would be more detail than the software work did regarding
the numbers of questions being asked in the qualitative survey. In contrast, some
researchers argued that the information recorded by software work would be more
efficiently and scientifically than the manual work did regarding a lot of questions being
asked in the qualitative survey.
Thirdly, on the basis of the findings, the recommendation part was very limited
because there was no verified data or resources to support it.
8.6 Future study
In the context of China’s housing market, it is not only necessary but also urgent to
launch China’s Housing Act as soon as possible particularly the low-income housing.
The processes of construction and management of low-income housing have to be
abided by the law.
On the basis of the findings of this research work, the local residents are willing to
take part in low-cost housing’s construction and management. Accordingly, the public

342
participation in low-cost housing development model would be the next study consisted
of the correlations between the regulations of four participated stages and the
satisfactions of four residential components & individual and household’s socio-
economic characteristics. Here is the process of future research.
To review the policies and regulations in each stage of the public
participation model
To investigate how significant those correlations between the regulations in
public participation and each component’s satisfaction & individual and
household’s socio-economic characteristics will be
To propose a low-cost housing construction and management law to protect
the medium-low and low-income group of citizens’ housing and living rights
All new 2-tier cities in Jiangsu province, China and select one or two typical
low-cost housing projects from each city
Exploratory sequential mixed mode method
The MANOVA will be used to analyse
A proper low-cost housing construction and management law
Therefore, to review the policies and regulations in each stage of the public
participation model is the first objective. Then, to investigate how significant those
correlations between the regulations in public participation and each component’s
satisfaction & individual and household’s socio-economic characteristics will be is the
second objective. Finally, according to the results given by the second objective
describing which policy and regulation has the most significant with their residential
components’ satisfactions & their socio-economic characteristics, it will propose a low-
cost housing construction and management law to protect the medium-low and low-
income group of citizens’ housing and living rights.

343
With respect to those participants, it is learned from the limitations of this current
work that the survey will be deployed in all new 2-tier cities in Jiangsu province and
will select one or two typical low-cost housing projects from each city.
The exploratory sequential mixed mode method will be applied. The Nvivo
qualitative data analysis software will be used firstly to facilitate in designing the
quantitative research questionnaire because the qualitative data would be very
complicated in terms of being collected from several projects in several cities.
The MANOVA will be used to analyse the quantitative data because the correlations
between the regulations of four participated stages and the satisfactions of four
residential components & individual and household’s socio-economic characteristics
meet the MANOVA mathematical modelling.
Therefore, the local government and citizens with the NGOs and NPC deputies’
supervisions will propose a proper low-cost housing construction and management law
to protect the medium-low and low-income group of citizens’ housing and living rights.
344
REFERENCES
Adriaanse, C. C. M. (2007). Measuring residential satisfaction: a residential
environmental satisfaction scale (RESS). Journal of Housing and the Built
Environment, 22(3), 287-304. doi:10.2307/41107389
Al-Homoud, M. (2011). Social and Physical Attributes as Measures of Community
Satisfaction at as-Salihyyah in the Badia of Jordan. Journal of Architectural and
Planning Research, 28(3), 211-228.
Amerigo, M., & Aragones, J. I. (1990). Residential Satisfaction in Council Housing.
Journal of Environmental Psychology, 10(4), 313-325. doi:Doi 10.1016/S0272-
4944(05)80031-3
Amerigo, M., & Aragones, J. I. (1997). A theoretical and methodological approach to
the study of residential satisfaction. Journal of Environmental Psychology,
17(1), 47-57. doi:DOI 10.1006/jevp.1996.0038
Ammar, S. M., Ali, K. H., & Yusof, N. A. (2013). The Effect of Participation in Design
and Implementation Works on User’Satisfaction in Multi-Storey Housing
Projects in Gaza, Palestine. World Applied Sciences Journal, 22(8), 1050-1058.
Andrews, F. M. (1974). Social indicators of perceived life quality. Soc Indic Res, 1(3),
279-299. doi:10.1007/bf00303860
Andrews, F. M., & Withey, S. B. (1976). Social indicators of well-being : Americans'
perceptions of life quality. New York [etc.]: Plenum Press.
Aragonés, J. I., & Corraliza, J. A. (1992). Satisfacción residencial en ámbitos de
infravivienda. Psicothema, 4(2), 329-341.
Arnstein, S. R. (1969). A Ladder Of Citizen Participation. Journal of the American
Institute of Planners, 35(4), 216-224. doi:10.1080/01944366908977225
Aulia, D. N., & Ismail, A. M. (2013). Residential Satisfaction of Middle Income
Population: Medan city. Asia Pacific International Conference on Environment-
Behaviour Studies (Aice-Bs 2013) London, 105, 674-683. doi:DOI
10.1016/j.sbspro.2013.11.070
Aziz, A. A., & Ahmad, A. S. (2012). Home Making in Low-Cost Housing Area. In M. Y.
Abbas & A. F. I. Bajunid (Eds.), Proceedings of the 1st National Conference on
Environment-Behaviour Studies (Vol. 49, pp. 268-281).
Babbitt, C. H., Burbach, M., & Pennisi, L. (2015). A mixed-methods approach to
assessing success in transitioning water management institutions: a case study of
the Platte River Basin, Nebraska. Ecology and Society, 20(1), 54. doi:Artn 54
10.5751/Es-07367-200154
Balestra, C., & Sultan, J. (2013). Home Sweet Home: The Determinants of Residential
Satisfaction and its Relation with Well-being. OECD Statistics Working Papers,
43. doi:10.1787/5jzbcx0czc0x-en
Barton, J., Plume, J., & Parolin, B. (2005). Public participation in a spatial decision
support system for public housing. Computers, Environment and Urban Systems,
29(6), 630-652. doi:10.1016/j.compenvurbsys.2005.03.002
Bauer, C. (1951). SOCIAL QUESTIONS IN HOUSING AND COMMUNITY
PLANNING. Journal of Social Issues, 7(1-2), 1-34. doi:10.1111/j.1540-
4560.1951.tb02219.x
Bechtel, R. B., & Churchman, A. (2003). Handbook of environmental psychology: John
Wiley & Sons.
Bekleyen, A., & Korkmaz, N. M. (2013). An evaluation of Akabe mass housing
settlement in Sanliurfa, Turkey. Journal of Housing and the Built Environment,
28(2), 293-309. doi:DOI 10.1007/s10901-012-9313-6
Berkoz, L., Turk, S. S., & Kellekci, O. L. (2009). Environmental Quality and User
345
Satisfaction in Mass Housing Areas: The Case of Istanbul. European Planning
Studies, 17(1), 161-174. doi:Pii 906802419
Doi 10.1080/09654310802514086
Bonnes, M., Bonaiuto, M., & Ercolani, A. P. (1991). Crowding and Residential
Satisfaction in the Urban-Environment - a Contextual Approach. Environment
and Behavior, 23(5), 531-552. doi:Doi 10.1177/0013916591235001
The Brief Introduction to Xuzhou's First Phase of Low-Cost Housing. (2012). Available
from Xuzhou Housing Security and Real Estate Management Bureau, from
Xuzhou Housing Security and Real Estate Management Bureau
http://www.xz.gov.cn/zgxz/014/20121224/014019007001_023f131b-cd63-4b8e-
b39f-4c4c6e547a43.htm
The Brief Introduction to Xuzhou's Second Phase of Low-Cost Housing. (2012).
Available from Xuzhou Housing Security and Real Estate Management Bureau,
from Xuzhou Housing Security and Real Estate Management Bureau
http://www.xz.gov.cn/zgxz/014/20121224/014019007003_dfc8c571-06ec-46cd-
b75d-7117f9913fc6.htm
The Brief Introduction to Xuzhou's Third Phase of Low-Cost Housing. (2012).
Available from Xuzhou Housing Security and Real Estate Management Bureau,
from Xuzhou Housing Security and Real Estate Management Bureau
http://www.xz.gov.cn/zgxz/014/20121224/014019007002_77e7820c-91e9-4813-
b81f-3d19845025dc.htm
Bryman, A. (2003). Quantity and quality in social research: Routledge.
Bryman, A. (2006). Integrating quantitative and qualitative research: how is it done?
Qualitative Research, 6(1), 97-113. doi:10.1177/1468794106058877
Bryman, A. (2007). Barriers to Integrating Quantitative and Qualitative Research.
Journal of Mixed Methods Research, 1(1), 8-22.
doi:10.1177/2345678906290531
Bryman, A. (2015). Social research methods: Oxford university press.
Bryman, A., Becker, S., & Sempik, J. (2008). Quality Criteria for Quantitative,
Qualitative and Mixed Methods Research: A View from Social Policy.
International Journal of Social Research Methodology, 11(4), 261-276.
doi:10.1080/13645570701401644
Bryman, A., & Cramer, D. (1994). Quantitative data analysis for social scientists (rev:
Taylor & Frances/Routledge.
Bulsara, C. (2015). Using a mixed methods approach to enhance and validate your
research. Brightwater Group Research Centre.
Buys, L., & Miller, E. (2012). Residential satisfaction in inner urban higher-density
Brisbane, Australia: role of dwelling design, neighbourhood and neighbours.
Journal of Environmental Planning and Management, 55(3), 319-338. doi:Doi
10.1080/09640568.2011.597592
Byrnes-Schulte, M., Lichtenberg, P., & Lysack, C. (2003). Residential satisfaction in the
central city: Predictors and perspectives. Gerontologist, 43, 184-184.
Campbell, A., Converse, P. E., & Rodgers, W. L. (1976). The quality of American life:
Perceptions, evaluations, and satisfactions. New York, NY, US: Russell Sage
Foundation.
Cao, B., Ouyang, Q., Zhu, Y. X., Huang, L., Hu, H. B., & Deng, G. F. (2012).
Development of a multivariate regression model for overall satisfaction in public
buildings based on field studies in Beijing and Shanghai. Building and
Environment, 47, 394-399. doi:DOI 10.1016/j.buildenv.2011.06.022
Carvalho, M., George, R. V., & Anthony, K. H. (1997). Residential Satisfaction in
Condominios Exclusivos (Gate-Guarded Neighborhoods) in Brazil. Environment
and Behavior, 29(6), 734-768. doi:10.1177/0013916597296002

346
Chen, J. (2016). Housing System and Urbanization in the People’s Republic of China.
Chen, J., Stephens, M., & Man, Y. (2013). The Future of Public Housing: Springer.
Chen, J., Yang, Z., & Wang, Y. P. (2014). The New Chinese Model of Public Housing: A
Step Forward or Backward? Housing Studies, 29(4), 534-550. doi:Doi
10.1080/02673037.2013.873392
Chen, L., Zhang, W., Yang, Y., & Yu, J. (2013). Disparities in residential environment
and satisfaction among urban residents in Dalian, China. Habitat International,
40, 100-108. doi:10.1016/j.habitatint.2013.03.002
Cho, S. H., & Lee, T. K. (2011). A study on building sustainable communities in high-
rise and high-density apartments - Focused on living program. Building and
Environment, 46(7), 1428-1435. doi:DOI 10.1016/j.buildenv.2011.01.004
Clark, V. P., & Creswell, J. W. (2011). Designing and conducting mixed methods
research. Retrieved on July, 25, 2014.
Cleaver, F. (1999). Paradoxes of participation: questioning participatory approaches to
development. Journal of international development, 11(4), 597.
Corrado, G., Corrado, L., & Santoro, E. (2013). On the Individual and Social
Determinants of Neighbourhood Satisfaction and Attachment. Regional Studies,
47(4), 544-562. doi:Doi 10.1080/00343404.2011.587797
Creswell, J. (2014). Research Design. International Student Edition: United Kingdom:
SAGE Publications Ltd.
Cui, C., Geertman, S., & Hooimeijer, P. (2016). Access to homeownership in urban
China: A comparison between skilled migrants and skilled locals in Nanjing.
Cities, 50, 188-196. doi:10.1016/j.cities.2015.10.008
The Data of Sampling Survey on 1% population of Changzhou in 2015. (2016).
Retrieved November 15 2016
http://www.cztjj.gov.cn/html/tjj/2016/OPPIMFCM_0510/12886.html
The Data of Sampling Survey on 1% population of Nanjing in 2015. (2016). Retrieved
November 15 2016 http://www.njtj.gov.cn/
The Data of Sampling Survey on 1% population of Xuzhou in 2015. (2016). Retrieved
November 15 2016, from Xuzhou Statistics
http://tj.xz.gov.cn/TJJ/tjgb/20160518/011_d1590f6b-ac70-4ba7-9eeb-
4bbf751b2c57.htm
Davy, J. (2006). Assessing public participation strategies in low-income housing: The
Mamre housing project. Stellenbosch: University of Stellenbosch.
Day, J. (2013). Effects of Involuntary Residential Relocation on Household Satisfaction
in Shanghai, China. Urban Policy and Research, 31(1), 93-117. doi:Doi
10.1080/08111146.2012.757736
Dekker, K., de Vos, S., Musterd, S., & van Kempen, R. (2011). Residential Satisfaction
in Housing Estates in European Cities: A Multi-level Research Approach.
Housing Studies, 26(4), 479-499. doi:Pii 936571553
Doi 10.1080/02673037.2011.559751
Dennis Lord, J., & Rent, G. S. (1987). Residential satisfaction in scattered-site public
housing projects. The Social Science Journal, 24(3), 287-302. doi:10.1016/0362-
3319(87)90077-2
Dittmann, J., & Goebel, J. (2010). Your House, Your Car, Your Education: The
Socioeconomic Situation of the Neighborhood and its Impact on Life
Satisfaction in Germany. Soc Indic Res, 96(3), 497-513. doi:10.1007/s11205-
009-9489-7
Djebarni, R., & Al-Abed, A. (2000). Satisfaction level with neighbourhoods in low-
income public housing in Yemen. Property Management, 18(4), 230-242.
doi:10.1108/02637470010348744
Fang, Y. P. (2006). Residential satisfaction, moving intention and moving behaviours: A

347
study of redeveloped neighbourhoods in inner-city Beijing. Housing Studies,
21(5), 671-694. doi:Doi 10.1080/02673030600807217
Fauth, R. C., Leventhal, T., & Brooks-Gunn, J. (2004). Short-term effects of moving
from public housing in poor to middle-class neighborhoods on low-income,
minority adults' outcomes. Soc Sci Med, 59(11), 2271-2284.
doi:10.1016/j.socscimed.2004.03.020
Field, A. (2009). Discovering statistics using SPSS: Sage publications.
Field, A. (2013). Discovering statistics using IBM SPSS statistics: Sage.
Fishbein, M., & Ajzen, I. (1974). Attitudes towards objects as predictors of single and
multiple behavioral criteria. Psychological review, 81(1), 59-74.
doi:10.1037/h0035872
Fitzpatrick, S., & Stephens, M. (2008). The future of social housing: Shelter.
Fowler Jr, F. J. (2013). Survey research methods: Sage publications.
Francescato, G., Weidemann, S., & Anderson, J. (1989). Evaluating the Built
Environment from the Users’ Point of View: An Attitudinal Model of Residential
Satisfaction. In W. E. Preiser (Ed.), Building Evaluation (pp. 181-198): Springer
US.
Fraser, T. M. (1968). Relative Habitability of Dwellings: A Conceptual View.
Fried, M. (1973). Some sources of residential satisfaction in an urban slum.
Fried, M., & Gleicher, P. (1961). Some Sources of Residential Satisfaction in an Urban
Slum. Journal of the American Institute of Planners, 27(4), 305-315.
doi:10.1080/01944366108978363
Full text: Report on China's economic, social development plan. (2015). [Press release].
Retrieved from http://www.npc.gov.cn/englishnpc/Special_12_3/2015-
03/19/content_1930758.htm
Galster, G. (1987). Identifying the Correlates of Dwelling Satisfaction - an Empirical
Critique. Environment and Behavior, 19(5), 539-568. doi:Doi
10.1177/0013916587195001
Galster, G. C. (1980). Consumers' Housing Satisfaction, Improvement Priorities, and
Needs: Center for Real Estate Education and Research, College of
Administrative Science, the Ohio State University.
Galster, G. C. (1985). Evaluating Indicators for Housing Policy - Residential
Satisfaction Vs Marginal Improvement Priorities. Soc Indic Res, 16(4), 415-448.
doi:Doi 10.1007/Bf00333289
Galster, G. C., & Hesser, G. W. (2016). Residential Satisfaction. Environment and
Behavior, 13(6), 735-758. doi:10.1177/0013916581136006
Gans, H. J. (1962). The urban villagers: group and class in the life of Italian-
Americans: Free Press of Glencoe.
Gans, H. J. (1967). The Levittowners: Ways of Life & Politics in a New Suburban
Community: Penguin.
Gans, H. J. (1982). Urban Villagers, Rev & Exp Ed: Free Press.
Ge, J., & Hokao, K. (2006). Research on residential lifestyles in Japanese cities from the
viewpoints of residential preference, residential choice and residential
satisfaction. Landscape and Urban Planning, 78(3), 165-178. doi:DOI
10.1016/j.landurbplan.2005.07.004
Geng, J. C., Long, R. Y., & Chen, H. (2016). Impact of information intervention on
travel mode choice of urban residents with different goal frames: A controlled
trial in Xuzhou, China. Transportation Research Part a-Policy and Practice, 91,
134-147. doi:10.1016/j.tra.2016.06.031
Gifford, R. (1987). Environmental psychology: Principles and practice. Massachusetts:
Allyn & Bacon, Inc.
Greene, J. C. (2006). Toward a methodology of mixed methods social inquiry. Research

348
in the Schools, 13(1), 93-98.
Greene, J. C. (2007). Mixed methods in social inquiry (Vol. 9): John Wiley & Sons.
Greene, J. C. (2008). Is Mixed Methods Social Inquiry a Distinctive Methodology?
Journal of Mixed Methods Research, 2(1), 7-22.
doi:10.1177/1558689807309969
Greene, J. C., Caracelli, V. J., & Graham, W. F. (1989). Toward a Conceptual
Framework for Mixed-Method Evaluation Designs. Educational Evaluation and
Policy Analysis, 11(3), 255. doi:10.2307/1163620
Grillo, M. C., Teixeira, M. A., & Wilson, D. C. (2010). Residential Satisfaction and
Civic Engagement: Understanding the Causes of Community Participation. Soc
Indic Res, 97(3), 451-466. doi:10.1007/s11205-009-9511-0
Grinstein-Weiss, M., Yeo, Y., Anacker, K., Van Zandt, S., Freeze, E. B., & Quercia, R.
G. (2011). HOMEOWNERSHIP AND NEIGHBORHOOD SATISFACTION
AMONG LOW- AND MODERATE-INCOME HOUSEHOLDS. Journal of
Urban Affairs, 33(3), 247-265. doi:10.1111/j.1467-9906.2011.00549.x
Guowuyuan guanyu jiejue chengshi di shouru jiating zhufang kunnan de ruogan yijian.
(24). (2007). Retrieved from
http://www.gov.cn/xxgk/pub/govpublic/mrlm/200803/t20080328_32758.html.
Gur, M., & Dostoglu, N. (2011). Affordable Housing in Turkey: User Satisfaction in
Toki Houses. Open House International, 36(3), 49-61.
Haliloglu Kahraman, Z. E. (2008). The Relationship between squatter housing
transformation and social integration of rural migrants into urban life: A case
study in Dikmen. (Ph.D Doctoral dissertation), MIDDLE EAST TECHNICAL
UNIVERSITY, MIDDLE EAST TECHNICAL UNIVERSITY.
Haliloglu Kahraman, Z. E. (2013). Dimensions Of Housing Satisfaction: A Case Study
Based On Perceptions Of Rural Migrants Living In Dikmen. Metu Journal of the
Faculty of Architecture, 30(01), 1-27. doi:10.4305/metu.jfa.2013.1.1
Hamersma, M., Tillema, T., Sussman, J., & Arts, J. (2014). Residential satisfaction close
to highways: The impact of accessibility, nuisances and highway adjustment
projects. Transportation Research Part a-Policy and Practice, 59, 106-121.
doi:DOI 10.1016/j.tra.2013.11.004
Han, L., Shu, J.-s., Hanif, N. R., Xi, W.-j., Li, X., Jing, H.-w., & Ma, L. (2015).
Influence law of multipoint vibration load on slope stability in Xiaolongtan open
pit mine in Yunnan, China. Journal of Central South University, 22(12), 4819-
4827. doi:10.1007/s11771-015-3033-5
Hartman, C. W. (1963). Social Values and Housing Orientations. Journal of Social
Issues, 19(2), 113-131. doi:10.1111/j.1540-4560.1963.tb00443.x
HaSeongKyu. (2006). Public Rental Housing and Social Exclusion. [공공임대주택과 사회적
배제에 관한 연구]. Housing Studies, 14(3), 159-181.
Hashim, A. E., Samikon, S. A., Nasir, N. M., & Ismail, N. (2012). Assessing factors
influencing Performance of Malaysian Low-Cost Public Housing in Sustainable
Environment. Ace-Bs 2012 Bangkok, 50(0), 920-927. doi:DOI
10.1016/j.sbspro.2012.08.093
Healey, P. (2015). Citizen-generated local development initiative: recent English
experience. International Journal of Urban Sciences, 19(2), 109-118.
doi:10.1080/12265934.2014.989892
Hills, J. (2007). Ends and means: The future roles of social housing in England.
Hipp, J. R. (2009). Specifying the Determinants of Neighborhood Satisfaction: A
Robust Assessment in 24 Metropolitan Areas. Social Forces, 88(1), 395-424.
Hong, H. (2004). Relationship between Satisfaction Degree on Management for
Residents, Common Spaces and Sense of Community in High Rise Mixed-use
Residential Building. [초고층 주상복합 건물의 입주자관리, 공유공간 만족도와
349
지역공동체의식의 관계]. J. of Korean Home Management Association, 22(3), 95-
105.
Hourihan, K. (1984). Context-Dependent Models of Residential Satisfaction - an
Analysis of Housing Groups in Cork, Ireland. Environment and Behavior, 16(3),
369-393. doi:Doi 10.1177/0013916584163004
Howley, P. (2009). Attitudes towards compact city living: Towards a greater
understanding of residential behaviour. Land Use Policy, 26(3), 792-798.
doi:DOI 10.1016/j.landusepol.2008.10.004
Hu, F. (2013). Homeownership and Subjective Wellbeing in Urban China: Does Owning
a House Make You Happier? Soc Indic Res, 110(3), 951-971.
doi:10.1007/s11205-011-9967-6
Huang, Y. Q. (2012). Low-income Housing in Chinese Cities: Policies and Practices.
China Quarterly(212), 941-964. doi:Doi 10.1017/S0305741012001270
Huang, Z., & Du, X. (2015). Assessment and determinants of residential satisfaction
with public housing in Hangzhou, China. Habitat International, 47(0), 218-230.
doi:10.1016/j.habitatint.2015.01.025
Ibem, E. (2013). Accessibility of Services and Facilities for Residents in Public Housing
in Urban Areas of Ogun State, Nigeria. Urban Forum, 24(3), 407-423.
doi:10.1007/s12132-012-9185-6
Ibem, E. O., & Aduwo, E. B. (2013). Assessment of residential satisfaction in public
housing in Ogun State, Nigeria. Habitat International, 40(0), 163-175. doi:DOI
10.1016/j.habitatint.2013.04.001
Ibem, E. O., & Amole, D. (2013a). Residential Satisfaction in Public Core Housing in
Abeokuta, Ogun State, Nigeria. Soc Indic Res, 113(1), 563-581. doi:DOI
10.1007/s11205-012-0111-z
Ibem, E. O., & Amole, D. (2013b). Subjective life satisfaction in public housing in
urban areas of Ogun State, Nigeria. Cities, 35(0), 51-61. doi:DOI
10.1016/j.cities.2013.06.004
Ibem, E. O., & Amole, D. (2014). Satisfaction with Life in Public Housing in Ogun
State, Nigeria: A Research Note. Journal of Happiness Studies, 15(3), 495-501.
doi:DOI 10.1007/s10902-013-9438-7
Ibem, E. O., Opoko, A. P., Adeboye, A. B., & Amole, D. (2013). Performance
evaluation of residential buildings in public housing estates in Ogun State,
Nigeria: Users' satisfaction perspective. Frontiers of Architectural Research,
2(2), 178-190. doi:10.1016/j.foar.2013.02.001
Ilesanmi, A. O. (2010). Post-occupancy evaluation and residents' satisfaction with
public housing in Lagos, Nigeria. J Build Apprais, 6(2), 153-169.
Ivankova, N. V., & Stick, S. L. (2006). Students’ Persistence in a Distributed Doctoral
Program in Educational Leadership in Higher Education: A Mixed Methods
Study. Research in Higher Education, 48(1), 93-135. doi:10.1007/s11162-006-
9025-4
James, J. P. e. a. (2001). Predicting Residential Satisfaction: A Comparative Case Study.
Paper presented at the Proceedings of the Envrionmental Design Research
Association 32nd Annual Meeting.
James, R. N. (2007). Multifamily housing characteristics and tenant satisfaction.
Journal of Performance of Constructed Facilities, 21(6), 472-480. doi:Doi
10.1061/(Asce)0887-3828(2007)21:6(472)
James, R. N. (2008). Impact of Subsidized Rental Housing Characteristics on
Metropolitan Residential Satisfaction. Journal of Urban Planning and
Development-Asce, 134(4), 166-172. doi:Doi 10.1061/(Asce)0733-
9488(2008)134:4(166)
Jansen, S. J. (2013a). Why is Housing Always Satisfactory? A Study into the Impact of

350
Preference and Experience on Housing Appreciation. Soc Indic Res, 113(3), 785-
805. doi:10.1007/s11205-012-0114-9
Jansen, S. J. T. (2013b). Why is Housing Always Satisfactory? A Study into the Impact
of Cognitive Restructuring and Future Perspectives on Housing Appreciation.
Soc Indic Res, 116(2), 353-371. doi:10.1007/s11205-013-0303-1
Jia, Y. (22nd June 2011). 对中央文献翻译的几点思考 Commentary on Party Central's
Document Translation. 中国翻译 Chinese Translators Journal. Retrieved from
http://www.cctb.net/bygz/wxfy/201106/t20110616_285276.htm#
Johnson, R. B., & Onwuegbuzie, A. J. (2004). Mixed Methods Research: A Research
Paradigm Whose Time Has Come. Educational Researcher, 33(7), 14-26.
doi:10.3102/0013189x033007014
Johnson, R. B., Onwuegbuzie, A. J., & Turner, L. A. (2007). Toward a Definition of
Mixed Methods Research. Journal of Mixed Methods Research, 1(2), 112-133.
doi:10.1177/1558689806298224
Kaitilla, S. (1993). Satisfaction with Public-Housing in Papua-New-Guinea - the Case
of West Taraka Housing Scheme. Environment and Behavior, 25(4), 514-545.
doi:Doi 10.1177/0013916593253005
Kang, S., & Lee, K.-H. (2007). A Research on Creating Crime-Safe Environment
Through Enforcing the Sense of Community in Urban Residential Area.
[도시주거지역에서의 근린관계 활성화를 통한 방범환경조성에 대한 연구]. Journal of the
Architectural Institute of Korea Planning & Design, 23(7), 97-106.
Kellekci, Ö. L., & Berköz, L. (2006). Mass Housing: User Satisfaction in Housing and
its Environment in Istanbul, Turkey. European Journal of Housing Policy, 6(1),
77-99. doi:10.1080/14616710600587654
Kleit, R. G. (2001a). Neighborhood relations in suburban scattered-site and clustered
public housing. Journal of Urban Affairs, 23(3-4), 409-430. doi:Doi
10.1111/0735-2166.00097
Kleit, R. G. (2001b). The role of neighborhood social networks in scattered-site public
housing residents' search for jobs. Housing Policy Debate, 12(3), 541-573.
Knight, A., & Ruddock, L. (2009). Advanced research methods in the built environment:
John Wiley & Sons.
Lane, S., & Kinsey, J. (1980). Housing Tenure Status and Housing Satisfaction. Journal
of Consumer Affairs, 14(2), 341-365. doi:10.1111/j.1745-6606.1980.tb00674.x
Lewis-Beck, M., Bryman, A. E., & Liao, T. F. (2003). The Sage encyclopedia of social
science research methods: Sage Publications.
Li, C. (2013). Can Citizen Participation in Public Service Provision Process Ensure
Enhancement of Public Satisfaction? -An Analysis of Samples from Several
Residential Communities in Beijing, China.
Li, S. M., Zhu, Y. S., & Li, L. M. (2012). Neighborhood Type, Gatedness, and
Residential Experiences in Chinese Cities: A Study of Guangzhou. Urban
Geography, 33(2), 237-255. doi:Doi 10.2747/0272-3638.33.2.237
Li, X., Lou, K., Hanif, N. B., Xi, W., Zhou, K., He, R., . . . Gao, G. (2016).
Experimental Research Into Human Factor Analysis of Sorting Fatigue. Journal
of Computational and Theoretical Nanoscience, 13(1), 728-735.
Li, X., Zhou, W., Han, L., Xi, W. J., & Crusoe, G. E. (2014). Research on the Influence
of Excavation and Loading on Z-Direction Displacement in Surrounding Soil
Mass. Archives of Mining Sciences, 59(4), 959-970. doi:DOI 10.2478/amsc-
2014-0066
Li, Z. G., & Wu, F. L. (2013). Residential Satisfaction in China's Informal Settlements:
A Case Study of Beijing, Shanghai, and Guangzhou. Urban Geography, 34(7),
923-949. doi:Doi 10.1080/02723638.2013.778694
Liang, D., & Fang, J. (2012). Public Participation Model in Public Construction

351
Projects: A Case Study of Low-Income Housing. Lingdao Kexue(17), 18-21.
Liu, W. D., Song, Z. Y., & Liu, Z. G. (2016). Progress of economic geography in
China's mainland since 2000. Journal of Geographical Sciences, 26(8), 1019-
1040. doi:10.1007/s11442-016-1313-0
Lovejoy, K., Handy, S., & Mokhtarian, P. (2010). Neighborhood satisfaction in
suburban versus traditional environments: An evaluation of contributing
characteristics in eight California neighborhoods. Landscape and Urban
Planning, 97(1), 37-48. doi:DOI 10.1016/j.landurbplan.2010.04.010
Lu, M. (1999). Determinants of residential satisfaction: Ordered logit vs. regression
models. Growth and Change, 30(2), 264-287. doi:Doi 10.1111/0017-4815.00113
Ma, X. D., Qiu, F. D., Li, Q. L., Shan, Y. B., & Cao, Y. (2013). Spatial pattern and
regional types of rural settlements in Xuzhou City, Jiangsu Province, China.
Chinese Geographical Science, 23(4), 482-491. doi:10.1007/s11769-013-0615-8
Maclennan, D., & More, A. (1997). The future of social housing: Key economic
questions. Housing Studies, 12(4), 531-547. doi:Doi
10.1080/02673039708720914
Macnaghten, P., & Jacobs, M. (1997). Public identification with sustainable
development. Global Environmental Change, 7(1), 5-24.
doi:http://dx.doi.org/10.1016/S0959-3780(96)00023-4
Marans, R. W., & Rodgers, W. (1975). Toward an understanding of community
satisfaction. Metropolitan American. Washing-ton, DC: National Academy of
Science, 311-375.
Mason, R., & Faulkenberry, G. D. (1978). Aspirations, achievements and life
satisfaction. Soc Indic Res, 5(1-4), 133-150. doi:10.1007/bf00352925
McClure, K., Schwartz, A. F., & Taghavi, L. B. (2015). Housing Choice Voucher
Location Patterns a Decade Later. Housing Policy Debate, 25(2), 215-233.
doi:10.1080/10511482.2014.921223
McCray, J. W., & Day, S. S. (1977). Housing Values, Aspirations, and Satisfactions as
Indicators of Housing Needs. Home Economics Research Journal, 5(4), 244-
254. doi:10.1177/1077727x7700500404
McCrea, R., Stimson, R., & Western, J. (2005). Testing a moderated model of
satisfaction with urban living using data for Brisbane-South East Queensland,
Australia. Soc Indic Res, 72(2), 121-152. doi:DOI 10.1007/s11205-004-2211-x
Mertens, D., Bazeley, P., Bowleg, L., Fielding, N., Maxwell, J., Molina-Azorin, J., &
Niglas, K. (2016). The future of mixed methods: A five year projection to 2020.
Mixed methods international research association.
Michelson, W. (1966). Research Note: An Empirical Analysis of Urban Environmental
Preferences. Journal of the American Institute of Planners, 32(6), 355-360.
doi:10.1080/01944366608978510
Michelson, W. (1977). Environmental choice, human behavior, and residental
satisfaction. New York: Oxford University Press.
Michelson, W. M. (1970). Man and his urban environment: a sociological approach:
Addison-Wesley Pub. Co.
Mohit, M. A., & Azim, M. (2012a). Assessment of Residential Satisfaction with Public
Housing in Hulhumale', Maldives. In M. Y. Abbas, A. F. I. Bajunid, & N. F. N.
Azhari (Eds.), Ace-Bs 2012 Bangkok (Vol. 50, pp. 756-770).
Mohit, M. A., & Azim, M. (2012b). Assessment of Residential Satisfaction with Public
Housing in Hulhumale’, Maldives. Procedia - Social and Behavioral Sciences,
50(0), 756-770. doi:10.1016/j.sbspro.2012.08.078
Mohit, M. A., Ibrahim, M., & Rashid, Y. R. (2010). Assessment of residential
satisfaction in newly designed public low-cost housing in Kuala Lumpur,
Malaysia. Habitat International, 34(1), 18-27.

352
doi:10.1016/j.habitatint.2009.04.002
Mohit, M. A., & Mahfoud, A. K. A. (2015). Appraisal of residential satisfaction in
double-storey terrace housing in Kuala Lumpur, Malaysia. Habitat
International, 49, 286-293. doi:10.1016/j.habitatint.2015.06.001
Mohit, M. A., & Nazyddah, N. (2011). Social housing programme of Selangor Zakat
Board of Malaysia and housing satisfaction. Journal of Housing and the Built
Environment, 26(2), 143-164. doi:DOI 10.1007/s10901-011-9216-y
Mohit, M. A., & Zaiton, A. R. (2012). Assessment of residential satisfaction in high-rise
condominium and terrace housing: case studies from Kuala Lumpur.
Morris, E. W., Crull, S. R., & Winter, M. (1976). Housing Norms, Housing Satisfaction
and the Propensity to Move. Journal of Marriage and Family, 38(2), 309-320.
doi:10.2307/350390
Morris, E. W., Woods, M. E., & Jacobson, A. L. (1972). The Measurement of Housing
Quality. Land Economics, 48(4), 383. doi:10.2307/3145315
Morris, W., & Winter, M. (1978). Housing, family, and society: Wiley.
Morse, J. M. (2003). Principles of mixed methods and multimethod research design.
Handbook of mixed methods in social and behavioral research, 189-208.
Moser, G. (2009). Quality of life and sustainability: Toward person–environment
congruity. Journal of Environmental Psychology, 29(3), 351-357.
doi:10.1016/j.jenvp.2009.02.002
Nam, & Choi. (2007). A Study on the Determinants of Residential Satisfaction of
National Rental Housing Residents. [국민임대주택 주거만족도의 영향요인에 대한 연구].
The Journal of Korea Real Estate Analysists Association, 13(3), 89-103.
Onibokun, A. G. (1974). Evaluating Consumers' Satisfaction with Housing: An
Application of a Systems Approach. Journal of the American Institute of
Planners, 40(3), 189-200. doi:10.1080/01944367408977468
Onibokun, A. G. (1976). Social System Correlates of Residential Satisfaction.
Environment and Behavior, 8(3), 323-344. doi:10.1177/136327527600800301
Oxley, M. (2000). Future of Social Housing: Learning from Europe: Institute for Public
Policy Research.
Paris, D. E. (2006). Impact of property management services on affordable housing
residents in Atlanta, Georgia. Journal of Performance of Constructed Facilities,
20(3), 222-228. doi:Doi 10.1061/(Asce)0887-3828(2006)20:3(222)
Paris, D. E., & Kangari, R. (2005). Multifamily affordable housing: Residential
satisfaction. Journal of Performance of Constructed Facilities, 19(2), 138-145.
doi:DOI 10.1061/(asce)0887-3828(2005)19:2(138)
Permentier, M., Bolt, G., & van Ham, M. (2011). Determinants of Neighbourhood
Satisfaction and Perception of Neighbourhood Reputation. Urban Studies, 48(5),
977-996. doi:Doi 10.1177/0042098010367860
Philips, D. (1967). Comfort in home'. Royal Society of Health Journal, 87, 237-246.
Poindexter, G. C. (1999). Who Gets the Final No-Tenant Participation in Public
Housing Redevelopment. Cornell JL & Pub. Pol'y, 9, 659.
Posthumus, H., Bolt, G., & van Kempen, R. (2014). Victims or Victors? The Effects of
Forced Relocations on Housing Satisfaction in Dutch Cities. Journal of Urban
Affairs, 36(1), 13-32. doi:Doi 10.1111/Juaf.12011
Rent, G. S., & Rent, C. S. (1978). Low-Income Housing: Factors Related to Residential
Satisfaction. Environment and Behavior, 10(4), 459-488.
doi:10.1177/001391657801000401
Salleh, A. G. (2008). Neighbourhood factors in private low-cost housing in Malaysia.
Habitat International, 32(4), 485-493. doi:DOI 10.1016/j.habitatint.2008.01.002
Schuurman, R., & He, R. (2013). Economic Overview of Jiangsu Province. from
Netherlands Business Support Office Nanjing
353
http://china.nlambassade.org/binaries/content/assets/postenweb/c/china/zaken-
doen-in-china/2014/economic-overview-of-jiangsu-province.pdf
Sheng, Y. K. (1990). Community Participation in Low-Income Housing Projects -
Problems and Prospects. Community Development Journal, 25(1), 56-64.
doi:DOI 10.1093/cdj/25.1.56
Sirgy, M. J., & Cornwell, T. (2002). How Neighborhood Features Affect Quality of Life.
Soc Indic Res, 59(1), 79-114. doi:10.1023/A:1016021108513
Speare, A. (1974). Residential satisfaction as an intervening variable in residential
mobility. Demography, 11(2), 173-188. doi:10.2307/2060556
The Statistical Bulletin of National Economy and Social Development of Xuzhou 2015.
(2016). Available from Xuzhou Statistics, from Xuzhou Statistics
http://tj.xz.gov.cn/TJJ/tjgb/20160317/011_5aea3693-6190-40a1-8462-
31af6aef5827.htm
Stephens, M. (2010). Locating Chinese urban housing policy in an international context.
Urban Studies, 47(14), 2965-2982. doi:10.1177/0042098009360219
Tan, K., Zhou, S. Y., Li, E. Z., & Du, P. J. (2015). Assessing the impact of urbanization
on net primary productivity using multi-scale remote sensing data: a case study
of Xuzhou, China. Frontiers of Earth Science, 9(2), 319-329.
doi:10.1007/s11707-014-0454-7
Tao, L., Wong, F. K. W., & Hui, E. C. M. (2014). Residential satisfaction of migrant
workers in China: A case study of Shenzhen. Habitat International, 42, 193-202.
doi:DOI 10.1016/j.habitatint.2013.12.006
Tashakkori, A., & Teddlie, C. (2010). Sage handbook of mixed methods in social &
behavioral research: Sage.
Teck-Hong, T. (2012). Housing satisfaction in medium- and high-cost housing: The case
of Greater Kuala Lumpur, Malaysia. Habitat International, 36(1), 108-116.
doi:DOI 10.1016/j.habitatint.2011.06.003
Tian, J. X., & Cui, Y. Y. (2009). The Evaluation Research of Public Housing Based on
the Public Satisfaction. In H. Lan (Ed.), 2009 International Conference on
Management Science & Engineering (pp. 1901-1906).
Tognoli, J. (1987). Residential environments. Handbook of environmental psychology,
1, 655-690.
Trujillo, J. L., & Parilla, J. (2016). REDEFINING GLOBAL CITIES-THE SEVEN
TYPES OF GLOBAL METRO ECONOMIES. from The Brookings Institution
https://www.brookings.edu/research/redefining-global-cities/
Tsenkova, S., & Turner, B. (2004). The Future of Social Housing in Eastern Europe:
Reforms in Latvia and Ukraine. European Journal of Housing Policy, 4(2), 133-
149. doi:10.1080/1461671042000269001
Turkoglu, H. D. (1997). Residents' satisfaction of housing environments: the case of
Istanbul, Turkey. Landscape and Urban Planning, 39(1), 55-67. doi:Doi
10.1016/S0169-2046(97)00040-6
Ukoha, O. M., & Beamish, J. O. (1997). Assessment of residents' satisfaction with
public housing in Abuja, Nigeria. Habitat International, 21(4), 445-460. doi:Doi
10.1016/S0197-3975(97)00017-9
Varady, D. P. (1983). Determinants of Residential-Mobility Decisions - the Role of
Government Services in Relation to Other Factors. Journal of the American
Planning Association, 49(2), 184-199. doi:Doi 10.1080/01944368308977063
Varady, D. P., & Carrozza, M. A. (2000). Toward a better way to measure customer
satisfaction levels in public housing: A report from Cincinnati. Housing Studies,
15(6), 797-825. doi:10.1080/02673030020002555
Varady, D. P., & Preiser, W. F. E. (1998). Scattered-site public housing and housing
satisfaction - Implications for the new public housing program. Journal of the

354
American Planning Association, 64(2), 189-207. doi:Doi
10.1080/01944369808975975
Veenhoven, R. (1996). Developments in satisfaction-research. Soc Indic Res, 37(1), 1-
46. doi:Doi 10.1007/Bf00300268
Vera-Toscano, E., & Ateca-Amestoy, V. (2008). The relevance of social interactions on
housing satisfaction. Soc Indic Res, 86(2), 257-274. doi:DOI 10.1007/s11205-
007-9107-5
Wahi, N. B., bin Junaini, S., & Ieee. (2012). Residential Satisfaction And The
Propensity To Stay: An Analysis Of Potential Movers From Low Cost House
Ieee Symposium on Business, Engineering and Industrial Applications (pp. 585-
590).
Wang, Zhang, & Wu. (2015). Intergroup neighbouring in urban China: Implications for
the social integration of migrants. Urban Studies, 53(4), 651-668.
doi:10.1177/0042098014568068
Wang, Y. P., & Murie, A. (1999). Commercial housing development in urban China.
Urban Studies, 36(9), 1475-1494. doi:10.1080/0042098992881
Wang, Y. P., & Murie, A. (2011). The new affordable and social housing provision
system in China: implications for comparative housing studies. International
Journal of Housing Policy, 11(3), 237-254.
Webler, T., Tuler, S., & Krueger, R. (2001). What is a good public participation process?
Five perspectives from the public. Environ Manage, 27(3), 435-450.
doi:10.1007/s002670010160
Weidemann, S., & Anderson, J. (1985). A Conceptual Framework for Residential
Satisfaction. In I. Altman & C. Werner (Eds.), Home Environments (Vol. 8, pp.
153-182): Springer US.
Wiesenfeld, E. (1995). La vivienda: su evaluación desde la psicología ambiental: Cdch
Ucv.
Wong, K.-k., & Siu, W.-m. (2002). The Perceived Environmental Quality of Commodity
Housing in China: Guangzhou and Beijing Case Study. Asian Geographer, 21(1-
2), 67-83. doi:10.1080/10225706.2002.9684086
Wu, C. H. (2008). The role of perceived discrepancy in satisfaction evaluation. Soc
Indic Res, 88(3), 423-436. doi:DOI 10.1007/s11205-007-9200-9
Wu, F. L. (1996). Changes in the structure of public housing provision in urban China.
Urban Studies, 33(9), 1601-1627. doi:Doi 10.1080/0042098966529
Xi, W., & Hanif, N. R. (2016). Neighbourhood Cohesion of Medium-Low Cost
Commodity Housing in Bandar Sunway, Selangor, Malaysia: A Case Study of
Mentari Court Apartment. Paper presented at the 2016 APNHR (The Asia-
Pacific Network for Housing Research) Conference, Sun Yat-sen University,
Guangzhou, China.
Xuzhou's Annual GDP. (2015). Retrieved November 17 2016, from Xuzhou Statistics
http://tj.xz.gov.cn/TJJ/sjfb/004001/
Xuzhou Major Economic Indicators (2013). (2013, 2013). Xuzhou (Jiangsu) City
Information Retrieved from
http://www.chinaknowledge.com/CityInfo/City.aspx?Region=Coastal&City=Xu
zhou
Xuzhou Transformation and Development Practices. (2016, October 20th 2016).
Retrieved from http://dpc.xz.gov.cn/fgw/ywgz/20161020/004023_79799c52-
243c-465e-a457-3b7389d8919f.htm
Yang, X., Chen, L., Li, Y., Xi, W., & Chen, L. (2015). Rule-based land use/land cover
classification in coastal areas using seasonal remote sensing imagery: a case
study from Lianyungang City, China. Environmental Monitoring and
Assessment, 187(7), 449. doi:10.1007/s10661-015-4667-3

355
Yung, B., & Lee, F.-P. (2012). “Right to Housing” in Hong Kong: Perspectives from the
Hong Kong Community. Housing, Theory and Society, 29(4), 401-419.
doi:10.1080/14036096.2012.655382
Zanuzdana, A., Khan, M., & Kraemer, A. (2013). Housing Satisfaction Related to
Health and Importance of Services in Urban Slums: Evidence from Dhaka,
Bangladesh. Soc Indic Res, 112(1), 163-185. doi:DOI 10.1007/s11205-012-
0045-5

356
LIST OF PUBLICATIONS AND PAPERS PRESENTED
Paper Presented at Conference
Xi and Hanif (2016)
Xi, W., & Hanif, N. R. (2016). Neighbourhood Cohesion of Medium-Low Cost
Commodity Housing in Bandar Sunway, Selangor, Malaysia: A Case Study of
Mentari Court Apartment. Paper presented at the 2016 APNHR (The Asia-
Pacific Network for Housing Research) Conference, Sun Yat-sen University,
Guangzhou, China.
The first page at p.460 (Appendix F)

Department of Estate Management Xi Wenjia BHA080004
357
Appendix A
_______________________________________________________________________________
FOR RESEARCHER USE
Name of Habitant: (Optional)
Name of Living Place:
INFORMATION: I, Xi Wenjia who is currently pursuing PhD in the Department
of Estate Management, Faculty of Built Environment, and the University of
Malaya, am going to conduct a research on Assessment of Residential Satisfaction
in the Three-Phases-in-use of Low-Cost Housing (also referred to here as Jingji
Shiyong Fang in Chinese) in Xuzhou city, Jiangsu Province, China, which is also
one important part of my PhD thesis named as The Residential Satisfaction of the
Low-Cost housing in the new second-tier city of Jiangsu Province, China: An
Example of Xuzhou City
This PhD research is prepared to fulfil the research gap where the current studies
could not measure the residential satisfaction in the above-mentioned projects by
way of applying the scientific research methods. In addition, this PhD research
which is going to indicate what the real residential environment of the three-
phases-in-use low-cost housing projects in Xuzhou city are will recommend the
city government to give further amendments regarding the residential satisfactions
on the future improving and planning of the existing and new low-cost housing
projects.
The Objectives of this Quantitative Research are:
1. To identify the level of residential satisfactions perceived by the residents
across the three-phases-in-use low-cost housing projects in Xuzhou city,
Jiangsu Province, China
2. To examine the factors which influence the level of residential satisfactions
of the inhabitants across the three-phases-in-use low-cost housing projects
in Xuzhou city
3. To find out the key predictors/determinants whose improvements can
enhance the level of residential satisfactions of the residents across the
three-phases-in-use low-cost housing projects in Xuzhou city
Form No. :
Date :

Department of Estate Management Xi Wenjia BHA080004
358
PART A: RESPONDENT’S INDIVIDUAL AND HOUSEHOLD’S SOCIO-
ECONOMIC CHARACTERISTICS
INSTRUCTION: Please tick (√) your answer.
QA1. Gender
1. Male 2. Female
QA2. Age
1. Age 21 – 30 3. Age 41 – 50 5. Above Age 60
2. Age 31 – 40 4. Age 51 – 60
QA3. Educational attainment
1. Primary School
2. Junior Middle School
3. Senior Middle School
4. Diploma
5. Bachelor Degree
6. Master Degree and above
QA4. Marital Status
1. Single
2. Married
3. Widowed/Divorced
QA5. Household size
1. 1 people
2. 2 people
3. 3 people
4. 4 people
5. 5 people and above
QA6. What is your occupation (sector)?
1. Government servant
2. State-Owned Enterprise (SOE)
3. Collective-Owned Enterprise (COE)
4. Private business
5. Own business
QA7. What is your occupation type?
1. Management & Professional
2. Technical & Administrative Support
3. Services & Operation
4. Others

Department of Estate Management Xi Wenjia BHA080004
359
QA8. How much is your household’s monthly net income (Include every
people living in this house)? (Including salary, allowances and bonuses after
deduction of income tax and EPF)
1. RMB0 – 1,999
2. RMB2,000 – 3,999
3. RMB4,000 – 5,999
4. RMB6,000 – 7,999
5. above RMB 8,000
QA9. Floor level
1. 1
st floor
2. 2nd
floor
3. 3rd
floor
4. 4th
floor
5. 5th
floor
6. 6th
floor
QA10. Length of Your Residence
1. <=3 years
2. >3, <=5 years
3. >5, <=7 years
4. >7, <=9 years
QA11. Your Main Mean of
Transportation
1. By Cycling (Electric Bicycle/Bicycle)
2. By Driving
3. By Bus
4. By Foot
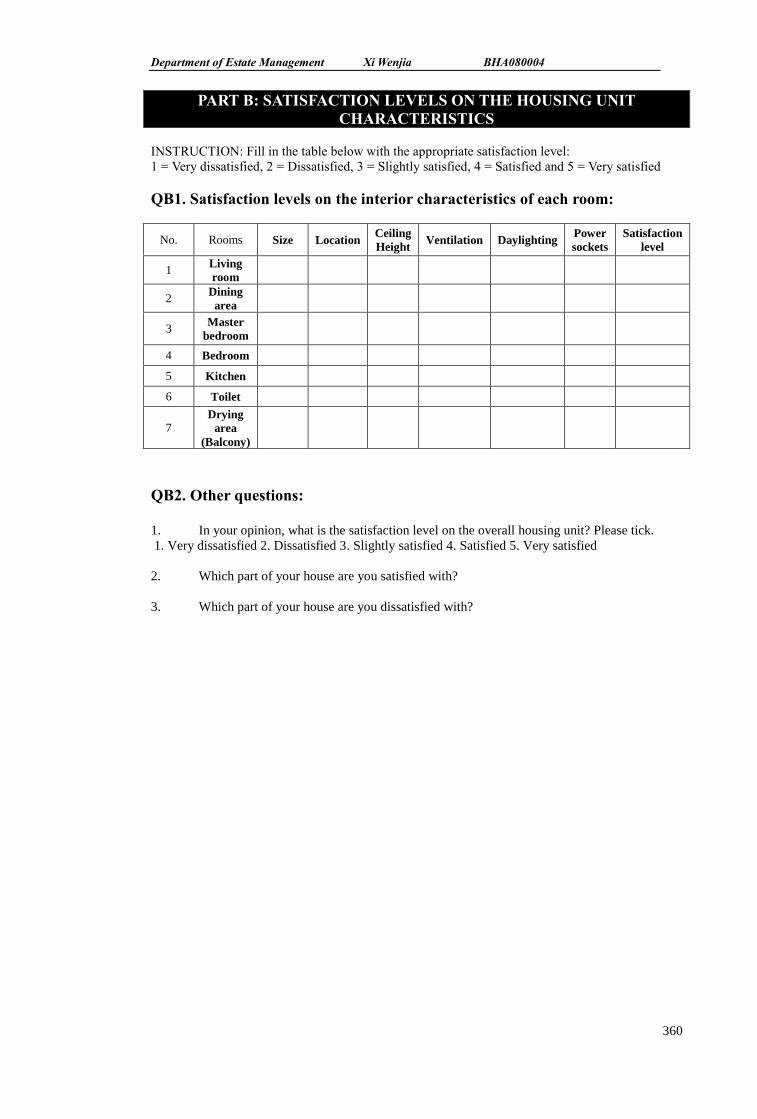
Department of Estate Management Xi Wenjia BHA080004
360
INSTRUCTION: Fill in the table below with the appropriate satisfaction level:
1 = Very dissatisfied, 2 = Dissatisfied, 3 = Slightly satisfied, 4 = Satisfied and 5 = Very satisfied
QB1. Satisfaction levels on the interior characteristics of each room:
No. Rooms Size Location Ceiling
Height Ventilation Daylighting
Power
sockets
Satisfaction
level
1 Living
room
2 Dining
area
3 Master
bedroom
4 Bedroom
5 Kitchen
6 Toilet
7 Drying
area
(Balcony)
QB2. Other questions:
1. In your opinion, what is the satisfaction level on the overall housing unit? Please tick.
1. Very dissatisfied 2. Dissatisfied 3. Slightly satisfied 4. Satisfied 5. Very satisfied
2. Which part of your house are you satisfied with?
3. Which part of your house are you dissatisfied with?
PART B: SATISFACTION LEVELS ON THE HOUSING UNIT
CHARACTERISTICS

Department of Estate Management Xi Wenjia BHA080004
361
INSTRUCTION: Fill in the table below with the appropriate satisfaction level:
1 = Very dissatisfied, 2 = Dissatisfied, 3 = Slightly satisfied, 4 = Satisfied and 5 = Very satisfied
QC1. Satisfaction levels on the supporting services provided within the
housing unit:
No. Types of Housing Unit
Supporting Services
When
moving into
the room
The Maintenance
after moving into
the room
Satisfaction level
1 Drain
2
Electrical &
Telecommunication wiring
(fixed-line telephone, television,
and internet)
QC2. Satisfaction levels on the supporting services provided around the
housing unit
No.
Types of
Housing Unit
Supporting
Services
Numbers of Firefighting
equipment
Use of Firefighting equipment
Training Course
Satisfaction
level
1 Firefighting
equipment
No.
Types of
Housing Unit
Supporting
Services
Numbers of Street
Lighting Brightness of Street Lighting
Satisfaction
level
2 Street lighting
No.
Types of
Housing Unit
Supporting
Services
Size Location Lighting Cleanness Satisfaction
level
3 Staircases
4 Corridor
No.
Types of
Housing Unit
Supporting
Services
Garbage collection Management of Garbage
(house)
Satisfaction
level
5 Garbage
disposal
QC3. Other questions:
1. What is your satisfaction level on the overall supporting services provided within and
around the housing unit? (Please tick)
1. Very dissatisfied 2. Dissatisfied 3. Slightly satisfied 4. Satisfied 5. Very satisfied
2. What other services do you suggest that need to be provided within and around the
housing unit?
PART C: SATISFACTION LEVELS ON THE HOUSING UNIT
SUPPORTING SERVICES

Department of Estate Management Xi Wenjia BHA080004
362
INSTRUCTION: Fill in the table below with the appropriate satisfaction level:
1 = Very dissatisfied, 2 = Dissatisfied, 3 = Slightly satisfied, 4 = Satisfied and 5 = Very satisfied
QD1. Satisfaction levels on the housing estate supporting facilities within the
housing area:
No. Housing Estate
Supporting Facilities Number Condition Location Cleanness
Satisfaction
Level
1 Open space
2 Children’s
playground
3 Parking facilities
(electric
Bicycle/Bicycle/car)
4 Perimeter road
5 Pedestrian walkways
6 Local Shops
7 Local Kindergarten
8 Fitness equipment
QD2. Other questions:
1. What is your satisfaction level on the overall housing estate supporting facilities within the
housing area? (Please tick)
1 = Very dissatisfied, 2 = Dissatisfied, 3 = Slightly satisfied, 4 = Satisfied and 5 = Very satisfied
2. What are other important facilities that need to be provided in the housing area?
PART D: SATISFACTION LEVELS ON THE HOUSING ESTATE
SUPPORTING FACILITIES
WITHIN THE HOUSING AREA

Department of Estate Management Xi Wenjia BHA080004
363
INSTRUCTION: Fill in the table below with the appropriate satisfaction level:
1 = Very dissatisfied, 2 = Dissatisfied, 3 = Slightly satisfied, 4 = Satisfied and 5 = Very satisfied
QE1a. Satisfaction levels on the social environment characteristics of
neighbourhood within the housing area:
No. Social Environment
characteristics of Neighbourhood
Residents
Involvement/
Participation
Social
Exclusion
Satisfaction
level
1
Community Relationship
(community committee-
residents/social cohesion/social
harmony)
No. Social Environment
characteristics of Neighbourhood
level of
Neighbourhood
Noise
level of
Crowd Noise
Satisfaction
level
2 Quietness of the housing estate
No. Social Environment
characteristics of Neighbourhood Frequency of
Occurrence Seriousness
Satisfaction
level
3 Local Crime situation
4 Local Accident situation
No. Social Environment
characteristics of Neighbourhood Number of
Security Guards
Frequency of
Security
Patrols
Satisfaction
level
5 Local Security control
QE1b. Satisfaction levels on the overall social environment characteristics of
neighbourhood:
1. What is your satisfaction level on the overall social environment characteristics of
neighbourhood within the housing area? (Please tick)
1 = Very dissatisfied, 2 = Dissatisfied, 3 = Slightly satisfied, 4 = Satisfied and 5 = Very satisfied
QE2a. Satisfaction levels on the spatial location characteristics of
neighbourhood:
No. Spatial Location characteristics
of Neighbourhood Distance Convenience
Satisfaction
level
6 Resident's Workplace
7 Community Clinic
8 Nearest General Hospital
9 Local Police Station
10 Nearest School
11 Local Market
12 Nearest Fire Station
13 Nearest Bus/Taxi Station
14 Urban Centre
PART E: SATISFACTION LEVELS ON THE NEIGHBOURHOOD
CHARACTERISTICS

Department of Estate Management Xi Wenjia BHA080004
364
QE2b. Other questions:
1. What is your satisfaction level on the overall spatial location characteristics of
neighbourhood? (Please tick)
1 = Very dissatisfied, 2 = Dissatisfied, 3 = Slightly satisfied, 4 = Satisfied and 5 = Very satisfied
2. What are other important neighbourhood facilities that need to be provided outside the
housing area?
~~~THANK YOU~~~
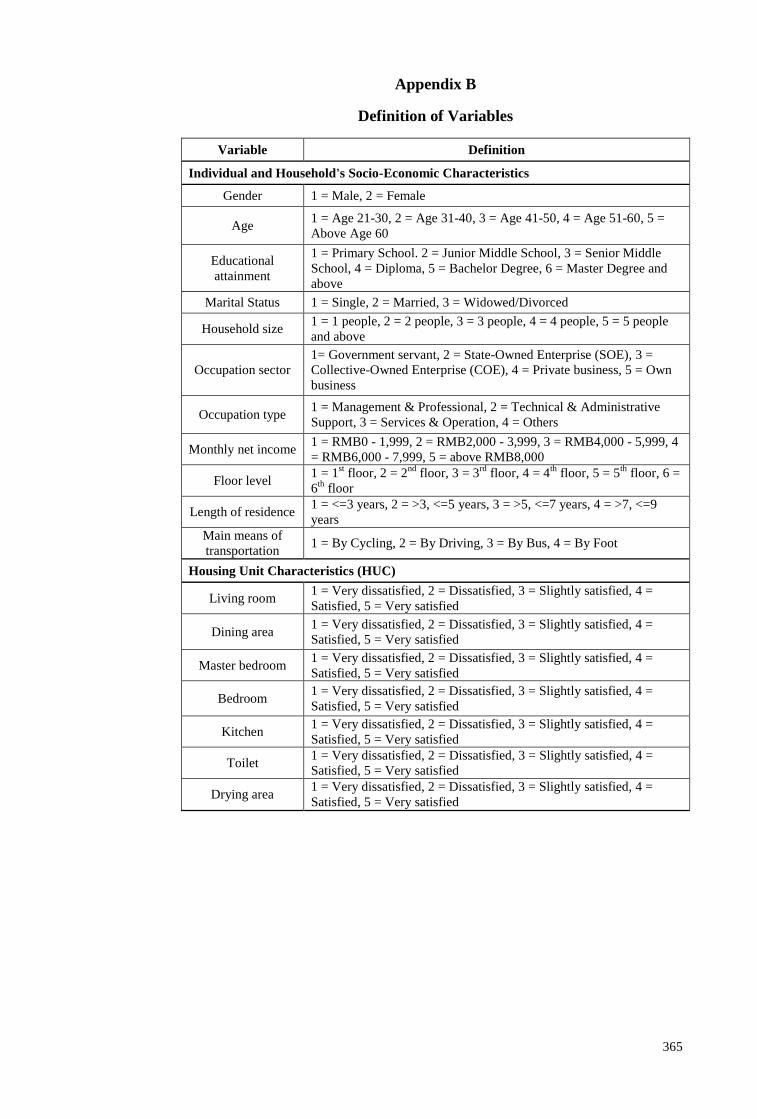
365
Appendix B
Definition of Variables
Variable Definition
Individual and Household's Socio-Economic Characteristics
Gender 1 = Male, 2 = Female
Age 1 = Age 21-30, 2 = Age 31-40, 3 = Age 41-50, 4 = Age 51-60, 5 =
Above Age 60
Educational
attainment
1 = Primary School. 2 = Junior Middle School, 3 = Senior Middle
School, 4 = Diploma, 5 = Bachelor Degree, 6 = Master Degree and
above
Marital Status 1 = Single, 2 = Married, 3 = Widowed/Divorced
Household size 1 = 1 people, 2 = 2 people, 3 = 3 people, 4 = 4 people, 5 = 5 people
and above
Occupation sector
1= Government servant, 2 = State-Owned Enterprise (SOE), 3 =
Collective-Owned Enterprise (COE), 4 = Private business, 5 = Own
business
Occupation type 1 = Management & Professional, 2 = Technical & Administrative
Support, 3 = Services & Operation, 4 = Others
Monthly net income 1 = RMB0 - 1,999, 2 = RMB2,000 - 3,999, 3 = RMB4,000 - 5,999, 4
= RMB6,000 - 7,999, 5 = above RMB8,000
Floor level 1 = 1
st floor, 2 = 2
nd floor, 3 = 3
rd floor, 4 = 4
th floor, 5 = 5
th floor, 6 =
6th
floor
Length of residence 1 = <=3 years, 2 = >3, <=5 years, 3 = >5, <=7 years, 4 = >7, <=9
years
Main means of
transportation 1 = By Cycling, 2 = By Driving, 3 = By Bus, 4 = By Foot
Housing Unit Characteristics (HUC)
Living room 1 = Very dissatisfied, 2 = Dissatisfied, 3 = Slightly satisfied, 4 =
Satisfied, 5 = Very satisfied
Dining area 1 = Very dissatisfied, 2 = Dissatisfied, 3 = Slightly satisfied, 4 =
Satisfied, 5 = Very satisfied
Master bedroom 1 = Very dissatisfied, 2 = Dissatisfied, 3 = Slightly satisfied, 4 =
Satisfied, 5 = Very satisfied
Bedroom 1 = Very dissatisfied, 2 = Dissatisfied, 3 = Slightly satisfied, 4 =
Satisfied, 5 = Very satisfied
Kitchen 1 = Very dissatisfied, 2 = Dissatisfied, 3 = Slightly satisfied, 4 =
Satisfied, 5 = Very satisfied
Toilet 1 = Very dissatisfied, 2 = Dissatisfied, 3 = Slightly satisfied, 4 =
Satisfied, 5 = Very satisfied
Drying area 1 = Very dissatisfied, 2 = Dissatisfied, 3 = Slightly satisfied, 4 =
Satisfied, 5 = Very satisfied
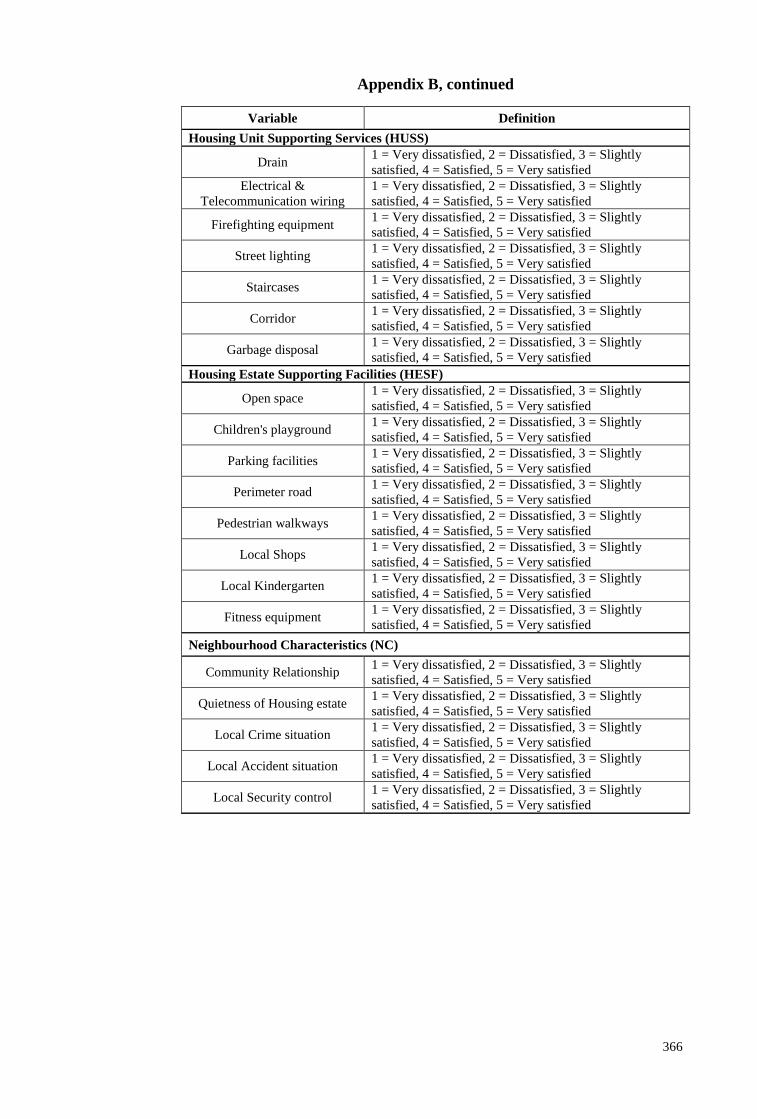
366
Appendix B, continued
Variable Definition
Housing Unit Supporting Services (HUSS)
Drain 1 = Very dissatisfied, 2 = Dissatisfied, 3 = Slightly
satisfied, 4 = Satisfied, 5 = Very satisfied
Electrical &
Telecommunication wiring
1 = Very dissatisfied, 2 = Dissatisfied, 3 = Slightly
satisfied, 4 = Satisfied, 5 = Very satisfied
Firefighting equipment 1 = Very dissatisfied, 2 = Dissatisfied, 3 = Slightly
satisfied, 4 = Satisfied, 5 = Very satisfied
Street lighting 1 = Very dissatisfied, 2 = Dissatisfied, 3 = Slightly
satisfied, 4 = Satisfied, 5 = Very satisfied
Staircases 1 = Very dissatisfied, 2 = Dissatisfied, 3 = Slightly
satisfied, 4 = Satisfied, 5 = Very satisfied
Corridor 1 = Very dissatisfied, 2 = Dissatisfied, 3 = Slightly
satisfied, 4 = Satisfied, 5 = Very satisfied
Garbage disposal 1 = Very dissatisfied, 2 = Dissatisfied, 3 = Slightly
satisfied, 4 = Satisfied, 5 = Very satisfied
Housing Estate Supporting Facilities (HESF)
Open space 1 = Very dissatisfied, 2 = Dissatisfied, 3 = Slightly
satisfied, 4 = Satisfied, 5 = Very satisfied
Children's playground 1 = Very dissatisfied, 2 = Dissatisfied, 3 = Slightly
satisfied, 4 = Satisfied, 5 = Very satisfied
Parking facilities 1 = Very dissatisfied, 2 = Dissatisfied, 3 = Slightly
satisfied, 4 = Satisfied, 5 = Very satisfied
Perimeter road 1 = Very dissatisfied, 2 = Dissatisfied, 3 = Slightly
satisfied, 4 = Satisfied, 5 = Very satisfied
Pedestrian walkways 1 = Very dissatisfied, 2 = Dissatisfied, 3 = Slightly
satisfied, 4 = Satisfied, 5 = Very satisfied
Local Shops 1 = Very dissatisfied, 2 = Dissatisfied, 3 = Slightly
satisfied, 4 = Satisfied, 5 = Very satisfied
Local Kindergarten 1 = Very dissatisfied, 2 = Dissatisfied, 3 = Slightly
satisfied, 4 = Satisfied, 5 = Very satisfied
Fitness equipment 1 = Very dissatisfied, 2 = Dissatisfied, 3 = Slightly
satisfied, 4 = Satisfied, 5 = Very satisfied
Neighbourhood Characteristics (NC)
Community Relationship 1 = Very dissatisfied, 2 = Dissatisfied, 3 = Slightly
satisfied, 4 = Satisfied, 5 = Very satisfied
Quietness of Housing estate 1 = Very dissatisfied, 2 = Dissatisfied, 3 = Slightly
satisfied, 4 = Satisfied, 5 = Very satisfied
Local Crime situation 1 = Very dissatisfied, 2 = Dissatisfied, 3 = Slightly
satisfied, 4 = Satisfied, 5 = Very satisfied
Local Accident situation 1 = Very dissatisfied, 2 = Dissatisfied, 3 = Slightly
satisfied, 4 = Satisfied, 5 = Very satisfied
Local Security control 1 = Very dissatisfied, 2 = Dissatisfied, 3 = Slightly
satisfied, 4 = Satisfied, 5 = Very satisfied

367
Appendix B, continued
Variable Definition
Neighbourhood Characteristics (NC)
Resident's Workplace 1 = Very dissatisfied, 2 = Dissatisfied, 3 = Slightly satisfied, 4 =
Satisfied, 5 = Very satisfied
Community Clinic 1 = Very dissatisfied, 2 = Dissatisfied, 3 = Slightly satisfied, 4 =
Satisfied, 5 = Very satisfied
Nearest General
Hospital
1 = Very dissatisfied, 2 = Dissatisfied, 3 = Slightly satisfied, 4 =
Satisfied, 5 = Very satisfied
Local Police Station 1 = Very dissatisfied, 2 = Dissatisfied, 3 = Slightly satisfied, 4 =
Satisfied, 5 = Very satisfied
Nearest School 1 = Very dissatisfied, 2 = Dissatisfied, 3 = Slightly satisfied, 4 =
Satisfied, 5 = Very satisfied
Local Market 1 = Very dissatisfied, 2 = Dissatisfied, 3 = Slightly satisfied, 4 =
Satisfied, 5 = Very satisfied
Nearest Fire Station 1 = Very dissatisfied, 2 = Dissatisfied, 3 = Slightly satisfied, 4 =
Satisfied, 5 = Very satisfied
Nearest Bus/Taxi
Station
1 = Very dissatisfied, 2 = Dissatisfied, 3 = Slightly satisfied, 4 =
Satisfied, 5 = Very satisfied
Urban Centre 1 = Very dissatisfied, 2 = Dissatisfied, 3 = Slightly satisfied, 4 =
Satisfied, 5 = Very satisfied
Source: Quantitative Questionnaire
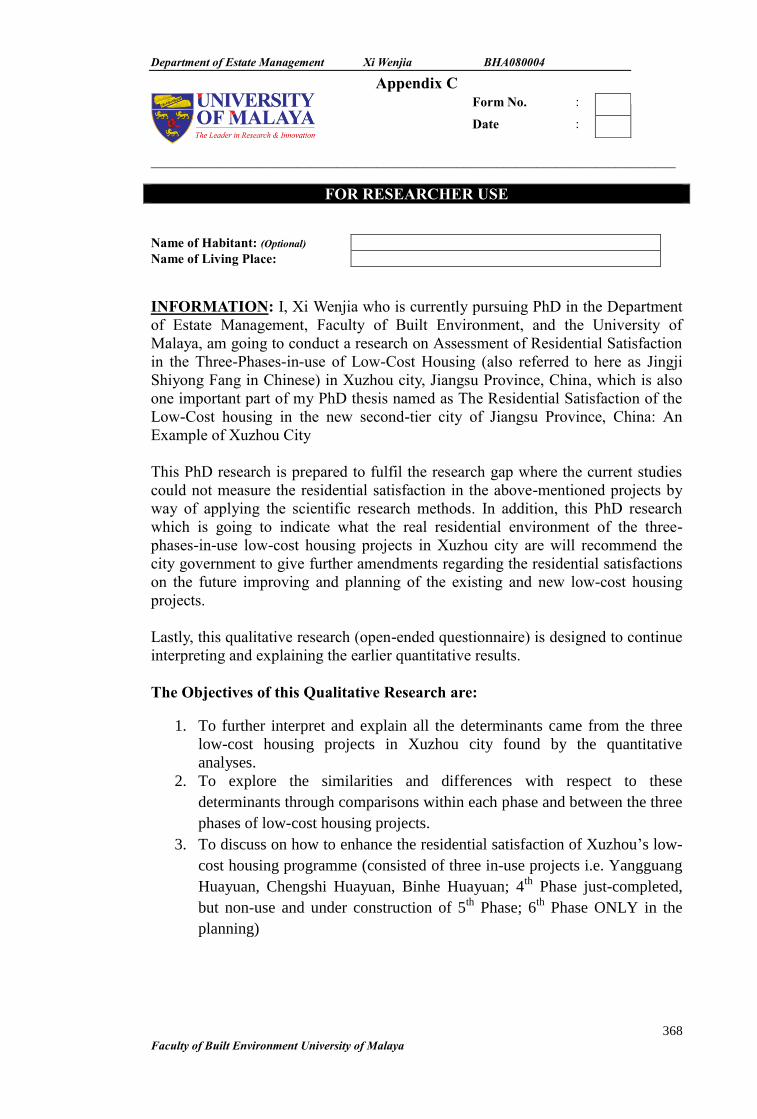
Department of Estate Management Xi Wenjia BHA080004
368
Faculty of Built Environment University of Malaya
Appendix C
_______________________________________________________________________________
FOR RESEARCHER USE
Name of Habitant: (Optional)
Name of Living Place:
INFORMATION: I, Xi Wenjia who is currently pursuing PhD in the Department
of Estate Management, Faculty of Built Environment, and the University of
Malaya, am going to conduct a research on Assessment of Residential Satisfaction
in the Three-Phases-in-use of Low-Cost Housing (also referred to here as Jingji
Shiyong Fang in Chinese) in Xuzhou city, Jiangsu Province, China, which is also
one important part of my PhD thesis named as The Residential Satisfaction of the
Low-Cost housing in the new second-tier city of Jiangsu Province, China: An
Example of Xuzhou City
This PhD research is prepared to fulfil the research gap where the current studies
could not measure the residential satisfaction in the above-mentioned projects by
way of applying the scientific research methods. In addition, this PhD research
which is going to indicate what the real residential environment of the three-
phases-in-use low-cost housing projects in Xuzhou city are will recommend the
city government to give further amendments regarding the residential satisfactions
on the future improving and planning of the existing and new low-cost housing
projects.
Lastly, this qualitative research (open-ended questionnaire) is designed to continue
interpreting and explaining the earlier quantitative results.
The Objectives of this Qualitative Research are:
1. To further interpret and explain all the determinants came from the three
low-cost housing projects in Xuzhou city found by the quantitative
analyses.
2. To explore the similarities and differences with respect to these
determinants through comparisons within each phase and between the three
phases of low-cost housing projects.
3. To discuss on how to enhance the residential satisfaction of Xuzhou’s low-
cost housing programme (consisted of three in-use projects i.e. Yangguang
Huayuan, Chengshi Huayuan, Binhe Huayuan; 4th
Phase just-completed,
but non-use and under construction of 5th
Phase; 6th
Phase ONLY in the
planning)
Form No. :
Date :

Department of Estate Management Xi Wenjia BHA080004
369
Faculty of Built Environment University of Malaya
PART A: RESPONDENT’S INDIVIDUAL AND HOUSEHOLD’s SOCIO-
ECONOMIC CHARACTERISTICS
INSTRUCTION: Please tick (√) your answer.
QA1. Gender
1. Male 2. Female
QA2. Age
1. Age 21 – 30 3. Age 41 – 50 5. Above Age 60
2. Age 31 – 40 4. Age 51 – 60
QA3. Educational attainment
1. Primary School
2. Junior Middle School
3. Senior Middle School
4. Diploma
5. Bachelor Degree
6. Master Degree and above
QA4. Marital Status
1. Single
2. Married
3. Widowed/Divorced
QA5. Household size
1. 1 people
2. 2 people
3. 3 people
4. 4 people
5. 5 people and above
QA6. What is your occupation (sector)?
1. Government servant
2. State-Owned Enterprise (SOE)
3. Collective-Owned Enterprise (COE)
4. Private business
5. Own business
QA7. What is your occupation type?
1. Management & Professional
2. Technical & Administrative Support
3. Services & Operation
4. Others
Department of Estate Management Xi Wenjia BHA080004
370
Faculty of Built Environment University of Malaya
QA8. How much is your household’s monthly net income (Include every
people living in this house)? (Including salary, allowances and bonuses after
deduction of income tax and EPF)
1. RMB0 – 1,999
2. RMB2,000 – 3,999
3. RMB4,000 – 5,999
4. RMB6,000 – 7,999
5. above RMB 8,000
QA9. Floor level
1. 1
st floor
2. 2nd
floor
3. 3rd
floor
4. 4th
floor
5. 5th
floor
6. 6th
floor
QA10. Length of Your Residence
1. <=3 years
2. >3, <=5 years
3. >5, <=7 years
4. >7, <=9 years
QA11. Your Main Means of Transportation
1. By Cycling (Electric Bicycle/Bicycle)
2. By Driving
3. By Bus
4. By Foot
QA. What do you think of your individual and household’s socio-economic
characteristics have affected your residential satisfaction such as occupation
type (others vs. management & professional, Phase 1), floor level (2nd
floor vs. 5th
floor, Phase 1), (4th
floor vs. 3rd
floor, Phase 3), and the main means of
transportation (by driving vs. by foot, Phase 2), (by driving vs. by cycling, Phase
3)? Thanks.

Department of Estate Management Xi Wenjia BHA080004
371
Faculty of Built Environment University of Malaya
INSTRUCTION: Please leave your comments on the Housing Unit Characteristics, especially on
bedroom (Phase 1 and 2), dining area (Phase 1), drying area (Phase 2), and living room (Phase
3)
QB. What do you think of your housing unit characteristics in terms of living
room, dining area, bedroom, and drying area (Balcony)? Thanks.
PART B: SATISFACTION WITH THE HOUSING UNIT
CHARACTERISTICS

Department of Estate Management Xi Wenjia BHA080004
372
Faculty of Built Environment University of Malaya
INSTRUCTION: Please leave your comments on the Housing Unit Supporting Services, especially
on electrical & Telecommunication wiring (fixed-line telephone, television, and internet)
(Phase3), corridor (Phase 1, 2, 3), staircases (Phase 2), drain (Phase 1), and garbage disposal
(Phase 1).
QC. What do you think of your housing unit supporting services in terms of
drain, electrical & Telecommunication wiring (fixed-line telephone, television,
and internet), staircases, corridor, and garbage disposal? Thanks.
PART C: SATISFACTION WITH THE HOUSING UNIT SUPPORTING
SERVICES

Department of Estate Management Xi Wenjia BHA080004
373
Faculty of Built Environment University of Malaya
INSTRUCTION: Please leave your comments on the Housing Estate Supporting Facilities,
especially on children’s playground (Phase 2, 3), local shops (Phase 1, 2, 3), open space (Phase
1, 3), local kindergarten (Phase 2, 3), parking facilities (electric bicycle/bicycle/car) (Phase 1).
QD. What do you think of your housing estate supporting facilities in terms of
open space, children’s playground, parking facilities (electric
bicycle/bicycle/car), local shops, and local kindergarten? Thanks.
PART D: SATISFACTION WITH THE HOUSING ESTATE SUPPORTING
FACILITIES
WITHIN THE HOUSING AREA
Department of Estate Management Xi Wenjia BHA080004
374
Faculty of Built Environment University of Malaya
INSTRUCTION: Please leave your comments on the Neighbourhood Characteristics, especially on
nearest school (Phase 1, 2), local crime situation (Phase 2), quietness of housing estate (Phase
3), resident’s workplace (Phase 1), nearest bus/taxi station (Phase 2), local police station (Phase
3), community clinic (Phase 1), nearest fire station (Phase 3), nearest general hospital (Phase
1), local accident situation (Phase 2), and community relationship (community committee-
residents/social cohesion/social harmony) (Phase 3).
QE. What do you think of your overall social environment and spatial
location characteristics of the neighbourhood in terms of community
relationship (community committee-residents/social cohesion/social
harmony), quietness of the housing estate, local crime situation, local accident
situation, resident’s workplace, community clinic, nearest general hospital,
local police station, nearest school, nearest fire station, and nearest bus/taxi
station? Thanks.
PART E: SATISFACTION WITH THE NEIGHBOURHOOD
CHARACTERISTICS

Department of Estate Management Xi Wenjia BHA080004
375
Faculty of Built Environment University of Malaya
Final Question:
In your opinion, how to enhance the residential satisfaction of Xuzhou’s low-
cost housing (consisted of three in-use projects i.e. Yangguang Huayuan,
Chengshi Huayuan, Binhe Huayuan; 4th
Phase just-completed, but non-use
and under construction of 5th
Phase; 6th
Phase ONLY in the planning)?
Thanks.
~~~THANK YOU~~~

376
Appendix D
Interpreting a Stepwise Method Regression Analysis
Phase 1 Low-Cost Housing (Yangguang Huayuan in Chinese) in Xuzhou
city, Jiangsu Province, China
Descriptives Table: Descriptive Statistics
Mean Std.
Deviation N
Yangguang Huayuan’s Residential Satisfaction Index
(%) 64.397 3.957 86
Gender (Female vs. Male) 0.593 0.494 86
Age (Age21-30 vs. Age31-40) 0.116 0.322 86
Age (Age21-30 vs. Age41-50) 0.384 0.489 86
Age (Age21-30 vs. Age51-60) 0.267 0.445 86
Age (Age21-30 vs. Above Age60) 0.151 0.36 86
Education attainment (Master Degree and above vs. Primary school) 0.081 0.275 86
Education attainment (Master Degree and above vs. Junior middle school) 0.233 0.425 86
Education attainment (Master Degree and above vs. Senior middle school) 0.384 0.489 86
Education attainment (Master Degree and above vs. Diploma) 0.209 0.409 86
Education attainment (Master Degree and above vs. Bachelor Degree) 0.07 0.256 86
Marital status (Widowed/Divorced vs. Single) 0.07 0.256 86
Marital status (Widowed/Divorced vs. Married) 0.86 0.349 86
Household size (4 people vs. 1 people) 0.337 0.476 86
Household size (4 people vs. 2 people) 0.337 0.476 86
Household size (4 people vs. 3 people) 0.547 0.501 86
Occupation sector (Government Servant vs. State-owned enterprise (SOE)) 0.186 0.391 86
Occupation sector (Government Servant vs. Collective-owned enterprise (COE)) 0.14 0.349 86
Occupation sector (Government Servant vs. Private business) 0.581 0.496 86
Occupation sector (Government Servant vs. Own business) 0.047 0.212 86
Occupation type (Others vs. Management & Professional) 0.093 0.292 86
Occupation type (Others vs. Technical & Administrative Support) 0.233 0.425 86
Occupation type (Others vs. Services & Operation) 0.395 0.492 86
Monthly net income of Household (RMB2,000-3,999 vs. RMB4,000-5,999) 0.36 0.483 86
Monthly net income of Household (RMB2,000-3,999 vs. RMB6,000-7,999) 0.314 0.467 86
Monthly net income of Household (RMB2,000-3,999 vs. aboveRMB8,000) 0.198 0.401 86
Floor level (2ndFloor vs. 1stFloor) 0.116 0.322 86
Floor level (2ndFloor vs. 3rdFloor) 0.128 0.336 86
Floor level (2ndFloor vs. 4thFloor) 0.174 0.382 86
Floor level (2ndFloor vs. 5thFloor) 0.244 0.432 86
Floor level (2ndFloor vs. 6thFloor) 0.244 0.432 86
Length of Residence (>5,<=7 years vs. >7,<=9 years) 0.907 0.292 86
Main Means of Transportation (By foot vs. By cycling) 0.36 0.483 86
Main Means of Transportation (By foot vs. By Driving) 0.047 0.212 86
Main Means of Transportation (By foot vs. By Bus) 0.581 0.496 86
Living room 69.418 20.338 86
Dining area 70.813 24.128 86
Master bedroom 76.007 20.225 86
Bedroom 72.403 19.333 86
Kitchen 61.939 19.272 86
Toilet 65.89 19.21 86
Drying area 68.333 19.17 86
Drain 69.419 21.494 86
Electrical & Telecommunication wiring 76.395 21.47 86
Firefighting equipment 59.767 18.66 86
Street Lighting 60.465 20.053 86

377
Table, continued
Mean Std.
Deviation N
Yangguang Huayuan’s Residential Satisfaction Index (%)
64.397 3.957 86
Staircases 61.105 24.751 86
Corridor 66.57 24.773 86
Garbage disposal 62.907 24.632 86
Yangguang Huayuan's Open Space 65.988 17.453 86
Yangguang Huayuan's Children's Playground 53.14 18.63 86
Yangguang Huayuan's Parking facilities 46.105 24.691 86
Yangguang Huayuan's Perimeter road 59.477 19.251 86
Yangguang Huayuan's Pedestrian walkways 59.244 20.73 86
Local Shops 76.163 21.125 86
Local Kindergarten 70.814 20.592 86
Yangguang Huayuan's Fitness equipment 66.163 24.789 86
Community Relationship 66.163 19.169 86
Quietness of housing estate 46.744 21.279 86
Local Crime situation 76.163 22.553 86
Local Accident situation 76.744 19.849 86
Local Security control 66.744 17.18 86
Resident's Workplace 51.744 19.232 86
Community Clinic 67.907 20.644 86
Nearest General Hospital 47.209 21.944 86
Local Police Station 59.767 21.854 86
Nearest School 64.884 26.11 86
Local Market 68.488 26.724 86
Nearest Fire Station 63.372 18.059 86
Nearest Bus/Taxi Station 59.302 26.603 86
Urban Centre 64.535 22.889 86
Source: SPSS OUTPUT, Descriptive Statistics
Field (2011); (Field, 2013) described that the descriptive statistics table
indicates the mean and standard deviation of each variable in Yangguang
Huayuan’s data set and thus, it obviously presents that the average residential
satisfaction index is 64.397%. In addition, Field (2011); (Field, 2013)
claimed that this table isn’t necessary for interpreting the regression model,
but it is a useful summary of the data.

378
Table: Correlations
Residential Satisfaction
Index (%)
Pearson
Correlation
Yangguang Huayuan's Residential Satisfaction Index (%) 1
Gender (Female vs. Male) 0.108
Age (Age21-30 vs. Age31-40) -0.07
Age (Age21-30 vs. Age41-50) 0.162
Age (Age21-30 vs. Age51-60) -0.127
Age (Age21-30 vs. Above Age60) -0.028
Education attainment (Master Degree and above vs. Primary school) -0.137
Education attainment (Master Degree and above vs. Junior middle school) -0.091
Education attainment (Master Degree and above vs. Senior middle school) 0.097
Education attainment (Master Degree and above vs. Diploma) 0.099
Education attainment (Master Degree and above vs. Bachelor Degree) 0.017
Marital status (Widowed/Divorced vs. Single) -0.098
Marital status (Widowed/Divorced vs. Married) -0.005
Household size (4 people vs. 1 people) -0.084
Household size (4 people vs. 2 people) -0.084
Household size (4 people vs. 3 people) -0.002
Occupation sector (Government Servant vs. State-owned enterprise (SOE)) -0.033
Occupation sector (Government Servant vs. Collective-owned enterprise (COE)) 0.01
Occupation sector (Government Servant vs. Private business) 0.011
Occupation sector (Government Servant vs. Own business) -0.062
Occupation type (Others vs. Management & Professional) -0.07
Occupation type (Others vs. Technical & Administrative Support) 0.023
Occupation type (Others vs. Services & Operation) 0.096
Monthly net income of Household (RMB2,000-3,999 vs. RMB4,000-5,999) -0.023
Monthly net income of Household (RMB2,000-3,999 vs. RMB6,000-7,999) 0.115
Monthly net income of Household (RMB2,000-3,999 vs. aboveRMB8,000) -0.145
Floor level (2ndFloor vs. 1stFloor) -0.107
Floor level (2ndFloor vs. 3rdFloor) 0.041
Floor level (2ndFloor vs. 4thFloor) 0.03
Floor level (2ndFloor vs. 5thFloor) 0.156
Floor level (2ndFloor vs. 6thFloor) -0.074
Length of Residence (>5,<=7 years vs. >7,<=9 years) -0.037
Main Means of Transportation (By foot vs. By cycling) 0.01
Main Means of Transportation (By foot vs. By Driving) -0.048
Main Means of Transportation (By foot vs. By Bus) 0.008
Living room 0.286
Dining area 0.374
Master bedroom 0.196
Bedroom 0.527
Kitchen 0.362
Toilet 0.149
Drying area 0.038
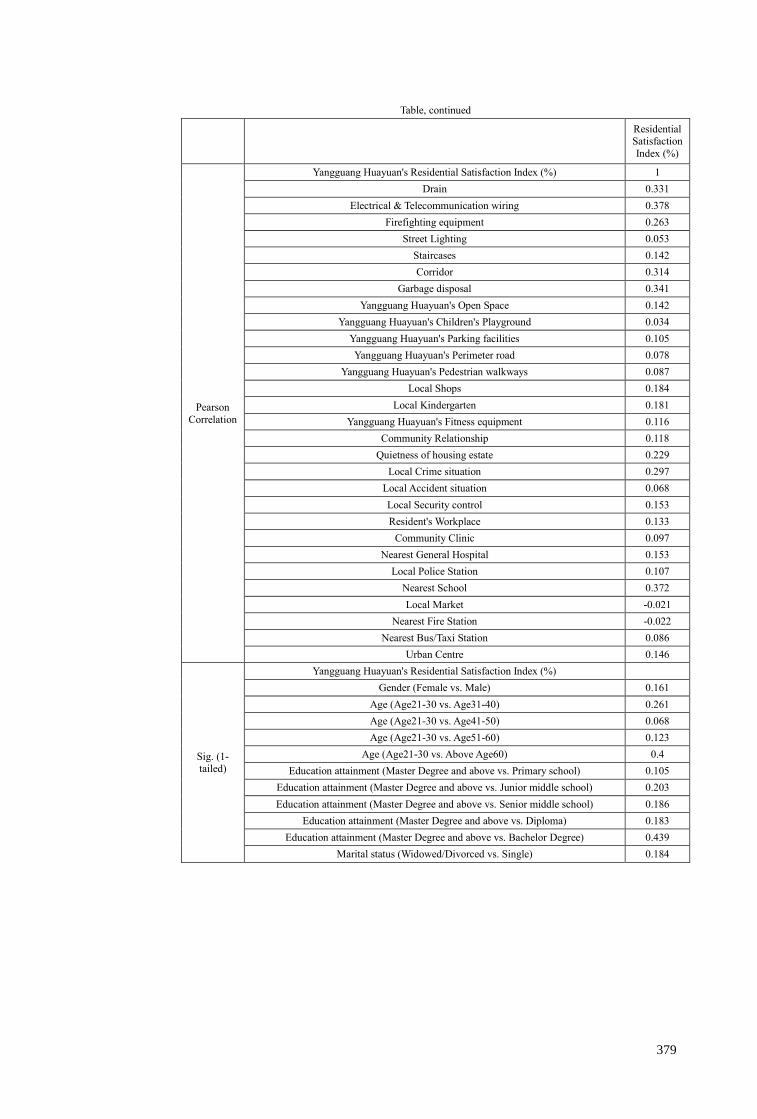
379
Table, continued
Residential Satisfaction
Index (%)
Pearson
Correlation
Yangguang Huayuan's Residential Satisfaction Index (%) 1
Drain 0.331
Electrical & Telecommunication wiring 0.378
Firefighting equipment 0.263
Street Lighting 0.053
Staircases 0.142
Corridor 0.314
Garbage disposal 0.341
Yangguang Huayuan's Open Space 0.142
Yangguang Huayuan's Children's Playground 0.034
Yangguang Huayuan's Parking facilities 0.105
Yangguang Huayuan's Perimeter road 0.078
Yangguang Huayuan's Pedestrian walkways 0.087
Local Shops 0.184
Local Kindergarten 0.181
Yangguang Huayuan's Fitness equipment 0.116
Community Relationship 0.118
Quietness of housing estate 0.229
Local Crime situation 0.297
Local Accident situation 0.068
Local Security control 0.153
Resident's Workplace 0.133
Community Clinic 0.097
Nearest General Hospital 0.153
Local Police Station 0.107
Nearest School 0.372
Local Market -0.021
Nearest Fire Station -0.022
Nearest Bus/Taxi Station 0.086
Urban Centre 0.146
Sig. (1-tailed)
Yangguang Huayuan's Residential Satisfaction Index (%)
Gender (Female vs. Male) 0.161
Age (Age21-30 vs. Age31-40) 0.261
Age (Age21-30 vs. Age41-50) 0.068
Age (Age21-30 vs. Age51-60) 0.123
Age (Age21-30 vs. Above Age60) 0.4
Education attainment (Master Degree and above vs. Primary school) 0.105
Education attainment (Master Degree and above vs. Junior middle school) 0.203
Education attainment (Master Degree and above vs. Senior middle school) 0.186
Education attainment (Master Degree and above vs. Diploma) 0.183
Education attainment (Master Degree and above vs. Bachelor Degree) 0.439
Marital status (Widowed/Divorced vs. Single) 0.184

380
Table, continued
Sig.
(1-
tailed)
Yangguang Huayuan’s Residential Satisfaction Index (%)
Marital status (Widowed/Divorced vs. Married) 0.482
Household size (4 people vs. 1 people) 0.221
Household size (4 people vs. 2 people) 0.221
Household size (4 people vs. 3 people) 0.491
Occupation sector (Government Servant vs. State-owned enterprise (SOE)) 0.38
Occupation sector (Government Servant vs. Collective-owned enterprise (COE)) 0.465
Occupation sector (Government Servant vs. Private business) 0.458
Occupation sector (Government Servant vs. Own business) 0.284
Occupation type (Others vs. Management & Professional) 0.261
Occupation type (Others vs. Technical & Administrative Support) 0.415
Occupation type (Others vs. Services & Operation) 0.19
Monthly net income of Household (RMB2,000-3,999 vs. RMB4,000-5,999) 0.417
Monthly net income of Household (RMB2,000-3,999 vs. RMB6,000-7,999) 0.145
Monthly net income of Household (RMB2,000-3,999 vs. aboveRMB8,000) 0.092
Floor level (2ndFloor vs. 1stFloor) 0.163
Floor level (2ndFloor vs. 3rdFloor) 0.355
Floor level (2ndFloor vs. 4thFloor) 0.393
Floor level (2ndFloor vs. 5thFloor) 0.075
Floor level (2ndFloor vs. 6thFloor) 0.249
Length of Residence (>5,<=7 years vs. >7,<=9 years) 0.368
Main Means of Transportation (By foot vs. By cycling) 0.465
Main Means of Transportation (By foot vs. By Driving) 0.33
Main Means of Transportation (By foot vs. By Bus) 0.47
Living room 0.004
Dining area 0
Master bedroom 0.035
Bedroom 0
Kitchen 0
Toilet 0.085
Drying area 0.363
Drain 0.001
Electrical & Telecommunication wiring 0
Firefighting equipment 0.007
Street Lighting 0.314
Staircases 0.096
Corridor 0.002
Garbage disposal 0.001
Yangguang Huayuan's Open Space 0.096
Yangguang Huayuan's Children's Playground 0.379
Yangguang Huayuan's Parking facilities 0.169
Yangguang Huayuan's Perimeter road 0.238
Yangguang Huayuan's Pedestrian walkways 0.213
Local Shops 0.045
Local Kindergarten 0.047

381
Table, continued
Sig.
(1-tailed)
Yangguang Huayuan’s Residential Satisfaction Index (%)
Yangguang Huayuan's Fitness equipment 0.143
Community Relationship 0.14
Quietness of housing estate 0.017
Local Crime situation 0.003
Local Accident situation 0.268
Local Security control 0.079
Resident's Workplace 0.111
Community Clinic 0.187
Nearest General Hospital 0.079
Local Police Station 0.164
Nearest School 0
Local Market 0.423
Nearest Fire Station 0.421
Nearest Bus/Taxi Station 0.216
Urban Centre 0.089
N
Yangguang Huayuan's Residential Satisfaction Index (%) 86
Gender (Female vs. Male) 86
Age (Age21-30 vs. Age31-40) 86
Age (Age21-30 vs. Age41-50) 86
Age (Age21-30 vs. Age51-60) 86
Age (Age21-30 vs. Above Age60) 86
Education attainment (Master Degree and above vs. Primary school) 86
Education attainment (Master Degree and above vs. Junior middle school) 86
Education attainment (Master Degree and above vs. Senior middle school) 86
Education attainment (Master Degree and above vs. Diploma) 86
Education attainment (Master Degree and above vs. Bachelor Degree) 86
Marital status (Widowed/Divorced vs. Single) 86
Marital status (Widowed/Divorced vs. Married) 86
Household size (4 people vs. 1 people) 86
Household size (4 people vs. 2 people) 86
Household size (4 people vs. 3 people) 86
Occupation sector (Government Servant vs. State-owned enterprise (SOE)) 86
Occupation sector (Government Servant vs. Collective-owned enterprise (COE)) 86
Occupation sector (Government Servant vs. Private business) 86
Occupation sector (Government Servant vs. Own business) 86
Occupation type (Others vs. Management & Professional) 86
Occupation type (Others vs. Technical & Administrative Support) 86
Occupation type (Others vs. Services & Operation) 86
Monthly net income of Household (RMB2,000-3,999 vs. RMB4,000-5,999) 86
Monthly net income of Household (RMB2,000-3,999 vs. RMB6,000-7,999) 86
Monthly net income of Household (RMB2,000-3,999 vs. aboveRMB8,000) 86
Floor level (2ndFloor vs. 1stFloor) 86
Floor level (2ndFloor vs. 3rdFloor) 86
Floor level (2ndFloor vs. 4thFloor) 86

382
Table, continued
N
Yangguang Huayuan’s Residential Satisfaction Index (%) 86
Floor level (2ndFloor vs. 5thFloor) 86
Floor level (2ndFloor vs. 6thFloor) 86
Length of Residence (>5,<=7 years vs. >7,<=9 years) 86
Main Means of Transportation (By foot vs. By cycling) 86
Main Means of Transportation (By foot vs. By Driving) 86
Main Means of Transportation (By foot vs. By Bus) 86
Living room 86
Dining area 86
Master bedroom 86
Bedroom 86
Kitchen 86
Toilet 86
Drying area 86
Drain 86
Electrical & Telecommunication wiring 86
Firefighting equipment 86
Street Lighting 86
Staircases 86
Corridor 86
Garbage disposal 86
Yangguang Huayuan's Open Space 86
Yangguang Huayuan's Children's Playground 86
Yangguang Huayuan's Parking facilities 86
Yangguang Huayuan's Perimeter road 86
Yangguang Huayuan's Pedestrian walkways 86
Local Shops 86
Local Kindergarten 86
Yangguang Huayuan's Fitness equipment 86
Community Relationship 86
Quietness of housing estate 86
Local Crime situation 86
Local Accident situation 86
Local Security control 86
Resident's Workplace 86
Community Clinic 86
Nearest General Hospital 86
Local Police Station 86
Nearest School 86
Local Market 86
Nearest Fire Station 86
Nearest Bus/Taxi Station 86
Urban Centre 86
Source: SPSS OUTPUT, Correlations
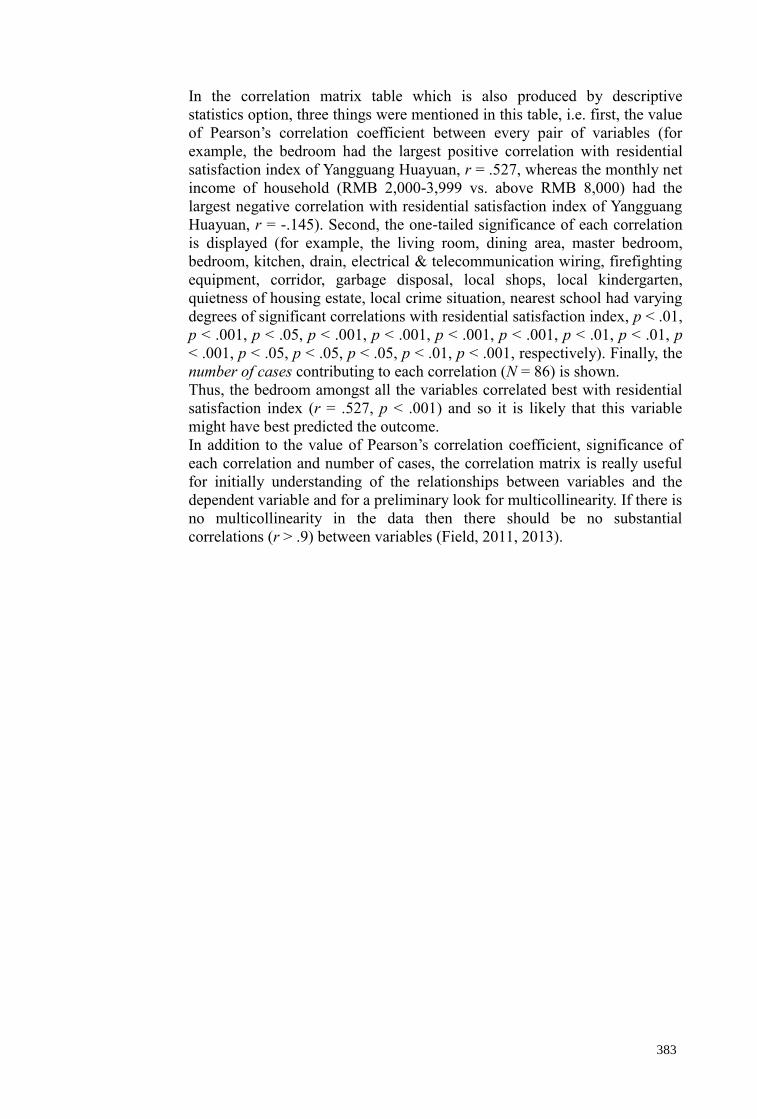
383
In the correlation matrix table which is also produced by descriptive
statistics option, three things were mentioned in this table, i.e. first, the value
of Pearson’s correlation coefficient between every pair of variables (for
example, the bedroom had the largest positive correlation with residential
satisfaction index of Yangguang Huayuan, r = .527, whereas the monthly net
income of household (RMB 2,000-3,999 vs. above RMB 8,000) had the
largest negative correlation with residential satisfaction index of Yangguang
Huayuan, r = -.145). Second, the one-tailed significance of each correlation
is displayed (for example, the living room, dining area, master bedroom,
bedroom, kitchen, drain, electrical & telecommunication wiring, firefighting
equipment, corridor, garbage disposal, local shops, local kindergarten,
quietness of housing estate, local crime situation, nearest school had varying
degrees of significant correlations with residential satisfaction index, p < .01,
p < .001, p < .05, p < .001, p < .001, p < .001, p < .001, p < .01, p < .01, p
< .001, p < .05, p < .05, p < .05, p < .01, p < .001, respectively). Finally, the
number of cases contributing to each correlation (N = 86) is shown.
Thus, the bedroom amongst all the variables correlated best with residential
satisfaction index (r = .527, p < .001) and so it is likely that this variable
might have best predicted the outcome.
In addition to the value of Pearson’s correlation coefficient, significance of
each correlation and number of cases, the correlation matrix is really useful
for initially understanding of the relationships between variables and the
dependent variable and for a preliminary look for multicollinearity. If there is
no multicollinearity in the data then there should be no substantial
correlations (r > .9) between variables (Field, 2011, 2013).
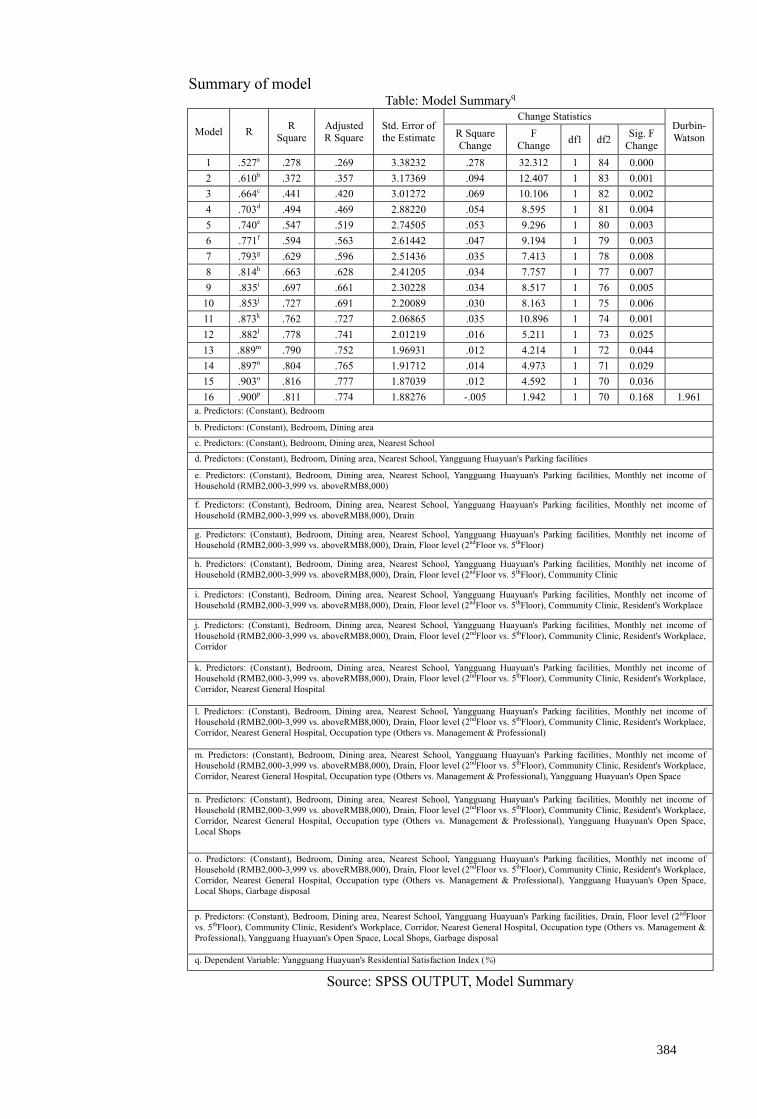
384
Summary of model Table: Model Summary
q
Model R R
Square Adjusted R Square
Std. Error of the Estimate
Change Statistics Durbin-Watson R Square
Change
F
Change df1 df2
Sig. F
Change
1 .527a .278 .269 3.38232 .278 32.312 1 84 0.000
2 .610b .372 .357 3.17369 .094 12.407 1 83 0.001
3 .664c .441 .420 3.01272 .069 10.106 1 82 0.002
4 .703d .494 .469 2.88220 .054 8.595 1 81 0.004
5 .740e .547 .519 2.74505 .053 9.296 1 80 0.003
6 .771f .594 .563 2.61442 .047 9.194 1 79 0.003
7 .793g .629 .596 2.51436 .035 7.413 1 78 0.008
8 .814h .663 .628 2.41205 .034 7.757 1 77 0.007
9 .835i .697 .661 2.30228 .034 8.517 1 76 0.005
10 .853j .727 .691 2.20089 .030 8.163 1 75 0.006
11 .873k .762 .727 2.06865 .035 10.896 1 74 0.001
12 .882l .778 .741 2.01219 .016 5.211 1 73 0.025
13 .889m .790 .752 1.96931 .012 4.214 1 72 0.044
14 .897n .804 .765 1.91712 .014 4.973 1 71 0.029
15 .903o .816 .777 1.87039 .012 4.592 1 70 0.036
16 .900p .811 .774 1.88276 -.005 1.942 1 70 0.168 1.961
a. Predictors: (Constant), Bedroom
b. Predictors: (Constant), Bedroom, Dining area
c. Predictors: (Constant), Bedroom, Dining area, Nearest School
d. Predictors: (Constant), Bedroom, Dining area, Nearest School, Yangguang Huayuan's Parking facilities
e. Predictors: (Constant), Bedroom, Dining area, Nearest School, Yangguang Huayuan's Parking facilities, Monthly net income of
Household (RMB2,000-3,999 vs. aboveRMB8,000)
f. Predictors: (Constant), Bedroom, Dining area, Nearest School, Yangguang Huayuan's Parking facilities, Monthly net income of
Household (RMB2,000-3,999 vs. aboveRMB8,000), Drain
g. Predictors: (Constant), Bedroom, Dining area, Nearest School, Yangguang Huayuan's Parking facilities, Monthly net income of
Household (RMB2,000-3,999 vs. aboveRMB8,000), Drain, Floor level (2ndFloor vs. 5thFloor)
h. Predictors: (Constant), Bedroom, Dining area, Nearest School, Yangguang Huayuan's Parking facilities, Monthly net income of
Household (RMB2,000-3,999 vs. aboveRMB8,000), Drain, Floor level (2ndFloor vs. 5thFloor), Community Clinic
i. Predictors: (Constant), Bedroom, Dining area, Nearest School, Yangguang Huayuan's Parking facilities, Monthly net income of
Household (RMB2,000-3,999 vs. aboveRMB8,000), Drain, Floor level (2ndFloor vs. 5thFloor), Community Clinic, Resident's Workplace
j. Predictors: (Constant), Bedroom, Dining area, Nearest School, Yangguang Huayuan's Parking facilities, Monthly net income of
Household (RMB2,000-3,999 vs. aboveRMB8,000), Drain, Floor level (2ndFloor vs. 5thFloor), Community Clinic, Resident's Workplace,
Corridor
k. Predictors: (Constant), Bedroom, Dining area, Nearest School, Yangguang Huayuan's Parking facilities, Monthly net income of
Household (RMB2,000-3,999 vs. aboveRMB8,000), Drain, Floor level (2ndFloor vs. 5thFloor), Community Clinic, Resident's Workplace,
Corridor, Nearest General Hospital
l. Predictors: (Constant), Bedroom, Dining area, Nearest School, Yangguang Huayuan's Parking facilities, Monthly net income of
Household (RMB2,000-3,999 vs. aboveRMB8,000), Drain, Floor level (2ndFloor vs. 5thFloor), Community Clinic, Resident's Workplace,
Corridor, Nearest General Hospital, Occupation type (Others vs. Management & Professional)
m. Predictors: (Constant), Bedroom, Dining area, Nearest School, Yangguang Huayuan's Parking facilities, Monthly net income of
Household (RMB2,000-3,999 vs. aboveRMB8,000), Drain, Floor level (2ndFloor vs. 5thFloor), Community Clinic, Resident's Workplace,
Corridor, Nearest General Hospital, Occupation type (Others vs. Management & Professional), Yangguang Huayuan's Open Space
n. Predictors: (Constant), Bedroom, Dining area, Nearest School, Yangguang Huayuan's Parking facilities, Monthly net income of
Household (RMB2,000-3,999 vs. aboveRMB8,000), Drain, Floor level (2ndFloor vs. 5thFloor), Community Clinic, Resident's Workplace,
Corridor, Nearest General Hospital, Occupation type (Others vs. Management & Professional), Yangguang Huayuan's Open Space,
Local Shops
o. Predictors: (Constant), Bedroom, Dining area, Nearest School, Yangguang Huayuan's Parking facilities, Monthly net income of
Household (RMB2,000-3,999 vs. aboveRMB8,000), Drain, Floor level (2ndFloor vs. 5thFloor), Community Clinic, Resident's Workplace,
Corridor, Nearest General Hospital, Occupation type (Others vs. Management & Professional), Yangguang Huayuan's Open Space,
Local Shops, Garbage disposal
p. Predictors: (Constant), Bedroom, Dining area, Nearest School, Yangguang Huayuan's Parking facilities, Drain, Floor level (2ndFloor
vs. 5thFloor), Community Clinic, Resident's Workplace, Corridor, Nearest General Hospital, Occupation type (Others vs. Management &
Professional), Yangguang Huayuan's Open Space, Local Shops, Garbage disposal
q. Dependent Variable: Yangguang Huayuan's Residential Satisfaction Index (%)
Source: SPSS OUTPUT, Model Summary

385
Field (2011); (Field, 2013) mentioned that the table of Model Summary
describes the overall model which is whether successful in predicting the
outcome. In Table, there are 16 models. The stepwise method regression that
has been already chosen in this research made all predictors in one go to
eventually identify significant predictors as the “determinants” of the
regression by reassessing the regression equation constantly to see whether
any redundant predictors can be removed when each time a predictor is
added to the equation in accordance with a removal test that is made of the
least useful predictor with the purpose of decreasing the impacts of data
collinearity by starting with no predictors and then adding them in order of
significance. Thus, Model 16 refers to 14 predictors being the
“determinants” of the regression.
In addition, Table is the model summary and this table was produced using
the Model fit option. This option is selected by default in SPSS, because
some very important information about the model such as the values of R, R2
and the adjusted R2 were mentioned in this option (Field, 2011, 2013). If the
R square change and Durbin-Watson options were selected, then these values
are included also.
Furthermore, the model summary table which is shown in Table indicates
what the dependent variable (DV) (outcome) was and what the predictors
were in the 16th
model. Moreover, in the column labelled R are the values of
the multiple correlation coefficients between the predictors and the
dependent variable (Field, 2011, 2013). When the bedroom was added and
retained as a predictor, this is the simple correlation between the bedroom
and the Yangguang Huayuan’s Residential Satisfaction Index (0.527).
The next column indicates a value of R2 which is a measure of how much of
the variability in the outcome is explained by the predictors (Field, 2011,
2013). For the first model, its value is .278 which means that the bedroom
explained 27.8% of the variation in residential satisfaction index. However,
when another predictor named dining area was included as well (model 2),
this value increased to .372 or 37.2% of the variance in residential
satisfaction index. Thus, if the bedroom has explained 27.8%, it obviously
showed that the dining area explained an additional 9.4% (9.4% = 37.2% -
27.8%, this value also is the R Square Change in the table). In addition, after
another predictor named nearest school was also included (model 3), this
value increased to 44.1% of the variance in residential satisfaction index.
Thus, when the bedroom and dining area have explained 37.2%, it obviously
showed that the nearest school explained an additional 6.9%. Moreover,
when another predictor called Yangguang Huayuan’s parking facilities was
additionally added (model 4), this value increased to 49.4% of the variance
in residential satisfaction index. So, when the bedroom, dining area and
nearest school have explained 44.1%, it obviously showed that the parking
facilities explained an additional 5.3%. Furthermore, when another predictor
named monthly net income of household (RMB2,000-3,999 vs. above
RMB8,000) was also added (model 5), this value increased to 54.7% of the
variance in residential satisfaction index. So, when the bedroom, dining area,
nearest school and parking facilities have explained 49.4%, it obviously
showed that the monthly net income (RMB2,000-3,999 vs. above
RMB8,000) explained an additional 5.3%. Additionally, after another
predictor called drain was added as well (model 6), this value increased to
59.4% of the variance in residential satisfaction index. So, when the

386
bedroom, dining area, nearest school, parking facilities and monthly net
income (RMB2,000-3,999 vs. above RMB8,000) have explained 54.7%, it
showed that the drain explained an additional 4.7%. What is more, after
another predictor called floor level (2nd
floor vs. 5th
floor) was additionally
added (model 7), this value increased to 62.9% of the variance in residential
satisfaction index. So, when the bedroom, dining area, nearest school,
parking facilities, monthly net income (RMB2,000-3,999 vs. above
RMB8,000) and drain have explained 59.4%, it showed that the floor level
(2nd
floor vs. 5th
floor) explained an additional 3.5%. After another predictor
named community clinic was added as well (model 8), this value increased
to 66.3% of the variance in residential satisfaction index. So, when the
bedroom, dining area, nearest school, parking facilities, monthly net income
(RMB2,000-3,999 vs. above RMB8,000), drain and floor level (2nd
floor vs.
5th
floor) have explained 62.9%, it showed that the community clinic
explained an additional 3.4%. When another predictor called resident’s
workplace was additionally included (model 9), this value improved to
69.7% of the variance in residential satisfaction index. Then, when the
bedroom, dining area, nearest school, parking facilities, monthly net income
(RMB2,000-3,999 vs. above RMB8,000), drain, floor level (2nd
floor vs.
5th
floor) and community clinic have accounted for 66.3%, it indicated that
the resident’s workplace explained 3.4% additionally. When another
predictor called corridor was additionally added (model 10), this value
improved to 72.7% of the variance in residential satisfaction index. Then,
when the bedroom, dining area, nearest school, parking facilities, monthly
net income (RMB2,000-3,999 vs. above RMB8,000), drain, floor level
(2nd
floor vs. 5th
floor), community clinic and resident’s workplace have
accounted for 69.7%, it indicated that the corridor explained 3.0%
additionally. Likewise, when another predictor named nearest general
hospital was added as well (model 11), this value improved to 76.2% of the
variance in residential satisfaction index. Then, when the bedroom, dining
area, nearest school, parking facilities, monthly net income (RMB2,000-
3,999 vs. above RMB8,000), drain, floor level (2nd
floor vs. 5th
floor),
community clinic, resident’s workplace and corridor have accounted for
72.7%, it indicated that the nearest general hospital accounted for 3.5%
additionally. Similarly, when another predictor called occupation type (others
vs. management & professional) was added as well (model 12), this value
improved to 77.8% of the variance in residential satisfaction index. Then,
when the bedroom, dining area, nearest school, parking facilities, monthly
net income (RMB2,000-3,999 vs. above RMB8,000), drain, floor level
(2nd
floor vs. 5th
floor), community clinic, resident’s workplace, corridor and
nearest general hospital have accounted for 76.2%, it indicated that the
occupation type (others vs. management & professional) accounted for 1.6%
additionally. Also, when another predictor named Yangguang Huayuan’s
open space was also added (model 13), this value improved to 79.0% of the
variance in residential satisfaction index. Then, when the bedroom, dining
area, nearest school, parking facilities, monthly net income (RMB2,000-
3,999 vs. above RMB8,000), drain, floor level (2nd
floor vs. 5th
floor),
community clinic, resident’s workplace, corridor, nearest general hospital
and occupation type (others vs. management & professional) have accounted
for 77.8%, it indicated the Yangguang Huayuan’s open space that accounted
for 1.2% additionally. In addition, when another predictor named local shops
was added as well (model 14), this value improved to 80.4% of the variance

387
in residential satisfaction index. Then, when the bedroom, dining area,
nearest school, parking facilities, monthly net income (RMB2,000-3,999 vs.
above RMB8,000), drain, floor level (2nd
floor vs. 5th
floor), community
clinic, resident’s workplace, corridor, nearest general hospital, occupation
type (others vs. management & professional) and open space have accounted
for 79.0%, it indicated that the local shops accounted for 1.4% additionally.
Moreover, when another predictor called garbage disposal was finally added
as well (model 15), this value improved to 81.6% of the variance in
residential satisfaction index. Then, when the bedroom, dining area, nearest
school, parking facilities, monthly net income (RMB2,000-3,999 vs. above
RMB8,000), drain, floor level (2nd
floor vs. 5th
floor), community clinic,
resident’s workplace, corridor, nearest general hospital, occupation type
(others vs. management & professional), open space and local shops have
accounted for 80.4%, it indicated that the garbage disposal accounted for
1.2% additionally. Besides, the predictor of monthly net income of
household (RMB2,000-3,999 vs. above RMB 8,000) was removed (model
16), this value decreased to 81.1% of the variance in residential satisfaction
index. So when the bedroom, dining area, nearest school, parking facilities,
monthly net income (RMB2,000-3,999 vs. above RMB8,000), drain, floor
level (2nd
floor vs. 5th
floor), community clinic, resident’s workplace, corridor,
nearest general hospital, occupation type (others vs. management &
professional), open space, local shops and garbage disposal have explained
81.6%, it indicated that the monthly net income (RMB2,000-3,999 vs. above
RMB8,000) less explained by 0.5%. Therefore, 14 predictors which have
been left have explained a large amount of the variation (81.1%) in the
Yangguang Huayuan’s residential satisfaction index.
Field (2011); (Field, 2013) described the adjusted R2 as a measurement of
how well the Yangguang Huayuan’s model generalized and ideally Field
(2011); (Field, 2013) believed that (adjusted R2)’s value to the same, or very
close to, the value of R2. In this model summary, the difference for the final
model was small (in fact the difference between the values is .811-.774
= .037 (about 3.7%). This shrinkage means that if the model were derived
from the population rather than a sample, it would explain approximately
3.7% less variance in the outcome (Field, 2011, 2013). In addition, the
following Stein’s formula to the R2 can understand its likely value in
different samples.
adjusted 𝑅2 = 1 − [(𝑛 − 1
𝑛 − 𝑘 − 1) (
𝑛 − 2
𝑛 − 𝑘 − 2) (
𝑛 + 1
𝑛)] (1 − 𝑅2)
Stein’s formula was given in equation and can be applied by replacing n with
the sample size (86) and k with the number of predictors (14), as follows,
adjusted 𝑅2 = 1 − [(86 − 1
86 − 14 − 1) (
86 − 2
86 − 14 − 2) (
86 + 1
86)] (1 − 0.811)
= 1 – [(1.197)(1.200)(1.011)](0.189)
= 1 – 0.274
= 0.726
The value is similar to the value of 𝑅2 (.811) indicating that the cross-
validity of this model is good. Thus, the adjusted R2 value (.774/.726) of the

388
model indicated that 77.4/72.6% of the variance in residential satisfaction
index had been explained by the model. The tolerance values of the
coefficients of predictor variables are well over 0.22/0.27
(1 − adjusted 𝑅2 ) and this indicated the absence of multicollinearity
between the predictor variables of the model (Al-Homoud, 2011; Amerigo &
Aragones, 1990; Cao et al., 2012; Dekker et al., 2011; Fauth et al., 2004;
Field, 2011, 2013; Galster, 1987; Ge & Hokao, 2004; Hourihan, 1984; Ibem
& Amole, 2013, 2014; James, 2001; Kang & Lee, 2007; Kellekci & Berköz,
2006; Li & Wu, 2013; M. A. Mohit & M. Azim, 2012; Mohammad Abdul
Mohit & Mohamed Azim, 2012); Mohit et al. (2010); (Mohit & Nazyddah,
2011; Turkoglu, 1997; Varady & Preiser, 1998).
Then, finally, the Durbin-Watson statistic is found in the last column of the
Table. Field (2011); (Field, 2013) explained that this statistic talked about
whether the assumption of independent errors is tenable.
“As a conservative rule I suggested that values less than 1 or greater than 3
should definitely rise alarm bells (although I urge you to look up precise
values for the situation of interest).”
--Field (2011); (Field,
2013)
That the value is closer to 2 is the better. For these data the value was 1.961,
which is so close to 2 that the assumption has almost certainly been met
(Field, 2011, 2013).
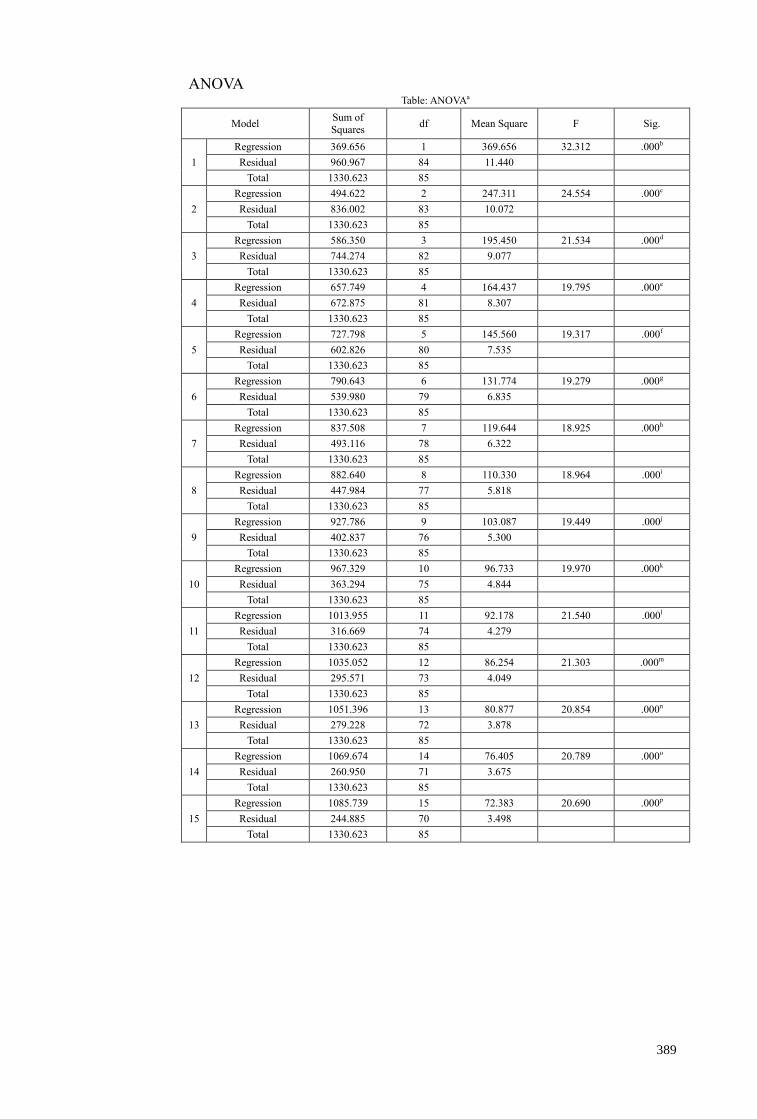
389
ANOVA Table: ANOVAa
Model Sum of
Squares df Mean Square F Sig.
1
Regression 369.656 1 369.656 32.312 .000b
Residual 960.967 84 11.440
Total 1330.623 85
2
Regression 494.622 2 247.311 24.554 .000c
Residual 836.002 83 10.072
Total 1330.623 85
3
Regression 586.350 3 195.450 21.534 .000d
Residual 744.274 82 9.077
Total 1330.623 85
4
Regression 657.749 4 164.437 19.795 .000e
Residual 672.875 81 8.307
Total 1330.623 85
5
Regression 727.798 5 145.560 19.317 .000f
Residual 602.826 80 7.535
Total 1330.623 85
6
Regression 790.643 6 131.774 19.279 .000g
Residual 539.980 79 6.835
Total 1330.623 85
7
Regression 837.508 7 119.644 18.925 .000h
Residual 493.116 78 6.322
Total 1330.623 85
8
Regression 882.640 8 110.330 18.964 .000i
Residual 447.984 77 5.818
Total 1330.623 85
9
Regression 927.786 9 103.087 19.449 .000j
Residual 402.837 76 5.300
Total 1330.623 85
10
Regression 967.329 10 96.733 19.970 .000k
Residual 363.294 75 4.844
Total 1330.623 85
11
Regression 1013.955 11 92.178 21.540 .000l
Residual 316.669 74 4.279
Total 1330.623 85
12
Regression 1035.052 12 86.254 21.303 .000m
Residual 295.571 73 4.049
Total 1330.623 85
13
Regression 1051.396 13 80.877 20.854 .000n
Residual 279.228 72 3.878
Total 1330.623 85
14
Regression 1069.674 14 76.405 20.789 .000o
Residual 260.950 71 3.675
Total 1330.623 85
15
Regression 1085.739 15 72.383 20.690 .000p
Residual 244.885 70 3.498
Total 1330.623 85

390
Table, continued
Model Sum of Squares
df Mean Square F Sig.
16
Regression 1078.944 14 77.067 21.741 .000q
Residual 251.680 71 3.545
Total 1330.623 85
a. Dependent Variable: Yangguang Huayuan's Residential Satisfaction Index (%)
b. Predictors: (Constant), Bedroom
c. Predictors: (Constant), Bedroom, Dining room
d. Predictors: (Constant), Bedroom, Dining room, Nearest School
e. Predictors: (Constant), Bedroom, Dining room, Nearest School, Yangguang Huayuan's Parking facilities
f. Predictors: (Constant), Bedroom, Dining room, Nearest School, Yangguang Huayuan's Parking facilities, Monthly net income of
Household (RMB2,000-3,999 vs. aboveRMB8,000)
g. Predictors: (Constant), Bedroom, Dining room, Nearest School, Yangguang Huayuan's Parking facilities, Monthly net income of
Household (RMB2,000-3,999 vs. aboveRMB8,000), Drain
h. Predictors: (Constant), Bedroom, Dining room, Nearest School, Yangguang Huayuan's Parking facilities, Monthly net income of
Household (RMB2,000-3,999 vs. aboveRMB8,000), Drain, Floor level (2ndFloor vs. 5thFloor)
i. Predictors: (Constant), Bedroom, Dining room, Nearest School, Yangguang Huayuan's Parking facilities, Monthly net income of
Household (RMB2,000-3,999 vs. aboveRMB8,000), Drain, Floor level (2ndFloor vs. 5thFloor), Community Clinic
j. Predictors: (Constant), Bedroom, Dining room, Nearest School, Yangguang Huayuan's Parking facilities, Monthly net income of
Household (RMB2,000-3,999 vs. aboveRMB8,000), Drain, Floor level (2ndFloor vs. 5thFloor), Community Clinic, Resident's
Workplace
k. Predictors: (Constant), Bedroom, Dining room, Nearest School, Yangguang Huayuan's Parking facilities, Monthly net income of
Household (RMB2,000-3,999 vs. aboveRMB8,000), Drain, Floor level (2ndFloor vs. 5thFloor), Community Clinic, Resident's
Workplace, Corridor
l. Predictors: (Constant), Bedroom, Dining room, Nearest School, Yangguang Huayuan's Parking facilities, Monthly net income of
Household (RMB2,000-3,999 vs. aboveRMB8,000), Drain, Floor level (2ndFloor vs. 5thFloor), Community Clinic, Resident's
Workplace, Corridor, Nearest General Hospital
m. Predictors: (Constant), Bedroom, Dining room, Nearest School, Yangguang Huayuan's Parking facilities, Monthly net income of
Household (RMB2,000-3,999 vs. aboveRMB8,000), Drain, Floor level (2ndFloor vs. 5thFloor), Community Clinic, Resident's
Workplace, Corridor, Nearest General Hospital, Occupation type (Others vs. Management & Professional)
n. Predictors: (Constant), Bedroom, Dining room, Nearest School, Yangguang Huayuan's Parking facilities, Monthly net income of
Household (RMB2,000-3,999 vs. aboveRMB8,000), Drain, Floor level (2ndFloor vs. 5thFloor), Community Clinic, Resident's
Workplace, Corridor, Nearest General Hospital, Occupation type (Others vs. Management & Professional), Yangguang Huayuan's
Open Space
o. Predictors: (Constant), Bedroom, Dining room, Nearest School, Yangguang Huayuan's Parking facilities, Monthly net income of
Household (RMB2,000-3,999 vs. aboveRMB8,000), Drain, Floor level (2ndFloor vs. 5thFloor), Community Clinic, Resident's
Workplace, Corridor, Nearest General Hospital, Occupation type (Others vs. Management & Professional), Yangguang Huayuan's
Open Space, Local Shops
p. Predictors: (Constant), Bedroom, Dining room, Nearest School, Yangguang Huayuan's Parking facilities, Monthly net income of
Household (RMB2,000-3,999 vs. aboveRMB8,000), Drain, Floor level (2ndFloor vs. 5thFloor), Community Clinic, Resident's
Workplace, Corridor, Nearest General Hospital, Occupation type (Others vs. Management & Professional), Yangguang Huayuan's
Open Space, Local Shops, Garbage disposal
q. Predictors: (Constant), Bedroom, Dining room, Nearest School, Yangguang Huayuan's Parking facilities, Drain, Floor level
(2ndFloor vs. 5thFloor), Community Clinic, Resident's Workplace, Corridor, Nearest General Hospital, Occupation type (Others vs.
Management & Professional), Yangguang Huayuan's Open Space, Local Shops, Garbage disposal
Source: SPSS OUTPUT, ANOVA
Table shows an ANOVA that tests whether the model is significantly better at
predicting the outcome than using the mean as a ‘best guess’. The ANOVA
also indicates whether the model is a significant fit of the data overall (Field,
2011, 2013). Thus, the combination of predictor variables significantly
predicted the residential satisfaction of Yangguang Huayuan, with F (14, 71)
= 21.741, p < .001, with all 14 predictors significantly contributing to the
prediction.

391
Model parameters Table, Coefficientsa
Model
Unstandardized
Coefficients
Standardized
Coefficients t Sig.
95.0% Confidence Interval
for B
B Std.
Error Beta
Lower
Bound
Upper
Bound
16
(Constant) 33.121 2.098 15.790 .000 28.938 37.303
Bedroom .072 .012 .350 5.935 .000 .048 .096
Dining room .051 .009 .309 5.567 .000 .033 .069
Nearest School .058 .009 .383 6.620 .000 .041 .076
Yangguang
Huayuan's Parking facilities
.027 .009 .168 2.951 .004 .009 .045
Drain .038 .010 .205 3.778 .000 .018 .058
Floor level
(2ndFloor vs.
5thFloor)
1.596 .502 .174 3.180 .002 .595 2.597
Community Clinic .037 .010 .194 3.546 .001 .016 .058
Resident's
Workplace .043 .012 .207 3.684 .000 .020 .066
Corridor .038 .009 .239 4.278 .000 .020 .056
Nearest General Hospital
.036 .011 .197 3.256 .002 .014 .057
Occupation type (Others vs.
Management &
Professional
-1.590 .768 -.117 -2.070 .042 -3.120 -.059
Yangguang Huayuan's Open
Space
.034 .013 .150 2.686 .009 .009 .059
Local Shops .026 .011 .140 2.445 .017 .005 .048
Garbage disposal .023 .009 .141 2.476 .016 .004 .041
a. Dependent Variable: Yangguang Huayuan's Residential Satisfaction Index (%)
Source: SPSS OUTPUT, Coefficients
Table, continued, Coefficientsa
Model Correlations Collinearity Statistics
Zero-order Partial Part Tolerance VIF
16
(Constant)
Bedroom .527 .576 .306 .767 1.304
Dining room .374 .551 .287 .863 1.158
Nearest School .372 .618 .342 .794 1.260
Yangguang Huayuan's
Parking facilities .105 .331 .152 .824 1.214
Drain .331 .409 .195 .904 1.107
Floor level (Floor2nd vs.
5thFloor) .156 .353 .164 .886 1.128
Community Clinic .097 .388 .183 .889 1.125
Resident's Workplace .133 .401 .190 .842 1.188
Corridor .314 .453 .221 .853 1.172
Nearest General Hospital .153 .360 .168 .727 1.375
Occupation type (Others vs. Management & Professional
-.070 -.239 -.107 .829 1.207
Yangguang Huayuan's Open Space
.142 .304 .139 .853 1.172
Local shops .184 .279 .126 .808 1.237
Garbage disposal .341 .282 .128 .816 1.225
a. Dependent Variable: Yangguang Huayuan's Residential Satisfaction Index (%)
Source: SPSS OUTPUT, Coefficients

392
A stepwise method regression was chosen in this study and so the last model
including the predictors (in order of significance) must be predicting the
residential satisfaction index of Yangguang Huayuan. Field (2011); (Field,
2013) conducted that the parameters for the only final model of Coefficients
are worthy of being concluded because all predictors were already
summarized. In addition, although the format of the table of coefficients is
presented by the options selected when entering, the confidence interval for
the b-values, collinearity diagnostics and the part and partial correlations are
required to be present (Field, 2011, 2013). Furthermore, the b-values denote
the relationship between residential satisfaction index and each predictor.
Field (2011); (Field, 2013) concluded that the value being positive says that
there is a positive relationship between the predictor and the dependent
variable (also named outcome), whereas a negative coefficient implies a
negative relationship. In Table, only one predictor so-called the occupation
type (others vs. management & professional) from respondent’s individual
and household characteristics has a negative b-value denoting a negative
relationship with residential satisfaction index of the phase 1 of low-cost
housing and all other 13 predictors have positive b-values showing positive
relationships. Therefore, as the increasing of satisfactions of the bedroom,
dining area, nearest school, parking facilities, drain, floor level (2nd
floor vs.
5th
floor), community clinic, resident’s workplace, corridor, nearest general
hospital, open space, local shops, and garbage disposal will probably
enhance the residential satisfaction of Yangguang Huayuan. Moreover, Field
(2011); (Field, 2013) clarified that the b-values explain more than this on
what degree each predictor influences the Dependent Variable if the effects
of all other predictors are held constant:
o Bedroom (b = 0.072): This value indicates that as the increasing of
satisfaction of bedroom by one unit, the residential satisfaction index
of Yangguang Huayuan increases by 0.072 units (7.2%). This
interpretation is true only if the effects of the dining area, nearest
school, Yangguang Huayuan’s parking facilities, drain, floor level
(2nd
floor vs. 5th
floor), community clinic, resident’s workplace,
corridor, nearest general hospital, occupation type (others vs.
management & professional), Yangguang Huayuan’s open space,
local shops and garbage disposal are held constant.
o Dining area (b = 0.051): This value shows that as the level of
satisfaction of dining area increases by one unit, the residential
satisfaction index increases by 0.051 units (5.1%). This interpretation
is true only if the effects of the bedroom, nearest school, parking
facilities, drain, floor level (2nd
floor vs. 5th
floor), community clinic,
resident’s workplace, corridor, nearest general hospital, occupation
type (others vs. management & professional), open space, local shops
and garbage disposal are held constant.
o Nearest School (b = 0.058): This value represents that the
respondents rating the satisfaction of the nearest school higher on the
satisfaction scale can bring additional 5.8% to residential satisfaction
index. This interpretation is true only if the effects of the bedroom,
dining area, parking facilities, drain, floor level (2nd
floor vs. 5th
floor),
community clinic, resident’s workplace, corridor, nearest general

393
hospital, occupation type (others vs. management & professional),
open space, local shops and garbage disposal are held constant.
o Yangguang Huayuan’s Parking facilities (b = 0.027): This value
refers to that the respondents to rate the satisfaction of Yangguang
Huayuan’s parking facilities higher on the satisfaction scale can bring
extra 2.7% to residential satisfaction index. This interpretation is true
only if the effects of the bedroom, dining area, nearest school, drain,
floor level (2nd
floor vs. 5th
floor), community clinic, resident’s
workplace, corridor, nearest general hospital, occupation type (others
vs. management & professional), open space, local shops and
garbage disposal are held constant.
o Drain (b = 0.038): This value implies that when the increasing of
satisfaction of drain by one unit, the residential satisfaction index
increases by 0.038 units (3.8%). This interpretation is true only if the
effects of the bedroom, dining area, nearest school, parking facilities,
floor level (2nd
floor vs. 5th
floor), community clinic, resident’s
workplace, corridor, nearest general hospital, occupation type (others
vs. management & professional), open space, local shops and
garbage disposal are held constant.
o Floor level (2nd
Floor vs. 5th
Floor) (b = 1.596): This value signifies
that the factor of 5th
floor contributes 159.6% to improving the
residential satisfaction index comparing to other predictors. In
particular, the change in the residential satisfaction index is greater
for the group of residents who are living on the 5th
floor than it is for
the group of residents who are living on the 2nd
floor. This
interpretation is true only if the effects of the bedroom, dining area,
nearest school, parking facilities, drain, community clinic, resident’s
workplace, corridor, nearest general hospital, occupation type (others
vs. management & professional), open space, local shops and
garbage disposal are held constant.
o Community Clinic (b = 0.037): This value conveys that the residents
to rate the satisfaction of community clinic higher on the satisfaction
scale could bring supplementary 3.7% to residential satisfaction
index. This interpretation is true only if the effects of the bedroom,
dining area, nearest school, parking facilities, drain, floor level
(2nd
floor vs. 5th
floor), resident’s workplace, corridor, nearest general
hospital, occupation type (others vs. management & professional),
open space, local shops and garbage disposal are held constant.
o Resident’s Workplace (b = 0.043): This value denotes that the
respondents to rate the satisfaction of their locations of workplaces
higher on the satisfaction scale can bring further 4.3% to residential
satisfaction index. This interpretation is true only if the effects of the
bedroom, dining area, nearest school, parking facilities, drain, floor
level (2nd
floor vs. 5th
floor), community clinic, corridor, nearest
general hospital, occupation type (others vs. management &
professional), open space, local shops and garbage disposal are held
constant.
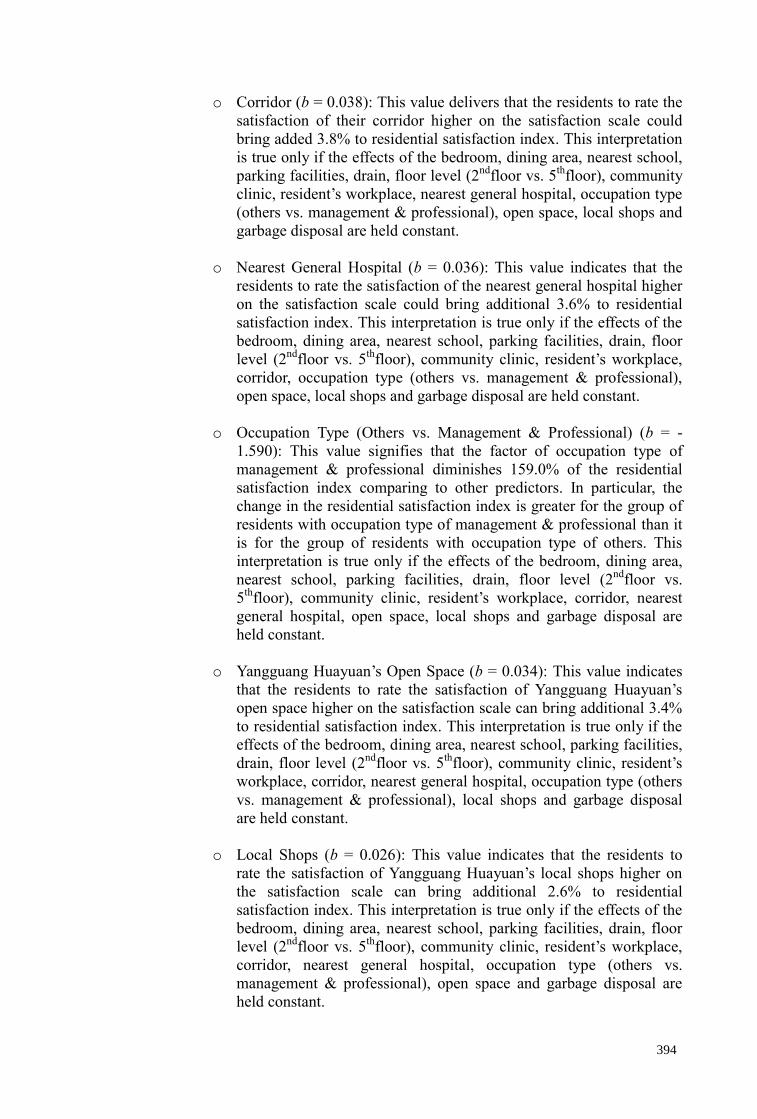
394
o Corridor (b = 0.038): This value delivers that the residents to rate the
satisfaction of their corridor higher on the satisfaction scale could
bring added 3.8% to residential satisfaction index. This interpretation
is true only if the effects of the bedroom, dining area, nearest school,
parking facilities, drain, floor level (2nd
floor vs. 5th
floor), community
clinic, resident’s workplace, nearest general hospital, occupation type
(others vs. management & professional), open space, local shops and
garbage disposal are held constant.
o Nearest General Hospital (b = 0.036): This value indicates that the
residents to rate the satisfaction of the nearest general hospital higher
on the satisfaction scale could bring additional 3.6% to residential
satisfaction index. This interpretation is true only if the effects of the
bedroom, dining area, nearest school, parking facilities, drain, floor
level (2nd
floor vs. 5th
floor), community clinic, resident’s workplace,
corridor, occupation type (others vs. management & professional),
open space, local shops and garbage disposal are held constant.
o Occupation Type (Others vs. Management & Professional) (b = -
1.590): This value signifies that the factor of occupation type of
management & professional diminishes 159.0% of the residential
satisfaction index comparing to other predictors. In particular, the
change in the residential satisfaction index is greater for the group of
residents with occupation type of management & professional than it
is for the group of residents with occupation type of others. This
interpretation is true only if the effects of the bedroom, dining area,
nearest school, parking facilities, drain, floor level (2nd
floor vs.
5th
floor), community clinic, resident’s workplace, corridor, nearest
general hospital, open space, local shops and garbage disposal are
held constant.
o Yangguang Huayuan’s Open Space (b = 0.034): This value indicates
that the residents to rate the satisfaction of Yangguang Huayuan’s
open space higher on the satisfaction scale can bring additional 3.4%
to residential satisfaction index. This interpretation is true only if the
effects of the bedroom, dining area, nearest school, parking facilities,
drain, floor level (2nd
floor vs. 5th
floor), community clinic, resident’s
workplace, corridor, nearest general hospital, occupation type (others
vs. management & professional), local shops and garbage disposal
are held constant.
o Local Shops (b = 0.026): This value indicates that the residents to
rate the satisfaction of Yangguang Huayuan’s local shops higher on
the satisfaction scale can bring additional 2.6% to residential
satisfaction index. This interpretation is true only if the effects of the
bedroom, dining area, nearest school, parking facilities, drain, floor
level (2nd
floor vs. 5th
floor), community clinic, resident’s workplace,
corridor, nearest general hospital, occupation type (others vs.
management & professional), open space and garbage disposal are
held constant.

395
o Garbage disposal (b = 0.023): This value indicates that the
respondents to rate the satisfaction of Yangguang Huayuan’s garbage
disposal higher on the satisfaction scale can bring additional 2.3% to
residential satisfaction index. This interpretation is true only if the
effects of the bedroom, dining area, nearest school, parking facilities,
drain, floor level (2nd
floor vs. 5th
floor), community clinic, resident’s
workplace, corridor, nearest general hospital, occupation type (others
vs. management & professional), open space and local shops are held
constant.
Field (2011); (Field, 2013) concluded that each of those b-values has an
associated standard error showing to what extent those values varied across
different samples and these standard errors determined whether or not the b-
values varied significantly from zero.
Additionally, a t-statistic can be derived that tests whether a b-value is
significantly different from 0. In the stepwise method regression, those t-
tests are conceptualized as measures of whether the predictor is making a
significant contribution to the model (Field, 2011, 2013). Thus, Field (2011);
(Field, 2013) concluded that if the t-test associated with a b-value is
significant (if the value in the column labelled Sig. < .05) then the predictor
is making a significant contribution to the model. It is implied that the
smaller the value of Sig. (and the larger the value of t) indicates that the
predictor contributes greater to the model (Field, 2011, 2013). In this model,
the bedroom (t (71) = 5.935, p < .001), the dining area (t (71) = 5.567, p
< .001), the nearest school (t (71) = 6.620, p < .001), the Yangguang
Huayuan’s parking facilities (t (71) = 2.951, p < .01), the drain (t (71) =
3.778, p < .001), the floor level (2nd
floor vs. 5th
floor) (t (71) = 3.180, p
< .01), the community clinic (t (71) = 3.546, p < .001), the resident’s
workplace (t (71) = 3.684, p < .001), the corridor (t (71) = 4.278, p < .001),
the nearest general hospital (t (71) = 3.256, p < .01), the occupation type
(others vs. management & professional) (t (71) = -2.070., p < .05), the
Yangguang Huayuan’s open space (t (71) = 2.686, p < .01), the local shops (t
(71) = 2.445., p < .05) and the garbage disposal (t (71) = 2.476., p < .05) are
all significant predictors of residential satisfaction index. Hence, from the
magnitude of the t-statistics, it is reported that the satisfactions with the
nearest school, bedroom, dining room, corridor, drain, resident’s workplace
and community clinic have the most impact and the satisfactions with the
nearest general hospital, Yangguang Huayuan’s parking facilities and open
space, and the floor level (2nd
floor vs. 5th
floor) have the moderately impact,
whereas the satisfactions with the garbage disposal, and local shops, and the
occupation type (others vs. management & professional) have less impact on
Yangguang Huayuan’s residential satisfaction index.
Comparing to the b-values and their significance regarded as acknowledged
exceedingly important statistics to be collected from Coefficients table of the
SPSS stepwise method regression, the standardized versions of the b-values
provided by SPSS (labelled as Beta, β1) are defined easier to interpret that
the dependent variable will change as a result of one standard deviation
change in the predictor and are all measured in standard deviation units and
to indicate how important those predictors in this model (Field, 2011, 2013).
In accordance with what the magnitude of the t-statistics explained above,
the standardized beta values for satisfactions of the nearest school, bedroom,

396
dining room, corridor, drain, resident’s workplace and community clinic are
virtually identical (.383, .350, .309, .239, .205, .207 and .194, respectively)
denoting that these seven variables have a comparable degree of importance
in the model, in addition, the satisfactions of the nearest general hospital,
floor level (2nd
floor vs. 5th
floor), Yangguang Huayuan’s parking facilities
and open space also have a comparable degree of importance in the model
(.197, .174, .168 and .150, respectively) and the satisfactions of the garbage
disposal, local shops and occupation type (others vs. management &
professional) have a comparable degree of importance in the model as well
(.141, .140 and -.117, respectively).
Bedroom (standardized β = .350): This value indicates that as the
satisfaction of bedroom increases by one standard deviation
(19.333%), the residential satisfaction index increases by 0.350
standard deviations. The standard deviation for the residential
satisfaction index is 3.957 and so this constitutes a change of 1.385%
(0.350 × 3.957). So, as every 19.333% more increased on the
satisfaction of bedroom, an additional 1.385% increase in the
residential satisfaction index can be achieved. This interpretation is
true only if the effects of the dining area, nearest school, parking
facilities, drain, floor level (2nd
floor vs. 5th
floor), community clinic,
resident’s workplace, corridor, nearest general hospital, occupation
type (others vs. management & professional), open space, local shops
and garbage disposal are held constant.
Dining area (standardized β = .309): This value indicates that as the
satisfaction of dining area improves by one standard deviation
(24.128%), the residential satisfaction index enhances by 0.309
standard deviations. The standard deviation for the residential
satisfaction index is 3.957 and so this constitutes a change of 1.223%
(0.309 × 3.957). Therefore, for each 24.128% more increased on the
satisfaction of dining area, an additional 1.223% upsurge in the
residential satisfaction index can be expected. This interpretation is
true only if the effects of the bedroom, nearest school, parking
facilities, drain, floor level (2nd
floor vs. 5th
floor), community clinic,
resident’s workplace, corridor, nearest general hospital, occupation
type (others vs. management & professional), open space, local shops
and garbage disposal are held constant.
Nearest School (standardized β = .383): This value indicates that as
the satisfaction of the nearest school rises by one standard deviation
(26.110%), the residential satisfaction index grows by 0.383 standard
deviations. The standard deviation for the residential satisfaction
index is 3.957 and so this represents a change of 1.516% (0.383 ×
3.957). Therefore, as every 26.11% more added on the satisfaction of
the nearest school, an additional 1.516% growth in the residential
satisfaction index can be achieved. This interpretation is true only if
the effects of the bedroom, dining area, parking facilities, drain, floor
level (2nd
floor vs. 5th
floor), community clinic, resident’s workplace,
corridor, nearest general hospital, occupation type (others vs.
management & professional), open space, local shops and garbage
disposal are held constant.
Parking facilities (standardized β = .168): This value indicates that as
the satisfaction of Yangguang Huayuan’s parking facilities escalates
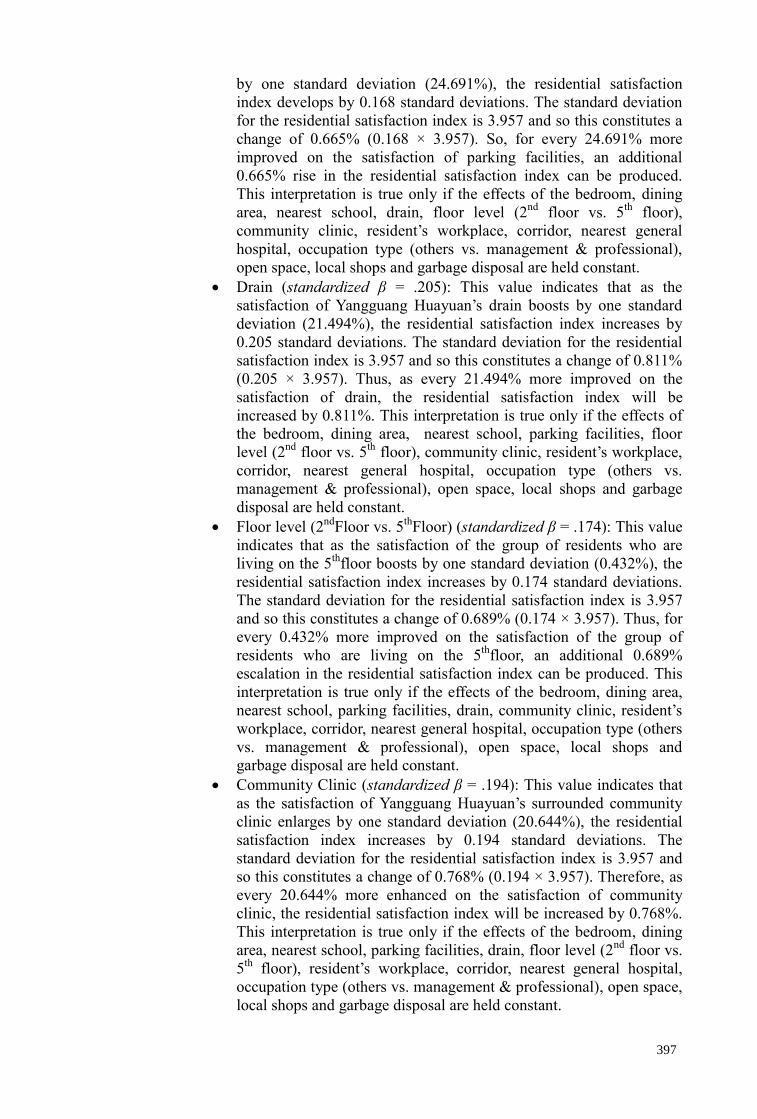
397
by one standard deviation (24.691%), the residential satisfaction
index develops by 0.168 standard deviations. The standard deviation
for the residential satisfaction index is 3.957 and so this constitutes a
change of 0.665% (0.168 × 3.957). So, for every 24.691% more
improved on the satisfaction of parking facilities, an additional
0.665% rise in the residential satisfaction index can be produced.
This interpretation is true only if the effects of the bedroom, dining
area, nearest school, drain, floor level (2nd
floor vs. 5th
floor),
community clinic, resident’s workplace, corridor, nearest general
hospital, occupation type (others vs. management & professional),
open space, local shops and garbage disposal are held constant.
Drain (standardized β = .205): This value indicates that as the
satisfaction of Yangguang Huayuan’s drain boosts by one standard
deviation (21.494%), the residential satisfaction index increases by
0.205 standard deviations. The standard deviation for the residential
satisfaction index is 3.957 and so this constitutes a change of 0.811%
(0.205 × 3.957). Thus, as every 21.494% more improved on the
satisfaction of drain, the residential satisfaction index will be
increased by 0.811%. This interpretation is true only if the effects of
the bedroom, dining area, nearest school, parking facilities, floor
level (2nd
floor vs. 5th
floor), community clinic, resident’s workplace,
corridor, nearest general hospital, occupation type (others vs.
management & professional), open space, local shops and garbage
disposal are held constant.
Floor level (2nd
Floor vs. 5th
Floor) (standardized β = .174): This value
indicates that as the satisfaction of the group of residents who are
living on the 5th
floor boosts by one standard deviation (0.432%), the
residential satisfaction index increases by 0.174 standard deviations.
The standard deviation for the residential satisfaction index is 3.957
and so this constitutes a change of 0.689% (0.174 × 3.957). Thus, for
every 0.432% more improved on the satisfaction of the group of
residents who are living on the 5th
floor, an additional 0.689%
escalation in the residential satisfaction index can be produced. This
interpretation is true only if the effects of the bedroom, dining area,
nearest school, parking facilities, drain, community clinic, resident’s
workplace, corridor, nearest general hospital, occupation type (others
vs. management & professional), open space, local shops and
garbage disposal are held constant.
Community Clinic (standardized β = .194): This value indicates that
as the satisfaction of Yangguang Huayuan’s surrounded community
clinic enlarges by one standard deviation (20.644%), the residential
satisfaction index increases by 0.194 standard deviations. The
standard deviation for the residential satisfaction index is 3.957 and
so this constitutes a change of 0.768% (0.194 × 3.957). Therefore, as
every 20.644% more enhanced on the satisfaction of community
clinic, the residential satisfaction index will be increased by 0.768%.
This interpretation is true only if the effects of the bedroom, dining
area, nearest school, parking facilities, drain, floor level (2nd
floor vs.
5th
floor), resident’s workplace, corridor, nearest general hospital,
occupation type (others vs. management & professional), open space,
local shops and garbage disposal are held constant.

398
Resident’s Workplace (standardized β = .207): This value indicates
that as the satisfaction of the location of resident’s workplace
enlarges by one standard deviation (19.232%), the residential
satisfaction index increases by 0.207 standard deviations. The
standard deviation for the residential satisfaction index is 3.957 and
so this constitutes a change of 0.819% (0.207 × 3.957). Thus, for
every 19.232% more improved on the satisfaction of the location of
resident’s workplace, the residential satisfaction index will be
increased by 0.819%. This interpretation is true only if the effects of
the bedroom, dining area, nearest school, parking facilities, drain,
floor level (2nd
floor vs. 5th
floor), community clinic, corridor, nearest
general hospital, occupation type (others vs. management &
professional), open space, local shops and garbage disposal are held
constant.
Corridor (standardized β = .239): This value indicates that as the
satisfaction of corridor increases by one standard deviation
(24.773%), the residential satisfaction index increases by 0.239
standard deviations. The standard deviation for the residential
satisfaction index is 3.957 and so this constitutes a change of 0.946%
(0.239 × 3.957). Thus, as every 24.773% more improved on the
satisfaction of corridor, the residential satisfaction index will be
increased by 0.946%. This interpretation is true only if the effects of
the bedroom, dining area, nearest school, parking facilities, drain,
floor level (2nd
floor vs. 5th
floor), community clinic, resident’s
workplace, nearest general hospital, occupation type (others vs.
management & professional), open space, local shops and garbage
disposal are held constant.
Nearest General Hospital (standardized β = .197): This value
indicates that as the satisfaction of the nearest general hospital rises
by one standard deviation (21.944%), the residential satisfaction
index increases by 0.197 standard deviations. The standard deviation
for the residential satisfaction index is 3.957 and so this constitutes a
change of 0.780% (0.197 × 3.957). As a result, for each 21.944%
more enhanced on the satisfaction of the nearest general hospital, the
residential satisfaction index will be enlarged by 0.780%. This
interpretation is true only if the effects of the bedroom, dining area,
nearest school, parking facilities, drain, floor level (2nd
floor vs. 5th
floor), community clinic, resident’s workplace, corridor, occupation
type (others vs. management & professional), open space, local shops
and garbage disposal are held constant.
Occupation Type (Others vs. Management & Professional)
(standardized β = -.117): This value indicates that as the
dissatisfaction of the group of residents who have the occupation type
of management & professional increases by one standard deviation
(0.292%), the residential satisfaction index decreases by 0.117
standard deviations. The standard deviation for the residential
satisfaction index is 3.9572 and so this constitutes a change of -
0.463% (-0.117 × 3.957). So, as every 0.292% more increased on the
dissatisfaction of the group of residents who have the occupation type
of management & professional, the residential satisfaction index will
be decreased by 0.463%. This interpretation is true only if the effects
of the bedroom, dining area, nearest school, parking facilities, drain,

399
floor level (2nd
floor vs. 5th
floor), community clinic, resident’s
workplace, corridor, nearest general hospital, open space, local shops
and garbage disposal are held constant.
Yangguang Huayuan’s Open Space (standardized β = .150): This
value indicates that as the satisfaction of Yangguang Huayuan’s open
space intensifies by one standard deviation (17.453%), the residential
satisfaction index increases by 0.150 standard deviations. The
standard deviation for the residential satisfaction index is 3.957 and
so this constitutes a change of 0.594% (0.150 × 3.957). So, as each
17.453% more enhanced on the satisfaction of Yangguang Huayuan’s
open space, the residential satisfaction index will be enhanced by
0.594%. This interpretation is true only if the effects of the bedroom,
dining area, nearest school, parking facilities, drain, floor level (2nd
floor vs. 5th
floor), community clinic, resident’s workplace, corridor,
nearest general hospital, occupation type (others vs. management &
professional), local shops and garbage disposal are held constant.
Local Shops (standardized β = .140): This value indicates that as the
satisfaction of Yangguang Huayuan’s local shops grows by one
standard deviation (21.125%), the residential satisfaction index
increases by 0.140 standard deviations. The standard deviation for the
residential satisfaction index is 3.957 and so this constitutes a change
of 0.554% (0.140 × 3.957). Then, as every 21.125% more improved
on the satisfaction of Yangguang Huayuan’s local shops, an
additional 0.554% growth in the residential satisfaction index can be
produced. This interpretation is true only if the effects of the
bedroom, dining area, nearest school, parking facilities, drain, floor
level (2nd
floor vs. 5th
floor), community clinic, resident’s workplace,
corridor, nearest general hospital, occupation type (others vs.
management & professional), open space and garbage disposal are
held constant.
Garbage disposal (standardized β = .141): This value indicates that as
the satisfaction of Yangguang Huayuan’s garbage disposal increases
by one standard deviation (24.632%), the residential satisfaction
index increases by 0.141 standard deviations. The standard deviation
for the residential satisfaction index is 3.957 and so this constitutes a
change of 0.558% (0.141 × 3.957). Thus, as every 24.632% more
increased on the satisfaction of Yangguang Huayuan’s garbage
disposal, the residential satisfaction index will be added by 0.558%.
This interpretation is true only if the effects of the bedroom, dining
area, nearest school, parking facilities, drain, floor level (2nd
floor vs.
5th
floor), community clinic, resident’s workplace, corridor, nearest
general hospital, occupation type (others vs. management &
professional), open space and local shops are held constant.
Field (2011); (Field, 2013) defined that the confidence intervals of the
unstandardized beta values are boundaries constructed such that in 95% of
these samples these boundaries will contain the true value of b also
indicating that 95% of these confidence intervals would contain the true
value of b. Thus, Field’s (2011, 2013) conclusion assured that the confidence
intervals constructed for the Yangguang Huayuan’s sample will contain the
true value of b in the population. In accordance with Field’s (2011, 2013)
writings, a good model should have a small confidence interval which
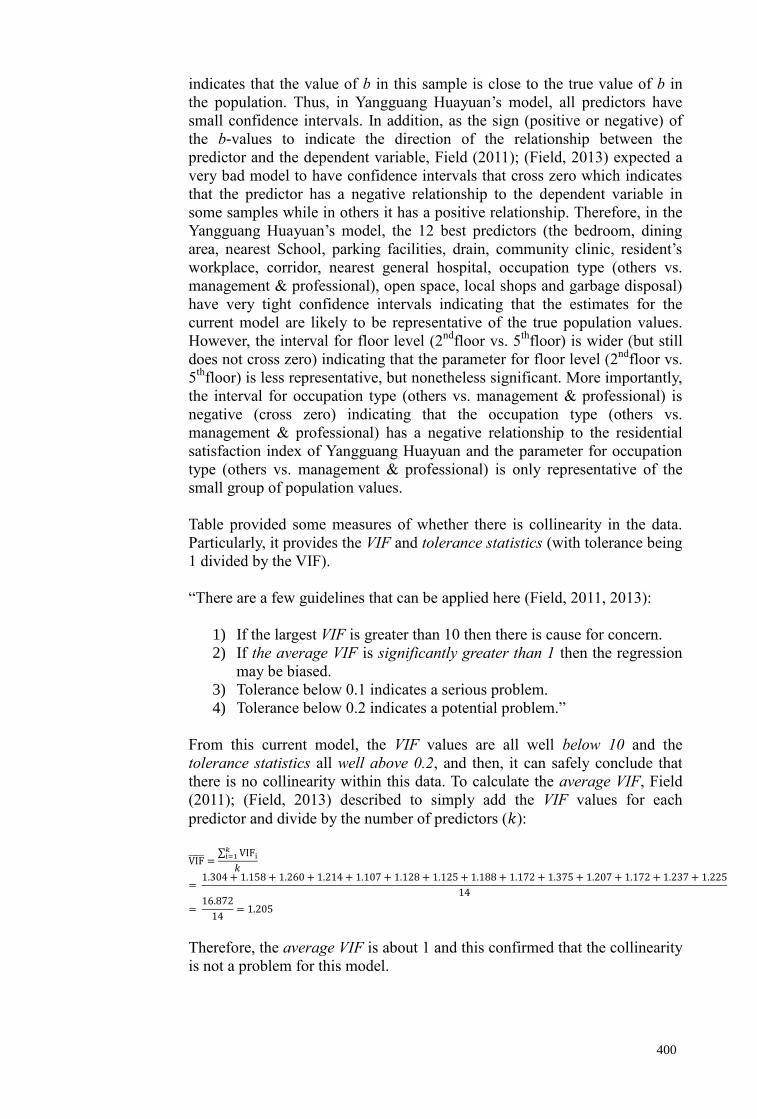
400
indicates that the value of b in this sample is close to the true value of b in
the population. Thus, in Yangguang Huayuan’s model, all predictors have
small confidence intervals. In addition, as the sign (positive or negative) of
the b-values to indicate the direction of the relationship between the
predictor and the dependent variable, Field (2011); (Field, 2013) expected a
very bad model to have confidence intervals that cross zero which indicates
that the predictor has a negative relationship to the dependent variable in
some samples while in others it has a positive relationship. Therefore, in the
Yangguang Huayuan’s model, the 12 best predictors (the bedroom, dining
area, nearest School, parking facilities, drain, community clinic, resident’s
workplace, corridor, nearest general hospital, occupation type (others vs.
management & professional), open space, local shops and garbage disposal)
have very tight confidence intervals indicating that the estimates for the
current model are likely to be representative of the true population values.
However, the interval for floor level (2nd
floor vs. 5th
floor) is wider (but still
does not cross zero) indicating that the parameter for floor level (2nd
floor vs.
5th
floor) is less representative, but nonetheless significant. More importantly,
the interval for occupation type (others vs. management & professional) is
negative (cross zero) indicating that the occupation type (others vs.
management & professional) has a negative relationship to the residential
satisfaction index of Yangguang Huayuan and the parameter for occupation
type (others vs. management & professional) is only representative of the
small group of population values.
Table provided some measures of whether there is collinearity in the data.
Particularly, it provides the VIF and tolerance statistics (with tolerance being
1 divided by the VIF).
“There are a few guidelines that can be applied here (Field, 2011, 2013):
1) If the largest VIF is greater than 10 then there is cause for concern.
2) If the average VIF is significantly greater than 1 then the regression
may be biased.
3) Tolerance below 0.1 indicates a serious problem.
4) Tolerance below 0.2 indicates a potential problem.”
From this current model, the VIF values are all well below 10 and the
tolerance statistics all well above 0.2, and then, it can safely conclude that
there is no collinearity within this data. To calculate the average VIF, Field
(2011); (Field, 2013) described to simply add the VIF values for each
predictor and divide by the number of predictors (𝑘):
VIF̅̅̅̅̅ =∑ VIFi
𝑘i=1
𝑘
= 1.304 + 1.158 + 1.260 + 1.214 + 1.107 + 1.128 + 1.125 + 1.188 + 1.172 + 1.375 + 1.207 + 1.172 + 1.237 + 1.225
14
= 16.872
14= 1.205
Therefore, the average VIF is about 1 and this confirmed that the collinearity
is not a problem for this model.

401
Phase 2 Low-Cost Housing (Chengshi Huayuan in Chinese) in Xuzhou
city, Jiangsu Province, China
Descriptives Table: Descriptive Statistics
Mean Std.
Deviation N
Chengshi Huayuan’s Residential Satisfaction Index
(%) 56.947 2.728 95
Gender (Female vs. Male) 0.695 0.463 95
Age (Age21-30 vs. Age31-40) 0.105 0.309 95
Age (Age21-30 vs. Age41-50) 0.284 0.453 95
Age (Age21-30 vs. Age51-60) 0.232 0.424 95
Age (Age21-30 vs. Above Age60) 0.232 0.424 95
Education attainment (Master Degree and above vs. Primary school) 0.147 0.356 95
Education attainment (Master Degree and above vs. Junior middle school) 0.221 0.417 95
Education attainment (Master Degree and above vs. Senior middle school) 0.200 0.402 95
Education attainment (Master Degree and above vs. Diploma) 0.326 0.471 95
Education attainment (Master Degree and above vs. Bachelor Degree) 0.074 0.263 95
Marital status (Widowed/Divorced vs. Single) 0.053 0.224 95
Marital status (Widowed/Divorced vs. Married) 0.926 0.263 95
Household size (1 people vs. 2 people) 0.379 0.488 95
Household size (1 people vs. 3 people) 0.600 0.492 95
Occupation sector (Government Servant vs. State-owned enterprise (SOE)) 0.137 0.346 95
Occupation sector (Government Servant vs. Collective-owned enterprise (COE)) 0.274 0.448 95
Occupation sector (Government Servant vs. Private business) 0.526 0.502 95
Occupation sector (Government Servant vs. Own business) 0.032 0.176 95
Occupation type (Others vs. Management & Professional) 0.021 0.144 95
Occupation type (Others vs. Technical & Administrative Support) 0.179 0.385 95
Occupation type (Others vs. Services & Operation) 0.389 0.490 95
Monthly net income of Household (aboveRMB8,000 vs. RMB0-1,999) 0.011 0.103 95
Monthly net income of Household (aboveRMB8,000 vs. RMB2,000-3,999) 0.147 0.356 95
Monthly net income of Household (aboveRMB8,000 vs. RMB4,000-5,999) 0.589 0.495 95
Monthly net income of Household (aboveRMB8,000 vs. RMB6,000-7,999) 0.232 0.424 95
Floor level (2ndFloor vs. 1stFloor) 0.116 0.322 95
Floor level (2ndFloor vs. 3rdFloor) 0.189 0.394 95
Floor level (2ndFloor vs. 4thFloor) 0.116 0.322 95
Floor level (2ndFloor vs. 5thFloor) 0.242 0.431 95
Floor level (2ndFloor vs. 6thFloor) 0.179 0.385 95
Length of Residence (>3, <=5years vs. >5, <=7years) 0.821 0.385 95
Main Means of Transportation (By Driving vs. By Cycling) 0.516 0.502 95
Main Means of Transportation (By Driving vs. By Bus) 0.347 0.479 95
Main Means of Transportation (By Driving vs. By Foot) 0.116 0.322 95
Living room 62.702 16.655 95
Dining area 57.789 18.300 95
Master bedroom 67.123 16.750 95
Bedroom 65.229 15.939 95
Kitchen 62.315 16.142 95
Toilet 53.930 17.225 95
Drying area 61.544 16.848 95
Drain 62.947 17.678 95
Electrical & Telecommunication wiring 55.053 18.843 95
Firefighting equipment 52.947 18.955 95
Street lighting 57.684 18.010 95

402
Table, continued
Mean Std.
Deviation N
Chengshi Huayuan’s Residential Satisfaction Index
(%) 56.947 2.728 95
Staircases 60.684 18.887 95
Corridor 55.789 19.342 95
Garbage disposal 60.947 18.627 95
Chengshi Huayuan's Open Space 54.158 14.779 95
Chengshi Huayuan's Children's Playground 50.053 18.328 95
Chengshi Huayuan's Parking facilities 51.316 18.119 95
Chengshi Huayuan's Perimeter road 58.789 14.870 95
Chengshi Huayuan's Pedestrian walkways 54.211 17.615 95
Local Shops 59.579 16.172 95
Local Kindergarten 50.158 19.136 95
Chengshi Huayuan's Fitness equipment 57.263 18.332 95
Community Relationship 63.684 18.740 95
Quietness of housing estate 52.842 18.661 95
Local Crime situation 60.211 16.630 95
Local Accident situation 62.947 18.899 95
Local Security control 54.632 16.873 95
Resident's Workplace 44.632 16.810 95
Community Clinic 62.842 20.663 95
Nearest General Hospital 46.421 19.782 95
Local Police Station 56.421 16.368 95
Nearest School 57.474 18.848 95
Local Market 61.053 18.989 95
Nearest Fire Station 57.895 17.619 95
Nearest Bus/Taxi Station 50.947 17.869 95
Urban Centre 45.895 17.166 95
Source: SPSS OUTPUT, Descriptive Statistics
The descriptive statistics table indicates the mean and standard deviation of
each variable in Chengshi Huayuan’s data set and thus, it obviously presents
that the average residential satisfaction index is 56.947%.

403
Table: Correlations
Residential Satisfaction
Index (%)
Pearson
Correlation
Chengshi Huayuan's Residential Satisfaction Index (%) 1.000
Gender (Female vs. Male) .026
Age (Age21-30 vs. Age31-40) .025
Age (Age21-30 vs. Age41-50) -.187
Age (Age21-30 vs. Age51-60) .048
Age (Age21-30 vs. Above Age60) .048
Education attainment (Master Degree and above vs. Primary school) .083
Education attainment (Master Degree and above vs. Junior middle school) -.089
Education attainment (Master Degree and above vs. Senior middle school) .013
Education attainment (Master Degree and above vs. Diploma) .030
Education attainment (Master Degree and above vs. Bachelor Degree) -.062
Marital status (Widowed/Divorced vs. Single) .029
Marital status (Widowed/Divorced vs. Married) -.077
Household size (1 people vs. 2 people) .061
Household size (1 people vs. 3 people) -.089
Occupation sector (Government Servant vs. State-owned enterprise (SOE)) .143
Occupation sector (Government Servant vs. Collective-owned enterprise (COE)) -.033
Occupation sector (Government Servant vs. Private business) -.072
Occupation sector (Government Servant vs. Own business) -.019
Occupation type (Others vs. Management & Professional) -.137
Occupation type (Others vs. Technical & Administrative Support) -.010
Occupation type (Others vs. Services & Operation) -.048
Monthly net income of Household (aboveRMB8,000 vs. RMB0-1,999) .060
Monthly net income of Household (aboveRMB8,000 vs. RMB2,000-3,999) .013
Monthly net income of Household (aboveRMB8,000 vs. RMB4,000-5,999) -.005
Monthly net income of Household (aboveRMB8,000 vs. RMB6,000-7,999) .026
Floor level (2ndFloor vs. 1stFloor) .075
Floor level (2ndFloor vs. 3rdFloor) -.206
Floor level (2ndFloor vs. 4thFloor) -.026
Floor level (2ndFloor vs. 5thFloor) .145
Floor level (2ndFloor vs. 6thFloor) -.066
Length of Residence (>3, <=5years vs. >5, <=7years) .192
Main Means of Transportation (By Driving vs. By Cycling) -.045
Main Means of Transportation (By Driving vs. By Bus) -.063
Main Means of Transportation (By Driving vs. By Foot) .224
Living room .175
Dining area .053
Master bedroom .243
Bedroom .180
Kitchen .102
Toilet .160
Drying area .082

404
Table, continued
Residential
Satisfaction
Index (%)
Pearson Correlation
Chengshi Huayuan's Residential Satisfaction Index (%) 1.000
Drain .154
Electrical & Telecommunication wiring .279
Firefighting equipment -.053
Street lighting .076
Staircases .215
Corridor .247
Garbage disposal .163
Chengshi Huayuan's Open Space .236
Chengshi Huayuan's Children's Playground .094
Chengshi Huayuan's Parking facilities .011
Chengshi Huayuan's Perimeter road .113
Chengshi Huayuan's Pedestrian walkways .307
Local Shops .255
Local Kindergarten .249
Chengshi Huayuan's Fitness equipment -.017
Community Relationship .229
Quietness of housing estate .196
Local Crime situation .414
Local Accident situation .304
Local Security control .150
Resident's Workplace -.226
Community Clinic .090
Nearest General Hospital -.015
Local Police Station .137
Nearest School .169
Local Market .185
Nearest Fire Station .082
Nearest Bus/Taxi Station .232
Urban Centre .284
Sig. (1-
tailed)
Chengshi Huayuan’s Residential Satisfaction Index (%)
Gender (Female vs. Male) .402
Age (Age21-30 vs. Age31-40) .406
Age (Age21-30 vs. Age41-50) .034
Age (Age21-30 vs. Age51-60) .321
Age (Age21-30 vs. Above Age60) .321
Education attainment (Master Degree and above vs. Primary school) .213
Education attainment (Master Degree and above vs. Junior middle school) .195
Education attainment (Master Degree and above vs. Senior middle school) .449
Education attainment (Master Degree and above vs. Diploma) .387
Education attainment (Master Degree and above vs. Bachelor Degree) .277
Marital status (Widowed/Divorced vs. Single) .391

405
Table, continued
Sig.
(1-tailed)
Chengshi Huayuan’s Residential Satisfaction Index (%)
Marital status (Widowed/Divorced vs. Married) .228
Household size (1 people vs. 2 people) .279
Household size (1 people vs. 3 people) .197
Occupation sector (Government Servant vs. State-owned enterprise (SOE)) .083
Occupation sector (Government Servant vs. Collective-owned enterprise (COE)) .376
Occupation sector (Government Servant vs. Private business) .245
Occupation sector (Government Servant vs. Own business) .429
Occupation type (Others vs. Management & Professional) .094
Occupation type (Others vs. Technical & Administrative Support) .460
Occupation type (Others vs. Services & Operation) .323
Monthly net income of Household (aboveRMB8,000 vs. RMB0-1,999) .283
Monthly net income of Household (aboveRMB8,000 vs. RMB2,000-3,999) .449
Monthly net income of Household (aboveRMB8,000 vs. RMB4,000-5,999) .480
Monthly net income of Household (aboveRMB8,000 vs. RMB6,000-7,999) .402
Floor level (2ndFloor vs. 1stFloor) .236
Floor level (2ndFloor vs. 3rdFloor) .023
Floor level (2ndFloor vs. 4thFloor) .400
Floor level (2ndFloor vs. 5thFloor) .081
Floor level (2ndFloor vs. 6thFloor) .264
Length of Residence (>3, <=5years vs. >5, <=7years) .031
Main Means of Transportation (By Driving vs. By Cycling) .334
Main Means of Transportation (By Driving vs. By Bus) .271
Main Means of Transportation (By Driving vs. By Foot) .015
Living room .045
Dining area .306
Master bedroom .009
Bedroom .040
Kitchen .164
Toilet .061
Drying area .214
Drain .068
Electrical & Telecommunication wiring .003
Firefighting equipment .305
Street lighting .231
Staircases .018
Corridor .008
Garbage disposal .057
Chengshi Huayuan's Open Space .011
Chengshi Huayuan's Children's Playground .182
Chengshi Huayuan's Parking facilities .458
Chengshi Huayuan's Perimeter road .137
Chengshi Huayuan's Pedestrian walkways .001
Local Shops .006
Local Kindergarten .008

406
Table, continued
Sig. (1-
tailed)
Chengshi Huayuan’s Residential Satisfaction Index (%)
Chengshi Huayuan's Fitness equipment .434
Community Relationship .013
Quietness of housing estate .028
Local Crime situation .000
Local Accident situation .001
Local Security control .074
Resident's Workplace .014
Community Clinic .193
Nearest General Hospital .443
Local Police Station .093
Nearest School .051
Local Market .036
Nearest Fire Station .216
Nearest Bus/Taxi Station .012
Urban Centre .003
N
Chengshi Huayuan's Residential Satisfaction Index (%) 95
Gender (Female vs. Male) 95
Age (Age21-30 vs. Age31-40) 95
Age (Age21-30 vs. Age41-50) 95
Age (Age21-30 vs. Age51-60) 95
Age (Age21-30 vs. Above Age60) 95
Education attainment (Master Degree and above vs. Primary school) 95
Education attainment (Master Degree and above vs. Junior middle school) 95
Education attainment (Master Degree and above vs. Senior middle school) 95
Education attainment (Master Degree and above vs. Diploma) 95
Education attainment (Master Degree and above vs. Bachelor Degree) 95
Marital status (Widowed/Divorced vs. Single) 95
Marital status (Widowed/Divorced vs. Married) 95
Household size (1 people vs. 2 people) 95
Household size (1 people vs. 3 people) 95
Occupation sector (Government Servant vs. State-owned enterprise (SOE)) 95
Occupation sector (Government Servant vs. Collective-owned enterprise (COE)) 95
Occupation sector (Government Servant vs. Private business) 95
Occupation sector (Government Servant vs. Own business) 95
Occupation type (Others vs. Management & Professional) 95
Occupation type (Others vs. Technical & Administrative Support) 95
Occupation type (Others vs. Services & Operation) 95
Monthly net income of Household (aboveRMB8,000 vs. RMB0-1,999) 95
Monthly net income of Household (aboveRMB8,000 vs. RMB2,000-3,999) 95
Monthly net income of Household (aboveRMB8,000 vs. RMB4,000-5,999) 95
Monthly net income of Household (aboveRMB8,000 vs. RMB6,000-7,999) 95
Floor level (2ndFloor vs. 1stFloor) 95
Floor level (2ndFloor vs. 3rdFloor) 95
Floor level (2ndFloor vs. 4thFloor) 95

407
Table, continued
N
Chengshi Huayuan’s Residential Satisfaction Index (%) 95
Floor level (2ndFloor vs. 5thFloor) 95
Floor level (2ndFloor vs. 6thFloor) 95
Length of Residence (>3, <=5years vs. >5, <=7years) 95
Main Means of Transportation (By Driving vs. By Cycling) 95
Main Means of Transportation (By Driving vs. By Bus) 95
Main Means of Transportation (By Driving vs. By Foot) 95
Living room 95
Dining area 95
Master bedroom 95
Bedroom 95
Kitchen 95
Toilet 95
Drying area 95
Drain 95
Electrical & Telecommunication wiring 95
Firefighting equipment 95
Street lighting 95
Staircases 95
Corridor 95
Garbage disposal 95
Chengshi Huayuan's Open Space 95
Chengshi Huayuan's Children's Playground 95
Chengshi Huayuan's Parking facilities 95
Chengshi Huayuan's Perimeter road 95
Chengshi Huayuan's Pedestrian walkways 95
Local Shops 95
Local Kindergarten 95
Chengshi Huayuan's Fitness equipment 95
Community Relationship 95
Quietness of housing estate 95
Local Crime situation 95
Local Accident situation 95
Local Security control 95
Resident's Workplace 95
Community Clinic 95
Nearest General Hospital 95
Local Police Station 95
Nearest School 95
Local Market 95
Nearest Fire Station 95
Nearest Bus/Taxi Station 95
Urban Centre 95
Source: SPSS OUTPUT, Correlations
In the correlation matrix table, three things were mentioned in this table, i.e.
first, the value of Pearson’s correlation coefficient between every pair of
variables (for example, the local crime situation had the largest positive
correlation with the residential satisfaction index of Chengshi Huayuan, r
= .414, whereas the resident’s workplace had the largest negative correlation
with the residential satisfaction index of Chengshi Huayuan, r = -.226).
Second, the one-tailed significance of each correlation is displayed (for
example, the local crime situation, Chengshi Huayuan’s pedestrian

408
walkways, local accident situation, urban centre, electrical &
telecommunication wiring, local shops, local kindergarten, corridor, master
bedroom, Chengshi Huayuan’s open space, nearest bus/taxi station,
community relationship, residents’ workplace, main means of transportation
(by driving vs. by foot), staircases, floor level (2nd
floor vs. 3rd
floor),
quietness of housing estate, length of residence (>3, <=5 years vs. >5, <= 7
years), age (age21-30 vs. age41-50), local market, bedroom, living room had
varying degrees of significant correlations with the residential satisfaction
index, p < .001, p < .01, p < .01, p < .01, p < .01, p < .01, p < .01, p < .01, p
< .01, p < .05, p < .05, p < .05, p < .05, p < .05, p < .05, p < .05, p < .05, p
< .05, p < .05, p < .05, p < .05, p < .05, respectively). Finally, the number of
cases contributing to each correlation (N = 95) is shown.
Thus, the local crime situation amongst all the variables correlated best with
the residential satisfaction index (r = .414, p < .001) and so it is likely that
this variable might have best predicted the outcome. In addition, there is no
multicollinearity in the data (no substantial correlations (r > .9) between
variables).

409
Summary of model
Table: Model Summaryo
Model R R
Square
Adjusted
R Square
Std. Error of the
Estimate
Change Statistics Durbin-
Watson R Square
Change
F
Change df1 df2
Sig. F
Change
1 .414a .171 .162 2.49661 .171 19.200 1 93 .000
2 .518b .269 .253 2.35754 .098 12.295 1 92 .001
3 .614c .377 .356 2.18867 .108 15.744 1 91 .000
4 .666d .444 .419 2.07920 .067 10.834 1 90 .001
5 .703e .494 .465 1.99439 .050 8.818 1 89 .004
6 .735f .540 .508 1.91278 .046 8.756 1 88 .004
7 .758g .575 .541 1.84862 .035 7.215 1 87 .009
8 .783h .613 .577 1.77418 .038 8.454 1 86 .005
9 .799i .638 .600 1.72474 .026 6.001 1 85 .016
10 .821j .674 .635 1.64798 .035 9.103 1 84 .003
11 .842k .709 .670 1.56641 .035 9.976 1 83 .002
12 .861l .741 .704 1.48481 .033 10.374 1 82 .002
13 .869m .756 .717 1.45137 .015 4.823 1 81 .031
14 .867n .752 .715 1.45569 -.004 1.489 1 81 .226 2.205
a. Predictors: (Constant), Local Crime situation
b. Predictors: (Constant), Local Crime situation, Staircases
c. Predictors: (Constant), Local Crime situation, Staircases, Local Kindergarten
d. Predictors: (Constant), Local Crime situation, Staircases, Local Kindergarten, Nearest Schools
e. Predictors: (Constant), Local Crime situation, Staircases, Local Kindergarten, Nearest Schools, Toilet
f. Predictors: (Constant), Local Crime situation, Staircases, Local Kindergarten, Nearest Schools, Toilet, Main Means of
Transportation (By Driving vs. By Foot)
g. Predictors: (Constant), Local Crime situation, Staircases, Local Kindergarten, Nearest Schools, Toilet, Main Means of
Transportation (By Driving vs. By Foot), Bedroom
h. Predictors: (Constant), Local Crime situation, Staircases, Local Kindergarten, Nearest Schools, Toilet, Main Means of
Transportation (By Driving vs. By Foot), Bedroom, Local shops
i. Predictors: (Constant), Local Crime situation, Staircases, Local Kindergarten, Nearest Schools, Toilet, Main Mean of
Transportation (By Driving vs. By Foot), Bedroom, Local shops, Local Accident situation
j. Predictors: (Constant), Local Crime situation, Staircases, Local Kindergarten, Nearest Schools, Toilet, Main Means of
Transportation (By Driving vs. By Foot), Bedroom, Local shops, Local Accident situation, Drying area
k. Predictors: (Constant), Local Crime situation, Staircases, Local Kindergarten, Nearest Schools, Toilet, Main Means of
Transportation (By Driving vs. By Foot), Bedroom, Local shops, Local Accident situation, Drying area, Nearest Bus/Taxi Station
l. Predictors: (Constant), Local Crime situation, Staircases, Local Kindergarten, Nearest Schools, Toilet, Main Mean of
Transportation (By Driving vs. By Foot), Bedroom, Local shops, Local Accident situation, Drying area, Nearest Bus/Taxi Station,
Chengshi Huayuan's Children's Playground
m. Predictors: (Constant), Local Crime situation, Staircases, Local Kindergarten, Nearest Schools, Toilet, Main Means of
Transportation (By Driving vs. By Foot), Bedroom, Local shops, Local Accident situation, Drying area, Nearest Bus/Taxi Station,
Chengshi Huayuan's Children's Playground, Corridor
n. Predictors: (Constant), Local Crime situation, Staircases, Local Kindergarten, Nearest Schools, Main Means of Transportation
(By Driving vs. By Foot), Bedroom, Local shops, Local Accident situation, Drying area, Nearest Bus/Taxi Station, Chengshi
Huayuan's Children's Playground, Corridor
o. Dependent Variable: Chengshi Huayuan's Residential Satisfaction Index (%)
Source: SPSS OUTPUT, Model Summary
In Table, there are 14 models. Model 14 refers to 12 predictors being the
“determinants” of the regression.
In addition, in the column labelled R in Table are the values of the multiple
correlation coefficients between the predictors and the dependent variable,
e.g. when the local crime situation was added and retained as a predictor, this
is the simple correlation between the local crime situation and the Chengshi
Huayuan’s residential satisfaction index (0.414).
In the next column of a value of R2, for the first model, its value is .171

410
which means that the local crime situation explained 17.1% of the variation
in residential satisfaction index. However, when another predictor named the
staircases was included as well (model 2), this value increased to 26.9% of
the variance in residential satisfaction index. Hence, if the local crime
situation has explained 17.1%, it obviously showed that the staircases
explained an additional 9.8% (9.8% = 26.9% - 17.1%, this value also is the R
Square Change in the table). In addition, after another predictor named local
kindergarten was also included (model 3), this value increased to 37.7% of
the variance in residential satisfaction index. Thus, when the local crime
situation and staircases have explained 26.9%, it obviously showed that the
local kindergarten explained an additional 10.8%. Moreover, when another
predictor called nearest school was additionally added (model 4), this value
increased to 44.4% of the variance in residential satisfaction index. So, when
the local crime situation, staircases and local kindergarten have explained
37.7%, it obviously showed that the nearest school explained an additional
6.7%. Furthermore, when another predictor named toilet was added as well
(model 5), this value increased to 49.4% of the variance in residential
satisfaction index. So, when the local crime situation, staircases, local
kindergarten and nearest school have explained 44.4%, it obviously showed
that the toilet explained an additional 5%. Additionally, after another
predictor named main means of transportation (by driving vs. by foot) was
added as well (model 6), this value increased to 54% of the variance in
residential satisfaction index. So, when the local crime situations, staircases,
local kindergarten, nearest school, and toilet have explained 49.4%, it
showed that the main means of transportation (by driving vs. foot) explained
an additional 4.6%. What is more, after another predictor called bedroom
was also added (model 7), this value increased to 57.5% of the variance in
residential satisfaction index. So, when the local crime situation, staircases,
local kindergarten, nearest school, toilet and main means of transportation
(by driving vs. by foot) have explained 54%, it showed that the bedroom
explained an additional 3.5%. After another predictor called local shops was
added as well (model 8), this value increased to 61.3% of the variance in
residential satisfaction index. So, when the local crime situation, staircases,
local kindergarten, nearest school, toilet, main means of transportation (by
driving vs. by foot) and bedroom have explained 57.5%, it showed that the
local shops explained an additional 3.8%. When another predictor named
local accident situation was additionally included (model 9), this value
improved to 63.8% of the variance in residential satisfaction index. Then,
when the local crime situation, staircases, local kindergarten, nearest school,
toilet, main means of transportation (by driving vs. by foot), bedroom and
local shops have accounted for 61.3%, it indicated that the local accident
situation explained 2.6% additionally. When another predictor named drying
area was additionally added (model 10), this value improved to 67.4% of the
variance in residential satisfaction index. Then, when the local crime
situation, staircases, local kindergarten, nearest school, toilet, main means of
transportation (by driving vs. by foot), bedroom, local shops and local
accident situation have accounted for 63.8%, it indicated that the drying area
explained 3.5% additionally. Likewise, when another predictor named
nearest bus/taxi station was added as well (model 11), this value improved to
70.9% of the variance in residential satisfaction index. Then, when the local
crime situation, staircases, local kindergarten, nearest school, toilet, main
means of transportation (by driving vs. by foot), bedroom, local shops, local

411
accident situation and drying area have accounted for 67.4%, it indicated that
the nearest bus/taxi station accounted for 3.5% additionally. Similarly, when
another predictor named Chengshi Huayuan’s children’s playground was
additionally added (model 12), this value improved to 74.1% of the variance
in residential satisfaction index. Then, when the local crime situation,
staircases, local kindergarten, nearest school, toilet, main means of
transportation (by driving vs. by foot), bedroom, local shops, local accident
situation, drying area and nearest bus/taxi station have accounted for 70.9%,
it indicated that the Chengshi Huayuan’s children’s playground accounted
for 3.3% additionally. Furthermore, when another predictor named corridor
was conclusively added as well (model 13), this value improved to 75.6% of
the variance in residential satisfaction index. Then, when the local crime
situation, staircases, local kindergarten, nearest school, toilet, main means of
transportation (by driving vs. by foot), bedroom, local shops, local accident
situation, drying area, nearest bus/taxi station and Chengshi Huayuan’s
children’s playground have already accounted for 74.1%, it indicated the
corridor that accounted for 1.5% additionally. Besides, the predictor named
toilet was removed (model 14), this value decreased to 75.2% of the variance
in residential satisfaction index. So when the local crime situation, staircases,
local kindergarten, nearest school, toilet, main means of transportation (by
driving vs. by foot), bedroom, local shops, local accident situation, drying
area, nearest bus/taxi station, Chengshi Huayuan’s children’s playground and
corridor have explained 75.6%, it indicated that the toilet less explained by
0.4%. Therefore, 12 predictors which have been left have explained a large
amount of the variation (75.2%) in the Chengshi Huayuan’s residential
satisfaction index.
In addition, the following Stein’s formula to the R2 can understand its likely
value in different samples.
adjusted 𝑅2 = 1 − [(𝑛 − 1
𝑛 − 𝑘 − 1) (
𝑛 − 2
𝑛 − 𝑘 − 2) (
𝑛 + 1
𝑛)] (1 − 𝑅2)
Stein’s formula was given in equation and can be applied by replacing n with
the sample size (95) and k with the number of predictors (12), as follows,
adjusted 𝑅2 = 1 − [(95 − 1
95 − 12 − 1) (
95 − 2
95 − 12 − 2) (
95 + 1
95)] (1 − 0.752)
= 1 – [(1.146)(1.148)(1.010)](0.248)
= 1 – 0.329
= 0.671
The value is similar to the value of 𝑅2 (.752) indicating that the cross-
validity of this model is good. Thus, the adjusted R2 value (.715/.671) of the
model indicated that 71.5/67.1% of the variance in residential satisfaction
index had been explained by the model. The tolerance values of the
coefficients of predictor variables are well over 0.28/0.32
(1 − adjusted 𝑅2 ) and this indicated the absence of multicollinearity
between the predictor variables of the model. Then, finally, the Durbin-
Watson statistic is found in the last column of the table in Table. That the
value is closer to 2 is the better. For these data the value was 2.205, which is
close to 2 that the assumption has almost certainly been met.

412
ANOVA Table: ANOVAa
Model Sum of Squares
df Mean Square F Sig.
1
Regression 119.673 1 119.673 19.200 .000b
Residual 579.673 93 6.233
Total 699.346 94
2
Regression 188.011 2 94.005 16.914 .000c
Residual 511.335 92 5.558
Total 699.346 94
3
Regression 263.431 3 87.810 18.331 .000d
Residual 435.915 91 4.790
Total 699.346 94
4
Regression 310.268 4 77.567 17.942 .000e
Residual 389.078 90 4.323
Total 699.346 94
5
Regression 345.342 5 69.068 17.364 .000f
Residual 354.004 89 3.978
Total 699.346 94
6
Regression 377.377 6 62.896 17.191 .000g
Residual 321.968 88 3.659
Total 699.346 94
7
Regression 402.033 7 57.433 16.806 .000h
Residual 297.313 87 3.417
Total 699.346 94
8
Regression 428.643 8 53.580 17.022 .000i
Residual 270.703 86 3.148
Total 699.346 94
9
Regression 446.495 9 49.611 16.677 .000j
Residual 252.851 85 2.975
Total 699.346 94
10
Regression 471.217 10 47.122 17.351 .000k
Residual 228.129 84 2.716
Total 699.346 94
11
Regression 495.693 11 45.063 18.366 .000l
Residual 203.653 83 2.454
Total 699.346 94
12
Regression 518.564 12 43.214 19.601 .000m
Residual 180.782 82 2.205
Total 699.346 94
13
Regression 528.723 13 40.671 19.308 .000n
Residual 170.623 81 2.106
Total 699.346 94

413
Table, continued
Model Sum of
Squares df Mean Square F Sig.
14
Regression 525.585 12 43.799 20.669 .000o
Residual 173.761 82 2.119
Total 699.346 94
a. Dependent Variable: Chengshi Huayuan's Residential Satisfaction Index (%)
b. Predictors: (Constant), Local Crime situation
c. Predictors: (Constant), Local Crime situation, Staircases
d. Predictors: (Constant), Local Crime situation, Staircases, Local Kindergarten
e. Predictors: (Constant), Local Crime situation, Staircases, Local Kindergarten, Nearest Schools
f. Predictors: (Constant), Local Crime situation, Staircases, Local Kindergarten, Nearest Schools, Toilet
g. Predictors: (Constant), Local Crime situation, Staircases, Local Kindergarten, Nearest Schools, Toilet, Main Means of
Transportation (By Driving vs. By Foot)
h. Predictors: (Constant), Local Crime situation, Staircases, Local Kindergarten, Nearest Schools, Toilet, Main Means of
Transportation (By Driving vs. By Foot), Bedroom
i. Predictors: (Constant), Local Crime situation, Staircases, Local Kindergarten, Nearest Schools, Toilet, Main Means of
Transportation (By Driving vs. By Foot), Bedroom, Local shops
j. Predictors: (Constant), Local Crime situation, Staircases, Local Kindergarten, Nearest Schools, Toilet, Main Means of
Transportation (By Driving vs. By Foot), Bedroom, Local shops, Local Accident situation
k. Predictors: (Constant), Local Crime situation, Staircases, Local Kindergarten, Nearest Schools, Toilet, Main Mean of
Transportation (By Driving vs. By Foot), Bedroom, Local shops, Local Accident situation, Drying area
l. Predictors: (Constant), Local Crime situation, Staircases, Local Kindergarten, Nearest Schools, Toilet, Main Means of
Transportation (By Driving vs. By Foot), Bedroom, Local shops, Local Accident situation, Drying area, Nearest Bus/Taxi Station
m. Predictors: (Constant), Local Crime situation, Staircases, Local Kindergarten, Nearest Schools, Toilet, Main Means of
Transportation (By Driving vs. By Foot), Bedroom, Local shops, Local Accident situation, Drying area, Nearest Bus/Taxi Station,
Chengshi Huayuan's Children's Playground
n. Predictors: (Constant), Local Crime situation, Staircases, Local Kindergarten, Nearest Schools, Toilet, Main Means of
Transportation (By Driving vs. By Foot), Bedroom, Local shops, Local Accident situation, Drying area, Nearest Bus/Taxi Station,
Chengshi Huayuan's Children's Playground, Corridor
o. Predictors: (Constant), Local Crime situation, Staircases, Local Kindergarten, Nearest Schools, Main Means of Transportation
(By Driving vs. By Foot), Bedroom, Local shops, Local Accident situation, Drying area, Nearest Bus/Taxi Station, Chengshi
Huayuan's Children's Playground, Corridor
Source: SPSS OUTPUT, ANOVA
Table shows an ANOVA that tests whether the model is significantly better at
predicting the outcome than using the mean as a ‘best guess’. The ANOVA
also indicates whether the model is a significant fit of the data overall (Field,
2011, 2013). Thus, the combination of predictor variables significantly
predicted the residential satisfaction of Chengshi Huayuan, with F (12, 82) =
20.669, p < .001, with all 12 predictors significantly contributing to the
prediction.

414
Model parameters Table: Coefficientsa
Model
Unstandardized
Coefficients
Standardized
Coefficients t Sig.
95.0% Confidence Interval
for B
B Std.
Error Beta
Lower
Bound
Upper
Bound
16
(Constant) 29.312 1.897 15.452 .000 25.539 33.086
Local Crime situation
.075 .010 .456 7.172 .000 .054 .095
Staircases .055 .009 .379 5.909 .000 .036 .073
Local Kindergarten .037 .009 .260 4.123 .000 .019 .055
Nearest School .051 .009 .352 5.742 .000 .033 .069
Main Means of
Transportation (By Driving vs. By
Foot)
1.505 .483 .177 3.114 .003 .544 2.466
Bedroom .035 .011 .205 3.314 .001 .014 .056
Local Shops .045 .010 .265 4.529 .000 .025 .064
Local Accident situation
.035 .009 .240 3.814 .000 .017 .053
Drying area .049 .010 .304 5.080 .000 .030 .068
Nearest Bus/Taxi
Station .039 .009 .254 4.333 .000 .021 .057
Chengshi Huayuan's Children's
Playground
.031 .009 .209 3.449 .001 .013 .049
Corridor .021 .008 .146 2.511 .014 .004 .037
a. Dependent Variable: Chengshi Huayuan's Residential Satisfaction Index (%)
Source: SPSS OUTPUT, Coefficients
Table, continued
Model
Correlations Collinearity Statistics
Zero-order Partial Part Tolerance VIF
16
(Constant)
Local Crime situation .414 .621 .395 .750 1.333
Staircases .215 .546 .325 .735 1.360
Local Kindergarten .249 .414 .227 .760 1.316
Nearest School .169 .536 .316 .805 1.242
Main Means of Transportation
(By Driving vs. By Foot) .224 .325 .171 .933 1.072
Bedroom .180 .344 .182 .789 1.267
Local shops .255 .447 .249 .884 1.132
Local Accident situation .304 .388 .210 .767 1.304
Drying area .082 .489 .280 .847 1.180
Nearest Bus/Taxi Station .232 .432 .239 .881 1.135
Chengshi Huayuan's Children's playground
.094 .356 .190 .827 1.209
Corridor .247 .267 .138 .892 1.121
a. Dependent Variable: Chengshi Huayuan's Residential Satisfaction Index (%)
Source: SPSS OUTPUT, Coefficients
In Table, all the 12 predictors have positive b-values showing positive
relationships between the predictors and the residential satisfaction index of
Chengshi Huayuan. Thus, as the increasing of satisfactions of the local crime
situation, staircases, local kindergarten, nearest school, main means of
transportation (by driving vs. by foot), bedroom, local shops, local accident

415
situation, drying area, nearest bus/taxi station, Chengshi Huayuan’s
children’s playground and corridor will probably enhance the residential
satisfaction of Chengshi Huayuan.
Moreover, in Table, the b-values explain what degree each predictor
influences the Dependent Variable if the effects of all other predictors are
held constant:
o Local Crime situation (b = 0.075): This value indicates that as the
increasing of satisfaction of local crime situation by one unit, the
residential satisfaction index of Chengshi Huayuan increases by
0.075 units (7.5%). This interpretation is true only if the effects of the
staircases, local kindergarten, nearest school, main means of
transportation (by driving vs. by foot), bedroom, local shops, local
accident situation, drying area, nearest bus/taxi station, Chengshi
Huayuan’s children’s playground and corridor are held constant.
o Staircases (b = 0.055): This value shows that as the level of
satisfaction of staircases increases by one unit, the residential
satisfaction index increases by 0.055 units (5.5%). This interpretation
is true only if the effects of the local crime situation, local
kindergarten, nearest school, main means of transportation (by
driving vs. by foot), bedroom, local shops, local accident situation,
drying area, nearest bus/taxi station, Chengshi Huayuan’s children’s
playground and corridor are held constant.
o Local Kindergarten (b = 0.037): This value represents that the
residents rating the satisfaction of local kindergarten higher on the
satisfaction scale can bring additional 3.7% to residential satisfaction
index. This interpretation is true only if the effects of the local crime
situation, staircases, nearest school, main means of transportation (by
driving vs. by foot), bedroom, local shops, local accident situation,
drying area, nearest bus/taxi station, Chengshi Huayuan’s children’s
playground and corridor are held constant.
o Nearest School (b = 0.051): This value refers to that the residents to
rate the satisfaction of the nearest school higher on the satisfaction
scale can bring extra 5.1% to residential satisfaction index. This
interpretation is true only if the effects of the local crime situation,
staircases, local kindergarten, main means of transportation (by
driving vs. by foot), bedroom, local shops, local accident situation,
drying area, nearest bus/taxi station, Chengshi Huayuan’s children’s
playground and corridor are held constant.
o Main Means of Transportation (By Driving vs. By Foot) (b = 1.505):
This value signifies that the factor of main means of transportation by
foot contributes 150.5% to improving the residential satisfaction
index comparing to other predictors. In particular, the change in the
residential satisfaction index is greater for the group of residents
going outside frequently by foot than it is for the group of residents
going outside regularly by driving. This interpretation is true only if
the effects of the local crime situation, staircases, local kindergarten,
nearest school, bedroom, local shops, local accident situation, drying
area, nearest bus/taxi station, Chengshi Huayuan’s children’s
playground and corridor are held constant.
o Bedroom (b = 0.035): This value conveys that the respondents to rate
the satisfaction of bedroom higher on the satisfaction scale could

416
bring supplementary 3.5% to residential satisfaction index. This
interpretation is true only if the effects of the local crime situation,
staircases, local kindergarten, nearest school, main means of
transportation (by driving vs. by foot), local shops, local accident
situation, drying area, nearest bus/taxi station, Chengshi Huayuan’s
children’s playground and corridor are held constant.
o Local Shops (b = 0.045): This value denotes that the residents to rate
the satisfaction of their local shops higher on the satisfaction scale
can bring further 4.5% to residential satisfaction index. This
interpretation is true only if the effects of the local crime situation,
staircases, local kindergarten, nearest school, main means of
transportation (by driving vs. by foot), bedroom, local accident
situation, drying area, nearest bus/taxi station, Chengshi Huayuan’s
children’s playground and corridor are held constant.
o Local accident situation (b = 0.035): This value delivers that the
respondents to rate the satisfaction of their local accident situation
higher on the satisfaction scale could bring added 3.5% to residential
satisfaction index. This interpretation is true only if the effects of the
local crime situation, staircases, local kindergarten, nearest school,
main means of transportation (by driving vs. by foot), bedroom, local
shops, drying area, nearest bus/taxi station, Chengshi Huayuan’s
children’s playground and corridor are held constant.
o Drying area (b = 0.049): This value delivers that the residents to rate
the satisfaction of their drying area higher on the satisfaction scale
could bring added 4.9% to residential satisfaction index. This
interpretation is true only if the effects of the local crime situation,
staircases, local kindergarten, nearest school, main means of
transportation (by driving vs. by foot), bedroom, local shops, local
accident situation, nearest bus/taxi station, Chengshi Huayuan’s
children’s playground and corridor are held constant.
o Nearest Bus/Taxi Station (b = 0.039): This value indicates that the
residents to rate the satisfaction of the nearest bus/taxi station higher
on the satisfaction scale could bring additional 3.9% to residential
satisfaction index. This interpretation is true only if the effects of the
local crime situation, staircases, local kindergarten, nearest school,
main means of transportation (by driving vs. by foot), bedroom, local
shops, local accident situation, drying area, Chengshi Huayuan’s
children’s playground and corridor are held constant.
o Chengshi Huayuan’s Children’s Playground (b = 0.031): This value
indicates that the residents to rate the satisfaction of Chengshi
Huayuan’s children’s playground higher on the satisfaction scale can
bring additional 3.1% to residential satisfaction index. This
interpretation is true only if the effects of the local crime situation,
staircases, local kindergarten, nearest school, main means of
transportation (by driving vs. by foot), bedroom, local shops, local
accident situation, drying area, nearest bus/taxi station and corridor
are held constant.
o Corridor (b = 0.021): This value indicates that the residents to rate
the satisfaction of corridor higher on the satisfaction scale can bring
additional 2.1% to residential satisfaction index. This interpretation is
true only if the effects of the local crime situation, staircases, local
kindergarten, nearest school, main means of transportation (by

417
driving vs. by foot), bedroom, local shops, local accident situation,
drying area, nearest bus/taxi station and Chengshi Huayuan’s
children’s playground are held constant.
In this model, the local crime situation (t (82) = 7.172, p < .001), the
staircases (t (82) = 5.909, p < .001), the local kindergarten (t (82) = 4.123, p
< .001), the nearest school (t (82) = 5.742, p < .001), the main means of
transportation (by driving vs. by foot) (t (82) = 3.114, p < .01), the bedroom
(t (82) = 3.314, p < .01), the local shops (t (82) = 4.529, p < .001), the local
accident situation (t (82) = 3.814, p < .001), the drying area (t (82) = 5.080, p
< .001), the nearest bus/taxi station (t (82) = 4.333, p < .001), the Chengshi
Huayuan’s children’s playground (t (82) = 3.449, p < .001) and the corridor
(t (82) = 2.511, p < .05) are all significant predictors of the residential
satisfaction index.
Hence, from the magnitude of the t-statistics, it is reported that the
satisfactions with the local crime situation, staircases, nearest school, drying
area, local shops, nearest bus/taxi station, local kindergarten, local accident
situation and Chengshi Huayuan’s children’s playground have the most
impact and the satisfaction with the bedroom, and the main means of
transportation (by driving vs. by foot) have the moderately impact, whereas
the satisfaction with the corridor has less impact on the Chengshi Huayuan’s
residential satisfaction index.
Comparing to the b-values and their significance regarded as acknowledged
exceedingly important statistics to be collected from Coefficients table of the
SPSS stepwise method regression, the standardized versions of the b-values
provided by SPSS (labelled as Beta, β1) are defined easier to interpret that
the dependent variable will change as a result of one standard deviation
change in the predictor and are all measured in standard deviation units and
to indicate how important those predictors in this model (Field, 2011, 2013).
In accordance with what the magnitude of the t-statistics explained above,
the standardized beta values for satisfactions of the local crime situation,
staircases, nearest school, drying area, local shops, nearest bus/taxi station,
local kindergarten, local accident situation and Chengshi Huayuan’s
children’s playground are virtually identical
(.456, .379, .352, .304, .265, .254, .260, .240 and .209, respectively) denoting
that these nine variables have a comparable degree of importance in the
model, in addition, the satisfactions of the bedroom and main means of
transportation also have a comparable degree of importance in the model
(.205 and .177, respectively) and the satisfaction of the corridor have a
comparable degree of importance in the model as well (.146).
Local Crime situation (standardized β = .456): This value indicates
that as the satisfaction of local crime situation increases by one
standard deviation (16.630%), the residential satisfaction index
increases by 0.456 standard deviations. The standard deviation for the
residential satisfaction index is 2.728 and so this constitutes a change
of 1.244% (0.456 × 2.728). Thus, as every 16.630% more increased
on the satisfaction of local crime situation, an additional 1.244%
increase in the residential satisfaction index can be produced. This
interpretation is true only if the effects of the staircases, local
418
kindergarten, nearest school, main means of transportation (by
driving vs. by foot), bedroom, local shops, local accident situation,
drying area, nearest bus/taxi station, Chengshi Huayuan’s children’s
playground and corridor are held constant.
Staircases (standardized β = .379): This value indicates that as the
satisfaction of staircases improves by one standard deviation
(18.887%), the residential satisfaction index enhances by 0.379
standard deviations. The standard deviation for the residential
satisfaction index is 2.728 and so this constitutes a change of 1.034%
(0.379 × 2.728). So, as each 18.887% more increased on the
satisfaction of staircases, an additional 1.034% growth in the
residential satisfaction index can be expected. This interpretation is
true only if the effects of the local crime situation, local kindergarten,
nearest school, main means of transportation (by driving vs. by foot),
bedroom, local shops, local accident situation, drying area, nearest
bus/taxi station, Chengshi Huayuan’s children’s playground and
corridor are held constant.
Local kindergarten (standardized β = .260): This value indicates that
as the satisfaction of local kindergarten rises by one standard
deviation (19.136%), the residential satisfaction index grows by
0.260 standard deviations. The standard deviation for the residential
satisfaction index is 2.728 and so this represents a change of 0.709%
(0.260 × 2.728). So, for every 19.136% more added on the
satisfaction of local kindergarten, an additional 0.709% rise in the
residential satisfaction index can be achieved. This interpretation is
true only if the effects of the local crime situation, staircases, nearest
school, main means of transportation (by driving vs. by foot),
bedroom, local shops, local accident situation, drying area, nearest
bus/taxi station, Chengshi Huayuan’s children’s playground and
corridor are held constant.
Nearest School (standardized β = .352): This value indicates that as
the satisfaction of the nearest school escalates by one standard
deviation (18.848%), the residential satisfaction index develops by
0.352 standard deviations. The standard deviation for the residential
satisfaction index is 2.728 and so this constitutes a change of 0.960%
(0.352 × 2.728). As a result, for each 18.848% more improved on the
satisfaction of the nearest school, an additional 0.960% upsurge in
the residential satisfaction index can be produced. This interpretation
is true only if the effects of the local crime situation, staircases, local
kindergarten, main means of transportation (by driving vs. by foot),
bedroom, local shops, local accident situation, drying area, nearest
bus/taxi station, Chengshi Huayuan’s children’s playground and
corridor are held constant.
Main Means of Transportation (By Driving vs. By Foot)
(standardized β = .177): This value indicates that as the satisfaction
of the group of residents who are going outside regularly by foot
increases by one standard deviation (0.322%), the residential
satisfaction index increases by 0.177 standard deviations. The
standard deviation for the residential satisfaction index is 2.728 and
so this constitutes a change of 0.483% (0.177 × 2.728). Thus, as
every 0.322% more improved on the satisfaction of the group of
residents who are going outside frequently by foot, the residential

419
satisfaction index will be increased by 0.483%. This interpretation is
true only if the effects of the local crime situation, staircases, local
kindergarten, nearest school, bedroom, local shops, local accident
situation, drying area, nearest bus/taxi station, Chengshi Huayuan’s
children’s playground and corridor are held constant.
Bedroom (standardized β = .205): This value indicates that as the
satisfaction of bedroom boosts by one standard deviation (15.939%),
the residential satisfaction index increases by 0.205 standard
deviations. The standard deviation for the residential satisfaction
index is 2.728 and so this constitutes a change of 0.559% (0.205 ×
2.728). So, as each 15.939% more increased on the satisfaction of
bedroom, the residential satisfaction index will be enlarged by
0.559%. This interpretation is true only if the effects of the local
crime situation, staircases, local kindergarten, nearest school, main
means of transportation (by driving vs. by foot), local shops, local
accident situation, drying area, nearest bus/taxi station, Chengshi
Huayuan’s children’s playground and corridor are held constant.
Local Shops (standardized β = .265): This value indicates that as the
satisfaction of local shops enlarges by one standard deviation
(16.172%), the residential satisfaction index increases by 0.265
standard deviations. The standard deviation for the residential
satisfaction index is 2.728 and so this constitutes a change of 0.723%
(0.265 × 2.728). So, for each 16.172% more enhanced on the
satisfaction of local shops, the residential satisfaction index will be
boosted by 0.723%. This interpretation is true only if the effects of
the local crime situation, staircases, local kindergarten, nearest
school, main means of transportation (by driving vs. by foot),
bedroom, local accident situation, drying area, nearest bus/taxi
station, Chengshi Huayuan’s children’s playground and corridor are
held constant.
Local Accident situation (standardized β = .240): This value indicates
that as the satisfaction of local accident situation enlarges by one
standard deviation (18.899%), the residential satisfaction index
increases by 0.240 standard deviations. The standard deviation for the
residential satisfaction index is 2.728 and so this constitutes a change
of 0.655% (0.240 × 2.728). As a result, for every 18.899% more
improved on the satisfaction of local accident situation, the
residential satisfaction index will be improved by 0.655%. This
interpretation is true only if the effects of the local crime situation,
staircases, local kindergarten, nearest school, main means of
transportation (by driving vs. by foot), bedroom, local shops, drying
area, nearest bus/taxi station, Chengshi Huayuan’s children’s
playground and corridor are held constant.
Drying area (standardized β = .304): This value indicates that as the
satisfaction of drying area increases by one standard deviation
(16.848%), the residential satisfaction index increases by 0.304
standard deviations. The standard deviation for the residential
satisfaction index is 2.728 and so this constitutes a change of 0.829%
(0.304 × 2.728). Therefore, for every 16.848% more improved on the
satisfaction of drying area, the residential satisfaction index will be
enhanced by 0.829%. This interpretation is true only if the effects of
the local crime situation, staircases, local kindergarten, nearest

420
school, main means of transportation (by driving vs. by foot),
bedroom, local shops, local accident situation, nearest bus/taxi
station, Chengshi Huayuan’s children’s playground and corridor are
held constant.
Nearest Bus/Taxi Station (standardized β = .254): This value
indicates that as the satisfaction of the nearest bus/taxi station rises
by one standard deviation (17.869%), the residential satisfaction
index increases by 0.254 standard deviations. The standard deviation
for the residential satisfaction index is 2.728 and so this constitutes a
change of 0.693% (0.254 × 2.728). Thus, for every 17.869% more
enhanced on the satisfaction of the nearest bus/taxi station, an
additional 0.693% growth in the residential satisfaction index can be
expected. This interpretation is true only if the effects of the local
crime situation, staircases, local kindergarten, nearest school, main
means of transportation (by driving vs. by foot), bedroom, local
shops, local accident situation, drying area, Chengshi Huayuan’s
children’s playground and corridor are held constant.
Chengshi Huayuan’s Children’s Playground (standardized β = .209):
This value indicates that as the satisfaction of Chengshi Huayuan’s
children’s playground increases by one standard deviation
(18.328%), the residential satisfaction index increases by 0.209
standard deviations. The standard deviation for the residential
satisfaction index is 2.728 and so this constitutes a change of 0.570%
(0.209 × 2.728). Hence, as every 18.328% more improved on the
satisfaction of children’s playground, an additional 0.570% escalation
in the residential satisfaction index can be produced. This
interpretation is true only if the effects of the local crime situation,
staircases, local kindergarten, nearest school, main means of
transportation (by driving vs. by foot), bedroom, local shops, local
accident situation, drying area, nearest bus/taxi station and corridor
are held constant.
Corridor (standardized β = .146): This value indicates that as the
satisfaction of corridor intensifies by one standard deviation
(19.342%), the residential satisfaction index increases by 0.146
standard deviations. The standard deviation for the residential
satisfaction index is 2.728 and so this constitutes a change of 0.398%
(0.146 × 2.728). So, as each 19.342% more enhanced on the
satisfaction of corridor, the residential satisfaction index will be
improved by 0.398%. This interpretation is true only if the effects of
the local crime situation, staircases, local kindergarten, nearest
school, main means of transportation (by driving vs. by foot),
bedroom, local shops, local accident situation, drying area, nearest
bus/taxi station and Chengshi Huayuan’s children’s playground are
held constant.
The confidence intervals of the unstandardized beta values in Table are
boundaries constructed such that in 95% of these samples these boundaries
will contain the true value of b, also indicating that 95% of these confidence
intervals would contain the true value of b. Thus, the confidence intervals
constructed for the Chengshi Huayuan’s sample will contain the true value of
b in the population. In accordance with Field’s (2011, 2013) writings, a good
model should have a small confidence interval which indicates that the value

421
of b in this sample is close to the true value of b in the population. Thus, in
the Chengshi Huayuan’s model, all predictors have small confidence
intervals. Moreover, in the Chengshi Huayuan’s model, the 11 best predictors
(the local crime situation, staircases, local kindergarten, nearest school,
bedroom, local shops, and local accident situation, drying area, nearest
bus/taxi station, Chengshi Huayuan’s children’s playground and corridor)
have very tight confidence intervals indicating that the estimates for the
current model are likely to be representative of the true population values.
However, the interval for main means of transportation (by driving vs. by
foot) is wider (but still does not cross zero) indicating that the parameter for
main means of transportation (by driving vs. by foot) is less representative,
but nonetheless significant.
Table provided some measures of whether there is collinearity in the data.
Particularly, it provides the VIF and tolerance statistics (with tolerance being
1 divided by the VIF). From this current model, the VIF values are all well
below 10 and the tolerance statistics all well above 0.2, and then, it can
safely conclude that there is no collinearity within this data. To calculate the
average VIF, Field (2011); (Field, 2013) described to simply add the VIF
values for each predictor and divide by the number of predictors (𝑘):
VIF̅̅ ̅̅̅ =∑ VIFi
𝑘i=1
𝑘
= 1.333 + 1.360 + 1.316 + 1.242 + 1.072 + 1.267 + 1.132 + 1.304 + 1.180 + 1.135 + 1.209 + 1.121
12
= 14.671
12= 1.223
Therefore, the average VIF is about 1 and this confirmed that the collinearity
is not a problem for this model.

422
Interpreting Phase 3 Low-Cost Housing (Binhe Huayuan in Chinese) in
Xuzhou city, Jiangsu Province, China
Descriptives Table: Descriptive Statistics
Mean Std.
Deviation N
Binhe Huayuan's Residential Satisfaction Index
(%) 62.845 3.816 80
Gender (Female vs. Male) 0.650 0.480 80
Age (Age21-30 vs. Age31-40) 0.200 0.403 80
Age (Age21-30 vs. Age41-50) 0.188 0.393 80
Age (Age21-30 vs. Age51-60) 0.300 0.461 80
Age (Age21-30 vs. Above Age60) 0.275 0.449 80
Education attainment (Master Degree and above vs. Primary school) 0.213 0.412 80
Education attainment (Master Degree and above vs. Junior middle school) 0.213 0.412 80
Education attainment (Master Degree and above vs. Senior middle school) 0.263 0.443 80
Education attainment (Master Degree and above vs. Diploma) 0.238 0.428 80
Education attainment (Master Degree and above vs. Bachelor Degree) 0.063 0.244 80
Marital status (Single vs. Married) 0.813 0.393 80
Marital status (Single vs. Widowed/Divorced) 0.175 0.382 80
Household size (4 people vs. 1 people) 0.113 0.318 80
Household size (4 people vs. 2 people) 0.250 0.436 80
Household size (4 people vs. 3 people) 0.588 0.495 80
Occupation sector (Own business vs. State-owned enterprise (SOE)) 0.188 0.393 80
Occupation sector (Own business vs. Collective-owned enterprise (COE)) 0.175 0.382 80
Occupation sector (Own business vs. Private business) 0.600 0.493 80
Occupation type (Others vs. Management & Professional) 0.125 0.333 80
Occupation type (Others vs. Technical & Administrative Support) 0.163 0.371 80
Occupation type (Others vs. Services & Operation) 0.338 0.476 80
Monthly net income of Household (RMB0-1,999 vs. RMB2,000-3,999) 0.225 0.420 80
Monthly net income of Household (RMB0-1,999 vs. RMB4,000-5,999) 0.588 0.495 80
Monthly net income of Household (RMB0-1,999 vs. RMB6,000-7,999) 0.588 0.495 80
Floor level (4thFloor vs. 1stFloor) 0.238 0.428 80
Floor level (4thFloor vs. 2ndFloor) 0.175 0.382 80
Floor level (4thFloor vs. 3rdFloor) 0.200 0.403 80
Floor level (4thFloor vs. 5thFloor) 0.163 0.371 80
Floor level (4thFloor vs. 6thFloor) 0.088 0.284 80
Length of Residence (>5, <=7years vs. <=3years) 0.088 0.284 80
Length of Residence (>5, <=7years vs. >3, <=5years) 0.888 0.318 80
Main Means of Transportation (By Driving vs. By Cycling) 0.388 0.490 80
Main Means of Transportation (By Driving vs. By Bus) 0.463 0.502 80
Main Means of Transportation (By Driving vs. By Foot) 0.138 0.347 80
Living room 65.125 23.420 80
Dining area 67.459 24.103 80
Master bedroom 74.749 20.594 80
Bedroom 69.500 18.173 80
Kitchen 62.959 20.902 80
Toilet 64.458 19.151 80
Drying area 63.292 19.635 80
Drain 65.750 23.045 80
Electrical & Telecommunication wiring 66.500 26.053 80
Firefighting equipment 56.125 20.837 80
Street lighting 59.000 23.090 80
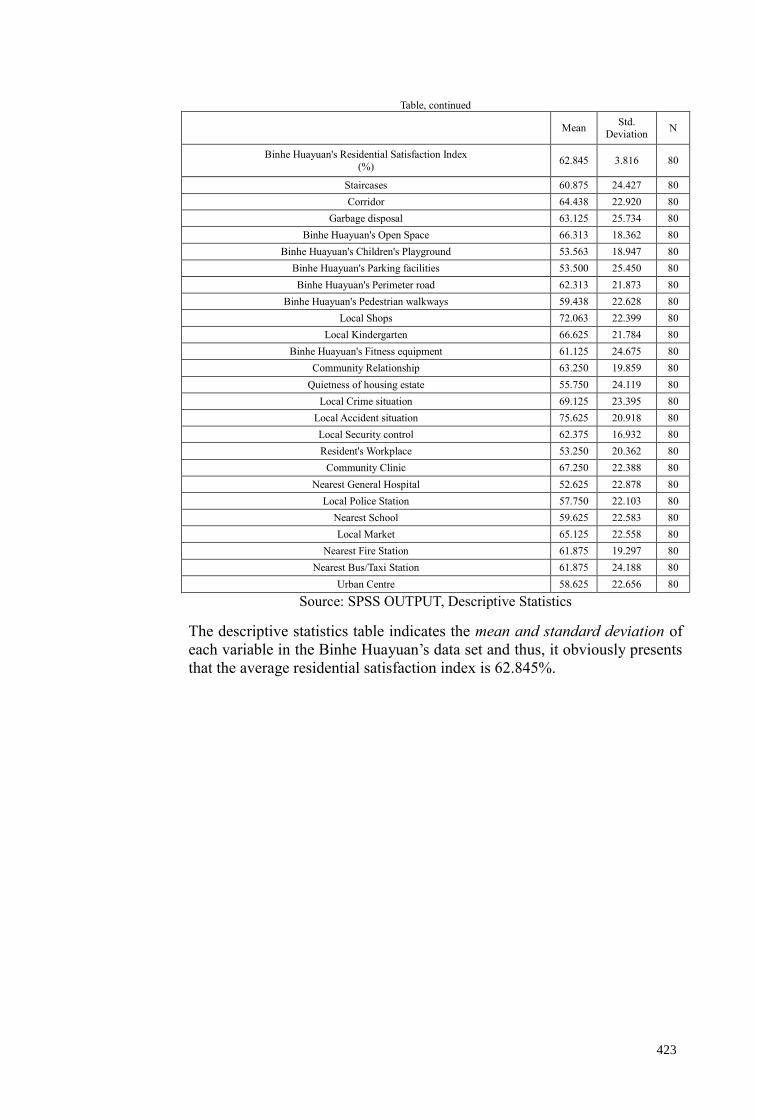
423
Table, continued
Mean Std.
Deviation N
Binhe Huayuan's Residential Satisfaction Index
(%) 62.845 3.816 80
Staircases 60.875 24.427 80
Corridor 64.438 22.920 80
Garbage disposal 63.125 25.734 80
Binhe Huayuan's Open Space 66.313 18.362 80
Binhe Huayuan's Children's Playground 53.563 18.947 80
Binhe Huayuan's Parking facilities 53.500 25.450 80
Binhe Huayuan's Perimeter road 62.313 21.873 80
Binhe Huayuan's Pedestrian walkways 59.438 22.628 80
Local Shops 72.063 22.399 80
Local Kindergarten 66.625 21.784 80
Binhe Huayuan's Fitness equipment 61.125 24.675 80
Community Relationship 63.250 19.859 80
Quietness of housing estate 55.750 24.119 80
Local Crime situation 69.125 23.395 80
Local Accident situation 75.625 20.918 80
Local Security control 62.375 16.932 80
Resident's Workplace 53.250 20.362 80
Community Clinic 67.250 22.388 80
Nearest General Hospital 52.625 22.878 80
Local Police Station 57.750 22.103 80
Nearest School 59.625 22.583 80
Local Market 65.125 22.558 80
Nearest Fire Station 61.875 19.297 80
Nearest Bus/Taxi Station 61.875 24.188 80
Urban Centre 58.625 22.656 80
Source: SPSS OUTPUT, Descriptive Statistics
The descriptive statistics table indicates the mean and standard deviation of
each variable in the Binhe Huayuan’s data set and thus, it obviously presents
that the average residential satisfaction index is 62.845%.

424
Table: Correlations
Residential Satisfaction
Index
(%)
Pearson
Correlation
Binhe Huayuan's Residential Satisfaction Index
(%) 1.000
Gender (Female vs. Male) -.120
Age (Age21-30 vs. Age31-40) -.079
Age (Age21-30 vs. Age41-50) .003
Age (Age21-30 vs. Age51-60) -.147
Age (Age21-30 vs. Above Age60) .176
Education attainment (Master Degree and above vs. Primary school) .158
Education attainment (Master Degree and above vs. Junior middle school) -.062
Education attainment (Master Degree and above vs. Senior middle school) -.090
Education attainment (Master Degree and above vs. Diploma) .033
Education attainment (Master Degree and above vs. Bachelor Degree) .018
Marital status (Single vs. Married) -.141
Marital status (Single vs. Widowed/Divorced) .142
Household size (4 people vs. 1 people) .105
Household size (4 people vs. 2 people) -.064
Household size (4 people vs. 3 people) .029
Occupation sector (Own business vs. State-owned enterprise (SOE)) .067
Occupation sector (Own business vs. Collective-owned enterprise (COE)) .063
Occupation sector (Own business vs. Private business) -.018
Occupation type (Others vs. Management & Professional) .128
Occupation type (Others vs. Technical & Administrative Support) -.060
Occupation type (Others vs. Services & Operation) -.107
Monthly net income of Household (RMB0-1,999 vs. RMB2,000-3,999) .103
Monthly net income of Household (RMB0-1,999 vs. RMB4,000-5,999) -.053
Monthly net income of Household (RMB0-1,999 vs. RMB6,000-7,999) -.053
Floor level (4thFloor vs. 1stFloor) .008
Floor level (4thFloor vs. 2ndFloor) .097
Floor level (4thFloor vs. 3rdFloor) -.008
Floor level (4thFloor vs. 5thFloor) -.031
Floor level (4thFloor vs. 6thFloor) .092
Length of Residence (>5, <=7years vs. <=3years) .047
Length of Residence (>5, <=7years vs. >3, <=5years) .021
Main Means of Transportation (By Driving vs. By Cycling) -.384
Main Means of Transportation (By Driving vs. By Bus) .219
Main Means of Transportation (By Driving vs. By Foot) .190
Living room .218
Dining area .233
Master bedroom .212
Bedroom -.014
Kitchen -.054
Toilet .038
Drying area .199

425
Table, continued
Residential Satisfaction
Index
(%)
Pearson
Correlation
Binhe Huayuan's Residential Satisfaction Index
(%) 1.000
Drain .207
Electrical & Telecommunication wiring .400
Firefighting equipment .259
Street lighting .211
Staircases .220
Corridor .374
Garbage disposal .326
Binhe Huayuan's Open Space .292
Binhe Huayuan's Children's Playground .341
Binhe Huayuan's Parking facilities .079
Binhe Huayuan's Perimeter road .088
Binhe Huayuan's Pedestrian walkways .132
Local Shops .278
Local Kindergarten .261
Binhe Huayuan's Fitness equipment .099
Community Relationship .134
Quietness of housing estate .407
Local Crime situation .157
Local Accident situation .131
Local Security control .193
Resident's Workplace -.041
Community Clinic .130
Nearest General Hospital -.028
Local Police Station .026
Nearest School .138
Local Market -.072
Nearest Fire Station .133
Nearest Bus/Taxi Station .256
Urban Centre .163
Sig. (1-
tailed)
Binhe Huayuan's Residential Satisfaction Index
(%)
Gender (Female vs. Male) .145
Age (Age21-30 vs. Age31-40) .243
Age (Age21-30 vs. Age41-50) .489
Age (Age21-30 vs. Age51-60) .096
Age (Age21-30 vs. Above Age60) .059
Education attainment (Master Degree and above vs. Primary school) .081
Education attainment (Master Degree and above vs. Junior middle school) .293
Education attainment (Master Degree and above vs. Senior middle school) .215
Education attainment (Master Degree and above vs. Diploma) .385
Education attainment (Master Degree and above vs. Bachelor Degree) .437
Marital status (Single vs. Married) .106

426
Table, continued
Sig.
(1-tailed)
Binhe Huayuan's Residential Satisfaction Index (%)
Marital status (Single vs. Widowed/Divorced) .104
Household size (4 people vs. 1 people) .176
Household size (4 people vs. 2 people) .287
Household size (4 people vs. 3 people) .400
Occupation sector (Own business vs. State-owned enterprise (SOE)) .278
Occupation sector (Own business vs. Collective-owned enterprise (COE)) .288
Occupation sector (Own business vs. Private business) .436
Occupation type (Others vs. Management & Professional) .129
Occupation type (Others vs. Technical & Administrative Support) .300
Occupation type (Others vs. Services & Operation) .173
Monthly net income of Household (RMB0-1,999 vs. RMB2,000-3,999) .182
Monthly net income of Household (RMB0-1,999 vs. RMB4,000-5,999) .321
Monthly net income of Household (RMB0-1,999 vs. RMB6,000-7,999) .321
Floor level (4thFloor vs. 1stFloor) .472
Floor level (4thFloor vs. 2ndFloor) .196
Floor level (4thFloor vs. 3rdFloor) .473
Floor level (4thFloor vs. 5thFloor) .393
Floor level (4thFloor vs. 6thFloor) .209
Length of Residence (>5, <=7years vs. <=3years) .340
Length of Residence (>5, <=7years vs. >3, <=5years) .427
Main Means of Transportation (By Driving vs. By Cycling) .000
Main Means of Transportation (By Driving vs. By Bus) .026
Main Means of Transportation (By Driving vs. By Foot) .046
Living room .026
Dining area .019
Master bedroom .029
Bedroom .452
Kitchen .316
Toilet .368
Drying area .038
Drain .033
Electrical & Telecommunication wiring .000
Firefighting equipment .010
Street lighting .030
Staircases .025
Corridor .000
Garbage disposal .002
Binhe Huayuan's Open Space .004
Binhe Huayuan's Children's Playground .001
Binhe Huayuan's Parking facilities .243
Binhe Huayuan's Perimeter road .218
Binhe Huayuan's Pedestrian walkways .121
Local Shops .006
Local Kindergarten .010

427
Table, continued
Sig. (1-
tailed)
Binhe Huayuan's Residential Satisfaction Index (%)
Binhe Huayuan's Fitness equipment .191
Community Relationship .118
Quietness of housing estate .000
Local Crime situation .082
Local Accident situation .123
Local Security control .043
Resident's Workplace .358
Community Clinic .124
Nearest General Hospital .404
Local Police Station .410
Nearest School .111
Local Market .263
Nearest Fire Station .120
Nearest Bus/Taxi Station .011
Urban Centre .075
N
Residential Satisfaction Index (%) 80
Gender (Female vs. Male) 80
Age (Age21-30 vs. Age31-40) 80
Age (Age21-30 vs. Age41-50) 80
Age (Age21-30 vs. Age51-60) 80
Age (Age21-30 vs. Above Age60) 80
Education attainment (Master and above vs. Primary school) 80
Education attainment (Master and above vs. Junior middle school) 80
Education attainment (Master Degree and above vs. Senior middle school) 80
Education attainment (Master Degree and above vs. Diploma) 80
Education attainment (Master Degree and above vs. Bachelor Degree) 80
Marital status (Single vs. Married) 80
Marital status (Single vs. Widowed/Divorced) 80
Household size (4 people vs. 1 people) 80
Household size (4 people vs. 2 people) 80
Household size (4 people vs. 3 people) 80
Occupation sector (Own business vs. State-owned enterprise (SOE)) 80
Occupation sector (Own business vs. Collective-owned enterprise (COE)) 80
Occupation sector (Own business vs. Private business) 80
Occupation type (Others vs. Management & Professional) 80
Occupation type (Others vs. Technical & Administrative Support) 80
Occupation type (Others vs. Services & Operation) 80
Monthly net income of Household (RMB0-1,999 vs. RMB2,000-3,999) 80
Monthly net income of Household (RMB0-1,999 vs. RMB4,000-5,999) 80
Monthly net income of Household (RMB0-1,999 vs. RMB6,000-7,999) 80
Floor level (4thFloor vs. 1stFloor) 80
Floor level (4thFloor vs. 2ndFloor) 80
Floor level (4thFloor vs. 3rdFloor) 80

428
Table, continued
N
Binhe Huayuan's Residential Satisfaction Index (%)
80
Floor level (4thFloor vs. 5thFloor) 80
Floor level (4thFloor vs. 6thFloor) 80
Length of Residence (>5, <=7years vs. <=3years) 80
Length of Residence (>5, <=7years vs. >3, <=5years) 80
Main Means of Transportation (By Driving vs. By Cycling) 80
Main Means of Transportation (By Driving vs. By Bus) 80
Main Means of Transportation (By Driving vs. By Foot) 80
Living room 80
Dining area 80
Master bedroom 80
Bedroom 80
Kitchen 80
Toilet 80
Drying area 80
Drain 80
Electrical & Telecommunication wiring 80
Firefighting equipment 80
Street lighting 80
Staircases 80
Corridor 80
Garbage disposal 80
Binhe Huayuan's Open Space 80
Binhe Huayuan's Children's Playground 80
Binhe Huayuan's Parking facilities 80
Binhe Huayuan's Perimeter road 80
Binhe Huayuan's Pedestrian walkways 80
Local Shops 80
Local Kindergarten 80
Binhe Huayuan's Fitness equipment 80
Community Relationship 80
Quietness of housing estate 80
Local Crime situation 80
Local Accident situation 80
Local Security control 80
Resident's Workplace 80
Community Clinic 80
Nearest General Hospital 80
Local Police Station 80
Nearest School 80
Local Market 80
Nearest Fire Station 80
Nearest Bus/Taxi Station 80
Urban Centre 80
Source: SPSS OUTPUT, Correlations
In the correlation matrix table, firstly, the quietness of housing estate had the
largest positive correlation with the residential satisfaction index of Binhe
Huayuan, r = .407, whereas the main means of transportation (by driving vs.
by cycling) had the largest negative correlation with the residential
satisfaction index of Binhe Huayuan, r = -. 384.
Secondly, the one-tailed significance of each correlation displayed the
quietness of housing estate, electrical& telecommunication wiring, main

429
means of transportation (by driving vs. by cycling), corridor, Binhe
Huayuan’s children’s playground, garbage disposal, Binhe Huayuan’s open
space, local shops, local kindergarten, firefighting equipment, nearest
bus/taxi station, dining area, staircases, main means of transportation (by
driving vs. by bus), living room, master room, street lighting, drain, drying
area, local security control and main means of transportation (by driving vs.
by foot) had varying degrees of significant correlations with the residential
satisfaction index, p < .001, p < .001, p < .001, p < .001, p < .001, p < .01, p
< .01, p < .01, p < .01, p < .05, p < .05, p < .05, p < .05, p < .05, p < .05, p
< .05, p < .05, p < .05, p < .05, p < .05, p < .05, respectively.
Finally, the number of cases contributing to each correlation (N = 80) is
shown.
Thus, the quietness of housing estate amongst all the variables correlated
best with the residential satisfaction index (r = .407, p < .001) and so it is
likely that this variable might have best predicted the outcome. In addition,
there is no multicollinearity in the data (no substantial correlations (r > .9)
between variables).
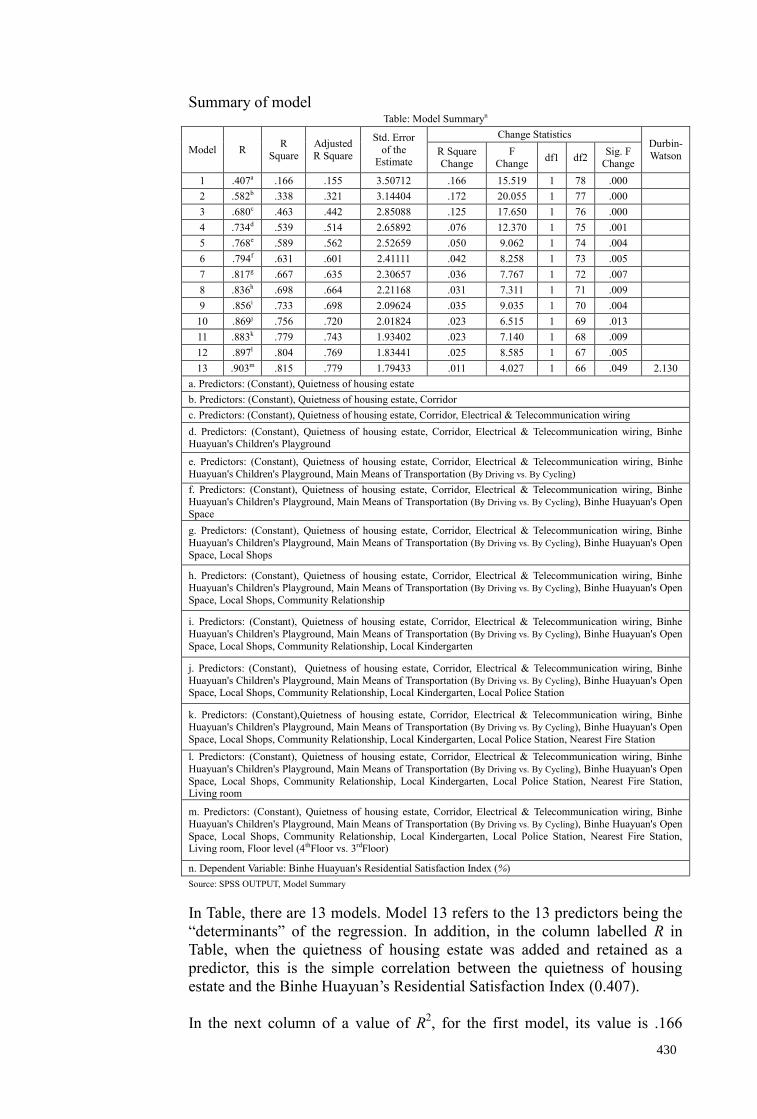
430
Summary of model Table: Model Summaryn
Model R R
Square
Adjusted
R Square
Std. Error
of the Estimate
Change Statistics Durbin-
Watson R Square
Change
F
Change df1 df2
Sig. F
Change
1 .407a .166 .155 3.50712 .166 15.519 1 78 .000
2 .582b .338 .321 3.14404 .172 20.055 1 77 .000
3 .680c .463 .442 2.85088 .125 17.650 1 76 .000
4 .734d .539 .514 2.65892 .076 12.370 1 75 .001
5 .768e .589 .562 2.52659 .050 9.062 1 74 .004
6 .794f .631 .601 2.41111 .042 8.258 1 73 .005
7 .817g .667 .635 2.30657 .036 7.767 1 72 .007
8 .836h .698 .664 2.21168 .031 7.311 1 71 .009
9 .856i .733 .698 2.09624 .035 9.035 1 70 .004
10 .869j .756 .720 2.01824 .023 6.515 1 69 .013
11 .883k .779 .743 1.93402 .023 7.140 1 68 .009
12 .897l .804 .769 1.83441 .025 8.585 1 67 .005
13 .903m .815 .779 1.79433 .011 4.027 1 66 .049 2.130
a. Predictors: (Constant), Quietness of housing estate
b. Predictors: (Constant), Quietness of housing estate, Corridor
c. Predictors: (Constant), Quietness of housing estate, Corridor, Electrical & Telecommunication wiring
d. Predictors: (Constant), Quietness of housing estate, Corridor, Electrical & Telecommunication wiring, Binhe Huayuan's Children's Playground
e. Predictors: (Constant), Quietness of housing estate, Corridor, Electrical & Telecommunication wiring, Binhe
Huayuan's Children's Playground, Main Means of Transportation (By Driving vs. By Cycling)
f. Predictors: (Constant), Quietness of housing estate, Corridor, Electrical & Telecommunication wiring, Binhe Huayuan's Children's Playground, Main Means of Transportation (By Driving vs. By Cycling), Binhe Huayuan's Open
Space
g. Predictors: (Constant), Quietness of housing estate, Corridor, Electrical & Telecommunication wiring, Binhe
Huayuan's Children's Playground, Main Means of Transportation (By Driving vs. By Cycling), Binhe Huayuan's Open
Space, Local Shops
h. Predictors: (Constant), Quietness of housing estate, Corridor, Electrical & Telecommunication wiring, Binhe Huayuan's Children's Playground, Main Means of Transportation (By Driving vs. By Cycling), Binhe Huayuan's Open
Space, Local Shops, Community Relationship
i. Predictors: (Constant), Quietness of housing estate, Corridor, Electrical & Telecommunication wiring, Binhe
Huayuan's Children's Playground, Main Means of Transportation (By Driving vs. By Cycling), Binhe Huayuan's Open
Space, Local Shops, Community Relationship, Local Kindergarten
j. Predictors: (Constant), Quietness of housing estate, Corridor, Electrical & Telecommunication wiring, Binhe
Huayuan's Children's Playground, Main Means of Transportation (By Driving vs. By Cycling), Binhe Huayuan's Open Space, Local Shops, Community Relationship, Local Kindergarten, Local Police Station
k. Predictors: (Constant),Quietness of housing estate, Corridor, Electrical & Telecommunication wiring, Binhe Huayuan's Children's Playground, Main Means of Transportation (By Driving vs. By Cycling), Binhe Huayuan's Open
Space, Local Shops, Community Relationship, Local Kindergarten, Local Police Station, Nearest Fire Station
l. Predictors: (Constant), Quietness of housing estate, Corridor, Electrical & Telecommunication wiring, Binhe
Huayuan's Children's Playground, Main Means of Transportation (By Driving vs. By Cycling), Binhe Huayuan's Open
Space, Local Shops, Community Relationship, Local Kindergarten, Local Police Station, Nearest Fire Station, Living room
m. Predictors: (Constant), Quietness of housing estate, Corridor, Electrical & Telecommunication wiring, Binhe
Huayuan's Children's Playground, Main Means of Transportation (By Driving vs. By Cycling), Binhe Huayuan's Open
Space, Local Shops, Community Relationship, Local Kindergarten, Local Police Station, Nearest Fire Station, Living room, Floor level (4thFloor vs. 3rdFloor)
n. Dependent Variable: Binhe Huayuan's Residential Satisfaction Index (%)
Source: SPSS OUTPUT, Model Summary
In Table, there are 13 models. Model 13 refers to the 13 predictors being the
“determinants” of the regression. In addition, in the column labelled R in
Table, when the quietness of housing estate was added and retained as a
predictor, this is the simple correlation between the quietness of housing
estate and the Binhe Huayuan’s Residential Satisfaction Index (0.407).
In the next column of a value of R2, for the first model, its value is .166

431
which means that the quietness of housing estate explained 16.6% of the
variation in residential satisfaction index. However, when another predictor
named corridor was included as well (model 2), this value increased to
33.8% of the variance in residential satisfaction index. Hence, if the
quietness of housing estate has explained 16.6%, it obviously showed that
the corridor explained an additional 17.2% (17.2% = 33.8% - 16.6%, this
value also is the R Square Change in the table). In addition, after another
predictor named electrical & telecommunication wiring was also included
(model 3), this value increased to 46.3% of the variance in residential
satisfaction index. Thus, when the quietness of housing estate and corridor
have explained 33.8%, it obviously showed that the electrical &
telecommunication wiring explained an additional 12.5%. Moreover, when
another predictor named Binhe Huayuan’s children’s playground was
additionally added (model 4), this value increased to 53.9% of the variance
in residential satisfaction index. So, when the quietness of housing estate,
corridor and electrical & telecommunication wiring have explained 46.3%, it
obviously showed that the Binhe Huayuan’s children’s playground explained
an additional 7.6%. Furthermore, when another predictor called main means
of transportation (by driving vs. by cycling) was added as well (model 5),
this value increased to 58.9% of the variance in residential satisfaction index.
So, when the quietness of housing estate, corridor, electrical &
telecommunication wiring and children’s playground have explained 53.9%,
it obviously showed that the main means of transportation (by driving vs. by
cycling) explained an additional 5%. Additionally, after another predictor
named Binhe Huayuan’s open space was added as well (model 6), this value
increased to 63.1% of the variance in residential satisfaction index. So, when
the quietness of housing estate, corridor, electrical & telecommunication
wiring, children’s playground and main means of transportation (by driving
vs. by cycling) have explained 58.9%, it showed that the Binhe Huayuan’s
open space explained an additional 4.2%. What is more, after another
predictor named local shops was also added (model 7), this value increased
to 66.7% of the variance in residential satisfaction index. So, when the
quietness of housing estate, corridor, electrical & telecommunication wiring,
children’s playground, main means of transportation main means of
transportation (by driving vs. by cycling) and Binhe Huayuan’s open space
have explained 63.1%, it showed that the local shops explained an additional
3.6%. After another predictor named community relationship was also added
(model 8), this value increased to 69.8% of the variance in residential
satisfaction index. So, when the quietness of housing estate, corridor,
electrical & telecommunication wiring, children’s playground, main means
of transportation main means of transportation (by driving vs. by cycling),
Binhe Huayuan’s open space and local shops explained 66.7%, it showed
that the community relationship explained an additional 3.1%. When another
predictor named local kindergarten was additionally included (model 9), this
value improved to 73.3% of the variance in residential satisfaction index.
Then, when the quietness of housing estate, corridor, electrical &
telecommunication wiring, children’s playground, main means of
transportation main means of transportation (by driving vs. by cycling),
Binhe Huayuan’s open space, local shops and community relationship have
accounted for 69.8%, it indicated that the local kindergarten explained 3.5%
additionally. When another predictor called local police station was
additionally added (model 10), this value improved to 75.6% of the variance

432
in residential satisfaction index. Then, when the quietness of housing estate,
corridor, electrical & telecommunication wiring, children’s playground, main
means of transportation main means of transportation (by driving vs. by
cycling), Binhe Huayuan’s open space, local shops, community relationship
and local kindergarten have accounted for 73.3%, it indicated that the local
police station explained 2.3% additionally. Likewise, when another predictor
named nearest fire station was added as well (model 11), this value improved
to 77.9% of the variance in residential satisfaction index. Then, when the
quietness of housing estate, corridor, electrical & telecommunication wiring,
children’s playground, main means of transportation main means of
transportation (by driving vs. by cycling), Binhe Huayuan’s open space,
local shops, community relationship, local kindergarten and local police
station accounted for 75.6%, it indicated that the nearest fire station
accounted for 2.3% additionally. Similarly, when another predictor called
living room was also added (model 12), this value improved to 80.4% of the
variance in residential satisfaction index. Then, when the quietness of
housing estate, corridor, electrical & telecommunication wiring, children’s
playground, main means of transportation main mean of transportation (by
driving vs. by cycling), Binhe Huayuan’s open space, local shops,
community relationship, local kindergarten, local police station and nearest
fire station accounted for 77.9%, it indicated that the living room accounted
for 2.5% additionally. Also, when another predictor named floor level
(4th
floor vs. 3rd
floor) was finally added as well (model 13), this value
improved to 81.5% of the variance in residential satisfaction index. Then,
when the quietness of housing estate, corridor, electrical &
telecommunication wiring, children’s playground, main means of
transportation main means of transportation (by driving vs. by cycling),
Binhe Huayuan’s open space, local shops, community relationship, local
kindergarten, local police station, nearest fire station and living room have
accounted for 80.4%, it indicated the floor level (4th
floor vs. 3rd
floor) that
accounted for 1.1% additionally. Therefore, 13 predictors which have been
left have explained a large amount of the variation (81.5%) in the Binhe
Huayuan’s residential satisfaction index.
In addition, the following Stein’s formula to the R2 can understand its likely
value in different samples.
adjusted 𝑅2 = 1 − [(𝑛 − 1
𝑛 − 𝑘 − 1) (
𝑛 − 2
𝑛 − 𝑘 − 2) (
𝑛 + 1
𝑛)] (1 − 𝑅2)
Stein’s formula was given in equation and can be applied by replacing n with
the sample size (80) and k with the number of predictors (13), as follows,
adjusted 𝑅2 = 1 − [(80 − 1
80 − 13 − 1) (
80 − 2
80 − 13 − 2) (
80 + 1
80)] (1 − 0.815)
= 1 – [(1.197)(1.2)(1.013)](0.185)
= 1 – 0.269
= 0.731
The value is similar to the value of 𝑅2 (.815) indicating that the cross-
validity of this model is good. Thus, the adjusted R2 value (.779/.731) of the
model indicated that 77.9/73.1% of the variance in residential satisfaction

433
index had been explained by the model. The tolerance values of the
coefficients of predictor variables are well over 0.22/0.26
(1 − adjusted 𝑅2 ) and this indicated the absence of multicollinearity
between the predictor variables of the model. Then, finally, the Durbin-
Watson statistic is found in the last column of the table in Table. That the
value is closer to 2 is the better. For these data the value was 2.130, which is
close to 2 that the assumption has almost certainly been met.
ANOVA Table: ANOVAa
Model Sum of Squares
df Mean Square F Sig.
1
Regression 190.881 1 190.881 15.519 .000b
Residual 959.391 78 12.300
Total 1150.272 79
2
Regression 389.128 2 194.564 19.683 .000c
Residual 761.144 77 9.885
Total 1150.272 79
3
Regression 532.580 3 177.527 21.843 .000d
Residual 617.692 76 8.128
Total 1150.272 79
4
Regression 620.031 4 155.008 21.925 .000e
Residual 530.241 75 7.070
Total 1150.272 79
5
Regression 677.882 5 135.576 21.238 .000f
Residual 472.390 74 6.384
Total 1150.272 79
6
Regression 725.891 6 120.982 20.811 .000g
Residual 424.381 73 5.813
Total 1150.272 79
7
Regression 767.213 7 109.602 20.601 .000h
Residual 383.059 72 5.320
Total 1150.272 79
8
Regression 802.975 8 100.372 20.520 .000i
Residual 347.297 71 4.892
Total 1150.272 79
9
Regression 842.677 9 93.631 21.308 .000j
Residual 307.595 70 4.394
Total 1150.272 79
10
Regression 869.215 10 86.922 21.339 .000k
Residual 281.057 69 4.073
Total 1150.272 79
11
Regression 895.922 11 81.447 21.775 .000l
Residual 254.350 68 3.740
Total 1150.272 79
12
Regression 924.812 12 77.068 22.902 .000m
Residual 225.460 67 3.365
Total 1150.272 79

434
Table, continued
Model Sum of
Squares df Mean Square F Sig.
13
Regression 937.776 13 72.137 22.405 .000n
Residual 212.496 66 3.220
Total 1150.272 79
a. Dependent Variable: Binhe Huayuan's Residential Satisfaction Index (%)
b. Predictors: (Constant), Quietness of housing estate
c. Predictors: (Constant), Quietness of housing estate, Corridor
d. Predictors: (Constant), Quietness of housing estate, Corridor, Electrical & Telecommunication wiring
e. Predictors: (Constant), Quietness of housing estate, Corridor, Electrical & Telecommunication wiring, Binhe Huayuan's
Children's Playground
f. Predictors: (Constant), Quietness of housing estate, Corridor, Electrical & Telecommunication wiring, Binhe Huayuan's Children's
Playground, Main Means of Transportation (By Driving vs. By Cycling)
g. Predictors: (Constant), Quietness of housing estate, Corridor, Electrical & Telecommunication wiring, Binhe Huayuan's
Children's Playground, Main Means of Transportation (By Driving vs. By Cycling), Binhe Huayuan's Open Space
h. Predictors: (Constant), Quietness of housing estate, Corridor, Electrical & Telecommunication wiring, Binhe Huayuan's
Children's Playground, Main Means of Transportation (By Driving vs. By Cycling), Binhe Huayuan's Open Space, Local Shops
i. Predictors: (Constant), Quietness of housing estate, Corridor, Electrical & Telecommunication wiring, Binhe Huayuan's Children's
Playground, Main Means of Transportation (By Driving vs. By Cycling), Binhe Huayuan's Open Space, Local Shops, Community
Relationship
j. Predictors: (Constant), Quietness of housing estate, Corridor, Electrical & Telecommunication wiring, Binhe Huayuan's Children's
Playground, Main Means of Transportation (By Driving vs. By Cycling), Binhe Huayuan's Open Space, Local Shops, Community
Relationship, Local Kindergarten
k. Predictors: (Constant), Quietness of housing estate, Corridor, Electrical & Telecommunication wiring, Binhe Huayuan's
Children's Playground, Main Means of Transportation (By Driving vs. By Cycling), Binhe Huayuan's Open Space, Local Shops,
Community Relationship, Local Kindergarten, Local Police Station
l. Predictors: (Constant),Quietness of housing estate, Corridor, Electrical & Telecommunication wiring, Binhe Huayuan's Children's
Playground, Main Means of Transportation (By Driving vs. By Cycling), Binhe Huayuan's Open Space, Local Shops, Community
Relationship, Local Kindergarten, Local Police Station, Nearest Fire Station
m. Predictors: (Constant), Quietness of housing estate, Corridor, Electrical & Telecommunication wiring, Binhe Huayuan's
Children's Playground, Main Means of Transportation (By Driving vs. By Cycling), Binhe Huayuan's Open Space, Local Shops,
Community Relationship, Local Kindergarten, Local Police Station, Nearest Fire Station, Living room
n. Predictors: (Constant), Quietness of housing estate, Corridor, Electrical & Telecommunication wiring, Binhe Huayuan's
Children's Playground, Main Means of Transportation (By Driving vs. By Cycling), Binhe Huayuan's Open Space, Local Shops,
Community Relationship, Local Kindergarten, Local Police Station, Nearest Fire Station, Living room, Floor level (4thFloor vs.
3rdFloor)
Source: SPSS OUTPUT, ANOVA
Table indicated that the combination of predictor variables significantly
predicted the residential satisfaction of Binhe Huayuan, with F (13, 66) =
22.405, p < .001, with all 13 predictors significantly contributing to the
prediction.

435
Model parameters Table: Coefficientsa
Model
Unstandardized
Coefficients
Standardized
Coefficients t Sig.
95.0% Confidence Interval
for B
B Std.
Error Beta
Lower
Bound
Upper
Bound
13
(Constant) 34.113 2.219 15.374 .000 29.683 38.544
Quietness of housing estate
.043 .009 .272 4.707 .000 .025 .061
Corridor .061 .010 .367 6.171 .000 .041 .081
Electrical &
Telecommunication wiring
.059 .008 .402 7.013 .000 .042 .076
Binhe Huayuan's Children's
Playground
.048 .011 .240 4.343 .000 .026 .070
Main Means of
Transportation (By Driving vs. By
Cycling)
-1.321 .470 -.170 -2.810 .007 -2.260 -.382
Binhe Huayuan's
Open Space .043 .012 .208 3.669 .000 .020 .067
Local Shops .033 .010 .196 3.389 .001 .014 .053
Community Relationship
.033 .011 .173 3.014 .004 .011 .055
Local Kindergarten .034 .010 .197 3.571 .001 .015 .054
Local Police Station .036 .010 .207 3.627 .001 .016 .056
Nearest Fire Station .042 .012 .214 3.625 .001 .019 .066
Living room .028 .009 .171 3.037 .003 .010 .046
Floor level (4thFloor
vs. 3rdFloor) 1.182 .589 .125 2.007 .049 .006 2.358
a. Dependent Variable: Binhe Huayuan's Residential Satisfaction (%)
Source: SPSS OUTPUT, Coefficients
Table, continued
Model
Correlations Collinearity Statistics
Zero-order Partial Part Tolerance VIF
13
(Constant)
Quietness of housing estate .407 .501 .249 .841 1.190
Corridor .374 .605 .326 .792 1.263
Electrical & Telecommunication wiring
.400 .653 .371 .851 1.175
Binhe Huayuan's Children's
Playground .341 .471 .230 .919 1.088
Main Means of Transportation (By Driving vs. By Cycling)
-.384 -.327 -.149 .767 1.303
Binhe Huayuan's Open Space .292 .412 .194 .874 1.145
Local Shops .278 .385 .179 .833 1.200
Community Relationship .134 .348 .159 .853 1.172
Local Kindergarten .261 .402 .189 .921 1.086
Local Police Station .026 .408 .192 .855 1.169
Nearest Fire Station .133 .408 .192 .801 1.248
Living room .218 .350 .161 .885 1.130
Floor level (4thFloor vs. 3rdFloor) -.008 .240 .106 .725 1.379
a. Dependent Variable: Binhe Huayuan's Residential Satisfaction (%)
Source: SPSS OUTPUT, Coefficients
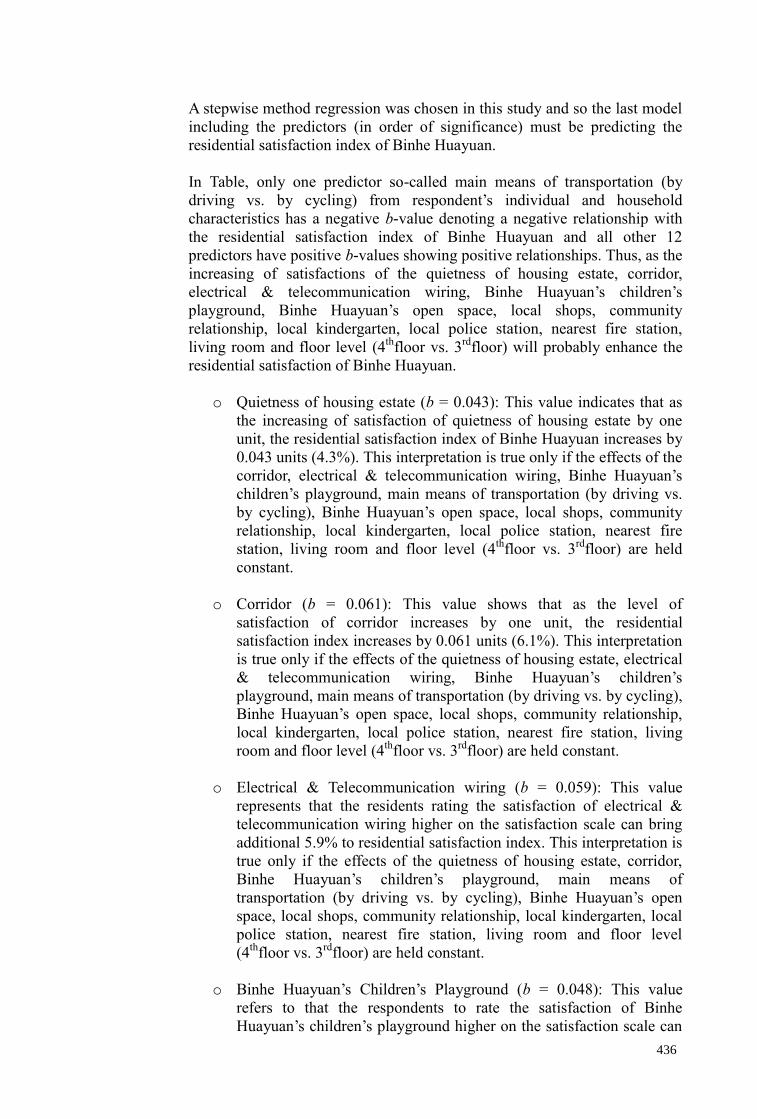
436
A stepwise method regression was chosen in this study and so the last model
including the predictors (in order of significance) must be predicting the
residential satisfaction index of Binhe Huayuan.
In Table, only one predictor so-called main means of transportation (by
driving vs. by cycling) from respondent’s individual and household
characteristics has a negative b-value denoting a negative relationship with
the residential satisfaction index of Binhe Huayuan and all other 12
predictors have positive b-values showing positive relationships. Thus, as the
increasing of satisfactions of the quietness of housing estate, corridor,
electrical & telecommunication wiring, Binhe Huayuan’s children’s
playground, Binhe Huayuan’s open space, local shops, community
relationship, local kindergarten, local police station, nearest fire station,
living room and floor level (4th
floor vs. 3rd
floor) will probably enhance the
residential satisfaction of Binhe Huayuan.
o Quietness of housing estate (b = 0.043): This value indicates that as
the increasing of satisfaction of quietness of housing estate by one
unit, the residential satisfaction index of Binhe Huayuan increases by
0.043 units (4.3%). This interpretation is true only if the effects of the
corridor, electrical & telecommunication wiring, Binhe Huayuan’s
children’s playground, main means of transportation (by driving vs.
by cycling), Binhe Huayuan’s open space, local shops, community
relationship, local kindergarten, local police station, nearest fire
station, living room and floor level (4th
floor vs. 3rd
floor) are held
constant.
o Corridor (b = 0.061): This value shows that as the level of
satisfaction of corridor increases by one unit, the residential
satisfaction index increases by 0.061 units (6.1%). This interpretation
is true only if the effects of the quietness of housing estate, electrical
& telecommunication wiring, Binhe Huayuan’s children’s
playground, main means of transportation (by driving vs. by cycling),
Binhe Huayuan’s open space, local shops, community relationship,
local kindergarten, local police station, nearest fire station, living
room and floor level (4th
floor vs. 3rd
floor) are held constant.
o Electrical & Telecommunication wiring (b = 0.059): This value
represents that the residents rating the satisfaction of electrical &
telecommunication wiring higher on the satisfaction scale can bring
additional 5.9% to residential satisfaction index. This interpretation is
true only if the effects of the quietness of housing estate, corridor,
Binhe Huayuan’s children’s playground, main means of
transportation (by driving vs. by cycling), Binhe Huayuan’s open
space, local shops, community relationship, local kindergarten, local
police station, nearest fire station, living room and floor level
(4th
floor vs. 3rd
floor) are held constant.
o Binhe Huayuan’s Children’s Playground (b = 0.048): This value
refers to that the respondents to rate the satisfaction of Binhe
Huayuan’s children’s playground higher on the satisfaction scale can

437
bring extra 4.8% to residential satisfaction index. This interpretation
is true only if the effects of the quietness of housing estate, corridor,
electrical & telecommunication wiring, main means of transportation
(by driving vs. by cycling), Binhe Huayuan’s open space, local shops,
community relationship, local kindergarten, local police station,
nearest fire station, living room and floor level (4th
floor vs. 3rd
floor)
are held constant.
o Main Means of Transportation (By Driving vs. By Cycling) (b = -
1.321): This value signifies that the factor of main means of
transportation by cycling diminishes 132.1% of the residential
satisfaction index comparing to other predictors. In particular, the
change in the residential satisfaction index is greater for the group of
residents going outside regularly by cycling than it is for the group of
residents going outside frequently by driving. This interpretation is
true only if the effects of the quietness of housing estate, corridor,
electrical & telecommunication wiring, Binhe Huayuan’s children’s
playground, Binhe Huayuan’s open space, local shops, community
relationship, local kindergarten, local police station, nearest fire
station, living room and floor level (4th
floor vs. 3rd
floor) are held
constant.
o Binhe Huayuan’s Open Space (b = 0.043): This value conveys that
the residents to rate the satisfaction of Binhe Huayuan’s open space
higher on the satisfaction scale could bring supplementary 4.3% to
residential satisfaction index. This interpretation is true only if the
effects of the quietness of housing estate, corridor, electrical &
telecommunication wiring, Binhe Huayuan’s children’s playground,
main means of transportation (by driving vs. by cycling), local shops,
community relationship, local kindergarten, local police station,
nearest fire station, living room and floor level (4th
floor vs. 3rd
floor)
are held constant.
o Local Shops (b = 0.033): This value denotes that the residents to rate
the satisfaction of local shops higher on the satisfaction scale can
bring further 3.3% to residential satisfaction index. This
interpretation is true only if the effects of the quietness of housing
estate, corridor, electrical & telecommunication wiring, Binhe
Huayuan’s children’s playground, main means of transportation (by
driving vs. by cycling), Binhe Huayuan’s open space, community
relationship, local kindergarten, local police station, nearest fire
station, living room and floor level (4th
floor vs. 3rd
floor) are held
constant.
o Community relationship (b = 0.033): This value delivers that the
residents to rate the satisfaction of their community relationship
higher on the satisfaction scale could bring added 3.3% to residential
satisfaction index. This interpretation is true only if the effects of the
quietness of housing estate, corridor, electrical & telecommunication
wiring, Binhe Huayuan’s children’s playground, main means of
transportation (by driving vs. by cycling), Binhe Huayuan’s open
space, local shops, local kindergarten, local police station, nearest fire

438
station, living room and floor level (4th
floor vs. 3rd
floor) are held
constant.
o Local Kindergarten (b = 0.034): This value indicates that the
residents to rate the satisfaction of local kindergarten higher on the
satisfaction scale could bring additional 3.4% to residential
satisfaction index. This interpretation is true only if the effects of the
quietness of housing estate, corridor, electrical & telecommunication
wiring, Binhe Huayuan’s children’s playground, main means of
transportation (by driving vs. by cycling), Binhe Huayuan’s open
space, local shops, community relationship, local police station,
nearest fire station, living room and floor level (4th
floor vs. 3rd
floor)
are held constant.
o Local Police Station (b = 0.036): This value indicates that the
residents to rate the satisfaction of local police station higher on the
satisfaction scale can bring additional 3.6% to residential satisfaction
index. This interpretation is true only if the effects of the quietness of
housing estate, corridor, electrical & telecommunication wiring,
Binhe Huayuan’s children’s playground, main mean of transportation
(by driving vs. by cycling), Binhe Huayuan’s open space, local shops,
community relationship, local kindergarten, nearest fire station,
living room and floor level (4th
floor vs. 3rd
floor) are held constant.
o Nearest Fire Station (b = 0.042): This value indicates that the
residents to rate the satisfaction of the nearest fire station higher on
the satisfaction scale can bring additional 4.2% to residential
satisfaction index. This interpretation is true only if the effects of the
quietness of housing estate, corridor, electrical & telecommunication
wiring, Binhe Huayuan’s children’s playground, main means of
transportation (by driving vs. by cycling), Binhe Huayuan’s open
space, local shops, community relationship, local kindergarten, local
police station, living room and floor level (4th
floor vs. 3rd
floor) are
held constant.
o Living room (b = 0.028): This value indicates that the residents to
rate the satisfaction of living room higher on the satisfaction scale
can bring additional 2.8% to residential satisfaction index. This
interpretation is true only if the effects of the quietness of housing
estate, corridor, electrical & telecommunication wiring, Binhe
Huayuan’s children’s playground, main means of transportation (by
driving vs. by cycling), Binhe Huayuan’s open space, local shops,
community relationship, local kindergarten, local police station,
nearest fire station and floor level (4th
floor vs. 3rd
floor) are held
constant.
o Floor level (4th
Floor vs. 3rd
Floor) (b = 1.182): This value signifies
that the factor of 3rd
floor contributes 118.2% to improving the
residential satisfaction index comparing to other predictors. In
particular, the change in the residential satisfaction index is greater
for the group of residents who are living on the 3rd
floor than it is for
the group of residents who are living on the 4th
floor. This
interpretation is true only if the effects of the quietness of housing

439
estate, corridor, electrical & telecommunication wiring, Binhe
Huayuan’s children’s playground, main means of transportation (by
driving vs. by cycling), Binhe Huayuan’s open space, local shops,
community relationship, local kindergarten, local police station,
nearest fire station and living room are held constant.
Additionally, in this model, the quietness of housing estate (t (66) = 4.707, p
< .001), the corridor (t (66) = 6.171, p < .001), the electrical &
telecommunication wiring (t (66) = 7.013, p < .001), the Binhe Huayuan’s
children’s playground (t (66) = 4.343, p < .001), the main means of
transportation (by driving vs. by cycling) (t (66) = -2.810, p < .01), the Binhe
Huayuan’s open space (t (66) = 3.669, p < .001), the local shops (t (66) =
3.389, p < .01), the community relationship (t (66) = 3.014, p < .01), the
local kindergarten (t (66) = 3.571, p < .001), the police station (t (66) =
3.627, p < .001), the nearest fire station (t (66) = 3.625., p < .001), the living
room (t (66) = 3.037, p < .01) and the floor level (4th
floor vs. 3rd
floor) (t (66)
= 2.007., p < .05) are all significant predictors of the residential satisfaction
index. Hence, from the magnitude of the t-statistics, it is reported that the
satisfactions with the electrical & telecommunication wiring, corridor,
quietness of housing estate, Binhe Huayuan’s children’s playground and
Binhe Huayuan’s open space have the most impact and the satisfactions with
the police station, nearest fire station, local kindergarten, local shops, living
room, and community relationship, and the main means of transportation (by
driving vs. by cycling) have the moderately impact, whereas the floor level
(4th
floor vs. 3rd
floor) has less impact on the Binhe Huayuan’s residential
satisfaction index.
In accordance with what the magnitude of the t-statistics explained above,
the standardized beta values for the electrical & telecommunication wiring,
corridor, quietness of housing estate, Binhe Huayuan’s children’s playground
and Binhe Huayuan’s open space are essentially identical
(.402, .367, .272, .240 and .208, respectively) meaning that these five
determinants have a comparable degree of importance in the model, in
addition, the determinants of the police station, nearest fire station, local
kindergarten, local shops, living room, community relationship and main
means of transportation (by driving vs. by cycling) also have a comparable
degree of importance in the model (.207, .214, .197, .196, .171, .173 and -
.170, respectively) and the determinant of the floor level (4th
floor vs.
3rd
floor) have a comparable degree of importance in the model as well
(.125).
Quietness of housing estate (standardized β = .272): This value
indicates that as the satisfaction of quietness of housing estate
increases by one standard deviation (24.119%), the residential
satisfaction index increases by 0.272 standard deviations. The
standard deviation for the residential satisfaction index is 3.816 and
so this constitutes a change of 1.038% (0.272 × 3.816). So, as every
24.119% more increased on the satisfaction of quietness of housing
estate, an additional 1.038% increase in the residential satisfaction
index can be expected. This interpretation is true only if the effects of
the corridor, electrical & telecommunication wiring, Binhe
Huayuan’s children’s playground, main means of transportation (by

440
driving vs. by cycling), Binhe Huayuan’s open space, local shops,
community relationship, local kindergarten, local police station,
nearest fire station, living room and floor level (4th
floor vs. 3rd
floor)
are held constant.
Corridor (standardized β = .367): This value indicates that as the
satisfaction of corridor improves by one standard deviation
(22.920%), the residential satisfaction index enhances by 0.367
standard deviations. The standard deviation for the residential
satisfaction index is 3.816 and so this constitutes a change of 1.400%
(0.367 × 3.816). So, for every 22.920% more increased on the
satisfaction of corridor, an additional 1.400% growth in the
residential satisfaction index can be achieved. This interpretation is
true only if the effects of the quietness of housing estate, electrical &
telecommunication wiring, Binhe Huayuan’s children’s playground,
main means of transportation (by driving vs. by cycling), Binhe
Huayuan’s open space, local shops, community relationship, local
kindergarten, local police station, nearest fire station, living room and
floor level (4th
floor vs. 3rd
floor) are held constant.
Electrical & Telecommunication wiring (standardized β = .402): This
value indicates that as the satisfaction of electrical &
telecommunication wiring rises by one standard deviation (26.053%),
the residential satisfaction index grows by 0.402 standard deviations.
The standard deviation for the residential satisfaction index is 3.816
and so this represents a change of 1.534% (0.402 × 3.816). Thus, as
every 26.053% more added on the satisfaction of electrical &
telecommunication wiring, an additional 1.534% rise in the
residential satisfaction index can be produced. This interpretation is
true only if the effects of the quietness of housing estate, corridor,
Binhe Huayuan’s children’s playground, main means of
transportation (by driving vs. by cycling), Binhe Huayuan’s open
space, local shops, community relationship, local kindergarten, local
police station, nearest fire station, living room and floor level
(4th
floor vs. 3rd
floor) are held constant.
Binhe Huayuan’s Children’s Playground (standardized β = .240):
This value indicates that as the satisfaction of Binhe Huayuan’s
children’s playground escalates by one standard deviation (18.947%),
the residential satisfaction index develops by 0.240 standard
deviations. The standard deviation for the residential satisfaction
index is 3.816 and so this constitutes a change of 0.916% (0.240 ×
3.816). So, for each 18.947% more improved on the satisfaction of
Binhe Huayuan’s children’s playground, an additional 0.916%
escalation in the residential satisfaction index can be produced. This
interpretation is true only if the effects of the quietness of housing
estate, corridor, electrical & telecommunication wiring, main means
of transportation (by driving vs. by cycling), Binhe Huayuan’s open
space, local shops, community relationship, local kindergarten, local
police station, nearest fire station, living room and floor level
(4th
floor vs. 3rd
floor) are held constant.
Main Means of Transportation (By Driving vs. By Cycling)
(standardized β = -.170): This value indicates that as the
dissatisfaction of the group of residents who are going outside
frequently by cycling increases by one standard deviation (0.490%),

441
the residential satisfaction index decreases by 0.170 standard
deviations. The standard deviation for the residential satisfaction
index is 3.816 and so this constitutes a change of -0.649% (-0.170 ×
3.816). Thus, as every 0.490% more increased on the dissatisfaction
of the group of residents who are going outside regularly by cycling,
the residential satisfaction index will be decreased by 0.649%. This
interpretation is true only if the effects of the quietness of housing
estate, corridor, electrical & telecommunication wiring, Binhe
Huayuan’s children’s playground, Binhe Huayuan’s open space, local
shops, community relationship, local kindergarten, local police
station, nearest fire station, living room and floor level (4th
floor vs.
3rd
floor) are held constant.
Binhe Huayuan’s Open Space (standardized β = .208): This value
indicates that as the satisfaction of Binhe Huayuan’s open space
enlarges by one standard deviation (18.362%), the residential
satisfaction index increases by 0.208 standard deviations. The
standard deviation for the residential satisfaction index is 3.816 and
so this constitutes a change of 0.794% (0.208 × 3.816). As a result,
for each 18.362% more enhanced on the satisfaction of Binhe
Huayuan’s open space, the residential satisfaction index will be
enlarged by 0.794%. This interpretation is true only if the effects of
the quietness of housing estate, corridor, electrical &
telecommunication wiring, Binhe Huayuan’s children’s playground,
main means of transportation (by driving vs. by cycling), local shops,
community relationship, local kindergarten, local police station,
nearest fire station, living room and floor level (4th
floor vs. 3rd
floor)
are held constant.
Local Shops (standardized β = .196): This value indicates that as the
satisfaction of local shops enlarges by one standard deviation
(22.399%), the residential satisfaction index increases by 0.196
standard deviations. The standard deviation for the residential
satisfaction index is 3.816 and so this constitutes a change of 0.748%
(0.196 × 3.816). Therefore, as every 22.399% more improved on the
satisfaction of local shops, the residential satisfaction index will be
increased by 0.748%. This interpretation is true only if the effects of
the quietness of housing estate, corridor, electrical &
telecommunication wiring, Binhe Huayuan’s children’s playground,
main means of transportation (by driving vs. by cycling), Binhe
Huayuan’s open space, community relationship, local kindergarten,
local police station, nearest fire station, living room and floor level
(4th
floor vs. 3rd
floor) are held constant.
Community Relationship (standardized β = .173): This value
indicates that as the satisfaction of community relationship increases
by one standard deviation (19.859%), the residential satisfaction
index increases by 0.173 standard deviations. The standard deviation
for the residential satisfaction index is 3.816 and so this constitutes a
change of 0.660% (0.173 × 3.816). Therefore, as each 19.859% more
improved on the satisfaction of community relationship, an additional
0.660% growth in the residential satisfaction index can be achieved.
This interpretation is true only if the effects of the quietness of
housing estate, corridor, electrical & telecommunication wiring,
Binhe Huayuan’s children’s playground, main means of

442
transportation (by driving vs. by cycling), Binhe Huayuan’s open
space, local shops, local kindergarten, local police station, nearest fire
station, living room and floor level (4th
floor vs. 3rd
floor) are held
constant.
Local Kindergarten (standardized β = .197): This value indicates that
as the satisfaction of local kindergarten rises by one standard
deviation (21.784%), the residential satisfaction index increases by
0.197 standard deviations. The standard deviation for the residential
satisfaction index is 3.816 and so this constitutes a change of 0.752%
(0.197 × 3.816). So, for every 21.784% more enhanced on the
satisfaction of local kindergarten, the residential satisfaction index
will be increased by 0.752%. This interpretation is true only if the
effects of the quietness of housing estate, corridor, electrical &
telecommunication wiring, Binhe Huayuan’s children’s playground,
main means of transportation (by driving vs. by cycling), Binhe
Huayuan’s open space, local shops, community relationship, local
police station, nearest fire station, living room and floor level
(4th
floor vs. 3rd
floor) are held constant.
Local Police Station (standardized β = .207): This value indicates
that as the satisfaction of local police station intensifies by one
standard deviation (22.103%), the residential satisfaction index
increases by 0.207 standard deviations. The standard deviation for the
residential satisfaction index is 3.816 and so this constitutes a change
of 0.790% (0.207 × 3.816). Therefore, as every 22.103% more
enhanced on the satisfaction of local police station, the residential
satisfaction index will be improved by 0.790%. This interpretation is
true only if the effects of the quietness of housing estate, corridor,
electrical & telecommunication wiring, Binhe Huayuan’s children’s
playground, main means of transportation (by driving vs. by cycling),
Binhe Huayuan’s open space, local shops, community relationship,
local kindergarten, nearest fire station, living room and floor level
(4th
floor vs. 3rd
floor) are held constant.
Nearest Fire Station (standardized β = .214): This value indicates that
as the satisfaction of the nearest fire station grows by one standard
deviation (19.297%), the residential satisfaction index increases by
0.214 standard deviations. The standard deviation for the residential
satisfaction index is 3.816 and so this constitutes a change of 0.817%
(0.214 × 3.816). Thus, for each 19.297% more improved on the
satisfaction of the nearest fire station, the residential satisfaction
index will be increased by 0.817%. This interpretation is true only if
the effects of the quietness of housing estate, corridor, electrical &
telecommunication wiring, Binhe Huayuan’s children’s playground,
main means of transportation (by driving vs. by cycling), Binhe
Huayuan’s open space, local shops, community relationship, local
kindergarten, local police station, living room and floor level (4th
floor
vs. 3rd
floor) are held constant.
Living room (standardized β = .171): This value indicates that as the
satisfaction of living room increases by one standard deviation
(23.420%), the residential satisfaction index increases by 0.171
standard deviations. The standard deviation for the residential
satisfaction index is 3.816 and so this constitutes a change of 0.653%
(0.171 × 3.816). So, as each 23.420% more increased on the

443
satisfaction of living room, an additional 0.653% rise in the
residential satisfaction index can be expected. This interpretation is
true only if the effects of the quietness of housing estate, corridor,
electrical & telecommunication wiring, Binhe Huayuan’s children’s
playground, main means of transportation (by driving vs. by cycling),
Binhe Huayuan’s open space, local shops, community relationship,
local kindergarten, local police station, nearest fire station and floor
level (4th
floor vs. 3rd
floor) are held constant.
Floor level (4th
floor vs. 3rd
floor) (standardized β = .125): This value
indicates that as the satisfaction of the group of residents who are
living on the 3rd
floor increases by one standard deviation (0.403%),
the residential satisfaction index increases by 0.125 standard
deviations. The standard deviation for the residential satisfaction
index is 3.816 and so this constitutes a change of 0.477% (0.125 ×
3.816). As a result, for every 0.403% more improved on the
satisfaction of the group of residents who are living on the 3rd
floor,
the residential satisfaction index will be increased by 0.477%. This
interpretation is true only if the effects of the quietness of housing
estate, corridor, electrical & telecommunication wiring, Binhe
Huayuan’s children’s playground, main means of transportation (by
driving vs. by cycling), Binhe Huayuan’s open space, local shops,
community relationship, local kindergarten, local police station,
nearest fire station and living room are held constant.
The confidence intervals of the unstandardized beta values in Table are
boundaries constructed such that in 95% of these samples these boundaries
will contain the true value of b, also indicating that 95% of these confidence
intervals would contain the true value of b. Thus, the confidence intervals
constructed for the Binhe Huayuan’s sample will contain the true value of b
in the population.
Moreover, in the Binhe Huayuan’s model, the 11 best predictors (the
quietness of housing estate, corridor, electrical & telecommunication wiring,
Binhe Huayuan’s children’s playground, Binhe Huayuan’s open space, local
shops, community relationship, local kindergarten, local police station,
nearest fire station and living room) have very tight confidence intervals
indicating that the estimates for the current model are likely to be
representative of the true population values. However, the interval for floor
level (4th
floor vs. 3rd
floor) is wider (but still does not cross zero) indicating
that the parameter for floor level (4th
floor vs. 3rd
floor) is less representative,
but nonetheless significant. More importantly, the interval for main means of
transportation (by driving vs. by cycling) is negative (cross zero) indicating
that the main means of transportation (by driving vs. by cycling) has a
negative relationship to the residential satisfaction index of Binhe Huayuan
and the parameter for main means of transportation (by driving vs. by
cycling) is only representative of the small group of population values.
Table provided some measures of whether there is collinearity in the data.
Particularly, it provides the VIF and tolerance statistics (with tolerance being
1 divided by the VIF). From this current model, the VIF values are all well
below 10 and the tolerance statistics all well above 0.2, and then, it can
safely conclude that there is no collinearity within this data. To calculate the
average VIF, Field (2011); (Field, 2013) described to simply add the VIF
values for each predictor and divide by the number of predictors (𝑘):
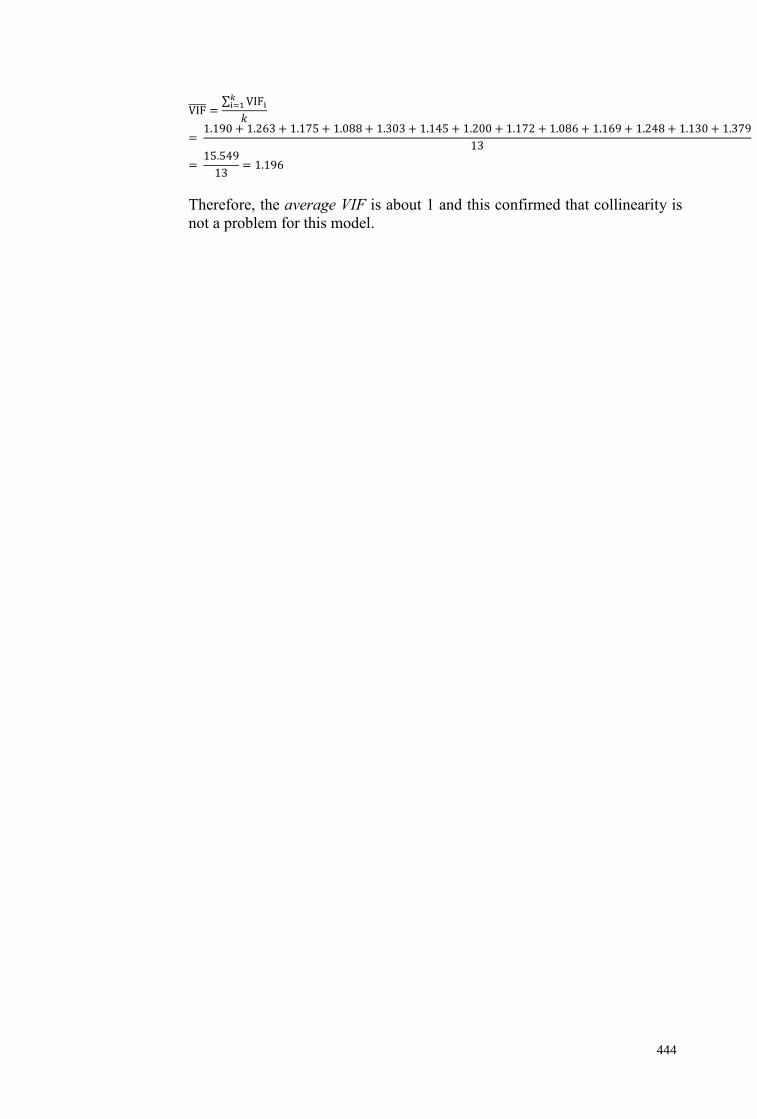
444
VIF̅̅ ̅̅̅ =∑ VIFi
𝑘i=1
𝑘
= 1.190 + 1.263 + 1.175 + 1.088 + 1.303 + 1.145 + 1.200 + 1.172 + 1.086 + 1.169 + 1.248 + 1.130 + 1.379
13
= 15.549
13= 1.196
Therefore, the average VIF is about 1 and this confirmed that collinearity is
not a problem for this model.

445
Appendix E: The Comparisons of Variables (Best Correlated to the Determinants) between the Three Phases
Residential
Satisfaction Index (%)
Respondents' Individual and Household characteristics
#Age51-60 #Above
Age 60
#Primary
school
#Single
#Married
#SOE #RMB
4,000-5,999 #1stFloor #6thFloor
<=3
years
#>5,<=7
years
#>7,<=
9years
#By
Cycling
#By
Driving
#By
Foot
Pearson
Correlation
and Sig.
(1-tailed)
Residential Satisfaction
Index (%) 1.000 (-.147) (-.028)/.048 (-.137)/.083 (-.098) (-.005) .143
(-.023)/
(-.005)/(-.053) (-.107)/.075 (-.074) .047 .192* (-.037) (-.384)*** (-.048) .224*
Respondents'
Individual and
Household
characteristics
#Age51-60 (-.147) .375***
#Above
Age 60 (-.028)/.048 .587*** .425***
#Primary
school (-.137)/.083 .587*** .406***
#Single (-.098)
#Married (-.005)
#SOE .143 .335***
#RMB4,000-
5,999 (-.023)/
(-.005)/(-.053)
#1stFloor (-.107)/.075
#6thFloor (-.074)
<=3 years .047 #>5,<=7
years .192*
#>7,<=9
years (-.037)
#By Cycling (-.384)*** .375***
#By Driving (-.048)
#By Foot .224* .425*** .406*** .335***
Note: #dummy variable [#Age (Age21-30 vs. Above Age 60), (Age21-30 vs. Age51-60); #Education attainment (Master and above vs. Primary school); #Marital status (Widowed/Divorced vs. Single); #Marital status (Widowed/Divorced vs. Married); #Monthly
net income of Household (RMB2,000-3,999 vs. RMB4,000-5,999); #Floor level (2ndFloor vs. 1stFloor); #Floor level (2ndFloor vs. 6thFloor); #Length of Residence (>5,<=7years vs. >7,<=9years), (>3,<=5 years vs. >5,<=7 years), (>5, <=7 years vs. <=3 years); #Main Means of Transportation (By Foot vs. By Driving), (By Driving vs. By Foot), (By Driving vs. By Cycling); #Occupation sector (Government Servant vs. State-owned enterprise (SOE))] *. Correlation is significant at the 0.05 level (1-tailed). **. Correlation is significant at the 0.01 level (1-tailed). ***. Correlation is significant at the 0.001 level (1-tailed). "(-)" = Negative correlation.
The Normal Colour represents the data of Phase 1; The Colour of Green represents the data of Phase 2; The Colour of Red represents the data of Phase 3.

446
Appendix E, continued
Residential
Satisfaction Index (%)
Respondents' Individual and Household characteristics
#Age
51-60
#Above Age
60
#Primary
school
#Single
#Married
#SOE #RMB
4,000-5,999 #1stFloor #6thFloor
<=3
years
#>5,<=7
years
#>7,<=
9years
#By
Cycling
#By
Driving
#By
Foot
Pearson
Correlation
and Sig. (1-
tailed)
Residential Satisfaction Index (%)
1.000 (-.147) (-.028)/.048 (-.137)/.083 (-.098) (-.005) .143
(-.023)/
(-.005)/
(-.053)
(-.107)/.075 (-.074) .047 .192* (-.037) (-.384)*** (-.048) .224*
Housing Unit
Characteristics
Living
room .286**/.175*
Dining
area .374*** /.053
Bedroom .527***/.180* (-.184)*
Kitchen .362***/.102 (-.236)*
Toilet .160 .218*
Drying
area .082
Note: #dummy variable [#Age (Age21-30 vs. Above Age 60), (Age21-30 vs. Age51-60); #Education attainment (Master and above vs. Primary school); #Marital status (Widowed/Divorced vs. Single); #Marital status (Widowed/Divorced vs. Married); #Monthly
net income of Household (RMB2,000-3,999 vs. RMB4,000-5,999); #Floor level (2ndFloor vs. 1stFloor); #Floor level (2ndFloor vs. 6thFloor); #Length of Residence (>5,<=7years vs. >7,<=9years), (>3,<=5 years vs. >5,<=7 years), (>5, <=7 years vs. <=3 years); #Main Means of Transportation (By Foot vs. By Driving), (By Driving vs. By Foot), (By Driving vs. By Cycling); #Occupation sector (Government Servant vs. State-owned enterprise (SOE))] *. Correlation is significant at the 0.05 level (1-tailed). **. Correlation is significant at the 0.01 level (1-tailed). ***. Correlation is significant at the 0.001 level (1-tailed). "(-)" = Negative correlation.
The Normal Colour represents the data of Phase 1; The Colour of Green represents the data of Phase 2; The Colour of Red represents the data of Phase 3.

447
Appendix E, continued
Residential
Satisfaction
Index (%)
Respondents' Individual and Household characteristics
#Age
51-60
#Above Age
60
#Primary
school #Single
#Marri
ed
#SOE
#RMB
4,000-
5,999
#1stFloor #6th
Floor
<=3
years
#>5,<=
7 years
#>7,<=
9years
#By
Cycling
#By
Driving
#By
Foot
Pearson
Correlation
and Sig. (1-
tailed)
Residential Satisfaction
Index (%) 1.000 (-.147) (-.028)/.048 (-.137)/.083 (-.098) (-.005) .143
(-.023)/
(-.005)/
(-.053)
(-.107)/.075 (-.074) .047 .192* (-.037) (-.384)*** (-.048) .224*
Housing
Unit
Supporting
Services
Drain .331***/.207*
Electrical &
Telecommunicati
on wiring
.378***/.279**/ .400***
Street Lighting .053/.076/.211*
Staircases .215*
corridor .314**/.374***
Garbage disposal .341***/.326** -.256** .240* -.186*
Note: #dummy variable [#Age (Age21-30 vs. Above Age 60), (Age21-30 vs. Age51-60); #Education attainment (Master and above vs. Primary school); #Marital status (Widowed/Divorced vs. Single); #Marital status (Widowed/Divorced vs. Married); #Monthly
net income of Household (RMB2,000-3,999 vs. RMB4,000-5,999); #Floor level (2ndFloor vs. 1stFloor); #Floor level (2ndFloor vs. 6thFloor); #Length of Residence (>5,<=7years vs. >7,<=9years), (>3,<=5 years vs. >5,<=7 years), (>5, <=7 years vs. <=3 years); #Main Means of Transportation (By Foot vs. By Driving), (By Driving vs. By Foot), (By Driving vs. By Cycling); #Occupation sector (Government Servant vs. State-owned enterprise (SOE))] *. Correlation is significant at the 0.05 level (1-tailed). **. Correlation is significant at the 0.01 level (1-tailed). ***. Correlation is significant at the 0.001 level (1-tailed). "(-)" = Negative correlation.
The Normal Colour represents the data of Phase 1; The Colour of Green represents the data of Phase 2; The Colour of Red represents the data of Phase 3.

448
Appendix E, continued
Residential Satisfaction
Index (%)
Respondents' Individual and Household characteristics
#Age51
-60
#Above
Age 60
#Primary
school #Single #Married #SOE
#RMB
4,000-5,999 #1stFloor
#6th
Floor
<=3
years
#>5,<=7
years
#>7,<=9
years
#By
Cycling
#By
Driving
#By
Foot
Pearson
Correlation
and Sig. (1-
tailed)
Residential Satisfaction
Index (%) 1.000 (-.147) (-.028)/.048 (-.137)/.083 (-.098) (-.005) .143
(-.023)/
(-.005)/
(-.053)
(-.107)/.075 (-.074) .047 .192* (-.037) (-.384)*** (-.048) .224*
Housing Estate
Supporting
Facilities
Open Space .142/.236*/
.292** (-.239)** (-.272)**
Children's
Playground
.034/.094/
.341*** ( -.211)* (-.285)**
Parking
facilities .105/.011
Perimeter road .078/.113/.088
Pedestrian
walkways .307**/.132
Local Shops .184*/.255**/
.278**
Local
Kindergarten .249**/.261**
Fitness
Equipment .116/(-.017)
Neighbourhood
Characteristics
Community
Relationship
.118/.229*/
.134
-
.274** (-.217)*
Quietness of
housing estate
.229*/.196*/ .407***
Local Crime
situation .297**/.414*** (-.271)**
Local
Accident
situation .304**/.131 (-.256)**
Nearest School .372***/.169 (-.209)* .219* .235*
Local Market .185*/(-.072) .241**
Nearest
Bus/Taxi
Station .086/.232* .297** .264**
Note: #dummy variable [#Age (Age21-30 vs. Above Age 60), (Age21-30 vs. Age51-60); #Education attainment (Master and above vs. Primary school); #Marital status (Widowed/Divorced vs. Single); #Marital status (Widowed/Divorced vs. Married); #Monthly net income of Household (RMB2,000-3,999
vs. RMB4,000-5,999); #Floor level (2ndFloor vs. 1stFloor); #Floor level (2ndFloor vs. 6thFloor); #Length of Residence (>5,<=7years vs. >7,<=9years), (>3,<=5 years vs. >5,<=7 years), (>5, <=7 years vs. <=3 years); #Main Means of Transportation (By Foot vs. By Driving), (By Driving vs. By Foot), (By
Driving vs. By Cycling); #Occupation sector (Government Servant vs. State-owned enterprise (SOE))] *. Correlation is significant at the 0.05 level (1-tailed). **. Correlation is significant at the 0.01 level (1-tailed). ***. Correlation is significant at the 0.001 level (1-tailed). "(-)" = Negative correlation.
The Normal Colour represents the data of Phase 1; The Colour of Green represents the data of Phase 2; The Colour of Red represents the data of Phase 3.
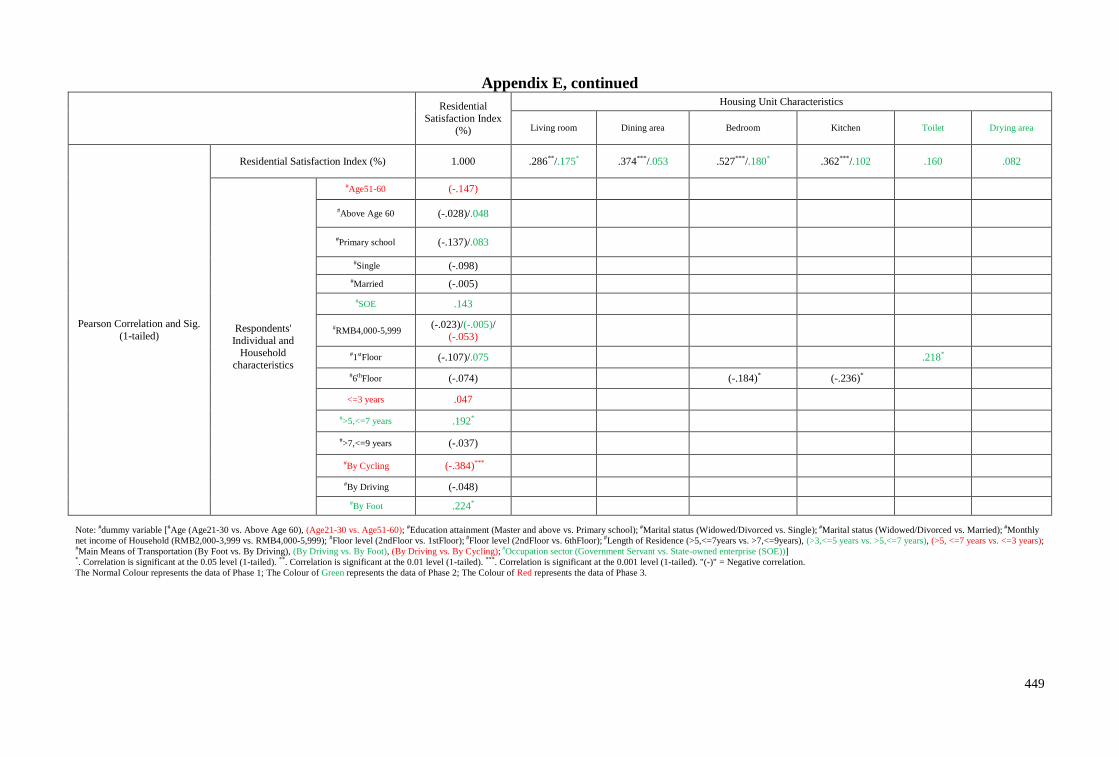
449
Appendix E, continued
Residential
Satisfaction Index (%)
Housing Unit Characteristics
Living room Dining area Bedroom Kitchen Toilet Drying area
Pearson Correlation and Sig.
(1-tailed)
Residential Satisfaction Index (%) 1.000 .286**/.175* .374***/.053 .527***/.180* .362***/.102 .160 .082
Respondents'
Individual and Household
characteristics
#Age51-60 (-.147)
#Above Age 60 (-.028)/.048
#Primary school (-.137)/.083
#Single (-.098)
#Married (-.005)
#SOE .143
#RMB4,000-5,999 (-.023)/(-.005)/
(-.053)
#1stFloor (-.107)/.075 .218*
#6thFloor (-.074) (-.184)* (-.236)*
<=3 years .047
#>5,<=7 years .192*
#>7,<=9 years (-.037)
#By Cycling (-.384)***
#By Driving (-.048)
#By Foot .224*
Note: #dummy variable [#Age (Age21-30 vs. Above Age 60), (Age21-30 vs. Age51-60); #Education attainment (Master and above vs. Primary school); #Marital status (Widowed/Divorced vs. Single); #Marital status (Widowed/Divorced vs. Married); #Monthly
net income of Household (RMB2,000-3,999 vs. RMB4,000-5,999); #Floor level (2ndFloor vs. 1stFloor); #Floor level (2ndFloor vs. 6thFloor); #Length of Residence (>5,<=7years vs. >7,<=9years), (>3,<=5 years vs. >5,<=7 years), (>5, <=7 years vs. <=3 years);
#Main Means of Transportation (By Foot vs. By Driving), (By Driving vs. By Foot), (By Driving vs. By Cycling); #Occupation sector (Government Servant vs. State-owned enterprise (SOE))]
*. Correlation is significant at the 0.05 level (1-tailed). **. Correlation is significant at the 0.01 level (1-tailed). ***. Correlation is significant at the 0.001 level (1-tailed). "(-)" = Negative correlation.
The Normal Colour represents the data of Phase 1; The Colour of Green represents the data of Phase 2; The Colour of Red represents the data of Phase 3.

450
Appendix E, continued
Residential
Satisfaction Index (%)
Housing Unit Characteristics
Living room Dining area Bedroom Kitchen Toilet Drying area
Residential Satisfaction Index (%) 1.000 .286**/.175* .374***/.053 .527***/.180* .362***/.102 .160 .082
Housing Unit
Characteristics
Living room .286**/.175* .664*** .412***
Dining area .374***/.053 .664*** .303** .221*
Bedroom .527***/.180* .412*** .303** .362***/.298**
Kitchen .362***/.102 .221* .362***/.298** .330***
Toilet .160 .297**
Drying area .082 .330*** .297**
Note: *. Correlation is significant at the 0.05 level (1-tailed). **. Correlation is significant at the 0.01 level (1-tailed). ***. Correlation is significant at the 0.001 level (1-tailed).
The Normal Colour represents the data of Phase 1; The Colour of Green represents the data of Phase 2; The Colour of Red represents the data of Phase 3.

451
Appendix E, continued
Residential Satisfaction
Index (%)
Housing Unit Characteristics
Living room Dining area Bedroom Kitchen Toilet Drying area
Pearson Correlation and Sig. (1-tailed)
Residential Satisfaction Index (%) 1.000 .286**/.175* .374***/.053 .527***/.180* .362***/.102 .160 .082
Housing Unit
Supporting Services
Drain .331***/.207*
Electrical &
Telecommunication
wiring .378***/ .279**/.400***
Street Lighting .053/.076/.211*
Staircases .215*
corridor .314**/.374***
Garbage disposal .341***/.326**
Note: *. Correlation is significant at the 0.05 level (1-tailed). **. Correlation is significant at the 0.01 level (1-tailed). ***. Correlation is significant at the 0.001 level (1-tailed).
The Normal Colour represents the data of Phase 1; The Colour of Green represents the data of Phase 2; The Colour of Red represents the data of Phase 3.
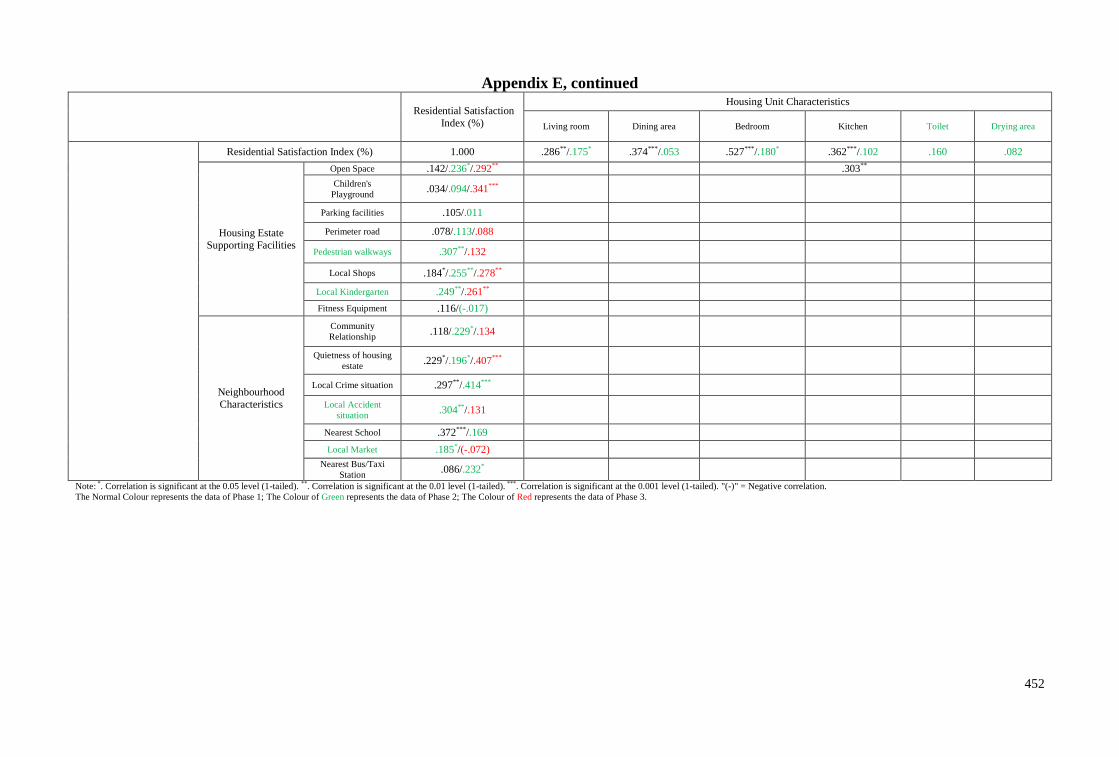
452
Appendix E, continued
Residential Satisfaction
Index (%)
Housing Unit Characteristics
Living room Dining area Bedroom Kitchen Toilet Drying area
Residential Satisfaction Index (%) 1.000 .286**/.175* .374***/.053 .527***/.180* .362***/.102 .160 .082
Housing Estate
Supporting Facilities
Open Space .142/.236*/.292** .303**
Children's
Playground .034/.094/.341***
Parking facilities .105/.011
Perimeter road .078/.113/.088
Pedestrian walkways .307**/.132
Local Shops .184*/.255**/.278**
Local Kindergarten .249**/.261**
Fitness Equipment .116/(-.017)
Neighbourhood
Characteristics
Community
Relationship .118/.229*/.134
Quietness of housing
estate .229*/.196*/.407***
Local Crime situation .297**/.414***
Local Accident
situation .304**/.131
Nearest School .372***/.169
Local Market .185*/(-.072)
Nearest Bus/Taxi
Station .086/.232*
Note: *. Correlation is significant at the 0.05 level (1-tailed). **. Correlation is significant at the 0.01 level (1-tailed). ***. Correlation is significant at the 0.001 level (1-tailed). "(-)" = Negative correlation.
The Normal Colour represents the data of Phase 1; The Colour of Green represents the data of Phase 2; The Colour of Red represents the data of Phase 3.

453
Appendix E, continued
Residential
Satisfaction
Index (%)
Housing Unit Supporting Services Housing Estate Supporting Facilities
Drain
Electrical &
Telecommunicatio
n wiring
Street
Lighting
Stairca
ses Corridor
Garbage
disposal Open Space
Children's
Playground
Parking
facilities
Perimeter
road
Pedestrian
walkways Local Shops
Local
Kindergarte
n
Fitness
Equipm
ent
Pearson
Correlati
on and
Sig. (1-
tailed)
Residential Satisfaction
Index (%) 1.000
.331***/
.207*
.378***/ .279**/
.400***
.053/.076/
.211* .215*
.314**/
.374***
.341***/
.326**
.142/.236*/
.292**
.034/.094/
.341***
.105/
.011
.078/.113/
.088
.307**/
.132
.184*/ .255**/
.278**
.249**/
.261**
.116/
(-.017)
Responde
nts'
Individual
and
Househol
d
characteri
stics
#Age51-
60 -.147
#Above
Age 60 (-.028)/.048
#Primary
school (-.137)/.083 -.239**
#Single (-.098) (-.256)**
#Married (-.005) .240*
#SOE .143
#RMB4,0
00-5,999
(-.023)/
(-.005)/
(-.053)
( -.186)*
#1stFloor (-.107)/.075 (-.272)**
#6thFloor (-.074)
<=3 years .047 (-.211)*
#>5,<=7y
ears .192* (-.285)**
#>7,<=9y
ears (-.037)
#By
Cycling ( -.384)***
#By
Driving (-.048)
#By Foot .224*
Housing
Unit
Charact
eristics
Living
room .286**/.175*
Dining
area .374***/.053
Bedroom .527***/.180*
Kitchen .362***/.102 .303**
Toilet .160
Drying
area .082
Note: #dummy variable [#Age (Age21-30 vs. Above Age 60), (Age21-30 vs. Age51-60); #Education attainment (Master and above vs. Primary school); #Marital status (Widowed/Divorced vs. Single); #Marital status (Widowed/Divorced vs. Married); #Monthly
net income of Household (RMB2,000-3,999 vs. RMB4,000-5,999); #Floor level (2ndFloor vs. 1stFloor); #Floor level (2ndFloor vs. 6thFloor); #Length of Residence (>5,<=7years vs. >7,<=9years), (>3,<=5 years vs. >5,<=7 years), (>5, <=7 years vs. <=3 years); #Main Means of Transportation (By Foot vs. By Driving), (By Driving vs. By Foot), (By Driving vs. By Cycling); #Occupation sector (Government Servant vs. State-owned enterprise (SOE))] *. Correlation is significant at the 0.05 level (1-tailed). **. Correlation is significant at the 0.01 level (1-tailed). ***. Correlation is significant at the 0.001 level (1-tailed). "(-)" = Negative correlation.
The Normal Colour represents the data of Phase 1; The Colour of Green represents the data of Phase 2; The Colour of Red represents the data of Phase 3.

454
Appendix E, continued
Residential
Satisfaction
Index (%)
Housing Unit Supporting Services Housing Estate Supporting Facilities
Drain Electrical &
Telecommunication
wiring
Street
Lighting Staircases
Corrid
or
Garbage
disposal Open Space
Children's
Playground
Parking
facilities
Perimeter
road
Pedestrian
walkways Local
Shops
Local
Kindergarten Fitness
Equipment
Pearson
Correlation
and Sig.
(1-tailed)
Residential Satisfaction
Index (%) 1.000
.331***/
.207*
.378***/.279**/
.400***
.053/.076/
.211* .215*
.314**/
.374***
.341***/
.326**
.142/.236*/
.292**
.034/.094/
.341*** .105/.011
.078/
.113/
.088
.307**/
.132
.184*/
.255**/
.278**
.249**/
.261**
.116/
(-.017)
Housing
Unit
Supporting
Services
Drain .331***/.207* .220*/.692***
Electrical &
Telecommun
ication
wiring
.378***/.279**/
.400***
.220*/
.692*** .243**
Street
Lighting
.053/.076/
.211* .298** (-.236)*/.249** .196* .288**
Staircases .215* .243**
corridor .314**/
.374*** .236*
Garbage
disposal
.341***/
.326** .236* .452***
Housing Estate
Supporting
Facilities
Open Space .142/.236*/
.292** .335*** .232* .357***
Children's
Playground
.034/.094/
.341*** .298** .452*** .335*** .238*
.270**/
.221*
Parking
facilities .105/.011 (-.236)*/.249** .238* .247**
Perimeter
road
.078/.113/ .0
88 .196* .270**/.221* .253** (-.254)**
Pedestrian
walkways .307**/.132 .253** .318***
Local Shops .184*/.255**/
.278** .232*
Local
Kindergarten .249**/.261** .357*** .318***
Fitness
Equipment .116/(-.017) .288** .247** ( -.254)**
Note: *. Correlation is significant at the 0.05 level (1-tailed). **. Correlation is significant at the 0.01 level (1-tailed). ***. Correlation is significant at the 0.001 level (1-tailed). "(-)" = Negative correlation.
The Normal Colour represents the data of Phase 1; The Colour of Green represents the data of Phase 2; The Colour of Red represents the data of Phase 3.
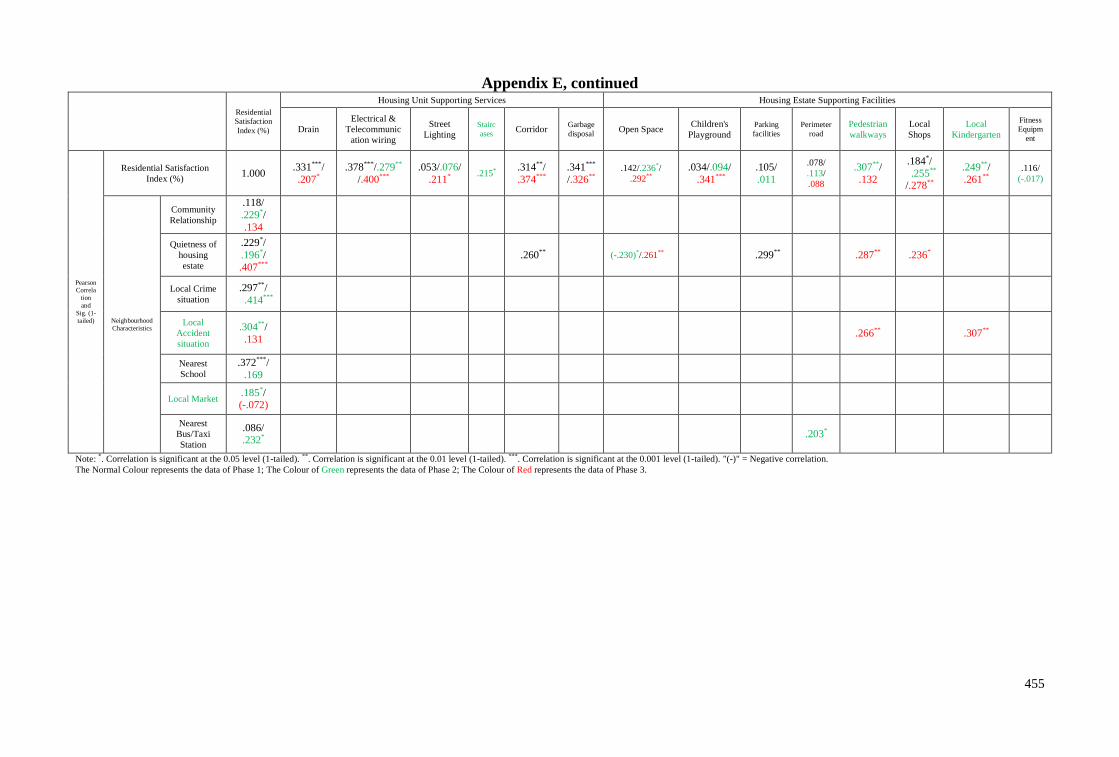
455
Appendix E, continued
Residential
Satisfaction
Index (%)
Housing Unit Supporting Services Housing Estate Supporting Facilities
Drain
Electrical &
Telecommunic
ation wiring
Street
Lighting
Stairc
ases Corridor
Garbage
disposal Open Space
Children's
Playground
Parking
facilities
Perimeter
road
Pedestrian
walkways
Local
Shops
Local
Kindergarten
Fitness
Equipm
ent
Pearson Correla
tion
and
Sig. (1-
tailed)
Residential Satisfaction
Index (%) 1.000
.331***/
.207*
.378***/.279**
/.400***
.053/.076/
.211* .215*
.314**/
.374***
.341***
/.326** .142/.236*/
.292**
.034/.094/
.341***
.105/
.011
.078/
.113/
.088
.307**/
.132
.184*/
.255**
/.278**
.249**/
.261** .116/
(-.017)
Neighbourhood
Characteristics
Community
Relationship
.118/
.229*/
.134
Quietness of
housing
estate
.229*/
.196*/
.407***
.260** (-.230)*/.261** .299** .287** .236*
Local Crime
situation
.297**/
.414***
Local
Accident
situation
.304**/
.131 .266** .307**
Nearest
School
.372***/
.169
Local Market .185*/ (-.072)
Nearest
Bus/Taxi
Station
.086/
.232* .203*
Note: *. Correlation is significant at the 0.05 level (1-tailed). **. Correlation is significant at the 0.01 level (1-tailed). ***. Correlation is significant at the 0.001 level (1-tailed). "(-)" = Negative correlation.
The Normal Colour represents the data of Phase 1; The Colour of Green represents the data of Phase 2; The Colour of Red represents the data of Phase 3.

456
Appendix E, continued
Residential
Satisfaction Index (%)
Neighbourhood Characteristics
Community
Relationship
Quietness of housing
estate Local Crime situation
Local Accident
situation Nearest School Local Market
Nearest Bus/Taxi
Station
Pearson
Correlation and
Sig. (1-tailed)
Residential Satisfaction Index (%) 1.000 .118/.229*/.134 .229*/.196*/.407*** .297**/.414*** .304**/.131 .372***/.169 .185*/(-.072) .086/.232*
Respondents'
Individual and
Household
characteristics
#Age51-60 (-.147) (-.274)** #Above Age 60 (-.028)/.048 #Primary school (-.137)/.083 .297**
#Single (-.098)
#Married (-.005) (-.209)* #SOE .143
#RMB4,000-
5,999
(-.023)/(-.005)/ (-.053)
(-.217)* (-.271)** (-.256)** .219*
#1stFloor (-.107)/.075
#6thFloor (-.074)
<=3 years .047 #>5,<=7 years .192* #>7,<=9years (-.037) .264**
#By Cycling ( -.384)*** #By Driving (-.048) .235*
#By Foot .224* .241**
Housing Unit
Characteristics
Living room .286**/.175*
Dining area .374***/.053
Bedroom .527***/.180*
Kitchen .362***/.102
Toilet .160
Drying area .082
Note: #dummy variable [#Age (Age21-30 vs. Above Age 60), (Age21-30 vs. Age51-60); #Education attainment (Master and above vs. Primary school); #Marital status (Widowed/Divorced vs. Single); #Marital status (Widowed/Divorced vs. Married); #Monthly
net income of Household (RMB2,000-3,999 vs. RMB4,000-5,999); #Floor level (2ndFloor vs. 1stFloor); #Floor level (2ndFloor vs. 6thFloor); #Length of Residence (>5,<=7years vs. >7,<=9years), (>3,<=5 years vs. >5,<=7 years), (>5, <=7 years vs. <=3 years); #Main Means of Transportation (By Foot vs. By Driving), (By Driving vs. By Foot), (By Driving vs. By Cycling); #Occupation sector (Government Servant vs. State-owned enterprise (SOE))] *. Correlation is significant at the 0.05 level (1-tailed). **.
Correlation is significant at the 0.01 level (1-tailed). ***. Correlation is significant at the 0.001 level (1-tailed). "(-)" = Negative correlation.
The Normal Colour represents the data of Phase 1; The Colour of Green represents the data of Phase 2; The Colour of Red represents the data of Phase 3.

457
Appendix E, continued
Residential
Satisfaction Index (%)
Neighbourhood Characteristics
Community
Relationship
Quietness of housing
estate Local Crime situation
Local Accident
situation Nearest School Local Market
Nearest Bus/Taxi
Station
Pearson
Correlation and
Sig. (1-tailed)
Residential Satisfaction Index (%) 1.000 .118/.229*/.134 .229*/.196*/.407*** .297**/.414*** .304**/.131 .372***/.169 .185*/(-.072) .086/.232*
Housing Unit
Supporting
Services
Drain .331***/.207*
Electrical &
Telecommunication
wiring .378***/.279**/.400***
Street Lighting .053/.076/.211*
Staircases .215*
corridor .314**/.374*** .260*
Garbage disposal .341***/.326**
Housing Estate
Supporting
Facilities
Open Space .142/.236*/.292** (-.230)*/ .261**
Children's
Playground .034/.094/.341***
Parking facilities .105/.011 .299**
Perimeter road .078/.113/.088 .203*
Pedestrian walkways .307**/.132 .287** .266**
Local Shops .184*/.255**/.278** .236*
Local Kindergarten .249**/.261** .307**
Fitness Equipment .116/(-.017)
Note: *. Correlation is significant at the 0.05 level (1-tailed). **. Correlation is significant at the 0.01 level (1-tailed). ***. Correlation is significant at the 0.001 level (1-tailed). "(-)" = Negative correlation.
The Normal Colour represents the data of Phase 1; The Colour of Green represents the data of Phase 2; The Colour of Red represents the data of Phase 3.

458
Appendix E, continued
Residential
Satisfaction Index
(%)
Neighbourhood Characteristics
Community
Relationship
Quietness of housing
estate Local Crime situation
Local Accident
situation Nearest School Local Market
Nearest Bus/Taxi
Station
Pearson
Correlation and
Sig. (1-tailed)
Residential Satisfaction Index
(%) 1.000 .118/.229*/.134 .229*/.196*/.407*** .297**/.414*** .304**/.131 .372***/.169 .185*/(-.072) .086/.232*
Neighbourhood
Characteristics
Community
Relationship .118/.229*/.134 .230* .228*
Quietness of
housing estate .229*/.196*/.407*** .437***
Local Crime
situation .297**/.414*** .437*** .367***
Local Accident
situation .304**/.131 .230* .367***
Nearest School .372***/.169
Local Market .185*/(-.072) .228*
Nearest
Bus/Taxi
Station .086/.232*
Note: *. Correlation is significant at the 0.05 level (1-tailed). **. Correlation is significant at the 0.01 level (1-tailed). ***. Correlation is significant at the 0.001 level (1-tailed). "(-)" = Negative correlation.
The Normal Colour represents the data of Phase 1; The Colour of Green represents the data of Phase 2; The Colour of Red represents the data of Phase 3.

459
Appendix F
Paper Presented at Conference
Neighbourhood Cohesion of Medium-Low Cost Commodity Housing in
Bandar Sunway, Selangor, Malaysia: A Case Study of Mentari Court
Apartment
Xi Wenjia1,2
, Noor Rosly Hanif1,2
Abstract
Neighbourhood cohesion plays a crucial role for maintaining the
stability and harmony of community. Thus, the aim of this quantitative
research is to determine the relationship between the individual
socioeconomic characteristics and neighbourhood cohesion in medium-low
cost commodity housing. A total of 470 residents who live in Mentari Court
apartment, Bandar Sunway, Selangor, Malaysia are randomly selected in the
research for data. We use Buckner’s Neighbourhood Cohesion Index to
measure neighbourhood cohesion. The Categorical Multiple Regression is
carried out in this research to analyse the collected data. The results showed
that household ownership, ethnic group, and age significantly influence
neighbourhood cohesion in medium-low cost commodity housing. Thus we
suggest that management of medium-low cost commodity housing apartment
should understand the elements that can affect the neighbourhood cohesion,
and invite house owners and old people to participate in the management in
order to establish a well-organized and harmonious, which will strengthen
the neighbourhood cohesion.
Key words: Neighbourhood cohesion, Socioeconomic characteristics,
Categorical multiple regression, Mentari Court apartment, Malaysia
1 Department of Estate Management, Faculty of Built Environment, University of Malaya, Kuala Lumpur, Malaysia 2 Corresponding authors: [email protected], [email protected]