Embed Size (px)
Citation preview

Bukedea district Hazard, risk and VulneraBility Profile | a
TESOBukEdEa district
June 2014ProfileHazard, risk and Vulnerability
The Republic of uganda

B | Bukedea district Hazard, risk and VulneraBility Profile
With support from:United Nations Development ProgrammePlot 11, Yusuf Lule RoadP.O. Box 7184Kampala, UgandaFor more information: www.undp.org

Bukedea district Hazard, risk and VulneraBility Profile | i
Contents
Acronyms ................................................................................................................... iii
Acknowledgements .................................................................................................... iv
ExECutivE Summary .............................................................................................1
introduCtion .........................................................................................................2
Objectives ...................................................................................................................2
Methodology ................................................................................................................2
Brief overview of the district ........................................................................................5
Location .......................................................................................................................5
Historical background and administrative set up .......................................................6
Climate and vegetation ...............................................................................................6
Topography .................................................................................................................6
Wet lands .....................................................................................................................7
HazardS ................................................................................................................. 11
riSkS ........................................................................................................................15
vulnErability ......................................................................................................28
ConCluSionS ........................................................................................................30
dEfinition of tErmS ...........................................................................................31

ii | Bukedea district Hazard, risk and VulneraBility Profile
figure
Figure 1 Bukedea district population trends ...............................................................8
maps
Figure 2 Bukedea district flood risk map ..................................................................15
Figure 3 Bukedea district hailstorm and lightning risk map ......................................17
Figure 4 Bukedea drought risk map ..........................................................................18
Figure 5 Bukedea district crop and animal disease risk map ...................................20
Figure 6 Bukedea district land conflict risk map .......................................................22
Figure 7 Bukedea district environmental degradation risk map ...............................23
Figure 8 Vermin risk map ...........................................................................................25
Figure 9 Bukedea district road accident risk map ....................................................26
Figure 10 Bukedea district bush fire risk map ..........................................................27
Figure 11 Bukedea district risk exposure and vulnerability map ..............................29
tables
Table 1 Gender composition of the population from 2008-2012 .................................8
Table 2 Sub-county populations at 2002 census .......................................................8
Table 3 Literacy and illiteracy levels by 2002 for 10+ years .......................................9
Table 4 Natural resource conflicts in bukedea district ..............................................10
Table 5 Hazard summary ..........................................................................................11
Table 6 Hazard .........................................................................................................12
Table 7 Risk vulnerability ...........................................................................................28

Bukedea district Hazard, risk and VulneraBility Profile | iii
acronyms
BBW Banana bacterial wiltCBSD Cassava brown streak diseaseCFR Central Forest ReservesDDMC District Disaster Management CommitteeFIEFOC Farm Income Enhancement and Forest Conservation ProjectFMD Foot and mouth diseaseGIS Geographical Information SystemsGPS Global Positioning SystemHCII Health Centre IILFR Local Forest ReservesMLND Maize lethal necrotic diseaseMS MicrosoftNAADS National Agriculture Advisory ServicesNGO Non-Governmental OrganizationOPM Office of the Prime MinisterTC Town CouncilUBOS Uganda Bureau of StatisticsUNDP United Nations Development Programme

iV | Bukedea district Hazard, risk and VulneraBility Profile
acknowledgements
On behalf of the Office of the Prime Minister, I wish to express sincere gratitude to all of the
key stakeholders who provided their valuable inputs and support to this hazard, risk and
vulnerability mapping exercise that led to the production of comprehensive district hazard,
risk and vulnerability profiles for the Teso sub-region.
I especially extend my appreciation to the Department of Disaster Preparedness and
Management in the Office of the Prime Minister, under the leadership of the Acting
Commissioner, Ms. Rose Nakabugo and the Assistant Commissioner, Mr. Gerald Menyha,
for the oversight and management of the entire exercise. My appreciation also goes to the
District Disaster Management Committees and the entire body of stakeholders who in one
way or another yielded valuable ideas, resources and time to support the completion of this
exercise.
Our gratitude goes also to the UNDP for providing funds to support this initiative and to the
UNDP/OPM Team comprised of Mr. Jose Neil A. C. Manzano, Disaster Risk Management
Advisor; Mr. Gilbert Anguyo, Disaster Risk Reduction Analyst; and Mr. Sidney Tupper, Climate
Risk Management Specialist, for providing valuable technical support in the organization of
the exercise, review of maps and findings, and editing of the profiles.
Finally, the field team led by Mr. Solomon Elungat, Senior Disaster Management Officer
and supported by Mr. Moses Banduga, GIS Expert, and Mr. Samuel Lwetutte and
Mr. Franco Ojok, GIS Specialists, who painstakingly traversed the sub-region gathering
local knowledge, mapping hazards and compiling these documents, deserves our thanks.
Hon. Hilary o. onek
Minister for Relief, Disaster Preparedness and Management

Bukedea district Hazard, risk and VulneraBility Profile | 1
ExEcutivE SummaryThis Bukedea District Hazard, Risk and Vulnerability Profile integrates scientific information
provided by agencies at national and district levels, and local knowledge provided by
communities on the district base map. This will contribute to a Ugandan atlas of disaster risks
and vulnerabilities to support planning and decision-making processes for management of
disaster risk in the District.
The district lies approximately between latitude 1°10’N and 1°35’N and longitude 33°30’E
and 34°20’E. The district covers a total area of 1,049.34 km2, of which 1,035.84 km2 are dry
land and 13.5 km2 are mainly swamps and wetlands.
this hazard, risk and vulnerability profile was produced using a four-phased approach:
Phase I Preliminary activitiesPhase II Field data collection, mapping, verification and ground truthing Phase III Participatory data analysis, mapping and report writingPhase IV Refinement, validation and final map production/reporting
The report characterizes the district in terms of location, geography, climate, administrative
arrangements, natural resources, gender demographics by sub-county, livelihoods,
agricultural production, poverty and environmental degradation.
It also ranks endemic hazards in the district in terms of magnitude and frequency: floods,
heavy storms and hail, drought and food insecurity, crop and animal disease, land conflict,
environmental degradation, vermin, road accidents and bush fires.
The discussion of the nature of each hazard and its geographic extent in terms of sub-
counties provides a qualitative assessment of the situations that the communities face.
Maps corresponding to each hazard show the areas where the hazard is significant, and
also hotspots as points of incidence of the hazard.
Kolir and Malera sub-counties experience the highest levels of flood hazard while Kodongole
has low flooding incidence and Bukedea Town Council does not experience severe floods.
Land conflicts stand out prominently in nearly all sub-counties in the district, particularly in
Bukedea Town Council.
Environmental degradation is high in Kachumbala and Kidongole, as are road accidents in
Kachumbala, Bukedea and Bukedea Town Council along the Mbale – Soroti highway.
All sub-counties register at least six of the nine hazards, making them prone to disasters of
aggregated hazards. Kachumbala and Bukedea are the most vulnerable, with more high
severity hazards than the other sub-counties.

2 | Bukedea district Hazard, risk and VulneraBility Profile
introductionBukedea District is located in the Teso Sub-region, 285 km from the capital city (Kampala).
The district and the sub-region as a whole have suffered from various disaster-related
challenges that have affected progress in development. The sub-region suffered from cattle
rustling and insurgency from 1985 to 1993. Food insecurity followed in 1992-94, worsened
by an outbreak of the cassava mosaic viral disease. The disease led to the extinction of
cassava varieties grown up to that time. In 2007 the entire sub-region experienced floods
that destroyed lives and property. In 2009 the region was again affected by drought that
destroyed 65 % of the crops planted.
Like other districts in the sub-region, Bukedea is prone to a range of hazards and associated
disasters including floods, crop and animal epidemic, severe hails storms, land conflicts,
pest infestation, environmental degradation, road related accidents, extended drought and
food insecurity.
This multi-hazard hazard mapping profiles district disaster risks and vulnerabilities. It is
a guide to aid decision making, development planning and design of interventions, to
minimize loss of economic resources, infrastructure, physical assets, human resources and
environmental capital, and to reduce the population’s vulnerability to disaster.
objectives
The objective of the hazard, risk, and vulnerability mapping is to produce a District Profile
that will aid planning and decision-making processes which address disaster risks and
reduce the vulnerability of households and communities in Bukedea District.
methodology
The multi-hazard, risk and vulnerability mapping approach employed a people-centered,
multi-sectoral, and multi-stakeholder approach. A mapping team led by the Office of the
Prime Minister (OPM) and involving representatives from UNDP and district sector offices
deployed on a field mission to Teso sub-region to capture the required information and
produce the district profile.
The team employed a variety of data-collection methods including use of a mix-scale
approach involving the integration of primary and secondary data. Secondary data were
acquired through government sources (relevant ministries, departments and agencies, and
the districts in Teso sub-region) and data bases from other organizations/NGOs operating
in these districts. The raw spatial data and satellite images were assembled from relevant
sources and analysed with descriptive statistics and remote sensing technology.

Bukedea district Hazard, risk and VulneraBility Profile | 3
the mapping exercise involved four critical phases as follows:
Phase I Preliminary activitiesPhase II Field data collection, mapping, verification and ground truthing Phase III Participatory data analysis, mapping and report writingPhase IV Refinement, validation and final map production/reporting
Phase i: Preliminary activities
In this phase the mapping team undertook a series of planning and programming activities
before start of field activity including holding meetings with relevant teams, mobilizing
required resources, acquiring required equipment and materials, review of relevant literature,
establishing relevant contacts and developing a checklist of activities to be undertaken in
Phase Two.
The main objectives of Phase One were to prepare and undertake preliminary assessment
of the quality and nature of the resources/materials, develop a quick understanding within
the mapping team and other actors of the task of the multi-hazard, risk, and vulnerability
mapping before any detailed physical field work was undertaken. This phase enabled the
scoping and design of specific content and legends for the thematic maps.
The phase was also useful for preparing the resource deployment plan, and outlining
procedure and field work plans, etc. It articulated, among other issues, the utilization of
various stakeholders to ensure maximum participation in locating disaster prone locations
and any other information relevant to the mapping exercise.
Phase ii: field data Collection and mapping
Stakeholder mapping and local meetings. A preliminary field meeting was held in each
district to capture key local issues related to disaster incidence and trends. The meetings
gave opportunities for the mapping team and stakeholders to identify other key resource
persons and support staff from within the local community for consultation.
Stakeholder Participation Practices. Stakeholder participation was a key component
of the mapping exercise. The team conducted consultations with district technical sector
heads under the overall purview of the District Disaster Management Committee (DDMC)
involved in the ground truthing exercises to ensure district leadership and ownership of the
data and results. During exit meetings, stakeholders, particularly those at district level, were
given the opportunity to validate, update and also contribute any other relevant information
vital to the mapping process.
Capture of spatial data. Spatial data were captured and complemented by base maps
prepared at appropriate scales. The base maps contained relevant data including location
of existing social-infrastructure and services, district area boundaries, environmental

4 | Bukedea district Hazard, risk and VulneraBility Profile
elements, forest areas, utilities like roads, drainage and river course, contours and flood
prone settlements.
Secondary data or desktop research. A desk review of relevant documents at the district
and other umbrella organizations, including policy and legal documents, previous maps/
report and studies, was conducted. A checklist summarized the required information
according to the multi-disaster risk indicators being studied/mapped. Data from documents
were analysed using various methods including content analysis.
Critical observation and ground truthing. This approach was used to critically assess
the conditions, nature and location of disaster prone zones, “current human activity” and
settlement patterns along disaster prone areas. Critical observation and ground truthing
included inspection and observation of social infrastructure, major household economic
activities being practiced, natural drainage lines, rivers etc. Non-mappable and non-
physical situations were captured through remote sensing (e.g. satellite images) and
physical observation.
main instruments of data collection. The main instruments used for data collection were
manuals of instructions (guides to mapping assistants), use of key informant guides and
notebooks, high resolution GPS receivers, digital camera for taking critical photographs,
high resolution satellite images and base maps/topographic sheets of the mapping areas.
Exit/feedback meetings with stakeholders. After field activities and data collection,
feedback and exit meetings with stakeholders were carried out in the district. These meetings
provided additional information regarding the disaster mapping exercise, validated the
data generated, and provided clarity on the expected outputs and the way forward into the
next phase.
Phase iii: data analysis and verification
analysis of collected data. The mapping team and district government officials analyzed
the collected data, and developed thematic disaster maps by integrating features generated
from GPS data with base maps and high resolution satellite images. The main activities at
this phase included:
• Data entry, cleaning and coding
• Preparation of base maps and process maps
• Preparation of disaster risk and vulnerability maps
Bukedea district Hazard, risk and VulneraBility Profile | 5
methods used for data analysis. Data analysis methods used are the following:
• Geo-processing, data transformation and geo-referencing
• Discussions/FGDs
• Drafting, digitizing and GIS Overlays
• Compiling of different data and information
data editing, coding and cleaning. Data entry clerks, data editors and coders digitized,
edited, coded and cleaned data collected using the various tools mentioned above. Both
qualitative and quantitative data obtained from the field were entered via a data entry
interface customized to the layout of the field data forms. Data coding and analysis started
immediately the data was available. Arrangements were made in the field to handle manual
editing and coding as and when data was received from the field crew. Furthermore, data
entry, verification, screen editing and system development followed sequentially to enable
the preparation of draft maps.
data analysis package. The mapping team analysed acquired data using MS Word and MS
Excel for Windows, and spatial data using ArcGIS 10 software and mobile GIS applications.
They performed rapid and systematic GIS overlays to generate base maps and risk and
vulnerability maps.
descriptive statistics. The mapping team investigated trends per given indicator using
tables, graphs, charts and frequencies. As processing of data developed, they merged
it for cross tabulation and eventual production of thematic maps for the various types of
hazards.
Generation and appraisal of draft maps: Prioritization set by the districts determined the
various hazards presented on the thematic maps. The team convened a field workshop
to present, appraise and validate the risk and vulnerability maps with respect to their
accuracy and completeness. Information gaps were identified and filled in the final risk
and vulnerability maps.
Phase iv: refinement, validation and reporting
A final workshop was conducted by the OPM to facilitate validation and dissemination of
the district hazard, risk, and vulnerability profile to relevant partners.
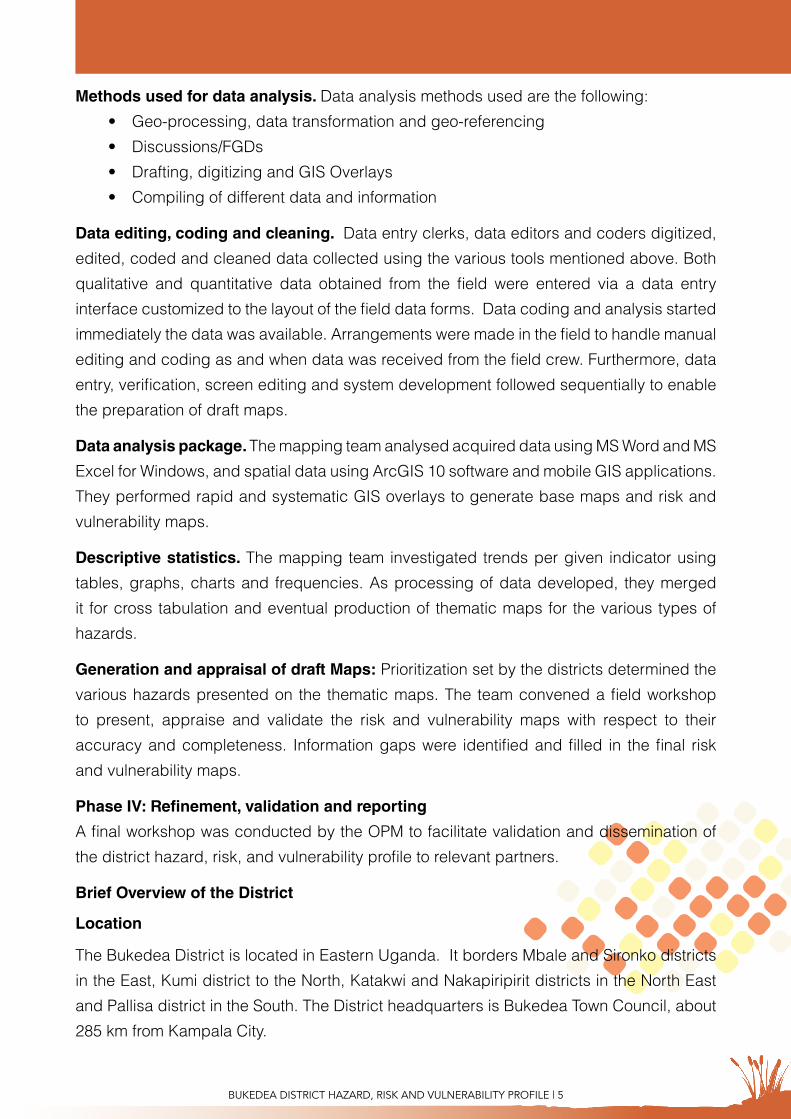
brief overview of the district
location
The Bukedea District is located in Eastern Uganda. It borders Mbale and Sironko districts
in the East, Kumi district to the North, Katakwi and Nakapiripirit districts in the North East
and Pallisa district in the South. The District headquarters is Bukedea Town Council, about
285 km from Kampala City.

6 | Bukedea district Hazard, risk and VulneraBility Profile
The district lies approximately between latitude 1°10’N and 1°35’N and longitude 33°30’E
and 34°20’E. The district covers a total area of 1,049.34 km2, of which 1,035.84 km2 are dry
land and 13.5 km2 are mainly swamps and wetlands.
Historical background and administrative set up
• Bukedea District is seven years old.
• Gazetted to a district status on 13th July 2006, took effect 1st July, 2006.
• Removed from Kumi District.
• One county, with five sub-counties and one Town Council.
Sources of revenue
Bukedea district’s main sources of funding so far are Central Government conditional and
unconditional transfers (99%), and revenue locally generated through taxes, rents, rates,
fees, etc. (1%). No donors have so far committed to fund any district programmes and
projects, although the district has a number of proposed programmes and projects in
various sectors.
Climate and vegetation
The district has a modified equatorial climate with heavy rainfall and high temperatures.
The rainfall pattern is characteristically bi-modal with peaks in April-May and July-August.
The rest of the months are relatively dry and hot. The annual mean temperature is 24°C.
The vegetation is generally savannah. There are woodlands at Malera, Kolir and Bukedea
Sub-Counties, as well as forest plantations and reserves.
topography
Bukedea District is in the plains of Teso sub-region, i.e., generally flat with few undulations,
and pierced by isolated inselbergs, the most pronounced being Bukedea (Kocheka) and
Kachumbala (Kongunga, Kongoidi, Komuge, Amus, Otimonga, Moru-Ateko, Kotia-Aligoi
and Kongatuny). Inselburgs are a good resource for stone mining for the construction
industry, are an African Monkey habitat and have caves which are attractive to tourists.
They modify the micro-climate and contribute to soils fertility due to their volcanic origins.
natural resources and utilisation
Bukedea District experiences environmental degradation, especially in wetlands, forests
and range lands. Depending on location, various factors contribute to this continuous
degradation. The population increase in the sub-counties of Kachumbala, Kidongole, and
Bukedea forces unsustainable demands on ecological services. Kolir and Malera sub-
counties presently have good biomass cover but face the threat of over-grazing which will
become problematic if not immediately checked.

Bukedea district Hazard, risk and VulneraBility Profile | 7
Wet lands
Rice growers have encroached on the Bukedea district wetlands, with the most severely
affected in parts of Kidongole, Bukedea and Kachumbala sub-counties.
The main human activities that have degraded wetlands include cultivation and to a
moderate extent brick making. The major crops in the wetlands are rice, sugarcane, millet,
sorghum, maize and vegetables, all cultivated during the dry season. Rice and sugarcane
grow in or near the core central portions of the wetlands while the other cereals are mostly
cultivated at the wetland edges. The overall impact is high soil turnover and mixing and
these contribute greatly to wetland siltation and drying, with consequent biodiversity
reduction and habitat destruction increasing over time.
forestry
The forest cover of the district is generally low due to population pressures and increasing
demand for forest products within the district. There are two types of forest reserves;
a) Forest on protected areas central forest reserve (CFR) or local forest reserves (LFR)
b) Forest on public, private land and riverine forest.
There are two LFRs in Kachumbala (26 Ha) and Malera ( Koreng 76 Ha) and one CFR
located in Bukedea town council (16 Ha). The district has a number of private and
community forests but most are poorly managed because plantation owners are generally
ignorant of silviculture practice. Privatization of forest reserves and afforestation have been
encouraged but have not yielded the expected results as the communities around the
forests still burn or cut down trees illegally.
Other than the above protected forests, the district has privately owned forests in farm lands
or communal lands which the community exploits unsustainably for firewood, charcoal and
brick burning. Wild fires are also a problem. There is therefore a need to train communities
on development of woodlots, use of energy saving stoves, nursery practices and storage
of fuel wood as a strategy to eliminate degradation of the existing natural and artificial
plantations. Such an initiative would promote community-owned woodlots maintained at
the household level.
Bukedea is one of the districts benefiting from the Farm Income Enhancement and Forestry
Conservation project (FIEFOC) forestry component. The project has two sub-components:
watershed management and tree planting. It provides the planting materials which most of
the farmers were lacking. Awareness-building by the project has led to increasing numbers
of people requesting tree planting support. Many farmers have developed big plantations,
for example, in Kolir and Kidongole, through their own initiatives. With sustained support by
the project, significant increases in tree cover may be expected during the next five years.

8 | Bukedea district Hazard, risk and VulneraBility Profile
Population
The population projections shown in Table 2 for the district are based on the 2002 Census.
table 1 Gender composition of the population from 2008-2012 2008 2009 2010 2011 2012Male 75,100 77,000 82,300 86,100 90,100Female 81,900 83,900 88,700 92,400 96,300Total 157,000 160,900 171,000 178,500 186,400
Source: UBOS
Population growth
The Population and Housing Census of 2002 revealed a total population of 122,433 persons,
a 4.2% increase since the previous census in 1991. The sub-counties of Kachumbala,
Kidongole and Bukedea have a high growth rate with changing demographics featuring
lower average age and consequent skewing of social service provision in favour of children.
table 2 Sub-county populations at 2002 census
Sub-county PopulationKachumbala 36366Malera 26669Bukedea 25456Kidongole 16971Kolir 16971Total 122433
Population density
The population density of Bukedea District has risen sharply from 117 people per km2 in
2002 to 173 people per km2 in 2011, leading to a steep fall in farm holding and increased
vulnerability of the farming population. Figure 1 shows the Bukedea population trends.
Increasing population density affects the district negatively in many aspects; among them,
land disputes and farm size reduction reduce agricultural productivity. Remedial options
include adoption of new technologies for higher cultivation yields, and improved educational
opportunities for girls.
figure 1 bukedea district population trends

Bukedea district Hazard, risk and VulneraBility Profile | 9
the Economy
The climate and vegetation has had a direct bearing on the economic activities of the
majority of the population. Agriculture forms a base of the mainstream economic life of the
people. Over 84% of the households are engaged in agriculture, though mainly practicing
subsistence farming this is according to various reports. There is limited application of
modern techniques of production this leaves farmers operating below their potential.
Besides crop farming is animal rearing of mainly local zebu cattle, goats, sheep, pigs and
poultry.
Poverty trends
Bukedea District is not exceptional in terms of poverty, with 54% of the population in absolute
poverty, and 20% malnourished.
Gender
Hazards affect the roles of both men and women differently. For grazing, men are greatly
affected in terms of pastures and water for livestock. Women are affected in their roles to
collect water and cooking fuel, take children to health units and other activities such as
threshing and drying of produce. Concerned with household food security, they suffer most
in times of drought and food insecurity.
Table 4 shows the stark disparity between male and female literacy. Improved literacy in
both genders, but particularly female, could lead to more livelihood options and consequent
poverty reduction.
table 3 literacy and illiteracy levels by 2002 for 10+ years
Literacy/ illiteracy Male total % Female total % Overall total % Literacy 22,759 69 19,687 28 22,226 57.6Illiteracy 11,050 31 21,606 52 32,656 22.2
land Conflict
Population pressure on arable land has pushed people to the wetlands, with continued
upland loss of soil fertility, resulting in failure to sustainably meet household requirements
and increasing resource conflicts between users as seen in Table 1.

10 | Bukedea district Hazard, risk and VulneraBility Profile
table 4 natural resource conflicts in bukedea district
Nature of Conflict Resource of conflict Level of conflict Area of Occurrence
Water collectors vs cattle keepers water very high All sub-counties
Cattle keepers vs builders grass high Malera ,kolir
Charcoal burners vs brick makers fuel wood high All sub-counties
Sand miners vs culti-vators land moderate Kidongole, Bukedea,
kachumbala
Brick makers vs devel-opers land moderate Town council

Bukedea district Hazard, risk and VulneraBility Profile | 11
Table 5 shows the hazards endemic in each sub-county and indicates the possibility of
aggregate disaster.
table 5 Hazard summary
Sub-county
Floo
ds
Cro
p an
d a
nim
al d
isea
se
Land
con
flict
Bus
h fir
es
Hai
lsto
rms
and
ligh
tnin
g
Envi
ronm
enta
l deg
rada
tion
Dro
ught
/ fo
od in
secu
rity
Verm
in
Roa
d ac
cide
nts
Malera
Kolir
Kachumbala
Kidongole
Bukedea
Bukedea TC
Total 5 6 6 2 6 6 6 5 3
HaZardS

12 | Bukedea district Hazard, risk and VulneraBility Profile
Table 6 discusses the nature of the hazards experienced by communities in Bukedea
District and links each hazard to a risk map which shows the extent of the hazard on a
base map with respect to geographic features and infrastructure. It ranks the hazards by
decreasing risk, as perceived by the communities.
table 6 Hazard
Hazard Status Sub-Counties Rank
Floods
See Figure 2
Increasing flooding from 2007 to date relate to increases in malaria, typhoid, cholera, domestic water contamination, destruction of crops and livestock destruction, destruction of infrastructure (e.g., Tajar Primary school, Busano HCII, Busano Primary school, Okula Primary school, among others). Difficulty in construction works in the district as was experienced at Tajar Primary school, Kamutur tajar road development. Poor access to community services as bridges are destroyed (e.g. to Tajar P/S).
The main sub-counties affected are Malera and Kolir. Bukedea, Kachumbala, Kidongole sub-counties equally suffer from floods.
1
Severe storms and hail
See Figure 3
Wind, hail and electrical storms affects most parts of the district, causing destruction of property and to some extent loss of life. Reported instances include Kangole primary school roof was blown off due to heavy storms that also destroyed property at Katekwan village in 2010. Storms usually affect cultivation yields, livestock life and household incomes. Storms mainly occur at the beginning of the rainy seasons.
District wide 2
Drought and food insecurity
See Figure 4
Drought has afflicted in all the sub-counties for the last several years, leading to inadequate food at household level.
Particularly in 2009, a total of 14,182 households (70,911 people) were without food and in dire need of help. Droughts often destroy crops and animals.
District wide 3

Bukedea district Hazard, risk and VulneraBility Profile | 13
Hazard Status Sub-Counties Rank
Crop and animal disease
See Figure 5
Crop and livestock pests and diseases have increased significantly in the district. Pests that devastate households include the army worm and fruit flies. Crop diseases include BBW, MLND, CBSD (has greatly affected most grown cassava varieties), Fruit and leaf spots, FMD that resulted into quarantine in 2012 (this being the worst).
These diseases and pests cut across all sub-counties and have a potential to reach disaster levels
4
Land Conflict
See Figure 6
Incidences of land conflicts are both in urban and rural settings. These range from ownership, boundary to user rights. The conflicts exist between households, clans, institutions and communities, and between individuals. The land cases form about 90% of the court cases reported in the district. However the time taken by courts to judge land cases remains wanting as some take over 10 years hence resulting into a number of deaths through poisoning and murder especially in Malera Sub-County. Institutions like churches, schools, government are losing land.
District wide and hot spot recorded in Malera Sub-County
5
Environmental Degradation
See Figure 7
Deforestation, wetland degradation, poor farming practices and loss of soil fertility are serious problems in the district.Population increase is attributed as the major factor which has pushed people to carry out degrading activities while striving to meet their needs. The lack of a waste disposal site in town council greatly contributes to the poor environment.Brick making, charcoal burning, sand mining, indiscriminate tree cutting, uncontrolled bush burning in the sub-counties of Malera and Kolir, and poor farming practices by farmers in all the sub-counties in spite the existence of NAADS programme, contribute to loss of biodiversity.
Kachumbala, Kidongole and Bukedea, Malera and Kolir sub-counties.
6

14 | Bukedea district Hazard, risk and VulneraBility Profile
Hazard Status Sub-Counties Rank
Vermin
See Figure 8
The district experiences incidences of vermin, mainly mole rats and monkeys, which affect crops such as sweet potato, cassava, maize, fruits and groundnuts.
Mainly a problem in Kachumbala, Kidongole and Bukedea sub-counties, with a few cases in Kolir and Malera
7
Road accidents
See Figure 9
The district often experiences road accidents include overturning of fuel tankers causing oil spillages on roads sides, loss of lives and property. This is often caused by speeding, lack of speed control humps at critical points, ill-maintained roads, and inadequate road signage.
Bukedea Town Council
8
Bush fire
See Figure 10
Households tend to use burning as a way to clear farm fields, rejuvenate pal-atable pastures and discourage preda-tors. These fires can get out of control resulting in crop destruction, biodiver-sity loss, destruction of property, loss of soil nutrients and loss of carbon sequestration capacity. For example, in Kolir, over 15 acres of pine plantation was lost to fire by a farmer.
Kolir and Malera sub-counties
9

Bukedea district Hazard, risk and VulneraBility Profile | 15
flood risk
figure 2 bukedea district flood risk map
riSKS
16 | Bukedea district Hazard, risk and VulneraBility Profile
Floods have become almost annual events during the wet season, affecting farmers
especially those in the valleys and wetland areas. Adjacent to wetlands, the sub-counties
worst affected are Malera and Kolir, all reporting high risk. Risk hot spot parishes are
Kochot, Aminit, Apopong, Kolir and Komongomesi in Koliri Sub-County and Kangole,
kakori, Kachede, Koreng, Kotiokot, Kotide and Kobaale parishes in Malera Sub-County
respectively. The impacts of floods are felt especially when roads are submerged and
bridges washed away. Floods also destroy crops, kill livestock and damage property.

Bukedea district Hazard, risk and VulneraBility Profile | 17
Hailstorm and lightning risk
figure 3 bukedea district hailstorm and lightning risk map
Storms with high winds, lightning and hailstorms throughout the district affect crop yields
and can cause loss of life. Fortunately, severity is low district wide. Never the less, risk hot
spots are variously distributed in the district devastating lives and property.

18 | Bukedea district Hazard, risk and VulneraBility Profile
drought risk map
figure 4 bukedea drought risk map

Bukedea district Hazard, risk and VulneraBility Profile | 19
Drought and food insecurity are widespread throughout the entire district mainly during
the dry season. Prolonged dry spells result in loss of human and livestock life, increased
rural-urban migration, family breakdown, outward migration to neighbouring districts, early
marriages of children between 12-18 years in exchange for food, and women and elderly
exchanging labour for food and basic needs.
Water for livestock is generally inadequate throughout the year because of intensive wetland
cultivation and drought in the sub-counties of Malera and Kolir. Watering points for livestock
(cattle) used to be the swamps, which are now for rice cultivation. Watering cattle just once
a day contributes to low productivity. There is one valley dam in Malera bordering Ongino
called Odouno; others are Kakere dam and Akero dam, and need to be desilted.
Pastures are of poor quality and quantity. Grazing land is scarce during the first rain season
when most fields are starting cultivation, especially in the sub-counties of Kachumbala and
Kidongole. The animals are grazed along the roadside. Farmers in Kachumbala have been
taking their animals for pasture to the neighbouring sub-county of Kolir during this season.
Generally, combinations of drought, soil degradation, pests and diseases have been the
major causes of food shortages in the district.
All sub-counties in the entire district reported a medium risk of drought and have suffered
particularly in the past two years, resulting in food insecurity affecting more than 71,000
persons.

20 | Bukedea district Hazard, risk and VulneraBility Profile
Crop and animal disease risk
figure 5 bukedea district crop and animal disease risk map

Bukedea district Hazard, risk and VulneraBility Profile | 21
Crop and animal diseases affect the entire district, with potential to reach disaster levels.
Since crops and animals are important elements of diet and livelihoods, these hazards have
significant impacts on food security and economic security. In recent times crops have
been infested by various crop pest and diseases including army worms, horny worms,
meal bugs, stalk borers aphids, leaf minors and viruses like cassava mosaic, cassava
brown streak disease and groundnuts rosette.
The prevalent diseases are tick-borne taking a toll on cattle, especially calves. Six cattle
dips were constructed from 1998 – 2000 and each of the sub-counties has at least one
cattle dip. Malera Sub-County has 2 cattle dips. None of the dips is functional and very
few farmers spray their animals.
Worms and clostridia infections are a problem in small livestock rearing and vaccinations
against previously neglected diseases like CCPP and PPR have been conducted in the
sub-counties of Kolir and Malera. In pigs, worms and African swine fever are a hindrance.
Newcastle disease, fowl pox and infectious rural hepatitis are major challenges in poultry
production.
Risk hot spots are distributed all over the district including Malera, Kamutur, Kachumbala,
Kidongole sub-counties, Bukedea Town Council, and Aminit, Kolir, Agule, Kochus,
Komongomeri parishes.

22 | Bukedea district Hazard, risk and VulneraBility Profile
land conflict risk
figure 6 bukedea district land conflict risk map
Land disputes occur throughout the district. The slow rate of resolution due to land court
inefficiency sometimes results in violence and murder. The hotspot in Bukedea Town
Council reflects the higher population density and land prices in the urbanized area. Land
disputes within wetlands have also increased over the years, fuelled by encroachment and
wetland reclamation by households.

Bukedea district Hazard, risk and VulneraBility Profile | 23
Environmental degradation risk
figure 7 bukedea district environmental degradation risk map

24 | Bukedea district Hazard, risk and VulneraBility Profile
The district suffers from severe environmental degradation. Most wetlands have been
destroyed due to paddy rice growing resulting in some of them completely drying up.
In some sub-counties like Kakomongole and Kacumbala, the wetlands have been over
cultivated leaving no area for cattle grazing or access to water for humans or animals.
Deforestation, wetland degradation, bush burning and loss of soil fertility are also serious
problems in Kachumbala, Kidongole and Bukedea.
There are two local forest reserves (LFRs) in Kachumbala (26 Ha) and Malera (Koreng 76
Ha) and one central forest reserve (CFR) 16 Ha located in Bukedea Town Council. However,
the forest cover of the district is diminishing, mainly due to unsustainable utilisation activities
within the district and the neighbourhood.
Risk levels are high in Kachumbala, Kidongole and Bukedea sub-counties. Unsustainable
exploitation of ecosystem services in Malera and Kolir sub-counties is causing biodiversity
loss.

Bukedea district Hazard, risk and VulneraBility Profile | 25
vermin risk
figure 8 vermin risk map
Vermin and problem animals affect the people of Bukedea, especially mole rats and monkeys,
which ravage sweet potato, cassava, maize, fruit and groundnut crops. These are the main
problem in Kachumbala, Kidongole and Bukedea sub-counties, and to a lesser extent in
Kolir and Malera. Risk hot spots are reported in Kakere and Kasoka (Bukedea Sub-County),
Kangole, Kachede, Kotiokot and Kodike (Malera Sub-County), Kochus, Komongomeri and
Kamutur (Kolir Sub-County).

26 | Bukedea district Hazard, risk and VulneraBility Profile
road accident risk
figure 9 bukedea district road accident risk map
Frequent road accidents have occurred in Bukedea District in recent years. Bad roads,
speeding and lack of warning signage cause road accidents throughout the district, with a
high incidence in Bukedea Town Council, and in Bukedea and Kachumbala sub-counties.

Bukedea district Hazard, risk and VulneraBility Profile | 27
bush fire risk
figure 10 bukedea district bush fire risk map
Bush fires caused by uncontrolled agricultural burning are a medium risk in Malera and
Koler sub-counties and a low risk elsewhere in the district.

28 | Bukedea district Hazard, risk and VulneraBility Profile
table 7 risks vulnerability
Hazard
Mal
era
Kol
ir
Kac
hum
bala
Kid
ongo
le
Buk
edea
Buk
edea
TC
Floods 3 3 2 1 2Crop and animal epidemics 2 2 2 2 2 2Land conflicts 3 3 3 3 3 2Bush fires 2 2 1 1 1Hailstorms and lighting 1 1 1 1 1 1Environmental degradation 2 2 3 3 2 2Drought and food insecurity 2 2 2 2 2 2Vermin 1 1 2 1 2Road accidents 3 3 3
Score: High = 3, Medium = 2, Low = 1, Not reported = Blank
vuLnEraBiLity

Bukedea district Hazard, risk and VulneraBility Profile | 29
risk and vulnerability
figure 11 bukedea district risk and vulnerability map
Bukedea and Kachumbala Sub-Counties are assessed at high risk and vulnerability levels,
based on the frequency of hazard events and the magnitudes of losses suffered. Malera
and Kolir sub-counties have moderate vulnerability levels, and Kidongole and Bukedea
Town Council rate lowest.
Land conflicts, road accidents and environmental degradation are the major risks registered
in the most vulnerable sub-counties of Kachumbala and Bukedea. Floods and land conflicts
are of high risk in Kolir and Malera sub-counties.

30 | Bukedea district Hazard, risk and VulneraBility Profile
The multi-hazard vulnerability profile resulting from this mapping exercise combines spatial
data and information captured with participatory methods in communities in Bukedea
District. The profile shows how communities in each sub-county perceive each hazard
based on likelihood of occurrence and severity of impact on them.
Clearly floods are the most significant hazard for people in Bukedea district, although the
severity and vulnerability vary across sub-counties. Nine types of hazards are endemic
in Bukedea District. Kolir and Malera sub-counties experience the worst flooding while
Kodongole has low flooding incidence and Bukedea Town Council does not experience
severe floods. Land conflicts stand out as prominent risks in nearly all sub-counties in the
district.
Some sub-counties, such as Kachumbala and Bukedea, are more vulnerable than
others, suffering from the cumulative impacts of several hazards, some of which may
occur simultaneously. As in neighbouring districts, flooding is most pronounced, with
high vulnerability levels in all sub-counties in the district compared to other hazards. The
Bukedea Town Council has the lowest composite vulnerability.
The hazard mapping exercise shows the importance of spatial information to characterize
disasters in Bukedea District. The hazard, risk and vulnerability profile information should
be reflected in the disaster mitigation plans developed by the Bukedea district local
government to plan action to minimize hazard impacts.
concLuSionS
Bukedea district Hazard, risk and VulneraBility Profile | 31
dEFinitionS oF tErmSdrought. Drought is the prolonged shortage of water usually caused by lack of rain. Drought
and famine are related because crop and livestock productivity suffer in droughts.
food insecurity. Food Insecurity is the severe shortage of food that may lead to malnutrition
and death.
floods. A flood occurs when large amounts of water cover a place that is meant to be dry.
Floods usually occur with high rainfall.
landslides. These are rapid movements of large mass of mud, rocks, formed from lose
soil and water. Landslides occur mainly during the rainy season, but they can also be
precipitated by earthquakes. Community settlement on steep slopes and other uncontrolled
land use practices increase the probability of landslides.
Epidemics. This is the occurrence of a disease, in a particular community and at a
particular period, beyond normal levels and numbers. Epidemics may affect people, crops
or livestock.
Human epidemics. The diseases include cholera, meningitis, hepatitis E, marbug, plague,
avian influenza, ebola and sleeping sickness among others.
Crop and animal epidemics. Animal epidemics include swine fever, foot and mouth disease,
naganan, and bird flu. Crop disease epidemics include coffee wilt, banana bacterial wilt,
cassava mosaic and cassava brown streak disease.
Heavy storms. Heavy storms in Uganda are often accompanied by hail, lightning and
violent winds. Storms can result in destruction of crops, animals, public facilities and
human settlements. Lightning can be deadly and may be mitigated by lightning ground
conductors on buildings.
Pest infestation. These are destructive insects, worms, caterpillars or any other animal
that attacks crops or livestock. Common pests in Uganda include weevils, locusts and
caterpillars.
vermin. Baboons, chimpanzees, bush pigs and other animals which raid crops cause
damage and losses which may significantly diminish agricultural productivity.
land conflict. These are conflicts arising from ownership and use of land and other land
resources.
32 | Bukedea district Hazard, risk and VulneraBility Profile
Cattle rustling. This is when one community raids another to steal livestock.
Environmental degradation. This results from poor land use and other unsustainable
ecosystem exploitation that lead to deterioration of the environment. Overgrazing, cultivation
on sloping land, unguided and uncontrolled use of fertilizers and pesticides, bush burning,
overfishing, deforestation, mining, poor wastewater treatment, inappropriate waste disposal
and wetlands reclamation are examples of causes of environmental degradation.
mines and unexploded ordinance. Mines are devices designed to explode with fatal
effect when disturbed. Unexploded ordinance are unspent bullets, grenades, rockets, etc.,
which are discarded or stored.
bush fires. Fires set deliberately to clear forest or pasture for agricultural purposes may
go out of control and consume far more than intended.
Earthquakes. Earthquakes results from sudden violent movements of the earth’s surface,
sometimes causing massive loss of lives and property due to building collapse.
invasive Species. A non-native plant or animal that invades a habitat or bioregion with
adverse economic, environmental, and/or ecological effects. An example is a grass that is
dominating pasture in the Rwenzori sub-region, reducing the grazing capacity of the land.

34 | Bukedea district Hazard, risk and VulneraBility Profile
With support from:United Nations Development ProgrammePlot 11, Yusuf Lule RoadP.O. Box 7184Kampala, UgandaFor more information: www.undp.org