Embed Size (px)
Citation preview
The Reliability Programme
Final report
Dennis Opposs and Qingping He
January 2011
Ofqual/11/4828
The Reliability Programme: Final report
Contents Summary .................................................................................................................... 4
Background ................................................................................................................ 5
The Ofqual Reliability of Results Programme............................................................. 6
Aims and objectives ................................................................................................ 6
Programme structure .............................................................................................. 6
Advisory groups ...................................................................................................... 7
Activities.................................................................................................................. 8
Summary of results from the programme ................................................................... 8
Evidence of reliability in Key Stage 2 National Curriculum testing .......................... 8
Key Stage 2 science pre-tests............................................................................. 8
The 2008 Key Stage 2 English reading pre-test ................................................ 11
Classification accuracy in results from the 2009 and 2010 Key Stage 2 National Curriculum tests ................................................................................................ 13
Evidence of reliability in GCE and GCSE.............................................................. 15
Test-related component / unit reliability ............................................................. 15
Marking-related variability.................................................................................. 22
Teacher assessment reliability .......................................................................... 24
Qualification level reliability ............................................................................... 25
Grading-related variability.................................................................................. 26
Evidence of reliability in workplace-based qualifications....................................... 26
Review of reliability theories and models .............................................................. 27
Representing and reporting of assessment results and measurement errors ....... 28
International approaches to representing and reporting of assessment results and errors .......................................................................................................... 28
Reporting of measurement uncertainty and reliability in USA............................ 29
Public perceptions of reliability.............................................................................. 31
Surveys of perceptions of A levels and GCSEs................................................. 31
Qualitative investigations of perceptions of reliability ........................................ 32
Quantitative investigation of public perceptions of reliability.............................. 34
Communicating about reliability with the public ................................................. 38
Raising public awareness of reliability................................................................... 38
Ofqual reliability seminars ..................................................................................... 39
Ofqual 2011 2

The Reliability Programme: Final report
Ofqual 2011 3
Interpretation and communication of reliability evidence ................................... 39
Classification accuracy in Key Stage 2 National Curriculum tests..................... 40
Reliability policy and its implications for awarding organisations....................... 42
Views on preliminary recommendations from TAG ........................................... 45
Views on reporting reliability information from an international perspective ...... 46
Technical Advisory Group report .............................................................................. 47
Recommendations to Ofqual................................................................................. 47
Areas for further work............................................................................................ 49
Policy Advisory Group report .................................................................................... 50
Communicating reliability evidence and improving public understanding.............. 50
Stakeholder perspectives on reliability .............................................................. 50
Ways of understanding and communicating reliability evidence........................ 50
Handling media stories...................................................................................... 50
Ways of improving public understanding of reliability and increasing public confidence ......................................................................................................... 51
Implications of findings from the Reliability Programme .................................... 52
Recommendations to Ofqual................................................................................. 53
Further research and policy development ................................................................ 54
Further research ................................................................................................... 54
Developing Ofqual reliability policy ....................................................................... 56
References ............................................................................................................... 57
The Reliability Programme: Final report
Summary
The Office of Qualifications and Examinations Regulation (Ofqual) in England has been conducting a two-year research programme, the Reliability of Results Programme, to investigate the reliability of results from national tests, public examinations and other qualifications in order to develop regulatory policy on reliability. Since it started in 2008, the programme has made substantial progress in the following areas.
Generating evidence of reliability: A substantial number of empirical studies have been undertaken to generate evidence of reliability for a selection of Key Stage 2 National Curriculum tests (NCTs); a range of GCE and GCSE units, components and qualifications; and a number of vocational qualifications.
Reviewing test theories and models: The programme has produced a number of research reports that review measurement theories and models used to study reliability and techniques used to produce and interpret reliability measures under the frameworks of classical test theory (CTT), generalizability theory (G-theory), and item response theory (IRT).
Interpreting and communicating reliability evidence: Views on how reliability evidence should be interpreted and communicated in the contexts of the assessments used in England have been collected from both assessment professionals and other main stakeholders.
Exploring public perceptions of unreliability in examination results: A substantial amount of information about public perceptions of reliability and the examinations system as a whole has been produced through qualitative studies using workshops, focus groups and discussion groups, and quantitative studies using online questionnaire surveys.
Developing policy on reliability: Findings from the programme have been under evaluation and areas where regulation on reliability may play a role are being explored.
This report, which is built on an interim report of the programme (Opposs and He, 2010), is intended to:
summarise the main findings from the programme
identify areas where further work will be needed
outline potential areas that Ofqual will be exploring during the development of reliability policy.
Ofqual 2011 4

The Reliability Programme: Final report
Background
England is a country in which much educational assessment takes place (Black and Wiliam, 2005). There are the following major assessment occasions in the English system:
whole cohort National Curriculum assessments (NCAs) for 11-year-olds in English and mathematics
public examinations, including standardised qualifications typically taken at the ages of 16 and 18
large and diverse suites of vocational qualifications, which may be taken by candidates in schools, further education institutions or in workplaces as part of on-the-job training.
Some assessment systems (such as the National Curriculum assessments and the 16-plus examinations – mainly GCSEs) produce data that are also used as accountability measures for institutions and individual professionals, in addition to providing information about individual student attainments in specific subject areas.
Reliability, in educational measurement terms, refers to the consistency of results on a given measure from repeated measurements under equivalent conditions and is an important indicator of the quality of an assessment. Although results have a huge impact on learners' lives, as with any measurements, assessment results contain inaccuracies. Although it is generally realised that assessment results contain inaccuracies and substantial work has been carried out to study the reliability of assessments, there is considerable variability in how measurement uncertainty is represented and reported in different parts of the world (see Bradshaw and Wheater, 2010). While in the USA and some other countries assessment results are sometimes reported as raw scores or scaled scores together with the associated standard error of measurement (SEM) (Bradshaw and Wheater, 2010; Phelps et al., 2010), in England assessment organisations tend to report learners’ performance levels or grades for National Curriculum assessments and public examinations without any indication at all of the likely error-rates involved. However, it has been suggested that there is a duty to communicate about the reliability of assessment results to the public (see, for example, American Educational Research Association (AERA) et al., 1999, Standard 2.1; Newton, 2005a, 2005b; Phelps et al., 2010). It is important that the degree of inconsistency in test and examination results is investigated, interpreted and understood appropriately.
There has been little sustained and systematic attempt to evaluate the reliability of results from England's assessment systems, and little understanding of the public's knowledge of and attitudes towards unreliability in assessment results. To address
Ofqual 2011 5

The Reliability Programme: Final report
this, Ofqual has been conducting a two-year research programme, the Reliability of Results Programme, involving:
generating evidence of reliability of results from national tests, public examinations, and other qualifications
interpreting and communicating reliability evidence
exploring public perceptions of unreliability in examination results
developing policy to regulate the reliability of assessments with a view to improving the national assessment systems further.
The Ofqual Reliability of Results Programme
Aims and objectives
The primary aim of the Ofqual Reliability of Results Programme is to gather evidence to inform developing regulatory policy on reliability. The main objectives of the programme include the following:
to generate evidence of reliability of results from a number of major National Curriculum assessments, public examinations and qualifications offered by assessment agencies and awarding organisations in England
to stimulate, capture and synthesise technical debate on the interpretation of reliability evidence generated from this programme and other reliability studies
to investigate how results and the associated errors are reported internationally, and what procedures are adopted by assessment providers to communicate results and measurement errors to the users
to explore public understanding of and attitudes towards assessment inconsistency
to stimulate national debate on the significance of the reliability evidence generated by this programme and by other reliability studies
to help improve public understanding of the concept of reliability
to develop Ofqual policy on reliability.
Programme structure
To achieve the aims and objectives set out for the programme, the programme is structured into three strands:
Ofqual 2011 6

The Reliability Programme: Final report
Strand 1: Generating evidence on the reliability of results from a selection of national qualifications, examinations and other assessments in England through empirical studies
Strand 2: Interpreting and communicating evidence on reliability
Strand 3: Investigating public perceptions of reliability and developing regulatory policy on reliability.
Advisory groups
A Technical Advisory Group (TAG) and a Policy Advisory Group (PAG) were appointed to provide support to the programme. TAG is made up of educational assessment experts and has been primarily advising work on Strands 1 and 2, regarding:
the methodologies to be used for the programme
the selection of qualifications, examinations and other assessments to be investigated
the reviewing of reports from research projects funded under this programme.
The group has made recommendations to Ofqual with regard to its policy on reliability at the end of the programme.
The Policy Advisory Group is made up of representatives from a wide range of stakeholders, including assessment experts, assessment providers, employers, communications experts, teachers, students and parents. PAG has been providing advice on work for Strand 3 of the programme, particularly in the areas of engagement with key stakeholders and communication of reliability evidence to the public. The group met twice during the second year of the programme. The main objectives of the group are:
to gain full understanding of progress of the Reliability Programme
to understand stakeholder perspectives on the reliability of results from England's test, examination and qualification systems
to explore ways to understand reliability evidence and communicate it to a non-technical audience
to discuss implications of findings from the programme
to discuss ways of dealing with negative media headlines that misinterpret or inappropriately communicate reliability statistics
Ofqual 2011 7

The Reliability Programme: Final report
to explore ways of improving public understanding of reliability and increasing public confidence in the examinations system
to discuss the adequacy and appropriateness of recommendations from TAG
to make recommendations to Ofqual.
Activities
A variety of activities have been undertaken under the programme to meet the programme objectives, including:
commissioning research projects to awarding organisations and research institutions to generate evidence on reliability of results from National Curriculum assessments, public examinations and vocational qualifications; reviewing measurement theories and models used to study reliability; reviewing techniques used for producing and interpreting reliability measures; gauging public perceptions on reliability; and investigating international approaches to the representation and reporting of assessment results and measurement errors
participating in national and international conferences to exchange ideas and experiences with other assessment researchers, policy-makers and practitioners on issues related to reliability
organising technical seminars involving assessment experts and communications experts to discuss issues related to reliability and reach consensus on the interpretation, evaluation and communication of reliability evidence to the wider public
participating in and organising public events to raise public awareness of assessment reliability and to help the public to understand the concept of reliability.
Summary of results from the programme
Evidence of reliability in Key Stage 2 National Curriculum testing
Key Stage 2 science pre-tests
The National Foundation for Educational Research (NFER) was commissioned to conduct a research project studying the reliability of results from the National Curriculum tests in science which were administered to all pupils in England at the age of 11 between 2004 and 2008. This study provided robust evidence of reliability of results from Key Stage 2 science assessments (see Maughan et al., 2009). The researchers studied the internal reliability of individual tests used and compared the consistency of results from different versions (or parallel forms) of the same test. A variety of reliability indices, including internal consistency coefficient for individual
Ofqual 2011 8

The Reliability Programme: Final report
tests, correlation coefficients between parallel forms, Kappa statistics for individual tests, and classification accuracy and consistency indices for individual tests and between parallel forms, were produced using widely used procedures. Measures of reliability have been appropriately interpreted in the context of National Curriculum assessment in England.
The Key Stage 2 science test consists of two papers (Paper A and Paper B). These papers each carry 40 marks and consist of a mixture of objective, short answer and longer response questions. The papers each have a time allowance of 45 minutes. Scores from the two papers are combined to produce a composite score, which is then used to assign a level representing the achievement in science by the pupil. Each year a subset of pupils takes an equivalent test, which is used as the following year’s live test shortly before the current year’s live test. By using the levels from the pre-test and the live test to produce a cross-tabulation of results for the pupils for each year studied, the researchers were able to investigate the consistency of the levels awarded to the pupils from the two tests (see Maughan et al., 2009, for a detailed description of the level-setting procedures used for the live test and the pre-test). As an example, Table 1 compares the percentages of pupils that were assigned to different levels by the 2004 live test (A+B) and the 2005 pre-test (A+B). The percentages of pupils who were awarded the same level on each version of the test (the bold numbers in the table) can be added up to provide an indication of the overall consistency between the live test and the pre-test, which is 73% in this case.
Table 1: Percentages of pupils who were classified into the different performance
categories by the 2005 pre-test (A+B) and the 2004 live test (A+B) (based on Maughan et
al., 2009)
2004 Live test (A+B) Below L3 L3 L4 L5
Below L3 <1 1 0 0 L3 <1 8 4 <1 L4 <1 4 29 9
2005 Pre-test
(A+B)
L5 0 0 9 35
Table 2 shows the percentage agreement in classification by the tests for each of the years investigated. There would appear to have been an improvement in the classification consistency of the tests over the five-year period, with the last three years being better than the first two. It was shown that almost all of the remainder of the pupils were classified into the adjacent levels, with less than 1% of pupils being awarded more than one level different in four of the five years.
Ofqual 2011 9

The Reliability Programme: Final report
Table 2: Percentages of pupils who were classified into the same performance categories
by the pre-tests (A+B) and live tests (A+B) (based on Maughan et al., 2009)
Tests Consistency (%) 2005 pre-test vs 2004 live test 72 2006 pre-test vs 2005 live test 74 2007 pre-test vs 2006 live test 79 2008 pre-test vs 2007 live test 79 2009 pre-test vs 2008 live test 79
Maughan et al. (2009) also computed the correlation coefficient for each pair of the pre-tests and live tests. Table 3 lists the raw score correlation coefficients for each pair and Cronbach’s alpha for individual tests. Cronbach’s alpha is a measure of consistency in test scores. Specifically, Cronbach’s alpha refers to the degree that groups of items in a test produce consistent or similar scores for individual test-takers (or consistency in test scores from different set of items). As items in a test can be viewed as a sample from a domain of potential items, Cronbach’s alpha may be viewed as a measure of the extent that the scores from test-takers on a test represent the expected scores from the entire domain. If items in a test also require human marking, Cronbach’s alpha will also to some degree reflect the variability in test scores associated with the inconsistency in marking between markers. Values of the Cronbach’s alpha for live test papers have been published by the Qualifications and Curriculum Development Agency (QCDA) on its website.
Table 3: Raw score correlation coefficients between the pre-tests and live tests, and
Cronbach’s alpha for individual tests (based on Maughan et al., 2009)
Year of comparison
Tests Correlation Cronbach’s alpha
04/05 Pre-test (A+B) vs live test (A+B) 0.85 0.92 vs * 05/06 Pre-test (A+B) vs live test (A+B) 0.81 0.93 vs 0.92 06/07 Pre-test (A+B) vs live test (A+B) 0.85 0.92 vs 0.93 07/08 Pre-test (A+B) vs live test (A+B) 0.86 0.94 vs * 08/09 Pre-test (A+B) vs live test (A+B) 0.88 0.94 vs*
* Cronbach’s alpha for live test was not available.
In classical test theory, the correlation between two parallel forms is the reliability estimate of the test, and the correlations between the pairs of the tests are generally lower than the Cronbach’s alpha values for individual tests. This is expected because Cronbach’s alpha is only an internal reliability measure of the test, which only reflects
Ofqual 2011 10

The Reliability Programme: Final report
the combined effect of errors from sources associated with items in the specific test and markers. The correlation between two tests, on the other hand, reflects the contributions to the overall inconsistency in results from both test items in the individual test forms and markers, and the occasions under which the tests were administered (that is, including test item-related, marker-related and occasion-related errors).
Maughan et al. (2009) also investigated the decision accuracy and consistency of results based on a single administration of the test using item response theory. Decision accuracy is defined as the proportion of pupils that would be awarded the same performance levels by both the true scores and the observed scores on the test. Decision consistency refers to the proportion of pupils that would be awarded the same performance levels by two sets of observed scores on two parallel forms of the same test. Since students taking the National Curriculum tests are classified into different National Curriculum performance levels, classification accuracy would be an appropriate indicator of the reliability of the tests. For the 2009 pre-test, the decision accuracy and consistency were estimated to be 0.89 (or 89%) and 0.84 (or 84%) respectively. Misclassification, which is defined as 1-decision accuracy, is frequently used to indicate the level of inconsistency in awarding the performance levels by the true scores and observed scores. For the 2009 pre-test, this is 0.11 (or 11%).
Maughan et al. (2009) also used Newton’s (2009) concept of classification ‘correctness’ and the method that Newton proposed to investigate level misclassification further.
The 2008 Key Stage 2 English reading pre-test
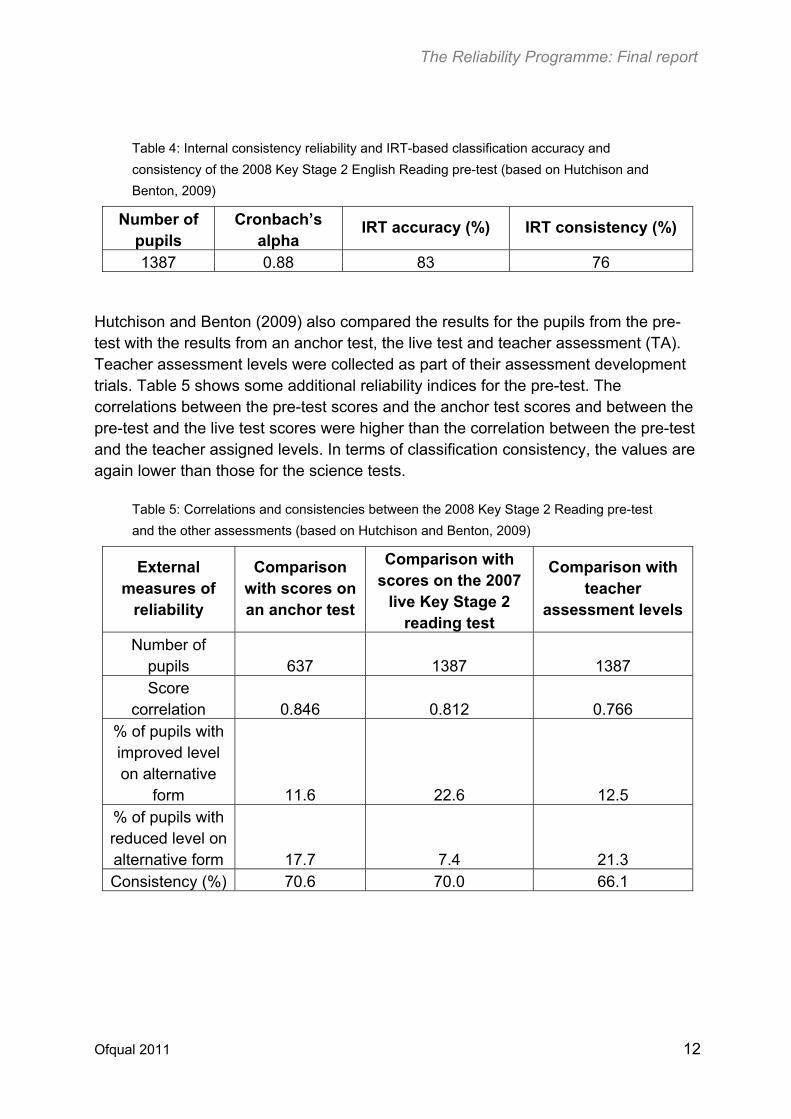
Used as a case study to illustrate how various reliability measures can be estimated and interpreted, Hutchison and Benton (2009) investigated the reliability of the 2008 Key Stage 2 English reading pre-test, which was conducted in 2007 (see also later discussions). The test was made up of 34 items, allowing a total of 50 marks to be achieved. For the sample of pupils from 60 schools involved in their analysis, the test had a mean of 28.5 and a standard deviation of 9.1. Table 4 shows Cronbach’s alpha and IRT-based classification accuracy and consistency for the test. The reliability measures for this test are generally lower than those for the science tests discussed previously. This is expected as this test was shorter and contained more open-ended questions requiring human marking than the science tests. An IRT-based misclassification was estimated to be 17%, or about 83% of the pupils were classified correctly.
Ofqual 2011 11
The Reliability Programme: Final report
Table 4: Internal consistency reliability and IRT-based classification accuracy and
consistency of the 2008 Key Stage 2 English Reading pre-test (based on Hutchison and
Benton, 2009)
Number of pupils
Cronbach’s alpha
IRT accuracy (%) IRT consistency (%)
1387 0.88 83 76
Hutchison and Benton (2009) also compared the results for the pupils from the pre-test with the results from an anchor test, the live test and teacher assessment (TA). Teacher assessment levels were collected as part of their assessment development trials. Table 5 shows some additional reliability indices for the pre-test. The correlations between the pre-test scores and the anchor test scores and between the pre-test and the live test scores were higher than the correlation between the pre-test and the teacher assigned levels. In terms of classification consistency, the values are again lower than those for the science tests.
Table 5: Correlations and consistencies between the 2008 Key Stage 2 Reading pre-test
and the other assessments (based on Hutchison and Benton, 2009)
External measures of
reliability
Comparison with scores on an anchor test
Comparison with scores on the 2007
live Key Stage 2 reading test
Comparison with teacher
assessment levels
Number of pupils 637 1387 1387 Score
correlation 0.846 0.812 0.766 % of pupils with improved level on alternative
form 11.6 22.6 12.5 % of pupils with reduced level on alternative form 17.7 7.4 21.3 Consistency (%) 70.6 70.0 66.1
Ofqual 2011 12

The Reliability Programme: Final report
Classification accuracy in results from the 2009 and 2010 Key Stage 2 National Curriculum tests
On 8 November 2010, Ofqual held a seminar at the Institute of Education in London to gain a further understanding of the reliability of Key Stage 2 National Curriculum tests through discussions of results from analyses of the 2009 and 2010 live assessment data using a number of widely used methods (He, Hayes and Wiliam, 2011). Six different methods under both the CTT and IRT frameworks have been used in the study to estimate classification accuracy. These involved modelling (conditional) error score distribution, estimating true score distribution, estimating observed score distribution based on modelled true score distribution using either simulations or numerical integration, and comparing modelled true score distribution with observed score distribution, taking into account cut scores set for the performance categories, to derive classification accuracy. The data analysed are from the 2009 and 2010 live test series. These include mark distributions for the populations and item level data for each subject for a sample of over 3000 students for each series.
The Key Stage 2 mathematics test has three subtests: Test A, Test B and a mental test. Test A and Test B are each worth 40 marks. Calculators are allowed for Test A but not for Test B. The mental test is worth 20 marks. Scores from the three subtests are combined to form the composite score for mathematics. The English test has two components, a reading component and a writing component. Both the reading and writing components are worth 50 marks. Again scores on the two subtests are aggregated to produce the overall score for the subject. As in the science tests, the composite score for each subject is used to assign a National Curriculum level for the subject to the pupil.
Table 6 shows the values of Cronbach’s alpha for the three subjects for the samples, with highest values for the mathematics tests and the lowest for the English tests. For individual subjects, the values are similar in 2009 and 2010. For the science tests, values of Cronbach’s alpha are also similar to those estimated for the pre-tests for 2005–9 (see previous discussions and Maughan et al., 2009). These values are relatively high for tests of this kind, and significantly higher than those reported in earlier years.
Table 7 shows the range of classification accuracy values for the samples that were used to produce item level data, suggesting that the different methods produce slightly different estimates. This is expected, because different methods make different assumptions about the true scores and the error scores and the extent to which these assumptions are met by the test data varies between the different methods. The accuracy values are generally about 90% for the mathematics tests, 87% for the science tests, and 85% for the English tests. These values are also
Ofqual 2011 13

The Reliability Programme: Final report
comparable with those from recent studies by other researchers (Hutchison and Benton, 2009; Maughan et al., 2009; Newton, 2009). These values are substantially higher than those suggested for the tests in the early years of testing (see Wiliam, 2001). This increase in classification accuracy may partly reflect that the reliability of Key Stage 2 National Curriculum tests has improved and partly reflect that the structure of the tests has changed (see also Maughan et al., 2009).
Table 6: Sample sizes and Cronbach’s alpha for the 2009 and 2010 Key Stage 2 live
tests
Sample size Number of items Cronbach’s alpha Subject 2009 2010 2009 2010 2009 2010
Science 3395 26017 79 73 0.928 0.926
Mathematics 3265 3649 100 100 0.968 0.964 English 3189 3656 40 38 0.910 0.919
Table 7: Classification accuracy for samples from the 2009 and 2010 Key Stage 2 live
tests estimated using different methods.
Accuracy (%) Subject M1* M2* M3* M4* M5* M6*
Science 2009 90 87 88 86 87 87
Science 2010 89 86 87 86 86 86 Mathematics
2009 92 89 90 89 89 89
Mathematics 2010
91 91 91 90 91 90
English 2009 87 84 87 83 86 85 English 2010 88 85 86 85 85 90
*M1 to M6: the different methods
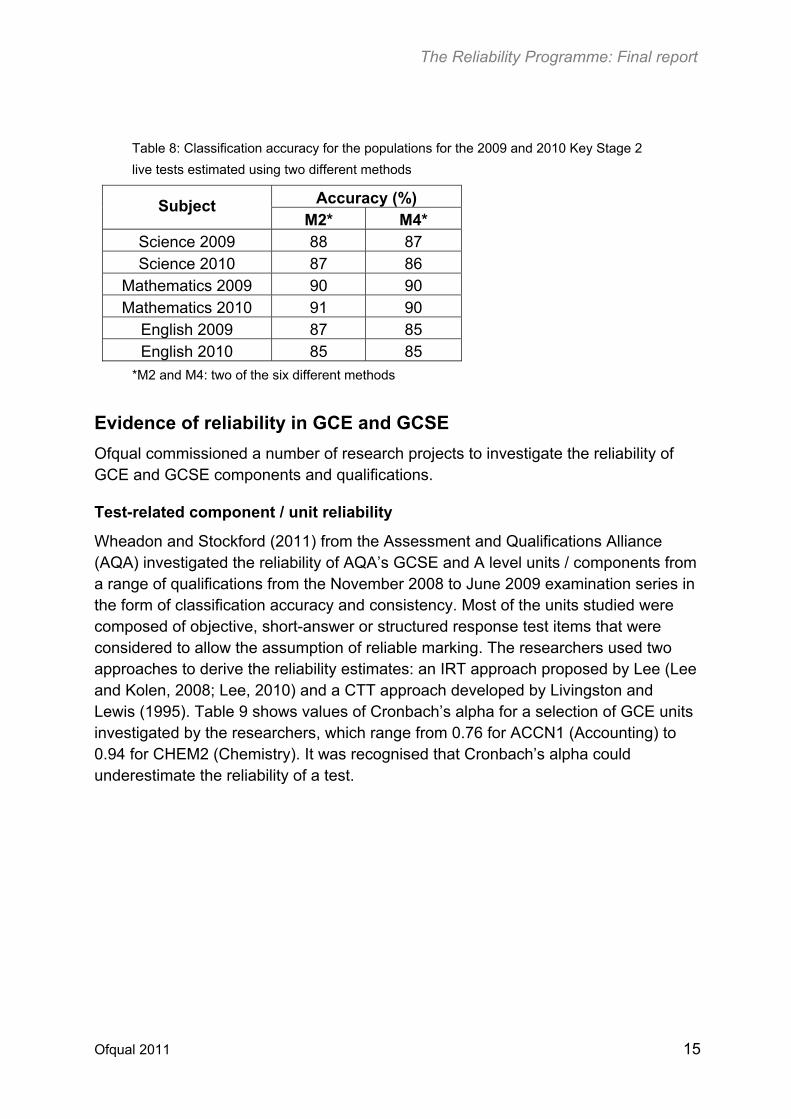
Assuming that the values of Cronbach’s alpha estimated for the samples can be generalized to the populations, two of the methods (M2 and M4) were also used to estimate the classification accuracy for the populations (see Table 8). These values are closely similar to those estimated for the samples.
Ofqual 2011 14
The Reliability Programme: Final report
Table 8: Classification accuracy for the populations for the 2009 and 2010 Key Stage 2
live tests estimated using two different methods
Accuracy (%) Subject M2* M4*
Science 2009 88 87 Science 2010 87 86
Mathematics 2009 90 90 Mathematics 2010 91 90
English 2009 87 85 English 2010 85 85
*M2 and M4: two of the six different methods
Evidence of reliability in GCE and GCSE
Ofqual commissioned a number of research projects to investigate the reliability of GCE and GCSE components and qualifications.
Test-related component / unit reliability
Wheadon and Stockford (2011) from the Assessment and Qualifications Alliance (AQA) investigated the reliability of AQA’s GCSE and A level units / components from a range of qualifications from the November 2008 to June 2009 examination series in the form of classification accuracy and consistency. Most of the units studied were composed of objective, short-answer or structured response test items that were considered to allow the assumption of reliable marking. The researchers used two approaches to derive the reliability estimates: an IRT approach proposed by Lee (Lee and Kolen, 2008; Lee, 2010) and a CTT approach developed by Livingston and Lewis (1995). Table 9 shows values of Cronbach’s alpha for a selection of GCE units investigated by the researchers, which range from 0.76 for ACCN1 (Accounting) to 0.94 for CHEM2 (Chemistry). It was recognised that Cronbach’s alpha could underestimate the reliability of a test.
Ofqual 2011 15

The Reliability Programme: Final report
Table 9: Cronbach’s alpha for the considered AS level units (from Wheadon and
Stockford, 2011)
Specification Unit Cronbach’s alpha Accounting ACCN1 0.76
Accounting ACCN2 0.78 Biology BIOL1 0.85 Biology BIOL2 0.89
Chemistry CHEM1 0.91
Chemistry CHEM2 0.94 Computing COMP2 0.84
Electronics ELEC1 0.90 Electronics ELEC2 0.93
Environmental studies ENVS1 0.77
Environmental studies ENVS2 0.88 Human biology HBIO1 0.87
Human biology HBIO2 0.84
Physics PHYA1 0.91 Physics a PHYA2 0.92
Physics b PHYB2 0.90 Psychology a PSYA1 0.83 Psychology a PSYA2 0.84
Psychology b PSYB1 0.77
Science in society SCIS1 0.85
Bramley and Dhawan (2011) from Cambridge Assessment (CA) reported values of Cronbach’s alpha for 97 AS components / units, ranging from 0.421 to 0.944 (see Figure 1). Again it was assumed that the components investigated were accurately marked. These researchers attempted to identify the most effective measures of assessment score / grade reliability that can be readily calculated for an assessment and the approach that can be used to combine and present reliability information. They investigated the relationship of Cronbach’s alpha and the standard error of measurement (SEM) to test length and found that both alpha and the SEM generally increase with maximum mark of the components. The researchers further looked at using the grade bandwidth:SEM ratio as a reliability indicator of component reliability to remove the effect of component maximum mark on Cronbach’s alpha or SEM, which generally is independent of component maximum mark (the grade bandwidth is defined as the number of marks in the A–B range for A level and higher tier GCSE units / components, and the number of marks in the C–D range for lower tier GCSE units / components; the SEM is calculated as the product of the square root of the
Ofqual 2011 16

The Reliability Programme: Final report
reliability coefficient such as Cronbach’s alpha and the standard deviation of the raw scores). Higher values of the grade bandwidth:SEM ratio will generally be associated with higher classification accuracy or consistency.
Figure 1: Distribution of Cronbach’s alpha for 97 GCE units / components studied (from
Bramley and Dhawan, 2011)
Table 10 shows the classification accuracy and consistency measures estimated for the GCE units using the IRT and CTT methods for the units / components studied by Wheadon and Stockford (2011). Table 11 further shows the proportion of candidates with the awarded grades that have their true scores either in the awarded grade or in the immediate adjacent grades.
Ofqual 2011 17

The Reliability Programme: Final report
Table 10: Classification accuracy and consistency in GCE units / components (based on
Wheadon and Stockford, 2011)
IRT Livingston and Lewis Specification Unit Accuracy Consistency Accuracy ConsistencyAccounting ACCN1 0.61 0.53 0.53 0.36 Accounting ACCN2 0.62 0.54 0.56 0.40
Biology BIOL1 0.60 0.51 0.58 0.40 Biology BIOL2 0.63 0.54 0.61 0.42 Chemistry CHEM1 0.67 0.57 0.64 0.45 Chemistry CHEM2 0.73 0.64 0.69 0.52 Computing COMP2 0.60 0.49 0.54 0.32 Electronics ELEC1 0.67 0.60 0.62 0.44
Electronics ELEC2 0.70 0.63 0.65 0.49 Environmental studies ENVS1 0.57 0.48 0.54 0.34
Environmental studies ENVS2 0.64 0.54 0.61 0.42 Human biology HBIO1 0.67 0.60 0.65 0.50 Human biology HBIO2 0.59 0.51 0.58 0.40
Physics PHYA1 0.67 0.59 0.64 0.47
Physics a PHYA2 0.68 0.60 0.66 0.47 Physics b PHYB2 0.64 0.56 0.62 0.45
Psychology a PSYA1 0.60 0.51 0.56 0.36 Psychology a PSYA2 0.60 0.52 0.57 0.38 Psychology b PSYB1 0.55 0.47 0.54 0.35 Science in society SCIS1 0.58 0.49 0.56 0.37
Ofqual 2011 18
The Reliability Programme: Final report
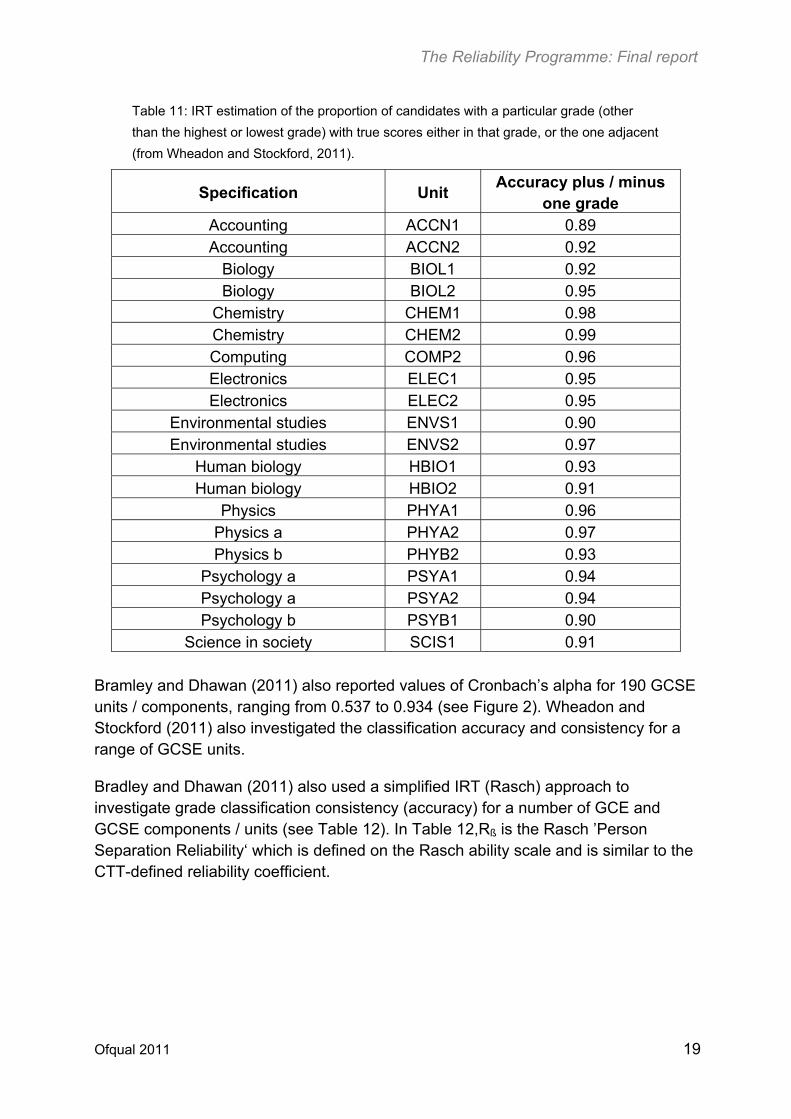
Table 11: IRT estimation of the proportion of candidates with a particular grade (other
than the highest or lowest grade) with true scores either in that grade, or the one adjacent
(from Wheadon and Stockford, 2011).
Specification Unit Accuracy plus / minus
one grade Accounting ACCN1 0.89 Accounting ACCN2 0.92
Biology BIOL1 0.92 Biology BIOL2 0.95
Chemistry CHEM1 0.98 Chemistry CHEM2 0.99 Computing COMP2 0.96 Electronics ELEC1 0.95 Electronics ELEC2 0.95
Environmental studies ENVS1 0.90 Environmental studies ENVS2 0.97
Human biology HBIO1 0.93 Human biology HBIO2 0.91
Physics PHYA1 0.96 Physics a PHYA2 0.97 Physics b PHYB2 0.93
Psychology a PSYA1 0.94 Psychology a PSYA2 0.94 Psychology b PSYB1 0.90
Science in society SCIS1 0.91 Bramley and Dhawan (2011) also reported values of Cronbach’s alpha for 190 GCSE units / components, ranging from 0.537 to 0.934 (see Figure 2). Wheadon and Stockford (2011) also investigated the classification accuracy and consistency for a range of GCSE units.
Bradley and Dhawan (2011) also used a simplified IRT (Rasch) approach to investigate grade classification consistency (accuracy) for a number of GCE and GCSE components / units (see Table 12). In Table 12,Rß is the Rasch ’Person Separation Reliability‘ which is defined on the Rasch ability scale and is similar to the CTT-defined reliability coefficient.
Ofqual 2011 19

The Reliability Programme: Final report
Figure 2: Distribution of Cronbach’s alpha for 190 GCSE units / components (from
Bramley and Dhawan, 2011)
Table 12: Reliability indices for twelve GCE / GCSE units / component (from Bramley and
Dhawan, 2011)
Ofqual 2011 20

The Reliability Programme: Final report
Johnson and Johnson (2011) explored the potential of using generalizability analysis to study component reliability for a range of GCE and GCSE components for a selection of subjects with varying assessment structure in terms of different numbers of questions in different components and different marks assigned to different questions in the component. The advantage of using G-theory to investigate reliability is that the relative contributions from different error sources to the overall error of measure for a test can be identified (see Johnson and Johnson, 2009, 2011). Further, G-theory can be used to explore the effect of various factors such as the number of tasks and the number of markers on the reliability of the test. For example, Table 13 shows how the relative and absolute reliability coefficients for a GCSE component vary with the number of questions in the question paper. In Table 13, Г is the generalizability coefficient (for relative measurement – ranking test-takers relative to each other); Ф is the absolute reliability coefficient (for absolute measurement – locating individuals absolutely on the measurement scale, irrespective of others), SEM is the standard error of measurement, and ME is the margin of error calculated as 1.96 SEM.
Table 13: Changes of reliability coefficients with the number of questions for a GCSE
component (from Johnson and Johnson, 2011)
Relative measurement
No. of questions
No. of markers
Mark scale*
Г SEM ME ME as % of mark scale
6 1 0–120 0.88 5.824 11.4 9.4
7 1 0–140 0.90 6.290 12.3 8.7
8 1 0–160 0.91 6.726 13.2 8.2 9 1 0–180 0.92 7.133 14.0 7.7
Absolute measurement No. of
questions No. of
markers Mark scale*
Ф SEM ME ME as % of mark scale
6 1 0–120 0.86 6.365 12.5 10.3 7 1 0–140 0.88 6.875 13.5 9.6 8 1 0–160 0.89 7.350 14.4 8.9
9 1 0–180 0.90 7.795 15.3 8.5
* This is the intended test score scale, not necessarily the achieved scale
The researchers mentioned above also discussed how classification accuracy and consistency measures were affected by factors such as test lengths, mark distributions and boundary locations, and how test reliability can be improved. The reports also discussed how reliability information could be used to inform test
Ofqual 2011 21
The Reliability Programme: Final report
development and improve assessment quality. It is noticed that the reliability measures reported for the various studies are for units only. In view of the structure of qualifications and the inter-relationships between units / components in a qualification, the qualification level reliability indices (coefficient alpha or classification accuracy and consistency) would be substantially higher than those for individual units or components.
Marking-related variability
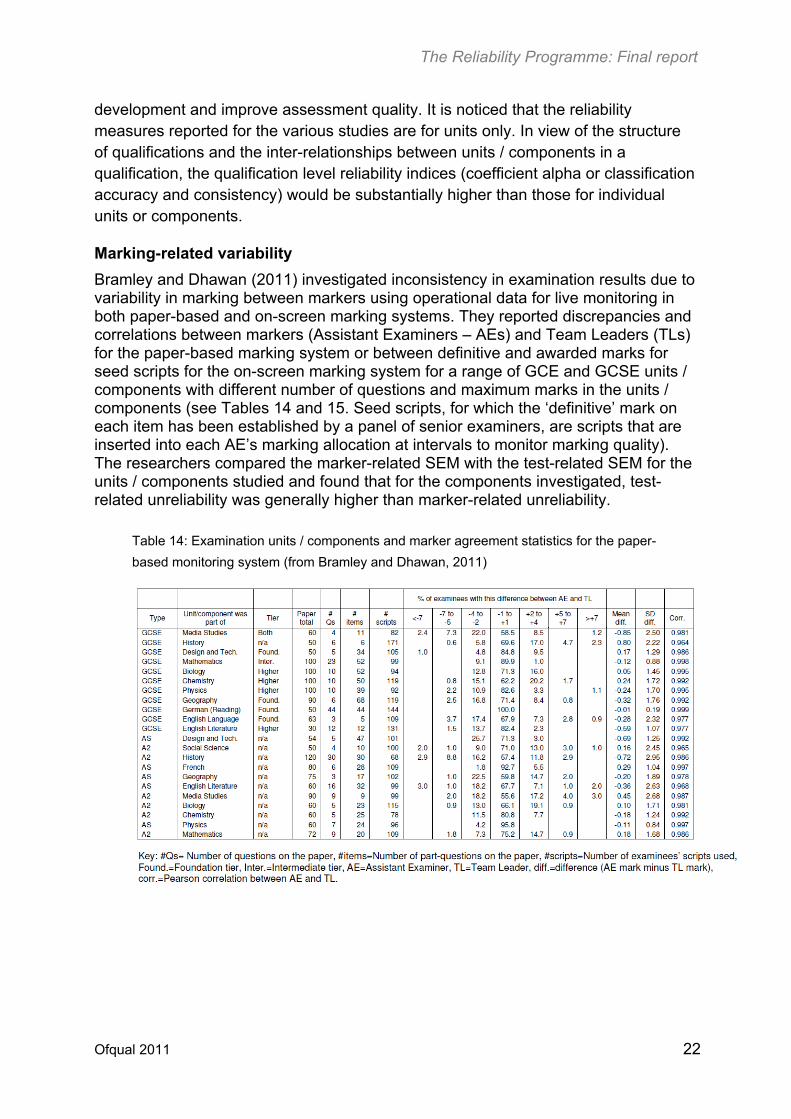
Bramley and Dhawan (2011) investigated inconsistency in examination results due to variability in marking between markers using operational data for live monitoring in both paper-based and on-screen marking systems. They reported discrepancies and correlations between markers (Assistant Examiners – AEs) and Team Leaders (TLs) for the paper-based marking system or between definitive and awarded marks for seed scripts for the on-screen marking system for a range of GCE and GCSE units / components with different number of questions and maximum marks in the units / components (see Tables 14 and 15. Seed scripts, for which the ‘definitive’ mark on each item has been established by a panel of senior examiners, are scripts that are inserted into each AE’s marking allocation at intervals to monitor marking quality). The researchers compared the marker-related SEM with the test-related SEM for the units / components studied and found that for the components investigated, test-related unreliability was generally higher than marker-related unreliability.
Table 14: Examination units / components and marker agreement statistics for the paper-
based monitoring system (from Bramley and Dhawan, 2011)
Ofqual 2011 22

The Reliability Programme: Final report
Table 15: Distribution of differences between definitive and awarded marks for seed
scripts in selected units / components for the on-screen monitoring system (from Bramley
and Dhawan, 2011)
Johnson and Johnson (2011) used an example to demonstrate how G-theory analysis can be used to explore the effect of the number of questions and the number of markers simultaneously on the reliability of a GCSE component (see Table 16). The relative reliability coefficient increases with increasing number of questions and number of markers.
Table 16: Changes in reliability coefficients with number of questions and number of
markers for a GCSE component (from Johnson and Johnson, 2011)
Relative measurement
No. of questions
No. of markers
Mark scale
SEM ME ME as % of mark scale
3 2 0–75 0.89 4.2 8.2 10.8
3 1 0–75 0.86 4.8 9.3 12.2
6 2 0–150 0.93 6.2 12.1 8.0 6 1 0–150 0.91 7.2 14.1 9.3
Absolute measurement
No. of questions
No. of markers
Mark scale
Ф SEMts MEts MEts as % of mark scale
3 2 0–75 0.84 5.0 9.8 12.9 3 1 0–75 0.79 6.0 11.8 15.5
6 2 0–150 0.89 8.0 15.7 10.4 6 1 0–150 0.84 10.0 19.6 13.0
Ofqual 2011 23

The Reliability Programme: Final report
Teacher assessment reliability
Johnson (2011) produced a report investigating the nature and extent of teacher assessment in the different testing and examination systems currently in operation in England, Wales and Northern Ireland and the procedures that are used by assessment agencies to ensure teacher assessment reliability. The research aimed to address the following teacher assessment issues.
What is the nature of the tasks assigned to teachers as the basis for forming judgements about learners’ knowledge, skills or abilities?
What rules and procedures are in operation that guide or standardise the conditions under which learners produce the evidence that their teachers use to assess them?
What is the nature of learners’ work – reports or artefacts – that teachers are required to assess, and what rules or requirements govern these?
What is the nature of any formal marking schemes that teachers use to arrive at their assessments, and what procedures are in place for checking reliability?
What methods are employed to check on the reliability of sets of submissions, and what are the criteria that would trigger action to address discrepancies?
What scaling or other adjustment methods are employed before aggregating assessment results to arrive at final awards, and what are the potential effects of these on the overall reliability of those final awards?
The report gave a very comprehensive account of the processes involved in teacher assessment, the main factors that could affect the reliability of teacher assessment results, and the quality assurance procedures adopted by assessment providers to ensure reliable teacher assessment results. The author examined the implications of the various aspects of teacher assessment for investigating teacher assessment reliability.
Coursework, tasks and conditions of assessment: The nature of assessment tasks and conditions under which the tasks are taken have important implications for assessment reliability and validity.
Internal assessment, performance evidence and rating criteria: Results from teacher assessment can take different forms, and their judgements can be complex involving the application of assessment criteria. Both teacher assessment results and judgement criteria can be subject to subjective interpretation.
Ofqual 2011 24
The Reliability Programme: Final report
External moderation of internal assessments: The issue of comparability in standards between teachers in the same school and between schools has implications for the reliability in teacher assessment results. Both statistical moderation and external inspections are used to address comparability.
Although the report provided some limited evidence of inconsistency in teacher assessment results, it found very limited empirical evidence on teacher assessment reliability, due primarily to the difficulties in conducting teacher assessment investigations. The author suggested that generalizability analysis could be used to investigate teacher assessment reliability.
Qualification level reliability
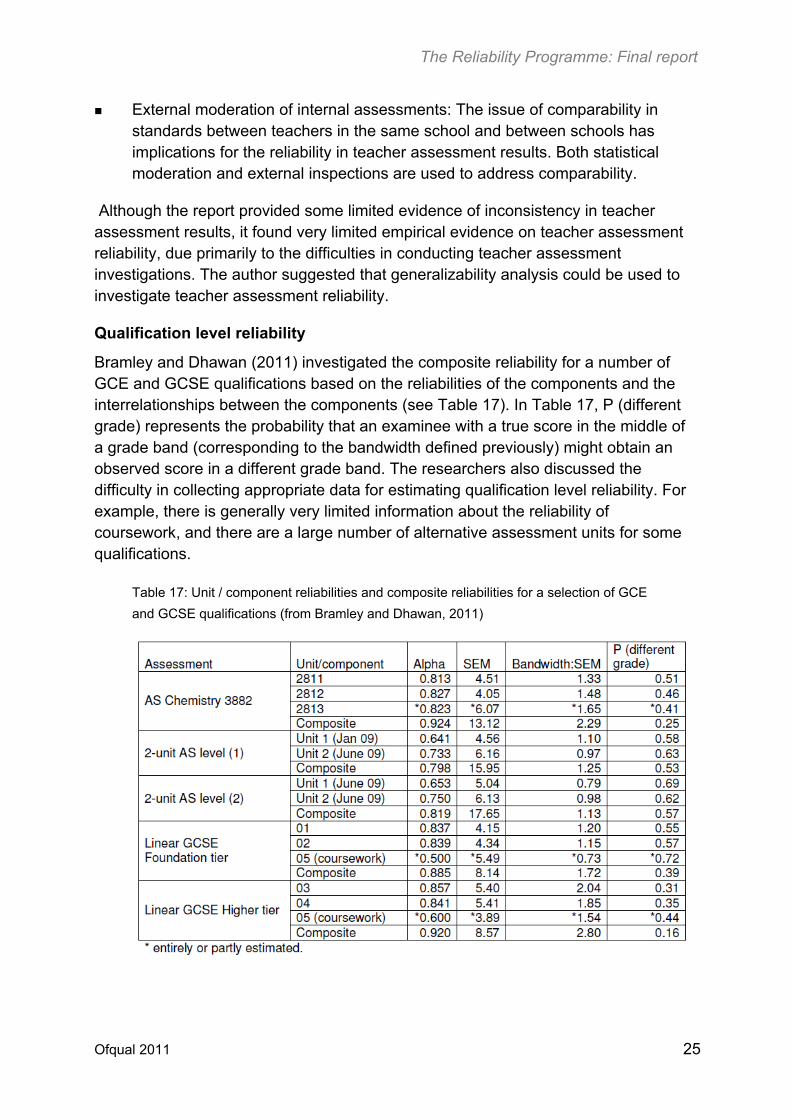
Bramley and Dhawan (2011) investigated the composite reliability for a number of GCE and GCSE qualifications based on the reliabilities of the components and the interrelationships between the components (see Table 17). In Table 17, P (different grade) represents the probability that an examinee with a true score in the middle of a grade band (corresponding to the bandwidth defined previously) might obtain an observed score in a different grade band. The researchers also discussed the difficulty in collecting appropriate data for estimating qualification level reliability. For example, there is generally very limited information about the reliability of coursework, and there are a large number of alternative assessment units for some qualifications.
Table 17: Unit / component reliabilities and composite reliabilities for a selection of GCE
and GCSE qualifications (from Bramley and Dhawan, 2011)
Ofqual 2011 25
The Reliability Programme: Final report
Grading-related variability
Bramley and Dhawan (2011) used examples to examine the sensitivity of qualification level outcomes to changes of grade boundary values. They discussed factors that could affect the sensitivity of qualification outcomes, which include the number of components / units to be aggregated, component mark distributions, correlations between components / units, and others.
Evidence of reliability in workplace-based qualifications
Harth and Hemker (2011) from City & Guilds and Cito conducted research on workplace-based vocational qualifications. Workplace-based vocational assessments present a variety of issues in terms of collecting appropriate data for analysis, such as observations of live performance, the use of a variety of tasks, individualised skills internally assessed, unlimited attempts by candidates, and others, which could introduce inconsistency in results. Another feature of this type of assessment is that candidates are entered for summative assessment only ‘when ready’ and the decision to ‘pass’ a candidate is taken in a sense before the assessment takes place (see Harth and Hemker, 2011).
Harth and Hemker (2011) provide a very detailed account of the processes involved in conducting workplace-based assessment, the many factors that can affect the reliability and validity of assessment results, existing procedures that are used to estimate reliably measures for vocational qualifications, and procedures that are used by assessment providers to ensure assessment reliability and validity.
The researchers investigated the reliability of outcomes from three selected qualifications in two occupational areas: Level 3 Electrotechnical Services (Electrical Installation – Buildings and Structures), Hairdressing NVQ (several pathways at levels 1, 2 and 3) and the new NVQ Certificate / Diploma in Hairdressing / Barbering / Combined Hair Types (several pathways at QCF levels 1, 2 and 3). To gather the necessary data for analysis, methodology was developed for data collection, which involved the use of centre-devised assessment records from candidate portfolios and of internal verifier (IV) reports. Procedures were then developed to estimate the inter-rater agreement, inter-rater reliability and inter-‘item’ reliability for the three qualifications. The main findings from this research (see Harth and Hemker, 2011) are as follows.
The results suggest that inter-rater (assessor / internal verifier) agreement is high (with Gower coefficient–proportion agreement, ranging from .90 to .99) and inter-rater (assessor / IV) reliability (Cohen’s kappa) is ‘substantial’ (for Electrotechnical Services) or ‘almost perfect’ (for Hairdressing).
Ofqual 2011 26

The Reliability Programme: Final report
Inter-‘item’ reliability (using a coefficient similar to Cronbach’s alpha and Guttman’s lambda) could only be estimated for the electrotechnical services and the results show high values.
The procedures presented confirm that it is possible to estimate the reliability of these qualifications, although changes would need to be made in the types of records used by assessors and the feedback given to candidates if this is to be carried out routinely.
The flexibility required in the structure of these qualifications may prevent these procedures developed from being applied across all vocational qualifications.
The verification process appears to work effectively in ensuring consistency of decisions and high inter-rater (assessor / IV) reliability.
Review of reliability theories and models
A number of research projects were also commissioned to review measurement theories and models that are used to study reliability and techniques that are used to produce and interpret reliability indices.
The report produced by Hutchison and Benton (2009) gives an insightful explanation of the measurement process, and a clear description of the different forms of reliability and the commonly used reliability indices under both CTT and IRT. The report provides a relatively comprehensive list of procedures that are commonly used to estimate these indices. This report also presents a clear description of how measurement error is related to reliability and how it should be interpreted. Clear descriptions of the assumptions involved in the use of the different forms of reliability measures and the sources of unreliability they account for are also provided in the report. A case study using a Key Stage 2 English reading pre-test was conducted to demonstrate how the various reliability indices can be estimated and interpreted (see previous discussions). The researchers also explored the use of alternative terms of reliability that could be understood by non-technical audiences.
The report produced by Johnson and Johnson (2009) provides an insightful explanation of the essential distinction between classical test theory and generalizability theory: a single undifferentiated error component versus the possibility of identifying multiple error sources in assessment results. The authors looked at the procedures involved in using CTT and G-theory to investigate score reliability. Their work clearly illustrated the usefulness of G-theory in the early developmental stages of tests and examinations. They explained how measurement models can be used in a decision study (D-study) to design a test with pre-specified measurement precision. G-theory can be used to explore the effect of various factors such as the number of tasks and the number of markers on the reliability of the test being designed, and to ensure that the acceptable degree of score reliability is
Ofqual 2011 27

The Reliability Programme: Final report
reached before the test is used in live testing situations. G-theory studies can also be used to monitor the results from live testing, to ensure that the required level of score reliability is maintained during testing.
The report produced by He (2009) investigates how the reliability of composite scores is affected by the reliabilities of component scores, weights assigned to individual components and the interrelationships between component scores. He conducted a relatively comprehensive review of the literature on methodologies for researching the reliabilities of tests and examinations, particularly in terms of multivariate techniques applicable for multi-component examinations, which is of great relevance to the examinations featured in the UK. The author looked at ways of forming composite scores from component scores and summarised some of the procedures developed for CTT, G-theory and IRT that are widely used for studying the reliabilities of composite scores composed of weighted component scores.
Representing and reporting of assessment results and measurement errors
International approaches to representing and reporting of assessment results and errors
An important area that the Reliability Programme has been trying to explore is how assessment results and associated errors are reported internationally, and what procedures are employed by assessment providers to communicate results and errors to the users.
The report produced by Bradshaw and Wheater (2010) provides evidence in these areas. The authors searched relevant literature and examples of assessments to identify how results are represented, what level of detail is reported and what steps are taken to quantify and report on error internationally. They also looked at the rationales that were behind the use of different reporting systems. These researchers developed a taxonomy for classifying approaches to the reporting of assessment results, and used this taxonomy to classify a range of international assessments. Key findings from this study are summarised below (see Bradshaw and Wheater, 2010).
The way results are reported depends on the intended use of the results and to whom the results are to be reported.
Two opposing issues must be weighed up when deciding on the level of detail of results reporting. These are:
the increased reliability when few grades are reported
the greater information when many are reported.
Ofqual 2011 28

The Reliability Programme: Final report
A selection of international assessments have been classified using the developed taxonomy. The classification is by three main areas:
a description of the assessment, which includes at what stage of secondary education the assessment is used, the purpose, who makes the award, the mode and method of the assessment, and whether the assessors are external or internal
how the results are represented, for instance by grades, scores or a profile, and the numbers of these
whether error or uncertainty is reported.
Few examples were located of reporting uncertainty or error in their results to learners. An introduction of the reporting of error in high-stakes qualifications would need careful handling to ensure this did not result in misinterpretation and a loss of confidence in the system.
Reporting of measurement uncertainty and reliability in USA
Following the report by Bradshaw and Wheater (2010), a group of researchers led by Richard Phelps in the USA were commissioned to investigate how measurement uncertainties were represented and reported in US high-stakes tests (see Phelps et al., 2010). These researchers conducted web-based searches, which were followed up where needed with telephone calls, and contacted key researchers at relevant entities involved in reporting test results in the USA. Using the evidence they collected, these researchers discussed the prevalence of the reporting of measurement uncertainty in high-stakes tests and the degree of ease or difficulty with which ordinary citizens may access such information. They found that the degree of transparency with measurement uncertainty issues varies. Transparency seems to be greater for educational than for licensure tests, for mostly objective than for mostly essay tests, for larger programmes than for smaller programmes. These researchers also found that transparency seemed to improve if the role of test contractors was greater and the role of state government was smaller.
With educational tests, they found that many of the states in the USA highlight imprecision along with the student scores on the parent / student reports (more states now are reporting score bands; see Figure 3 for an example of the kind of reports commonly used). But all states prepare technical manuals, which are usually readily available to those who want them. With licensure examinations, the situation is mixed. Some provide information about uncertainty on the candidate report itself and more reliability information in a yearly technical document. Others make available various technical reports and papers summarising reliability information. Others produce reports with substantial detail that are not released to the public.
Ofqual 2011 29

The Reliability Programme: Final report
The researchers found that totality of uncertainty is not reported to all stakeholders in US educational and licensure testing programmes. It would be difficult for the average parent to find a full range of measurement uncertainty statistics for their children’s tests, for example. The researchers conclude that the average parent would not be looking for this degree of technical information, which explains why technical manuals are not found on the home page of testing programme websites. Documents that better respond to the typical consumer’s needs are placed at the forefront and the technical manuals are placed behind. Despite this, they are not hidden and there seems not to be any effort to hide information.
Figure 3: North Carolina End-of-Grade Test student score report (adapted from Phelps et
al., 2010)
Ofqual 2011 30

The Reliability Programme: Final report
Public perceptions of reliability
Surveys of perceptions of A levels and GCSEs
Ipsos MORI conducts a survey of perceptions of A level and GCSE that is now in its eighth wave (Ipsos MORI, 2010). The most recently reported wave of the survey was conducted in the winter of 2009, and reported findings based on samples of A level and GCSE teachers, students and their parents, and the general public.
Both the 2009 and the 2010 surveys included questions about the reliability and accuracy of examination results (Ipsos MORI, 2010). Large majorities of teachers, parents and students thought that most or all students got the correct grade at GCSEs and A levels (for example, see Figure 4). Respondents also gave reasons that they perceived as being likely to cause candidates to get the wrong grade in examinations, which included:
students performing better or worse than expected in examinations or coursework
inaccurate marking and poorly designed examination papers.
Figure 4 Teachers’ views on the accuracy of GCSE grades (from Ipsos MORI, 2010)
Ofqual 2011 31
The Reliability Programme: Final report
Qualitative investigations of perceptions of reliability
As part of Strand 3 of the Reliability Programme, research projects were commissioned from Ipsos MORI and from the Assessment and Qualifications Alliance (AQA) to investigate public perceptions of reliability using workshops and focus groups. These studies focused on the following aspects of reliability:
the assessment process
factors affecting the performances of students on examinations
the reliability concepts and measurement error
the different types of error in examination results: preventable human mistakes versus inevitable random measurement error
factors contributing to measurement error in examination results
the level of acceptance towards human error and measurement error in examination results.
The research conducted by Ipsos MORI in January 2009 used two workshops in London and Birmingham to investigate the opinions of different groups about reliability and unreliability (Ipsos MORI, 2009). Research participants were drawn from teachers, students, parents, members of the general public, employers and examiners. The sessions started with an analogy to an error occurring in medical treatment; this was used as a substantial input to help workshop participants understand the concepts under discussion. Researchers understood that giving such substantial input to participants whose opinions and attitudes one was trying to discover ran the risk of biasing them. However, the belief was that participants would probably not have developed views on reliability in test scores and so it was felt important to give them contextualisation of this sort. Some of the findings from the research are summarised below.
There was a demarcation in the minds of the public between inevitable errors in the assessment process and preventable errors. The research participants appeared to accept that a certain amount of error was inevitable in a large examinations system, but they could be intolerant of ‘preventable errors’.
Sometimes participants appeared to be making a distinction between inherent and preventable error, and at other times did not.
Some research participants stated that their attitude to error depended upon whether the error changed a student’s grade or mark. They considered grade-related error to be more consequential than mark-related.
Ofqual 2011 32
The Reliability Programme: Final report
Participants’ views about error could vary by group and by the perceived cause of the error. For example, students and teachers could be intolerant of typographical errors in papers, while examiners could be more sanguine, taking the view that what was important was that any mistakes that did occur were rectified.
There was evidence that students were aware that some inconsistency between human markers was inherent in subjects such as English. However, there were also statements that such inherent errors should be minimised or even eliminated.
Students and the general public were able to debate whether and how examinations can and should sample from the curricula.
Chamberlain from AQA (2010) conducted qualitative research to follow up Ipsos MORI's (2009) work. Chamberlain collected data via ten focus groups, with samples of job-seekers, employees, employers, students for a Postgraduate Certificate in Education (PGCE), and primary and secondary teachers (74 participants in total; 28 male and 46 female). Like Ipsos MORI, Chamberlain designed her research with the assumption that she would have to take steps to mitigate participants' lack of knowledge of key elements of the reliability concept. Chamberlain used vignettes as a technique to introduce reliability to her research participants. The vignettes were very short stories or scenarios involving fictional characters in specific dilemmas which were related to the research context and relevant to the lives and educational experiences of the participants. Main findings from the study were as follows (see Chamberlain, 2010):
With the exception of the secondary school teachers, the participants had limited awareness of the concept of reliability. Participants were able to recognise forms of human error in the assessment process but often failed to envisage how this might impact on the reliability of their assessment outcomes.
The participants struggled to see how measurement inaccuracy (Newton, 2005) could be termed ‘assessment error’ and how it could impact on the reliability of outcomes. Instead, they suggested that measurement inaccuracy was an inevitable part of life, and that to draw attention to its impact on assessment outcomes would not be beneficial.
The participants had rarely questioned the reliability of the assessment process or their assessment outcomes, and showed a significant amount of trust in the system to award them the ‘right’ outcomes. Some participants had experiences of re-marks or appeals. This appeared to make them more questioning of the accuracy of their results than other participants, but seemed to do little to undermine their trust in the assessment system as a whole. The secondary
Ofqual 2011 33
The Reliability Programme: Final report
school teachers spoke extensively about their experiences of challenging students’ results, and demonstrated their awareness of how errors could occur.
Participants tended to trust examiners to assess their work fairly, believing that examiners are professional and well-trained subject experts. The participants could recognise, however, that some subjects require more interpretation than others, and thus that the reliability of marking could be variable. The secondary school teachers tended to be less trusting – many acted as moderators themselves in order to mediate the influence of external examiners, and to gain a better understanding of assessment criteria to pass on to their students.
On the whole, the participants suggested that they would like to be more informed about assessment reliability, but only through a better understanding of how the assessment process works i.e. knowing what happens to a candidate’s script after the candidate has completed the examination. There was a notable lack of support for any quantification of reliability and, in particular, publishing a reliability statistic alongside a candidate’s grade. The secondary school teachers were particularly emphatic that any initiative to enhance understanding of reliability should begin with teachers and students, and not with parents or the public at large.
Results from the research indicated that reliability is a difficult concept to comprehend. The author suggested that ’a qualitative approach to reliability that focuses on students and teachers may be a possible way forward in enhancing the dissemination of reliability information‘ (Chamberlain, 2010, page 3).
Ofqual also held a workshop at the UK Youth Parliament (UKYP) Annual Conference with secondary school students to gauge their knowledge and views on the reliability of examination results and the examination system in general. Various views were expressed by the students regarding the importance of achieving high examination results, confidence in receiving the right grades, factors that would result in a wrong grade being given and actions to take, and ways to improve reliability of examination results.
Quantitative investigation of public perceptions of reliability
The qualitative investigations of stakeholders' perspectives into reliability discussed previously had elements that sought to 'teach' participants about reliability. The Ipsos Mori (2009) research used a workshop format with a substantial initial input and the Chamberlain (2010) research used vignettes as part of a focus group approach. This might have helped the participants to understand the concept of reliability and the factors that could introduce uncertainty in examination scores, and develop views on measurement error. The group discussions could also have influenced the opinions of the participants about error in examination results. Furthermore, the small sample size of these studies makes it inappropriate to make any generalisation of the
Ofqual 2011 34

The Reliability Programme: Final report
findings. The Ipsos MORI (2010) survey only addressed some narrow aspects of reliability of examination results. The research by He et al. (2010) sought to contribute further to a developing understanding of attitudes to reliability and unreliability using an objective online questionnaire survey. The questionnaire was structured into five distinctive topics to measure different aspects of respondents’ knowledge of and attitudes towards unreliability in examination results:
Topic A: Knowledge of and experience in the examination process and confidence in the national examinations system
Topic B: Understanding of factors that affect the performances of students on examinations and factors that introduce uncertainty into examination scores
Topic C: Attitudes towards different types of assessment error (including human mistakes and measurement inaccuracy)
Topic D: Approaches for improving reliability
Topic E: Approaches to trust in general.
Representative respondents were sampled from three key stakeholder groups: A level teachers, A level students aged 16–18, and employers. The achieved sample sizes were 314 for teachers, 358 for students and 210 for employers. Data collected was also analysed to investigate:
how attitudes to unreliability are related to knowledge and understanding of the reliability concept
how attitudes to unreliability are related to confidence and belief in the examination system and approaches to trust
how confidence and belief in the examination system are related to trust.
Main findings from the study are as follows.
There was substantial variability in the understanding of reliability concepts and attitudes to unreliability in examination results among the respondents, both within group and between groups.
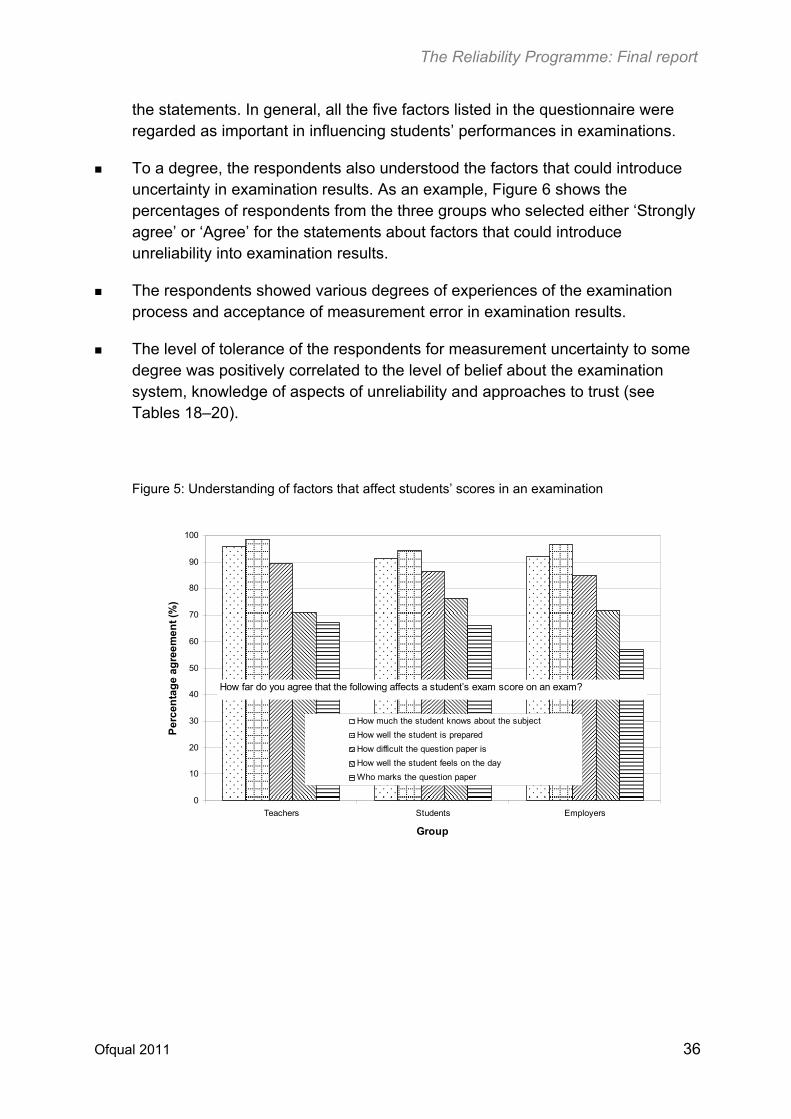
The majority of the respondents from the three groups appeared to understand the assessment process and the factors that affect students’ performances in examinations. As an example, Figure 5 shows the percentages of respondents from the three groups who selected either ‘Strongly agree’ or ‘Agree’ for the five statements about factors that could influence a student’s score on an examination. All groups showed a similar pattern in the level of endorsement for
Ofqual 2011 35
The Reliability Programme: Final report
the statements. In general, all the five factors listed in the questionnaire were regarded as important in influencing students’ performances in examinations.
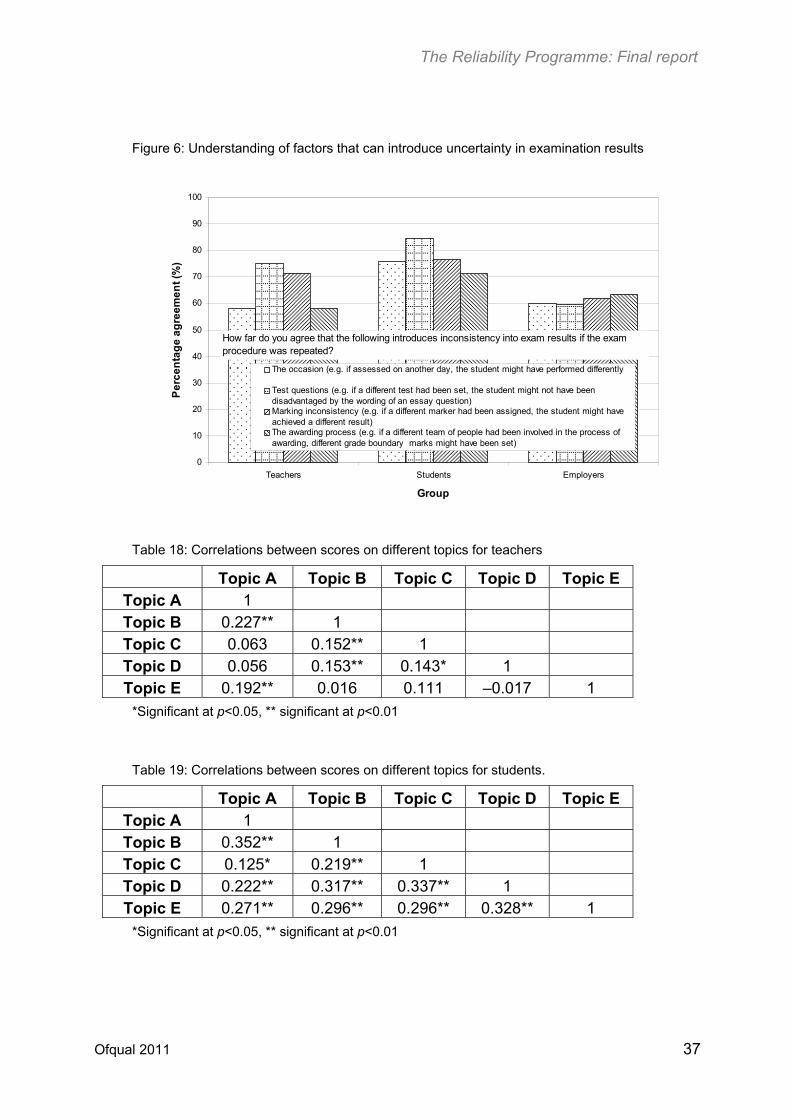
To a degree, the respondents also understood the factors that could introduce uncertainty in examination results. As an example, Figure 6 shows the percentages of respondents from the three groups who selected either ‘Strongly agree’ or ‘Agree’ for the statements about factors that could introduce unreliability into examination results.
The respondents showed various degrees of experiences of the examination process and acceptance of measurement error in examination results.
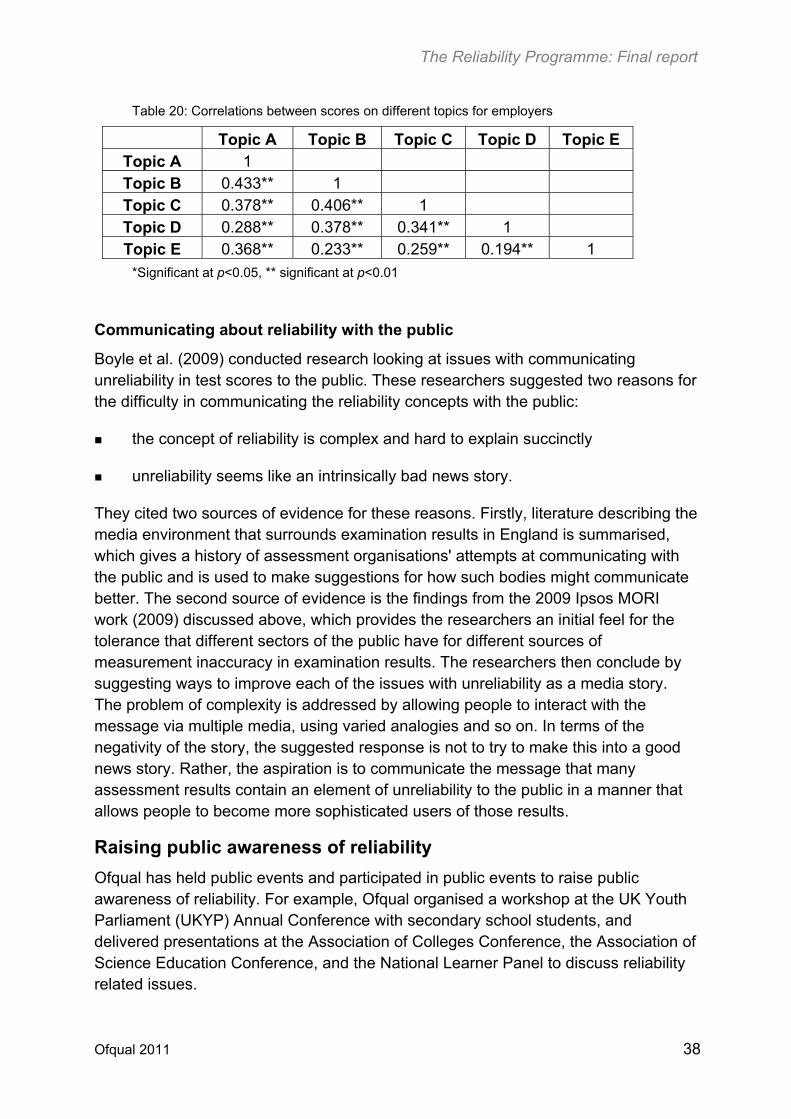
The level of tolerance of the respondents for measurement uncertainty to some degree was positively correlated to the level of belief about the examination system, knowledge of aspects of unreliability and approaches to trust (see Tables 18–20).
Figure 5: Understanding of factors that affect students’ scores in an examination
0
10
20
30
40
50
60
70
80
90
100
Teachers Students Employers
Group
Pe
rce
nta
ge
ag
ree
me
nt
(%)
How much the student knows about the subject
How well the student is prepared
How difficult the question paper is
How well the student feels on the day
Who marks the question paper
How far do you agree that the following affects a student’s exam score on an exam?
Ofqual 2011 36
The Reliability Programme: Final report
Figure 6: Understanding of factors that can introduce uncertainty in examination results
0
10
20
30
40
50
60
70
80
90
100
Teachers Students Employers
Group
Pe
rce
nta
ge
ag
ree
me
nt
(%)
The occasion (e.g. if assessed on another day, the student might have performed differently
Test questions (e.g. if a different test had been set, the student might not have beendisadvantaged by the wording of an essay question)Marking inconsistency (e.g. if a different marker had been assigned, the student might haveachieved a different result)The awarding process (e.g. if a different team of people had been involved in the process ofawarding, different grade boundary marks might have been set)
How far do you agree that the following introduces inconsistency into exam results if the exam procedure was repeated?
Table 18: Correlations between scores on different topics for teachers
Topic A Topic B Topic C Topic D Topic E Topic A 1 Topic B 0.227** 1 Topic C 0.063 0.152** 1 Topic D 0.056 0.153** 0.143* 1 Topic E 0.192** 0.016 0.111 –0.017 1
*Significant at p<0.05, ** significant at p<0.01
Table 19: Correlations between scores on different topics for students.
Topic A Topic B Topic C Topic D Topic E Topic A 1 Topic B 0.352** 1 Topic C 0.125* 0.219** 1 Topic D 0.222** 0.317** 0.337** 1 Topic E 0.271** 0.296** 0.296** 0.328** 1
*Significant at p<0.05, ** significant at p<0.01
Ofqual 2011 37
The Reliability Programme: Final report
Table 20: Correlations between scores on different topics for employers
Topic A Topic B Topic C Topic D Topic E Topic A 1 Topic B 0.433** 1 Topic C 0.378** 0.406** 1 Topic D 0.288** 0.378** 0.341** 1 Topic E 0.368** 0.233** 0.259** 0.194** 1
*Significant at p<0.05, ** significant at p<0.01
Communicating about reliability with the public
Boyle et al. (2009) conducted research looking at issues with communicating unreliability in test scores to the public. These researchers suggested two reasons for the difficulty in communicating the reliability concepts with the public:
the concept of reliability is complex and hard to explain succinctly
unreliability seems like an intrinsically bad news story.
They cited two sources of evidence for these reasons. Firstly, literature describing the media environment that surrounds examination results in England is summarised, which gives a history of assessment organisations' attempts at communicating with the public and is used to make suggestions for how such bodies might communicate better. The second source of evidence is the findings from the 2009 Ipsos MORI work (2009) discussed above, which provides the researchers an initial feel for the tolerance that different sectors of the public have for different sources of measurement inaccuracy in examination results. The researchers then conclude by suggesting ways to improve each of the issues with unreliability as a media story. The problem of complexity is addressed by allowing people to interact with the message via multiple media, using varied analogies and so on. In terms of the negativity of the story, the suggested response is not to try to make this into a good news story. Rather, the aspiration is to communicate the message that many assessment results contain an element of unreliability to the public in a manner that allows people to become more sophisticated users of those results.
Raising public awareness of reliability
Ofqual has held public events and participated in public events to raise public awareness of reliability. For example, Ofqual organised a workshop at the UK Youth Parliament (UKYP) Annual Conference with secondary school students, and delivered presentations at the Association of Colleges Conference, the Association of Science Education Conference, and the National Learner Panel to discuss reliability related issues.
Ofqual 2011 38

The Reliability Programme: Final report
Ofqual reliability seminars
Interpretation and communication of reliability evidence
One of the objectives of the Reliability Programme is to investigate how reliability evidence should be best produced, interpreted, evaluated and communicated to the users of assessment results. In addition to commissioning the various research projects that looked at aspects of assessment reliability, Ofqual also held a seminar on 7th October, 2009 at the University of Warwick, involving leading assessment experts and communications experts to discuss these issues (see Ofqual, 2009).
The discussions at the seminar focused on the following major topics:
factors that affect the reliability of results from assessments
definition and meaning of different forms of reliability
theories and models that are used to study reliability
statistical methods that are used to produce reliability estimates
discussion on the empirical evidence of reliability from case studies
representing and reporting assessment results and reliability estimates / measurement errors
improving reliability and implications
disseminating reliability statistics
educating the public to understand reliability concepts.
There was suggestion at the seminar that factors that could affect the reliability of assessment results and the way they interact with each other should be investigated. There was debate about the meaning of the term ‘reliability’ as to whether factors that the awarding organisations have little control over should be included, and views on this were divided. There was also debate about the different statistical methods that are used to produce reliability estimates and the impact such estimates would have on level or grade misclassification for National Curriculum assessments and general qualifications. Results from both simulation investigations and empirical studies were presented at the seminar and the differences in results between the various methods were discussed. There was discussion on how the different reliability indices could be affected by the use of different score scales used for reporting assessment results.
There was strong agreement on the importance of being more open with the public about the factors that can affect the accuracy of assessment results. How likely was it that a candidate would have got the same grade on a different paper with different
Ofqual 2011 39

The Reliability Programme: Final report
questions? How likely was it that the student would have been awarded different grades if marked by a different examiner? How many candidates would have been affected, up or down a grade or level, by an adjustment to the cut-off point? Did all the questions contribute evenly to the overall purpose of the assessment or were some of them more random and should therefore have been given less importance? Did the test measure the performance of those at the top as accurately as those in the middle? Delegates agreed that these were all aspects that should be discussed, whether or not they are included in any stricter definition of ‘reliability’.
The participants realised the importance of a high level of reliability in assessment results. However, there was a balance that must be reached between improving reliability and the impacts on students in terms of what is to be measured, and assessment providers in terms of financial costs. Also, it was agreed that increasing reliability should not compromise validity.
It was realised that there was a need to educate the users of assessment results to understand the concept of reliability and the existence of inevitable measurement uncertainty in results from assessment systems.
Classification accuracy in Key Stage 2 National Curriculum tests
The seminar held on 8th November, 2010 at the Institute of Education in London and attended by a group of assessment researchers from academic and research institutions, awarding organisations, test development agencies, and Ofqual, was intended specifically to gain a further understanding of the reliability of current Key Stage 2 National Curriculum tests based on analyses of live test data collected from the 2009 and 2010 series (see previous discussions). The seminar discussed a range of topics, including:
different conceptions of assessment validity and threats to validity, including construct-irrelevant variance and construct under-representation
the relationship between reliability and validity: reliability should be viewed as one aspect of validity
the implications of inferences to be made from assessment outcomes for the operational definition of reliability and the choice of reliability indices to assist data interpretation. For example, where assessment results are reported using scores, the use of standard error of measurement would be appropriate; where results are reported using performance categories such as the National Curriculum levels used for National Curriculum assessments, and grades used for GCSEs and GCEs, the use of classification accuracy would be appropriate. Classification accuracy refers to the degree that both true scores and observed scores on a test classify test-takers into the same performance categories
Ofqual 2011 40
The Reliability Programme: Final report
conceptualising and interpreting reliability in the context of National Curriculum tests in England
factors affecting classification accuracy in test results in general
impact of different methods used for estimation on classification accuracy measures
current classification accuracy or misclassification (which refers to the degree to which true scores and observed scores classify test-takers into different performance categories) in results from the Key Stage 2 National Curriculum tests in science, mathematics and English
ways to improve reliability and assessment quality in general.
The seminar also discussed factors that can affect classification accuracy, including:
the measurement precision (SEM) or test reliability (which is generally used to estimate SEM for CTT); other things being equal, higher measurement precision will result in higher classification accuracy or a lower rate of misclassification
score range and distribution
number of performance categories that are used and the boundary locations of the categories; other things being equal, higher number of performance categories will result in lower classification accuracy
models that are used and the methods that are used to estimate model parameters. Different models and model parameters could produce different true score distributions or expected observed score distributions, which will affect the classification accuracy.
It was noticed that all classification accuracy indices are estimates, based on certain mathematical models which inevitably make various assumptions about test scores. In many situations, the degree to which the model assumptions are met by the test data is difficult to evaluate. Although it is likely that the extent to which the real test data meet the assumptions of the models varies between the different methods, the classification accuracy values estimated from the different methods for the tests studied are broadly similar, which may suggest that the models represent the test data reasonably well.
It was also noticed that the classfication accuracy estimates are slightly different for the three subjects for the past two years, with mathematics having the highest accuracy. These differences to a certain degree reflect the difference in the nature of tasks assessed by the different subjects and the reliability in marking the test papers.
Ofqual 2011 41

The Reliability Programme: Final report
While for mathematics and science, answers can be reasonably objectively marked, in English, particularly the writing component, answers are subject to potentially substantial human subjective judgement. Therefore, inconsistency in marking between markers would be expected to be higher for the English tests than for the mathematics and science tests, although procedures such as the development of a clear mark scheme and proper marker training have been adopted to improve marking reliability. It is also noticed that for all the three subjects, the standard error of measurement was estimated using Cronbach’s alpha. For the mathematics and science tests, Cronbach’s alpha may be assumed to be a good approximation of the test reliability, but the degree to which it also captures marking unreliability for the English tests is not entirely clear. Further work on the effect of marking unreliability on Cronbach’s alpha would be required.
It was realised that although efforts should be made to improve assessment reliability, some degree of unreliability in test scores or inaccuracy in classifications is inevitable in any educational assessment, including the Key Stage 2 National Curriculum tests. This is because variables in the assessment process affecting test scores cannot be completely eliminated. For example, the Key Stage 2 National Curriculum tests only sample contents and skills from across the whole of the Key Stage 2 National Curriculum programmes of study, covering different areas in different years, which inevitably results in differences between the tests. Assessments use tasks of different formats to assess different types of knowledge and skills so that valid inference can be made from assessment results. Some tasks can be marked more consistently than others. Improving test reliability should not compromise test validity.
It was noticed that both the reliability coefficient and the classification accuracy index are estimates of population parameters, and that they should be interpreted that way. The probability that a particular examinee is misclassified clearly depends on the position of his / her test score on the score scale. Examinees on or near the level boundary marks are more likely to be misclassified than those further away.
Reliability policy and its implications for awarding organisations
Ofqual held a seminar on 27th January, 2010 at the University of Warwick to discuss findings from some of the commissioned research projects, the implications of the findings for the development of regulatory policy on reliability, and the impact of such policy on assessment providers. Participants of the seminar included assessment researchers from academic and research institutions, awarding organisations and test agencies, the QCDA and Ofqual. The seminar involved presentations from researchers, followed by group and plenary discussions.
The presentations covered a range of areas related to assessment reliability, including:
Ofqual 2011 42
The Reliability Programme: Final report
the identification of factors that influence the reliability of results
the review of measurement theories and models that are used to study the reliability of assessment results
the review of techniques that are used to produce and interpret reliability measures and their limitations
the investigation of methods that are used to study the reliability of results for different forms of assessment
international approaches to representing and communicating assessment results and associated errors to the users.
Ofqual presented potential reliability policy alternatives and discussed the advantages and disadvantages of the different options (see later discussions).
The group and plenary discussions focused on the following topics:
tension in managing public confidence while exploring and improving reliability
operational issues for awarding organisations in producing reliability information
particular challenges posed by the Reliability Programme in vocational qualifications.
Areas discussed at the seminar included:
which reliability measures should be reported and how they should be published:
ways to represent results
ways to represent measurement errors
ways to communicate reliability measures to the public.
Constraints on reporting reliability measures:
human resources: the requirement of the necessary technical expertise
financial resources: the requirement of necessary financial costs. This is especially important for small assessment providers
operational difficulties: these would include the collection of the necessary data for producing reliability measures. Qualifications sharing components or units face particular challenges for producing qualification level
Ofqual 2011 43

The Reliability Programme: Final report
reliabilities, as data for shared components / units are difficult to collect (for example, qualifications supported by the Qualifications and Credit Framework [QCF] may contain shared units). It is also difficult to conduct reliability studies for some components or units (for example, teacher assessments and competence-based assessments in vocational qualifications). Some qualifications have small candidate entries and could be difficult and expensive to produce reliability measures.
Issues with improving reliability:
reliability only represents one aspect of the quality of an assessment
financial implications
implications for technical expertise
validity issues: improving reliability should not comprise the validity of the assessment results.
Reliability and qualification structure: component reliabilities and the overall qualification level reliability to a certain extent are affected by the structure of the qualification (for example, item types and testing time or length, and number of components / units in a qualification). Awarding organisations, QCDA, Ofqual and other regulators need to work together when designing new assessment specifications.
Education of the public to understand the concept of reliability:
the reason why understanding measurement precision is important
how reliability measures should be interpreted.
One representative gave a presentation on an awarding organisation's perspective of Ofqual's policy on reliability. The presentation and the discussions that followed covered a range of aspects related to the reliability of assessment results, including:
what examinations leading to qualifications are trying to measure
sources of error under the framework of classical test theory
what counts as, and should be reported as, reliability
what practical and affordable research can be done to better understand the relative importance of the sources of error in a general sense
routine reporting and related issues:
Ofqual 2011 44
The Reliability Programme: Final report
purposes of reporting reliability information
what is practical and affordable routinely
unintended consequences
reporting strategy: start general at system level and move towards specific qualifications as understanding grows.
Views on preliminary recommendations from TAG
Ofqual held a seminar on 6th October, 2010 at the University of Warwick, to discuss some of the preliminary recommendations from the Technical Advisory Group which may be considered when developing reliability policy (see later sections). Again, participants included assessment researchers from academic and research institutions, awarding organisations and test development agencies, QCDA and Ofqual. A range of views were expressed on various aspects of the recommendations at the seminar, as follows.
Reliability studies should be used by the awarding organisations to improve the reliability of components or qualifications.
The difficulty in calculating qualification level reliability from component reliabilities in terms of data availability and expertise required (for example, QCF qualifications with shared units) should be recognised.
The meanings of technical terms should be defined clearly and precisely.
There is a need to characterise different types of reliability.
In view of the limited knowledge on reliability the public have, the regulator should collect reliability information to assure the public that the reliability of qualifications is regulated by the regulator to ensure assessment quality.
Should reliability information be published by the awarding organisations themselves or through the regulator?
If reliability information is to be published for wide public access, considerations should be given to the following issues:
Who are the primary intended audiences?
What do the public know and understand about reliability?
What is the question that the public want answered?
What are the public going to do with reliability information?
Ofqual 2011 45
The Reliability Programme: Final report
What is the best way to engage with the public?
What is the best way to ensure that reliability information is used and interpreted appropriately?
Would publishing reliability information result in competition for market share between awarding organisations and lead to awarding organisations trying to improve reliability at the expense of validity?
Reliability should be borne in mind at the design stage of developing a qualification.
It is necessary to take a holistic view of the quality of the whole assessment process, not just reliability.
In the case of workplace-based assessments, naturally occurring data should be used for reliability investigations to ensure validity.
Views on reporting reliability information from an international perspective
Ofqual held a joint discussion group with NFER at the 2009 AEA-Europe Annual Conference to gather views on representing and reporting reliability information from an international perspective. The discussions focused on the following topics:
What do users of outcomes want?
What are the main issues in reporting and using results and associated errors?
Is it important to report measurement error in results?
What is the best practice in representing and reporting results?
What is the best practice in representing and reporting measurement error?
Views expressed by participants included:
reliability studies should be built into the assessment quality assurance process
information on reliability (or misclassification or measurement error) should be in the public domain
the introduction of information about reliability (particularly misclassification or measurement error) should be managed carefully to ensure that the public have confidence in the assessment system
education of the public to understand the concept of reliability or measurement error is seen to play an important part to alleviate the problem of misinterpretations of measurement error by the media
Ofqual 2011 46

The Reliability Programme: Final report
the reporting of results and measurement errors can be complex since results are normally used by multiple users, each of whom may have different requirements
reliability indices should be reported at population level
standard error of measurement should be reported at individual test-taker level.
Technical Advisory Group report
The Technical Advisory Group has produced a report which provides an intuitive introduction to the concept of reliability and validity and an explanation of the importance of understanding reliability in assessment (see Baird et al., 2011). The report also provides an in-depth account of the different forms of reliability in the context of the assessments operating in England, including:
markers – rater reliability
tests – internal reliability
equivalent forms reliability
standard-setting reliability.
The report also discusses the techniques that are used to produce and interpret reliability estimates, and the issues and challenges associated with the conceptualisation and operationalisation of reliability in:
teacher-based assessments
vocational qualifications, particularly workplace based assessments.
Recommendations to Ofqual
The Technical Advisory Group has made a series of recommendations for Ofqual to consider when developing regulatory policies on reliability. These include:
Recommendation 1: Ofqual should outline the primary purpose of each qualification and Ofqual should regulate against that purpose.
Recommendation 2: A body of data should be collected by Ofqual on the reliability of a range of assessment types.
Recommendation 3: Where possible, reliability statistics for the qualification as a whole should be produced because information at this level is important for assessment users.
Ofqual 2011 47

The Reliability Programme: Final report
Recommendation 4: Awarding bodies should document the reliability of their assessments using the checklist for reliability claims (Figure 7).
Recommendation 5: At a minimum, the standard error of measurement should be produced to indicate inter-rater reliability for assessments regulated by Ofqual.
Recommendation 6: At a minimum, a lower bound internal reliability index should be produced for each assessment. An equivalent-forms index would be preferable, where it is possible to produce it.
Recommendation 7: Ofqual should gather evidence of equivalent forms reliability for a range of qualifications, since this is the most comprehensive measure of assessment reliability. This may require a designed experiment and the findings will indicate whether the three sources of unreliability included in a coefficient of equivalence are large enough to invalidate the likely uses of the test.
Recommendation 8: As part of Ofqual’s qualification accreditation process, awarding organisations should be required to demonstrate adequate levels of equivalent forms reliability. Sources of unwanted variation could result from aspects of the design that are not controlled by the awarding organisation or Ofqual, but technical information can then inform the discussion with other parts of the system, such as the Department for Education.
Recommendation 9: Statistics on the reliability of teacher assessment should be produced by awarding bodies.
Recommendation 10: Greater consistency and control of assessment formats in workplace assessments should be required by Ofqual for new assessments, unless a rationale can be produced by awarding organisations for the validity and reliability of less well controlled assessments.
Recommendation 11: Ofqual should require all examining bodies to document and publish their standard setting practices, so that regulation of standard setting reliability is more transparent in all sectors.
Specifically, Recommendation 4 above, which is articulated further in detail in Figure 7 below, sets the framework for conducting reliability studies to generate evidence to support reliability claims. The framework takes into account of the complex structure of assessments currently being used in England and the many factors that can introduce inconsistency in examination results when the assessment procedure is replicated. For example, a qualification can have a number of components / units, different components may contain tasks of different format, and components can be assessed internally or externally, marked on paper or on-screen and by computers or by humans. The checklist can be used as a basis for developing argument for any reliability claims.
Ofqual 2011 48

The Reliability Programme: Final report
Figure 7: Checklist for reporting reliability claims (from Baird et al., 2011)
Areas for further work
The group has identified areas where further work would be needed:
further evidence on inter-rater reliability for a wide range of assessments
the use of a variety of reliability indices for different types of assessments
evidence of equivalent forms reliability at both component / unit and qualification levels for a range of assessments
teacher assessment reliability
the impact of awarding procedures on the reliability of standard setting.
Ofqual 2011 49
The Reliability Programme: Final report
Policy Advisory Group report
The final report from the Policy Advisory Report summarised the work that has been done on Strand 3 of the programme and made suggestions for areas where further work is needed (see Burslem, 2011). The report also outlines recommendations for how Ofqual should carry forward its work on assessment reliability.
Communicating reliability evidence and improving public understanding
Stakeholder perspectives on reliability
The group realised that one of the problems that makes it difficult for the public to understand the concept of reliability is that the technical meanings of the words such as ’reliability / reliable‘ and ’error‘ in the context of education assessment are different from their meanings in daily use. Although the daily use of ’reliability‘ is generally associated with the idea of consistency of occurrence of the same event, it is constantly implied as an ’either / or’ concept. However, different levels of reliability can exist in results from educational assessments. The word ’error’ in its daily use is constantly associated with human mistakes, while its technical meaning in educational measurement implies deviation of scores on a test from some notional number when the measurement procedure is repeated. The fact that most candidates only take the same examination once might also make it difficult to associate examination results with the concept of reliability.
Ways of understanding and communicating reliability evidence
The group recognised that the reliability concept is difficult for the public to comprehend. Although there is ample literature on the themes of reliability, most of it is quite technical. Education was seen to be the key for the public to understand reliability concepts in the context of educational assessment. The use of plain language and examples to explain the assessment process, the meaning of technical terms, the factors that affect test scores and factors that introduce inconsistency in test scores would be useful. The use of analogies from other disciplines, such as medical diagnosis, might also be useful.
Handling media stories
The group realised that the publication of the reports commissioned under the Reliability Programme has drawn some negative headlines from the media, involving misinterpretation, misrepresentation or inappropriate communication of reliability statistics, which could undermine public confidence in the assessment system rather than generate debate about reliability, although some of the headlines generated were also a natural reaction from the media. Whilst it was realised that the media always want to generate headlines that are interesting to their audience, Ofqual needs to develop a media handling strategy to alleviate the impact from such
Ofqual 2011 50

The Reliability Programme: Final report
negative headlines on public confidence. This would include explaining the purposes of the Reliability Programme, making technical terms plain so that the general public can understand easily, setting an appropriate context for interpreting findings from the research, and expressing Ofqual’s views.
It was generally agreed that some further explanations of the results that are being reported would be required. Particularly, the context within which the reliability information is interpreted should be clearly set in plain language, since what technical experts may know, the less well-informed general public may not. It was realised that some sentences from a report might be picked up and used by the media as negative headlines. It was suggested that reports could be reviewed by someone outside Ofqual before publication to identify places where potential negative headlines may lie. Educating the media about reliability might also be required.
Ways of improving public understanding of reliability and increasing public confidence
There was a consensus that since the general public has only limited knowledge about reliability, engaging with the public and education would be the key to improving public understanding of reliability concepts. This may be a long-term process and could involve the following approaches.
Explaining technical terms using layperson language so that the public can understand. There is too much packed into the terms such as assessment, measurement, reliability and the associated various indices (Cronbach’s alpha coefficient, standard error of measurement, classification accuracy, and so on), random error, system error, human error, and others. These need to be unpacked for the general public to comprehend.
Enabling the public to understand the assessment process.
Enabling the public to understand the many factors that can influence the performance of a test-taker on a test and consistency of test scores under repeated measurements. These factors would include the particular question paper that the test-taker took on the day of the examination, the particular day of the examination and the particular examiner who happened to mark the script, in addition to the test-taker’s actual ability in the subject area being tested. Variability in some of the factors will inevitably exist and is intrinsic to any assessment system when the measurement procedure is repeated and this will result in inconsistency of test scores, although the degree of such variability may be reduced to some degree.
Enabling the public to understand that some level of inconsistency in test or examination scores from repeated measurements is inevitable and will vary from assessment / subject to assessment / subject. This is because the level of
Ofqual 2011 51

The Reliability Programme: Final report
control on the factors that can introduce inconsistency in test scores varies between assessments / subjects. As tests and examinations normally sample contents and skills from the entire curricula, different areas will be covered in different tests or examinations. Assessments use tasks of different formats to assess different types of knowledge and skills to ensure validity, and some tasks can be marked more consistently than others. Although awarding organisations try to improve assessment reliability as much as they can (for example through improving quality of question papers and marker training), there are however certain limitations on what can be done to improve reliability. It is certainly important to continue to explore ways of improving test reliability but this must be done with regard to other important factors such as validity and manageability.
Helping the public to make sensible interpretations of reliability evidence, which would involve clearly setting the context for interpretation and explaining the meaning of the numbers associated with reliability indices. For example, it would be helpful to explain what it is meant by Cronbach’s alpha being 0.90 or classification accuracy being 95% for outcomes from a specific assessment and how these figures would change for different populations, different assessments, and different grading systems. It would also be useful to make it clear that most reliability indices are for a group of candidates, not for individuals.
To increase public confidence in the examinations system, Ofqual needs to make clear that:
what Ofqual does is to ensure the quality of the assessments and qualifications it regulates and to safeguard learners’ interests
reliability is a complicated abstract concept, and reliability measure is only one indicator of the quality of an assessment. Reliability can vary from assessment to assessment. Interpretation of reliability measures requires an understanding of the concept of reliability and the nature of the assessment
the Reliability Programme aims to gain a better understanding of the reliability of results from assessments in England in order to improve the quality of the qualifications systems further
Ofqual ensures that awarding organisations have appropriate procedures in place to ensure assessment reliability.
Implications of findings from the Reliability Programme
Findings from the programme have provided important information on the reliability of results from a range of assessments and how reliability is understood by both assessment professionals and the general public. This has put Ofqual in a position to
Ofqual 2011 52
The Reliability Programme: Final report
develop regulatory policy on reliability for the assessments it regulates in order to improve their quality further, and to develop approaches for improving public understanding of reliability and increasing public confidence in the national qualifications system.
Recommendations to Ofqual
Based on analyses of the results from the programme and recommendations made by TAG, the group proposed the following recommendations to Ofqual.
Continue work on reliability. Although the group realised that substantial progress has been made by the programme, further work would be needed. Work in the area of teacher assessment, workplace-based assessment, construct validity of assessment would be of particularly interest and importance.
Publish reliability reports commissioned. The various reports produced under the programme represent a very useful resource for a range of audiences, including researchers from academic institutions and awarding organisations, policy-makers and educational practitioners.
Encourage awarding organisations to generate and publish reliability data.
Set up a programme to improve public understanding of reliability and increase public confidence in the examinations system, by working with the awarding organisations to:
make technical terms plain so that people can understand
enable the public to understand the assessment process
explain factors affecting assessment outcomes and factors that can introduce inconsistency in test scores
help the public to interpret reliability evidence
engage with main stakeholders, maybe starting with teachers and students in schools. Other stakeholders such as parents, employers, local education authorities and training agencies would also need to be involved
Enable the public to understand that the Reliability Programme investigates the reliability of assessment outcomes and aims to develop regulatory policy on reliability in order to improve the quality of the qualifications system further.
Ofqual 2011 53
The Reliability Programme: Final report
Further research and policy development
Reliability is an important indictor of assessment quality and a prerequisite of validity. The Ofqual Reliability Programme has made substantial progress since its initiation in late 2008 in the following areas.
Generating evidence of reliability: A substantial number of empirical studies have been undertaken to generate evidence of reliability for a selection of Key Stage 2 National Curriculum tests; a range of GCE and GCSE units, components and qualifications; and a number of vocational qualifications.
Reviewing test theories and models: The programme has produced a number of research reports that review measurement theories and models used to study reliability and techniques used to produce and interpret reliability measures under the frameworks of classical test theory, generalisability theory, and item response theory.
Interpreting and communicating reliability evidence: Views on how reliability evidence should be interpreted and communicated in the contexts of the assessments in England have been collected from both assessment professionals and other main stakeholders.
Exploring public perceptions of unreliability in examination results: A substantial amount of information about public perceptions of reliability and the examinations system as a whole has been produced through qualitative studies using workshops, focus groups and discussion groups, and quantitative studies using online questionnaire surveys.
Developing policy on reliability: Findings from the programme have been under evaluation and areas where regulation on reliability may play a role are being explored.
Further research
Although considerable work has been undertaken by the Reliability Programme, as suggested by the Technical Advisory Group and the Policy Advisory Group, further research will be needed. Particularly, the following areas need to be explored in the future.
Use of multiple reliability indices for a range of assessment types should be explored to assess the practical applications of specific estimation techniques and the differences in estimation between different techniques.
Equivalent forms reliability: There has been little evidence on equivalent forms reliability for national tests or public examinations. Empirical studies should be
Ofqual 2011 54
The Reliability Programme: Final report
Teacher assessment reliability: There has been little evidence on the reliability of teacher assessments currently in use in England. Since teacher assessments comprise an important part of most qualifications, information on teacher assessment reliability will have an important impact on the overall reliability of the qualifications.
Qualification level reliability for qualifications that share units with other qualifications or use a large number of alternative / optional units (for example, many qualifications in the QCF system): Where a qualification has a large number of optional units or shares units with others, it may be difficult to derive reliability estimates for some units and therefore the overall reliability estimate due to unavailability of the necessary data for analysis. Specific techniques will need to be developed to address this issue.
The impact of standard setting procedures on the reliability of standard setting: There has been little research on the reliability of standard setting.
Improving public understanding of reliability and increasing public confidence in the qualifications system: Publication of reliability information may potentially undermine public confidence in the examinations system due to limited public understanding of reliability concepts and misinterpretation or inappropriate communication of reliability statistics by the media. A programme will need to be established to improve public understanding and increase public confidence when exploring reliability.
Conducting the work outlined above will involve:
setting up an advisory group which will be made up of external assessment experts to advise on research priorities
setting up and carrying out Ofqual internal research projects
funding external research projects. In view of the very limited financial resources available, detailed research planning will be needed, and advice from the advisory group will be sought
external research projects requested by Ofqual and conducted by assessment providers
setting up joint research projects between Ofqual and external research organisations and / or assessment providers
Ofqual 2011 55

The Reliability Programme: Final report
organising seminars involving assessment researchers to discuss specific technical issues
engaging with wider stakeholders such as awarding organisations, examiners, teachers, parents, students, and other stakeholder groups like employers, local education authorities and training agencies to improve public understanding of reliability concepts and to increase public confidence in the examinations system. This could involve organising seminars or workshops with key stakeholders and educational journalists to explore:
understanding the importance of Ofqual’s work, including its work on reliability
explanation of some of the reliability terms and other technical terms in less technical lay-person and plain terms so that the general public can understand
ways to help the public understand the assessment process, the factors that can affect students’ performance on examinations, and the existence of variables in the assessment process that can introduce inconsistency into examination results when the assessment procedure is replicated. It is important for people to understand that reliability is related to the consistency of results when the assessment procedure is repeated. Analogies from other fields of measurement may be used.
how reliability measures should be interpreted in the context of the specific assessment concerned, taking into consideration the nature of the assessment (such as the use of specific tasks to assess specific skills in order for the results to be valid); different assessments may have different levels of reliability.
Developing Ofqual reliability policy
The recommendations made by the Technical Advisory Group and the Policy Advisory Group will be used as a basis to develop Ofqual policy on reliability. Initially, Ofqual may consider introducing the following regulatory requirements.
All awarding organisations document and publish their standard setting practices, if they have not already done so. This would make the regulation of standard setting reliability more transparent in all sectors.
Assessments (components or qualifications) comprising objective questions should report Cronbach’s alpha using the framework depicted in Figure 7.
Components comprising questions requiring human subjective judgement should report marking reliability using the framework depicted in Figure 7.
Ofqual 2011 56

The Reliability Programme: Final report
Ofqual will study the implications of the recommendations from TAG and PAG for developing policies further. Particularly, the following areas will be explored:
improving public understanding of reliability and increasing public confidence in the examinations system
the use of reliability studies as part of the assessment quality assurance process
the use of standardised procedures for marking assessments
the use of standardised procedures for producing reliability measures (including underlying assumptions and limitations, and interpretations)
the use of standardised procedures for reporting examination results and associated errors (including interpretations)
setting reliability standards and monitoring the reliability of assessments and qualifications
the requirement of both reliability and validity evidence for accreditation of new qualifications.
References
American Educational Research Association (AERA), American Psychological Association (APA) and National Council on Measurement in Education (NCME) (1999) Standards for Educational and Psychological Testing. Washington, DC. AERA.
Baird, J., Black, P., Bèguin, A., Pollitt, A. and Stanley, G. (2011) The Reliability Programme: Final report of the Technical Advisory Group. Coventry, UK, Ofqual. Available online at: www.ofqual.gov.uk/research-and-statistics/research-reports/92-articles/20-reliability.
Black, P. and Wiliam, D. (2005) ‘Lessons from around the world: how policies, politics and cultures constrain and afford assessment practices’. The Curriculum Journal, 16(2), 249–261.
Boyle, A., Opposs, D. and Kinsella, A. (2009) ‘No news is good news? Talking to the public about the reliability of assessment’. Paper presented at the 35th International Association for Educational Assessment (IAEA) Annual Conference in Brisbane, Australia, 13–18 September, 2009. Available online at: www.ofqual.gov.uk/files/2009-09-iaea-no-news-is-good-news.pdf.
Ofqual 2011 57

The Reliability Programme: Final report
Bradshaw, J. and Wheater, R. (2010) International Survey of Results Reporting. Coventry, UK, Ofqual. Available online at: www.ofqual.gov.uk/files/Ofqual_10_4705_International_Survey_of_Results_Reporting_08_03_10_(2).pdf.
Bramley, T. and Dhawan, V. (2011) Estimates of Reliability of Qualifications. Coventry, UK, Ofqual. Available online at: www.ofqual.gov.uk/research-and-statistics/research-reports/92-articles/20-reliability.
Burslem, S. (2011) The Reliability Programme: Final report of the Policy Advisory Group. Coventry, UK, Ofqual. Available online at: www.ofqual.gov.uk/research-and-statistics/research-reports/92-articles/20-reliability.
Chamberlain, S. (2010) Public Perceptions of Reliability. Coventry, UK, Ofqual. Available online at: www.ofqual.gov.uk/files/Ofqual_10_4708_public_perceptions_reliability_report_08_03_10.pdf.
Harth, H. and Hemker, B. (2011) On the Reliability of Results in Vocational Assessment: the case of work-based certification. Coventry, UK, Ofqual. Available online at: www.ofqual.gov.uk/research-and-statistics/research-reports/92-articles/20-reliability.
He, Q. (2009) Estimating the Reliability of Composite Scores. Coventry, UK, Ofqual. Available online at: www.ofqual.gov.uk/files/2010-02-01-composite-reliability.pdf
He, Q. Hayes, M. and Wiliam, D. (2011) Classification Accuracy in Results from KS2 National Curriculum Tests. Coventry, UK, Ofqual. Available online at: www.ofqual.gov.uk/research-and-statistics/research-reports/92-articles/20-reliability.
He, Q., Opposs, D. and Boyle, A. (2010) A Quantitative Investigation into Public Perceptions of Reliability in Examination Results in England. Coventry, UK, Ofqual. Available online at: www.ofqual.gov.uk/files/2010-10-20-public-perceptions-of-reliability.pdf.
Hutchison, D. and Benton, T. (2009) Parallel Universes and Parallel Measures: Estimating the Reliability of Test Results. Coventry, UK, Ofqual. Available online at: www.ofqual.gov.uk/files/2010-02-01-parallel-universes-and-parallel-measures.pdf.
Johnson, S. (2011) A Focus on Teacher Assessment Reliability in GCSE and GCE. Coventry, UK, Ofqual. Available online at: www.ofqual.gov.uk/research-and-statistics/research-reports/92-articles/20-reliability.
Ofqual 2011 58

The Reliability Programme: Final report
Johnson, S. and Johnson, R. (2009) Conceptualising and Interpreting Reliability. Coventry, UK, Ofqual. Available online at: www.ofqual.gov.uk/files/2010-02-05-conceptualising-and-interpreting-reliability.pdf.
Johnson, S. and Johnson, R. (2011) Component Reliability in GCSE and GCE. Coventry, UK, Ofqual. Available online at: www.ofqual.gov.uk/research-and-statistics/research-reports/92-articles/20-reliability.
Ipsos MORI (2009) Public Perceptions of Reliability in Examinations. Coventry, UK, Ofqual. Available online at: www.ofqual.gov.uk/files/2009-05-14_public_perceptions_of_reliability.pdf.
Ipsos MORI (2010) Perceptions of A levels and GCSEs – Wave 8. Coventry, UK, Ofqual. Available online at: www.ofqual.gov.uk/files/2010-03-ofqual-perceptions-of-a-levels-and-gcses-wave-8.pdf.
Lee, W. (2010) ‘Classification consistency and accuracy for complex assessments using item response theory’. Journal of Educational Measurement 47, 1–17.
Lee, W. and Kolen, M. (2008) IRT-CLASS: A computer program for item response theory classification consistency and accuracy (Version 2.0) [Computer software]. Iowa City, IA: Center for Advanced Studies in Measurement and Assessment, University of Iowa. Available online at: www.education.uiowa.edu/casma.
Livingston, S. A., and Lewis, C. (1995) ‘Estimating the consistency and accuracy of classifications based on test scores’. Journal of Educational Measurement, 32, 179–197.
Maughan, S., Styles, B., Lin, Y. and Kirkup, C. (2009) Partial Estimates of Reliability: Reliability in the Key Stage 2 Science Tests. Coventry, UK, Ofqual. Available online at: www.ofqual.gov.uk/files/2009-11-partial-estimates-of-reliability-report.pdf.
Newton, P.E. (2005a) ‘The public understanding of measurement error’. British Education Research Journal, 31, 419–42.
Newton, P.E. (2005b) ‘Threats to professional understanding of assessment error’. Journal of Education Policy, 20, 457–83.
Newton, P.E. (2009) ‘The reliability of results from National Curriculum testing in England’. Educational Research, 51, 181–212.
Ofqual (2009) The Reliability Programme: Technical Seminar Report. Coventry, UK, Ofqual. Available online at: www.ofqual.gov.uk/files/Reliability_Programme_Technical_Seminar_Report.pdf.
Ofqual 2011 59

The Reliability Programme: Final report
Ofqual 2011 60
Opposs, D. and He, Q. (2010). The Reliability of Results from National Curriculum Assessments, Public Examinations and Qualifications: An Interim Report of the Ofqual Reliability of Results Programme. Coventry, UK, Ofqual. Available online at: www.ofqual.gov.uk/files/2010-07-26-reliability-of-results-interim-report.pdf.
Phelps, R., Zenisky, A., Hambleton, R. and Sireci, S. (2010) On the Reporting of Measurement Uncertainty and Reliability for U.S. Educational and Licensure Tests. Coventry, UK, Ofqual. Available online at: www.ofqual.gov.uk/files/10_4759-measurement-of-reliability.pdf.
Wheadon, C. and Stockford, I. (2011) Classification Accuracy and Consistency in GCSE and A level Examinations offered by the Assessment and Qualifications Alliance (AQA) November 2008 to June 2009. Coventry, UK, Ofqual. Available online at: www.ofqual.gov.uk/research-and-statistics/research-reports/92-articles/20-reliability.
Wiliam, D. (2001) ‘Reliability, validity, and all that jazz’. Education, 3–13, 29 (3), 17–21.

We wish to make our publications widely accessible. Please contact us if you have any specific accessibility requirements.
First published by the Office of Qualifications and Examinations Regulation in 2011
© Crown copyright 2011
Office of Qualifications and Examinations Regulation Spring Place 2nd Floor Coventry Business Park Glendinning House Herald Avenue 6 Murray Street Coventry CV5 6UB Belfast BT1 6DN
Telephone 0300 303 3344 Textphone 0300 303 3345 Helpline 0300 303 3346
www.ofqual.gov.uk