Embed Size (px)
Citation preview

1
1
2
3
4
5
6
Section: Training and Testing
Title: The reliability and validity of a field hockey skill test.
Running title: Reliability of a field hockey skill test.
2
Abstract 7
8 1
2
3
4
5
6
7
8
9
10
11
12
13
14
15
16
17
18
19
20
21
22
23
24
25
High test retest reliability is essential in tests used for both scientific research and to monitor
athletic performance. Thirty-nine (20 male and 19 female) well-trained university field
hockey players volunteered to participate in the study. The reliability of the
9
in house designed 10
test was determined by repeating the test (3-14 days later) following full familiarisation. The
validity was assessed by comparing coaches ranks of players with ranked performance on the
skill test.
11
12
The mean difference and confidence limits in overall skill test performance was 0.0 13
± 1.0% and the standard error (confidence limits) was 2.1% (1.7 to 2.8%). The mean 14
15 difference and confidence limits for the ‘decision making’ time was 0.0 ± 1.0% and the
16 standard error (confidence limits) was 4.5% (3.6 to 6.2%). The validity correlation (Pearson)
17 was r = 0.83 and r= 0.73 for female players and r = 0.61 and r = 0.70 for male players for
18
19
20
21
overall time and ‘decision making’ time respectively. We conclude that the field hockey skill
test is a reliable measure of skill performance and that it is valid as a predictor of coach
assessed hockey performance, but the validity is greater for female players.
Keywords: Intermittent exercise, team sports
3
Introduction 22
23
24
25
26
27
28
29
30
31
32
33
34
35
36
37
38
39
40
41
42
43
44
45
46
1
2
3
4
5
6
7
8
9
10
11
12
13
14
15
16
17
18
19
20
21
22
23
24
25
To undertake research into field hockey in a controlled setting, it is necessary to employ a
skill test that can be completed in the laboratory environment. However, there are only a
limited number of field hockey skill tests and very little has been done scientifically to
formulate tests that measure playing ability (14). Two decades later, further developments of
hockey tests had not advanced. Reilly and Borrie (10) noted that it was surprising that even
though field hockey had been part of the Physical Education curriculum in Europe and North
America since the beginning of the 20th Century, there had been little attention given to the
design of field tests for the game.
Thus, at present the number of published tests of field hockey skill is limited and no skill tests
have been published during the last fifteen years. With the advent of synthetic sportsturfs as
the major playing surface over that period, it is apparent that the skills have changed
significantly and thus there is a need to develop a skill test that is appropriate to modern field
hockey. Furthermore, the skill tests were designed to determine differences in skill
performance between players, rather than to monitor improvements or changes for a particular
player, and thus were not stringently tested for reliability.
In the formulation of a skill test, it is important that technique is differentiated from skill.
Technique is the production of some pattern of movements which are technically sound (7).
The following definition of skill will be used for the purpose of the design of this study: “Skill
is the learned ability to bring about predetermined results with the maximum certainty, often
with the minimum outlay of energy, or of time and energy,” (7). This encompasses the idea
that a skilled athlete must take an action that is appropriate and therefore the skill involves
interpreting the needs of the situation and making the correct decision as well as carrying out
4
1
2
3
4
5
6
7
8
9
10
11
12
13
14
15
16
17
18
19
20
21
22
23
24
25
47
48
49
50
51
52
53
54
55
56
57
58
59
60
61
62
63
64
65
66
67
the necessary movements. The main point here is that the cognitive component in the form of
decision making is a fundamental element of the
skill.
Over the past decade there has been an increase in the literature regarding the importance of
reliability and validity studies and the statistics that should be employed and interpreted. In
terms of reliability, it has been advocated that a number of statistical methods be cited and
interpreted (1). Reliability has been partially defined to include the “consistency of an
individual’s performance on a test” (1). It should be recognised that tests will always include
some form of measurement error and therefore reliability needs to be considered as the
amount of measurement error that has been deemed acceptable for the effective practical use
of a measurement tool. When the tool is to be used for scientific research, the acceptable level
is of paramount importance. To conclude that a measuring tool is valid, it must show logical,
construct and criterion validity (13). Logical validity means that the tool is appropriate to
want you want to measure, construct validity refers to a measuring tool that can discriminate
between standards and criterion validity refers to how well the measuring tool correlates to
previous tools used to measure the same variable (13).
The aim of this study was to design a field hockey skill test, which is both reliable and valid
for the modern game of hockey and determine the acceptable levels to make it a suitable tool
to use for research in a laboratory environment.
5
1
2
3
4
5
6
7
8
9
10
11
12
13
14
15
16
17
18
19
20
21
22
23
24
25
Materials and methods 68
69
70
71
72
73
74
75
76
77
78
79
80
81
82
83
84
85
86
87
88
89
90
91
92
Participants
Thirty-nine university hockey players volunteered to take part in the study. Twenty males and
19 females completed the validity study, whereas only 14 males and 17 females completed the
reliability of the skill test. The study had Loughborough University Ethical Committee
Approval and informed consent was obtained.
Skill Test Design
The test was designed to include numerous elements of the game of hockey, incorporating
dribbling, passing and shooting, whilst controlling as many variables as possible. For example
a field hockey rebound board was used to pass off and the surface for the test was a water-
based sportsturf (Desso), the type of surface all the players regularly play and train on. The
goal is the width of a normal field hockey goal and the target area for the skill test is 18 inches
high, which is the height of a backboard in hockey.
The objectivity of the skill test was paramount in the design and therefore participants were
only given instructions about the penalty timing system and completing the test as quickly and
as accurately as possible. No information on how to approach the test was provided. This
allowed the participants to use techniques, make decisions and react to the different elements
as they would in a game.
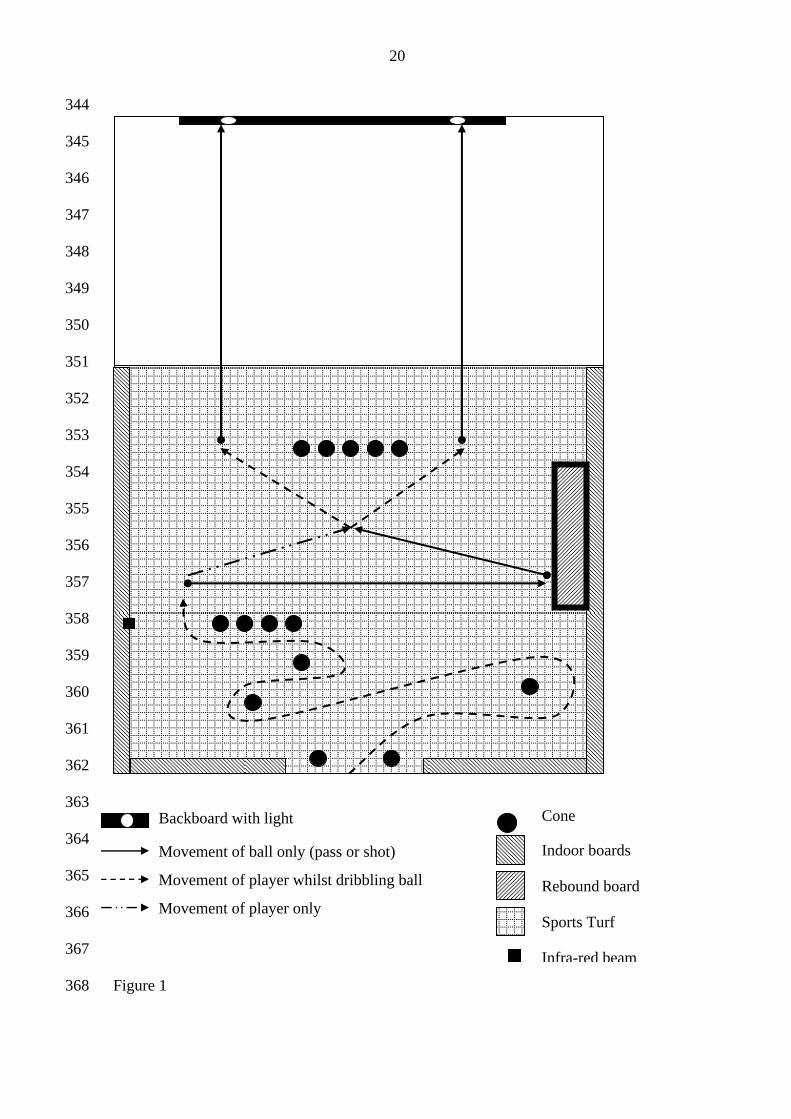
The skill test requires the participants to start from a line 16 yards from the goal. The player
then runs to a hockey ball and then dribbles round the cones in a specific sequence (Figure 1).
The completion of the dribbling phase requires the player’s foot or ball to break an infra-red
beam which triggers a light on either side of the goal and starts a computer
6
1
2
3
4
5
6
7
8
9
10
11
12
13
14
15
16
17
18
19
20
21
22
23
24
25
93
94
95
96
97
98
99
100
101
102
103
104
105
106
107
108
109
110
111
112
113
114
115
116
117
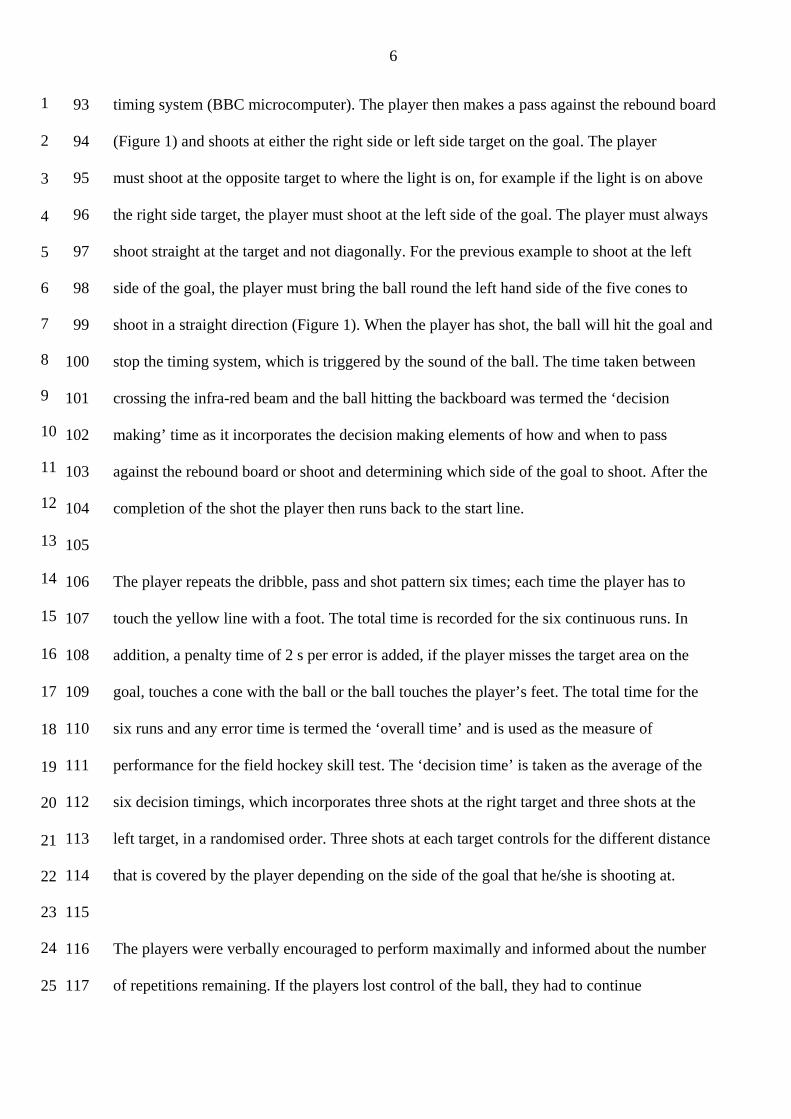
timing system (BBC microcomputer). The player then makes a pass against the rebound board
(Figure 1) and shoots at either the right side or left side target on the goal. The player
must shoot at the opposite target to where the light is on, for example if the light is on above
the right side target, the player must shoot at the left side of the goal. The player must always
shoot straight at the target and not diagonally. For the previous example to shoot at the left
side of the goal, the player must bring the ball round the left hand side of the five cones to
shoot in a straight direction (Figure 1). When the player has shot, the ball will hit the goal and
stop the timing system, which is triggered by the sound of the ball. The time taken between
crossing the infra-red beam and the ball hitting the backboard was termed the ‘decision
making’ time as it incorporates the decision making elements of how and when to pass
against the rebound board or shoot and determining which side of the goal to shoot. After the
completion of the shot the player then runs back to the start line.
The player repeats the dribble, pass and shot pattern six times; each time the player has to
touch the yellow line with a foot. The total time is recorded for the six continuous runs. In
addition, a penalty time of 2 s per error is added, if the player misses the target area on the
goal, touches a cone with the ball or the ball touches the player’s feet. The total time for the
six runs and any error time is termed the ‘overall time’ and is used as the measure of
performance for the field hockey skill test. The ‘decision time’ is taken as the average of the
six decision timings, which incorporates three shots at the right target and three shots at the
left target, in a randomised order. Three shots at each target controls for the different distance
that is covered by the player depending on the side of the goal that he/she is shooting at.
The players were verbally encouraged to perform maximally and informed about the number
of repetitions remaining. If the players lost control of the ball, they had to continue
7
from wherever the ball went in an enclosed 55.5m2 area. 1
2
3
4
5
6
7
8
9
10
11
12
13
14
15
16
17
18
19
20
21
22
23
24
25
118
119
120
121
122
123
124
125
126
Familiarisation
Subjects were familiarised with the skill test on two occasions. During the first session they
were instructed about how to complete the skill test and the timing and penalty system. They
then completed 10 repetitions of the test, resting between each repetition. The pattern was
randomised, but five shots were completed to each side of the goal. The second
familiarisation session required the subjects to perform the skill test in its entirety. Thus, they
completed the six repetitions as fast as they could, and the overall time and decision time were
recorded. The mean difference ± confidence interval for the familiarisation and first trial data 127
128
129
130
131
was -4.2 ± 2.6% and the typical error (confidence interval) was 4.8% (3.9 to 7.0%).
Reliability Trials
After being fully familiarised, 31, of the 39 subjects who completed the validity study,
completed the skill test on two occasions on separate days, 3 to 14 days apart. The subjects
were asked to refrain from vigorous exercise on the day of the skill test. To account for
circadian rhythms, the skill tests were completed at the same time of day.
132
133
134
135
136
137
138
139
140
141
142
Validity Trials
Thirty-nine subjects completed the skill test after refraining from vigorous exercise on that
day, but were not informed about their performance. The male players who completed the test
were then ranked for performance and skill on their normal game play by one international-
standard coach (coach 1) and one National League coach (coach 2). Similarly, an
international-standard coach (coach 3) and one National League coach (coach 4) ranked the
female players’ who completed the test. The coaches were provided with a definition of skill
8
143
144
145
146
147
and performance, which they could use to rank the players, so that all the coaches were
working to the same criteria. Performance was defined as overall match performance and
contribution to a match and skill defined as “the learned ability to bring about predetermined
results with the maximum certainty, often with the minimum outlay of energy, or of time and
energy,” (7). The coaches were provided with the
148
149
150
151
15
names of the players, but were not given any information about the performance of the
players on the field hockey skill test. All the coaches regularly coached and watched the
players who they ranked, so were fully aware of their abilities. The performance ranks were
compared with the overall time for the skill test, whereas the skill ranks were compared with
the decision time. 2
3
4
5
6
7
8
9
0
1
2
15
Statistical Analyses 15
15
15
15
15
15
The reproducibility of the skill test was determined using numerous statistical techniques.
These were mean difference, Bland and Altman limits of agreement, correlations and typical
error (1, 2, 5). The coaches’ ranks and skill test scores were compared using a Pearson
correlation. Data were checked for non-uniformity, so that the appropriate statistical
techniques could be employed.
16
Results 16
Reliability 16
163 The mean (± SD) for the overall performance time for trial 1 and trial 2 was 83.93 ± 6.60 and
164 84.36 ± 7.44 s for men and 96.56 ± 6.68 and 96.26 ± 6.12 s. The mean difference and
165 confidence limits in overall skill test performance was 0.0 ± 1.0% and the standard error
166 (confidence limits) was 2.1% (1.7 to 2.8%). The mean difference and confidence limits for the
1625 7
1
2
3
4
5
6
7
8
9
10
11
12
13
14
15
16
17
18
19
20
21
22
23
24
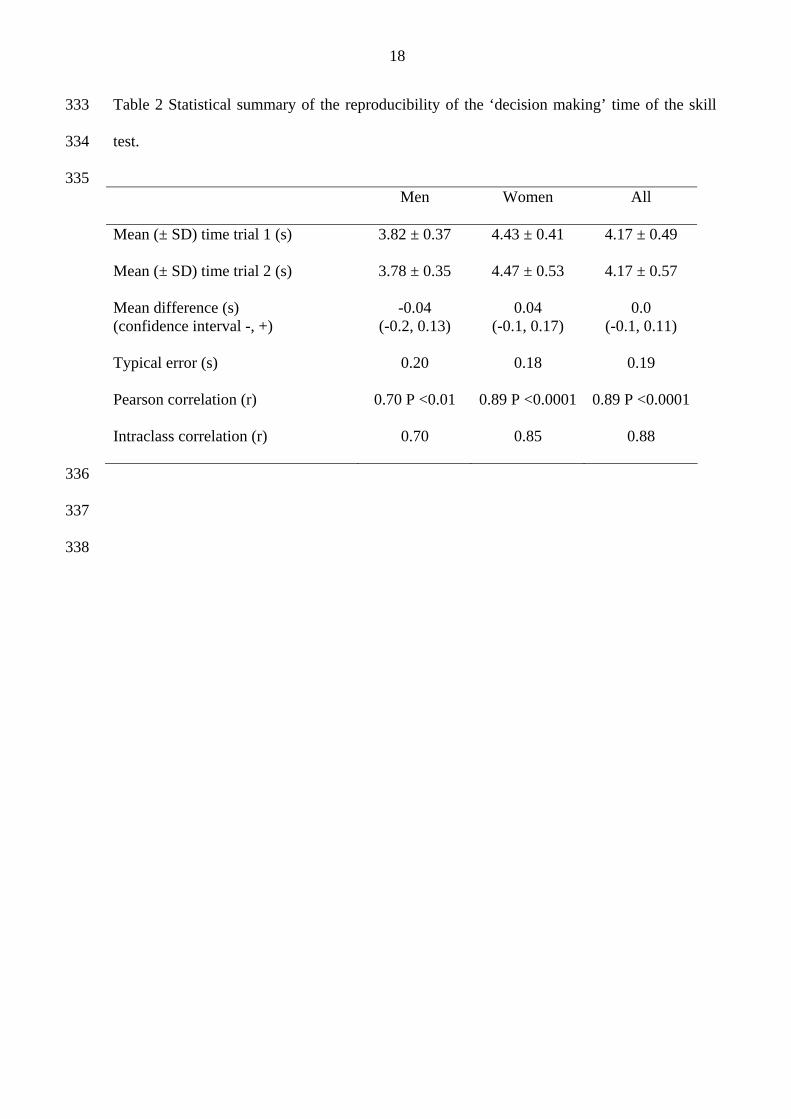
‘decision making’ time was 0.0 ± 1.0% and the standard error (confidence limits) was 4.5%
9
168 (3.6 to 6.2%). Table 1 and 2 shows a variety of statistical results used for comparing the
169
170
171
172
173
174
175
176
177
overall performance and ‘decision making’ time reliability of the skill test respectively. There
is a strong relationship for overall skill test performance as indicated by a Pearson and
intraclass correlation above 0.90 (Table 1). The relationship for decision time was also good,
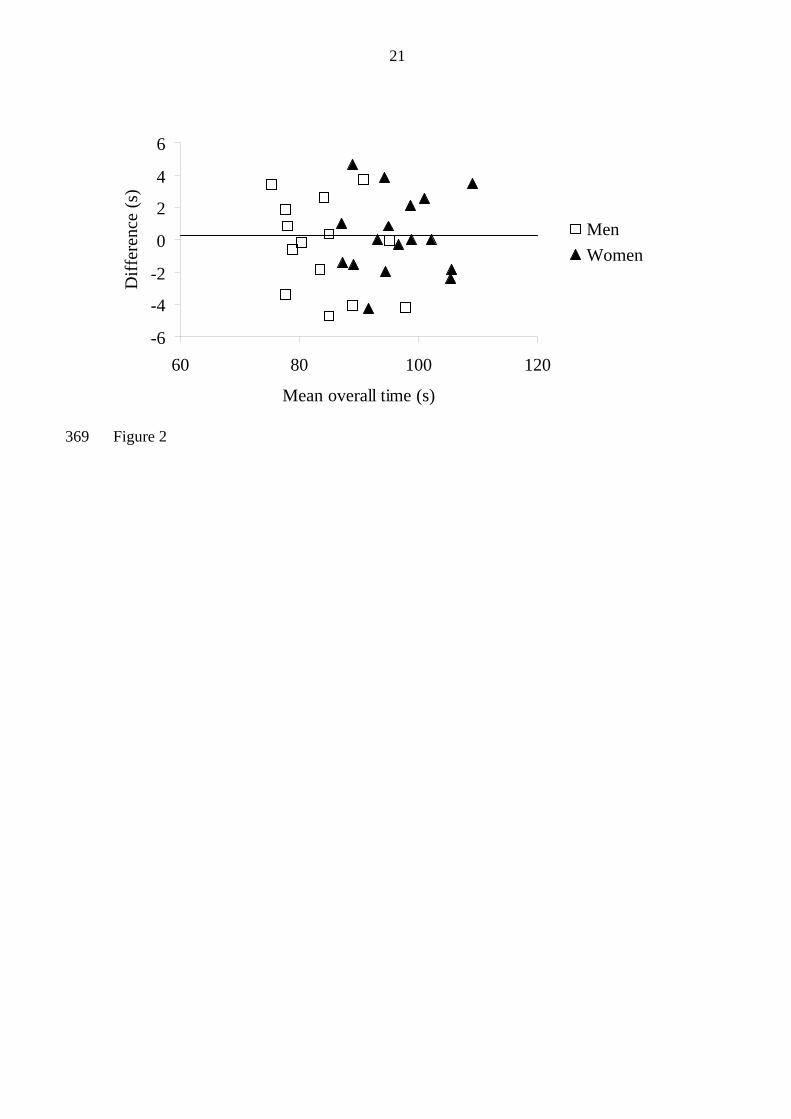
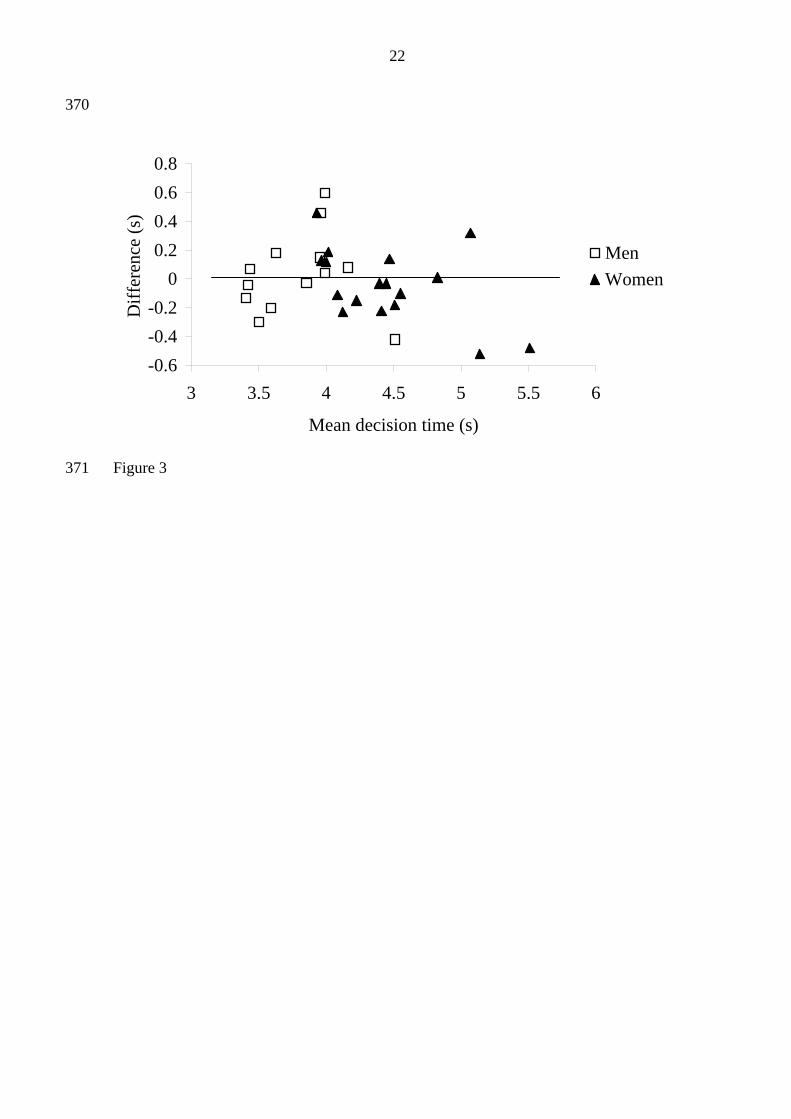
being above 0.70 (Table 2). Figure 2 shows the Bland and Altman plot for overall
performance time for trial 2-1, and gives a mean difference and limits of agreement of 0.03 ±
5.11 s. The Bland and Altman plot for decision time shows a mean difference and limits of
agreement of 0.01 ± 0.52 s (Figure 3).
Validity
178 The Pearson correlation for the mean women’s’ coaches rank and overall time was r = 0.83
179 (P<0.01) and decision time was r = 0.73 (P<0.01). The Pearson correlation for the mean
180 men’s coaches rank and overall time was r = 0.61 (P<0.01) and decision time was r = 0.70
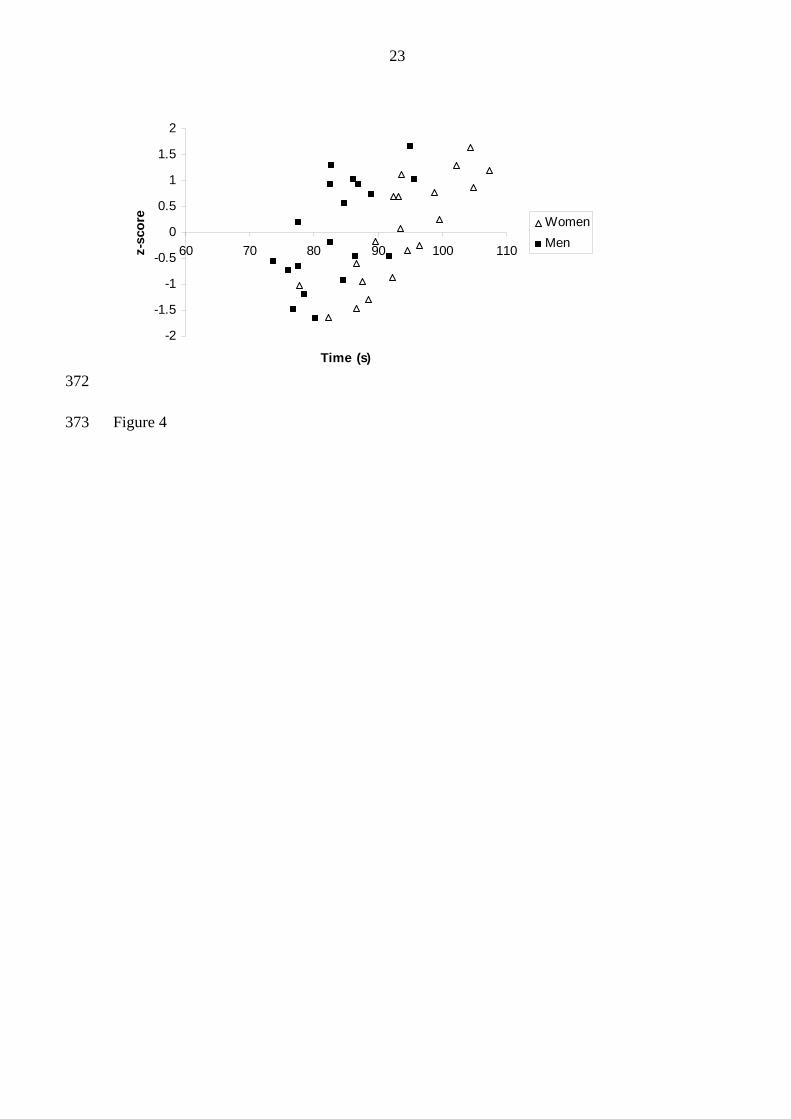
181 (P<0.01). Figure 4 shows a plot of the z-score from the mean coaches rank (residual) versus
182 the overall time for the skill test. The figure shows good uniformity of the data. The standard
183 error of the estimate for the overall time is 0.58 for the women and 0.81 for the men. The
standard error of the estimate for the decision time is 0.70 for the women and 0.74 for the 184
185
186
187
188
189
190
191
192
men.
Discussion
The main finding from the present study was that the reproducibility of the skill test was
good. Correlations between the two trials were high to very high (4). The correlations
between coaches’ rankings and player performance were also high for the high standard
players used.
10
193
194
195
196
197
198
199
200
201
202
203
204
205
206
207
208
209
210
211
212
213
To assess test retest reliability, Hopkins (5) has advocated the use of typical error rather than
the limits of agreement approach that is recommended by Atkinson and Nevill (1). Hopkins
(5) suggested that the value of the limits of agreement approach is dependent upon the sample
size of the reliability study. The bias of the limits of agreement are <5% if there are >25
subjects; however if there is only 8 subjects this bias is 21%. In the current study, there are
over 30 subjects for the data for men and women combined and therefore the bias will be low.
The Bland and Altman (2) limits of agreement provide a confidence interval for the
differences between two trials and it is up to the experimenter to determine whether this range
is acceptable. Hopkins (5) suggested that a 95% confidence interval used for the limits of
agreement approach is too stringent a measure if used for looking at an athlete’s improvement
in performance and that half the limits of agreement would still leave approximate odds of 5-1
that performance had actually improved. Thus, the limits of agreement allows for an
underestimation of the reliability of the protocol as it takes into account 2 standard deviations
rather than the usual one that is used as an indicator of variation. The mean difference and
limits of agreement for overall skill test performance was 0.03 ± 5.11 s and for ‘decision
making’ was 0.01 ± 0.52 s. In contrast the typical error of overall performance, as advocated
by Hopkins (5) of the test was 2.0 s for men and 1.7 s for women. For the ‘decision making’
data the typical error was 0.20 s for men and 0.18 s for women. The typical error is the
within-subject standard deviation and represents the variation we could expect to see from
trial to trial for each subject (5).
214 A key aspect of determining whether the reliability of the test is appropriate to the tests use is
215 to assess the minimum worthwhile change that matters to the coach, player or scientist. This
216 worthwhile change value may vary between the player, coach and scientist. For team sports
217 particularly this is a very difficult value to determine as the performance on a skill test, such
11
1
2
3
4
5
6
7
8
9
10
11
12
13
14
15
16
17
18
19
20
21
22
23
24
25
218 as that presented in this paper may not directly reflect performance on the pitch due to
219 numerous and complex interactions that occur during team sports. To try to overcome this
220 issue the validity for this test was assessed by ranking players on their overall pitch
221 performance and correlating this with the performance on the skill test. In terms of the
222 minimum worthwhile change for reliability of tests associated with team sports, Hopkins (6)
223 outlined that the smallest worthwhile change should be <0.2 of the between athlete SD. For
224 the current test the error of the measurement or typical error related to the between athlete SD
is 0.26 for the women and 0.28 for the men respectively. Therefore this is slightly higher than 225
226 the value indicated. Based on this data, in practical terms the smallest worthwhile change for
227 the field hockey skill test should be 2s. If the performance of a player on the test improves by
228
229
230
2s, you can be confident that the player has improved his or her performance on the skill test.
These data show that the reliability of the skill test is considerably better than any previously
published data for field hockey (3, 11, 12, 14). The tests that have been formulated during the 231
232 last 20 years have been designed as field tests to determine differences between players rather
233
234
235
236
237
238
239
240
241
than for repeated measures on the same player. The Chapman Ball Control Test (3) isolates
the ability of an individual to control the ball manipulatively by arm, wrist and hand action
within a 9.5” (24 cm) diameter circle. This could be described as measuring dribbling
technique rather than field hockey skill per se. Thus, it cannot be a measure of playing ability
since this is not what constitutes the entire domain of field hockey skill. The testing took
place on a gymnasium floor, which is a considerably different surface from the outdoor game.
While the results from the Chapman test correlate well with subjective opinions of playing
ability, it does not attempt to measure any other characteristics. Testing of ball control is
obviously important, but analyses of match
12
play highlight how little time players spend with the ball during a match and the very short
duration of each period with the ball. The validity of the Chapman test would be reasonable if
the test scores were compared with subjective ratings of ball control and not overall playing
ability. Reilly and Bretherton (11) developed a field-based skill test, namely the “T”-dribbling
test and a dribbling and accuracy test, to help determine the fitness of female hockey players.
The T-dribbling test was shown to be correlated with aerobic fitness (r = 0.48; estimated
max and physical working capacity) and anaerobic power (r = 0.6; stair run test). The
accuracy was correlated with ectomorphy (r = -0.63). The skill tests provide useful field tests,
but do not provide us with a test that includes a passing aspect and ‘decision making’ element.
Furthermore, the “T”-dribbling test, is restrictive in that the players were unable to use reverse
sticks, which is an integral part of the game and therefore would not be a suitable measure of
hockey performance per se.
242
243
244
245
246
247
248
249
250
251
252
253
254
255
256
257
258
259
260
2OV&
In our laboratory, previous soccer skill tests have been developed for use in researching the
effects of fatigue on skill performance. The reliability in terms of mean difference (± limits of
agreement) for the Loughborough Soccer Passing Test was –0.1 ± 11.2% (9). The limits of
agreement are much greater than those in the current study (0.0 ± 5.6%), suggesting that the
reliability of the field hockey skill test is good and acceptable for scientific research.
261
262
263
264
265
266
The validity of the field hockey skill test is moderate to good. The term ‘validity’ used in the
current study, refers to both logical validity and construct validity. Logical validity means that
the test is appropriate to what you want to measure, whereas construct validity refers to a test
which can discriminate between groups of performers (13). A further type of validity, should
be tested for, namely criterion validity, which means that the test needs to be compared with
an established test. However, as there does not seem to be a
13
1
2
3
4
5
6
7
8
9
10
11
12
13
14
15
16
17
18
19
20
21
22
23
24
25
267 previous field hockey skill test that is regarded as ‘established’, this is inapplicable. The skill
268 test shows better validity for the women than the men for both the correlations and typical
269 error or standardised error of the estimate values. The typical error values were 0.58 for the
270 women and 0.81 for the men. Though these values are larger than we would hope for they are
271 justifiable from the method used. The coaches ranks were based off performance and are
272 extremely subjective so the variation will be much greater between players. Further more the
273 players used were all of a high standard so the variation between players would have been low
increasing the difficulty for coaches rankings. The greater validity for women may be due to
the different demands and styles of play adopted by men and women. In field hockey there are
“physical and physiological differences between the sexes” that means that the game of
hockey will be played differently by men and women (8). For elite hockey players, men were
found to have a higher max and haemoglobin content and were faster, taller and heavier
than the women (8).
274
275
276
277
278
279
280
281
282
283
284
285
286
287
288
289
290
291
2OV&
Skill tests need to be objective as well as valid and reliable. Though the objectivity of the test
has not been statistically determined, the test should exhibit good objectivity. The test
performance is determined by timings, which are completed by a computer and stopwatch and
penalty time. The players are only instructed in what order to complete the test and the
penalty system, and thus the inferences of the testers are minimal. The tester is only
responsible for timing and counting the number of penalties so the results should be similar, if
not identical between all testers.
The test was performed on a typical sportsturf and is thus easily transferable between pitches.
The field hockey skill test could be easily transferred to the pitch, using the goal and could be
made as realistic as is required. The movement of a goal keeper could determine the side for
14
1
2
3
4
5
6
7
8
9
10
11
12
13
14
15
16
17
18
19
20
21
22
23
24
25
292
293
294
295
296
297
298
299
300
301
shooting, with another attacker playing the pass and a defender taking the place of the five
cones to shoot around. Thus, the test could be as scientific or match-like as is required, and
could range from a coaching aid to a selection aid.
The limits of agreement and typical error indicate the reliability of the skill test is very good
and that changes in overall performance of greater than 2.1% could be attributed to the
intervention. In summary, the field hockey skill test provides a reliable, objective and valid
tool for testing the skills of good to elite field hockey players. The high reliability and validity
allows it to be used for scientific research as well as determining how the skills of individual
players are developing.
15
References 302
303
304
305
306
307
308
309
310
311
312
1Atkinson G, Nevill AM. Statistical methods for assessing measurement error (reliability) in
variables relevant to sports medicine. Sports Med 1998; 26: 217-38.
2Bland JM, Altman DG. Statistical methods for assessing agreement between two methods of
clinical measurement. Lancet 1986; 1: 307-310.
3Chapman N. Chapman Ball Control Test- Field Hockey. Res Q Exerc Sport 1982; 53: 239-
242.
4Cohen L, Holliday M. Statistics for Social Scientists. London: Paul Chapman Publishing,
1982.
5Hopkins WG. Measures of reliability in sports medicine and science. Sports Med 2000; 30:
1-15.
6Hopkins WG. How to interpret changes in an athletic performance test. Sportscience 2004; 313
8:1-7. 314
315
316
317
318
319
320
321
322
323
324
325
7Knapp B. Skill in Sport: The attainment of proficiency. London: Routledge and Kegan Paul,
1963.
8Lakomy J, Dabinett J, Nevill ME. Physiological differences between elite male and female
games players. Faster, Higher, Stronger 2000; 20-21.
9McGregor S. The influence of fluid ingestion on metabolism and soccer skill following
intermittent high intensity shuttle running. Unpublished doctoral dissertation 1999.
Loughborough University, UK.
10Reilly T, Borrie A. Physiology applied to field hockey. Sports Med 1992: 14: 10-26.
11Reilly T. Bretherton S. Multivariate analysis of fitness of female field hockey players. In:
Day JAP (ed). Perspectives in Kinanthropometry Champaign, IL: Human Kinetics, 1986:
135-142.
16
12Schmithals M, French E. Achievement tests in field hockey for college women. Res Q Exerc
Sport 1940; 11: 84-92.
326
327
328
329
330
13Strand BN, Wilson R. Assessing Sports Skills. Champaign, IL: Human Kinetics, 1993.
14Wessel JA, Koening FB. Field hockey. In:. Larson LA, (ed). Encyclopaedia of Sports
Sciences and Medicine. London: Collier-MacMillan, 1971: 679-680
17
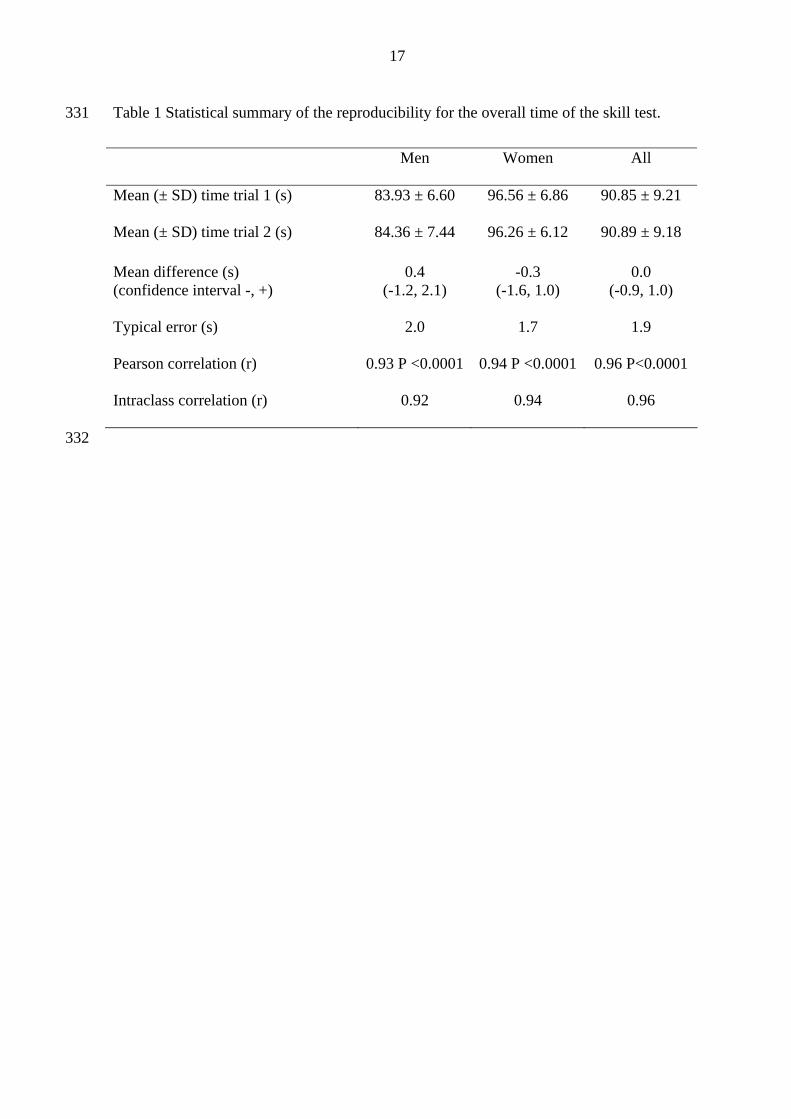
Table 1 Statistical summary of the reproducibility for the overall time of the skill test. 331
Men Women All
Mean (± SD) time trial 1 (s) 83.93 ± 6.60 96.56 ± 6.86 90.85 ± 9.21
Mean (± SD) time trial 2 (s) 84.36 ± 7.44 96.26 ± 6.12 90.89 ± 9.18
Mean difference (s) (confidence interval -, +)
0.4 (-1.2, 2.1)
-0.3 (-1.6, 1.0)
0.0 (-0.9, 1.0)
Typical error (s) 2.0 1.7 1.9
Pearson correlation (r) 0.93 P <0.0001 0.94 P <0.0001 0.96 P<0.0001
Intraclass correlation (r) 0.92 0.94 0.96
332
18
Table 2 Statistical summary of the reproducibility of the ‘decision making’ time of the skill
test.
333
334
335 Men Women All
Mean (± SD) time trial 1 (s) 3.82 ± 0.37 4.43 ± 0.41 4.17 ± 0.49
Mean (± SD) time trial 2 (s) 3.78 ± 0.35 4.47 ± 0.53 4.17 ± 0.57
Mean difference (s) (confidence interval -, +)
-0.04 (-0.2, 0.13)
0.04 (-0.1, 0.17)
0.0 (-0.1, 0.11)
Typical error (s) 0.20 0.18 0.19
Pearson correlation (r) 0.70 P <0.01 0.89 P <0.0001 0.89 P <0.0001
Intraclass correlation (r) 0.70 0.85 0.88
336
337
338
19
339
340
341
342
343
Figure Captions
Figure 1. Schematic representation of the field hockey skill test.
Figure 2. Bland-Altman plot for the overall time raw data.
Figure 3. Bland-Altman plot for the ‘decision making’ time raw data.
Figure 4. A residuals versus predicted plot for the overall time for men and women.
20
344
345
346
347
348
349
350
351
352
353
354
355
356
357
358
359
360
361
362
363
364
365
366
367
368
Figure 1
Rebound board
Cone Backboard with light
Indoor boards Movement of ball only (pass or shot)
Movement of player whilst dribbling ball
Movement of player only Sports Turf
Infra-red beam
21
-6
-4
-2
0
2
4
6
60 80 100 120
Mean overall time (s)
Diff
eren
ce (s
)
MenWomen
369 Figure 2
22
370
371
-0.6-0.4-0.2
00.20.40.60.8
3 3.5 4 4.5 5 5.5 6
Mean decision time (s)
Diff
eren
ce (s
)
MenWomen
Figure 3
23
-2
-1.5
-1
-0.5
0
0.5
1
1.5
2
60 70 80 90 100 110
Time (s)
z-sc
ore Women
Men
372
373 Figure 4