Embed Size (px)
Citation preview

Gardner-Webb UniversityDigital Commons @ Gardner-Webb University
Education Dissertations and Projects School of Education
2012
The Relationship of Learner-Centered Beliefs ofEighth-Grade Math Teachers and StudentAchievement on the North Carolina End-of-GradeMathematics TestTakeda Lasha LeGrandGardner-Webb University
Follow this and additional works at: https://digitalcommons.gardner-webb.edu/education_etd
Part of the Junior High, Intermediate, Middle School Education and Teaching Commons, andthe Science and Mathematics Education Commons
This Dissertation is brought to you for free and open access by the School of Education at Digital Commons @ Gardner-Webb University. It has beenaccepted for inclusion in Education Dissertations and Projects by an authorized administrator of Digital Commons @ Gardner-Webb University. Formore information, please see Copyright and Publishing Info.
Recommended CitationLeGrand, Takeda Lasha, "The Relationship of Learner-Centered Beliefs of Eighth-Grade Math Teachers and Student Achievement onthe North Carolina End-of-Grade Mathematics Test" (2012). Education Dissertations and Projects. 61.https://digitalcommons.gardner-webb.edu/education_etd/61

The Relationship of Learner-Centered Beliefs of Eighth-Grade Math Teachers and
Student Achievement on the North Carolina End-of-Grade Mathematics Test
by
Takeda Lasha LeGrand
A Dissertation Submitted to the
Gardner-Webb School of Education
in Partial Fulfillment of the Requirements
for the Degree of Doctor of Education
Gardner-Webb University
2012
ii
Approval Page
This dissertation was submitted by Takeda Lasha LeGrand under the direction of the
persons listed below. It was submitted to the Gardner-Webb University School of
Education and approved in partial fulfillment of the requirements for the degree of
Doctor of Education at Gardner-Webb University.
Gregory Firn, Ed.D. Date
Committee Chair
Lorraine Collins, Ed.D. Date
Committee Member
Michael Perry, Ed.D. Date
Committee Member
A. Doug Eury, Ed.D. Date
Committee Member
Frances B. Burch, Ph.D. Date
Dean of Graduate School

iii
Acknowledgments
I would like to acknowledge my heavenly Father who supplied my every need
and made provisions for me to arrive at this point in my educational pursuits. Only
because of his grace, mercy, and love was I able to fulfill my duties as a mother, wife,
and student during this process. I would also like to acknowledge and thank my many
child-care providers. Mrs. Jill Jordan, Mrs. Keonta Chambers, Mr. and Mrs. Shaun Rose,
Mrs. Cyekeshia Pickett, Mrs. Tina Witherspoon, Aunt Florine, Aunt Loretta, and Mother
Pam, thank you for stepping in to assist me with my family obligations and loving my
children unconditionally. I would like to acknowledge my champion for education, the
late Georgia Stewart Knotts. My grandmother Georgia taught me the value of an
education and hard work. Above all, she taught me how to pray without ceasing. I would
like to acknowledge and thank Drs. Lorraine Collins and Michael Perry who, at times,
believed in me more than I believed in myself. I would further like to acknowledge Dr.
Gregory A. Firn who invested his time and expertise into my education. Dr. Firn, I will
forever remember your guidance and direction. Finally, I would like to acknowledge two
members of my cohort, Jan Edwards-Webster and Eddy Malave, who participated in this
journey with me. Chiefly, I would like to acknowledge your encouragement when I
wanted to abandon this process. I would like to dedicate this dissertation to my husband,
Thomas J. LeGrand, Jr., and our precious gifts-Trinity and Taylor. Thomas, your love for
me and my dreams is evident in so many ways. You are my husband, partner, best friend,
coach, and spiritual adviser. More importantly, you are a phenomenal father to our
children. I love you and thank our wonderful Father in heaven for joining us together.

iv
Abstract
The Relationship of Learner-Centered Beliefs of Eighth-Grade Teachers and Student
Achievement on the North Carolina End-of-Grade Mathematics Test. LeGrand, Takeda
Lasha, 2012: Dissertation, Gardner-Webb University, Learner-Centered Beliefs/Eighth-
Grade Mathematics/Student Achievement/School Reform/Teacher Reflection
Educators are charged with reform efforts to improve student achievement. Most efforts
focus on accountability reform. The learner-centered model for school reform is
organized around the personal domain for systemic reform. How teachers work with
students is greatly influenced by policy and what they believe about student learning and
behavior. Subsequently, teacher behaviors, beliefs, and practices impact learning. This
dissertation attempted to establish teacher beliefs and their effectiveness on student
achievement on the eighth-grade End-of-Grade Mathematics Test in the State of North
Carolina.
This study was conducted within the Sandhills Regional Education Consortium located in
the central part of North Carolina. As of the 2011 school year, 12 school districts made
up the Sandhills Regional Education Consortium; 5 of the twelve districts participated in
this research study.
A non-experimental quantitative study design was used to examine teachers’ beliefs
about the learner, learning, and teaching as well as the impact of their beliefs on student
mathematics achievement. The researcher collected data via the Teacher Beliefs Survey,
a demographic questionnaire, and student achievement on the eighth-grade 2011 North
Carolina End-of-Grade Mathematics Test for the purpose of this research.
Data collected revealed that only 1 teacher met McCombs and Whisler’s criteria for
having learner-centered beliefs and 2 teachers were identified as non-learner-centered.
There was no statistical significant difference between teacher beliefs and student
achievement on the eighth-grade End-of-Grade Mathematics Test, but there was a
difference in teachers’ beliefs about non-learner-centered ideas in higher-performing
districts than teachers’ beliefs about non-learner-centered ideas in lower-performing
districts, but not enough to be considered significant.

v
Table of Contents
Page
Chapter 1: Introduction ........................................................................................................1
National Reform Efforts ......................................................................................................1
North Carolina Reform Efforts ............................................................................................3
Mathematics Performance ...................................................................................................5
Organizational Domains of Change .....................................................................................6
Definition of Learner-Centered............................................................................................7
Statement of the Problem .....................................................................................................9
Limitations ...........................................................................................................................9
Delimitations ........................................................................................................................9
Overview of Chapters ........................................................................................................10
Definition of Terms............................................................................................................10
Chapter 2: Literature Review .............................................................................................12
Introduction ........................................................................................................................12
Research Overview ............................................................................................................12
Level I Research ................................................................................................................14
A Historical Overview of the Learner-Centered Psychological Principles .......................15
Development and Validation Process of Learner-Centered Psychological
Principles............................................................................................................................15
Educational Psychology and Student Achievement ..........................................................18
Summary of the Learner-Centered Psychological Principles Theoretical
Foundation .........................................................................................................................20
Level II Research ...............................................................................................................21
Learner-Centered Battery ...................................................................................................22
Assessment of Learner-Centered Practices Surveys ..........................................................24
Learner-Centered Principles and Student Achievement ....................................................25
Summary of Level II Research ..........................................................................................26
Level III Research ..............................................................................................................26
Teacher Effectiveness ........................................................................................................26
Summary of Literature Review ..........................................................................................31
Purpose Statement ..............................................................................................................31
Hypotheses .........................................................................................................................32
Research Questions ............................................................................................................33
Chapter 3: Methodology ....................................................................................................35
General Design...................................................................................................................35
Participants .........................................................................................................................35
Instrument ..........................................................................................................................36
Procedures ..........................................................................................................................37
Data Analysis .....................................................................................................................38
Descriptive Statistics ..........................................................................................................38
Inferential Statistics ...........................................................................................................39
Summary of Methodology .................................................................................................40
Chapter 4: Results ..............................................................................................................42
Demographic Characteristics .............................................................................................42
Data Report ........................................................................................................................46

vi
Summary ............................................................................................................................57
Chapter 5: Discussion ........................................................................................................58
Review of Dissertation .......................................................................................................58
Implications of Findings ....................................................................................................58
Limitations .........................................................................................................................65
Recommendations ..............................................................................................................65
References ..........................................................................................................................67
Appendices
A Learner-Centered Psychological Principles ...........................................................73
B Teacher Beliefs Survey ..........................................................................................79
C Informed Consent Letters ......................................................................................87
Tables
1 Total Years Teaching .............................................................................................42
2 Total Years Teaching Math ...................................................................................43
3 Total Years Teaching Middle School Math ...........................................................44
4 Major Area of Teaching .........................................................................................44
5 Minor Area of Teaching.........................................................................................45
6 Highest Degree Earned ..........................................................................................46
7 Learner-Centered Beliefs Means ...........................................................................48
8 Differences Among Teachers on Learner-Centered and Non-Learner-
Centered Beliefs .....................................................................................................49
9 Learner-Centered Teachers ....................................................................................49
10 Teachers Above the Validation Mean for Learner-Centered Beliefs ....................50
11 Non-Learner-Centered Teachers ............................................................................50
12 Teachers Above the Validation Mean for Non-Learner-Centered
Beliefs: Learner ......................................................................................................51
13 Teachers Above the Validation Mean for Non-Learner-Centered
Beliefs: Teaching and Learning .............................................................................51
14 Analysis of Variance for Total Score.....................................................................52
15 Difference Between Teachers in High-Performing Districts Learner-
Centered Beliefs .....................................................................................................53
16 Independent Samples Test Between High- and Low-Performing
Districts ..................................................................................................................53
17 Difference Between Teachers in Higher-Performing districts: Non-
Learner-Centered Beliefs About the Learner .........................................................53
18 Independent Samples Test Between Teachers in Higher-Performing
Districts: Non-Learner-Centered Beliefs about the Learner ..................................54
19 Difference Between Teachers in Higher- and Lower-Performing
Districts: Non-Learner-Centered About Teaching and Learning ..........................54
20 Independent Samples Test: Difference Between Teachers in High- and Low-
Performing Districts: Non-Learner-Centered About Teaching and Learning .......55
21 Correlations Among the Levels of Learner-Centeredness .....................................56
22 Correlations Among the Levels of Learner-Centeredness with Total
Score ......................................................................................................................56
23 Correlations among the Levels of Learner-Centeredness with Mean
Scale Score .............................................................................................................57

1
Chapter 1: Introduction
National Reform Efforts
Education reform is rooted in the standards movement. Chiefly, standards serve to
clarify and raise expectations, as well as provide a common set of expectations (Mid-
continent Research for Education and Learning [McREL], 2011). For this reason, A
Nation at Risk serves as the primary initiator of the current standards movement
(National Commission on Excellence in Education [NCEE], 1983). Present reform efforts
reference the Nation at Risk report by stating:
The educational foundations of our society are presently being eroded by a rising
tide of mediocrity that threatens our very future as a nation and a people . . . We
have, in effect been communicating an act of unthinking, unilateral education
disarmament. (NCEE, 1983, p. 5)
In 1990, former President George Bush announced the National Education Goals
for 2000. As a result, six broad goals for education, to be reached by 2000, were
developed. Particularly, Goals 3 and 4 focused on mathematics achievement. Goal 3
proposed that by the year 2000, American students should leave Grades 4, 8, and 12
having demonstrated competency in challenging subject matter including English,
mathematics, science, history, and geography; Goal 4 required that by the year 2000, U.S.
students should be the first in the world in science and mathematics achievement
(National Education Goals Panel, 1991).
The Secretary’s Commission on Achieving Necessary Skills (SCANS)
determined the skills employers desired from employees and drew attention to
mathematics achievement on America’s economic threat (McREL, 2011). By the same

2
token, former President George W. Bush signed the No Child Left Behind Act of 2002
into law. In 2002, the United States Congress signed Public Law 107-110, the No Child
Left Behind (NCLB) Act of 2002, into law. NCLB was the reauthorization of the 1965
Elementary and Secondary Education (ESEA) Act. The purpose of the NCLB Act was to
close the achievement gap by increasing accountability, flexibility, and choice in public
schools (U.S. Department of Education, 2010). The Act concentrated on improving all
public schools, as well as ensuring all students had access to a quality education.
Moreover, efforts targeted accountability, school choice, flexibility in funding, and
literacy (U.S. Department of Education, 2010).
In February of 2009, President Barack Obama signed the American Recovery and
Reinvestment Act of 2009 into law. The Act prioritized funding for stimulation of the
economy, job creation, and education. As a result, Race to the Top received $4.35 billion
for education reform efforts (U.S. Department of Education, 2009).
Race to the Top focused on four core education reform areas: (a) Adopting
standards and assessments that prepare students to succeed in college and the workplace
and to compete in the global economy; (b) Building data systems that measure student
growth and success, and inform teachers and principals about how they can improve
instruction; (c) Recruiting, developing, rewarding, and retaining effective teachers and
principals, especially where they are needed most; and (d) Turning around our lowest-
achieving schools (U.S. Department of Education, 2009).
Race to the Top prioritized an emphasis on Science, Technology, Engineering,
and Mathematics (STEM), and on school-level conditions for reform. In essence, school-
level conditions such as creating climates and cultures that remove obstacles to learning

3
and actively supporting student engagement and achievement directly impact the
classroom level (U.S. Department of Education, 2009). As a result, Science, Technology,
Engineering, and Mathematics (STEM) academies and learning communities are
increasing in America’s schools. The Bill and Melinda Gates foundation has invested
heavily in smaller learning communities (National Evaluation of High School
Transformation, 2005). According to the U.S. Department of Education (2000), four
critical reasons our children must achieve in mathematics and science are (a) The
demands of our changing economy and workforce; (b) Our government need for a
competent citizenry; (c) The link between mathematics and science to our nation’s
security; and (d) The deeper value of mathematical and scientific knowledge in the
preservation of our history.
North Carolina Reform Efforts
All public schools in America must measure and report Adequate Yearly Progress
(AYP) (U.S. Department of Education, 2010). Accountability efforts have focused on
ensuring that schools make (AYP) and nurture teacher effectiveness. AYP measures the
yearly progress of different groups of students against yearly targets in reading/language
arts and mathematics. The groups of students are identified via grade level and in the
following ways: (a) The school as a whole, (b) White, (c) Black, (d) Hispanic, (e) Native
American, (f) Asian, (g) Two or more Races, (h) Economically Disadvantaged Students,
(i) Limited English Proficient Students, and (j) Students with Disabilities (U.S.
Department of Education, 2010).
The End-of-Grade (EOG) Mathematics test is administered to students in grades
3-8 to determine if elementary and middle schools in North Carolina make AYP. North

4
Carolina State Board of Education school reform efforts for schools that do not make
AYP include corrective action, restructuring, school choice, and supplemental
educational services. These actions focus on professional development, instruction,
curriculum, management, supplemental education, and school options, all which address
the technical and organizational domains for systemic reform (Public Schools of North
Carolina State Board of Education/Department of Public Instruction, 2011).
During the 2010-2011 school year, North Carolina students as a whole in grades
3-8 did not meet AYP (Public Schools, 2011). Unfortunately, several years after the
enactment of the NCLB Act of 2001, the mathematics achievement gap still existed
(Blank, 2011).
For almost 30 years, reform efforts have focused on improving the quality of
education that students receive and on increasing student achievement levels at both the
state and national levels (Fuhrman & Odden, 2001). As a result, the No Child Left
Behind Act of 2002 continues to focus on accountability, flexibility, and choice (U.S.
Department of Education, 2010); however, the act is neither a comprehensive nor a
holistic reform model.
Learner-centered principles have been validated in educational psychology as a
means for improving learning communities for learner and teacher (American
Psychological Association [APA], 1993, 1997). The American Psychological Association
developed the Learner-Centered Psychological Principles as a framework for school
reform that focuses on the often-neglected personal domain (APA, 1993, 1997).
Currently, the North Carolina State Board of Education and the Department of
Instruction’s efforts to increase all student achievement levels based on the mandates

5
required by NCLB Act of 2002 largely address the technical and organizational domains
of the educational system. Yet the personal domain, consisting of teacher beliefs about
their practices as a reflection tool as well as teacher expectations, is in need of further
study.
Mathematics Performance
The acquisition of math skills in middle school is the foundation for mathematics
success in high school and post-secondary learning (Riley, 1997). The National
Assessment of Education Progress (NAEP) is the largest national study on what students
in the United States know and can do in a variety of academic areas and has been
administered for over 42 years (National Center for Education Statistics [NCES], 2011a).
Accordingly, the 2011 NAEP in Mathematics report collected data from 175,200 eighth
graders in the United States. Public and charter schools in all 50 states, the District of
Columbia, and the Department of Defense participated. NAEP assessed the following
mathematical areas: number properties and operations, measurement, geometry, data
analysis, statistics, probability, and algebra. Subsequently, performance in these areas
was categorized into three achievement levels: basic, proficient, and advance. In essence,
basic denotes partial mastery with an emphasis on recall and understanding. Proficient
denotes mastery of mathematics concepts, particularly at the application level. Advance
denotes superior performance, with attention to synthesizing information (NCES, 2011c).
Participants’ results are based on a 0-500 scale score reported at five percentile
intervals (NCES, 2011c). The use of percentiles is useful for determining the percentage
of students scoring at or below the scale score (Fraenkel & Wallen, 2006). Between 2009
and 2011, students performing at the proficient and advance levels significantly
6
increased; on the contrary, students performing at the basic level did not significantly
improve in their performance (NCES, 2011c).
Conversely, low-performing students, who are minority and receive free/reduced
lunch, are continuing to perform inadequately when compared to their white counterparts.
The achievement gap in mathematics is still present (NCES, 2011c).
This gap extends beyond the students within the United States. Hence, when the
Program for International Student Assessment (PISA) 2009 report compared the United
States with Canada, France, Germany, Italy, Japan, Russian Federation, and the United
Kingdom, the United States ranked third in math achievement. Also, the percentage of
United States top performing math students only scored significantly higher than one
other country—Russian Federation (NCES, 2011b). Minority children tend to perform
lower in mathematics when compared to their white counterparts (NCES, 2011a) and
college students say that there is a need to improve the quality of instruction students
receive in math during high school years (Thompson & Joshua-Shearer, 2002).
Students enrolled in public schools in North Carolina are not immune to the
mathematics achievement gap. Particularly, this achievement gap is evidenced by the fact
that North Carolina public schools did not make AYP in mathematics for students in
grades 3-8 for the 2010-2011 school year (Public Schools, 2011).
Organizational Domains of Change
In 1997 the Researchers at the Mid-continent Regional Educational Laboratory
(McREL) identified and organized systemic reform around three primary domains of
educational systems: personal, technical, and organizational (McCombs & Whisler,
1997). The identified personal domains focused on understanding the keys to motivation
7
to learn, classroom interactions and achievement, and increasing parental involvement.
The technical domain addressed classroom management, technology literacy, curriculum
and instruction, and standards-based curriculum. The organizational domain included
policies and procedures for management structures and management of systemic reform
(McCombs & Whisler, 1997).
In part, as a response to the lack of attention to the psychology of learning, the
APA and the researchers at McREL developed a framework for addressing the personal
domain of school redesign and reform. The original framework consisted of 12 learner-
centered principles; however, today the framework consists of 14 learner-centered
principles that are categorized into four domains (APA, 1993, 1997).
The four research-validated domains are (a) metacognitive and cognitive factors,
(b) affective and motivational factors, (c) developmental and social factors, and (d)
individual difference factors (APA 1993, 1997).
Definition of Learner-Centered
In the original research by the APA Task Force (1993), McCombs and Whisler
(1997) published the following definition of learner-centered:
Learner-centered is the perspective that couples a focus on individual learners-
their heredity, experiences, perspectives, backgrounds, traits, talents, interests,
capacities, and needs-with a focus on learning-the best available knowledge about
learning and how it occurs and about teaching practices that are most effective in
promoting the highest levels of motivation, learning, and achievement for all
learners. (p. 42)
Furthermore, learner-centeredness is a complex interaction of teacher qualities in
8
combination with characteristics of instructional practices, as perceived by individual
learners. Therefore, the quality of learner-centeredness does not reside in programs or
practices. Accordingly, learner-centered clarifies what teachers need to know, do, and be
(i.e., beliefs, practices, and dispositions) to create a positive learning environment
(McCombs & Lauer, 1997; McCombs & Whisler, 1997).
The learner-centered framework offers a highly successfully alternative to current
school reform efforts by combining the best available knowledge on what supports a
positive learning environment and what promotes change for people within the system
(McCombs, 2003a). Specifically, the Learner-Centered Model provides a framework for
balancing learner needs with current research on the learning process (APA, 1997).
The Learner-Centered Model is a meta-model for implementing and evaluating
both programs and practices at multiple levels throughout the education system. The
Learner-Centered Model is illustrated with diverse utility via the classroom, school, and
district levels, as well as from personal beliefs to practice (APA, 1997). As reform
policies attempt to address achievement deficiencies, teachers must embrace the current
research on learners and learning as evidenced by the research-validated principles
defined by the APA’s Learner-Centered Psychological Principles (APA, 1997).
The Learner-Centered Battery (LCB) evolved from the learner-centered principles
(McCombs & Lauer, 1997). The Learner-Centered Battery, theoretical and research-
based, is the direct result of the Learner-Centered Psychological Principles (APA, 1993,
1997) and measures the following aspects: (a) teachers’ beliefs about learners, learning,
teaching, (b) teachers’ perceptions of their classroom practices in domains of practice
identified in the Learner-Centered Psychological Principles, and (c) students’ perceptions

9
of teacher classroom practices in the four research-validated domains (Fasko, Grubb,
Jesse, & McCombs, 1997).
A majority of the attention given to all reforms focused on technical and
organizational domains, not the personal domain. Accordingly, the Learner-Centered
Model validates the human element in education and reaffirms the impact of teacher
beliefs and perceptions on learning and motivation (McCombs & Vakili, 2005).
Currently, school reform efforts in North Carolina minimally address this personal
domain. Therefore, this study sought to both identify and examine teacher beliefs and
their impact on student achievement.
Statement of the Problem
Despite previous and current reform efforts and initiatives, mathematics
achievement in North Carolina has not been significantly improved.
Limitations
Chiefly, a limitation of this study was the design. This study was a causal
comparative research study designed to examine relationships, not cause and effect.
Furthermore, causal comparative research investigates the possibility of relationships; on
the other hand, other alternatives may explain relationships found in the data. Significant
findings served as a first step for identifying variables for further study (Fraenkel &
Wallen, 2006).
Delimitations
A potential delimitation of this study was in the selection of schools. Accordingly,
the researcher selected schools from five districts (n = 5) within the Sandhills Regional
Education Consortium located in the central part of North Carolina and focused on the
10
eighth-grade End-of-Grade Mathematics Scores for 2011.
Overview of Chapters
Chapter 2 includes a review of the literature that describes previous research akin
to the intended aim of this study. Specifically, the review of literature illustrates a
structure designed in concert with the three levels of research described by Ellis and
Fouts (1993). The levels of research are (a) the theoretical basis of learner-centered
beliefs, (b) the practical research on learner-centered beliefs as it relates to the student
achievement, and (c) research conducted to assess the overall outcome of learner-
centered beliefs and student achievement. Chapter 2 analyzes teacher beliefs and
expectations, student achievement, and teacher effectiveness; the three levels of research
arranged this component too. The review of literature ends with rationale for this study.
Chapter 3 exemplifies the methodology applied in this study. Chapter 4 reports
the results of descriptive and inferential statistics as well as their analyses. Chapter 5
analyzes and discusses the results and summarizes the study with recommendations for
further investigation.
Definition of Terms
Adequate Yearly Progress (AYP): Measures the yearly progress of different groups of
students at the school, district, and state levels against yearly targets in reading/language
arts and mathematics.
End-of-Grade Test (EOG): Tests designed to measure student performance on the goals,
objectives, and grade-level competencies specified in the North Carolina Standard Course
of Study.
Learner-Centered: The perspective that couples a focus on individual learners, their

11
heredity, experiences, perspectives, backgrounds, talents, interests, capacities, and needs,
with a focus on learning. The best available knowledge is implemented about learning
and how it occurs and about teaching practices that are most effective in promoting the
highest levels of motivation, learning, and achievement for all learners. Learner-centered
is a reflection in practice of the Learner-Centered Psychological Principles.
Learner-Centered Battery (LCB): Measures teachers’ beliefs regarding the following:
learners, learning, and teaching; teachers’ perceptions of their classroom practices in
domains of practice identified in the Learner-Centered Psychological Principles and
students’ perceptions of teacher classroom practices in the following domains;
metacognitive and cognitive factors; affective and motivational factors; developmental
and social factors; and individual difference factors.
Learner-Centered Principles (LCP): Psychological principles (14) that pertain to the
learner and the learning process. The 14 principles are divided into cognitive and
metacognitive, motivational and affective, developmental and social, and individual
difference factors influencing learners and learning.
No Child Left Behind Act of 2002: The most recent reauthorization of the Elementary
and Secondary Education Act of 1965. The reauthorized law added strict new
accountability changes and mandated that every child be taught by a Highly Qualified
teacher. The law emphasizes new standards for teachers and new consequences for Title I
schools that do not meet student achievement standards for two or more consecutive
years. The law’s major goal is for every school to be at 100% proficiency by 2013-14, as
measured by state tests.

12
Chapter 2: Literature Review
Introduction
Present reform policies, including those identified under the No Child Left Behind
(NCLB) Act of 2002, have created conflict between learner-centered and accountability-
centered reformers (Sleeter, 2007). Accordingly, learner-centered beliefs education
reform has been a popular topic among educators, policymakers, and the public since the
report of a Nation at Risk in 1983 (McCombs, 2003b).
Increased recognition focuses on the need to address reform based on new
knowledge about learning, motivation, and development (McCombs, 2003a). Therefore,
after reviewing a century of research on learning, motivation, development, and
individual differences, the APA developed the Learner-Centered Psychological Principles
(LCPs). The original research identified 12 principles, which was revised as 14
statements in 1997 (APA, 1993, 1997).
Research Overview
The general design of this research utilized the three levels of research identified
by Ellis and Fouts (1993) and concludes with sections on Teacher Effectiveness, Purpose
Statement, Hypotheses, and Research Questions.
Ellis and Fouts (1993) identified three levels of research that inform education,
innovation, and practice presented as Level I, Level II, and Level III. Briefly, Ellis and
Fouts (1993) defined Level I research as basic research on learning and utilizing
correlations, descriptive data, and qualitative case studies. Level I research is limited to
medical or psychological investigation at the clinical level. Level II research tests the
actual theory in a classroom setting, often in the form of a comparative study. Level III
13
research evaluates programs at the school or district level, often in the form of a large-
scale comparative study.
As a widely accepted practice, a theory is established as research-based after all
three levels of research are conducted (Ellis & Fouts, 1993). Therefore, the three levels of
research provide the structure and overall alignment of this literature review.
Evolution of the Learner-Centered Psychological Principles, study of the
Learner-Centered Psychological Principles Domains, and educational psychology and
student achievement at the basic research level are discussed in the Level I research
section. To begin with, research in this section includes the theoretical examination by
the American Psychological Association (APA) and Mid-continent Regional Education
Laboratory (McREL) Task Force (1993), Albert Bandura (1969, 1977, 1982, 1997), John
Keller (1983, 1987), Lezotte and Snyder (2011), Abraham Maslow (1943, 1970),
McCombs (1994), McCombs and Lauer (1997), and McCombs and Whisler (1997).
Level II research includes the validation and original results of the instrument
constructed to establish and determine learner-centered practices and behaviors of
teachers (APA, 1993; McCombs, 1994, 1999, 2003a; McCombs & Lauer, 1997), and
student achievement (Meece, 2003; Weinberger & McCombs, 2001; Wenglinsky, 2000).
Also, the validation of the Assessment of Learner-Centered Practices tool is discussed.
The Assessment of Learner-Centered Practices Survey is an extension of the learner-
centered psychological principles and is utilized to address teacher characteristics and
beliefs and teacher consistency with learner-centered psychological principles
(McCombs, 1999). The work of McCombs (1994, 1999) and McCombs and Lauer (1997)
is presented in the Level II research section. Furthermore, studies that measure learner-

14
centered practices and behaviors on the motivation and academic achievement of students
are included in the Level II research section.
The Level III research section provides an explanation of learner-centeredness as
part of the learner-centered model for education reform. In essence, learner-centeredness
is not a program.
Following the Level III research section is a section on teacher effectiveness. The
section includes studies (Eaker, DuFour, & Dufour, 2002; Edmonds, 1979; Ruddell,
1999; Turner, Meyer, Midgley, & Patrick, 2003; Tyler & Boelter, 2008; Weinberger &
McCombs, 2001) that demonstrate teacher efficacy, motivation and learning, and student
perceptions of teaching and learning.
Lastly, this review of literature summarizes each of the three levels of research
defined by Ellis and Fouts (1993) and the current focus on teacher effectiveness and
concludes with an argument to specifically study the correlation of learner-centered
beliefs and practices with student achievement.
Level I Research
Ellis and Fouts (1993) cited Level I research as basic research on learning and
behavior and stated that the purpose of Level I research is to establish a theoretical
construct or idea as having some effect on the dependent variable that is caused by the
independent variable; generalizations can be made to other groups (Kaufhold, 2007).
Therefore, the validity of the learner-centered psychological principles as a construct
must be reviewed. For this purpose, this section is categorized into the following topics:
(a) A Historical Overview of the Learner-Centered Psychological Principles; (b)
Development and Validation Process of the Learner-Centered Psychological Principles;

15
(c) Educational Psychology and Student Achievement; and (d) Summary of the Learner-
Centered Psychological Principles Theoretical Foundation.
A Historical Overview of the Learner-Centered Psychological Principles
In 1990, the American Psychological Association appointed the Presidential Task
Force on Psychology in Education. The task force reviewed over a century of research on
education. Attention was focused on learning, motivation, development, and individual
differences; the Learner-Centered Psychological Principles (LCPs) emerged (APA, 1993,
1997).
Originally, 12 psychological principles, which were revised to 14 statements,
were grouped in 4 domains. The four domains are (a) metacognitive and cognitive, (b)
motivational and affective, (c) developmental and social, and (d) individual difference
factors shown by the research to have significant impacts on student learning, motivation,
and achievement in school (APA, 1993, 1997).
The original 12 psychological principles (APA, 1993) and the additional two
principles (APA, 1997) communicate the belief that current reform efforts lack the
profound knowledge and implementation of teaching and learning based on research
from human learning, human motivation, and human development necessary to be
effective and enduring (APA, 1993, 1997; McCombs, 2003b; McCombs & Whisler,
1997).
Development and Validation Process of Learner-Centered Psychological Principles
Validation of the LCPs began with a review from experts in the field of
psychology, particularly educational, developmental, motivational, social, and cognitive
psychology (APA, 1993). Feedback received from a diverse pool of experts (science,
16
mathematics, teacher educators, and school counselors) warranted revisions to the
document. Consequently, five revisions yielded a well-articulated Learner-Centered
Psychological Principles document (APA, 1997).
Four domains of learner-centered psychological principles were defined. The first
domain, metacognitive and cognitive factors, make up the first six LCPs: (a) The nature
of the learning process, (b) Goals of the learning process, (c) The construction of
knowledge, (d) Strategic thinking, (e) Thinking about thinking, and (f) Context of
learning. Each principle is supported with an exhaustive research base (APA, 1993, 1997;
McCombs, 2003a; McCombs & Whisler, 1997). Hence, the first domain research is
rooted in constructivist learning, cognitive learning, and higher-order thinking strategies
(APA, 1993, 1997; McCombs & Whisler, 1997).
Furthermore, the second domain, motivational and affective factors, consists of
three LCPs: (g) Motivational influences on learning, (h) Intrinsic motivation to learn, and
(i) Effects of motivation and effort. By the same token, the second domain includes an
exhaustive research base similar to the first domain (APA, 1993, 1997; McCombs &
Whisler, 1997). Particularly, research was centered on the interrelationship and
interaction between intrinsic motivation, learning goals, anxiety, intellectual curiosity,
and clinical applications of cognitive approaches (APA, 1993, 1997; McCombs &
Whisler, 1997).
The third domain, developmental and social factors, include two LCPs: (j)
Developmental influences on learning and (k) Social influences on learning. Following
the research base of domains 1 and 2, domain 3 is heavily grounded in both theoretical
and clinical research (APA, 1993, 1997; McCombs & Whisler, 1997). Research efforts

17
targeted developmental psychology and theories of intelligence via physical, social,
emotional, and intellectual development (McCombs, 1994).
Subsequently, the fourth domain, individual differences, consists of three LCPs:
(l) Individual differences in learning, (m) Learning and diversity, and (n) Standards and
assessment. Research in the areas of social constructivism, adaptive instruction, cultural
diversity, self-esteem, socio-emotional support, and social psychology are imperative to
this domain (APA, 1993, 1997; McCombs & Whisler, 1997).
As a result of the APA (1997) revisions, two additional practices were added to
domain four. McCombs (1994) concluded that the research in domain four is derived
chiefly from the areas of individual differences as well as social and developmental
psychology. Theory about the role of environmental variables, such as previous
experiences, belief systems, and capabilities, extends to include linguistic, cultural, and
social differences research. Lastly, domain four identifies the integral role of high
expectations and the stages of the learning process as central to learner-centered (APA,
1997).
McCombs and Whisler (1997) desired to understand the challenges of failed
education reforms, which led to exploration of the implications of the learner-centered
principles at both the classroom and school levels. As a result, McCombs and Whisler
(1997) organized the learner-centered principles into five premises. They are:
1. Learners are distinct and unique. Their distinctiveness must be addressed and utilized
to plan instructional experiences if learners are to engage in and be held accountable for
their own learning; 2. Learners’ unique differences include their emotional states of mind,
learning rates, learning styles, stages of development, abilities, talents, feelings of

18
efficacy, and other academic and non-academic attributes and needs. Theses must be
considered in the construction of learning experiences if all learners are to be provided
with the appropriate level for learning and self-development; 3. Learning is a constructive
process that occurs optimally when what is being learned is germane and significant to
the learner and when the learner is actively involved in constructing his or her own
knowledge and understanding by connecting what is being learned with previous
knowledge and experience; 4. Learning occurs optimally in a positive climate, one that
fosters positive interpersonal relationships, that contains comfort and order, and in which
the learner feels valued and esteemed; and 5. Learning is an essential natural process;
learners are naturally inquisitive and basically interested in learning about and mastering
their world. Negative thoughts and feelings sometimes conflict with the natural learning
process and must be addressed, the learner does not require “fixing.” (p. 10)
These five premises serve as the theoretical framework of the learner-centered
principles (McCombs & Whisler, 1997). The effective schools research on the correlates
of effective schools is similar to the traits listed in the five premises (Lezotte & Snyder,
2011). McCombs and Whisler’s (1997) premises are established on practical research;
however, effective school correlates such as climate of high expectations, opportunity to
learn/time on task, safe and orderly environment, and clear and focused mission are
guided by widely accepted beliefs about learning, the learner, and the role of the teacher
(Lezotte & Snyder, 2011).
Educational Psychology and Student Achievement
Historically, motivation has been a dominant field of study in educational
psychology and is viewed as the catalyst for moving a resting organism. Motivation is

19
often cited by educational psychologists as an indicator of learning (Weiner, 1990).
Albert Bandura (1969), John Keller (1983), and Abraham Maslow’s (1970) theories on
motivation and human learning set precedence for much of our current research on
human motivation and learning.
Bandura’s (1977) social learning theory identified four components that influence
behavior; they are attention, retention, reproduction, and motivation. With attention to
motivation, Bandura (1977) suggested that an individual must be motivated by something
that individual deems rewarding. Subsequently, the object that serves as a reward acts as
a reinforcement (Bandura, 1977).
On the contrary, Bandura disagreed with traditional theorists, Ivan Pavlov, B.F.
Skinner, and Edward Thorndike regarding a direct link between behavior (performance)
and reinforcement (achievement). He proposed that an individual’s cognitive process
mediated between behavior and reinforcement (Schultz & Schultz, 2004).
This focus on the cognitive process led to Bandura’s (1982) extensive work on
self-efficacy. He defined self-efficacy as the sense of self-esteem and competence in
performing a task. Albert Bandura’s (1977, 1982, 1997) theory of self-efficacy as a
mediator of performance and achievement contributed to the research on motivation and
learning.
John Keller’s (1987) ARCS Model of Motivation Design’s purpose was to
stimulate and sustain a student’s motivation for learning. The ARCS Model consists of
four steps for enduring motivation in the learning process, which are: attention,
relevance, confidence, and satisfaction (ARCS) (Keller, 1983). Specifically, confidence is
unique to learner-centered beliefs. Confidence builds the learner’s efficacy in the

20
learner’s ability to have control over learning and assessment (Keller, 1984). Keller’s
(1987) model is categorized into four groups: person-centered, environmentally-centered,
interaction-centered, and omnibus-centered. Person-centered is the direct result of
theories grounded in human behavior (Keller, 1987).
Abraham Maslow’s Hierarchy of Needs Theory (1943) contends that while people
aim to meet basic needs, they seek to obtain progressively higher needs. Ordinarily, the
needs are depicted in the form of a hierarchy identical to a pyramid (Maslow, 1943). The
five levels of needs include: physiological, safety, belongingness, esteem, and self-
actualization. Esteem needs include confidence, achievement, and self-esteem. Esteem
mirrors efficacy, and when esteem needs are satisfied, feelings of self-confidence,
strength, and the ability to achieve desired goals are exhibited (Maslow, 1943).
Research on human motivation and learning remains a driving force for research
in educational psychology (Ryan & Patrick, 2001). Hidi and Harackiewicz (2000) urged
educators to incorporate practices that balance both intrinsic and extrinsic motivation by
focusing on students’ interests, intrinsic motivation, mastery goals, extrinsic motivation,
and performance goals. Mastery goal achievement is rooted in the learner’s desire to
improve, master a skill, and understand learning material; however, performance goal
achievement is driven by competing with others for grades and recognition (Ames, 1992;
Nicholls, 1984). On the whole, the APA findings (1993, 1997) and McCombs’s (2003b)
work with Learner-Centered Practices (LCPs) continued to validate the effectiveness of
addressing human motivation and self-efficacy in learning.
Summary of the Learner-Centered Psychological Principles Theoretical Foundation
The 14 psychological principles are organized into four domains identified as (a)
21
metacognitive and cognitive, (b) motivational and affective, (c) developmental and
social, and (d) individual differences influencing learners and learning (APA, 1993,
1997).
Accordingly, the Level I Research basis for the Learner-Centered Principles
extends over a decade. The Learner-Centered Principles are in their second iteration and
by definition they have the greatest positive effect on learners and learning (McCombs,
2003b). The Learner-Centered Psychological Principles are consistent with recent
discoveries from psychology that link positive youth development and prevention
interventions (Seligman & Csikszentmihalyi, 2000).
The resulting Learner-Centered Psychological Principle’s definition of the term
learner-centered and learner-centered premises provide a theoretical concept for a holistic
view of how the individual principles collectively interact to influence learners and
learning (McCombs, 1999). Consequently, this theoretical concept is limited in its utility
for influencing educational reform due to its inability to provide practical insights that
result from pure research (Ellis & Fouts, 1993).
Therefore, the Level II research section is designed to investigate and examine
research conducted to test the usefulness and effectiveness of the learner-centered
principles in classrooms and schools.
Level II Research
Ellis and Fouts (1993) define Level II research as program evaluation designed to
test the impact of programs or instructional methods in educational settings. Accordingly,
Ellis and Fouts (1993) identified two criterions that Level II research must meet: (a) the
study is conducted in the same or similar setting, and (b) the study does not attempt to
22
develop a theory, instead, it attempts to make instructional or curricular applications of a
given theory. Furthermore, Ellis and Fouts (1993) determined the outcome of Level II
research as providing practical implications that cannot be derived directly from pure
research.
For these reasons, this review of the Level II research section is organized into
four components: (a) Learner-Centered Battery, (b) Assessment of Learner-Centered
Practices Surveys, (c) Learner-Centered Principles and Student Achievement, and (d)
Summary of Level II Research.
Learner-Centered Battery
The Learner-Centered Battery (LCB) is a direct result of work on the Learner-
Centered Psychological Principles (APA, 1993). Researchers at McREL determined a
need to construct an instrument that would support educators in addressing three purposes
derived from the learner-centered principles (McCombs & Lauer, 1997).
Chiefly, the Learner-Centered Battery’s utility is to provide teachers with a tool
to: (a) analyze their basic beliefs and assumptions about learners, learning, and teaching
with the current knowledge base; (b) respond to student perceptions of their classroom
practices in domains critical to motivation, learning, and achievement; and (c) utilize self-
assessment and reflection skills to determine areas of improvement for professional
development in order to effectively meet the needs of all students (McCombs & Lauer,
1997).
A two-phase validation method was utilized. Initially, the reliability and content
validity of teacher and student surveys were completed. Following the completion of the
reliability and content validity surveys, the construct and predictive validity of teacher

23
and student variables were assessed (McCombs & Lauer, 1997). Evaluating student
motivation and achievement during each phase was critical for initial validation
(McCombs & Lauer, 1997).
Phase 1 validation efforts reported moderate to high internal consistencies (alpha
coefficients from .67 to .96) that were consistent with the Learner-Centered
Psychologically Principles (APA, 1993). Above all, Phase 1 empirical findings confirmed
the theoretical relationships between teacher beliefs and practices; therefore, future use of
self-assessment tools for enhancing teachers’ reflections is promising (McCombs &
Lauer, 1997).
Phase 2 validation established statistical validity of the Learner-Centered Battery
by examining its association with existing data on teachers’ attitudes and students’
motivation, and its predictive validity. Therefore, teacher’ perceptions of their practice
was positively associated with their attitudes about self-efficacy, their influence on
students during adolescence, reflective self-awareness, supporting their students’
autonomy, and learner-centered beliefs. Likewise, their perceptions were negatively
associated with their non-learner-centered beliefs about learners (McCombs & Lauer,
1997).
McCombs and Lauer (1997) declare that the Learner-Centered Battery offers an
assuring set of tools for self-reflection; with focus on the following implications: (a)
teachers can gain increasing individual responsibility for specifying their own
professional development plan, (b) the difference between pre- and in-service teacher
education has the potential to become increasingly obscured as individual teacher’s needs
are met in continuing education programs, and c) the “everyone learns the same” thinking

24
about effective teachers needs to be adjusted to reflect the variety of teacher
characteristics that can accommodate both student and content differences in schools
(McCombs & Lauer, 1997).
After surveying more than 660 teachers and 4,800 students, the Learner-Centered
Battery was validated. The LCB final format represents a short set of 35-item teacher and
student self-assessment surveys. The variables measured by the survey are teacher beliefs
and assumptions, and teacher assessment of classroom practices. The three items
measured in Teacher Beliefs are (a) learner-centered beliefs about learner, learning, and
teaching; (b) non-learner-centered beliefs about learners; and (c) non-learned centered
beliefs about learning and teaching (McCombs, 1994).
Assessment of Learner-Centered Practices Surveys
The Assessment of Learner-Centered Practices (ALCP) surveys were constructed
to involve teachers in the reflection process (McCombs, 2003a). With support from more
than 5,000 K-20 teachers and their more than 25, 000 students, the ALCP surveys have
been validated (McCombs, 1999).
The guided reflection process assists teachers with reflecting on (a) their
individual beliefs and practices, (b) their student perceptions of the teachers’ classroom
practices, and (c) the outcome of teacher and student learner-centered variables on
student motivation and achievement (McCombs, 1999, 2003a). Teachers who make
decisions about their practice based on the understandings of the Learning-Centered
Principles are more likely to (a) involve learners in decisions about how and what they
learn and how that learning is assessed; (b) value each learner’s individual perspectives;
(c) respect and respond to individual differences in learners’ previous experiences, likes,

25
and skill-sets; and (d) include learners as partners, instead of passive recipients in the
teaching and learning process (McCombs & Lauer, 1997; McCombs & Whisler, 1997).
The ALCP surveys are a set of self-assessment tools for teachers, students, and
administrators. Chiefly, the ALCP surveys supports teacher self-assessment and
reflection. Teachers are able to examine their beliefs and discrepancies between teacher
and students perceptions on practices that can enhance student motivation and
achievement is (McCombs & Lauer, 1997; McCombs & Whisler, 1997). Specific beliefs
or teaching practices (not teachers) are identified either as learner-centered or non-
learner-centered, (McCombs & Lauer, 1997, 1999; McCombs, 2003a). This
determination is aligned with the belief that learner-centered beliefs are challenging
because beliefs cannot be grouped into a single program.
Learner-Centered Principles and Student Achievement
McCombs (2003a) confirmed that teachers who are more learner-centered are
more successful in engaging all students in an effective learning process (McCombs,
2003a). The implementation of the learner-centered model highlighted relationships
between teachers’ beliefs and perceptions of their classroom practices which has led to
the identification of predictive positive outcomes for students from kindergarten through
college (Weinberger & McCombs, 2001). Likewise, Wenglinsky (2000) found those
math teachers who received professional development to improve their efficacy with
struggling learners found that these particular students’ math skills improved
significantly. Judith Meece (2003) applied the learner-centered principles to 2,200 middle
school students and her findings reported more positive forms of motivation and greater
academic engagement among students when they perceived their teachers were using

26
learner-centered practices.
Summary of Level II Research
The purpose of the Learner-Centered Battery (LCB) is to address the need for
teachers to examine the consistency of their basic beliefs and assumptions about learners,
learning, and teaching; attend to student perceptions of their classroom practices, and
self-reflect in order to meet the needs of all students (McCombs & Lauer, 1997). Chiefly,
the Assessment of Learner-Centered Practices Surveys (ALCPs) applies the learner-
centered principles via a set of self-assessment tools for teachers, students, and
administrators that facilitate teacher self-assessment and reflection (McCombs & Lauer,
1997; McCombs & Whisler, 1997). Several studies (Meece, 2003; Weinberger &
McCombs, 2001; Wenglinsky, 2000) have linked positive outcomes in student
achievement to learner-centered principles. The Level III Research section provides
clarification on the inability to evaluate learner-centered principles as a program.
Level III Research
Ellis and Fouts (1993) define Level III research as evaluative research designed to
establish the efficacy of programs at the school or district level. For the most part,
“learner-centered beliefs and practices” is not a formal program or even a unified reform
effort. Therefore, Level III research consisting of studies that examine the overall effects
on teachers and students is problematic and does not require further elaboration for the
purpose of this research.
Teacher Effectiveness
Ruddell (1999) contends that students who were proficient in academics
experienced two times as many effective teachers than challenged learners. Effective
27
teachers who were cited for including individual learner needs, motivation, and aptitudes
in their classroom practice (Ruddell, 1999). The notion that there is a link between
teacher efficacy and students’ skills is a persistent theme in education research
(Wenglinsky, 2000). Weinberger and McCombs (2001) reports academic performance as
well as non-academic outcomes improved in learning environments where teachers
displayed a higher amount of learner-centered practices over non-learner-centered
practices (Weinberger & McCombs, 2001).
Teacher attitudes impact student achievement. Several researchers (Foster &
Peele, 1999; Nieto, 2000) believe that effective teachers have high and clear expectations,
and believe all students can learn (Foster & Peele, 1999; Nieto, 2000). Accordingly, the
effective schools research reports that instruction, curriculum, and assessment designed to
meet the various needs of students in a safe and orderly climate of high expectation of
learning produced effective student motivation and student achievement (Edmonds,
1979).
Teacher expectations are more important for students who make up our
disenfranchised populations and sub-groups (Paul, 2005; Silver, Smith, & Nelson, 1995).
Numerous research studies have linked teacher expectations with math-related outcomes
(Turner et al., 2003; Tyler & Boelter, 2008).
Despite current reform efforts, which focus on the principal’s role in instructional
leadership, the teacher’s role is especially important in instructional reform because of
direct impact with instruction at the classroom level (Heller & Firestone, 1995; Firestone,
1996). Teacher effectiveness has gained much attention with regards to student
achievement and performance. As a result, the Interstate New Teacher Assessment and

28
Support Consortium (InTASC) developed a new vision of teaching for improving student
achievement, which has resulted in the introduction of ten new teaching standards.
Specifically, Standard 9: Professional Learning and Ethical Practice addresses the
teachers’ ability to reflect and evaluate how their choices impact learners (Council of
Chief State School Officers [CCSSO], 2011).
Teacher behaviors, beliefs, and practices impact learning (McCombs, 2003a).
How teachers work with students is greatly influenced by policy and by what they believe
about student learning and behavior (McREL, 1995). In order to design and implement
effective systemic reform, the basic structural domains of the educational systems and the
process of systemic change itself must be thoroughly examined (Marzano & Kendall,
1996).
A Nation at Risk, reported in 1983, is similar to NCLB and highlights America’s
economic threat as a result of deficiencies in the education system (National Commission
on Excellence in Education, 1983). School reform has been a topic of public education
for the past 100 years. Education reform comes in cycles, usually designed like recipes
for success. Rather than focus on the classroom, many reform efforts focus on curriculum
and organization structures (Tyack & Cuban, 1995). Accordingly, one of North Carolina
Department of Public Instruction’s reform effort that focuses on teacher effectiveness
includes the new teacher evaluation instrument (Public Schools, 2011).
With attention to teacher quality, one of the strategies employed to improve both
student and teacher learning is professional learning communities. Professional learning
communities have been cited as a key success factor for school improvement (Eaker et
al., 2002).

29
A professional learning community (PLC) is best defined as a learning
organization where people continually build their capacity to create desired outcomes,
new ways of thinking are nurtured, and collective aspirations are set free. With attention
to the word community, professional learning communities emphasize relationships,
shared ideals, and a strong culture (DuFour & Eaker, 1998; Senge, 1990).
Learner-centered practices communicate the importance of continuous
improvement, human needs, and relationship for optimal learning to occur. Several
reform efforts have ignored learners and their needs (McCombs, 2003b). As a result of
the increased need to focus on learner-centeredness, the InTASC revised model’s core
standards (10) set forth new and higher expectations for teachers. In brief, the revised
standards are designed for teachers to be accountable for the learning of all their students
(CCSSO, 2011).
Specifically, Standards 3, 6, 7, 8, 9, and 10 (CCSSO, 2011), directly relate to
teacher beliefs, expectations, motivation, and learning. In short, the standards (CCSSO,
2011) directly related are:
Standard #3: Learning Environments. The teacher works with others to create
environments that support individual and collaborative learning, and that
encourage positive social interaction, active engagement in learning, and self-
motivation. (p. 12)
Standard #6: Assessment. The teacher understands and uses multiple methods of
assessment to engage learners in their own growth, to monitor learner progress,
and to guide the teacher’s and learner’s decision making. (p. 18)
Standard #7: Planning for Instruction. The teacher plans instruction that supports

30
every student in meeting rigorous learning goals by drawing upon knowledge of
content areas, curriculum, cross-disciplinary skills, and pedagogy, as well as
knowledge of learners and the community context. (p. 16)
Standard #8: Instructional Strategies. The teacher understands and uses a variety
of instructional strategies to encourage learners to develop deep understanding of
content areas and their connections, and to build skills to apply knowledge in
meaningful ways. (p. 17)
Standard #9: Professional Learning and Ethical Practice. The teacher engages in
ongoing professional learning and uses evidence to continually evaluate his/her
practice, particularly the effects of his/her choices and actions on others (learners,
families, other professionals, and the community), and adapts practice to meet the
needs of each learner. (p. 18)
Standard #10: Leadership and Collaboration. The teacher seeks appropriate
leadership roles and opportunities to take responsibility for student learning, to
collaborate with learners, families, colleagues, other school professionals, and
community members to ensure learner growth, and to advance the profession. (p.
19)
The model core standards articulate learner-centered beliefs and teacher efficacy
as evidenced by their focus on the learner, teacher skill-set, motivation, and teacher
reflection (CCSSO, 2011). North Carolina’s new Teacher Evaluation Instrument,
designed by McREL, mirrors the revised InTASC standards. Specifically, the new
instrument addresses teachers being reflective practitioners via Standard 5: Teachers
Reflect on their Practice (Public Schools, 2011).

31
Summary of Literature Review
The section on Level I research included the history of the Learner-Centered
Psychological Principles, validation and construction of the learner-centered
psychological principles, definition of learner-centered and closing statements on the
theoretical foundation of the learner-centered principles (APA, 1993, 1997; McCombs,
1999; McCombs & Lauer, 1997).
The Level II research section provided an analyses of the learner-centered battery,
assessment of learner-centered practices, learner-centered psychological principles (APA,
1993, 1997; McCombs, 1999; McCombs & Lauer, 1997; Weinberger & McCombs,
2001), and student achievement (McCombs & Lauer, 1997, McCombs & Whisler, 1997;
Meece, 2003; Weinberger & McCombs, 2001).
Consequently, the review of Level III research does not exist due. The absence of
Level III research is in attributed to the nature of the learner-centered psychological
principles, which do not exist in isolation. Accordingly, Level I and Level II research
provided a brief overview of the learner-centered principles structured utilizing Ellis and
Fouts’s (1993) description of Level III research. Most important to this study is the fact
that questions about teacher learner-centered beliefs and practices have yet to be
correlated with student achievement as measured by the North Carolina EOG Test.
Purpose Statement
The purpose of this study was to examine the relationship of learner-centered
beliefs of eighth-grade math teachers and students enrolled in their respective districts
performance on the North Carolina End-of-Grade (EOG) Mathematics Test. Quantitative
data were collected via the Teacher Beliefs Survey, North Carolina School Report

32
Cards/Profiles, and North Carolina eighth-grade EOG math scores. Data were collected
from teachers representative of the schools that reside in five districts (n = 5) that are a
part of the Sandhills Regional Education Consortium (SREC).
The schools selected were located in the central part of North Carolina. North
Carolina is home to 100 county districts, 15 city districts, 99 charter schools, and 71 early
colleges. A combined 2,524 schools served 1,475,668 students (Public Schools, 2011).
Five (n = 5) of the 115 districts were part of the SREC, and five districts participated
(SREC, 2011).
Although similar studies have been conducted in other states, research using the
Teacher Beliefs Survey to examine teacher efficacy and student achievement based on
mathematics has not been formatively researched in North Carolina. The information
gained from this study extends beyond the rural district in which the author works and
provides a framework for future study in all of North Carolina Public Schools and
beyond.
Hypotheses
As a result of the literature review the following hypotheses emerged:
Hypothesis 1. Districts that have a higher percentage of students meeting (Level
III) or exceeding (Level IV) the state standard on the eighth-grade EOG Mathematics
Test have learner-centered teachers teaching mathematics.
Hypothesis 2. Districts that have a lower percentage of students meeting (Level
III) or exceeding (Level IV) the state standard on the eighth-grade EOG Mathematics
Test have non-learner-centered teachers teaching mathematics.
Hypothesis 3. There is a higher correlation between student performance on the

33
eighth-grade EOG Mathematics Test with teachers with learner-centered beliefs.
Hypothesis 4. There is a higher inverse correlation between student performance
on the eighth-grade EOG Mathematics Test with teachers with non-learner-centered
beliefs.
Research Questions
This study was directed by research questions categorized by two separate
purposes. The first category consisted of questions designed to examine the relationship
of learner-centered beliefs of eighth-grade math teachers and student achievement. The
second category consisted of questions designed to determine if there are differences
between eighth-grade math teachers on their learner-centered beliefs. The research
questions are:
Research Question 1. What is the level of learner-centered beliefs by eighth-
grade math teachers?
Research Question 2. Is there a difference in the level of learner-centered beliefs
and non-learner-centered beliefs about the learner, teaching and learning of teachers, and
student achievement on the eighth-grade 2011 EOG Mathematics Test?
Research Question 3. Is there a difference in the level of learner-centered beliefs
about the learner between teachers in districts with a higher percentage of students who
met or exceeded state standards on the eighth-grade EOG Mathematics Test?
Research Question 4. Is there a difference in the level of non-learner-centered
beliefs about the learner between teachers in districts with a higher percentage of students
who met or exceeded state standards on the eighth-grade EOG Mathematics Test?
Research Question 5. Is there as difference in the level of non-learner-centered

34
beliefs about teaching and learning between teachers in districts with a higher percentage
of students who met or exceeded state standards on the eighth-grade EOG Mathematics
Test than those teachers with a lower percentage of students who met or exceeded state
standards on the eighth-grade EOG Mathematics Test?
Research Question 6. What is the relationship of learner-centered beliefs of
eighth-grade mathematics teachers and student achievement between districts within the
SREC on the eighth-grade EOG Mathematics Test in 2011?

35
Chapter 3: Methodology
General Design
This study was designed to explore six questions via a non-experimental research
design utilizing descriptive as well as causal comparative design components. The
purpose of this study was to determine the learner-centered beliefs of selected eighth-
grade mathematics teachers in the SREC in the state of North Carolina. Therefore, this
study examined and compared the learner-centered beliefs of teachers to determine
differences, if any, as well as possible causal relationships with the performance of
students on the eighth-grade EOG mathematics test.
Participants
The 16 participants (n = 16) in this study consisted of middle school mathematics
teachers from middle schools located in five (n = 5) of the 12 Local Educational
Agencies (LEAs) in the Sandhills region of North Carolina. The participants were
selected based on their teaching of eighth-grade mathematics during the 2010-2011
school year. The districts represented in this study are Anson County, Cumberland
County, Harnett County, Montgomery County, and Richmond County. The participants
consisted of teachers from districts with 70-80% of students proficient via a Level III or
Level IV. North Carolina Department of Public Instruction (2011) defines proficient as
achieving Level III (met standard) or Level IV (exceeded standard) on the EOG
Mathematics Test. The participating districts respective proficiency percentages on the
eighth-grade EOG Mathematics Test for the 2010-2011 school year were a) Anson
County 72%, b) Cumberland County 77.4%, c) Harnett County 74.8%, d) Montgomery
County 75.3%, and e) Richmond County 70.7%.

36
Rarely are samples identical to their population of study when they only represent
a small portion of the population (Fraenkel & Wallen, 2006). Ary, Jacobs, and Razavieh
(2009) reported that the sampling errors of the mean (difference between a sample and its
population) yielded specific known laws to include:
The expected mean of sampling errors is zero, sampling error is an inverse
function of sample size, sampling error is a direct function of the standard
deviation of the population and sampling errors are distributed in a normal or
near-normal manner around the expected mean of zero. (pp. 159–160)
Instrument
Teacher Beliefs Survey. The instrument used in this study contained two
sections-Part I: Background and Demographic Information and Part II: Teacher Beliefs
Survey.
Part I: Background and Demographic Information. In this section,
participants were asked to identify (a) the total number of years teaching, (b) the number
of years teaching mathematics, and (c) the number of years teaching middles school
mathematics. In addition participants were asked to identify their undergraduate major
and minor as well as the highest degree earned.
Part II: Teacher Beliefs Survey. The Teacher Beliefs Survey (McREL, 1994)
contains 35 items. The initial validation efforts focused on establishing internal
consistency reliability and factor structures (theoretically, sound sub-scales related to
learner-centered beliefs and practices) for the teacher scales. The results revealed 35
items divided into three subscales: (a) Learner-Centered Beliefs about Learners,
Learning, and Teaching (14 items, alpha = .87); (b) Nonlearner-Centered Beliefs about

37
Learners (9 items, alpha = .83); and (c) Nonlearner-Centered Beliefs about Teaching and
Learning, (12 items, alpha = .82) (McCombs, 1994).
The second phase of validation focused on establishing the predictive validity and
further constructs validity of the Teacher Survey (McCombs, 1994). Therefore, the
Teacher Beliefs Survey has demonstrated both internal consistency and construct
validity.
North Carolina EOG Mathematics Test. The measure of student achievement
was the North Carolina EOG Mathematics Test. The Mathematics Test consists of 82
multiple-choice questions. The Mathematics Test was designed to measure student
performance on goals, objectives, and grade-level competencies specified in the North
Carolina Standard Course of Study. Specific skills in number operation, measurement,
geometry, data analysis and probability, and algebra are assessed.
Student results are reported in scale scores, percentile scores, and achievement
levels. Scale scores provide a consistent method for interpretations of results from test to
test. Percentile scores show student performance relative to students who took the test
during the first year the tests were administered. Achievement Levels (I, II, III, or IV) are
used to provide an interpretation of student performance relative to pre-determined
standards based on ranges of scale scores. Specifically, this study focused on the
percentage of students who were proficient as determined by an achievement Level of III
or IV. The test is administered within the last 3 weeks of the school year (Public Schools,
2011).
Procedures
A sample of 16 (n = 16) math teachers assigned to teach eighth-grade math in

38
2010-2011 was identified from 5 (n = 5) of the 12 districts in the SREC. An electronic
cover letter requesting participation and explaining the purpose of the study was emailed
to each eighth-grade math teacher. The researcher created a web-based survey site where
participants could take the survey at their convenience.
The study was designed to explore the answers to the six research questions. The
main question to be answered required a descriptive and causal comparative research
design. Accordingly, this study collected data on multiple variables to ascertain the
relationship between these variables (Fraenkel & Wallen, 2006). The independent
variable in this study was the teacher learner-centered beliefs as measured by the Teacher
Beliefs Survey. The dependent variable in this study was academic achievement as
measured by the North Carolina EOG eighth-grade math test.
Data Analysis
Using the IBM Statistical Package for Social Sciences Base 20 (IBM, 2011), data
from descriptive statistics utilizing mean and independent measures t-tests are reported in
Chapter 4. Inferential statistics utilizing an Analysis of Variance and Pearson Product-
Moment Correlation Coefficient were used in data analysis of the Teacher Beliefs Survey
(IBM, 2011).
Descriptive Statistics
Specifically, descriptive statistics were utilized to determine the measures of
central tendency and measures of variability. The Teacher Beliefs Survey results are
reported via a total score measuring each of the following three factors: (a) Learner-
Centered Beliefs about learners, learning, and teaching (14 items); (b) Non-learner-
centered beliefs about learners; and (c) Non-learner-centered beliefs about teaching and
39
learning.
The total score possible for Learner-Centered Beliefs about learners, learning, and
teaching (14 items) ranges from a low of 14 (14 x 1) to a high of 56 (14 x 4); the total
possible score for Non-Learner-Centered Beliefs about learners (9 items) ranges from a
low of 9 (9 x 1) to a high of 36 (9 x 4); and the total possible score for Non-Learner-
Centered Beliefs about learning and teaching (12 items) ranges from a low of 12 (12 x 1)
to a high of 48 (12 x 4). Once totaled, each factor was divided by the number of items in
each factor, resulting in a mean score. Likewise, the validation sample means were: a)
Factor 1, 3.22; b) Factor 2, 2.28; and c) Factor 3, 2.31 (McCombs & Whisler, 1997).
Consequently, McCombs and Whisler’s (1997) research identified those teachers
with M > 3.4 for Learner-Centered Beliefs, M < 2.0 for Non-Learner-Centered Beliefs
about learners, and M < 2.0 for Non-Learner-Centered Beliefs about Teaching and
Learning as teachers with learner-centered beliefs.
Conversely, research identified those with M > 2.8 for Learner-Centered Beliefs,
M > 2.4 for Non-Learner-Centered Beliefs about learners, and M > 2.4 for Non-Learner-
Centered Beliefs about Teaching and Learning as teachers with non-learner-centered
beliefs (McCombs & Whisler, 1997).
In addition to the Teacher Beliefs, the survey included demographic questions
such as years of math-teaching experience, area of academic preparation, and level of
education attained.
Inferential Statistics
In addition to studying relationships, several research questions were designed to
explore differences. To that end, an analysis of variance (ANOVA) statistical procedure

40
was utilized to determine where and on which specific variables differences existed
between means on each factor of the Teacher Beliefs Survey. As Kaufhold (2007)
pointed out, an “ANOVA is used to compare the differences in more than two means and
a further breakdown could be made” (p. 81). Particularly, the ANOVA tested the
following: (a) teacher results in the same district, (b) teacher results from within each
category, and (c) teacher results from both categories to determine whether each factor
and the interactions between the factors were statistically significant.
The results from the eighth-grade 2011 EOG Mathematics Test served as a
dependent variable, and an ANOVA to obtain an F-stat yielded the following between
each school: (a) teachers’ degree of learner-centeredness and the individual test score for
each school, (b) teachers’ degree of non-learner-centeredness about learners and the
individual test score for each school, and (c) teachers’ degree of non-learner-centeredness
about learning and teaching the individual test score for each school. An appropriate post
hoc analysis was not conducted because the ANOVA did not determine a significant
difference.
A Pearson Product-Moment correlation was performed to determine the
relationship, if any, between teacher beliefs and performance on the eighth-grade 2011
EOG Mathematics Test. Chiefly, the teachers’ degrees of learner-centeredness, non-
learner-centeredness about learners, and non-learner-centeredness about learning and
teaching were examined to determine the direction and magnitude of a relationship, if
any, between student achievement and teacher beliefs.
Summary of Methodology
In summary, the methodology implemented in this research study were designed

41
to answer six research questions. Descriptive statistics was used to determine the mean
and variability, and inferential statistics including the Independent Sample t-test, Analysis
of Variance, and Pearson Product Moment Correlation Coefficient were used to
determine differences and possible causal relationships between the learner-centered
beliefs of selected eighth-grade mathematics teachers in the state of North Carolina with
the performance of students on the eighth-grade EOG Mathematics Test.

42
Chapter 4: Results
Four sections frame the organization of the results chapter. Section one includes
demographic characteristics of the districts and the eighth-grade mathematics teachers
who participated in this research study. Section two includes the results of four
hypotheses. Section three is separated into six sub-sections. The sub-section reports the
answers to the six research questions, statistical analysis, and the actual results. The last
section includes a summary of results.
Demographic Characteristics
Total years of teaching. One teacher (n = 1) or 6% were in their second through
fourth year of teaching (see Table 1). Five (n = 5) or 31% ranged from 5 to 9 years of
total teaching experience. Three (n = 3) or 19% had 10 to 15 years of total teaching
experience. Four (n = 4) or 25% ranged from 16 to 23 years of total teaching experience.
Finally, three (n = 3) or 19% had 24 years or more of total teaching experience. These
results are presented in Table 1.
Table 1
Total Years Teaching
District
1-4
years
5-9
years
10-15
years
16-23
years
24
years
Anson County Schools 2
Cumberland County Schools 4 1 2
Harnett County Schools 1 1 1 1
Montgomery County Schools 1 1
Richmond County Schools 1
Total 1 (6%) 5 (31%) 3 (19%) 4 (25%) 3 (19%)

43
Total years of teaching mathematics. As seen in Table 2, one teacher (n = 1) or
6% was in the second through fourth year of teaching mathematics (see Table 2). Four (n
= 4) or 25% ranged from 5 to 9 years of teaching mathematics. Five (n = 5) or 31% had
10 to 15 years of teaching mathematics. Three (n = 3) or 19% ranged from 16 to 23 years
of teaching mathematics. Finally, three (n = 3) or 19% had 24 years or more of teaching
mathematics.
Table 2
Total Years Teaching Math
District
1-4
years
5-9
years
10-15
years
16-23
years
24
years
Anson County Schools 2
Cumberland County Schools 3 2 1 1
Harnett County Schools 1 2 1
Montgomery County Schools 1 1
Richmond County Schools 1
Total 1 (6%) 4 (25%)
5 (31%)
3 (19%) 3 (19%)
Total years of teaching middle school mathematics. The following results are
displayed in Table 3. Two teachers (n = 2) or 13% were in their second through fourth
year of teaching mathematics at the middle school level. Four (n = 4) or 25% ranged from
5 to 9 years of teaching middle school mathematics. Three (n = 3) or 19% had 10 to 15
years of teaching middle school mathematics. Three (n = 3) or 19% ranged from 16 to 23
years of teaching middle school mathematics. Finally, four (n = 4) or 25% had 24 years
or more of teaching middle school mathematics (see Table 3).

44
Table 3
Total Years Teaching Middle School Math
District
1-4
years
5-9
years
10-15
years
16-23
years
24
years
Anson County Schools 2
Cumberland County Schools 1 3 1 1 1
Harnett County Schools 1 1 1 1
Montgomery County Schools 1 1
Richmond County Schools 1
Total 2 (13%) 4 (25%) 3 (19%) 3 (19%) 4 (25%)
Major area of teaching preparation. Ten teachers (n = 10) or 63% reported that
mathematics was their major area of teacher preparation. One (n = 1) or 6% reported
science as the major area of teacher preparation. One (n = 1) or 6% reported language arts
as the major area of teacher preparation. One (n = 1) or 6% reported Social Studies as the
major area of teacher preparation. Lastly, three (n = 3) or 19% reported “other” as their
major area of teacher preparation (see Table 4).
Table 4
Major Area of Teaching
District
Mathematics
Science
Language
Arts
Social
Studies
Other
Anson County Schools 2
Cumberland County Schools 3 1 1 2
Harnett County Schools 3 1
Montgomery County Schools 1 1
Richmond County Schools 1
Total 10 (63%) 1 (6%) 1 (6%) 1 (6%) 3 (19%)

45
Minor area of teaching preparation. As seen in Table 5, six teachers (n = 6) or
38% indicated that mathematics was their minor area of teacher preparation. Three (n =
3) or 19% identified science as their minor area of teacher preparation. One (n = 1) or 6%
identified language arts as the minor area of teacher preparation. Two (n = 2) or 13%
identified social studies as their minor area of teacher preparation. Finally, four (n = 4) or
25% identified “other” as their minor area of teacher preparation.
Table 5
Minor Area of Teaching
District
Mathematics
Science
Language
Arts
Social
Studies
Other
Anson County Schools 1 1
Cumberland County Schools 3 1 1 2
Harnett County Schools 2 1 1
Montgomery County Schools 1 1
Richmond County Schools 1
Total 6 (38%) 3 (19%) 1 (6%) 2 (13%) 4 (25%)
Highest degree earned. Ten teachers (n = 10) or 63% indicated their highest
degree was either a Bachelor of Arts or Bachelor of Science. Six (n = 6) or 38% indicated
their highest degree earned was either a Masters of Art or a Masters of Science. There
were no participants who indicated they had earned a doctorate (see Table 6).

46
Table 6
Highest Degree Earned
District BA/BS MA/MS Ph.D./Ed.D.
Anson County Schools 1 1
Cumberland County Schools 6 1
Harnett County Schools 4
Montgomery County Schools 2
Richmond County Schools 1
Total 10 (63%) 6 (38%)
Data Report
From the review of literature, four hypotheses were identified and investigated
through six research questions. The four hypotheses were:
Hypothesis 1. Districts that have a higher percentage of students meeting (Level
III) or exceeding (Level IV) the state standard on the eighth grade EOG Mathematics
Test have learner-centered teachers teaching mathematics.
Hypothesis 2. Districts that have a lower percentage of students meeting (Level
III) or exceeding (Level IV) the state standard on the eighth-grade EOG Mathematics
Test have non-learner-centered teachers teaching mathematics.
Hypothesis 3. There is a higher correlation between student performance on the
Eighth-grade EOG Mathematics Test with teachers with learner-centered beliefs.
Hypothesis 4. There is a higher inverse correlation between student performance
on the eighth-grade EOG Mathematics Test with teachers with non-learner-centered
beliefs.
To test the null hypothesis, six research questions were identified. The results
from each research question are described in the following sections.

47
Research Question 1. What is the level of learner-centered beliefs by eighth-
grade math teachers? McCombs and Whisler (1997) defined those teachers with M > 3.4
for Learner-Centered Beliefs, M < 2.0 for Non-learner-centered Beliefs about Learners,
and M < 2.0 for Non-learner-centered Beliefs about Teaching and Learning as teachers
with learner-centered beliefs. Teachers with M < 2.8 for Learner-Centered Beliefs, M >
2.4 for Non-learner-centered Beliefs about Learners, and M > 2.4 for Non-learner-
centered Beliefs about Teaching and Learning were identified as teachers with non-
learner-centered beliefs. Utilizing descriptive statistics and calculating the mean, the
results of Research Question 1 are shown in Table 7.

48
Table 7
Learner-Centered Beliefs Means
School
LCB
NLCB
(Learners)
NLCB
(Learning and Teaching)
Richmond County Schools-A 3.4 2.4 2.3
Cumberland County Schools-A 3.6 1.9 3.1
Cumberland County Schools-B 2.2 2.1 2.3
Cumberland County Schools-C 4.0 1.3 2.9
Cumberland County Schools-D 2.3 2.1 3.2
Cumberland County Schools-E 3.9 2.4 3.5
Cumberland County Schools-F 3.9 1.9 2.0
Cumberland County Schools-G 2.9 2.4 2.8
Anson County Schools-A 3.5 2.2 2.8
Anson County Schools-B 3.2 1.8 2.7
Harnett County Schools-A 3.5 2.9 2.8
Harnett County Schools-B 3.5 1.6 2.3
Harnett County Schools-C 2.8 3.7 3.2
Harnett County Schools-D 3.2 1.7 2.5
Montgomery County Schools-A 2.8 2.9 3.1
Montgomery County Schools-B 4 4 4
McCombs and Whisler (1997) reported that standard deviations for each factor
were .40, .56, and .49. However, the standard deviations for this study based on all three
factors were .55, .74, and .51 respectively (see Table 8). Thirteen teachers (n = 13) did
not meet McCombs and Whisler (1997) statistical definition of a learner-centered teacher
or non-learner-centered teacher. One teacher (n = 1) met the criteria for learner-centered
beliefs (see Table 9).
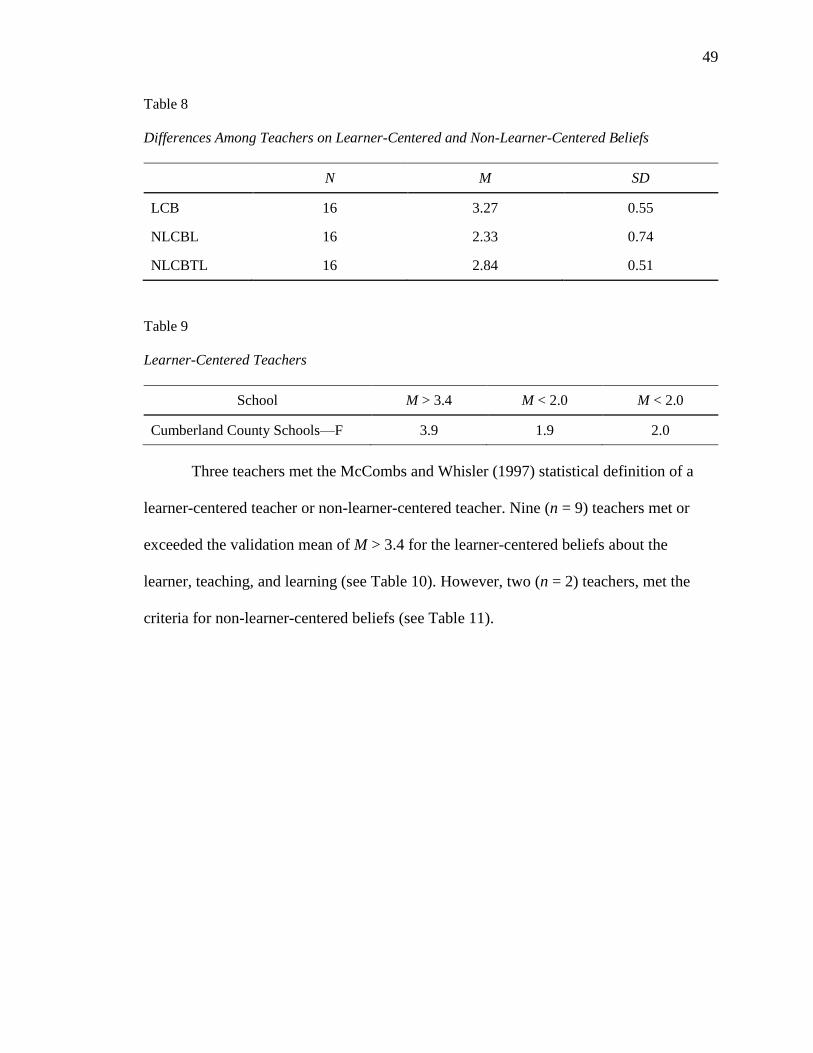
49
Table 8
Differences Among Teachers on Learner-Centered and Non-Learner-Centered Beliefs
N M SD
LCB 16 3.27 0.55
NLCBL 16 2.33 0.74
NLCBTL 16 2.84 0.51
Table 9
Learner-Centered Teachers
School M > 3.4 M < 2.0 M < 2.0
Cumberland County Schools—F 3.9 1.9 2.0
Three teachers met the McCombs and Whisler (1997) statistical definition of a
learner-centered teacher or non-learner-centered teacher. Nine (n = 9) teachers met or
exceeded the validation mean of M > 3.4 for the learner-centered beliefs about the
learner, teaching, and learning (see Table 10). However, two (n = 2) teachers, met the
criteria for non-learner-centered beliefs (see Table 11).

50
Table 10
Teachers Above the Validation Mean for Learner-Centered Beliefs
School LCB M > 3.4
Richmond County Schools – A 3.4
Cumberland County Schools – A 3.6
Cumberland County Schools – C 4
Cumberland County Schools – E 3.9
Cumberland County Schools – F 3.9
Anson County Schools – A 3.5
Harnett County Schools – A 3.5
Harnett County Schools – B 3.5
Montgomery County Schools – B 4
Table 11
Non-Learner-Centered Teachers
School M < 2.8 M > 2.4 M > 2.4
Harnett County Schools – C 2.8 3.7 3.2
Montgomery County Schools – A 2.8 2.9 3.1
As displayed in Tables 12 and 13, only two teachers met the McCombs and
Whisler (1997) statistical definition of a non-learner-centered teacher. Two (n = 2)
teachers were below the validation mean of M < 2.8 for the learner-centered beliefs about
the learner, teaching, and learning. Fourteen teachers (n = 14) were above the validation
mean associated with non-learner-centered beliefs. In concert, seven (n = 7) teachers
were above the validation mean of M > 2.4 for the non-learner-centered beliefs about the
learner and fifteen teachers (n = 15) were above the validation mean of M > 2.4 for non-
learner-centered beliefs about teaching and learning.

51
Table 12
Teachers Above the Validation Mean for Non-Learner-Centered Beliefs: Learner
School NLCB (Learners)
Richmond County Schools – A 2.4
Cumberland County Schools – E 2.4
Cumberland County Schools – G 2.4
Harnett County Schools – A 2.9
Harnett County Schools – C 3.7
Montgomery County Schools – A 2.9
Montgomery County Schools – B 4
Table 13
Teachers Above the Validation Mean for Non-Learner-Centered Beliefs: Teaching and Learning
School NLCB (Learning and Teaching)
Richmond County Schools – A 2.3
Cumberland County Schools – A 3.1
Cumberland County Schools – B 2.3
Cumberland County Schools – C 2.9
Cumberland County Schools – D 3.2
Cumberland County Schools – E 3.5
Cumberland County Schools – G 2.8
Anson County Schools – A 2.8
Anson County Schools – B 2.7
Harnett County Schools – A 2.8
Harnett County Schools – B 2.3
Harnett County Schools – C 3.2
Harnett County Schools – D 2.5
Montgomery County Schools – A 3.1
Montgomery County Schools – B 4

52
Research Question 2. Is there a difference in the level of learner-centered beliefs
and non-learner-centered beliefs about the learner, teaching and learning of teachers and
student performance on the eighth grade 2011 EOG Mathematics Test?
An analysis of variance (ANOVA) was conducted to assess whether the North
Carolina EOG mathematics scale score means were statistically significantly different
among the learner-centered belief means, non-learner-centered beliefs about learners
means, and non-learner-centered beliefs about teaching and learning means. The test
results, which can be seen in Table 14, failed to identify a statistically significant
difference. Because the overall F test was not significant, no follow-up tests were
conducted.
Table 14
Analysis of Variance for Total Score
Source Df F Sig.
LCB 14 .005 .945
NLCBL 14 .005 .947
NLCBTL 14 1.970 .624
Research Question 3. Is there a difference in the level of learner-centered beliefs
about the learner between teachers in districts with a higher percentage of students who
met or exceeded state standards on the eighth-grade EOG Mathematics Test?
An overall score from the Teacher Beliefs Survey was calculated along with a
total mean along with each district’s eighth grade EOG Mathematics Tests. An
independent samples t-test was performed to evaluate if a statistical difference existed
between higher-performing districts teacher scores on the level of learner-centered beliefs
(see Tables 15 and 16).

53
Table 15
Difference Between Teachers in High-Performing Districts Learner-Centered Beliefs
N M SD Std. Error Mean
LCB ≥ 75.3 9 3.27 .75 .215
< 75.3 7 3.29 .28 .104
Table 16
Independent Samples Test Between High- and Low-Performing Districts
Levene’s Test
for Equality of
Variances
F
Sig.
t
df
Sig.
(2-tailed)
Equal variances assumed 18.036 .001 -.071 14 .945
Equal variances not assumed -.078 10.6 .939
An Independent sample t-test was conducted to evaluate if a statistical difference
existed between high-performing districts teacher scores on the level of non-learner-
centered beliefs about the learner (see Tables 17 and 18). The test result, t (14) = .068, p
= .947, supported the hypothesis that teachers in higher-performing districts (M = 2.34,
SD = .76) were less non-learner-centered about the learners than teachers in lower-
performing districts (M = 2.32, SD = .76).
Table 17
Difference Between Teachers in Higher-Performing Districts: Non-Learner-Centered Beliefs
About the Learner
N M SD Std. Error Mean
NLCBL ≥ 75.3 9 2.34 .76 .253
< 75.3 7 2.32 .76 .287
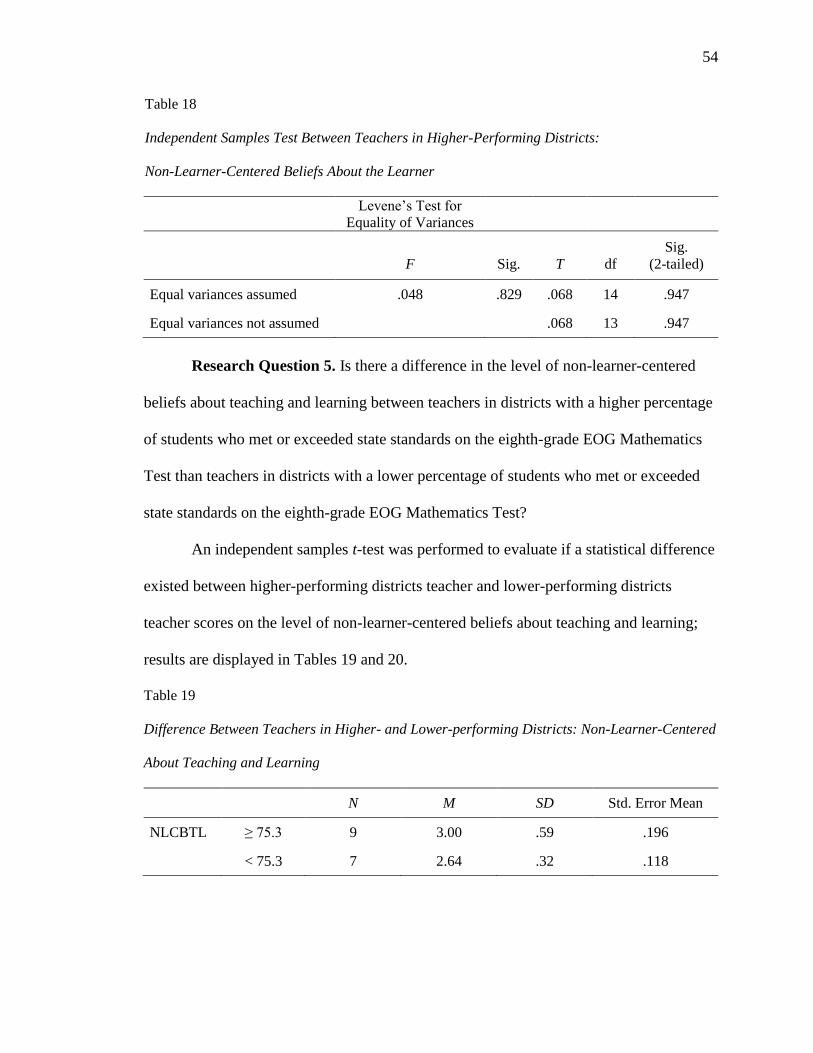
54
Table 18
Independent Samples Test Between Teachers in Higher-Performing Districts:
Non-Learner-Centered Beliefs About the Learner
Levene’s Test for
Equality of Variances
F
Sig.
T
df
Sig.
(2-tailed)
Equal variances assumed .048 .829 .068 14 .947
Equal variances not assumed .068 13 .947
Research Question 5. Is there a difference in the level of non-learner-centered
beliefs about teaching and learning between teachers in districts with a higher percentage
of students who met or exceeded state standards on the eighth-grade EOG Mathematics
Test than teachers in districts with a lower percentage of students who met or exceeded
state standards on the eighth-grade EOG Mathematics Test?
An independent samples t-test was performed to evaluate if a statistical difference
existed between higher-performing districts teacher and lower-performing districts
teacher scores on the level of non-learner-centered beliefs about teaching and learning;
results are displayed in Tables 19 and 20.
Table 19
Difference Between Teachers in Higher- and Lower-performing Districts: Non-Learner-Centered
About Teaching and Learning
N M SD Std. Error Mean
NLCBTL ≥ 75.3 9 3.00 .59 .196
< 75.3 7 2.64 .32 .118
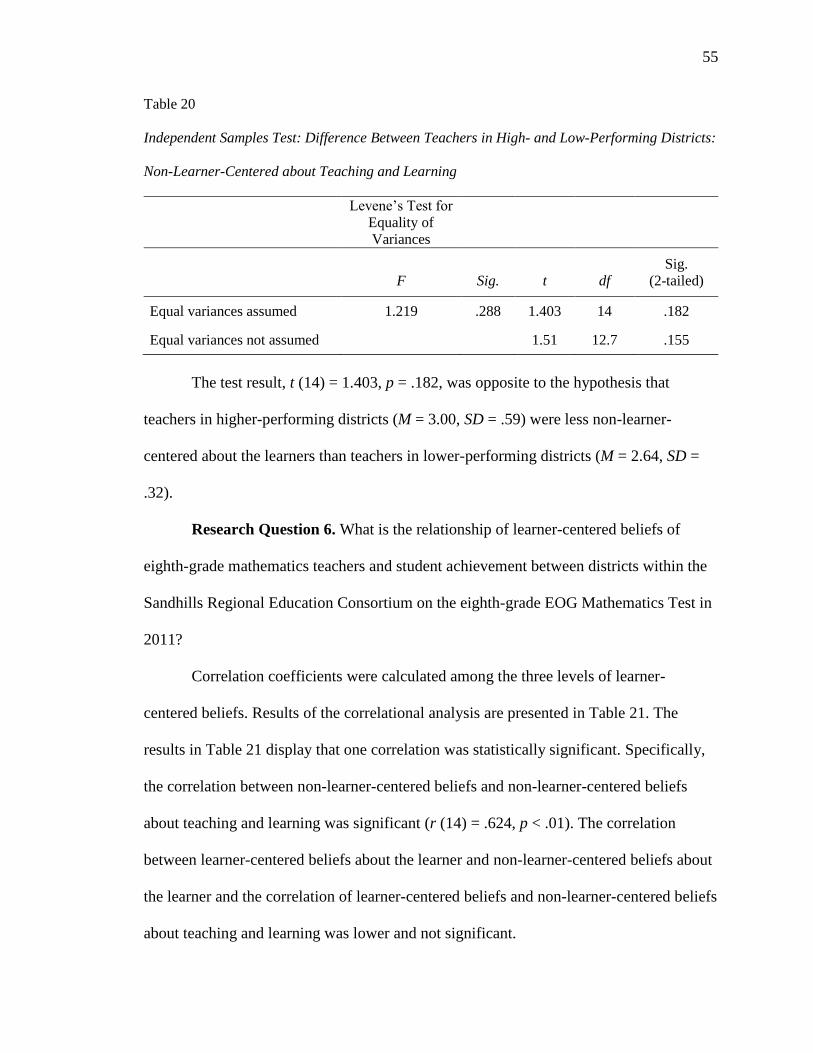
55
Table 20
Independent Samples Test: Difference Between Teachers in High- and Low-Performing Districts:
Non-Learner-Centered about Teaching and Learning
Levene’s Test for
Equality of
Variances
F
Sig.
t
df
Sig.
(2-tailed)
Equal variances assumed 1.219 .288 1.403 14 .182
Equal variances not assumed 1.51 12.7 .155
The test result, t (14) = 1.403, p = .182, was opposite to the hypothesis that
teachers in higher-performing districts (M = 3.00, SD = .59) were less non-learner-
centered about the learners than teachers in lower-performing districts (M = 2.64, SD =
.32).
Research Question 6. What is the relationship of learner-centered beliefs of
eighth-grade mathematics teachers and student achievement between districts within the
Sandhills Regional Education Consortium on the eighth-grade EOG Mathematics Test in
2011?
Correlation coefficients were calculated among the three levels of learner-
centered beliefs. Results of the correlational analysis are presented in Table 21. The
results in Table 21 display that one correlation was statistically significant. Specifically,
the correlation between non-learner-centered beliefs and non-learner-centered beliefs
about teaching and learning was significant (r (14) = .624, p < .01). The correlation
between learner-centered beliefs about the learner and non-learner-centered beliefs about
the learner and the correlation of learner-centered beliefs and non-learner-centered beliefs
about teaching and learning was lower and not significant.

56
Table 21
Correlations Among the Levels of Learner-Centeredness
NLCB
(Learners)
NLCB
(Teaching and Learning)
LCB -.065 .160
NLCB .624**
Note. **
p < .01
A second set of correlation coefficients was calculated among the three levels of
learner-centered beliefs with the Total Score (See Table 22). The correlation of the
Learner-Centered Beliefs with the Total Score resulted in r (14) = .520, p < .05. The
correlation of the non-learner-centered Beliefs about the Learner with the Total Score
resulted in r (14) = .564, p < .05. The correlation of the non-learner-centered Beliefs
about Teaching and Learning with the Total Score resulted in r (14) = .771, p < .01.
Thus, statistical significant correlations were achieved and were equal to or greater than
.35.
Table 22
Correlations Among the Levels of Learner-Centeredness with Total Score
LCB
NLCB
(Learners)
NLCB
(Learning and Teaching)
Total Score .52* .57
* .77
**
Note. *p < .05,
**p < .01
A third set of correlation coefficients was calculated among the three levels of
Learner-Centered Beliefs with the mean scale scores (See Table 23). The correlation of
the Learner-centered beliefs with the mean scale score resulted in r (14) = -.071, p < .425.
The correlation of the non-learner-centered Beliefs about the Learner with the mean scale
score resulted in r (14) = -.121, p < .655. The correlation of the non-learner-centered

57
Beliefs about Teaching and Learning with the mean scale score resulted in r (14) = .188,
p < .486. Thus, there were no statistically significant correlations from this analysis.
Table 23
Correlations Among the Levels of Learner-Centeredness with Mean Scale Score
LCB
NLCB
(Learners)
NLCB
(Learning and Teaching)
Mean Scale Score -.071 -.121 .188
Summary
This chapter reported demographic information on participants, descriptive
statistics, inferential statistics, and answers to six research questions that guided this
study. Demographic information describing the participants in the study was presented.
Descriptive statistics were utilized to statistically define the participants and data
collected from the Teacher Beliefs Survey. Using an Independent-Samples t-Tests,
Analysis of Variance, and Pearson Product-Moment Correlation Coefficient, all six
research questions were explored. Overall, the data analysis resulted in a failure to reject
the four null hypotheses and therefore did not show statistically significant differences or
statistically significant correlations between learner-centered teachers, non-learner-
centered teachers and student performance of students on the eighth-grade EOG
Mathematics Test in 2011. Statistical significance was identified with two of the three
Pearson Product Moment Correlation Coefficient data analyses. In Chapter 5, an in-depth
discussion of the results is presented based on the results reported in Chapter 4.

58
Chapter 5: Discussion
Chapter 5 is organized in the following sequence: (a) a review of the purpose of
this dissertation, (b) a discussion of the results and demographic data presented in
Chapter 4, (c) limitations of this study, and (d) a conclusion accompanied by
recommendations for future study.
Review of Dissertation
This study examined the relationships of learner-centered beliefs of eighth grade
math teachers and their student performance on the North Carolina Eighth Grade End-of-
Grade Mathematics Test. Specifically, the researcher focused on teachers and districts
located in the Sandhills Regional Education Consortium in central North Carolina.
Implications of Findings
Sixteen (n = 16) teachers who taught eighth grade mathematics during the 2010-
2011 school year in a district located in the Sandhills Regional Education Consortium
participated in this study. The 16 teachers represented 5 of the 12 districts that makeup
the Sandhills Regional Education Consortium. The majority of the teachers had been
teaching middle school mathematics for 5 or more years and majored in mathematics.
With regards to advance degrees, only about one-third of the participants held a Master’s
degree. The demographic data did not suggest a difference in total years teaching, total
years teaching mathematics, area of preparation, or highest degree earned with the level
of learner-centered beliefs. Interestingly, Harnett County teachers (n = 4) all held
Master’s Degrees; however, Harnett County yielded one of the two results for a non-
learner-centered teacher. These factors may impact student performance; however, they
are beyond the scope of this study and further investigation is worthy.

59
As identified as a potential limitation, the sample size (n = 16) was selected based
primarily on the permissions granted by secondary district superintendents within the
Sandhills Regional Education Consortium. For research purposes, a sample should be as
large as the researcher can obtain with a reasonable expenditure of time and resources;
however, 30 participants are recommended as a general guideline for sample size
(Fraenkel & Wallen, 2006). Though this study reflects the sample size obtainable by the
researcher and the researcher collected data over a 3-month period, the small sample size
does bring into question the external validity or generalizability of results. Therefore, the
extent to which the conclusions from this study can be believed to accurately reflect the
results of 5 districts (n = 5) and 16 (n = 16) middle school teachers in North Carolina is a
concern. Ary et al. (2009) stated, “[We] can justify stating that a sample mean is an
unbiased estimate of the population mean and is a reasonable estimate of the population
mean” (p. 159). Most importantly, the design of the study looked at eighth-grade
mathematics teachers from districts in the Sandhills Regional Education Consortium in
an effort to assess, if present, the level of learner-centered beliefs and their statistical
difference and the impact of those beliefs on student achievement. To the degree that
superintendents agreed to the study, teachers of eighth-grade mathematics were asked to
participate based on their teaching eighth-grade mathematics during the 2010-2011
school year. It is necessary to make mention again the small sample size of this study was
due to seeking permission from superintendents and due to the maximum amount
research projects districts allow per year. As such, this sample size was a limitation to the
study.
This study also proved to be unique in that one achievement area was examined—

60
mathematics. Given that the purpose of this present study was to ascertain the level of
learner-centeredness among eighth-grade mathematics teachers, it was important to focus
specifically on their beliefs. According to Fraenkel and Wallen (2006), a sample size of
sixteen (n = 16) does not necessarily mean the sample was too small to justify the
conclusions of the research. Arguably, the most important characteristic of a sample is its
representativeness, not its size. Given that several of the districts represented in this study
were home to less than 3 middle schools, the participants were representative of those
districts.
The demographic information did not suggest a difference in the total years of
teaching, total years of teaching mathematics, total years of teaching college
mathematics, areas of preparation, or highest degree earned with the level of learner-
centered beliefs. It is possible that these factors were beyond the range of this research
study. Nevertheless, the possible differences are worthy of further investigations.
The review of literature identified four hypotheses. Previously reported in Chapter
4, the null hypotheses for each of the four hypotheses were tested through six research
questions. The information in the section below states each hypotheses followed by the
applicable research question (s) and discussion
Hypothesis 1. Districts that have a higher percentage of students meeting (Level
III) or exceeding (Level IV) the state standard on the eighth grade EOG Mathematics
Test have learner-centered teachers teaching mathematics.
Hypothesis 2. Districts that have a lower percentage of students meeting (Level
III) or exceeding (Level IV) the state standard on the eighth-grade EOG Mathematics
Test have non-learner-centered teachers teaching mathematics.

61
Research Question 1. What is the level of learner-centered beliefs by eighth-
grade math teachers? To determine the level of learner-centered beliefs of eighth-grade
mathematics teachers, the means from each factor were statistically compared to the
validation means. The results, as reported in Chapter 4, identified one teacher (n = 1) as
meeting the statistical criteria for non-learner-centered beliefs. However, only three (n =
3) teachers met the McCombs and Whisler (1997) statistical definition of a learner-
centered teacher or non-learner-centered teacher. Subsequently, upon a more careful
examination, nine (n = 9) teachers met or exceeded the validation mean of M > 3.4 for the
learner-centered beliefs about the learner, teaching, and learning. Conversely, two (n = 2)
teachers met the criteria for non-learner-centered beliefs. In conclusion, only one teacher
met the criteria for learner-centered.
Research Question 6. What is the relationship of learner-centered beliefs of
eighth-grade mathematics teachers and student achievement between districts within the
Sandhills Regional Education Consortium on the eighth-grade EOG Mathematics Test in
2011? Specifically, the correlation between non-learner-centered beliefs and non-learner-
centered beliefs about teaching and learning was significant (p < .01); however, after
correlating among the three factors, there were no statistically significant correlations (p
< .486) between leaner-centered beliefs, non-learner-centered beliefs about the learner,
and non-learner-centered beliefs about learning and teaching and their impact on student
achievement.
Overall, these findings were not statistically significant; they highlight a better
understanding about the participants in this study and the statistical significance of two of
the three Pearson Product -Moment Correlations Coefficient data analyses. Chiefly, the

62
results failed to reject null Hypotheses 1 and 2. This study suggests that teachers’ beliefs
do not have an impact on student performance as measured by the eighth-grade EOG
Mathematics Test. Although the sample size (n = 16) was small, the results suggest that
teacher beliefs and practices may not be identical with regards to mathematics
achievement.
Hypothesis 3. There is a higher correlation between student performance on the
eighth-grade EOG Mathematics Test with teachers with learner-centered beliefs.
Hypothesis 4. There is a higher inverse correlation between student performance
on the eighth-grade EOG Mathematics Test with teachers with non-learner-centered
beliefs.
Research Question 2. Is there a difference in the level of learner-centered beliefs
and non-learner-centered beliefs about the learner, teaching and learning of teachers and
student performance on the eighth-grade 2011 EOG Mathematics Test?
An analysis of variance (ANOVA) measured whether the North Carolina EOG
mathematics proficient means were statistically significantly different among the learner-
centered beliefs about learners’ means, and non-learner-centered beliefs about learners’
means, and non-learner-centered beliefs about teaching and learning means. The test
results failed to identify a statistically significant difference. Therefore, the results of this
research question rejected the null hypothesis. There is no difference in teacher learner-
centered beliefs and student performance on the eighth-grade 2011 EOG Mathematics
Test. Results suggested that learner-centered beliefs of eighth-grade mathematics teachers
may be aligned with classroom practices; therefore, further investigation including
student perceptions and teacher actions are warranted to make a better judgment eighth-
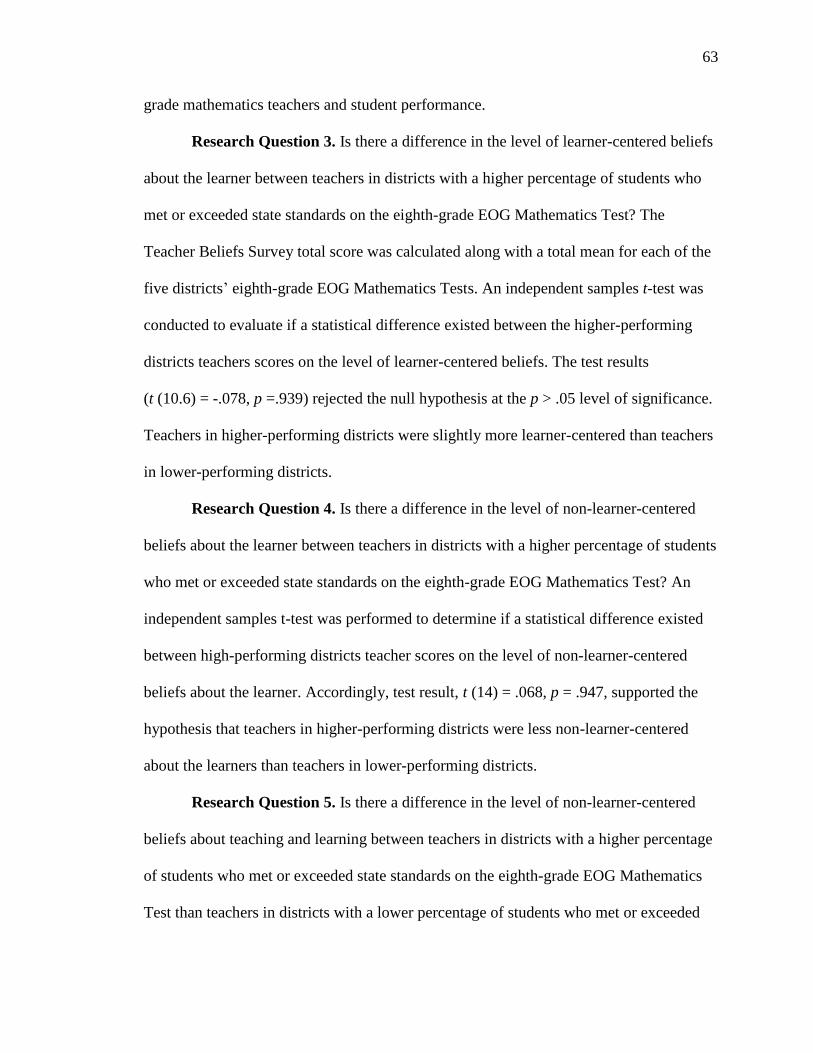
63
grade mathematics teachers and student performance.
Research Question 3. Is there a difference in the level of learner-centered beliefs
about the learner between teachers in districts with a higher percentage of students who
met or exceeded state standards on the eighth-grade EOG Mathematics Test? The
Teacher Beliefs Survey total score was calculated along with a total mean for each of the
five districts’ eighth-grade EOG Mathematics Tests. An independent samples t-test was
conducted to evaluate if a statistical difference existed between the higher-performing
districts teachers scores on the level of learner-centered beliefs. The test results
(t (10.6) = -.078, p =.939) rejected the null hypothesis at the p > .05 level of significance.
Teachers in higher-performing districts were slightly more learner-centered than teachers
in lower-performing districts.
Research Question 4. Is there a difference in the level of non-learner-centered
beliefs about the learner between teachers in districts with a higher percentage of students
who met or exceeded state standards on the eighth-grade EOG Mathematics Test? An
independent samples t-test was performed to determine if a statistical difference existed
between high-performing districts teacher scores on the level of non-learner-centered
beliefs about the learner. Accordingly, test result, t (14) = .068, p = .947, supported the
hypothesis that teachers in higher-performing districts were less non-learner-centered
about the learners than teachers in lower-performing districts.
Research Question 5. Is there a difference in the level of non-learner-centered
beliefs about teaching and learning between teachers in districts with a higher percentage
of students who met or exceeded state standards on the eighth-grade EOG Mathematics
Test than teachers in districts with a lower percentage of students who met or exceeded

64
state standards on the eighth-grade EOG Mathematics Test? An independent samples t-
test was performed to determine if a statistical difference existed between higher-
performing districts teacher and lower-performing districts teacher scores on the level of
non-learner-centered beliefs about teaching and learning. The test result ( t (14) = 1.403,
p = .182) was counter to the hypothesis that teachers in higher-performing districts were
less non-learner-centered about learners than teachers in lower-performing districts.
Consequently, there are at least four possible explanations that account for these
findings. To begin with, in the initial validation and successive studies using the Teacher
Beliefs Survey, researchers did not identify subject-specific teachers as the single focus
of their study. Perhaps a unique set of variables exist among middle school mathematics
teachers, including teacher preparation for mathematics, state licensure for teaching
mathematics, mathematics pedagogy, and possibly mathematics curricula, that prevents
the differentiation of learner-centered from non-learner-centered beliefs of the teacher.
With sample size in mind, the small sample size is a limitation and is considered a
plausible explanation. At the same time, the validation means derived by McCombs and
Whisler (1997) used in this study to ascertain the level of learner-centeredness may have
been set too high. However, irrespective of the level of learner-centeredness, statistical
analysis did not yield a statistical significant difference between the teachers from higher
performing and lower-performing districts.
Finally, the differentiation of learner-centered from non-learner-centered beliefs
of middle school mathematics instructors as measured by the Teacher Beliefs Survey may
not be possible given variables or factors unique to middle school mathematics.

65
Limitations
Limitations of this study included the sample size, timing, and design. This study
was intended to garner participation from all twelve of the Sandhills Regional Education
Consortium districts; however, only five districts (n = 5) and sixteen teachers (n = 16) are
represented in this study. Due to using post-hoc data for student achievement, some
teachers were no longer employed with some of the participating districts. Additionally,
the design of this study collected quantitative data only.
Lastly, it is possible that a type I error is associated with the small sample size
(n = 16). Given that a type I error rejects a null hypothesis that is actually true (alpha
error); the research hypotheses in this present study may have been true and a relationship
and a difference does exist based on teachers level of learner-centered beliefs and non-
learner-centered beliefs (Fraenkel & Wallen, 2006).
Recommendations
This study validates the premise that learner-centered beliefs and practices are not
a program, but a personal model for addressing school reform as evidenced by the human
element in each participant’s response. Furthermore, this study highlights a need to
explore professional development opportunities to support a learner-centered
environment for professional growth as evidenced by only one of the sixteen teachers
meeting the criteria for learner-centered. Future research into the number of years of
experience (5 plus) teaching mathematics, the educational attainment of math teachers,
and National Board Certified Teaching credentialing are worthy of investigation.
Research comparing student learner-centered beliefs and teacher leaner-centered beliefs
to student and teacher performance as well as observation of teachers in practice will

66
provide a clearer picture of learning-centered beliefs and practices. A longitudinal study
on student growth overtime, ethnicity, and gender will add to the multiple facets of this
study.
In summary, although the overall results of this study do not support the results
found by McCombs and Whisler (1997), they do support the work of Niyozow (2009)
that sustainable education reform must include the integral role of teachers in learner-
centered pedagogy.

67
References
APA Task Force on Psychology in Education. (1993). Learner-centered psychological
principles: Guidelines for school redesign and reform. Washington, DC:
American Psychological Association and Mid-Continent Regional Educational
Laboratory.
APA Work Group of the Board of Educational Affairs. (1997). Learner-centered
psychological principles: A framework for school reform and redesign.
Washington, DC: American Psychological Association.
Ames, C. (1992). Classrooms: Goals, structures, and student motivation. Journal of
Education Psychology, 84(1), 261–271.
Ary, D., Jacobs, L. C., & Razavieh, A. (2009). Introduction to Research in Education
(8th ed.). Belmont, CA: Wadsworth Cengage Learning.
Bandura, A. (1969). Principles of behavior modification. New York, NY: Holt, Rinehart
& Winston.
Bandura, A. (1977). Self-efficacy: Toward a unifying theory of behavioral change.
Psychological Review, 84, 195-215.
Bandura, A. (1982). Self-efficacy mechanism in human agency. American Psychologist,
37, 122–147.
Bandura, A. (1997). Self-efficacy: The exercise of control. New York, NY: W. H.
Freeman.
Blank, R. K. (2011). Closing the achievement gap for economically disadvantaged
students? Analyzing change since no child left behind using state assessments and
the national assessment of educational progress. Washington, DC: Chief Council
of State School Officers.
Council of Chief State School Officers. (2011). InTASC model core teaching standards:
A resource for state dialogue. Washington, DC: Author.
DuFour, R., & Eaker, R. (1998). Professional learning communities at work: Best
practices for enhancing student achievement. Bloomington, IN: Solution Tree
Press.
Eaker, R., Dufour, R., & Dufour, R. (2002). Getting started: Reculturing schools to
become professional learning communities. Bloomington, IN: Solution Tree
Press.

68
Edmonds, R. (1979). Effective schools for the urban poor. Educational Leadership, 1,
15–24. Association for Supervision and Curriculum Development.
Ellis, A., & Fouts, J. (1993). Research on educational innovations. Princeton, NJ: Eye on
Education.
Fasko, D., Hr., Grubb, D. J., Jesse, D., & McCombs, B. L. (1997). Use of the learner-
centered principles test battery: Implications for inservice and preservice
professional development. The Professional Educator, 20(1), 23–24.
Firestone, W. A. (1996). Leadership roles or functions? In K. Leithwood, J. Chapman, D.
Corson, P. Hallinger, & A.W. Hart (Eds.), International Handbook of Educational
Leadership and Administration (pp. 395–418). San Francisco, CA: Jossey-Bass.
Foster, M., & Peele, T. B. (1999). Teaching Black males: Lessons from the experts. In V.
C. Polite & J. E. Davis (Eds.), African American males in school and society:
Practices and policies for effective education (pp. 8–19). New York, NY:
Teachers College Press.
Fraenkel, J. R., & Wallen, N. E. (2006). How to design and evaluate research in
education (6th ed.). New York, NY: McGraw-Hill Companies, Inc.
Fuhrman, S. H., & Odden, A. (2001). Introduction to a Kappan special section on school
reform. Phi Delta Kappan, 83(1), 59–61.
Heller, M. F., & Firestone, W. A. (1995). Who’s in charge here? Sources of leadership
for change in eight schools. The Elementary School Journal, 96(1), 65–86.
Hidi, S., & Harackiewicz, J. M. (2000). Motivating the academically unmotivated: A
critical issues for the 21st century. Review of Educational Research, 70(2), 151–
179.
IBM Cooperation. (2011). IBM SPSS statistics base 20. Somers, NY: IBM Cooperation.
Kaufhold, J. A. (2007). Basic statistics for educational research. Lincoln, NE: iUniverse.
Keller, J. M. (1983). Motivational design of instruction. In C. M. Reigeluth (Ed.),
Instructional-design theories and models: An overview of their current status (pp.
383–434). Hillsdale, NJ: Lawrence Erlbaum Associates.
Keller, J. M. (1984). The use of the ARCS model of motivation in teacher training. In K.
Shaw, & J. Trott (Eds.), Aspects of Educational Technology Volume XVII: Staff
Development and Career Updating (pp. 140–145). London: Kogan Page.
Keller, J. M. (1987). Development and use of the ARCS model of motivational design.
Journal of Instructional Development, 10(3), 2–10.

69
Lezotte, L. W., & Snyder, K. M. (2011). What effective schools do: Re-envisioning the
correlates. Bloomington, IN: Solution Tree Press.
Marzano, R. J., & Kendall J. S. (1996). A comprehensive guide to designing standards-
based districts, schools, and classrooms. Alexandria, VA: Association of Staff
and Curriculum Development.
Maslow, A. H. (1943). A theory of human motivation. Psychological Review, 50, 370–
396.
Maslow, A. H. (1970). Motivation and personality (2nd ed.). New York, NY: Harper and
Row.
McCombs, B. L. (1994). Development and validation of the learner-centered
psychological principles. Aurora, CO: Mid-continent Regional Education
Laboratory.
McCombs, B. L. (1999). The Assessment of Learner-Centered Practices (ALCP):
Tools for teacher reflection, learning, and change. Denver, CO: University of
Denver Research Institute.
McCombs, B. L. (2003a). Defining tools for teacher reflection: The Assessment
Learner-Centered Practices (ALCP). Chicago, IL: American Educational
Research Association.
McCombs, B. L. (2003b). Providing a framework for the redesign of K-12
education in the context of current educational reform issues. Theory Into
Practice, 42(2), 93–101.
McCombs, B. L., & Lauer, P. A. (1997). Development and validation of the Learner-
Centered Battery: Self-Assessment tools for teacher reflection and professional
development. The Professional Educator, 20(1), 1–21.
McCombs, B. L., & Vakili, D. (2005). A learner-centered framework for e-learning.
Teachers College Record, 107(8), 1582–1609.
McCombs, B. L., & Whisler, J. S. (1997). The learner-centered classroom and school:
Strategies for increasing student motivation and achievement. San Francisco, CA:
Jossey-Bass.
Meece, J. L. (2003). Applying learner-centered principles to middle school education.
Theory into Practice, 42(2), 109–116.

70
Mid-continent Regional Educational Laboratory. (1995). What’s noteworthy on learners,
learning, and schooling? Washington, DC: Office of Educational Research and
Improvement.
Mid-continent Research for Education and Learning. (2011). McREL: Midcontinent-
Research for Education and Learning content knowledge standards and
benchmark database. Denver, CO: Author.
National Center for Education Statistics. (2011a). NAEP-TIMSS linking study: comparing
state academic performance against international benchmarks. Washington, DC:
Institute of Education Sciences, U.S. Department of Education.
National Center for Education Statistics. (2011b). Comparative indicators of education in
the United States and other G-8 countries: 2011. Washington, DC: Institute of
Education Sciences, U.S. Department of Education.
National Center for Education Statistics. (2011c). The nation’s report card: Mathematics
2011 (NCES2012-458). Washington, DC: Institute of Education Sciences, U.S.
Department of Education.
National Commission on Excellence in Education. (1983). A Nation at Risk: The
imperative for educational reform. Washington, DC: U.S. Department of
Education.
National Education Goals Panel. (1991). The National Education Goals Report: Building
a nation of learners. Washington, DC: Author.
National Evaluation of High School Transformation. (2005). Executive summary:
Evaluation of the Bill & Melinda Gates Foundation’s high school grants, 2001-
2004. Washington, DC: Author.
Nicholls, J. G. (1984). Achievement motivation: Conception of ability, subjective
experience, task choice, and performance. Psychological Review, 91, 328–346.
Nieto, S. (2000). Affirming diversity: The sociopolitical context of multicultural
education (3rd ed.). New York, NY: Longinan.
Niyozow, S. (2009). Understanding teaching beyond content and method: Insights from
Central Asia. European Education, 40(4), 46–69.
Paul, F. G. (2005). Grouping within Algebra I: A structural sieve with powerful effects
for low-income, minority, and immigrant students. Educational Policy, 19, 262–
282.
71
Public Schools of North Carolina State Board of Education/Department of Public
Instruction. (2011). Accountability services division: Adequate yearly progress
2010-2011. Retrieved from http://www.ncpublicschools.org/accountability/
reporting/aypresults
Riley, R. W. (1997). In math and college-going, middle school makes all the difference.
Middle School Journal, 29, 3–7.
Ruddell, R. B. (1999). Teaching children to read and write: Becoming an influential
teacher (2nd ed.). Boston: Allyn and Bacon.
Ryan, A. M., & Patrick, H. (2001). The classroom social environment and changes in
adolescents’ motivation and engagement during middle school. American
Educational Research Journal, 38(2), 437–460.
Sandhills Region Education Consortium. (2011). Sandhills Regional Education
Consortium. Retrieved from www.srec.ccc.k12.nc.us
Seligman, M. E. P., & Csikszentmihalyi, M. (2000). Positive psychology: An
introduction. American Psychologist, 55(1), 5–14.
Schultz, D. P., & Schultz, S. E. (2004). A history of modern psychology (8th ed.).
Belmont, CA: Wadsworth/Thompson Learning.
Senge, P. M. (1990). The fifth discipline: The art and practice of the learning
organization. New York, NY: Currency Doubleday.
Silver, E. A., Smith, M. S., & Nelson, B. S. (1995). The QUASAR Project: Equity
concerns meet mathematics education reform in the middle school. In L. B.
Adajian (Ed.), New directions for equity in mathematics education (pp. 9–56).
New York, NY: Cambridge University Press.
Sleeter, C. E. (2007). Balancing accountability demands with research-validated learner-
centered teaching and learning practices. In B. L. McCombs, Facing
accountability in education: Democracy and equity at risk. New York, NY:
Teachers College Press.
Thompson, G. L., & Joshua-Shearer, M. (2002). In retrospect: What college
undergraduates say about their high school education. High School Journal,
85(4), 1–15.
Turner, J. C., Meyer, D. K., Midgley, C., & Patrick, H. (2003). Teacher discourse and
sixth graders’ reported affect and achievement behaviors in two high-
mastery/high-performance mathematics classrooms. The Elementary School
Journal, 103, 357–378.

72
Tyack, D., & Cuban, L. (1995). Tinkering toward Utopia: A century of public school
reform. Cambridge, MA: Harvard University Press.
Tyler, K. M., & Boelter, C. M. (2008). Linking Black middle school students’
perceptions of teachers’ expectations to academic engagement and efficacy. The
Negro Educational Review, 59, 27–44.
U.S. Department of Education. (2000). Before it’s too late: A report to the nation from
the national commission on mathematics and science teaching for the 21st
century. Washington, DC: Education Publication Center.
U.S. Department of Education. (2009). Race to the Top program executive summary.
Washington, DC: Department of Education.
U.S. Department of Education. (2010). The Elementary and Secondary Education Act;
Public Law print of PL107-110, The No child Left Behind Act 2001. Retrieved
from http://www2.ed.gov/policy/elsec/leg/esea02/107-110.pdf
Weinberger, E., & McCombs, B. L. (2001). The impact of learner centered practices on
the academic and non-academic outcomes of upper elementary and middle school
students. Paper presented in the Symposium, “Integrating What We Know About
Learners and Learning: A foundation for transforming PreK-20 Practices,” at the
annual meeting of the American Educational Research Association, Seattle, WA.
Weiner, B. (1990). History of motivational research in education. Journal of Educational
Psychology, 82, 616–622.
Wenglinsky, H. (2000). How teaching matters: Bringing the classroom back into
discussions of teacher quality. Princeton, NJ: Educational Testing Service.

73
Appendix A
Learner-Centered Psychological Principles

74
LEARNER-CENTERED PSYCHOLOGICAL PRINCIPLES
The following 14 psychological factors pertain to the learner and the learning process.
They focus on psychological factors that are primarily internal to and under the control of
the learner rather than conditioned habits or physiological factors. However, the
principles also attempt to acknowledge external environment or contextual factors that
interact with these internal factors. The principles are intended to deal holistically with
learners in the context of real-world learning situations. Thus, they are best understood as
an organized set of principles; no principle should be viewed in isolation. The 14
principles are divided into those referring to cognitive and metacognitive, motivational
and affective, developmental and social, and individual difference factors influencing
learners and learning. Finally, the principles are intended to apply to all learners-from
children, to teachers, to administrators, to parents, and to community members involved
in our educational system.
Cognitive and Metacognitive Factors
1. Nature of the learning process. The learning of complex subject matter is most
effective when it is an intentional process of constructing meaning from information
and experience.
There are different types of learning processes; for example, habit formation in motor
learning, and learning that involves the generation of knowledge or cognitive skills,
and learning strategies. Learning in schools emphasizes the use of intentional
processes that students can use to construct meaning from information, experiences,
and their own thoughts and beliefs. Successful learners are active, goal-directed, self-
regulating, and assume personal responsibility for contributing to their own learning.
2. Goals of the learning process. The successful learner, over time and with support and
instructional guidance, can create meaningful, coherent representations of knowledge.
The strategic nature of learning requires students to be goal directed. To construct
useful representations of knowledge and to acquire the thinking and learning
strategies necessary for continued learning success across the life span, students must
generate and pursue personally relevant goals. Initially, students’ short-term goals and
learning may be sketchy in an area, but over time their understanding can be refined
by filling gaps, resolving inconsistencies, and deepening their understanding of the
subject matter so that they can reach longer-term goals. Educators can assist learners
in creating meaningful learning goals that are consistent with both personal and
educational aspirations and interests.
3. Construction of knowledge. The successful learner can link new information with
existing knowledge in meaningful ways.
Knowledge widens and deepens as students continue to build links between new
information and experiences and their existing knowledge base. The nature of these

75
links can take a variety of forms, such as adding to, modifying, or reorganizing
existing knowledge or skills. How these links are made or develop may vary in
different subject areas and among students with varying talents, interests, and
abilities. However, unless new knowledge becomes integrated with the learner’s prior
knowledge and understanding, this new knowledge remains isolated, cannot be used
most effectively in new tasks, and does not transfer readily to new situations.
Educators can assist learners in acquiring and integrating knowledge by a number of
strategies that have been shown to be effective with learners of varying abilities, such
as correct mapping and thematic organization or categorizing.
4. Strategic thinking. The successful learner can create and use a repertoire of thinking
and reasoning strategies to achieve complex learning goals.
Successful learners use strategic thinking in their approach to learning, reasoning,
problem solving, and concept learning. They understand and can use a variety of
strategies to help them reach learning and performance goals, and to apply their
knowledge in novel situations. They also continue to expand their repertoire of
strategies by reflecting on the methods they use to see which work well for them, by
receiving guided instruction and feedback, and by observing or interacting with
appropriate models. Learning outcomes can be enhanced if educators assist learners
in developing, applying, and assessing their strategic learning skills.
5. Thinking about thinking. Higher order strategies for selecting and monitoring mental
operations facilitate creative and critical thinking.
Successful learners can reflect on how they think and learn, set reasonable learning or
performance goals, select potentially appropriate learning strategies or methods, and
monitor their progress toward these goals. In addition, successful learners know what
to do if a problem occurs or if they are not making sufficient or timely progress
toward a goal. They can generate alternative methods to reach their goal (or reassess
the appropriateness and utility of the goal). Instructional methods that focus on
helping learners develop these higher order (metacognitive) strategies can enhance
student learning and personal responsibility for learning.
6. Context of learning. Learning is influenced by environmental factors, including
culture, technology, and instructional practices.
Learning does not occur in a vacuum. Teachers play a major interactive role with
both the learner and the learning environment. Cultural or group influences on
students can impact many educationally relevant variables, such as motivation,
orientation toward learning, and ways of thinking. Technologies and instructional
practices must be appropriate for learners’ level of prior knowledge, cognitive
abilities, and their learning and thinking strategies. The classroom environment,
particularly the degree to which it is nurturing or not, can also have significant
impacts on student learning.

76
Motivational and Affective Factors
7. Motivational and emotional influences on learning. What and how much is learned is
influenced by the learner’s motivation. Motivation to learn, in turn, is influenced by
the individual’s emotional states, beliefs, interests and goals, and habits of thinking.
The rich internal world of thoughts, beliefs, goals, and expectations for success or
failure can enhance or interfere with the learner’s quality of thinking and information
processing. Students’ beliefs about themselves as learners and the nature of learning
have a marked influence on motivation. Motivational and emotional factors also
influence both the quality of thinking and information processing as well as an
individual’s motivation to learn. Positive emotions, such as curiosity, generally
enhance motivation and facilitate learning and performance. Mild anxiety can also
enhance learning and performance by focusing the learner’s attention on a particular
task. However, intense negative emotions (e.g., anxiety, panic, rage, insecurity) and
relative thoughts (e.g., worrying about competence, ruminating about failure, fearing
punishment, ridicule or stigmatizing labels) generally detract from motivation,
interfere with learning, and contribute to low performance.
8. Intrinsic motivation to learn. The learner’s creativity, higher order thinking, and
natural curiosity all contribute to motivation to learn. Intrinsic motivation is
stimulated by tasks of optimal novelty and difficulty relevant to personal interests,
and providing for personal choice of control.
Curiosity, flexible and insightful thinking, and creativity are major indicators of the
learners’ intrinsic motivation to learn, which is in large part a function of meeting
basic needs to be competent and to exercise personal control. Intrinsic motivation is
facilitated on tasks that learners perceive as interesting and personally relevant and
meaningful, appropriate in complexity and difficulty to the learners’ abilities, and on
which they believe they can succeed. Intrinsic motivation is also facilitated on tasks
that are comparable to real-world situations and meet needs for choice and control.
Educators can encourage and support learners’ natural curiosity and motivation to
learn by attending to individual differences in learners’ perception of optimal novelty
and difficulty, relevance, and personal choice and control.
9. Effects of motivation and effort. Acquisition of complex knowledge and skills
requires extended learner effort and guided practice.
Without learners’ motivation to learn, the willingness to exert this effort is unlikely
without coercion. Effort is another main indicator of motivation to learn. The
acquisition of complex knowledge and skills demands the investment of considerable
learner energy and strategic effort, along with persistence over time. Educators need
to be concerned with facilitating motivation by strategies that enhance learner effort
and commitment to learning and to achieving high standards of comprehension and
understanding. Effective strategies include purposeful learning activities, guided by
practices that enhance positive emotions and intrinsic motivation to learn, and

77
methods that increase learners’ perceptions that a task is interesting and personally
relevant.
Developmental and Social Factors
10. Developmental influences on learning. As individuals develop, there are different
opportunities and constraints for learning. Learning is most effective when
differential development within and across physical, intellectual, emotional, and
social domains is taken into account.
Individuals learn best when material is appropriate to their developmental level and is
presented in an enjoyable and interesting way. Because individual development varies
across intellectual, social, emotional, and physical domains, achievement in different
instructional domains may also vary. Overemphasis on one’s type of developmental
readiness—such as reading readiness, for example—may preclude learners from
demonstrating that they are more capable in other areas of performance. The
cognitive, emotional and social development of individual learners and how they
interpret life experiences are affected by prior schooling, home, culture, and
community factors. Early and continuing parental involvement in schooling, and the
quality of language interactions and two-way communications between adults and
children can influence these developmental areas. Awareness and understanding of
developmental differences among children with and without emotional, physical, or
intellectual disabilities, can facilitate the creation of optimal learning contexts.
11. Social influences on learning. Learning is influenced by social interactions,
interpersonal relations, and communication with others.
Learning can be enhanced when the learner has an opportunity to interact and to
collaborate with others on instructional tasks. Learning settings that allow for social
interactions, and that respect diversity, encourage flexible thinking and social
competence. In interactive and collaborative instructional contexts, individuals have
an opportunity for perspective taking and reflective thinking that may lead to higher
levels of cognitive, social, and moral development, as well as self-esteem. Quality
personal relationships that provide stability, trust, and caring can increase learners’
sense of belonging, self-respect and self-acceptance, and provide a positive climate
for learning. Family influences, positive interpersonal support and instruction in self-
motivation strategies can offset factors that interfere with optimal learning such as
negative beliefs about competence in a particular subject, high levels of test anxiety,
negative sex role expectations, and unique pressure to perform well. Positive learning
climates can also help to establish the context for healthier levels of thinking, feeling,
and behaving. Such contexts help learners feel safe to share ideas, actively participate
in the learning process, and create a learning community.
Individual Differences Factors
12. Individual differences in learning. Learners have different strategies, approaches, and

78
capabilities for learning that are a function of prior experience and heredity.
Individuals are born with and develop their own capabilities and talents. In addition,
through learning and social acculturation, they have acquired their own preferences
for how they like to learn and the pace at which they learn. However, these
preferences are not always useful in helping learners reach their learning goals.
Educators need to help students examine their learning preferences and expand or
modify them, if necessary. The interaction between learner differences and curricular
and environmental conditions is another key factor affecting learning outcomes.
Educators need to be sensitive to individual differences, in general. They also need to
attend to learner perceptions of the degree to which these differences are accredited
and adapted to by varying instructional methods and materials.
13. Learning and diversity. Learning is most effective when differences in learners’
linguistic, cultural, and social backgrounds are taken into account.
The same basic principles of learning, motivation, and effective instruction apply to
all learners. However, language, ethnicity, race, beliefs, and socioeconomic status all
can influence learning. Careful attention to these factors in the instructional setting
enhances the possibilities for designing and implementing appropriate learning
environments. When learners perceive that their individual differences in abilities,
backgrounds, cultures, and experiences are valued, respected, and accommodated in
learning tasks and contexts, levels of motivation and achievement are enhanced.
14. Standards and assessment. Setting appropriately high and challenging standards and
assessing the learner as well as learning progress including diagnostic, process, and
outcome assessment are integral parts of the learning process.
Assessment provides important information to both the learner and teacher at all
stages of the learning process. Effective learning takes place when learners feel
challenged to work towards appropriately high goals. Therefore, appraisal of the
learner’s cognitive strengths and weaknesses, as well as current knowledge and skills,
is important for the selection of instructional materials of an optimal degree of
difficulty. Ongoing assessment of the learner’s understanding of the curricular
material can provide valuable feedback to both learners and teachers about progress
toward the learning goals. Standardized assessment of learner progress and outcomes
assessment provides one type of information about achievement levels both within
and across individuals that can inform various types of programmatic decisions.
Performance assessments can provide other sources of information about the
attainment of learning outcomes. Self-assessments of learning progress can also
improve students’ self-appraisal skills and enhance motivation and self-directed
learning.

79
Appendix B
Teacher Beliefs Survey

80
Part I Background/Demographic Information
Select your response to following questions.
1. The total number of total years
teaching
A 1-4
B 5-9
C 10-15
D 16-23
E 24+
3. The total number of total years
teaching mathematics
A 1-4
B 5-9
C 10-15
D 16-23
E 24+
5. The total number of total years
teaching middle school mathematics
A 1-4
B 5-9
C 10-15
D 16-23
E 24+
2. What was your Major area of teaching
preparation?
A Mathematics
B Science
C Language Arts
D Social Studies
E Other
4. What was your Minor area of teaching
preparation?
A Mathematics
B Science
C Language Arts
D Social Studies
E Other
6. What is the Highest degree earned?
A BA/BS
B MA/MS
C Ed.D./Ph.

81
Optional questions
7. What is your age range? 8. What is your ethnicity?
A 21-25 A Caucasian American
B 26-30 B African American
C 31-35 C Hispanic/Latino
D 36-40 D Asian
E 41+ E Native American
F Other
9. What is your sex?
A Male
B Female

82
Part II Teacher Beliefs Survey
THE ASSESSMENT OF LEARNER-CENTERED PRACTICES
(ALCP):
Middle Level TEACHER Survey (Grade 8) ©
DIRECTIONS for Part II: A number of statements that teachers in Grades 4 through 8
have used to describe themselves are shown below. Please read each statement carefully.
Decide to what extent you agree or disagree with each statement. Do you strongly
disagree, somewhat disagree, somewhat agree, or strongly agree? Select the appropriate
number located in the box corresponding with each statement to indicate your choice.
Answer carefully, but don't think too much about any one question.
PLEASE ANSWER EVERY QUESTION. Your responses will be kept private and
confidential.
Responses:
1=Strongly Disagree, 2=Somewhat Disagree, 3=Somewhat Agree, 4=Strongly Agree
Statement
Strongly
Disagree
Somewhat
Disagree
Somewhat
Agree
Strongly
Agree
1. Students have more
respect for teachers they
see and can relate to as
real people, not just as
teachers.
1 2 3 4
2. There are some students
whose personal lives are
so dysfunctional that they
simply do not have the
capability to learn.
1 2 3 4
3. I can’t allow myself to
make mistakes with my
students.
1 2 3 4

83
Teacher Beliefs Survey (cont.)
Statement
Strongly
Disagree
Somewhat
Disagree
Somewhat
Agree
Strongly
Agree
4. Students achieve more in
classes in which teachers
encourage them to
express their personal
beliefs and feelings.
1 2 3 4
5. Too many students
expect to be coddled in
school.
1 2 3 4
6. If students are not doing
well, they need to go
back to the basics and do
more drill and skill
development.
1 2 3 4
7. In order to maximize
learning, I need to help
students feel comfortable
in discussing their
feelings and beliefs.
1 2 3 4
8. It’s impossible to work
with students who refuse
to learn.
1 2 3 4
9. No matter how bad a
teacher feels, he or she
has a responsibility not to
let students know about
those feelings.
1 2 3 4
10. Addressing students’
social, emotional, and
physical needs is just as
important to learning as
meeting their intellectual
needs.
1 2 3 4
11. Even with feedback,
some students just can’t
figure out their mistakes.
1 2 3 4
12. My most important job as
a teacher is to help
students meet well
established standards of
what it takes to succeed.
1 2 3 4

84
Teacher Beliefs Survey (cont.)
Statement
Strongly
Disagree
Somewhat
Disagree
Somewhat
Agree
Strongly
Agree
13. Taking the time to create
caring relationships with
my students is the most
important element for
student achievement.
1 2 3 4
14. I can’t help feeling upset
and inadequate when
dealing with difficult
students.
1 2 3 4
15. If I don’t prompt and
provide direction for
student questions,
students won’t get the
right answer.
1 2 3 4
16. Helping students
understand how their
beliefs about themselves
influence learning is as
important as working on
their academic skills.
1 2 3 4
17. It’s just too late to help
some students.
1 2 3 4
18. Knowing my subject
matter really well is the
most important
contribution I can make
to student learning.
1 2 3 4
19. I can help students who
are uninterested in
learning get in touch with
their natural motivation
to learn.
1 2 3 4
20. No matter what I do or
how hard I try, there are
some students who are
unreachable.
1 2 3 4
21. Knowledge of the subject
area is the most important
part of being an effective
teacher.
1 2 3 4

85
Teacher Beliefs Survey (cont.)
Statement
Strongly
Disagree
Somewhat
Disagree
Somewhat
Agree
Strongly
Agree
22. Students will be more
motivated to learn if
teachers get to know
them at a personal level.
1 2 3 4
23. Innate ability is fairly
fixed and some children
just can’t learn as well as
others.
1 2 3 4
24. One of the most
important things I can
teach students is how to
follow rules and to do
what is expected of them
in the classroom.
1 2 3 4
25. When teachers are
relaxed and comfortable
with themselves, they
have access to a natural
wisdom for dealing with
even the most difficult
classroom situations.
1 2 3 4
26. Teachers shouldn’t be
expected to work with
students who consistently
cause problems in class.
1 2 3 4
27. Good teachers always
know more that their
students.
1 2 3 4
28. Being willing to share
who I am as a person
with my students
facilitates learning more
than being an authority
figure.
1 2 3 4
29. I know best what students
need to know and what’s
important; students
should take my word that
something will be
relevant to them.
1 2 3 4

86
Teacher Beliefs Survey (cont.)
Statement
Strongly
Disagree
Somewhat
Disagree
Somewhat
Agree
Strongly
Agree
30. My acceptance of myself
as a person is more
central to my classroom
effectiveness than the
comprehensiveness of my
teaching skills.
1 2 3 4
31. For effective learning to
occur, I need to be in
control of the direction of
learning.
1 2 3 4
32. Accepting students where
they are—no matter what
their behavior and
academic performance—
makes them more
receptive to learning.
1 2 3 4
33. I am responsible for what
students learn and how
they learn.
1 2 3 4
34. Seeing things from the
students’ point of view is
the key to their good
performance in school.
1 2 3 4
35. I believe that just
listening to students is a
caring way helps them
solve their own problems.
1 2 3 4
© Copyright 1994. Used by permission of McREL. McCombs, B.L., & Lauer, P.A. (1994). Development
and Validation of the Learner-Centered Battery: Self Assessment Tools for Teacher Reflection and
Professional Development. Aurora, CO: Mid-continent Regional Education Laboratory.

87
Appendix C
Informed Consent Letters

88
Dear Superintendent/Assistant Superintendent,
I am asking for your help in assisting me with my doctoral dissertation that seeks to
conduct an initial study to identify, determine a difference, if any, and investigate any
possible relationship between the role of teacher beliefs about learner-centered education
with student achievement. Your decision to participate is voluntary.
Specifically, I am asking that you provide each of your mathematics teachers who taught
eighth-grade mathematics during the 2010-2011 school year the Teacher Beliefs Survey
that includes: Overview, Instructions, and the Teacher Beliefs Survey. The Teacher
Beliefs Survey is can be accessed via https://www.surveymonkey.com/s/RZMH7H6 until
February 28th
is completely confidential and does not ask any staff member to identify
him or herself. The survey will not take any longer than 5 minutes to complete. There
are no risks associated with completing the survey.
Why YOUR district? YOUR district was selected because it is part of the Sandhills
Regional Education Consortium (SREC) and based on the results of the 2011 North
Carolina Eighth-Grade End-of-Grade Mathematics Test. Please know that I am fully
aware that the EOG results are merely a starting point and in no way take into account the
many challenges, obstacles, or barriers that you and your staff contend with day in and
day out.
Unlike previous research on school reform that has tended for the most part to address
technical and organizational changes in our present system, this study seeks to ascertain if
there is a difference as well as if a relationship exists between learner-centered beliefs
and student achievement. Why learner-centered? Researchers at the Mid-continent
Regional Educational Laboratory (McREL) identified an additional domain of reform
that in their estimation has seldom, if ever, been studied. That domain includes defining
and examining teacher beliefs and practices considered learner-centered and the degree to
which student achievement, motivation, and learning is influenced.
The results of the study will provide you and your mathematics teachers the level of (1)
Learner-Centered Beliefs about Learners, Teaching and Learning; (2) Non-learner-
Centered Beliefs About Learners; and (3) Non-learner-Centered Beliefs About Teaching
and Learning. Additionally, the results of this study will provide you the answers to
several research questions investigating differences and/or relationships between and
among the learner-centered beliefs and student achievement of different middle schools
within the SREC.
As I indicated, I will return to you the findings of the study as well as your specific
school’s survey results accompanied by some general recommendations that may assist
you with the work of improving student learning and achievement of all students.
Again, all I am asking is for you to request teachers who taught eighth-grade mathematics
during the 2010-2011 school year to complete the Teacher Beliefs Survey located online
at https://www.surveymonkey.com/s/RZMH7H6. Knowing full well the demands on
your time, please accept my sincerest appreciation for assisting me with this project. If
you or any of your staff have any questions, please do not hesitate to contact me either by

89
phone (XXX-XXX-XXXX) or by email (XXXXXX).
Thank you in advance for your support.
Takeda LeGrand
Doctoral Candidate
Gardner-Webb University

90
Dear Staff,
I am asking for your help in assisting me with my doctoral dissertation that seeks to
conduct an initial study to identify, determine a difference, if any, and investigate any
possible relationship between the role of teacher beliefs about learner-centered education
with student achievement. Your decision to participate is voluntary.
Specifically, I am asking that you complete the Teacher Beliefs Survey by February 28th
.
The web address at https://www.surveymonkey.com/s/RZMH7H6 will provide you with:
An Overview, Instructions, and the Teacher Beliefs Survey. The Teacher Beliefs Survey
is completely confidential and does not ask you to identify yourself. The survey will not
take any longer than 5 minutes to complete. There are no risks associated with
completing the survey.
Middle School was selected because it is part of the Sandhills Regional Education
Consortium (SREC) and based on the results of the 2011 North Carolina Eighth-Grade
End-of-Grade Mathematics Test. Please know that I am fully aware that the EOG results
are merely a starting point and in no way take into account the many challenges,
obstacles, or barriers that you and your staff contend with day in and day out.
Unlike previous research on school reform that has tended for the most part to address
technical and organizational changes in our present system, this study seeks to ascertain if
there is a difference as well as if a relationship exists between learner-centered beliefs
and student achievement. Why learner-centered? Researchers at the Mid-continent
Regional Educational Laboratory (McREL) identified an additional domain of reform
that in their estimation has seldom, if ever, been studied. That domain includes defining
and examining teacher beliefs and practices considered learner-centered and the degree to
which student achievement, motivation, and learning is influenced.
The results of the study will provide you the level of (1) Learner-Centered Beliefs about
Learners, Teaching and Learning; (2) Nonlearner-Centered Beliefs About Learners; and
(3) Nonlearner-Centered Beliefs About Teaching and Learning. Additionally, the results
of this study will provide you the answers to several research questions investigating
differences and/or relationships between and among the learner-centered beliefs and
student achievement of different middle schools within the SREC.
As I indicated, I will return to you the findings of the study as well as your specific
school’s survey results accompanied by some general recommendations that may assist
you with the work of improving student learning and achievement of all students.
Again, all I am asking is for you to complete the Teacher Beliefs Survey located at the
following address at https://www.surveymonkey.com/s/RZMH7H6. Knowing full well
the demands on your time, please accept my sincerest appreciation for assisting me with
this project. If you have any questions, please do not hesitate to contact me either by
phone (XXX-XXX-XXXX) or by email (XXXXX).

91
Thank you in advance for your support.
Takeda LeGrand
Doctoral Candidate
Gardner-Webb University