Embed Size (px)
Citation preview

THE RELATIONSHIP BETWEEN THE FORTUNE 100 BEST COMPANIES TO WORK FOR
AND STOCK PERFORMANCE: DOES INVESTING IN EMPLOYEES PRODUCE HIGHER
RETURNS?
by
Christina Bowman
Submitted in partial fulfillment of the
requirements for Departmental Honors in
the Department of Finance
Texas Christian University
Fort Worth, Texas
May 8, 2017

ii
THE RELATIONSHIP BETWEEN THE FORTUNE 100 BEST COMPANIES TO WORK FOR
AND STOCK PERFORMANCE: DOES INVESTING IN EMPLOYEES PRODUCE HIGHER
RETURNS?
Project Approved:
Supervising Professor: Larry Lockwood, Ph.D.
Department of Finance
Tracey Rockett, Ph.D.
Department of Management, Entrepreneurship, and Leadership

iii
ABSTRACT
Investors are often searching to find new strategies to maximize stock performance. Oftentimes
methodologies such as financial statement analysis or industry analysis are utilized to identify
specific stocks, however, a new notion of corporate governance and the publication of the Fortune
100 Best Companies to Work For List may suggest a new investment strategy. The purpose of this
study is to understand the relationship between investing in your employees and the corresponding
stock market performance. This thesis explores past literature on the relationship between satisfied
employees and productivity, as well as past studies performed on the Fortune 100 List. Lastly, the
study analyzes the stock performance of the Fortune 100 List from 1998 to 2016 by comparing the
market adjusted returns to the broad market returns. It is concluded that the Fortune 100 List
overall outperforms the market, and further, that the Fortune 100 may be a good portfolio to invest
in when the broad market is not doing well.

iv
TABLE OF CONTENTS
Introduction………………………………………………………………………………………1
Literature Review……………………………………………………………………………….. 3
Fortune 100 List Methodology……………………………………………………………. 3
Employee Satisfaction……………………………………………………………………. 5
Fortune 100 Studies………………………………………………………………………. 8
Methodology…………………………………………………………………………………… 12
Results………………………………………………………………………………………….. 14
Outperformance of the Market………………………………………………………….. 15
Company Events or State of the Economy……………………………………………….. 15
Performance when the Market is Down………………………………………………….19
Discussion………………………………………………………………………………………. 20
Conclusions……………………………………………………………………………... 20
Limitations………………………………………………………………………………. 21
Future Studies…………………………………………………………………………… 21
Implications……………………………………………………………………………………. 22
Investor Perspective…………………………………………………………………….. 22
Company Perspective…………………………………………………………………… 23
Conclusion……………………………………………………………………………………… 24
Bibliography…………………………………………………………………………………… 27
Appendix……………………………………………………………………………………….. 30

1
Introduction
Investors are often searching to find the “Holy Grail” of investing; that is, trying to
uncover new methods to create portfolios of stocks that will produce the highest returns. Many
investors attempt to accomplish this by analyzing a company’s financial statements, industry
trends, utilizing ratio analysis, or release of earnings reports (Goenner, 2008). This paper
explores a possible method and investment strategy for maximizing returns. The purpose of this
study is to determine if creating a positive workplace culture and investing in employees upfront
produces higher stock returns in comparison to the market. This study is based upon the Fortune
100 Best Companies to Work For List (referred to from now on as the Fortune 100) published
each year starting in 1998 to the present 2016.
The underlying theme that led to this concept and the Fortune 100 List is the idea that
throughout the years there has been a progression in mindset of a company’s end goal. In the
past, companies used to be concerned solely with shareholder wealth maximization, which is
increasing stock price to work for investors. Over the past couple of years, a new notion of
corporate governance has evolved. With this, companies are more concerned with stakeholder
welfare, which encompasses everyone who holds an interest in the company. This includes not
only investors, but also employees, customers, and the community. Therefore, the objective of
this study is two-fold. First is to approach it from an investor’s perspective. The implication of
stock performance for the Fortune 100 list will be explored, and will be the main focus of the
paper. Second is to look at it from a company perspective. In other words, what are the benefits
of investing in your employees? There may be an indication that companies could model
themselves after companies on the Fortune 100 list in order to increase their perceived value. In
order to answer both of these questions, a portfolio of public companies will be created for each

2
year of the Fortune 100 list and the market adjusted returns will be compared to returns of the
broad market.
Various studies have been completed using the Fortune 100 list as a means of measuring
the importance of the intangible assets of people. Simon and DeVaro (2006) used the list to
determine if a positive workplace culture leads to higher customer satisfaction. Fulmer, Gerhart,
and Scott (2003), Filbeck and Preece (2003), and Goenner (2008) used the list to measure the
impact on stock performance, which will be the focus of this paper. Much of this literature
focuses on the various results present when utilizing a buy and hold strategy versus an annual
strategy, then comparing the returns to either a market benchmark or a portfolio of comparable
companies.
Past research has often focused on a range of no more than ten years for a buy and hold
strategy or has analyzed the annual returns for less than fifteen periods. Given the larger amount
of lists published, this paper will assess the performance of each list on an annual basis from the
years 1998 to 2016, the largest sample period that has been found in this area of research.
Viewing the Fortune 100 returns over a 19 year period will help guide investors in offering
solutions to maximize their investments. This paper suggests that one can improve investment
performance based upon a published list of companies by Fortune Magazine. In this case, the
value is derived from intangible assets, that is, assets that do not appear on the financial
statements and in turn are difficult to measure (Goenner, 2008). Employees and more
importantly, employee satisfaction, are the key intangible assets that add value to this specific list
of firms.
In order to explore this anomaly, the study will analyze portfolios consisting of public
companies on the Fortune 100 list and compare the returns to a risk adjusted benchmark. A new

3
portfolio is created each year for the new, updated list that is published. This paper may also
suggest that companies not on the list could look closely at the employer-employee relationships
present at the Fortune 100 companies and attempt to model their company after them. It is most
likely that the increased stock performance is due to the recognition they receive from the list,
however, implementing initiatives followed by the Fortune 100 may foster stronger relationships
within the organization.
The question at hand can be considered from a cost benefit perspective. Does investing in
employees, thus increasing cost, produce higher stock returns compared to the market? The
hypothesis is that companies on the Fortune 100 list will produce higher returns that outperform
the market. The reasoning is that the release of the information will add value to the stock and
thus stock prices will adjust to reflect that positively perceived information. Further, it is
hypothesized that positive returns before the publication date and release of the information may
suggest leaked information.
The paper will begin with a literature review of how the Fortune 100 list is created,
relationships between employee satisfaction and work performance, and then discuss the
literature and research that has been done regarding the Fortune 100 and stock performance. The
methodology will then be explained followed by the results of the study. Lastly, a discussion of
the implications and conclusions of the study will be made.
Literature Review
Fortune 100 Best Companies to Work For List
A variety of lists and publications have been produced regarding good work
environments. Some of the most notable publications include Fortune’s World Most Admired
Companies, Forbes’s America’s Best Small Companies, the Fortune 500, and many more. The

4
publication utilized in this study is the Fortune 100 Best Companies to Work For in America. In
order to understand the ultimate purpose of this study, it is first necessary to understand what
makes up the Fortune 100 List and how that list is derived. Every year since 1998, Fortune
Magazine publishes a 100 Best Companies to Work For List. Fortune partners with the Great
Place to Work Institute to create the list of 100 companies. Companies must apply in order to
participate in this survey, and thus be considered for the Fortune 100 list. The current credentials
as of 2016 to participate include a company that has operated for at least five years and has more
than 1,000 US employees. These requirements have changed throughout the years, altering the
number of years a firm has been in operation and number of US employees, however, those two
factors have been the primary measures for being selected (Great Place to Work Institute, 2017).
The Great Place to Work Institute conducts an extensive survey about employee
satisfaction. The survey is broken up into two different parts. Two-thirds of the survey is based
on a Trust Index Employee Survey, which polls employees about their attitude related to their
workplace experience. The Trust Model is made up of five dimensions: credibility, respect,
fairness, pride, and camaraderie. Credibility, respect, and fairness focus on employee’s
perception of management practices. In other words, how employees view management’s
communication practices, level of involvement, fairness of policies, and overall trust they have in
management. Pride measures an employee’s individual feelings about the impact they have in
their work and the overall pride of the company. Camaraderie focuses on the organization as a
whole, assessing the employee’s views of a friendly and supportive community. This portion of
the survey is sent to a random sample of employees. The other third consists of results from the
Culture Audit, which focuses on questions about compensation and benefit programs, as well as
other areas in the workplace such as training methods, hiring practices, internal communication,

5
and diversity efforts. The Great Place to Work Institute ultimately scores the companies on nine
key practice areas. An important factor concerning truth and validity of this survey is the fact
that it surveys employees as opposed to top management or experts, highly eliminating the
possibility of misrepresentation or inflated results (Filbeck & Preece, 2003).
Employee Satisfaction and Company Performance
The Fortune 100 list is centered on employees and the workplace, thus, literature
surrounding employee satisfaction and workplace culture must be explored. The defining factor
that makes the Fortune 100 list so appealing to investors is the intangible asset of people, the
employees. From a strategic management perspective, the importance of the intangible asset can
be viewed from the perspective of a resource based view (RBV). Wernerfelt (1984) defines a
resource as “anything which could be thought of as a strength or weakness of a given firm”, or
more formally, “those tangible and intangible assets which are tied semi permanently to the
firm”. Wernerfelt (1984) asserts that there are resource position barriers, similar to entry barriers,
which can lead to the potential for higher returns since one company will have the advantage.
Such information would not appear on balance sheets or financial statements, but are clearly
assets that must be taken into consideration. This can be equated to employees in the notion that
a firm with successful and satisfied employees may have a competitive advantage over a firm
who does not possess such an intangible asset.
There is a common belief that good employer-employee relations create happy workers
which in turn lead to increased productivity and performance, reduced turnover, and customer
satisfaction. Despite this popular belief, much research suggests that there is a weak correlation
between these factors at the individual level (Ostroff, 1992). A recent study that seems to support
the existence of such a relationship suggests that the two have a correlation on an individual level

6
of 0.30 (Judge, Bono, Thoresen, & Patton, 2001). The majority of the research that has been
conducted regarding the relationship between employee job satisfaction and performance have
been at the individual level. Ostroff (1992) is one of the first to explore the idea of employee
satisfaction at the organizational level, and finds a more compelling relationship between the
two. In order to test this hypothesis, Ostroff performed a study on a sample of 364 schools, in
which 298 schools participated. The relationship between three key measures was studied:
satisfaction and attitude measures, school characteristics, and organizational performance.
Ostroff’s results showed that the strongest correlations were regarding employee satisfaction.
Organizations with more satisfied employees were more effective. While in some cases there
exists the same relationship at an individual level, the results were proven to be much more
conclusive at an organizational level. The nature of this study poses some limitations, as the
study considered only school systems and factors among companies in other industries may
show slightly different results.
Bockerman and Ilmakunnas (2012) expand the definition from job satisfaction to
employee wellbeing, looking more broadly at the concept of happy employees. According to
Wright and Cropanzano (2000), unhappy employees lead to lower job performance because they
emphasize the negative aspects and dwell on the areas they dislike. This negative attitude can
thus affect other employees in the workplace and have a detrimental effect on the performance of
surrounding employees. Conversely, happier workers show decreased absence from work, higher
organizational citizenship, and less employee turnover. All factors allow the firm to focus their
resources on the direct productivity of the firm as opposed to replacing people who quit or
finding ways to make up for absentees (Bockerman & Ilmakunnas, 2012). Bockerman and
Ilmakunnas (2012) study manufacturing plants from 1996-2001 to assess the relationship

7
between job satisfaction and productivity and finds that an increase in job satisfaction by one
standard deviation results in a 6.6% increase in productivity per hour. In a Harvard Business
Review article titled Positive Intelligence, Achor (2012) states that a positive attitude, which he
refers to as the “happiness advantage”, leads to increased productivity. One of the best ways to
achieve this happiness is to engage in social support by connecting with coworkers. In another
experiment to measure happiness in the workplace, Oswald, Proto, and Sgroi (2014) employ four
different experiments that explore the notion of happiness and productivity by performing mood
inductions and ‘happiness shocks’, thus manipulating the mood of the subject. The productivity
levels are then tested among individuals who did not receive the inflated happiness, and for those
that now experience a happier mood. It was found that the happy individuals exhibited 12%
greater productivity. It can be concluded that happiness in the workplace has a statistically
significant positive impact on job productivity.
As cited above, there is evidence that job satisfaction and job performance are related, but
the causality link is highly debated (Davar & RanjuBala, 2012). Most studies approach it from
the perspective that job satisfaction increases job performance, however, the reverse could be
true. In the reverse situation, good, productive performance may cause high employee
satisfaction (Bockerman & Ilmakunnas, 2012). Johnson, Davis, and Albright (2009) attempt to
determine if there is a relationship between employee attitudes and financial performance of a
firm. It was found that an improved financial performance of the firm can positively impact
employee attitudes, but when switching the variables, employee attitudes do not impact future
financial performance. There is not substantial literature or findings yet to determine the
direction of causality.
8
If it can be concluded that employee satisfaction and performance are related on an
organization level, then the next area of exploration needs to be which factors actually contribute
to that satisfaction. The Great Place to Work Institute conducts extensive surveys and identifies
key factors contributing to employee satisfaction such as attitudes towards management,
company camaraderie, benefits and pay, training, communication, and diversity efforts. Many of
the factors present on the Great Place to Work Institute’s survey appear to be a common theme
among researchers. Conway, Williams, and Green (1987) propose that job satisfaction is best
analyzed based upon job facets, that is, breaking up overall job satisfaction into different factors
such as training, promotions, compensation, etc. Through job facet satisfaction surveys,
promotion was ranked as the most important factor. According to the Society for Human
Resource Management 2016 Job Satisfaction report, extensive surveys revealed that the top 5
factors that contribute to overall employee job satisfaction are, in the following order, (1)
respectful treatment of all employees at all levels, (2) compensation/pay, overall, (3) benefits,
overall, (4) job security, and (5) trust between employees and senior management (“Employee
Job Satisfaction and Engagement”, 2016). The Great Place to Work Institute (2017) captures
these five factors very well, with the Trust Survey covering numbers 1 and 5, and the Culture
Audit covering 2, 3, and 4. With the positive correlation between job satisfaction and job
productivity, more companies should consider adopting, or at minimum, investing in a few of the
top rated factors in order to create a healthier and more productive workspace.
Fortune 100 Best Stock Performance
There is sufficient research and literature completed on how companies on the Fortune
100 list relate to stock performance. Key variations among this literature include investment
strategies, benchmarks, portfolio composition, key metrics, and analysis horizon. Through the

9
discussion of literature, it is important to note that each researcher uses a different variation of
the factors mentioned above, so big picture and common theme of results is key. The past
findings and conclusions will be discussed below.
Many studies have performed the Fortune 100 analysis using a variety of investment
strategies. One of the most common is the buy and hold strategy, where it buys the firms on the
Fortune 100 list for the portfolio and holds those companies until the end of the sample period,
often consisting of many years. Another method is to follow an active strategy, in which the
portfolio is updated each year with the new additions and deletions. In most cases, the buy and
hold strategies display higher overall returns compared to the market than portfolios held
annually (Fulmer, Gerhart, & Scott 2003). This held true in Goenner’s (2008) study, where he
found that the buy and hold strategy outperforms the active strategy in six of the seven periods.
The same is true in Filbeck and Precce’s (2003) case where the Fortune 100 statistically
outperformed only 2 of the 13 annual periods compared to 6 of the 9 multi-year buy and hold
periods. According to Filbeck and Preece (2003), “the raw return results suggest that an investor
cannot outperform the market investing in Fortune’s ‘100 Best Companies to Work For’ on a
consistent, annual basis, although support may exist for such superior results for longer holding
periods”.
Various benchmarks have been used as well to compare the Fortune 100 returns. The
S&P 500 is a common benchmark, as it is the easiest method. Goenner (2008) utilizes both a buy
and hold strategy and active strategy compared to the S&P 500, and find that both methods
outperform the S&P 500 in seven out of eight annual periods, with 1998 being the exception.
Fillbeck and Preece (2003), however, state that the S&P 500 is not an adequate benchmark due
to the unique industry makeup and market capitalization of the Fortune 100. They use matched

10
firms as a benchmark instead. Fulmer, Gerhart, and Scott (2003) perform their analysis utilizing
benchmarks of both the broad market as well as matched companies. On a cumulative basis, or
multi-year analysis, Fulmer’s results show that the stock returns for the Fortune 100 for years
1995 – 2000 had a total return of 376%, compared to 193% for the broad market index,
presenting a 95% advantage. That number is not as large nor consistent among years when
looking at the returns on an annual basis.
Fulmer et al. (2003) evaluated the Fortune 100 based upon two key metrics, ROA and
market to book ratio for years 1995 to 2000. This sample period is composed of an analysis for
years prior to the release of the first list, the first published list in 1998, and years after the
release of the first list holding the same portfolio. ROA is a profitability metric that measures
how profitable a company’s assets are. The idea is that if one firm has more efficient intangible
assets than another, i.e. employees, then the ROA will be higher. The market to book ratio
compares the book value of a firm to its market value, thus employing both market and financial
statement information. Therefore, this metric includes intangible assets as well, helping to
measure the impact that employer-employee relations have on firm market value. It was
concluded that when compared to a portfolio of matching firms, the Fortune 100 firms boasted
higher metrics. The market-to-book ratio was significantly higher for the Fortune 100 in 4 out of
the 6 years tested. The ROA results were a bit more scattered, but overall they suggest that the
Fortune 100 has better profitability for most years sampled (Fulmer et al., 2003). Filbeck and
Preece (2003) evaluate the portfolio by using the Sharpe ratio, Jenson’s Alpha, and Treynor ratio
in order to account for risk. This is important because the Fortune 100 portfolios are riskier than
the market, most likely why they offer higher returns (Goenner, 2008). Filbeck and Preece
(2003) find that based on both the Sharpe and Treynor ratio, the Fortune 100 portfolio

11
outperforms the benchmark in 10 out of the 13 annual periods and all the multi-periods. Using
Jenson’s Alpha, the number increases to 11 out of 13 annual periods and all multi-periods. With
the risk adjusted performance measures, the portfolios of the Fortune 100 still outperform the
market.
Additionally, some studies have further broken down the Fortune 100 list to analyze how
the top 5, 10, and 25 companies compare to the overall Fortune 100 portfolio as well as the
market. Goenner (2008) found that for the buy and hold strategy, the full portfolio of all public
companies produces better returns, but for the active strategy adjusted annually, the top 25
companies produce better returns. With a higher number of firms, the portfolio is more
diversified and is thus less risky and less sensitive to changes in the market.
The time frame in which the returns are analyzed can have different implications as to the
meaning of the results. The most common method has been to compare the results over a sample
period, typically one year or a multi-year buy and hold period. The goal of this method is to
understand the implications surrounding investment performance of the Fortune 100 portfolio in
relation to the market. However, there is another important time frame to be considered. The
performance information surrounding the few days before and after the release of the magazine
issue and announcement of the Fortune 100 list can have important indications. Looking at the
returns for the day or two before the announcement can lead to conclusions about leaked
information (Filbeck & Preece, 2003). If the portfolio return increases the day before the
announcement, it may indicate that investors got a hold of the information. This type of analysis
is known as an event study, in which a specific event affects the activity of a stock. A positive
market reaction further indicates that investors do indeed value the Fortune 100 list as a strong

12
investment (Filbeck & Preece, 2003). They found that prior to the release of the announcement,
the Fortune 100 have statistically significant positive abnormal returns.
Performing a cost benefit analysis regarding the cost of providing the employee benefits
and the benefits that are earned on stock performance suggest a positive correlation. It is
important to note that when comparing and mentioning different author’s work, many of the
results are based upon different assumptions, models, and benchmarks. Thus, similar results
among these different circumstances overwhelmingly suggests a positive correlation between the
Fortune 100 List and stock performance. It can thus be asserted that the cost of investing in
employees, that is, providing good benefits, training, internal communication, etc. is worth the
extra cost. Not only does it fail to hinder the performance of the company stock, it appears to
enhance the returns that are seen.
Methodology
The purpose of this paper is to determine if companies on the Fortune 100 list outperform
the market. The sample used to address this question consists of the Fortune 100 Best Companies
to Work For List from the years 1998 to 2016. This time frame is the list in its entirety, providing
19 years of information. The most recent lists are found on the Fortune website, and the more
dated lists are found in the archives on the Fortune website or via repositories from past
magazines uploaded to the TCU library database (“Fortune 100 Best Companies”, 1998-2016).
Each list consists of 100 public, private, or non-profit companies, but for the purpose of the
study, only public companies could be analyzed. After filtering to include only public
companies, the average number of companies that make up the portfolio was reduced to roughly
50 for each year. The dates closer to 1998 have a larger portion of public companies on the list,
whereas the more current lists have fewer public companies, with the number closer to 35. There

13
has been an obvious trend of a decrease in the number of public companies that have been
awarded a spot on the list in the more recent years. In order to complete the data collection, the
corresponding ticker symbol and PERMNO was collected for each company.
[Insert Figure 1]
When studying stock performance, data collection through a database is the best method
to employ. In order to generate portfolio returns, Wharton Research Data Services (WRDS) was
utilized. WRDS is a research platform and business tool that provides access to a variety of
business research databases and sophisticated software tools. Within WRDS, Eventus, an event
study software, was used to create the portfolios with various assumptions to generate returns
over different periods of time. An event study assesses the impact of a specific event on the value
of a firm. The event being analyzed is the release of the Fortune 100 List. Essentially, this event
study is analyzing whether investors believe that being on the Fortune 100 list creates value for
the company through increased stock returns. An event study has various event windows, which
are used to look at the stock performance for a specific time frame. Multiple event periods are
chosen in order to show how the market reacts to the news across different periods of time
(Peterson, 1989). A specific start date must be identified that acts as “0” in the event window. In
this case, the date the Fortune 100 list was published acts as the conception of the portfolio. The
event windows will be set up to analyze the yearly returns, but also to test stock activity around
the announcement date. (0, +230) is the most widely explored event window in this study, and its
meaning translates to the stock returns from the day the list was released to 230 days after the
release of the magazine. 230 accounts for roughly the number of trading days in a year. Other
event windows test how investors react to the release of the list in a shorter period of time. (0,
+1) and (+1 +30) present information about the company’s stock performance days after the

14
news is released to analyze how the market reacts to that particular event, the essential concept
of an ‘event study’. If there is significant positive activity during these time frames, it may
suggest that investors view the Fortune 100 list as valuable information that led them to invest in
the companies. (-1, 0) and (-30, -2) display the returns right before the list is released, which may
indicate if any pre-knowledge of the list was leaked.
[Insert Figure 2]
Having discussed the initial assumptions, the company Permnos and dates are then
uploaded via textfile and the Eventus software extracts the necessary data from the CRSP stock
price database. The Basic Event Study – Daily is the event study utilized for the purpose of this
paper. The software provides a market adjusted return (MAR) and a market model abnormal
return for each stock as well as the portfolio as a whole. The market adjusted return adjusts for
broad market conditions and is equal to the return of the individual stock minus the return of the
market. The return of the market equals the market cap-weighted index of all stocks listed on the
NYSE, AMEX, and NASDAQ. This acts as a hedge strategy, where it is long the individual
stock and short the broad market index. The market model abnormal return takes beta into
account and explains how the stock performed in comparison to how it was expected to perform
after controlling for the company’s risk as captured by its beta (Kagan, Mayo, & Stout, 1995).
The portfolios were analyzed on a one year basis, in which the portfolio lasts the length of one
year and then a new portfolio is created for the next year of the Fortune 100 list.
Results
The results of the study support the hypothesis that the Fortune 100 list outperforms the
market. The majority of the results reported will focus on the (0, +230) time frame, the annual
return of the Fortune 100. The return that is collected from the Eventus software is the market

15
adjusted return and denotes by how much the Fortune 100 outperformed the broad market. For
example, in 1998 the return provided means that the Fortune 100 earned 1.36% more than the
broad market. The Fortune 100 returns were compared to the S&P 500 returns, acting as the
benchmark for the broad market. In order to get the overall return of the Fortune 100, the market
adjusted return is added to the S&P 500 return.
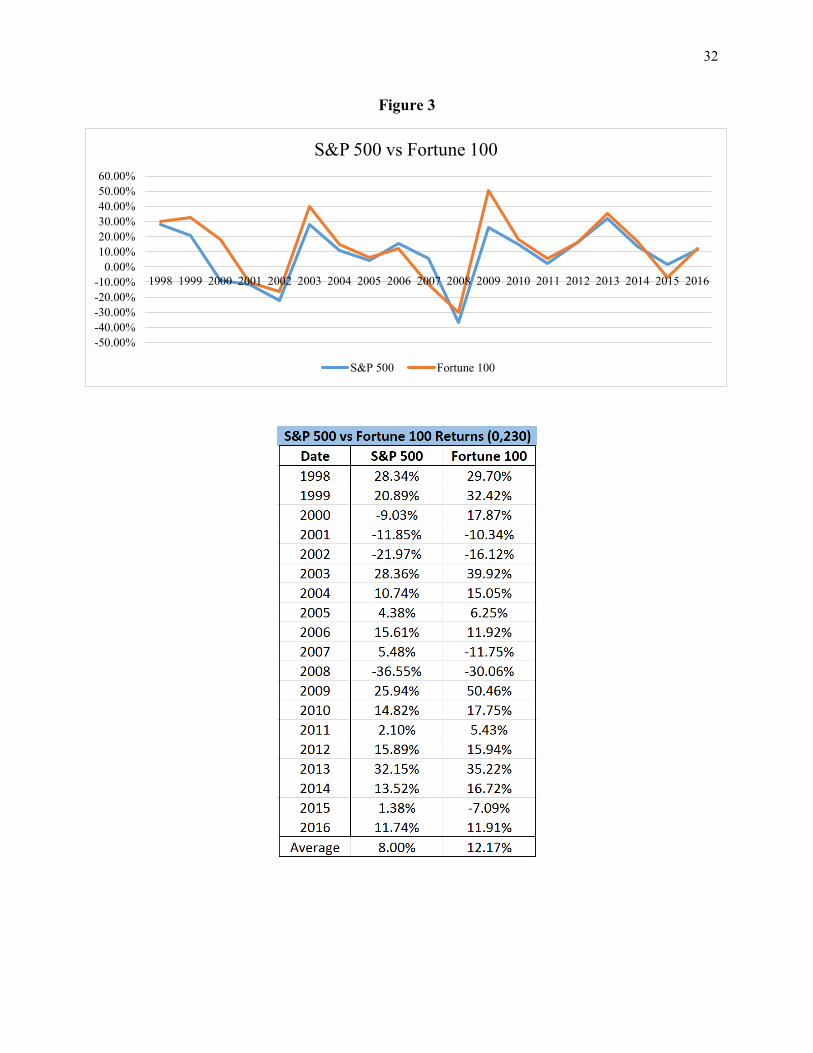
The first result to be discussed is the overall performance of the Fortune 100 portfolio.
The Fortune 100 outperformed the market in 16 out of the 19 years of data collection.
[Insert Figure 3]
When averaging the market adjusted returns from 1998 to 2016, the Fortune 100, on average,
outperforms the broad market by 4.17% per year. When graphed against one another, the Fortune
100 return and return of the S&P 500 are highly correlated, however there are years where there
are larger gaps between the two. This is often due to individual stocks in the portfolio that either
had unusually high or low returns that year.
Company events or the state of the economy can have a large impact on the performance
of the portfolio. This can be viewed by looking at market adjusted returns or the market model
abnormal returns that are unusually high or low for a particular year. There are three years of
particular interest for the market adjusted returns, and two years for the market model abnormal
returns. These are 2000, 2007, 2009 and 2001 and 2010 respectively.
[Insert Figure 4]
In order to access which stocks were causing these influxes, the return of each individual
company in the portfolio was considered. Stock returns that were statistically significant at the
.01 or .001 level were considered significant and analyzed in further detail. When looking at
companies that are significant, one can group them based upon industry or practice in order to

16
assess if there are any trends among those that are significant. Such a trend may suggest it is not
a single company event, but rather the state of the economy and its effect on a specific industry.
In order to understand the impact of these statistically significant returns, a new portfolio was
created that excluded the statistically significant stocks, and the return of the old portfolio was
compared to the return of the new portfolio.
In 2007, the original return was -17.23%. Seven stocks were considered significant and
taken out of the portfolio, giving an adjusted return of -4.31%. Three stocks deserve special
attention and can provide explanations for the highly negative return of the original portfolio.
Standard Pacific Homes is a real estate company that was highly affected by the state of the
economy. In 2007, the housing market crashed and there was fear that public real estate
companies were on the brink of bankruptcy (Glaeser, 2010). The negative market conditions for
housing and real estate companies caused the value of Standard Pacific’s stock to plummet.
Homebanc is another company that was a big loser for the portfolio which was caused by
an unfortunate company event due to housing market conditions. Homebanc Mortgage, a
company that operates in the mortgage loan and real estate market, filed for Chapter 11
Bankruptcy in August of 2007 (Rauch, 2007). During 2007, this was a common theme among
companies in the public real estate industry and mortgage companies. Lastly, First Horizon
National is a bank that struggled during the financial crisis, similar to many other banks. The
state of the economy was the key driver of bad performance for the year of 2007.
[Insert Figure 5]
The year of 2009 was on the opposite side of the spectrum, boasting a highly positive
return. In order to identify the players that contributed to this increased performance, statistically
significant companies were considered. 2009 was overall very positive, and companies were only

17
significant at the .05 level. Aflac and Carmax were two of the high performers. Carmax does not
have any obvious events that led to this increased stock performance, however, Aflac completed
an acquisition of Continental American Insurance Company in 2009 (“Annual Report”, 2009).
The high market adjusted returns this year are likely due to the fact that in 2008 the S&P 500 had
a return of -36.55%, perhaps one of the worst years for the market since the Great Depression. In
2009 there was a greater sentiment of optimism regarding market conditions, expecting the
economy to recover from the recession. Less hesitation in the market led to increased stock
performance overall, and a strong portfolio of companies on the Fortune 100 list led to an even
higher market adjusted return.
Trends show that there is a strong correlation between the market adjusted returns and
market model abnormal returns, however, some outliers do exist. Two years in particular are
2001 and 2010 in which there is a 38.34% and 19.20% difference respectively between the two
returns for the year.
[Insert Figure 6]
The market model abnormal return computes the difference between the actual return of a
security and the expected return of the security. Essentially, the market model abnormal return
would be very negative if a particular stock return was much lower than expected. The process
for determining the discretion between the two returns is very similar to the method used for the
difference between the S&P 500 and Fortune 100 returns. 2001 has a very specific and obvious
outlier that led to this discrepancy. In 2001, Enron was on the Fortune 100 list due to the
perceived value the company created for their employees. Enron is a company that is widely
known and studied among business students and employees as an example of poor ethical
standards and the consequences of fraud. Before the accounting fraud was discovered, Enron was

18
viewed as a model company that was one of the largest accounting firms and wildly successful.
In 2000, Enron’s stock hit a high of $90.75 then plummeted in October of 2001 to $33.84 after
talk of the possibility of fraud. Enron filed for bankruptcy in December 2001 with the stock price
ending at just pennies (Healy & Palepu, 2003). Top executives had covered up a fraud by
manipulating accounting practices and financial statements in order to overstate their earnings.
Enron is a key example of how a company event can affect the returns of a portfolio. While the
market adjusted return was certainly reduced due to Enron, the market model abnormal return
shows that this was clearly not expected. When only taking Enron out of the portfolio and
rerunning the data, a market adjusted return of 6.27% and market model abnormal return of -
31.33% are obtained. Compare this to the original market adjusted returns of 1.51% and -36.92%
respectively.
[Insert Figure 7]
The year 2010 had an overall positive market adjusted return but a highly negative
abnormal return, meaning that overall the stocks performed well, but not near as well as
expected. Following the difficult economic conditions in 2008-2009, 2010 was expected to make
a recovery and an optimistic sentiment was felt throughout the market. 2009 performed better
than 2008, and 2010 was expected to perform better than 2009. While 2010 boasted an overall
positive return, it was not as high as 2009 thus accounting for the difference between the
expected return and actual return, i.e., the market model abnormal return. While much of the
discrepancy is due to the fact that 2010 didn’t meet investor’s expectations, one can look closer
at companies to understand individual events that caused this, two being Google and Cisco
Systems. In 2010 there were rumors that Google was considering discontinuing operations in

19
China, a large opportunity for market expansion (Paul, 2010). Such information worried
investors which negatively affected the stock.
Results suggest that the Fortune 100 may be a good portfolio to invest in when the broad
market is not doing well. The S&P 500 returns show that there were four years from 1998-2016
that the market was negative: 2000, 2001, 2002, and 2015. In each of these four years, the
Fortune 100 had a market adjusted return that was positive, thus outperforming the market. It is
important to note, however, that the overall return of the portfolio was not always positive. While
the portfolio lost, it lost less than the broad market.
[Insert Figure 8]
All results presented up to this point have been based on the (0, +230) event window.
Other event windows were considered such as the (-30, -2) and (+1, +30) to determine if there
were any trends in leaked information or perceived value a few days after release of the
magazine. While there were significant results in some years, such was not the case for others.
The significance of these events appears to be on an individual basis as opposed to a conclusion
that can be reached about the entire portfolio. For example, in 2016 there was increased activity
of 4.03% a few days before the release of the magazine. In 2012, however, there was almost no
movement, with a return of 0.01% from (-30, -2). The sporadic significance of returns the couple
of days before is understandable, as leaked information most likely wouldn’t happen every year.
2016, 2008, 2002, and 2001 all have unusually high returns during the event windows before the
release of the list. The same observation can be made when looking at the (+1, +30) event
window. While some years boast high returns after the release of the magazine, others are close
to zero or even negative. When averaged together, the average return is 0.70%. This observation
is a bit more startling, as one would expect there to be a stronger trend. Over time there is

20
overwhelming evidence that the portfolio outperforms the market on an annual basis, but the first
30 days after the release of the magazine show no significance to the event.
[Insert Figure 9]
Discussion
Various conclusions can be reached based upon the data collected. First and foremost is
that overall, the Fortune 100 does outperform the market. This supports both my hypothesis and
past literature and studies that have been completed on the topic. Second, company events and
the state of the economy can have a large impact on the performance of the portfolio. This is not
a foolproof strategy – a good company that treats their employees well does not automatically
mean it has increased stock performance. Outside factors or company events can either help or
hurt the performance of the portfolio. Outliers must be adjusted for in order to fully maximize
returns. If an investor does seriously invest in the portfolio, it would be smart to eliminate
companies who are in industries that are struggling, or get rid of a company as soon as an
unfortunate even occurs. Third, the Fortune 100 portfolio is a good portfolio to invest in when
the broad market is not doing well. Lastly, connecting the findings to a company perspective,
companies may be able to model themselves after companies on the Fortune 100 list in order to
increase their perceived value. Investors clearly value companies who invest in their employees.
It is unclear whether it is the recognition companies receive on the Fortune 100 list, or if simply
being a “good company” increases the appeal to investors, but there is certainly some benefit to
be obtained. More companies should strive to meet criteria to fit the statement, “doing well while
doing good”.
The results found align very closely with my expected findings, however, there was one
area of the research that surprised me. I expected there to be a larger reaction to the release of the

21
list. While overall the portfolio outperformed the market, often by large amounts, that was not
the case a few days after the release of the list. Investors did not jump at the news, and I expected
there to me more activity within the first month of the magazine being released.
Limitations of the Study
There are a number of limitations that must be considered. The sample firms must have
return records on the Eventus Database, otherwise it cannot be included in the analysis. Full
sample size of public companies on the Fortune 100 list may be reduced based on these
limitations. In some cases, particular companies were excluded from the analysis if full stock
returns did not exist for the year or if the information input did not align with the software
system. Getting the dates to line up exactly in the event windows was not perfect. In two cases,
years 2003 and 2015, the Eventus software could not produce outputs for the date the magazine
was released. The date had to be adjusted a couple months after or before in order to produce
results. The event window was then adjusted accordingly with 20 trading days in a month to
bring it back to its actual release date. Further, 230 days was a rough estimate for number of
trading days in a year, and therefore the “annual return” was not exact. Another limitation is that
this study looks at the returns generated of each list held for only a single year. If a buy and hold
strategy is utilized, it is likely that larger returns will be seen. While the Fortune 100 List in most
cases outperformed the market, it cannot be concluded with confidence that investing in the
Fortune 100 list will consistently outperform the market.
Future Studies
I see three possible future studies that could follow in order to enhance the results. One
further addresses whether the list outperforms the market. The list can be analyzed by breaking it
up to look at how the top 10 or top 25 companies perform. Rankings was not a result looked at in
22
my thesis, however, it has been done in other studies as described in the literature review.
Viewing this for all 19 years will show if there is any significant trend among various rankings in
the list. To view the implications from a practical perspective, a future study that could be
performed is to actually create and invest in portfolios made up of the Fortune 100. This could be
done either based upon past information, or could be a multi-year study in which one invests in a
portfolio in real time to see how it grows in comparison to a benchmark. A real-time portfolio
would show the true returns one would earn including taxes and transaction costs. Third is to
perform a study to understand the relationship and correlation between good companies and
stock performance. This would consist of building a portfolio of similar companies that are
viewed as good places to work but are not featured on the Fortune 100 list. Doing so will help
address whether the stronger returns of outperforming the market for the Fortune 100 are due to
recognition received for being on the list, or whether it is the fact that the companies invest in
their employees.
Implications
The implications for this study affect both investors and companies. For investors, the
findings of returns that outperform the market can be put into practical use by investing money in
this portfolio. Investors are constantly searching for investment strategies that outperform the
market, but are often unsuccessful at doing so. The Fortune 100 list, when held and updated over
a long period of time may offer a solution to the dawning quandary. Assume that in 1998, an
individual invests $100,000 in the Fortune 100 portfolio. At the beginning of 1999 when the new
list is released, the portfolio is updated to include only companies on the 1999 list. This
continues until 2016. This utilizes an active strategy once a year in which the portfolio is updated
and rebalanced every year, but passive for the remainder of the year. The goal is to see how

23
much your $100,000 grows over those 19 years. Starting with what the broad market earns,
measured by the S&P 500, the gross amount at the end of 2016 would equate to roughly
$324,000. If an individual invests in the Fortune 100, the return at the end of the 19 years would
equal about $639,200. By investing in the Fortune 100 an individual earns nearly twice as much
than if they invested in the market. The actual returns would be lower if transacted in real life
due to taxes and transaction costs. Transaction costs would be minimal however, as many
companies remain on the list from year to year, and in some cases, are on the list every year. For
example, Nordstrom (JWN) had been on the list all 19 years, and Google has been on the list
since 2007.
[Insert Figure 10]
Compounding and sequence of returns are highly influential in the success of this portfolio. The
fact that the Fortune 100 outperforms the market when it is down allows the Fortune 100
portfolio to build upon their previous returns or lose less than the market while the S&P 500
loses more helps the return greatly.
While investors may be more likely to find the information and results in this portfolio
more applicable, there are actually very strong implications on a company perspective. The
Fortune 100 list was created after lengthy surveys and research had been done on companies in
order to assess their efforts to address employee needs and create a positive workplace culture.
The results suggest that investors value companies who take care of their employees. With the
methods and factors used in constructing the list being widely available on the Great Places to
Work Institute’s website, companies can get ideas and begin to implement similar practices into
their workplace. Further, companies who are not in the running for the Fortune 100 list could
apply.

24
Conclusion
The Fortune 100 Best Companies to Work For List has many implications about stock
performance and the value of investing in employees. The Fortune 100 List suggests a possible
investment strategy to maximize returns that outperform the market. The importance of the
Fortune 100 List can be viewed from both an investor’s perspective as well as from a company
perspective. From a company perspective, firms can increase their value by possessing intangible
assets such as satisfied employees, known as a resource based view. Past literature suggests a
strong relationship between satisfied employees and increased productivity. Studies by Oswald et
al. (2014) and Bockerman and Ilmakunnas (2012) provide evidence of this relationship by
finding that happier employees are 12% more productive than unhappy employees, and that a
one standard deviation increase in job satisfaction led to a 6.6% increase in productivity. Many
of the factors that create satisfied employees are factors considered when creating the Fortune
100 list. As cited and surveyed by the Great Place to Work Institute, factors such as the
relationship and trust between employees and management, relationships among co-workers, and
more quantifiable benefits such as compensation, training programs, and diversity efforts are
among the most important aspects of employee satisfaction.
There have been many studies done on the Fortune 100 list and stock performance.
While all the studies have the same end goal, they all use different assumptions to generate the
results. Differing assumptions include differences in benchmarks, metrics and ratios used,
passive versus active strategies, and subsections of the lists looked at. Different benchmarks used
include the S&P 500 as the most common one, or a portfolio of matched companies. Buy and
hold versus active strategies can lead to very different results, as one is constantly updated and
the other is held for a given period of time. Despite the different assumptions, researches such as

25
Filbeck and Preece (2003), Goenner (2008), and Fulmer et al. (2003) found that there is an
overwhelming response that the Fortune 100 list outperforms the market.
In order to perform my own study, I utilized an event study using the Wharton Research
Data Services under its own set of assumptions. The public companies on Fortune 100 List from
years 1998 – 2016 were used as the sample, thus extracting data in its entirety. The market
adjusted return was found for the entire list of public companies and compared to the S&P 500
based upon an annual holding period. The most notable results were found from an event
window of (0, +230), the annual return that includes all trading days in a year. Results support
the hypothesis that the Fortune 100 would outperform the market. Out of all 19 years, only 3 did
not outperform the broad market. It was found that on average, the Fortune 100 outperforms the
market by over 4% per year. While the general hypothesis was supported, additional findings
were discovered. Some years outperformed or underperformed the market by a small percentage,
and others were much larger. This difference can often be attributed to one or two individual
stocks in the portfolio, which can be caused by company events or the state of the economy.
Enron in 2001 is an example of a company event negatively affecting the return of the portfolio.
The returns for the year 2007 were largely affected by the state of the economy. The market in
2007 was struggling due to the housing market crash, which in turn affected both the companies
of Standard Pacific and Homebanc Mortgage. It is important to note that the Fortune 100 is not a
foolproof strategy, and outliers do exist.
Another discovery is that the Fortune 100 outperforms the market when the broad market
is not doing well. In each of the four years the S&P 500 was negative, the Fortune 100 portfolio
outperformed the broad market. While it outperforms the market, that does not mean it results in
an overall positive return for the year. This information suggests that the Fortune 100 may be a

26
good portfolio to invest in when the broad market is not doing well, as it loses less than the S&P
500. From a practical perspective, investors may want to understand how their returns would
grow if real money was invested in the portfolio. If $100,000 were invested in the portfolio and
grown over the 19 years the list has been published, findings indicate that the portfolio would
earn almost double the amount of a portfolio consisting of the S&P 500. This analysis does not
take into consideration taxes or transaction costs, but it sheds light to a possible future study.
From a company perspective, the findings that the Fortune 100 List outperforms the
broad market can be very valuable information. Other companies may want to model themselves
after the Fortune 100 and attempt to incorporate similar benefit programs and company culture to
fully maximize firm value. Investors clearly value the notion of companies investing in their
employees. Further research must be performed in order to understand if the value is derived
from recognition received from being mentioned on the Fortune 100 list or if it is solely due to
the creation of happy employees. Regardless of the relationship, the event study performed over
the 19 years from 1998 to 2016 concluded that investors view the Fortune 100 list as valuable, as
it outperforms the broad market in all but three years of the study.

27
Bibliography
Achor, S. (2012). Positive Intelligence. Harvard Business Review.
Annual Report. (2009). Aflac Incorporated. Retrieved March 2, 2017 from
http://investors.aflac.com/~/media/Files/A/Aflac-IR/financial-reporting/annual-
reports/ar2009.pdf
Bockerman, P., Ilmakunnas, P. (2012). The Job Satisfaction-Productivity Nexus: A Study Using
Matched Survey and Register Data. ILRReview, 65(2).
Conway, P. G., Williams, M. S., Green, J. L. (1987). A Model of Job Facet Satisfaction. Journal
of Social Work Education, 23(1), 48-57. http://www.jstor.org/
Davar, S. C., RanjuBala. (2012). Relationship between Job Satisfaction & Job Performance: a
Meta-analysis. Indian Journal of Industrial Relations, 48(2), 290-305.
http://www.jstor.org/
Employee Job Satisfaction and Engagement: Revitalizing a Changing Workforce. (2016). Society
for Human Resource Management.
Filbeck, G., Preece, D. (2003). Fortune’s Best 100 Companies to Work for in America: Do They
Work for Shareholders?. Journal of Business Finance & Accounting, 30(5) & (6), 771-
795.
Fortune 100 Best Companies to Work For. (1998-2016). Fortune Magazine.
Fulmer, I. S., Gerhart, B., Scott, K. S. (2003). Are The 100 Best Better? An Empirical
Investigation of the Relationship between Being a “Great Place to Work” and Firm
Performance. Personnel Psychology, 56, 965-993.
Glaeser, E. (2010). Housing policy in the wake of the crash. Daedalus, 139(4), 95-106.

28
Goenner, C. F. (2008). Investing in Fortune’s 100 Best Companies to Work for in America.
Journal of Economics, 34(1), 1-19.
Great Place to Work Institute. (2017). Retrieved January 9, 2017, from
https://www.greatplacetowork.com/
Healy, H. M., Palepu, K. G. (2003). The Fall of Enron. American Economic Association, 17(2),
3-26
Johnson, D. E., Davis, S. B., Albright, T. L. (2009). Examining the Relationship between
Employee Attitudes and a Firm’s Financial Performance: A Theoretical Framework and
Causal Investigation. Journal of Managerial Issues, 21(3), 367-382.
Judge, T. A., Bono, J. E., Thoresen, C. J., Patton, G. K. (2001). A Job Satisfaction-Job
Performance Relationship: A Qualitative and Quantitative Review. Psychological
Bulletin, 127(3), 376-407.
Kagan, G., Mayo, H., Stout, R. (1995). Risk-Adjusted Returns and Stock Market Games. Journal
of Economic Education, 26(1), 39.
Ostroff, C. (1992). The Relationship Between Satisfaction, Attitudes, and Performance: An
Organizational Level Analysis. Journal of Applied Psychology, 77(6), 963-974.
Oswald, A. J., Proto, E., Sgroi, D. (2014). Happiness and Productivity. University of Warwick.
Paul, I. (2010, January 13). Google Pulling Out of China? Don't Bet On It. Retrieved April 9,
2017, from http://www.pcworld.com/article/186793/google_china.html
Peterson, P. P. (1989). Event Studies: A Review of Issues and Methodology. Quarterly Journal
of Business and Economics, 28(3), 36-66.
Rauch, J. (2007, August 10). HomeBanc Files for Bankruptcy. Retrieved April 9, 2017, from
http://www.bizjournals.com/atlanta/stories/2007/08/06/daily48.html

29
Simon, D. H., DeVaro, J. (2006). Do the Best Companies to Work for Provide Better Customer
Satisfaction?. Managerial and Decision Economics, 27, 667-683.
Wernerfelt, B. (1984). A Resource-Based View of the Firm. Strategic Management Journal,
5(2), 171-180.
Wright, T. A., Cropanzano, R. (2000). Psychological Well-Being and Job Satisfaction as
Predictors of Job Performance. Journal of Occupational Health Psychology, 5(1), 84-94.

30
Appendix
Figure 1
2016 Fortune 100 Sample

31
Figure 2
32
Figure 3
-50.00%
-40.00%
-30.00%
-20.00%
-10.00%
0.00%
10.00%
20.00%
30.00%
40.00%
50.00%
60.00%
1998 1999 2000 2001 2002 2003 2004 2005 2006 2007 2008 2009 2010 2011 2012 2013 2014 2015 2016
S&P 500 vs Fortune 100
S&P 500 Fortune 100

33
Figure 4
Figure 3
Figure 5

34
Figure 6
-50.00%
-40.00%
-30.00%
-20.00%
-10.00%
0.00%
10.00%
20.00%
30.00%
40.00%
1998 1999 2000 2001 2002 2003 2004 2005 2006 2007 2008 2009 2010 2011 2012 2013 2014 2015 2016
Market Adjusted Return vs Market Model Abnormal Return
Market Adjusted Return Market Model Abnormal Return

35
Figure 7
Figure 8

36
Figure 9
Figure 10
$-
$100,000
$200,000
$300,000
$400,000
$500,000
$600,000
$700,000
1998199920002001200220032004200520062007200820092010201120122013201420152016
Investment Portfolio
Fortune S&P 500

37