Embed Size (px)
Citation preview

The Relationship BetweenStream Macroinvertebrates and
Salmon in the Quilceda/Allen Drainage
March 1999
Publication No. 99-311

For additional copies of this report, contact:
Department of EcologyPublications
P.O. Box 47600Olympia, WA 98504-7600Telephone: (360) 407-7472
The Department of Ecology is an equal opportunity agency and does not discriminate on the basis ofrace, creed, color, disability, age, religion, national origin, sex, marital status, disabled veteran’s status,Vietnam Era veteran’s status, or sexual orientation.
For more information or if you have special accommodation needs, please contact Michelle Ideker at(360) 407-6677. Ecology Headquarters telecommunications device for the deaf (TDD) number is(360) 407-6006. Ecology Regional Office TDD numbers are as follows:
SWRO (TDD) (360) 407-6306NWRO (TDD) (206) 649-4259CRO (TDD) (509) 454-7673ERO (TDD) (509) 458-2055
The Relationship BetweenStream Macroinvertebrates and
Salmon in the Quilceda/Allen Drainage
prepared byRobert W. Plotnikoff and Joanne Polayes
Washington State Department of EcologyEnvironmental Assessment ProgramOlympia, Washington 98504-7710
March 1999
Waterbody # WA-07-1015Publication No. 99-311

(BACK-OF-PAGE PLACEHOLDER FOR DUPLEX PRINTING)

Page i
Table of Contents
List of Tables .................................................................................................................. ii
List of Figures ................................................................................................................. ii
Abstract ......................................................................................................................... iii
Methods.......................................................................................................................... 2
Description of Study Area ........................................................................................... 2Field Sampling............................................................................................................. 4Laboratory Sample Analysis......................................................................................... 6Macroinvertebrate Data Analysis ................................................................................. 6
Results ............................................................................................................................ 9
Site Condition and Ranking ......................................................................................... 9Sources of Stream Degradation ................................................................................... 9Macroinvertebrates and Salmon Habitat..................................................................... 10Biological Properties of Benthic Communities ........................................................... 13
Discussion.....................................................................................................................14
Site Condition and Ranking ....................................................................................... 14Sources of Stream Degradation ................................................................................. 14Macroinvertebrates and Salmon Habitat..................................................................... 15Biological Properties of Benthic Communities ........................................................... 16
Conclusions................................................................................................................... 17
Acknowledgements ....................................................................................................... 18
References.....................................................................................................................19
APPENDIX A Field Survey FormsAPPENDIX B Biological Condition and Relationships to Land Use, Stream Reach
Condition, and Salmon UseAPPENDIX C Biological Conditions in Riffle and Pool HabitatAPPENDIX D Biometrics Data for Each SiteAPPENDIX E Detailed Pre-Survey Site Descriptions

Page ii
List of Tables
Table 1. Sites selected for biological monitoring in the Quilceda/AllenProject ....................................................................................................4
Table 2. Physical and chemical variables measured at each stream and theirscale of measurement (reach and site specific)..........................................4
Table 3. Biometrics used to construct the Benthic Index of BioticIntegrity (B-IBI)......................................................................................7
Table 4. Biometrics and the type of degradation reflected from a responseto physical or chemical changes in a stream reach....................................8
List of Figures
Figure 1. Biological Assessment Sites for the Quilceda/Allen Watershed.................3
Figure 2. Benthic Index of Biotic Integrity scores for sites in theQuilceda/Allen drainage and the land uses associated with each site.........9
Figure 3. Reported stream reach use by salmon at sites in theQuilceda/Allen drainage.........................................................................11
Figure 4. Threshold for minimum amount of cobble substrate in forested,reference streams of the Quilceda/Allen drainage ...................................11
Figure 5. Threshold for minimum amount of coarse gravel substrate inforested, reference streams of the Quilceda/Allen drainage.....................12
Figure 6. Threshold for minimum amount of canopy shading at forested,reference streams of the Quilceda/Allen drainage ...................................12
Page iii
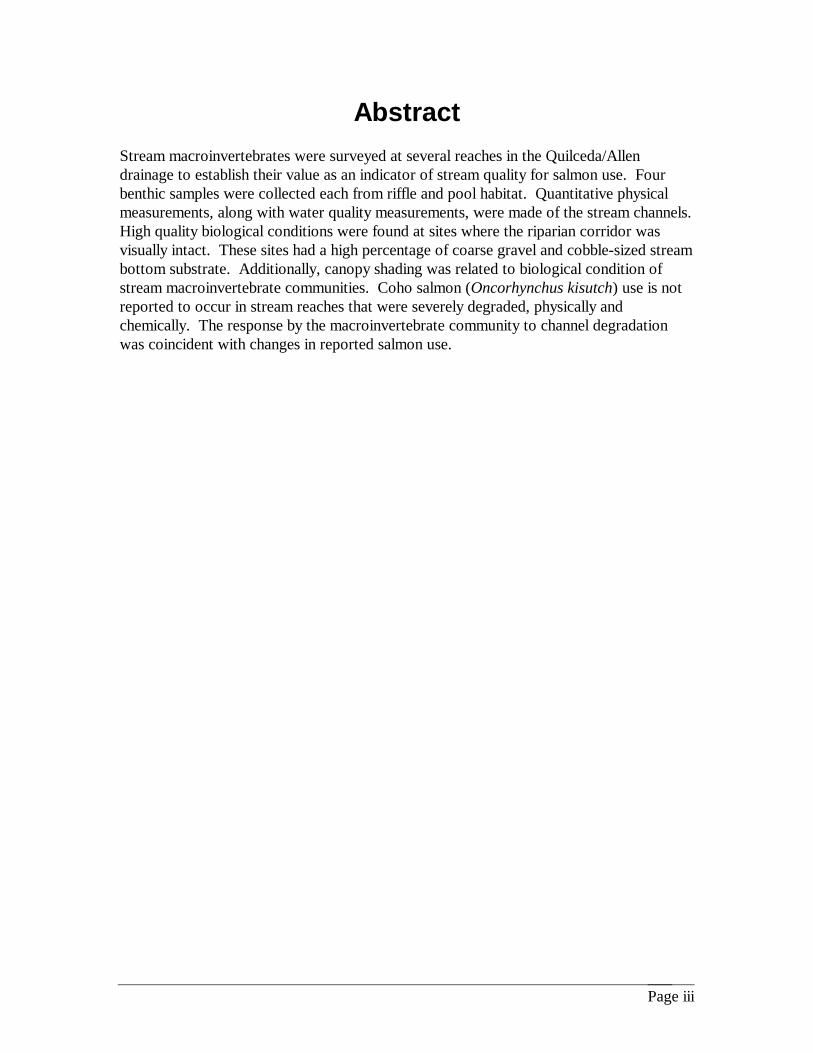
Abstract
Stream macroinvertebrates were surveyed at several reaches in the Quilceda/Allendrainage to establish their value as an indicator of stream quality for salmon use. Fourbenthic samples were collected each from riffle and pool habitat. Quantitative physicalmeasurements, along with water quality measurements, were made of the stream channels.High quality biological conditions were found at sites where the riparian corridor wasvisually intact. These sites had a high percentage of coarse gravel and cobble-sized streambottom substrate. Additionally, canopy shading was related to biological condition ofstream macroinvertebrate communities. Coho salmon (Oncorhynchus kisutch) use is notreported to occur in stream reaches that were severely degraded, physically andchemically. The response by the macroinvertebrate community to channel degradationwas coincident with changes in reported salmon use.

Page iv
(BACK-OF-PAGE PLACEHOLDER FOR DUPLEX PRINTING)

Page 1
Introduction
Streams contain a wealth of biological organisms. The benthic macroinvertebrates(aquatic insects) are a major component of this life in streams and are often used tomeasure stream health. Healthy streams maintain biological community attributes andfunctions that support biota in a pattern identifiable as a natural, non-degraded condition.Macroinvertebrate community characterization is an inexpensive way to measure streamquality, much like those methods relying on water quality samples.
Stream-dwelling invertebrates are affected by physical, chemical, and other biologicalvariables in their environment. Macroinvertebrate communities respond with some type ofsignal to changes in these environmental variables. Signals from the macroinvertebratecommunity, that are associated with a likely cause, provide a very effective way foridentifying measures needed to protect important stream resources.
Benthic macroinvertebrates generally inhabit a localized area of a stream throughout theirlife cycle. Therefore, the individual organisms are continually exposed to any changes thatoccur in the chemical and physical environment (Rosenberg and Resh, 1993). Continuousexposure to the localized condition presents an historical view of a stream’s quality. As aresult, monitoring stream biology can also serve as an early warning system todeteriorating stream health. Conversely, macroinvertebrates can be used to monitorstream improvement as it occurs over the longer time period.
Objectives for this project were to:• provide a demonstration of the practical application of biological assessment
techniques in an urbanizing basin,• provide a baseline for determining trends in the basin,• determine the availability of food organisms for salmon over a range of land uses,• investigate the association between biological measures and known water quality
problems,• gather information that can be used in convincing public officials of the need for
action, and• gather diagnostic information that can be used in identifying and solving problems.
Page 2
Methods
Description of Study Area
Quilceda Creek and Allen Creek are small drainages that discharge near the mouth of theSnohomish River Basin (Figure 1). Their combined drainage area is about 44 square milesin Marysville, Arlington, and the Tulalip Indian Reservation. Originally, about two-thirdsof the watershed area was upland forest. About one-third of the area was wetland,primarily marsh and swamp in the Marysville Trough lowlands and the large estuarinemarsh at the mouth of Quilceda Creek. Smaller forested wetlands occurred at theheadwaters and within the ravines of Quilceda and Allen Creeks.
Early development by Europeans involved ditching and draining the lowlands foragriculture. Suburban and urban development followed more recently. In the process,about 75 to 85 percent of the watershed's wetlands have been drained and filled(Carroll, 1998).
Wetland loss combined with increased impervious surfaces result in rapid stormwaterrunoff and increased flash flooding. These storm flows often carry a high sediment loadfrom land-clearing activities and can cause permanent alterations in physical habitatcharacteristics of the stream. Impervious surfaces also reduce groundwater recharge,resulting in lower summer flows. This affect can be significant, since during dry weathergroundwater contributes between 46 and 60 percent of the combined flow of the Main-stem and Middle Fork Quilceda Creek (Larson and Marti, 1996). In addition,development often encroaches directly on riparian corridors, altering stream banks andremoving vegetation. Removing streamside vegetation eliminates the shading that helpskeep water temperatures cool, reduces food (e.g., leaves and terrestrial insects) for aquaticorganisms, and removes a source of large woody debris that provides habitat structure.
Sampling Sites
Sites that were sampled for benthic macroinvertebrates in the Quilceda Creek andAllen Creek drainages are shown in Figure 1. The site number, name, and reason formonitoring are listed in Table 1.

Page 3
Figure 1. Biological Assessment Sites for the Quilceda/Allen Watershed.

Page 4
Table 1. Sites selected for biological monitoring in the Quilceda/Allen Project.
Site # Stream Name Location Land Use
44H Quilceda Creek 51st Ave. NE suburban landscaping44N Quilceda Creek Route 9, Quilceda (forest buffer) reference site49B Quilceda Creek Dirt Bike Area dirt bikes, upstream agriculture58B M.F. Quilceda Creek Meadow Creek subdivision stream rehabilitation, development58F M.F. Quilceda Creek Wade Road (buffer) logged, upstream gravel mining60D Edgecomb Creek Edgecomb Creek (forest buffer) culvert erosion, runoff68I Allen Creek Cedarcrest Middle School upstream agriculture, construction73B Munson Creek 67th Ave. NE development73C Munson Creek Golf Course dam, golf course73D Munson Creek 76th Ave. NE new development
Field Sampling
Environmental Variables
A standard set of variables was measured at each stream site. Table 2 lists variablesmeasured and the scale of measurement (reach and site-specific). Organization of thevariables at each scale was similar to those of Carteret al. (1996). The field forms used torecord measurements at each stream are in Appendix A.
Table 2. Physical and chemical variables measured at each stream and their scale ofmeasurement (reach and site-specific).
Scale of Measurement
Reach Site-specific
Gradient DepthFlow % Cobble
Wetted Width % Coarse GravelBankfull Width Current Velocity
Water Temperature % Canopy CoverDissolved Oxygen
ConductivitypH

Page 5
Stream Habitat
Stream reaches contain two easily identified and contrasting habitats: riffles (brokensurface water) and pools (slow-moving or eddying water). The primary reason forsurveying these two habitats was to measure habitat-specific signals from stressedinvertebrate communities.
Multiple samples were collected at each stream site. Four biological samples werecollected in riffle habitat and four samples were collected in pool habitat. First, collectionlocations in riffle habitat were selected based on the following criteria:
• depth of riffle,• substrate size, and• location within a riffle area of the stream (forward, middle, back).
Sampling among several riffles in a stream increased representation of physical differencesin this habitat. Also, the sampling design was expected to generate a larger number ofbenthic macroinvertebrate taxa from a reach. Variations in physical condition of the rifflehabitat provided an opportunity to collect both common and rare taxa.
Benthic macroinvertebrates were collected at four locations in pool habitat. The locationswithin a reach were determined by finding representative combinations of the followingvariables:
• depth of pool, and• location within the channel (side, middle, behind a boulder/woody debris).
Absence of flowing water in pool habitat resulted in low sampler efficiency. Most streambottom samplers rely on flowing water to direct macroinvertebrates into a collection net.In the absence of flowing water, loss of individual organisms increased. Benthicorganisms collected from pools provided reliable synoptic lists of taxa, but not communitycharacterizations dependent on density estimates.
Habitat-Specific Degradation
Separate riffle and pool samples were collected at all sites. Riffle and pool invertebrateassemblages were compared in order to identify: (1) differences based on habitat type,(2) stream conditions under which differences occur, and (3) whether identification of adifference between habitats is useful information.

Page 6
Sampling Stream Macroinvertebrates
Stream benthic macroinvertebrates were sampled from reach lengths forty times theaverage width. Macroinvertebrate samples were collected from riffle and pool habitatswith a D-Frame kicknet (sampling area=2.0 ft2). A device fastened to the base of theD-Frame kicknet enclosed a one-foot by two-foot area in front of the sampler. Thesubstrate in the enclosed area was removed and scrubbed with a brush to dislodgeinvertebrates into the collection net. Samples from each habitat type were stored inethanol-filled containers.
Macroinvertebrate samples from most sites were composited into a single riffle sample anda single pool sample. As part of the data quality objectives, approximately 10 percent oftotal sites monitored in a year were included as part of an evaluation of communityvariability within a stream reach. Replicate samples were stored in separate containers ateach of these streams. A detailed description of the stream survey protocols can be foundin Plotnikoff (1994).
Laboratory Sample Analysis
Macroinvertebrate samples were sorted and identified by an independent laboratory(Wisseman, 1998). Samples were either sorted whole or, in the case of large sedimentvolumes, sub-sampled so that only a fraction of the original was analyzed. Most of themacroinvertebrates were identified to genus, including the Chironomidae, and a few tospecies where the taxonomy was well known.
Quality assurance procedures included: 1) re-sorting of individual samples that requiredsub-sampling, and 2) re-identification of these same samples. A fraction (10 percent) ofthe total number of project samples were subjected to these quality assurance procedures.Taxonomic literature used to identify the macroinvertebrates included peer-reviewed andpublished documents.
Macroinvertebrate Data Analysis
Site Condition and Ranking
The benthic macroinvertebrate data was used to calculate several biometrics. Biometricsare expressions of structural or functional community characteristics. An example of astructural characteristic would be “species richness” where the biometric is calculatedfrom a simple count. The functional characteristics (e.g., percent predators) describe thefeeding behavior or activity of the macroinvertebrate species.
Ranking of site biological condition was based on the Karr and Chu’s (1997) BenthicIndex of Biological Integrity (B-IBI). We used nine of the suggested biometrics to

Page 7
construct a B-IBI value for each habitat type (pool and riffle) at a site. The biometricsused in calculating the index value are in Table 3.
Table 3. Biometrics used to construct the Benthic Index of Biotic Integrity (B-IBI).
Metric Response to Scoring BoundariesDegradation 1 3 5
Total number of taxa Decrease <10 10-20 >20Number of Ephemeroptera taxa Decrease <3 3-5.5 >5.5Number of Plecoptera taxa Decrease <3 3-5.5 >5.5Number of Trichoptera taxa Decrease <2 2-4.5 >4.5Number of long-lived taxa Decrease <0.5 0.5-2 >2Number of intolerant taxa Decrease <0.5 0.5-2 >2% of individuals in tolerant taxa Increase >50 20-50 <20% of predator individuals Decrease <5 5-10 >10% dominance (2 or 3 taxa) Increase >75 50-75 <50
A high B-IBI score indicates a healthy stream condition and a lower score indicates thepresence of stream degradation. The possible range of B-IBI scores are nine throughforty-five.
Sources of Stream Degradation
Changes in a stream’s physical or chemical characteristics are often reflected in thebiological communities. Macroinvertebrates are heavily influenced by factors that effecttheir food source, substrate (living space), water temperature, and current velocity(Hynes 1970). Individual biometrics are sensitive to changes in these factors and respondto degradation of stream resources.
We examined each biometric and how site condition was ranked by the individualbiometric. The physical or chemical changes that would prompt a biological signal werecompared with the biometric sensitive to that change. Biometric response to specificstream degradation type is listed in Table 4. These biological/degradation sourceassociations are general guidelines for explaining community condition at each samplingsite.

Page 8
Table 4. Biometrics and the type of degradation reflected from a response to physical orchemical changes in a stream reach.
Biometric Type of Degradation
Total number of taxa loss of living space (e.g., sediment deposition)Number of Ephemeroptera taxa increase in surface water temperatureNumber of Plecoptera taxa increase in surface water temperatureNumber of Trichoptera taxa loss in deposited organic material or increase in algae growthNumber of long-lived taxa loss or decline in continuous supply of cool waterNumber of intolerant taxa a change in the chemical or physical characteristics of a stream% of individuals in tolerant taxa a change in the chemical or physical characteristics of a stream% of predator individuals loss of living space and change in flow dynamics% dominance (2 or 3 taxa) response to severe physical or chemical impacts to a stream
Biometrics are analyzed individually by first selecting calibration sites. The calibrationsites should represent unimpaired stream locations and also visually impaired locations.A biometric is effective in identifying stream degradation when it responds to cleardifferences in stream quality. Once each biometric is tested from a set of data, thepresence of degraded stream reaches and source of degradation can be determined.
Macroinvertebrates and Salmon Habitat
Benthic macroinvertebrates reflect stream qualities such as: physical characteristics,chemical characteristics, and severity of the most recent physical disturbance. Likewise,anadromous fish species have a preference for stream conditions that are, in part,determined by their living requirements at individual life stages. Those physical andchemical characteristics of streams that are optimal for macroinvertebrate communities canbe related to optimal conditions for life stages and species of salmon.
Macroinvertebrate communities that were considered in good condition were compared toreported stream reach use by salmon (Carroll and Smith, 1999). The relationship betweenmacroinvertebrate community condition and salmon use was used as a benchmark.Streams that had poor community conditions were further examined for physical orchemical differences that could explain why they did not meet expectations for theirdesignated salmon use.

Page 9
Results
Site Condition and Ranking
Benthic macroinvertebrate community scores (i.e., Benthic Index of Biotic Integrity) werehighest at the forested sites in the Quilceda/Allen drainage (Edgecomb Creek-60D, MiddleFork Quilceda Creek-58F, and Quilceda Creek-44N). Stream habitat such as pools andriffles had poor benthic community conditions in reaches below a golf course and majorsuburban development. The Benthic Index range was greater for riffle communities thanin pool communities (Figure 2).
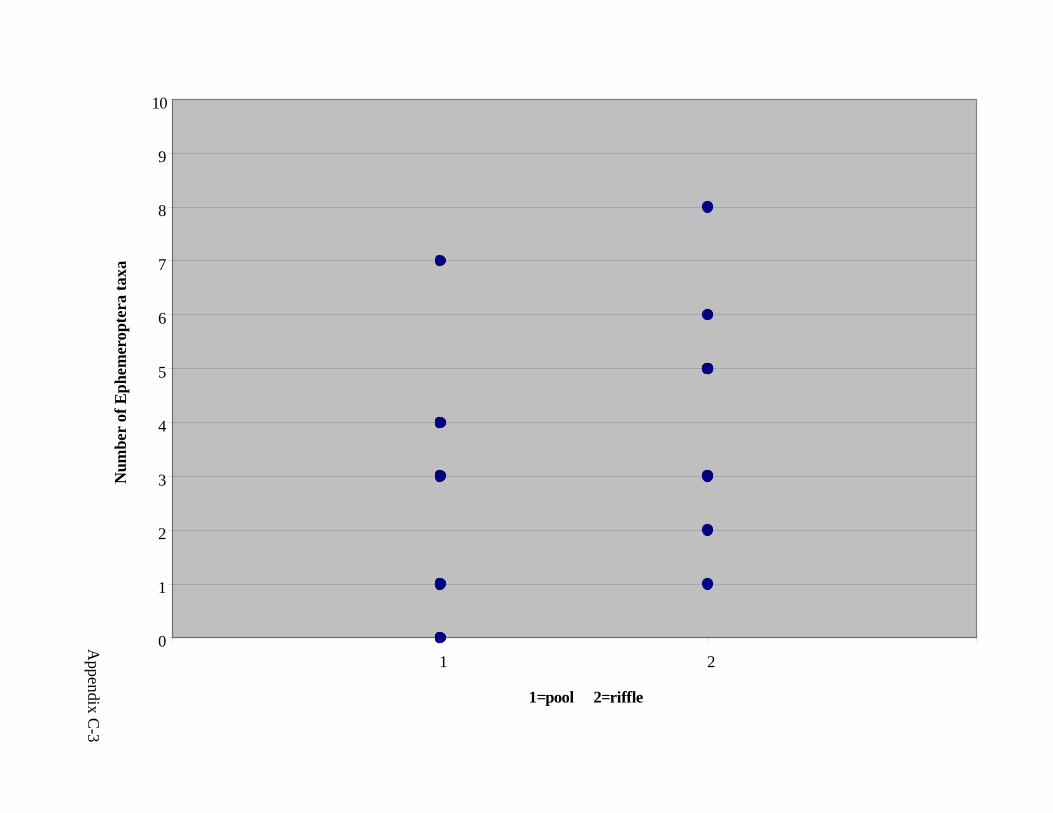
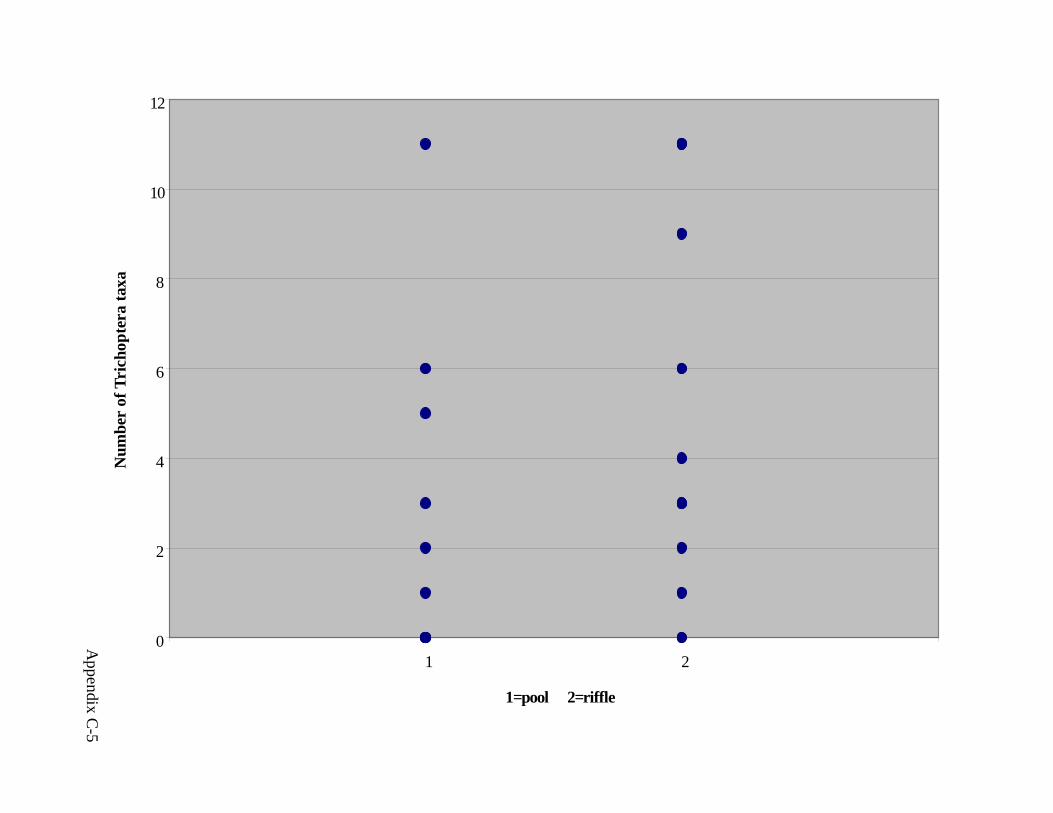
The numeric ranges for seven of the individual metrics were similar in riffle and poolhabitat (Appendix C). Species found in riffle habitat were different from those found inpool habitat even though metric ranges were similar in both. The “number of Plecoptera”was greater in riffles and the “percent of individuals in tolerant taxa” was greater in pools.
Sources of Stream Degradation
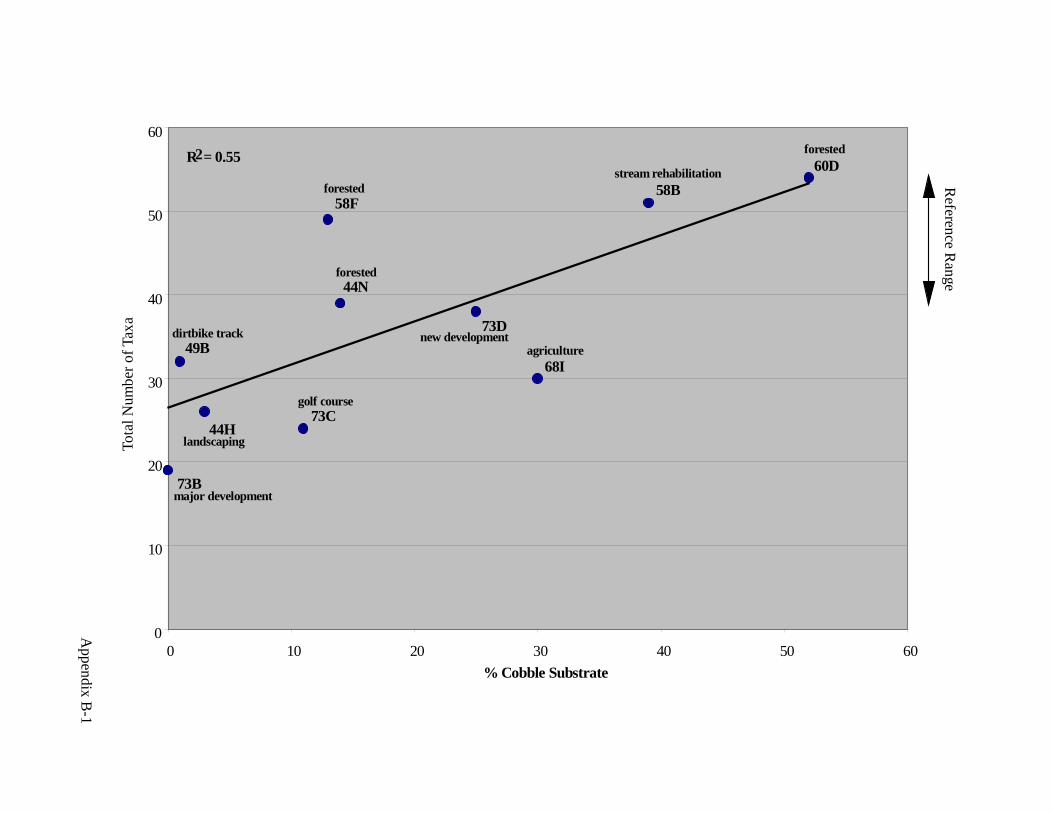
The total number of taxa at each stream site was influenced by quantity of cobble substrate(Appendix B-1). Percentage of coarse gravel substrate did not have as strong an influenceon providing living space for more taxa (Appendix B-2).
9
15
21
27
33
39
45
1 2
1=pool 2=riffle
Ben
thic
Inde
xof
Bio
ticIn
tegr
ityS
core
erosion, runoff (forested)
reference site (forested)
reference site (forested)
agriculturenew developmentsuburban landscapingstream rehabilitation
golf course
majordevelopment
non
poi
nt-
fore
stre
sour
ceu
sen
onpo
int-
subu
rban
dev
elop
men
t&ag
ricu
lture
Pollution Source
erosion, runoff (forested)
new development
golf course
stream rehabilitation
upstream agriculture
suburban landscaping
major development
upstream agriculturedirtbike track
60D
60D
58F
58F
44N
73D
73C
68I
68I58B
58B44H
44H
73B
73B
49B
49B
44N
73C
73D
Figure 2. Benthic Index of Biotic Integrity scores for sites in the Quilceda/Allen drainage and theland uses associated with each site.
reference site (forested)
reference site (forested)
agriculture

Page 10
Plecoptera taxa, or stoneflies, had more representatives in the heavily canopied streamreaches (Appendix C). Of the stonefly taxa present at each site, more than 75 percentwere shredders (Appendix D). This functional feeding group processes fallen leaves instreams and begins the transfer of biomass downstream.
Intact riparian canopy (i.e., percent canopy shading) positively influenced the number ofmayfly (Ephemeroptera) species, caddisfly (Trichoptera) species, and percentage ofpredators in the benthic community (Appendix B-3, B-4, and B-5). Stream corridors thatwere protected by vegetation also had substrate types that promoted greater varieties ofspecies in each of these taxonomic groups. Streams with fewer species in riffle habitat hadless canopy shading and less cobble and coarse gravel substrate. Canopy shade over thestream corresponded with the number of intolerant taxa (Appendix B-6).
Surface water conductivity was low at reference sites Edgecomb Creek (60D), MiddleFork Quilceda Creek (58F), and Quilceda Creek (44N). Stream reaches adjacent to(Munson Creek, 73C) and below the golf course (Munson Creek, 73B) had the highestwater conductivities. Streams with the highest conductivities were also dominated bythree taxa (Appendix B-7). These taxa were considered tolerant to living in fine sedimentsor were filtering suspended organic particles from the water column (collector-filterers).Intolerant taxa were identified from stream reaches that had moderate- to low waterconductivities (Appendix B-8).
The diverse benthic communities at reference sites contained more of the intolerant taxaidentified in this drainage network. Stream conditions that favored higher numbers of taxaprovided important living space for benthic animals that were intolerant to physical changein the channel and corridor. In stream reaches where dominance of three taxa was high,diversity of the benthic community was lower. Stream channel changes and proliferationof tolerant benthic taxa pre-empted the naturally occurring species diversity.
Macroinvertebrates and Salmon Habitat
Stream reach use by salmon (Carroll and Smith, 1999) included spawning, rearing, and aseparate designation called resident (Figure 3). Coho salmon (Oncorhynchus kisutch)used streams for spawning and rearing with high riffle B-IBI scores (Benthic Index ofBiotic Integrity). Chum salmon (Oncorhynchus keta) used streams that were of moderatequality (mid-range B-IBI scores) for spawning. The poorest quality streams (low B-IBIscore) did not have coho salmon spawning or chum salmon using the reach. Residentcutthroat trout (Oncorhynchus clarki) were reported from all sites sampled for benthicmacroinvertebrates.
Relationships between physical conditions at stream reaches and the correspondingbiological condition were compared. Cobble and coarse gravel substrates were comparedwith the total number of taxa collected from a stream site (Figure 4 and Figure 5). The

Page 11
Figure 4. Threshold for minimum amount of cobble substrate in forested,reference streams of the Quilceda/Allen drainage.
9
15
21
27
33
39
45
1 21=pool 2=riffle
Ben
thic
Inde
xof
Bio
ticIn
tegr
ityS
core
60D Coho spawning; resident Cutthroat
58F Coho spawning/rearing; resident Cutthroat
44N Coho spawning; resident Cutthroat
68I, 73D,44H, 58B
Coho spawning/rearingresident CutthroatChum spawning
73C resident Cutthroat
49B Chum spawningresident CutthroatCoho rearing
73B resident Cutthroat
60D, 58F
44N
73D73C
68I, 58B
44H
73B, 49B
Refere nce
Ra nge
Figure 3. Reported stream reach use by salmon at sites in the Quilceda/Allen drainage.
R2= 0.55
0
10
20
30
40
50
60
0 10 20 30 40 50 60% Cobble Substrate
Tota
lNum
bero
fTa
xa
60D58B
58F
44N
73D
68I49B
44H73C
73B
Referen
ceR
ange
resident Cutthroat
resident Cutthroat
Coho spawning
Coho spawning
Coho spawning
(~13.5%)

Page 12
Figure 5. Threshold for minimum amount of coarse gravel substrate in forested, referencestreams of the Quilceda/Allen drainage.
Figure 6. Threshold for minimum amount of canopy shading at forested, referencestreams of the Quilceda/Allen drainage.
R2= 0.39
0
10
20
30
40
50
60
70
0 10 20 30 40 50 60 70 80 90 100% Coarse Gravel Substrate
Tota
lNum
ber
ofTa
xa
60D58B
58F
44N
73D
49B68I
44H
73B
73C
Reference
Range
(~32%)
Coho spawning
Coho spawning
Coho spawning
resident Cutthroat
resident Cutthroat
R2 = 0.71
0
1
2
3
4
5
6
7
8
9
0 10 20 30 40 50 60 70 80 90% Canopy Shading
Num
ber
ofE
phem
erop
tera
Taxa
60D
44H
73D
44N
58F
73B
49B
73C
68I
(w/o site 58B)
Reference
Range
(~70%)
Coho spawning
Coho spawning
Coho spawning
resident Cutthroat
resident Cutthroat

Page 13
amount of canopy shading was compared with the number of mayfly (Ephemeroptera)taxa collected at each site (Figure 6).
Reference condition thresholds were identified with the lowest quantified value for eachphysical variable at the following sites: 44N (Quilceda Creek), 58F (Middle Fork QuilcedaCreek), and 60D (Edgecomb Creek). Sites that had a larger quantity of cobble, coarsegravel, or canopy shading were considered to be in better condition. Proportion of cobblesubstrate that identified a reference condition was ~13.5 percent (Figure 4). Proportion ofcoarse gravel substrate that identified a reference condition was ~32 percent (Figure 5).Canopy shading was at least 70 percent to qualify as a reference condition (Figure 6).
Biological Properties of Benthic Communities
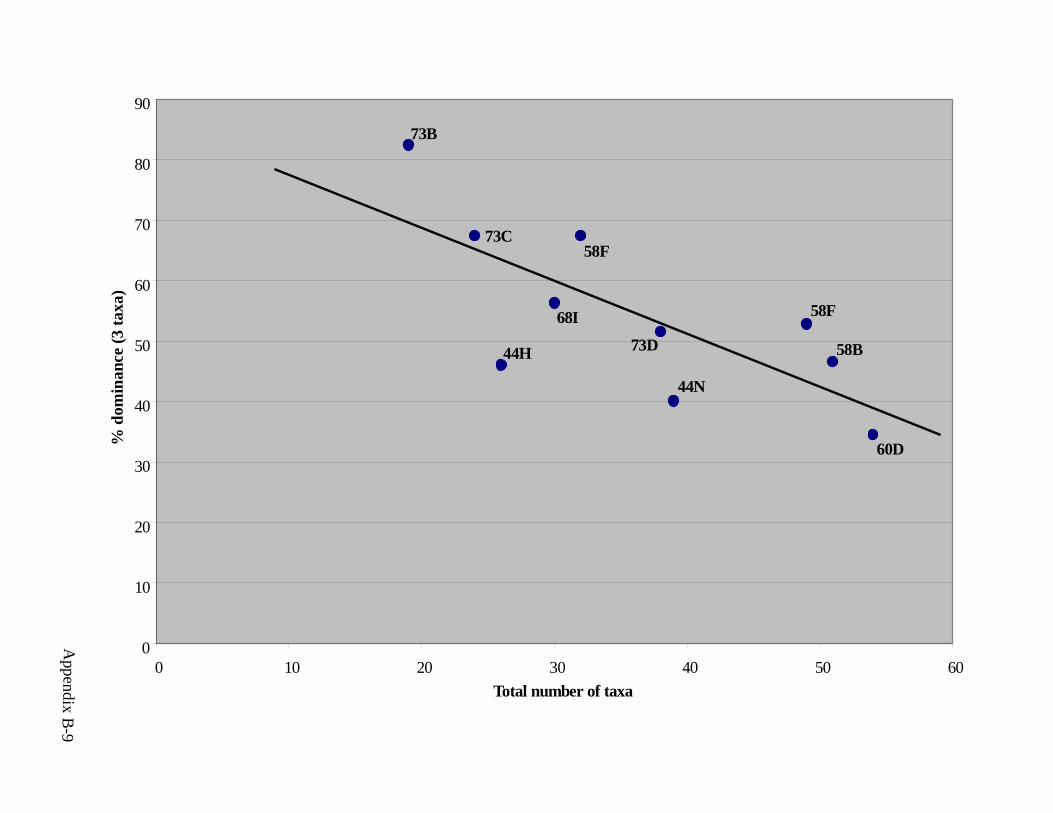
Certain properties of biological communities can be used to indicate stream quality. Thecomparison between total number of taxa occurring at a site and the dominance of thethree best-represented taxa, indicates the diversity and variety of available living resources.An inverse relationship between total number of taxa and dominance was identified(Appendix B-9). The number of intolerant taxa increased with the greater number of taxacollected from a site (Appendix B-10). The diversity of taxa at a site was related to thenumber of specialist taxa or those that are considered sensitive to environmental impacts.

Page 14
Discussion
Site Condition and Ranking
Benthic communities were best in undisturbed stream reaches of the Quilceda/Allendrainage. Biological condition of stream reaches is partly determined by intensity andquantity of local and upper watershed disturbance. Areas sampled that had moderate orno visible streamside activity scored highest in biological condition. These sites werecompared against the moderate- and low-scoring sites for type of known surrounding landuses.
Sites where benthic communities indicated moderate-impairment were land usesestablished several years prior to the survey. At least partial riparian corridors were intactand land use was not directly adjacent the stream. The worst biological condition in astream occurred where major development of the landscape reached the streamside.Watershed areas that suffered continuous soil disturbance (e.g., dirt bike track and majordevelopment) reflected the degradation to the stream through the benthic community.
More Plecoptera or “stoneflies” were found in riffles than in pools at reference sites in theQuilceda/Allen drainage. Stoneflies prefer cold water and a high diversity of substratetypes as a living space. The greater variety at three sites suggest stream reaches that havenot been degraded from surrounding activities that cause water temperature increases ordeposition of fine materials in riffles.
Pool habitat is a place commonly associated with deposition of fine materials and,consequently, substrate that is suitable for burrowing. Pool habitat at four sites had moretaxa than in riffles. Moderate streamside activity was associated with the biologically richpool habitat. As is often the case, moderate disturbance of the physical habitat opens newliving space (Townsendet al. 1997). Animals that do well in a changing environment tendto be tolerant to degradation and can quickly colonize available habitat.
Sources of Stream Degradation
Available living space is an important determining factor of richness in a macroinvertebratecommunity. Size of substrate material on stream bottoms in the Quilceda/Allen drainagethat had more cobble generally supported a greater variety of taxa. Interstitial spaces(spaces between the rocks) are filled with particles of other size classes and organic food(detritus) sources (Minshall 1984; Minshall and Minshall 1977). Reference streams in thisdrainage had intact riparian zones that were a potential food source for thesemacroinvertebrates. Additionally, larger substrate particles tend to protectmacroinvertebrates from the effects of floods by: 1) providing refuge from swift currents,and 2) resisting movement with the higher current velocities (Allan 1995).

Page 15
Stoneflies were present in greater varieties at the healthy stream sites. The majority ofthese taxa were functionally classified as shredders (consume leaves, sticks, and twigs).Taxa such as stonefly shredders serve an important and sometimes dominant role incanopied streams (Cumminset al. 1989). Their reduction or disappearance from streamreaches resulted from inadequate or absent streamside vegetation. The same observationswere made by Wallaceet al. (1997) where significant decreases in abundance and biomassof shredders were measured when leaf litter was excluded from stream reaches.
Canopy shading of the stream was an integral characteristic of the reference reaches.Streamside vegetation appeared to maintain normal function of ecosystem characteristicsin the Quilceda/Allen drainage. Streams without vegetation cover had a lower percentageof coarse substrate, greater quantities of conductive fine inorganic material reaching thestream, and a low macroinvertebrate diversity. Quantity of streamside vegetation is animportant characteristic for maintaining biological integrity of the macroinvertebratecommunity in the drainage.
Surface water conductivity was high at stream reaches with moderate- to heavy streamsideactivity. Mayet al. (1997) identified a strong direct relationship between baseflowconductivity and amount of urbanized area in a watershed. Fine soil and otherconstituents that are washed into the stream during rain events and through groundwatercan elevate water conductivity. Stream reaches below a golf course (73C) and majordevelopment (73B) had the highest conductivity. This resulted in a few tolerant taxadominating the macroinvertebrate community.
Macroinvertebrates and Salmon Habitat
Coho salmon (Oncorhynchus kisutch) spawning and rearing (Carroll and Smith, 1999)occurred at the highest quality forested sites in the Quilceda/Allen drainage (60D, 58F,44N). Healthy macroinvertebrate communities in near-natural conditions were collectedfrom stream reaches that had both spawning and rearing coho salmon. Environmentalneeds of benthic macroinvertebrates were directly related to those of the coho salmon.
The physical condition of high quality salmon stream reaches was characterized by threevariables: proportion of cobble, proportion of coarse gravel, and canopy shading.Characteristics of the macroinvertebrate community were related to these variables so thatlimiting physical factors could be identified. The thresholds foreach variable outlined theminimum requirements that would maintain natural biological conditions in each stream.
The low quantity of coarse gravel at Allen Creek (68I) may have resulted from theupstream agriculture identified along this reach. This site had a proportion of cobblecomparable to the reference conditions. Dominant substrate types were cobble and finesediment. Sediment transport from agricultural activities upstream may have been onesource of suspended sediment. Munson Creek (73C) had a lower proportion of cobbleand lacked adequate shading. This combination of physical conditions may be a result oflong-term degradation from activity at the nearby golf course.

Page 16
Other investigations of Puget Sound, Washington streams have identified a B-IBIthreshold for “natural” streams (Mayet al. 1997). A natural stream has an impervioussurface area in a watershed of less than five percent. Coho salmon spawning and rearingactivity in these streams was present where B-IBI scores were 33 and higher.
Coho salmon activity was diminished or had disappeared in the Quilceda/Allen drainagestreams with scores less than a B-IBI score of 33. Typically, in Puget Sound streams,coho outnumber the cutthroat trout under natural conditions (Lucchetti andFuerstenberg 1993). Resident cutthroat trout used all of the stream reaches visited by thissurvey, but were more abundant than coho salmon at the most degraded sites (Carroll andSmith, 1999).
Biological Properties of Benthic Communities
Reference sites that had high numbers of taxa also had lower dominance of individual taxa.Biota in stressed ecosystems are usually dominated by a few tolerant taxa, but lose theintolerant or “specialist” taxa. This inverse relationship between total number of taxa anddominance of the community by few species was found among sites in the Quilceda/Allendrainage. Major development of the landscape near streams substantially affectedbiological conditions. Examining dominance of future macroinvertebrate collections fromthe Quilceda/Allen drainage will be a good indicator of stream degradation.
Periodically, species-rich communities contain many examples of individuals that areintolerant to changes in the ecosystem. Although there were deviations from a directrelationship between number of taxa and intolerant taxa, the expectation for healthybiological conditions would be that diverse communities contain “specialist” species.Living requirements are usually modified by a stream’s resistance to flooding and drought.The appearance of macroinvertebrate specialist taxa indicates a complex, stable habitatcondition and abundant food resources.

Page 17
Conclusions
• The best macroinvertebrate community conditions occurred in stream reaches wherethe riparian corridor was visually intact. Even with some impacts associated withsurrounding land uses such as road runoff, culvert erosion, and/or upstream logging anintact forested riparian buffer can preserve a relatively healthy macroinvertebratecommunity.
• Stream biota were most affected by land uses that visually reached the wetted portionof the channel. The physical disposition of the activity acted as a linkage for pollutantsto reach the stream.
• Key characteristics for good sites were presence of: 1) cobble substrate, 2) coarsegravel substrate, and 3) canopy shading. All of these conditions were present beyonda minimum threshold at two sites that had been logged and showed signs of erosionfrom culverts. These sites were considered as references following analysis of thebiological information.
• Three categories of biological condition were described: 1) high quality (minimalimpact to key physical characteristics of the stream corridor), 2) moderate quality(diminished macroinvertebrate species richness and signs of long-term affects fromnearby land uses), and 3) low quality (poor biological conditions and obvious visualconnections between stream and source of pollution).
• Coho salmon activity diminished in streams whose B-IBI scores were 33 and lower.Degraded stream reaches were used by resident cutthroat and not by salmon.
• Analysis of the macroinvertebrate community provides a consistent evaluation ofaquatic resources that accurately reflects land use impacts on the aquatic ecosystem.

Page 18
Acknowledgements
We would like to thank Kathy Thornburgh, Rick Huey, Janet Carroll, Maureen MeehanMartin, and Steve Barrett for field assistance. Kathy Thornburgh and Janet Carrollprovided valuable site descriptions and salmon use information. Michelle Ideker preparedthe final version of this report.
Page 19
References
Allan, J.D. 1995. Stream Ecology: the structure and function of running waters.Chapman and Hall, New York. 388 pp.
Carroll, J. 1998. Draft Quilceda/Allen Watershed Management Plan. Snohomish CountyPublic Works, Surface Water Management, Everett, WA. 179 pp. + appendices.
Carroll, J. and D. Smith. 1999. Anecdotal information, personal communication.
Carter, J.L, S.V. Fend, and S.S. Kennelly. 1996. The relationships among three habitatscales and stream benthic community structure. Freshwater Biology 35: 109-124.
Cummins, K.W., M.A. Wilzbach, D.M. Gates, J.B. Perry, and W.B. Taliaferro.1989.Shredders and riparian vegetation. Bioscience 39(1): 24-30.
Hynes, H.B.N. 1970. The Ecology of Running Waters. Liverpool University Press,Liverpool, Great Britain. 555 pp.
Karr, J.R. and E.W. Chu. 1997. Biological Monitoring and Assessment: usingmultimetric indexes effectively. EPA 235-R97-001. University of Washington,Seattle. 149 pp.
Larson, A.G. and P.B. Marti. 1996 Relationship Between Groundwater and SurfaceWater in the Quilceda Creek Watershed. Publication No. 96-333. WashingtonDepartment of Ecology, , Olympia, WA. 33 pp.
Lucchetti, G. and R. Fuerstenberg. 1993. Relative fish use in urban and non-urbanstreams. Proceedings of the Conference on Wild Salmon. Vancouver, B.C.
May, C.W., E.B. Welch, R.R. Horner, J.R. Karr, and B.W. Mar. 1997. Quality Indicesfor Urbanization Effects in Puget Sound Lowland Streams. University of Washington,Seattle. 229 pp.
Minshal, G.W. 1984. Aquatic insect-substratum relationships.in Resh, V.H. and D.M.Rosenberg (eds.) The Ecology of Aquatic Insects. Praeger Publishers, New York.pp. 358-400.
Minshall, G.W. and J.N. Minshall. 1977. Microdistribution of benthic invertebrates in aRocky Mountain (U.S.A.) stream. Hydrobiologia 55(3): 231-249.
Plotnikoff, R.W. 1994. Instream Biological Assessment Monitoring Protocols: BenthicMacroinvertebrates. Publication No. 94-113. Washington State Department ofEcology, Olympia, WA. 27 p.

Page 20
Rosenberg, D.M. and V.H. Resh. 1993. Introduction to freshwater biomonitoring andbenthic macroinvertebrates.in Rosenberg, D.M. and V.H. Resh (eds.) FreshwaterBiomonitoring and Benthic Macroinvertebrates. Chapman and Hall, New York.pp. 1-9.
Townsend, C.R., M.R. Scarsbrook, and S. Doledec. 1997. The intermediate disturbancehypothesis, refugia, and biodiversity in streams. Limnology and Oceanography42(5): 938-949.
Wallace, J.B., S.L. Eggert, J.L. Meyer, and J.R. Webster. 1997. Multiple trophic levelsof a forest stream linked to terrestrial litter inputs. Science 277: 102-104.
Wisseman, R.W. 1998. Aquatic Biology Associates, Inc. Corvallis, Oregon.

Appendix A
Field Survey Forms

(BACK-OF-PAGE PLACEHOLDER FOR DUPLEX PRINTING)

Waterbody Name:
Location/Station :
Major Basin:
Dominant Land Use:
Date/Time:
Weather:
Latitude/Longitude:
Investigators:
SURFACE WATER INFORMATION
Parameters Measurement (Qualifiers)
Temperature
pH Calibration or Calibration Check:
Conductivity
Dissolved Oxygen Bottle no. mL of titrant Correction factor
Sample Time:
Qualitative Observations
Water Clarity
Water Odors
Sediment Odors
Surface Films
Field Notes:
Photograph:
Photograph:

STREAM REACH PROFILETransect Wetted Width Bankfull Width Maximum Depth Residual Pool Depth (Dp-Dc RPD) Stream Gradient
(riffles) (riffles) (riffles) Dp Dc RPD (Clinometer)
Riffle 1
Riffle 2
Riffle 3
Riffle 4
STREAM DISCHARGEObservation Width Depth Velocity Flag Comments
(Circle units) ( m or ft ) ( m or ft ) ( m/s or ft /s)
1
2
3
4
5
6
7
8
9
10
11
12
13
14
15
16
17
18
19
20
Residual Pool Depth: Dp maximum depth of pool, Dc depth at pool crest (or tailout), RPD residual pool depth

SUBSTRATE MEASUREMENTS CANOPY COVER MEASUREMENTSSubstrate Parameter Riffle 1 Riffle 2 DENSIOMETER (count open intersections)
Depth (m) Direction Riffle 1 Riffle 2 Riffle 3 Riffle 4
Size Class ( Center (up) Bedrock (smooth) Center
(d ) Bedrock (rough) Center (left) Boulder (250-4000 mm) Center
( i h ) Cobble (64-250 mm) Left Bank Coarse Gravel (16-64 mm) Right Bank Fine Gravel (2-16 mm)
Sand (0.06-2 mm) HUMAN INFLUENCE Silt/Clay/Muck (not gritty) O = not present Wood (any size) B = on bank Other (comment) C = within 10m
P = > 10m
SUBSTRATE MEASUREMENTS Disturbance Left Bank Right BankSubstrate Parameter Riffle 3 Riffle 4 Dike/Riprap
Depth (m) Buildings
Size Class ()
Pavement
Bedrock (smooth) Road/Railroad
Bedrock (rough) Pipes (inlet/outlet)
Boulder (250-4000 mm) Landfill/Trash
Cobble (64-250 mm) Park/Lawn
Coarse Gravel (16-64 mm) Row Crops
Fine Gravel (2-16 mm) Pasture/Range
Sand (0.06-2 mm) Logging Operations
Silt/Clay/Muck (not gritty)
Wood (any size) Substrate measurements are made with a 60 cm diameter hoop
Other (comment) and at least 50 observations within the sample area.
Comments:

Stream Cross-Section Profile Current VelocityObservatio Width Riffle 1 Riffle 2 Riffle 3 Riffle 4 (m/sec or ft/sec)
No. (m or ft) Transect Velocity1 Riffle 12 Riffle 23 Riffle 34 Riffle 45678910111213141516171819202122232425262728293031323334353637383940(vertical, equidistant measurements from bankful horizontal line to stream bottom)

Qualitative Habitat Assessment Survey – Visual AnalysisRiffle/Run Prevalence
Site Name: Site No.: Date: Evaluator Initial:
Habitat Parameter Optimal Sub-Optimal Marginal Poor
1. Substrate-Percent Fines(fraction < 6.35mm)
< 10%(16-20)
10 –20%(11-15)
20 – 50%(6-10)
> 50%(0-5)
2. Instream Cover (cobble gravel,large woody debris, undercutbanks, macrophytes)
> 50%
(16-20)
30 –50%
(11-15)
10 –30%
(6-10)
< 10%
(0-5)
3. Embeddedness (Riffle)(gravel,cobble, boulder particles)
0 – 25%(16-20)
25 50%(11-15)
50 – 75%(6-10)
> 75%(0-5)
4. Velocity/Depth All habitats:i)slow/deepii)slow/shallowiii)fast/deepiv)fast/shallow
(16-20)
3 of 4
(11-15)
2 of 4
(6-10)
1 of 4
(0-5)
5. Channel Shape Trapezoidal
(11-15)
Rectangular
(6-10)
Inversetrapezoidal(0-5)
6. Pool/Riffle Ratio (distancebetween riffles/stream width)
5 – 7(frequent sequence)(12-15)
7 – 15(less frequent)(8-11)
15 – 25(infrequent riffle)(4-7)
> 25(homogeneous)(0-3)
7. Width to Depth Ratio (wettedwidth/depth)
< 7(12-15)
8 – 15(8-11)
15 – 25(4-7)
> 25(0-3)
8. Bank Vegetation (streambankcoverage)
> 90%(9-10)
70 – 89%(6-8)
50 – 79%(3-5)
< 50%(0-2)
9. Lower Bank Stability(evidence of erosion)
Stable(9-10)
Little Erosion(6-8)
Mod. Erosion(3-5)
Unstable(0-2)
10. Disruptive Pressures (evidenceof vegetation disruption onstreambanks)
Minimal(all remains)(9-10)
Evident(60-90%)(6-8)
Obvious(30-60%)(3-5)
High(< 30%)(0-2)
11. Zone of Influence (width ofriparian zone)
≥ 4 x BFW(BFW = Bankfull Width)
(9-10)
≥ 2 & < 4
(6-8)
≥ 1 & < 2
(3-5)
Little or None
(0-2)
12. Successional Stage(forested sites only)
Old-growth
(9-10)
Young
(6-8)
Pole saplings
(3-5)
Seedlings/Clearcut(0-2)

(BACK-OF-PAGE PLACEHOLDER FOR DUPLEX PRINTING)

Appendix B
Biological Condition and Relationships to Land Use,Stream Reach Condition, and Salmon Use

(BACK-OF-PAGE PLACEHOLDER FOR DUPLEX PRINTING)
R2= 0.55
0
10
20
30
40
50
60
0 10 20 30 40 50 60
% Cobble Substrate
Tota
lNu
mb
ero
fTax
a
60D
58B58F
44N
Ap
pen
dix
B-1
73D
68I49B
44H73C
73B
Referen
ceR
ange
forested
forested
forested
major development
golf course
agriculturedirtbike track new development
landscaping
stream rehabilitation

R2= 0.39
0
10
20
30
40
50
60
70
0 10 20 30 40 50 60 70 80 90 100
% Coarse Gravel Substrate
Tota
lNum
bero
fTax
a
60D
58B
58F
44N
73D
49B
68I44H
73B
73C
Reference
Range
Appendix
B-2
forestedforested
forested
major development
golf courseagriculture
dirtbike tracknew development
landscaping
stream rehabilitation

R2= 0.71
0
1
2
3
4
5
6
7
8
9
0 10 20 30 40 50 60 70 80 90
%Canopy Shading
Num
ber
ofE
phem
erop
tera
Taxa 60D
44H
73D
44N
58F
73B
49B
73C
68I
(w/o site 58B)
Reference
Range
Appe
ndix
B-3
forested
forested
forested
major development
golf course
agriculture dirtbike track
new development
landscaping

R2= 0.55
0
2
4
6
8
10
12
0 10 20 30 40 50 60 70 80 90 100
% Canopy Shading
Num
ber
ofTr
icho
pter
aTa
xa
60D 58F
44N
73D
68I
73C 49B
44H
58B
73B
Re
fere
nce
Ra
nge
Appendix
B-4
forested
forested
forested
major development
golf course
agriculture
dirtbike track
new development
landscaping
stream rehabilitation

R2= 0.25
0
5
10
15
20
25
30
0 10 20 30 40 50 60 70 80 90
% Canopy Shading
%of
pred
ator
indi
vidu
als
(riff
les)
60D
58F
44N
68I
73D49B
44H
73C
73B
58B
Reference
Range
Appendix
B-5
forested
forested
forested
major development
golf course
agriculture
dirtbike tracknew development
landscaping
stream rehabilitation

R2= 0.41
0
1
2
3
4
5
0 10 20 30 40 50 60 70 80 90
% Canopy Shading
Num
ber
ofin
tole
rant
taxa
58F
(w/o site 60D)
73D
44N
44H49B68I73C
73B
58B
Referen
ceR
ange
Ap
pen
dix
B-6
forested
forested
major development
golf course dirtbike track
new development
landscapingstream rehabilitation agriculture

R2= 0.51
0
10
20
30
40
50
60
70
80
90
0 50 100 150 200 250 300 350 400 450 500
Surface Water Conductivity (umhos/cm)
%do
min
ance
(3ta
xa)
73B
73C49B
44H
68I
73D58F
58B
44N
60D
Reference
Range
Appendix
B-7
forested
forested
forested
major development
golf courseagriculture
dirtbike track
new development
landscaping
stream rehabilitation

R2= 0.42
0
1
2
3
4
5
6
7
8
9
10
0 50 100 150 200 250 300 350 400 450 500
Surface Water Conductivity (umhos/cm)
Num
ber
ofin
tole
rant
taxa
73B
73C
44H
44N
58F
60D
73D
58B49B68I
Re
fere
nce
Ran
ge
Appendix
B-8
forested
forested
forested
major development
golf courseagriculture
dirtbike track
new development
landscaping
stream rehabilitation
0
10
20
30
40
50
60
70
80
90
0 10 20 30 40 50 60
Total number of taxa
%do
min
ance
(3ta
xa)
73B
60D
58B
58F
44N
44H 73D
68I
73C58F
Appendix
B-9

0
1
2
3
4
5
6
7
8
9
0 10 20 30 40 50 60
Total number of taxa
Num
ber
ofin
tole
rant
taxa
58B
44N
58F
60D
73D
68I73C
44H 49B
73BApp
endixB
-10

Appendix C
Biological Conditions in Riffle and Pool Habitat

(BACK-OF-PAGE PLACEHOLDER FOR DUPLEX PRINTING)

9
15
21
27
33
39
45
1 2
1=pool 2=riffle
Ben
thic
Inde
xof
Bio
ticIn
tegr
ityS
core
Ap
pen
dixC
-1

0
10
20
30
40
50
60
1 2
1=pool 2=riffle
Tota
lnum
ber
ofta
xa
Appe
ndix
C-2
0
1
2
3
4
5
6
7
8
9
10
1 2
1=pool 2=riffle
Num
bero
fEph
emer
opte
rata
xa
App
en
dixC
-3

0
2
4
6
8
10
12
1 2
1=pool 2=riffle
Num
ber
ofP
leco
pter
ata
xa
Appendix
C-4
0
2
4
6
8
10
12
1 2
1=pool 2=riffle
Num
ber
ofTr
icho
pter
ata
xa
Ap
pe
ndix
C-5

0
1
2
3
4
5
6
7
1 2
1=pool 2=riffle
Num
ber
oflo
ng-li
ved
taxa
Ap
pe
ndix
C-6

0
1
2
3
4
5
6
7
8
9
10
1 2
1=pool 2=riffle
Num
bero
fint
oler
antt
axa
Ap
pen
dix
C-7

0
5
10
15
20
25
30
35
1 2
1=pool 2=riffle
%of
indi
vidu
als
into
lera
ntta
xa
App
endix
C-8

0
5
10
15
20
25
30
35
1 2
1=pool 2=riffle
%of
pred
ator
indi
vidu
als
Ap
pen
dixC
-9

0
10
20
30
40
50
60
70
80
90
100
1 2
1=pool 2=riffle
%do
min
ance
(3ta
xa)
Ap
pend
ixC
-10

Appendix D
Biometrics Data for Each Site

(BACK-OF-PAGE PLACEHOLDER FOR DUPLEX PRINTING)

Habitat Name Taxa # Eph_Taxa Ple_Taxa Tri_Taxa LL_Taxa Intol_Taxa %Tol_Taxa %Pred %Dom_3 B-IBI
riffle Allen Cr (68I) 30 3 4 4 2 1 0.81 11.11 56.36 33pool Allen Cr (68I) 46 3 2 2 0 1 23.73 7.24 43.44 25riffle Edgecomb Cr (60D) 54 6 9 11 5 8 2.62 25.27 34.55 45pool Edgecomb Cr (60D) 30 4 5 5 1 4 10.63 32.53 48.14 39riffle Munson Cr (73C) 24 3 0 3 3 1 1.66 0.66 67.45 29pool Munson Cr (73C) 29 4 0 1 1 2 13.41 7.68 67.94 27riffle Munson Cr (73B) 19 1 0 0 1 0 7.25 1.98 82.45 17pool Munson Cr (73B) 13 0 1 0 2 0 8.33 13.34 78.33 21riffle Munson Cr (73D) 38 5 5 6 2 2 2.68 5.91 51.61 33pool Munson Cr (73D) 39 3 0 3 6 2 19.94 3.98 66.29 29riffle Quilceda Cr (44H) 26 5 3 2 2 1 19.09 3.36 46.06 33pool Quilceda Cr (44H) 26 0 2 0 0 0 28.03 17.59 45.06 23riffle Quilceda Cr (44N) 39 5 6 9 2 2 6.18 17.35 40.15 39pool Quilceda Cr (44N) 45 1 3 6 2 1 8.57 11.97 53.2 33riffle M.F. Quilceda Cr (58B) 51 5 3 1 3 1 6.92 7.05 46.65 33pool M.F. Quilceda Cr (58B) 42 4 0 0 2 1 30.21 4.34 41.18 25riffle M.F. Quilceda Cr (58F) 49 8 10 11 4 4 0.08 18.74 52.89 43pool M.F. Quilceda Cr (58F) 46 7 5 11 3 2 1.73 26.58 67.48 39riffle Quilceda Cr (49B) 32 2 2 3 2 1 0.97 5.37 67.48 27pool Quilceda Cr (49B) 20 1 0 0 0 0 10.46 10.46 65.12 21
Abbreviations:
Taxa # - number of taxa at a siteEph_Taxa - number of mayfly (Ephemeroptera) taxaPle_Taxa - number of stonefly (Plecoptera) taxaTri_Taxa - number of caddisfly (Trichoptera) taxaLL_Taxa - number of long-lived taxaIntol_Taxa - number of intolerant taxa%Tol_Taxa - percent of tolerant taxa%Pred - percent of predator taxa%Dom_3 - percent of top three dominant taxaB-IBI (Benthic Index of Biotic Integrity)