Embed Size (px)
Citation preview

The relationship between sonority and glottalvibration
Megan L. Risdal, Ann Aly, Adam J. Chong,Pat Keating, Jesse Zymet
CUNY Phonology Forum — 2016 Sonority

Introduction & Background Our Study Results Summary Acknowledgments References
Introduction
I Sonority and the sonority hierarchy have been an importantbasis underlying explanations for various phonologicalphenomena (e.g., assimilation, phonotactics of syllablestructure).
Sonority & Glottal Vibration — CUNY 2016 January 19, 2016— Slide 2/32

Introduction & Background Our Study Results Summary Acknowledgments References
Phonetics of Sonority
Searching for a Physical Basis of Sonority
I How it manifests phonetically and how to quantify it iscurrently unresolved (Eduard, 1881; Heffner, 1950; Fletcher,1972; Parker, 2002).
I Some have suggested that sonority may be related to:I degree of constriction (e.g., Hankamer and Aissen, 1974)
I While others have related sonority to:I voicing (e.g., Nathan, 1989)
Sonority & Glottal Vibration — CUNY 2016 January 19, 2016— Slide 3/32
Introduction & Background Our Study Results Summary Acknowledgments References
Phonetics of Sonority
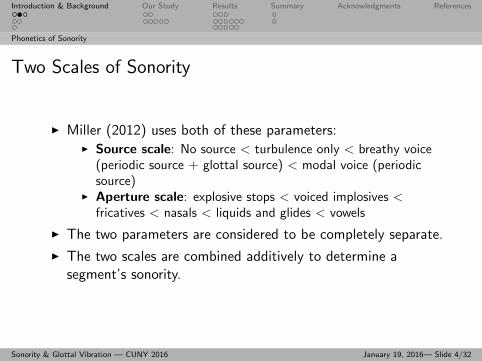
Two Scales of Sonority
I Miller (2012) uses both of these parameters:I Source scale: No source < turbulence only < breathy voice
(periodic source + glottal source) < modal voice (periodicsource)
I Aperture scale: explosive stops < voiced implosives <fricatives < nasals < liquids and glides < vowels
I The two parameters are considered to be completely separate.
I The two scales are combined additively to determine asegment’s sonority.
Sonority & Glottal Vibration — CUNY 2016 January 19, 2016— Slide 4/32

Introduction & Background Our Study Results Summary Acknowledgments References
Phonetics of Sonority
Phonetic Correlates of Sonority
I Parker (2002) also took into account both voicing and degreeof constriction in several of the phonetic correlates hemeasured (e.g. intensity, peak intraoral air pressure and peaktotal air flow) which depend simultaneously on both sourceand filter.
I Other measures, F1 and duration, depend only on the filter.
I He reports that intensity exhibits the strongest (positive)correlation with the sonority hierarchy and duration exhibitsthe least (see also Gordon, this conference).
Sonority & Glottal Vibration — CUNY 2016 January 19, 2016— Slide 5/32
Introduction & Background Our Study Results Summary Acknowledgments References
Glottal Source-Vocal Tract Interactions
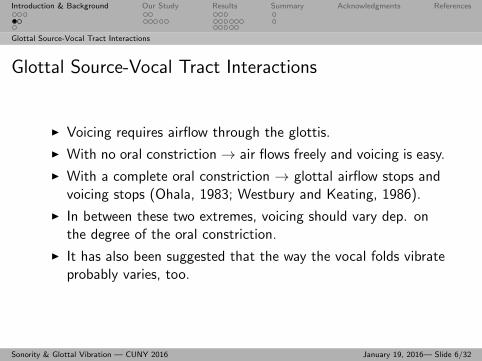
Glottal Source-Vocal Tract Interactions
I Voicing requires airflow through the glottis.
I With no oral constriction→ air flows freely and voicing is easy.
I With a complete oral constriction → glottal airflow stops andvoicing stops (Ohala, 1983; Westbury and Keating, 1986).
I In between these two extremes, voicing should vary dep. onthe degree of the oral constriction.
I It has also been suggested that the way the vocal folds vibrateprobably varies, too.
Sonority & Glottal Vibration — CUNY 2016 January 19, 2016— Slide 6/32
Introduction & Background Our Study Results Summary Acknowledgments References
Glottal Source-Vocal Tract Interactions
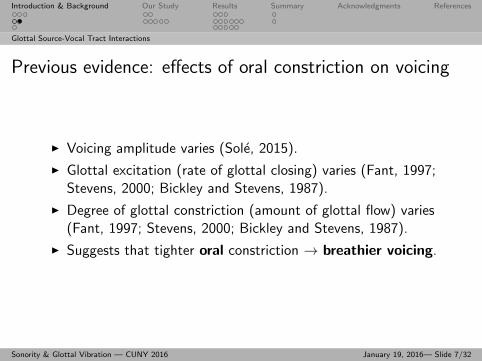
Previous evidence: effects of oral constriction on voicing
I Voicing amplitude varies (Sole, 2015).
I Glottal excitation (rate of glottal closing) varies (Fant, 1997;Stevens, 2000; Bickley and Stevens, 1987).
I Degree of glottal constriction (amount of glottal flow) varies(Fant, 1997; Stevens, 2000; Bickley and Stevens, 1987).
I Suggests that tighter oral constriction → breathier voicing.
Sonority & Glottal Vibration — CUNY 2016 January 19, 2016— Slide 7/32

Introduction & Background Our Study Results Summary Acknowledgments References
Mittal et al.
Mittal et al. (2014)
I Six geminate voiced consonants: [r, z, G, l, n, and N].
I Measured strength of glottal excitation ∆ψ:An acoustic measure of the relative amplitude of impulse-likeexcitation derived from the instant of significant excitation ofthe vocal-tract system during production of speech (Murtyand Yegnanarayana, 2008).
I Result: [z] < [r] < [n,N] < [G] < [l].
Sonority & Glottal Vibration — CUNY 2016 January 19, 2016— Slide 8/32

Our Study
Introduction & Background Our Study Results Summary Acknowledgments References
Our Study
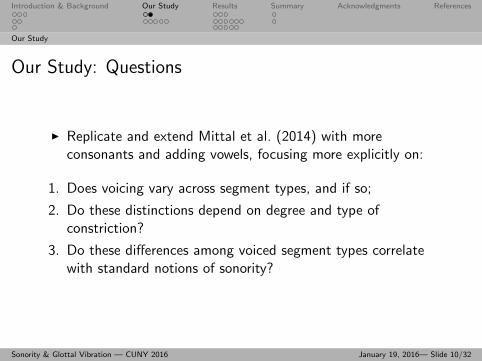
Our Study: Questions
I Replicate and extend Mittal et al. (2014) with moreconsonants and adding vowels, focusing more explicitly on:
1. Does voicing vary across segment types, and if so;
2. Do these distinctions depend on degree and type ofconstriction?
3. Do these differences among voiced segment types correlatewith standard notions of sonority?
Sonority & Glottal Vibration — CUNY 2016 January 19, 2016— Slide 10/32

Introduction & Background Our Study Results Summary Acknowledgments References
The Study Design
Segments (21 total)
I Including 5 of 6 segments from (Mittal et al., 2014). Weeliminated [N] because no difference between it and [n] wasreported.
Consonants
I Approximants: [j, w, l, ô]
I Trill & Tap: [r, R]
I Nasal: [n]
I Fricatives: [D, z, G, K]
I Affricates & Stop: [Ã, gG, d]
Vowels
I Front unround: [i, e, a]
I Front round: [y, ø]
I Back round: [o, u]
Sonority & Glottal Vibration — CUNY 2016 January 19, 2016— Slide 11/32

Introduction & Background Our Study Results Summary Acknowledgments References
The Study Design
Our Dependent Measures
I Acoustic signal: Strength of glottal Excitation (SoE), thesame dependent measure, ∆ψ, reported in Mittal et al.(2014).
I Electroglottography (EGG) signal: the Contact Quotient(CQH) as a measure associated with amount of vocal foldcontact during phonation.
Sonority & Glottal Vibration — CUNY 2016 January 19, 2016— Slide 12/32
Introduction & Background Our Study Results Summary Acknowledgments References
The Study Design
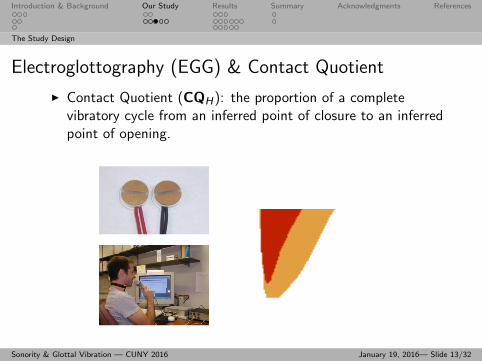
Electroglottography (EGG) & Contact Quotient
I Contact Quotient (CQH): the proportion of a completevibratory cycle from an inferred point of closure to an inferredpoint of opening.
Sonority & Glottal Vibration — CUNY 2016 January 19, 2016— Slide 13/32
Introduction & Background Our Study Results Summary Acknowledgments References
The Study Design
Participants & Procedure
I 13 participants (6 males and 7 females) contributed data forthe present study.
I All speakers were linguists trained in phonetics and fluentspeakers of English (8 native speakers of North AmericanEnglish).
I Participants produced consonants (3 reps [aCa]) and vowels (3reps [wV]) for a total possible 63 tokens per speaker or 819overall.
Sonority & Glottal Vibration — CUNY 2016 January 19, 2016— Slide 14/32

Introduction & Background Our Study Results Summary Acknowledgments References
The Study Design
Segmentation & Measurement
I Tokens were segmented using Praat TextGrids from onsetthrough voiced duration.
I Only fully-voiced portions of segments were analyzed.I The first voiced closure of the trill with at least 3 pulses was
segmented.I Affricates were treated as a voiced closure (stop) and a voiced
release (fricative) separately.I Stop releases were not included.
I Using VoiceSauce for SoE (Shue et al., 2011) and EggWorksfor CQH (Tehrani, 2012) software.
I Missing values and outliers were excluded leaving 744 tokensfor analysis. We report on speaker normalized values of CQH
and SoE.
Sonority & Glottal Vibration — CUNY 2016 January 19, 2016— Slide 15/32

Results & Analysis

Introduction & Background Our Study Results Summary Acknowledgments References
Descriptives & Analysis Method
Missing Tokens: Evidence for Voicing Difficulty
Figure: Segments eliminated due to lack of voicing. L −→ R =decreasing constriction degree.
Sonority & Glottal Vibration — CUNY 2016 January 19, 2016— Slide 17/32

Introduction & Background Our Study Results Summary Acknowledgments References
Descriptives & Analysis Method
Analyses
I First we examine overall trends between CQH & SoE andvoiced segments and discuss our findings as they relate tosonority.
I Following this, we take a closer look at several within-categorydistinctions.
I Null hypothesis: no difference in CQH or SoE across voicedsegments, with the exception of voiced fricatives.
Sonority & Glottal Vibration — CUNY 2016 January 19, 2016— Slide 18/32

CQH : Consonants
Figure: CQH across all consonants, collapsing vowels into a singlecategory. L −→ R = decreasing constriction degree.

Strength of Excitation: Consonants
Figure: SoE across all consonants, collapsing vowels into a singlecategory. L −→ R = decreasing constriction degree.

The relationship between CQH and SoEI CQH makes distinctions among obstruents and SoE among
sonorants.
ɹ
ɣʁ ɾ
a
ð
d_cl
e
gɣ_cl
gɣ_rel
i
j
ln
o
ø
r
ʤ_rel
u
w
y
z-1.0
-0.5
0.0
0.5
1.0
1.5
-1.0 -0.5 0.0 0.5Mean Scaled Contact Quotient
Mea
n S
cale
d S
oEmannera
a
a
a
a
a
a
a
stopfricativetrilltapnasalliquidglidevocalic
Figure: Scaled CQH by Scaled SoE by segment. Size of symbol indicatesstandard deviation.

Introduction & Background Our Study Results Summary Acknowledgments References
Results: CQH and SoE
Conditional Inference Tree
I Do CQH values discriminate among voiced sounds along thesonority hierarchy?
I Conditional inference trees work by recursively partitioningobservations into subsets of the data which are significantlydifferent with respect to an outcome variable (Hothorn et al.,2006).
Sonority & Glottal Vibration — CUNY 2016 January 19, 2016— Slide 22/32

CQH : All SegmentsI V > liquids/glides + [gG] (cl) > non-dorsal fricatives/tap/trill
+ [d] (cl) > dorsal fricatives
segmentsp < 0.001
gɣ_cl, n, l, ɹ, j, w, V d_cl, gɣ_rel, ʁ, ɣ, ʤ_rel, ð, z, r, ɾ
segmentsp < 0.001
gɣ_cl, n, l, ɹ, j, wV
Node #2 (n = 201)
-3
-2
-1
0
1
2
Node #1 (n = 266)
-3
-2
-1
0
1
2
segmentsp < 0.001
d_cl, gɣ_rel, ʤ_rel, ð, z, r, ɾ , ʁ ɣ
Node #3 (n = 213)
-3
-2
-1
0
1
2
Node #4 (n = 50)
-3
-2
-1
0
1
2
Figure: CQH across all segments.
Introduction & Background Our Study Results Summary Acknowledgments References
Results: CQH and SoE
Interim Summary: The relationship between CQH and SoE
I A range of values of both measures is observed acrosssegments of different constriction degrees.
I In broad terms, the trends reflect differences along thesonority hierarchy.
I Vowels, on the whole, have the highest CQH and SoE values,indicating strongest voicing energy and least breathy voicing.
I Compared to nasals, liquids and glides, voiced obstruents alsohave lower CQH and SoE values - less energy in voicing andbreathier voicing.
Sonority & Glottal Vibration — CUNY 2016 January 19, 2016— Slide 24/32
Introduction & Background Our Study Results Summary Acknowledgments References
Results: Within Segment Types
Analyses: Within Segment Types
I Cross-linguistically, the sonority hierarchy is stable at eachlevel; however, there is some variation within levels (Janyet al., 2007).
I In particular, liquids and rhotics differed across languages (e.g.,Egyptian Arabic, Hindi, Mongolian, Malayalam).
I Other contrasts may pattern differently cross-linguistically, forexample sibilants versus other fricatives.
I This motivates us to examine some within-categorydifferences.
I Linear mixed effects models1 in R predicting CQH/SoE values.
1Speaker as random intercept. P-values obtained using likelihood ratio tests.Sonority & Glottal Vibration — CUNY 2016 January 19, 2016— Slide 25/32

Introduction & Background Our Study Results Summary Acknowledgments References
Results: Within Segment Types
Trill, tap, and [d]
I We were interested in examining segments that involved fullclosures, but are nonetheless in different parts of the sonorityhierarchy.
I The trill has a significantly lower CQH value (breathier)compared to [d] and [R] which aren’t significantly different.
I That is: [r] < [d] = [R] on CQH values.
I Trills pattern like voiced fricatives which is not surprising astheir contact intervals are often more like voiced fricativesthan like stops.
Sonority & Glottal Vibration — CUNY 2016 January 19, 2016— Slide 26/32
Introduction & Background Our Study Results Summary Acknowledgments References
Results: Within Segment Types
Place (dorsal/coronal) versus Sibilance
I Mittal et al. (2014) attributed a difference between dorsal,non-sibilant [G] and coronal, sibilant [z] in SoE to a place ofarticulation effect rather than an effect of sibilance.
I We compared the dorsal, non-sibilant fricatives [K] and [G](n = 59) to the coronal, non-sibilant [D] (n = 34) and thecoronal, sibilant [z] (n = 38) to tease this apart.
I Place: Dorsal fricatives (non-sibilants) have lower CQH
values than coronal [D] (non-sibilant) and [z] (sibilant) →breathier voicing.
I Sibilance: no significant effect on model fit.
Sonority & Glottal Vibration — CUNY 2016 January 19, 2016— Slide 27/32

Strength of Excitation: VowelsI We tested the relationship between voicing across vowels and
intrinsic aperture using scaled SoE and scaled F1 as anindicator of vowel height/aperture.
a
aa uu
uy
yy
øø
øo
o
o
i
iie
eeø
ø
ø
e
ee
i
ii
y
y
yu
uu
aaa
ooo y
yy
oooa
a
a
i
ii
uuu
øøø
e
e
e
aa
eee
iii
y
y
oo
o
u
uu
øøø
uu
uyyyø
ø
øee
e
aaa
ii
i
oo
o
i
e
a
øy
ou i
i
e
eaa
øø
yy
oo
u
u
ooo iiiaa a
ø
ø
ø
eee
uu
uy
yy
uuu
a aa
e
e
e
ii
i
ø ø
ø
o oo
øøø
aa
a
i
ii
ee
e
u
u
uo
oo
yy
a
uuuo
o
o i
ii
eee
y
yy
øøø
i
i
i
yy
yu
u
u
aaa
ee
e
ooo
aaa
yyy
o
oo ø
ø ø
uuu
ii
i
eee
eee
uuu
øøø
ii
i
yy
yo
oo
aaa
-1
0
1
2
3
-10123Scaled F1 (reversed)
Sca
led
Stre
ngth
of E
xcita
tion
vowelsaaaaaaa
yuiøoea
Figure: Strength of Excitation versus scaled F1 (reversed).

Introduction & Background Our Study Results Summary Acknowledgments References
Results: Within Segment Types
Vowels: [i, e, a, y, ø, o, u]
What were the effects of the following factors on SoE?
I Height (F1): High vowels > Mid vowels > Low vowels.
I Backness (F2): No significant effect.
I Roundness: Unrounded vowels have lower SoE values (lessstrong voicing) than round vowels.
I These effects are in the opposite direction from theprediction based on the idea that rounding/height decreasevowel aperture.
Sonority & Glottal Vibration — CUNY 2016 January 19, 2016— Slide 29/32

Introduction & Background Our Study Results Summary Acknowledgments References
Summary
Summary: Within Categories
I Compared to tap [R] and stop [d], the trill [r] has the lowestCQH values meaning it patterns more like a fricative.
I Place vs. Sibilance:I Found a significant difference in voicing dep. on place of
articulation but not sibilance.
I Vowels: The expected relationship between vowel height (androundness) and SoE is not borne out; however —
I The reversal in expected SoE values among vowels is alsoobserved among sonorants (nasal > liquids > approx.).
Sonority & Glottal Vibration — CUNY 2016 January 19, 2016— Slide 30/32

Introduction & Background Our Study Results Summary Acknowledgments References
Conclusion & Future Directions
Conclusions
1. Does voicing vary across segment types, and if so;I Yes! Null hypothesis can be rejected.
2. Do these distinctions depend on degree and type ofconstriction?
I Generally speaking, the tighter the constriction → thebreathier the voicing
3. Do these differences reflect distinctions made by(phonological) sonority?
I Only at the broadest level: Vowels > approximants >obstruents
I A number of reversals within each broad manner class.
Sonority & Glottal Vibration — CUNY 2016 January 19, 2016— Slide 31/32

Introduction & Background Our Study Results Summary Acknowledgments References
Acknowledgments
Thank you to Yen Shue for VoiceSauce and Henry Tehrani forEggWorks.
We would also like to thank the students in the UCLA Winter 2015Speech Production graduate course for participating in the designand execution of this study, as well as Soo Jin Park for adding theSoE measure to VoiceSauce.
Thank you also to members of the UCLA Phonetics Lab for helpfulcomments and discussion.
Sonority & Glottal Vibration — CUNY 2016 January 19, 2016— Slide 32/32

Introduction & Background Our Study Results Summary Acknowledgments References
Bickley, C. A. and Stevens, K. (1987). Effects of a vocal tract constriction onthe glottal source: Data from voiced consonants. In Baer, T., Sasaki, C.,and Harris, K., editors, Laryngeal Function in Phonation and Respiration,pages 239–253. College-Hill Press, Boston, MA.
Eduard, S. (1881). Grundzuge der Phonetik. Breitkopf und Hartel, Leipzig.
Fant, G. (1997). The voice source in connected speech. SpeechCommunication, 22:125–139.
Fletcher, M. (1972). Speech and Hearing in Communication. Krieger, RobertE., Huntington.
Hankamer, J. and Aissen, J. (1974). The sonority hierarchy. pages 131–145,Chicago: Chicago Linguistic Society.
Heffner, R.-M. S. (1950). General Phonetics. The University of WisconsinPress, Madison.
Hothorn, T., Hornik, K., and Zeileis, A. (2006). Unbiased recursivepartitioning: A conditional inference framework. Journal of Computationaland Graphical Statistics, (3):651–674.
Jany, C., Gordon, M., Nash, C. M., and Takara, N. (2007). How universal is thesonority hierarchy?: A cross-linguistic study. Paper presented at ICPhS XVI.
Sonority & Glottal Vibration — CUNY 2016 January 19, 2016— Slide 32/32
Introduction & Background Our Study Results Summary Acknowledgments References
Miller, B. (2012). Sonority and the larynx. In Parker, S., editor, The SonorityControversy, pages 257–288. Walter de Gruyter.
Mittal, V. K., Yegnanarayana, B., and Bhaskararao, P. (2014). Study of theeffects of vocal tract constriction on glottal vibration. Journal of theAcoustical Society of America, 136(4):1932–1941.
Murty, K. S. R. and Yegnanarayana, B. (2008). Epoch extraction from speechsignals. IEEE Transactions on Audio, Speech, and Language Processing,16(8):1602–1613.
Nathan, G. S. (1989). Preliminaries to a theory of phonological substance: Thesubstance of sonority. In Corrigan, R., Noonan, M., and Eckman, F., editors,Linguistics categorization, volume 61 of Current Issues in Linguistic Theory,pages 55–68. John Benjamins, Amsterdam.
Ohala, J. J. (1983). The Origin of Sound Patterns in Vocal Tract Constraints.
Parker, S. (2002). Quantifying the Sonority Hierarchy. PhD thesis, Universityof Massachusetts Amherst.
Shue, Y. L., Keating, P. A., Vicenik, C., and Yu, K. (2011). Voicesauce: Aprogram for voice analysis. In Proceedings ICPhS 17, pages 1846–1849.
Sole, M.-J. (2015). Acoustic evidence of articulatory adjustments to sustainvoicing during voiced stops. In Proceedings of the 18th InternationalCongress of Phonetic Sciences. Glasgow, UK: the University of Glasgow.
Sonority & Glottal Vibration — CUNY 2016 January 19, 2016— Slide 32/32
Introduction & Background Our Study Results Summary Acknowledgments References
Stevens, K. (2000). Acoustic Phonetics. Current Studies in Linguistics Series.MIT Press.
Tehrani, H. (2012). Eggworks.http://www.linguistics.ucla.edu/faciliti/sales/software.htm.
Westbury, J. and Keating, P. (1986). On the naturalness of stop consonantvoicing. Journal of Linguistics, 22:145–166.
Sonority & Glottal Vibration — CUNY 2016 January 19, 2016— Slide 32/32