Embed Size (px)
Citation preview

i
The Relationship between Perceived Risk and Brand Equity: A
Comparison of Tesco and ASDA

ii
Abstract
The aim of this study is to explore the relationship between brand equity and perceived
risk of customers. The study has conducted a comparative study between Tesco and
ASDA, two retail giants of the UK. This study also aimed at finding the solutions to
reduce perceived risk of the customers. For meeting its objectives this study has followed
positivism philosophy and taken deductive approach of research. The data were collected
by using a questionnaire survey on customers of Tesco and ASDA regarding their
feelings about different risks and different aspects of brand equity of both companies.
The study revealed that overall brand equity of Tesco is higher than that of ASDA. The
product related risk of Tesco is higher than that of ASDA, but the user related perceived
risks are lower for Tesco than ASDA. From Pearson correlation analysis it is found that
Brand equity affects the perceived risk negatively. If brand equity can be improved than
customers’ perceived risk can be reduced and ultimately customer satisfaction and
loyalty can be enhanced which will lead both Tesco and ASDA to long term profitability.
The study recommended that Tesco should increase its customer contacts. On the other
hand ASDA should improve its brand awareness for diminishing customers’ perceived
risk.
Keywords: Brand Equity, Brand Loyalty, Perceived Risk, Brand awareness, Perceived
quality.

iii
Acknowledgement
A dissertation or research involves the effort of many persons. This dissertation has also
been prepared with the help of many people. I have done this study on the “The
Relationship between Perceived Risk and Brand Equity: A Comparison of Tesco
and ASDA”. In the way of completing my task I had to take help from different persons.
First of all, I express my heartfelt gratitude to my honourable
supervisor……………………………….who helped me in every stage of my
dissertation. His timely and realistic guidelines helped me to correct my errors and make
the dissertation meaningful. I would also like to thank to the persons who helped me in
the step of data collection. I am especially grateful to Mr. AHM Raihan, Manager, Tesco,
in London, UK, and to the Jonathon Broad, Manger or ASDA in Londonwho helped me
conducting my interview. I am thankful to the customers who gave me their valuable
time for the interview.
I am also thankful to my friends and relatives who gave me support in the different
stages of dissertation. Without their support it would not be possible to complete this
work.
iv
ContentsAbstract........................................................................................................... ii
Acknowledgement.......................................................................................... iii
Chapter – 1: Introduction.................................................................................1
1 Introduction...............................................................................................1
1.1 Background of the Study.....................................................................1
1.2 Company Overview.............................................................................2
1.2.1 ASDA.............................................................................................2
1.2.2 Tesco.............................................................................................2
1.3 Rationale of the Study.........................................................................3
1.4 Aim and Objectives of the Study.........................................................3
1.5 Research Aim:.....................................................................................3
1.5 Research Questions................................................................................4
1.6 Hypothesis of the Study......................................................................4
1.7 Structure of the Study.........................................................................4
1.8 Summary............................................................................................5
Chapter – 2: Literature Review........................................................................6
2 Literature Review......................................................................................6
2.1 Introduction.........................................................................................6
2.2 Perceived Risk: An Overview...............................................................6
2.3 Features of Perceived Risk..................................................................7
2.4 Issues of Measuring Perceived Risk.....................................................8
2.5 The Behavioural Foundation of Perceived Risk....................................9
2.6 Concept of Brand Equity...................................................................10
2.7 Brand Equity Model...........................................................................10
2.8 Impacts of Brand Equity....................................................................12
2.9 Measuring Brand Equity....................................................................12
2.10 Process of Brand Equity....................................................................14
2.10.1 Brand Equity and Advertising.....................................................14
2.10.2 Copy Test Measures for Brand Equity..........................................14
2.10.3 Equity Measure and Ad Recall.....................................................14
2.10.4 Attributes of Brand Equity..........................................................15
2.11 Summary..........................................................................................15
Chapter – 3: Research Methodology..............................................................16
3 Research Methodology............................................................................16

v
3.1 Introduction.......................................................................................16
3.2 Research Philosophy.........................................................................16
3.3 Research Approach...........................................................................16
3.4 Research Methods.............................................................................17
3.5 Data Collection Method.....................................................................17
3.6 Sampling Method and Sample Size...................................................18
3.7 Data Analysis Method and Data Interpretation.................................18
3.8 Ethical Considerations.......................................................................19
3.9 Limitation of Methodology................................................................19
3.10 Summary..........................................................................................19
Chapter 4: Results.........................................................................................20
4 Results.....................................................................................................20
4.1 Demographic Data:...........................................................................20
4.2 Reliability Test...................................................................................22
4.3 Descriptive Statistics........................................................................22
4.3.1 Brand Equity:..............................................................................22
4.3.2 Perceived Risk:...........................................................................24
4.3.3 Comparison between Tesco and ASDA:.......................................27
4.3.4 Pearson’s Correlation:.................................................................28
4.3.5 Regression analysis....................................................................29
Chapter 5: Analysis and Discussion...............................................................31
5 Analysis and Discussion..........................................................................31
5.1 Analysis and Discussion of Results....................................................31
5.2 Analysis and discussion based on Objectives:..................................33
5.3 Summary:..........................................................................................33
Chapter 6: Conclusion and Recommendation................................................34
6 Conclusion and Recommendation...........................................................34
6.1 Conclusion:.......................................................................................34
6.2 Recommendations:...........................................................................35
6.3 Limitations and Scope for Future Research:......................................35
References.....................................................................................................37
List of Tables

vi
Table 4-1: Demographic Variables of the respondents.................................................................23Table 4-2: Cronbach’s Alpha........................................................................................................25Table 4-3: Comparative Descriptive Statistics of Brand equity and Customers’ Perceived risk of TESCO and ASDA......................................................................................................................28Table 4-4: Pearson’s correlation matrix for Tesco........................................................................31Table 4-5: Pearson Correlation for ASDA....................................................................................32Table 4-6: Regression results for measuring effect of brand equity on customer's perceived risk 33Table 4-7: Regression results.......................................................................................................33
List of Figures
Figure 2-1:Issues of Risk Perception Research............................................................11Figure 2-2: Brand Equity Model.............................................................................14Figure 2-3: Measuring Brand Equity........................................................................16Figure 4-1: Comparison between perceived brand equity of Tesco and ASDA.....................30Figure 4-2: : Comparison of perceived risk score for Tesco and ASDA..............................30

1
Chapter – 1: Introduction
1 Introduction
1.1 Background of the StudyThe performance management of an organisation is based on the sales level and
production. Sales and production level can be manipulated by creating impact on the
consumers mind, which can affect on the decision making process of purchasing the
products. Perceived risk is the concept of consumer’s level of uncertainly during making
the decision to buy the products (Apgar, 2006; Hoeffler, 2003). Most of the times, it is
occurred for expensive products but in developed countries, it can be seen in any sector
of business market because of having competitive environment (Kotler, 2008). The
increase of SMEs has created the competitive environment in the marketplace that can
affect on organisational performance, due to this reason, popular brands are concerned
about their perceived risk and so, they are introducing innovative processes to attract the
customers. Marketing communication is developed and online marketing is introduced to
attract more customers. In many cases customers can fear to purchase products without
any information but the advertisement and information can reduce that risk level of the
consumers and encourage them to purchase the products (Neef, 2005).
Famous brands like ASDA and Tesco are two selected company for the study that also
deal with perceived risk factors (tescoplc.com, 2013). This is generally a process of
ensuring brand image in the market so that customers can have a mental satisfaction to
buy the products. It can reduce the risk of consumer’s level uncertainly (Leone et al,
2006). But many companies fail to ensure their brand equity that brings negative impact
on the organisational performance (Won, 2008; Chen, 2001). If the company has
sustainable brand image then it can launch new product in the market rather than low
level of risks than other companies. Perceived risk does not only affect on the brand
image and financial factors but it also has an impact on gaining competitive advantages
from the market (Verhoef, 2003). Tesco and ASDA are two popular brands in UK
market, so, this study will be discussing the comparative scenario of these two brands
from the perspective of the relationship between perceived risk and brand equity
(your.asda.com, 2013).

2
1.2 Company Overview1.2.1ASDAASDA is the second biggest crockery retailer in UK Market that provides various items
of products for the customers. It has 267 physical retails in UK and provides around
165000 employment opportunities. It supplies grocery products, home wares,
entertainment as well as financial services. The increasing level of sales shows that
market share is also increasing day by day in for the company. The customer satisfaction
concept is well managed by this brand so the level of customers keeps increasing.
Another major factor for this company is to ensure the best quality of goods for the
consumers in UK that bring a sustainable brand image for them. The social responsibility
is also maintained by this brand and they are willing to produce greener product for the
consumers. They have been committed to reduce the emission of carbon dioxide by the
end of 2009 in the amount of 100000 tones. All these issues have brought popularity for
the brand in the market and customers also feel comfortable to purchase products from
them. Thus, perceived risk is reduced for the company and brand equity is ensured
(your.asda.com, 2013).
1.2.2TescoTesco is another popular retailer in UK market that provides numerous types of goods
and services for the consumers. This brand is officially established in 1932 and it
increased its business very rapidly. After the establishment, Tesco opened 100 small
branches within next eight years. In 1956, Tesco achieved the capacity to supply small
grocery products for the customers and they also introduced fresh food products for the
customers with their traditional dried food products. In 1995 this brand has become the
biggest retailer of food products in Britain. During the same year, Tesco introduced Club
card Reward Scheme. Tesco increased small stores into 720 within 2002. The total profit
of the company was 2 billion pounds in 2005 and in 2006, Tesco raised their number of
stored into 1879 that made them near about one-third amount of grocery market in UK
(tescoplc.com, 2013). The improvement of customer relationship management in this
company creates the most beneficial opportunities to increase organisational
performance.

3
1.3 Rationale of the StudyThe major research issue is the reduction of perceived risk for the companies by ensuring
brand equity. The nature of perceived risk is very concerning for any business
organisation. Tesco and ASDA may take effectives measure to deal with perceived risk.
Brand equity is very useful for these brands to reduce the level of perceived risk. This is
a research issue because it can affect negatively on organisational performance. The
profit making opportunities of the companies can be hampered if perceived risk lessen
the consumer’s level (Otterson, 2005; Mackay, 2001). Brand equity is the concept of
increasing popularity in the market that can help to gain competitive advantages, so, this
has becomes a research issue in this present study. The present market situation describes
that UK has the most competitive business environment for the grocery retailers. The rise
of SMEs in this sector makes the popular brands concerned to lose their sustainable
position in the market (Keller, 2003). Due to this reason, this is a burning issue for this
research at present business situation. The outcome of the study can shed light on the
selected companies in order to gain some benefits to reduce perceived risk and increase
brand equity in the competitive market.
1.4 Aim and Objectives of the StudyThe aim and objectives of the study need to be designed properly so that we can follow
specific instructions for the research activities. The aim and objectives of the study also
defines the major purposes from this study. The benefits and outcome of the study can
assist selected companies to utilise the impact of brand equity as well as to reduce
perceived risk. The main aim of the study is given below.
1.5 Research Aim:The aim of the study is to investigate perceived risk and brand equity relevant with Tesco
and ASDA.
There are some objectives of the study that may help to gain the aim of the research.
Research objectives are important to understand the expected outcome from the present
study. Significant research objectives are mentioned below.
To discuss various factors and issues related with perceived risk and brand equity
between ASDA and Tesco in UK market To understand the relationship between perceived risk and brand equity in Tesco
and ASDA

4
To find out the process in order to increase brand equity of Tesco and ASDA to
minimize perceived risk in UK market To describe the impact of reducing perceived risk and ensuring brand equity for
increasing the pace of organisational performance To recommend ways that can help to develop the market position of Tesco and
ASDA by reducing perceived risk
1.5 Research QuestionsSome research questions are need to be mentioned so that we can understand the impact
of brand equity for minimizing perceived risk in the selected companies.
What are the factors and issues relevant with brand equity and perceived risk in
Tesco and ASDA? How to evaluate the critical relationship between brand equity and perceived risk
in Tesco and ASDA? How does the brand equity create impact to reduce perceived risk in the
competitive market?
1.6 Hypothesis of the StudyResearch question can be assisted with designing some hypothesis. Hypothesis of the
study can be important to support the research aim and objectives that describes the
importance of brand equity to reduce perceived risk for the selected companies to gain
competitive advantages from the market. Significant hypothesis of the study are shown
below.
Business risks such as social risk, performance risk and psychological risk
directly affecting for the difference between the level of perceived risk and
organisational performance of Tesco and ASDA. Brand equity can create impact to lessen the level of perceived risk of customers
towards particular goods and services of Tesco and ASDA.
1.7 Structure of the StudyThe beginning chapter of the study focuses on the aim and objectives of the study.
Rationale of the study and some research questions are also explained here. The second
chapter explains important secondary literatures relevant to the aim and objectives of the
study. Research methodology will be important to design particular methods and
processof conducting the study. Data collection method and data analysis method are
going to be described in this chapter. The next chapter will bring data presentation and

5
analysis so that we can discuss the findings of the research and objectives. The last
chapter explains conclusive discussion of the study with important recommendations.
1.8 SummaryIntroduction segment is required to discuss the aim and objectives of the study. The
background of the study is described in this chapter. The overview of both selected
companies is also explained here/necessary research questions and research hypotheses
are mentioned in this segment. Rationale of the study is another important portion of the
introduction chapter. Rationale of the study indicates the needs and major purposes of the
present study.

6
Chapter – 2: Literature Review
2 Literature Review
2.1 IntroductionSecondary sources are necessary to understand significant findings and analysis of the
previous studies relevant to the aim and objectives of the research. The concept of
perceived risk and brand equity are going to be described here.Important factors and
issues relevant with brand equity are going to be explained in this segment. Model of
brand equity and its attributes are some important issues for this case study. The
definition and aspects of perceived risk is also another vital portion of this chapter.
Secondary data is required to maintain effective analysis of the data so that we can attain
the aim and objectives of the case study.
2.2 Perceived Risk: An OverviewSeveral types of risks are indicated by perceived risk in business organisation. Mostly,
the risk factors related with business performance risk, social risks as well as
psychological risk that can create impact on the organisational performance arereferred
as perceived risk (Liesch et al, 2006). Perceived risk is the concept of having lack of
information about the products for the consumers. But organisations are very keen to
provide such information regarding the products so that the risk level of the consumers
can be reduced (De Zoysa and Russell, 2003).
Many advertising firms are working for marketing communications and business
organisations are utilising them to provide products information to the consumers. For
example, if consumers wish to purchase a car with high level of costs but they do not
know about its service and facilities, so, it increases the level of perceived risk. But if the
company brings the opportunity to provide that necessary information about the car for
the consumers, it may convince the consumers to purchase the car (Lavino and
Neumann, 2010).Perceived risk is more like reducing the consumer’s level risk rather
than dealing with other risk factors of a business organisation. The psychological issue of
the buyers can affect on decision making process of purchasing the products, so, it is the
responsibility for the companies to let the consumers know about their products and

7
create a positive psychological impact on the buyers mind that convince them to
purchase the products (Lavino and Neumann, 2010).
2.3 Features of Perceived RiskConsumer’s behaviour refers that they do not wish to buy products from unknown brands
because it creates risk to waste their money. Consumer’sintention is to purchase products
from the brand, which is popular in the market that inspires them to show positive
psychological behaviour towards the products. Some important features of perceived risk
are discussed below.
The issues relevant with heuristics including anchoring, overconfidence and
availability of the products. This feature refers that organisations need to have
availability of the products for the customers and the level of confidence need to
be high through effective brand image to manipulate consumer’s behaviour
(Kotler, 2008). Business organisation need to have an idea of average losses at times. Perceived
cannot be maintained time to time so it may bring losses for the companies. Management of the business organisation can study about the analysis of
situational characteristics of perceived risk so that the measures can be taken
properly. Or in other words, the consequences of perceived risk need to be
clarified for the business organisation (Emblemsvag and Kjolstad, 2002). There can be some associations with the risk sources that need to be identified by
the organisation. Perceived risk emerges from the psychological conscience and
behaviour of the consumers, so, business organisation needs to know how to
manipulate the consumer’s behaviour and attract them toward the products. Risk controlling agencies and institutions work to deal with perceived risk in
business organisations. So companies can maintain sustainable credibility and
trust with those agencies so that perceived risk can be reduced in order to
increase organisational performance (Renn and Rohrmann, 2000). Media coverage is another important issue because the advantages of modern
technology introduces a new scope of social media marketing to ensure brand
equity for the companies, which makes consumers convinced to buy products and
lessen the level of perceived risk from consumers mind. Judgement of others including references groups and consumer’s previous buying
experience are related with perceived risk (Emblemsvag and Kjolstad, 2002).
Reference groups can make the consumers purchase products as well as

8
consumers previous experience can affect on psychological risk level of the
consumers.
2.4 Issues of Measuring Perceived RiskMeasurement of perceived risk is very crucial for the companies because it can directly
affect on the fluctuation of the level of consumers of the company. The measurement of
perceived risk requires some issues that can help to understand the sources as well as the
consequences of perceived risk for the organisation.
Figure 2-1:Issues of Risk Perception Research
Source: Ricciardi, 2004; p. 30
Necessary information need to be processed to understand the cognitive and emotional
factors of the consumers. The core issue is to understand the cognitive structure of risk
judgement of the consumers that emerges from the lack of awareness about either
products of brand. The feeling of consumers can be negatively affected by perceived risk
(Ricciardi, 2004). The relation to statistical data about the company is necessary for the
consumers know about the success of the organisation. It may affect consumers’
cognitive structure through mind satisfaction. Individual or societal risk acceptance is
another vital issue relevant with the measurement of perceived risk. Therefore, we live in
society; we need to face some risks for business purposes. Business organisations are
willing to take risks to make profit from the society’s consumers. The link to actual risk
behaviour is very important to know for the companies (Verhaegen, 2005; Emblemsvag

9
and Kjolstad, 2002). Customers often hesitate to buy products that are costly or
expensive and if the brand is not very popular it increases the level of risk in consumer’s
cognitive mind. It creates a link to actual risk behaviours of the consumers (Ricciardi,
2004).
The next issue is to analyse the cross-cultural differences. When a business organisations
wish to expand their business in other regions, which creates cross-cultural differences.
So, companies need to be sincere about dealing with this issue to maintain suitable
products for particular target population so that it does not affect consumers’ cognitive
mind negatively (Mercer et al, 2005). Application to risk communication is very
important because it can bring the opportunity for the companies to gain competitive
advantages from the market (Ricciardi, 2004). The last issue relevant with perceived risk
is issues of personality traits and demographic differences. This sort of issue can often
create impact on cognitive structure of the consumers that raises the level of risk from
psychological perspective.
2.5 The Behavioural Foundation of Perceived RiskPerceived risk is term that is connected with behavioural perspective. It describes the
judgement to risk issues of individuals that may bring hazard for them, so, basically they
try to avoid it but if the opposite party can provide information regarding the exchange
process then it may reduce the level of risk (Mercer et al, 2005). Consumers do not want
to waste their money by purchasing products with less quality, so, financial perspective is
also included with perceived risk issues. The terminology comes from social sciences
that consumers can hesitate to make decision during purchasing products if there is no
assurance or guarantee of the products (Slovic, 2000). But brand image and satisfactory
quality of the products can influence the consumer’s behaviours positively and tract them
to purchase the products. We can notice that perceived risk can be predictable and
measurable so that companies can take measures to deal with it. Risk perception issues
are highly connected with consumer’s behaviour (Böhm, 2001). The proper management
of perceived risk can also bring positive psychological impact on consumer’s mind that
helps to achieve competitive advantages for the companies. Behavioural factors are
directly affecting on perceived risk so the companies need to follow effective marketing
policy and process to regulate consumer’s behaviour (Slovic, 2010).

10
2.6 Concept of Brand EquityBrand equity is a term related to marketing that indicates that the brand of the company
is well established in the market. The concept of brand equity comes from brand image
of the business organisation. It is connected with marketing issues because brand image
can be ensured through effective marketing communication (Kim et al, 2003; Erdem et
al, 2006). Business organisations need to maintain sustainable brand equity to increase
the organisational performance. For example, Nokia is a popular brand for cell phone
products (Christodoulides and Chernatony, 2010). It has brand equity and consumers feel
comfortable to purchase products of Nokia. This is refried as brand equity when people
know about the quality and the brand image, so, they can attract to the products of that
same brand very easily (Lee and Back, 2010; Dean, 2004).
The sales and production level is highly reliable on the impact of brand equity. There is a
critical relationship between perceived risk and brand equity because the impact of brand
equity works on reducing the level of perceived risk from consumer’s mind. The major
source for brand equity is to ensure the best quality of product and services for the
consumers (Sietz et al, 2010). Advertising and marketing can be important to increase the
brand image in the market. Popular and competitive brands can show their willingness to
collaborate with the company that has effective brand equity in the market. So, it is
completely a process of attaining the goal of a business organisation by satisfying the
customers with the best quality of products.
2.7 Brand Equity ModelThe model of brand equity is a framework to understand relevant factors of brand equity.
The figure explains that brand equity has seven major aspects to complete the model.
The association is the beginning aspect of brand equity model. It refers to the business
organisation that wishes to ensure brand image in the market by providing the best
quality of products and services.

11
Figure 2-2: Brand Equity Model
Source: sparkideasnl.wordpress.com, 2013
The association needs to maintain brand image and personality. If the company has the
brand of the name emerges from the owners name then it can affect on the brand image.
If the personality of the owner is very popular in the society then the brand name
becomes very famous in the market (Yoo and Donthu, 2001). The familiarity if the brand
needs to be ensured by supplying sufficient amount of products to the customers. The
awareness of the brand comes from the impact of familiarity. If the consumers are aware
about the brand name then they can be attracted to purchase goods from them. Awareness
of the brand image can be ensured through proper marketing communication and
advertisement. Social media marketing is now introduced to ensure the awareness of the
brand image among the consumers (Yasin et al, 2007). Loyalty of the brand indicates the
customer relationship management and the commitment to provide the best quality and
services for the customers. Brand can maintain loyalty by providing privileges to its
regular customers’ that ease the way of brand equity.
Preference of the brand can be maintained if the company supplies satisfactory products
to the customers. Customers havechoices to purchase products from different brands but
they can prefer to buy the products from the company that has popularity to provide the
best quality of products. Loyalty of the brand to its customers is also affecting for
preference issues (Milberg and Sinn, 2008). The availability of the product as well as

12
brand needs to be ensured. If the company does not avail in the market for long time with
its products then it may not bring brand equity for them (Bravo et al, 2007).
2.8 Impacts of Brand EquityBrand equity is a commonly used marketing strategy to create a positive psychological
impact on the customers mind to purchase the products. It also can affect the decision
making process of the consumers during buying products. The impact of brand equity
refers that it brings awareness to the customers about the company and its product. If the
customers are aware about the brand they can be eager to purchase products from the
brand (Pike et al, 2010; Washburn and Plank, 2002). The sales and production can be
fastened by the consequences of brand equity. For example, customer purchase product
from the popular brand more often than other brands. So, it can vastly increase the level
of sales for the company (Pappu et al, 2005; Broyles et al, 2010).
It brings a communication with the customers and enhances the scope of customer
loyalty. When we come to the concept of loyalty, we can generalise that brand equity can
also ensure customer relationship. If the CRM department works fluently then it can
affect on the organisational performance. The ultimate goal of a business organisation is
to increase the pace of profitability and productivity of the company (Martinez and Pina,
2009). Brand equity brings the opportunity for increasing profit for the organisation and
ensures sustainable position in the market. Another impact of brand equity is to gain
competitive advantages from the market (Broyles et al, 2009).
2.9 Measuring Brand EquityBrand equity builder model can explain how we can measure brand equity of a business
organisation.

13
Figure 2-3: Measuring Brand Equity
Source: Walker, 2002; p. 02
Brand health is important factors to understand the present situation of brand equity of a
company. The loyalty of the brand to its customers and the commitment to provide the
best quality of products and services determines the brand health in the market (Walker,
2002). Purchase interest and price sensitivity are two major issues to be measured to
understand the brand health. Market share is another vital scope to understand the annual
profitability of the company (Whitelock and Fastoso, 2007).
Price comparison and price evaluation are required to understand the price value of the
organisation. Then we can measure the brand equity through some processes such as
relevance, popularity, quality, uniqueness and familiarity. Popularity of the brand is a
factor that helps us to measure the level f brand equity in the market. It is the basic
concept that comes to the consumer’s mind during the decision making process of
buying the products (Wang et al, 2006). If the popularity of the brand is sustainable then
it can create a positive psychological impact on the consumers mind to buy the products.
Quality of the products is also vital factor to measure the level of brand equity. The
improvement of the products quality can ensure the increase of brand equity (Atilgan et
al, 2005).

14
2.10 Process of Brand Equity2.10.1 Brand Equity and AdvertisingAdvertising is a measure that enhances the marketing activities of a brand. Advertising is
generally a process of motivation. From psychological perspective, advertising brings an
opportunity for the company to spread the company background and information to the
consumers (Pappu et al, 2005). Advertising in published media and electronic media is
very popular to increase the brand equity. The launch of new products as well as the
product quality can be provided to theconsumer through advertising. The features and
price of the products can also be released by advertising that can ensure customer
attraction to the company (Netemeyer et al, 2004).
2.10.2 Copy Test Measures for Brand EquityBrand perception of the consumers can be evaluated through cop test measures. This is
basically a process of understanding the effectiveness of advertising to increase the brand
image. The consumers are affected by the advertisement easily and they become aware
about the brand (Jung and Sung, 2008; Keller and Lehmann, 2008). But if they do not
purchase the products from that brand then the advertising efforts may go in vain. So, the
business organisations need to take copy test measures toevaluate the impact of
advertising. We need to evaluate that the advertising increases the sales or not, so that we
can see the difference between after advertising moment before advertising moment of
the company (Konecnik and Gartner, 2007). Copy test measure beings the scope to deal
with advertising and marketing limitation that can hinder the attainment of brand equity.
2.10.3 Equity Measure and Ad RecallAd recall for brand equity is a process of increasing the brand equity in the market.
When a brand is already popular in the market it may need to increase the rating because
of competitive business environment (Hsieh, 2004). So, ad recall may be introduced to
increase the brand equity to gain the competitive advantages. The difference of the
product quality is an important factor to brand equity. Newly established companies that
supply products f1or the customers do not have any brand image (Bloemer and Ruyter,
2008). Due to this reason they need to provide high quality of products for the consumers
to make them stable in the market. This sense creates a competitive business scenario for
the popular brands that leads to take ad recall measures.

15
2.10.4 Attributes of Brand EquityThere are some important attributes of brand equity that can help to understand the
sources and factors of attaining brand image for the business organisations.
Brand loyalty or satisfaction Brand popularity in the market Awareness about the brand Personality of the brand image Distribution coverage and market value Differentiation Perceived values Amount of market share (Buil et al, 2008)
According to Kotler (2008) there are three major index of brand equity that can increase
organisational performance such as:
Stability of the brand is described as a process of attaining customer retention and
customer loyalty The level of market share is considered as a success of brand equity for
organisational performance Other organisations can measure the relation with relative price explained by the
ratio
2.11 SummaryThis chapter explains about the nature and definition of perceived risk and brand equity.
There are many important factors and issues relating to perceived risk are described in
this chapter to explain the aim and objectives. Bran equity process and some necessary
issues regarding the aim and objectives are also expressed here. The role of advertising
for marketing as well as brand equity is also explained in this segment. The discussion of
model of brand equity is another vital portion of this chapter.

16
Chapter – 3: Research Methodology
3 Research Methodology
3.1 IntroductionResearch methodology is the chapter of the present study that includes the research
methods and research design. The methods of conducting this research are going to be
explained in this chapter.
3.2 Research PhilosophyBoth positivism and interpretivism research philosophy/paradigm are very popular to
conduct marketing research. Positivism research philosophy believes that if we can solve
the problems that can ease the way of attaining the benefits for the organisations
(Neuman, 2009). On the other hand, the concept of interpretivisim believes that if we can
solve the problems then it can bring success as well as more difficulties for the
organisation. The core concept of this research philosophy is that human being has the
power to make their decisions (Crossan, 2003). For this study positivism is adopted as
the research philosophy. Since the focus of this study is to explore the cause effect
relationship between perceived risk and brand equity and the reality of such effect can be
identified without intruding into the event Positivism is the suitable philosophy for this
study.
3.3 Research ApproachBoth inductive and deductive research approaches are indicated in the research design
segment. The use of research approach enhances the supporting role for research
methods that can make the methodology efficient for the case study.
Inductive Research Approach: The implication of research approach is necessary to
conduct the research activities within specific way. The concept of inductive research
approach brings the opportunity to use bottom-up strategy for the research
methodology(Creswell, 2007). Theory is the ultimate outcome to inductive approach.
Deductive Research Approach: The term deductive research approach refers that it has
the consistency of applying top to bottom strategy for research methodology. The major
role of applying deductive research approach is to design specific aim and objectives of
the study. It can also bring the scope of using tentative hypothesis for conducting the
case study successfully. Hypothesis can help to understand the comparison between

17
Tesco and Asda by discussing the issues regarding perceived risk and brand equity
(Kumar and Ranjit, 2005). Deductive research approach is useful to ensure boarder
generalisation of the primary data relating to perceived risk and brand equity in the
selected companies. So by considering the use of existing theories for bringing an
outcome by exploring the relationship between perceived risk and brand equity of Tesco
and ASDA it is seemed that deductive approach will be more suitable for this study.
3.4 Research MethodsThere are two major method of conducting the case study of perceived risk and brand
equity comparing in Tesco and Asda such as quantitative method and qualitative
methods. Both these methods can be useful to analyse various factors and issues relevant
with the aim and objectives of the case study.
Qualitative Research Method: Qualitative research method is more likely to conduct
the study by using different qualitative theories and descriptions. This method is more
suitable for behavioural analysis.
Quantitative Research Method: The implication of quantitative method is important
for this present study because it can describe some quantitative variables of perceived
risk and brand equity. We need to analyse some significant factors of brand equity
through quantitative data, so, this research method is mainly used for this study.
Quantitative research approach is also useful for analysing the primary data in
accordance with secondary data that helps to attain the aim and objectives of the case
study (Denscombe, 2007). It also brings the opportunity to conduct questionnaire survey
for primary data collection. Survey method is very important to gather useful data
relating to the perceived risk and brand equity in Tesco and Asda.
3.5 Data Collection MethodThe methods of data collection need to be specified for the study. The tools of data
collection are also necessary to ensure effective data collection procedures in this
research.
Secondary Data Collection Method: This type of data is called as second hand data.
Researcher does not need to collect it by his efforts because it is already published
somewhere else. It refers that any kind of written and published materials relevant with
perceived risk and brand equity are mentioned as secondary data in this case study. The

18
importance of secondary sources of data explains that outcome of the study can be
expected by discussing the findings of the literatures (Creswell, 2007). In literature
review segment, we have discussed some important issues and factors that can help to
understand the impact of brand equity for reducing perceived risk in business
organisations.
Primary Data Collection Method: Primary data collection method is very useful for the
case study of perceived risk and brand equity comparing in Tesco and Asda because it
can provide the present situation of perceived risk and brand equity in the companies. It
is also called as first hand data but it is less reliable than secondary sources because it is
not approved or published somewhere else before (Saunders et al, 2009). Primary data
can help to gather information about the spruces of perceived risk a as well as the
process of ensuring brand equity. Primary data has been collected by conducting a survey
on a sample of 72 customers of Tesco and ASDA (34 from Tesco and 38 from ASDA).
Data Collection Tools: The discussion of particular data collection tools is required for
successful methodology of this case study. Primary data can be collected by
questionnaire survey and qualitative interviewing process. Structured type of interview is
applied in this study to gather qualitative data relevant with perceived risk and brand
equity. On the other hand, seminar paper and books, websites and online articles, online
data base, newspaper, books, printed articles or any kind of written material relevant with
the aim and objectives of the case study are considered as tools of secondary data
(Fisher, 2007).
3.6 Sampling Method and Sample SizeSamples are required to participate in the primary data collection process. These samples
will share their views and opinions regarding the issues of perceived risk and brand
equity of Tesco as well as Asda. So, researcher needs to be sincere about choosing
samples of the study. Random sampling method is applied to choose total 72 respondents
for the data collection process. After collecting data 60 respondent’s feedbacks were used
in the final analysis.
19
3.7 Data Analysis Method and Data InterpretationThe collected data were analysed by using different statistical tools. This study employed
different descriptive statistics, figures and tables for analyzing the data. Moreover,
Pearson’s correlation matrix has been used to explore the relationship between brand
equity factors and customer’s perceived risk. Data interpretation has been supported by
the use of MS Excel application.
3.8 Ethical ConsiderationsHonesty and the truthfulness of the researcher is the basic ethical issue of the case study.
Some other ethical issues for the methodology need to be ensured such as protection of
the respondents from both physical and mental injury, prevention of frauds, privacy and
confidentiality as well as consent of information (Saunders et al, 2009). The selected
companies also provide authorisation for conducting the case study. All the information
will be kept secret so that there can be no misuse of the data.
3.9 Limitation of Methodology Lack of funds and resource may hinder the process of methodology in this study Lack of time management and improper method of data collection can hamper
the attainment of the aim and objectives Unskilled researcher is always a negative impact of the research Lack of attention from both researcher and participants Violation of ethical issues Lack of attention from the selected companies (Denscombe, 2007)
3.10 SummaryThis chapter contain valuable segments of conducting the case study. The discussion of
research design is important through the analysis of research onion. Research philosophy
and research approaches are also exp0lained here. Important research methods and data
collection procedures are also described here. Data analysis method and tools of
presenting data and collecting data are expressed here. Some necessary ethical issues of
methodology and limitations are also discussed in this chapter.

20
Chapter 4: Results
4 ResultsThe main purpose of this study to explore the relationship between perceived risk and
brand equity of the UK retailing companies by taking the case study of TESCO and
ASDA. Brand equity is a comprehensive measurement of the value of a brand in the
market. A company with high brand equity has high customer loyalty that results in
higher level of profitability. But perceived risks of customers affect customer satisfaction
and loyalty. Literature shows that the perceived risk of customers can be reduced by
building strong brand equity through using marketing tools. This chapter presents the
outcomes of the statistical analysis conducted for exploring the association between
brand equity and customers’ perception of risk.
4.1 Demographic Data:Table 4-1 summarizes the demographic characteristics of the participants in the survey.
The survey was conducted on total 72 respondents (34 from Tesco and 38 from ASDA).
But after screening the responses at last 60 questionnaire were used for final analysis.
The demographic data below shows 42% of the respondents are male and 58% are
female. The age of the respondents shows only 5% respondents are below 18 and only
8% are above 60. The rest 87% of the respondents are between 18 years to 59 years. The
marital status of the participants indicates 65% of the respondents are married and rest
35% is unmarried. The educational qualifications of the participants’ show only 27% of
the respondents do not have higher degree (10% secondary, 17% diploma). The rest 73%
of the participants have higher degree. The employment variable indicates about 78% of
the participants are employed (part time or full time). The rest of the participants are
either student or unemployed or housewife or retired persons. The income variable
demonstrates that about 25% of the respondents have income level below £20000. About
49% of the respondents have higher level of income (more than £30000).
Table 4-1: Demographic Variables of the respondents
Frequency Percent
GenderMale 25 42%Female 35 58%Total 60 100%

21
AgeBelow 18 3 5%18- 30 15 25%31- 39 18 30%40- 49 13 22%50- 59 6 10%Over 60 5 8%Total 60 100%
Marital StatusMarried 39 65%Unmarried 21 35%Total 60 100%
EducationSecondary 6 10%Diploma 10 17%Bachelor Degree 24 40%Masters 16 27%PHD 4 7%Total 60 100%
Employment Status
Full-time 38 63%Part-time 9 15%Student 5 8%Unemployed 2 3%Housewife/husband 3 5%Retired 3 5%Total 60 100%
IncomeBelow £10000 5 8%
£10000- £20000 10 17%£20001- £30000 16 27%£30001- £40000 12 20%£40001- £50000 10 17%Above £50000 7 12%Total 60 100%
22
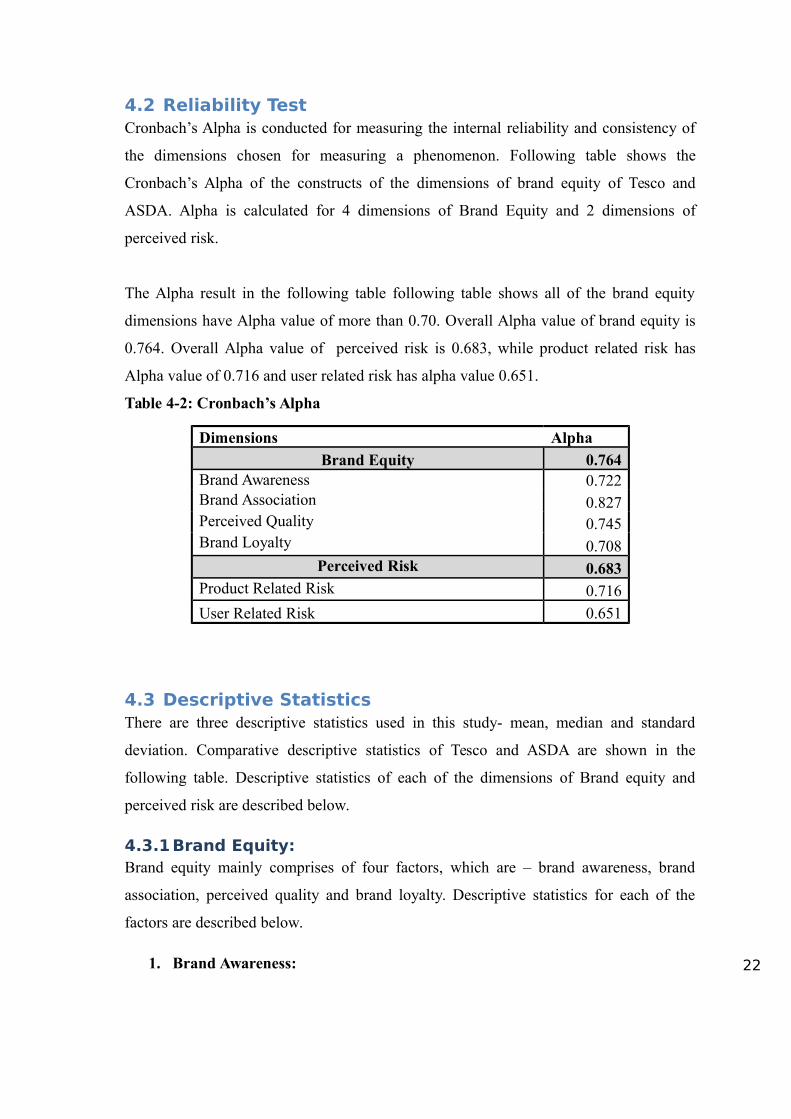
4.2 Reliability TestCronbach’s Alpha is conducted for measuring the internal reliability and consistency of
the dimensions chosen for measuring a phenomenon. Following table shows the
Cronbach’s Alpha of the constructs of the dimensions of brand equity of Tesco and
ASDA. Alpha is calculated for 4 dimensions of Brand Equity and 2 dimensions of
perceived risk.
The Alpha result in the following table following table shows all of the brand equity
dimensions have Alpha value of more than 0.70. Overall Alpha value of brand equity is
0.764. Overall Alpha value of perceived risk is 0.683, while product related risk has
Alpha value of 0.716 and user related risk has alpha value 0.651.
Table 4-2: Cronbach’s Alpha
Dimensions Alpha
Brand Equity 0.764Brand Awareness 0.722Brand Association 0.827Perceived Quality 0.745Brand Loyalty 0.708
Perceived Risk 0.683Product Related Risk 0.716
User Related Risk 0.651
4.3 Descriptive StatisticsThere are three descriptive statistics used in this study- mean, median and standard
deviation. Comparative descriptive statistics of Tesco and ASDA are shown in the
following table. Descriptive statistics of each of the dimensions of Brand equity and
perceived risk are described below.
4.3.1Brand Equity:Brand equity mainly comprises of four factors, which are – brand awareness, brand
association, perceived quality and brand loyalty. Descriptive statistics for each of the
factors are described below.
1. Brand Awareness:

23
The descriptive statistics for brand awareness dimension shows overall brand awareness
score for Tesco is 5.67 and overall brand awareness score for ASDA is 5.32. The median
for Tesco’s brand awareness is 5.5 and for ASDA is 5. From the breakdown of the brand
awareness score it is found that highest score is for the question whether this brand is
known to the respondent. Tesco customers has given a higher score (6.25) whereas
ASDA customers given an average score of 5.80.
2. Brand association:
The overall brand association score of Tesco is 5.35 while the average brand association
score for ASDA is 5.20. The median for both of the firms’ brand association score is 5.
Under brand association the output demonstrates that the mean score given by
respondents for the uniqueness of the brand image (Question BE05) of Tesco is 6.37 and
of ASDA is 5.93. The mean score for the question whether customers have trust on the
company (Question BE06) exhibits Tesco achieved trust score of 5.52 and ASDA
achieved a trust score of 5.11. Other brand association factors such as preference of
brand image, identification of brand among other brands and feeling regarding the brand
shows mean score of 5.34, 4.86 and 4.67 for Tesco and 5.48, 4.77 and 4.71 for ASDA.
3. Perceived Quality:
The perceived quality score in the table 4-3 exhibits the mean perceived quality score for
Tesco is 5.30 and for ASDA is 5.11. The median score is 6 for Tesco and 5.5 for ASDA.
The deeper analysis of the perceived quality shows that the functionality score for Tesco
products (question BE10) is 5.66 while functionality score for ASDA products is 5.04.
Another question regarding suitability of product to the customers (Question BE11)
explored the mean scores for Tesco and ASDA are 5.52 and 5.63. Another important
question was whether product of the both retailers last long. The output shows a mean
score of 4.75 and 4.61 for Tesco and ASDA.
4. Brand Loyalty:
Brand loyalty is the most valuable factor of brand equity. Table 4-3 below demonstrates
average brand loyalty score of Tesco 5.15 and for ASDA is 4.98. Under brand loyalty it
was asked whether customers’ purchase goods frequently. The mean score for Tesco is
found 4.73 and for ASDA is 4.84. A question was also asked about the use of loyalty
program. The output shows a mean score of 5.88 for Tesco and 5.26 for ASDA.

24
Preference of their retailing brand over other brands and recommendation intension of
this retailer yielded the average scores for Tesco as 4.97 and 5.28 and for ASDA as 5.02
and 4.72.
4.3.2Perceived Risk:Customers’ perceptions of Risk were divided into two dimensions-product related
perceived risk and user related perceived risk.
1. Product Related Perceived Risk:
The four components of product related perceived risk are- Financial risk, physical risk,
performance risk and time risk. The lower the score of risk, the lower is the level of
perceived risk by the customers.
The financial risk factor illustrates the mean financial risk score for Tesco customers is
3.25 and for ASDA customers is 3.44. The average physical risk factor for Tesco
customers is 2.87 and for ASDA customers is 2.61. The mean performance risk score for
Tesco customers is 4.22 and for ASDA customers is 4.15. The time risk factor shows that
the average score for Tesco customers is 4.43 and for ASDA customers is 4.12. The
overall product related risk factor of Tesco Customers achieved a score of 3.69 and
ASDA customers achieved 3.58.
2. User Related Perceived Risk:
Among the user related perceived risk social risk has scored 4.01 by Tesco customers
and 4.10 by ASDA customers. Psychological risk has been given the score of 3.56 by
Tesco Customers and 3.63 by ASDA customers.
25
Table 4-3: Comparative Descriptive Statistics of Brand equity and Customers’ Perceived risk of TESCO and ASDA
TESCO ASDACoding of Questions
Mean MedianStd. Deviation Mean Median
Std. Deviation
Brand Equity Dimensions1. Brand awareness 5.67 5.5 0.9915 5.32 5 1.0520BE01 This Brand is known to me 6.25 6 0.9538 5.8 6 1.0361BE02 I can remember this brand before other brands. 5.71 6 1.1736 5.4 5 1.2453997BE03 I am aware of this brand. 5.52 5 0.9253 4.97 5 0.9684BE04 This brand is well reputed. 5.2 5 0.9131 5.1 5 0.9582
2. Brand association 5.352 5 0.8868 5.2 5 0.9154BE05 Brand image of this brand is unique. 6.37 6 1.2447 5.93 6 1.0859BE06 I have trust on this brand. 5.52 6 0.9089 5.11 6 0.9416BE07 I prefer the brand image of this retailer. 5.34 5 0.7559 5.48 5 0.8135BE08 I can identify the product of this brand among other brands 4.86 5 0.9444 4.77 5 1.0553BE09 I feel nice when see the products or news of this retailer. 4.67 5 0.5802 4.71 5 0.6807
3. Perceived quality 5.3 6 0.9411 5.11 5.5 0.9248BE10 The products of this retailer are very functional 5.66 6 1.2442 5.04 5 1.1434BE11 Product of this retailer suits me well. 5.52 6 0.9087 5.63 6 0.9589BE12 I have trust in the product quality of this retailer 5.71 6 0.7551 5.57 6 0.7128BE13 Product of this brand lasts long. 4.75 5 0.9443 4.61 5 0.8235BE14 The products of this retailer provide value for money 4.86 5 0.8533 4.7 5.5 0.9854

26
4. Brand loyalty 5.15 5 1.1123 4.98 5 1.1684BE15 I purchase goods from this retailer repeatedly 4.73 5 1.2428 4.84 5 0.9816BE16 This brand is my best choice. 5.13 5 1.1573 4.88 5 1.2199BE17 I use loyalty program of this retailer rigorously 5.88 5 1.0736 5.26 5 1.1507BE18 When this brand is available I will not buy other brand. 4.91 5 1.1041 5.15 5 1.2255BE19 I prefer this retailer over all other retailers 4.97 5 1.1948 5.02 5 1.1152BE20 I would recommend this retailer to others 5.28 5 0.9011 4.72 4 1.3175
Perceived Risk (PR)1. Product Related Risk 3.69 3.5 1.0957 3.58 3.5 1.0887
Financial Risk 3.25 3 1.0923 3.44 3 1.0231Physical Risk 2.87 3 1.1257 2.61 3 1.1755Performance Risk 4.22 4 1.1063 4.15 4 1.0656Time Risk 4.43 4 1.0586 4.12 4 1.0905
2. User Related Perceived Risks 3.79 3.5 0.9949 3.88 4 0.9067Social Risk 4.01 4 0.9746 4.1 4 0.9319
Psychological Risk 3.56 3 1.0152 3.63 4 0.8814

27
4.3.3Comparison between Tesco and ASDA:The figure 4-1 illustrates the comparison between customers’ perceived brand equity of
Tesco and ASDA. The figure shows the highest score is given by customers to brand
awareness and lowest score is to brand loyalty. In all four factors Tesco’s scores are higher
than those of ASDA’s score.
Figure 4-4: Comparison between perceived brand equity of Tesco and ASDA.
The figure 4-2 depicts the comparison of perceived risk of Tesco and ASDA. The figure
shows a higher product related perceived risk for Tesco’s customers and lower product
related perceived risk for ASDA customers. But in case of user related perceived risk Tesco
customers’ have a lower score than those of ASDA.
Figure 4-5: : Comparison of perceived risk score for Tesco and ASDA.

28
4.3.4Pearson’s Correlation:In this study Pearson’s Correlation was measured for exploring the relationship nature
between perceived risk and brand equity for Tesco and ASDA.
Pearson’s Correlation for TESCO:
Table 4-4 in this chapter exhibits the correlation coefficients of Brand equity and perceived
risk. The table shows a negative but significant correlation between brand equity and
perceived risk. Overall perceived risk correlation coefficient with over all brand equity is
-0.394 which is significant at 5% level.
Table 4-4: Pearson’s correlation matrix for Tesco
1 2 3 4 5 6 7 81 Brand Awareness 12 Brand Association 0.861*** 13 Perceived Quality 0.748** 0.651** 14 Brand Loyalty 0.635* 0.586** 0.883*** 15 Brand Equity 0.914*** 0.892*** 0.927*** 0.905*** 1
6
Product Related Risk
-0.275* -0.236* -0.429** -0.483**
-0.346
** 1
7 User Related Risk -0.327** -0.358* -0.363* -0.415**
-0.381
**0.897
*** 1
8
Perceived Risk
-0.314** -0.288* -0.402** -0.447**
-0.394
** 0.942*** 0.918*** 1Pearson Correlation Matrix for ASDA
The Pearson’s correlation for ASDA has also shown a similar result like Tesco. The
correlation coefficient for overall perceived risk shows a negative association between
perceived risk and brand equity of ASDA. The correlation coefficient score is -0.454 which
is significant at 5% level.

29
Table 4-5: Pearson Correlation for ASDA
1 2 3 4 5 6 7 81 Brand Awareness 1
2Brand Association
0.885*** 1
3Perceived Quality
0.723*** 0.676** 1
4Brand Loyalty 0.594* 0.607** 0.778** 1
5 Brand Equity0.953*** 0.921*** 0.944*** 0.928*** 1
6
Product Related Risk -0.263* -0.247* -0.396** -0.495**
-0.384** 1
7User Related Risk
-0.327* -0.364* -0.411**
-0.437
***-
0.442** -0.897** 1
8
Perceived Risk-0.338* -0.341* -0.412** -0.454**
-0.419** 0.933*** 0.969*** 1
4.3.5Regression analysisThrough the regression analysis the researcher measured the extent of the relationship
between customers’ perceived risk and brand equity. Total four regression models were run.
The first two model outputs are presented below.
4.3.5.1 Effect of Brand Equity of TESCO on its customers’ perceived riskThe coefficient table shows both products related perceived risk and user related perceived
risk is negatively influenced by brand equity in case of Tesco. The regression coefficient for
product related risk is -0.537 and user related risk is -0.469. The brand equity coefficient in
case of product related risk is significant at 5% level and the brand equity coefficient in case
of customer related risk is significant at 10% level.

30
Table 4-6: Regression results for measuring effect of brand equity on customer's perceived risk
Dependent Variable: Customers’ Perceived Risk
Model
Coefficients
ProductRelated Risk
customerRelated Risk
(Constant) 1.437 1.662
Brand Equity -0.537** -0.469*
R-Squared =0.362*Significant at 10% level **Significant at 5% level
4.3.5.2 Effect of Brand Equity of ASDA on its customers’ perceived riskThe coefficient table shows both products related perceived risk and user related perceived
risk is negatively influenced by brand equity in case of ASDA. The regression coefficient for
product related risk is -0.431 and user related risk is -0.477. The brand equity coefficient in
case of product related risk is significant at 10% level and the brand equity coefficient in
case of customer related risk is significant at 5% level.
Table 4-7: Regression results
Dependent Variable: Customers’ Perceived Risk
Model
Coefficients
ProductRelated Risk
customerRelated Risk
(Constant) 1.682 1.519
Brand Equity -.431* -0.477***
R-Squared =0.328*Significant at 10% level ***Significant at 1% level
Conclusion:
This chapter presented the results of the statistical analysis of the primary data. The data
were compiled by using MS Excel 2007 and analyzed by using SPSS 16.0. As the
implications of the output have not discussed in this chapter following chapter states the
critical analysis of the results and the implications of outputs.

31
Chapter 5: Analysis and Discussion
5 Analysis and DiscussionThis chapter comprises the critical analysis and discussion of the results presented in the
previous chapter. The discussion of findings is based on the literature available in chapter
two. This chapter also provides the conclusions, recommendations and suggested areas for
further study. The findings are discussed in terms of the research objectives in relation to
literature in chapter two.
5.1 Analysis and Discussion of ResultsFrom the demographic data of the study it is found that most of the respondents are between
the ages of 18 to 59. So, this can be said that these customers are able to answer the survey
question better way than others. The education level of 73% respondents is higher than
diploma level. Most of the respondents are employed (about 78%) and having good income
level. All of the demographic characteristics of the respondents indicate a good choice of the
sample. So, the findings of the study are more reliable.
Further analysis of the reliability was done by calculating Cronbach’s Alpha. The Alpha
scores show that all of the brand equity dimensions are consistent and reliable as they have
Alpha’s of more than 0.7. Other constructs are also reliable as Alpha of more than 0.60 is
acceptable.
From the descriptive statistics it is found that overall brand awareness of Tesco customers is
higher than that of ASDA customers. The mean brand awareness score of Tesco indicates
most customers are fully aware of this brand. They can remember this brand before other
brands and they know this brand is well reputed. The customers of ASDA showed a
somewhat worse brand awareness than the customers of in terms of knowing the brand,
remembering the brand over other brands and regarding the perception of the reputation of
the brand.
In case of brand association the difference between brand association of Tesco’s and ASDA’s
customers was explored. The customers of Tesco have higher level of brand association than
that of ASDA’s customers. Most of the customers think that brand image of Tesco is more

32
unique than that of ASDA. Tesco’s customers have more trust on Tesco than that of ASDA
although both of companies’ customers showed positive feedback regarding trust on the
brands. The customers of both of the retailers showed slightly positive replies regarding the
identification of the brand among other brands and all the customers of both retailers said
that they feel nice when they see the brand news of their respective retailers.
The perceived quality of Tesco’s brand and products are slightly better than that of ASDA. It
is found that the products of Tesco are more functional than those of ASDA. The products of
Tesco are found more durability than those of ASDA according to customers’ opinion. But
the overall perceived quality of both of the Brand is good.
The brand loyalty factor of overall brand equity implies that the brand loyalty of both of the
retailers is somewhat satisfactory although the loyalty of Tesco’s customers is slightly higher
than that of ASDA’s customers. Although the overall brand loyalty score of Tesco is higher it
is found that ASDA’s customers buy more frequently that those of Tesco’s customers. It is
found that the loyalty program such as Clubcard is more popular among Tesco’s customers
than ASDA’s customers. This is because Tesco manages its loyalty program more efficiently
and provides very lucrative offers for customers than ASDA.
From the overall comparison of the brand equity of both Tesco and ASDA it is found that the
brand equity of Tesco is higher than that of ASDA.
The perceived risk analysis of the customers of both of the companies indicates that product
related perceived risk of Tesco’s customers is higher than that of ASDA’s customers. Tesco’s
customers feel greater performance risk and time risk in case of purchasing products
comparing to the customers of ASDA.
On the other hand user related perceived risk is higher for ASDA than that of Tesco. ASDA’s
customers feel more that they would be humiliated by Keith and keen by buying goods from
ASDA. Tesco’s customers also feel this but at a lower degree. Tesco’s customers are
psychologically happier than those of ASDA’s customers because perceived psychological
risk of Tesco’s customers is lower than that of ASDA’s customers.

33
5.2 Analysis and discussion based on Objectives:Relationship between perceived risk and brand equity in Tesco and ASDA
The Pearson correlation indicates a negative relationship between perceived risk and brand
equity in case of both Tesco and ASDA. This implies that if brand equity of both of the
companies can be enhanced by using different marketing tools such as advertising,
promotion, good pricing, superior brand construction and superior marketing strategy the
perceived risk of the customers can reduced. Perceived risk ultimately affects the buying
behaviour of the customers and customer loyalty. So,by reducing product related perceived
risk a better customer loyalty can be created.
The regression analysis explored the extent of effect of brand equity on customers’ perceived
risk. It is found that brand equity is negatively associated with the both product related and
user/customer specific perceived risk of Tesco’s customers. The regression co-efficient
indicates if brand equity is enhanced by 1% then product related perceived risk can be
reduced by 0.537% and user related perceived If brand equity can be improved by 1% then
customer specific risk can be reduced by 0.469%. In case of ASDA both the product specific
perceived risk and customer specific perceived risk can be reduced by managing brand
equity properly. This implies that if product quality can be improved, competitive prices can
be charged, brand value can improved by using superior technology then customers’
perceived risk can be reduced in much extent.
The studies of Chaudhuri, (1997), Mercer et al, (2005), Rogers (2008), and Slovic, (2010)
found the negative association between perceived risk and brand equity, although they
studied the effect of perceived risk on brand equity. As a countervailing effect brand equity
should also have negative impact on perceived risk of customers. This study proved this
hypothesis.
5.3 Summary:This chapter conducted the discussion and critical analysis of the finding of the study.
Through the discussion it is found that Brand equity affects the perceived risk negatively. If
brand equity can be improved than customers’ perceived risk can be reduced and ultimately
customer satisfaction and loyalty can be enhanced which will lead both Tesco and ASDA to
long term profitability

34
Chapter 6: Conclusion and Recommendation
6 Conclusion and RecommendationThe previous chapter discussed about results found from analysis of primary data collected
through questionnaire survey conducted on a sample of Tesco and ASDA customers. The
analysis showed customers’ responses regarding different aspects of Brand Equity of both
the companies and the perceived risk of the customers. Customers’ perceived risk were
divided into product related perceived risk and person/customer related perceived risk. It
was studied whether brand equity has any impact on these risk perception of customers.
After conducting the analysis in the above chapter, this chapter has made the summarization
of the analysis, the conclusion and the recommendation for Tesco and ASDA based on
findings and conclusion. Moreover, the scope of future studies and limitations of the study
have also been discussed in this chapter.
6.1 Conclusion:The main objective of this research was to identify the nature and extent of relationship
between perceived risk and brand equity. For conducting this research a structured
questionnaire was developed. The data were collected by conducting survey on customers of
both Tesco and ASDA. For measuring the relationship between brand equity and perceived
risk brand equity is measured based on customers’ ranking of different aspects of brand
equity. The perceived risk also explored by the opinion of customers. From the study it can
be said Tesco has superior brand equity than that of ASDA. But the customers of Tesco feel
more risk in the products of Tesco than the customers of ASDA. The reason behind this
should be explored by Tesco. Different statistical analysis such as Pearson’s correlation and
regression analysis found negative association between customers’ perceived risk and brand
equity. If brand equity can be improved than customers’ perceived risk can be reduced and
ultimately customer satisfaction and loyalty can be enhanced which will lead both Tesco and
ASDA to long term profitability
6.2 Recommendations:As this research identified some weaknesses in brand equity management system of both
Tesco and ASDA, some recommendations can be made for these companies. The
recommendations are pointed out below:

35
Tesco should improve its customer contact system i.e. it should design its
promotional activities more practically to increase the effectiveness of its
promotional activities. Besides this Tesco should also improve the services in its
customer touch points so that customers use its customer interfaces for taking a
purchase decision. The company should improve its e-mail system for more customization of e-mail
promotions so that such promotions create necessity of products in customers mind. Another problem was identified for Tesco’s brand equity, which is regarding the
transaction processing cost through online. Tesco should care about it and reduce
customers’ transaction costs by contracting with online payment gateways with
favourable terms. ASDA should more focus on improving brand awareness and brand loyalty. The
brand of ASDA is not as strong as that of Tesco. So, by superior branding and brand
management ASDA should improve its condition The customers of Tesco perceive more performance and time risk in comparison to
ASDA’s customers. Tesco should improve the quality of product so that customers
don’t fear about the performance and time waste for repairing the product. Tesco’s and ASDA’s online customer service system should be improved as it is
found that most of the time the real time chat boxes remain busy. Moreover, online
queries should be answered quickly. Servicing of products purchased through online should be made easy.
6.3 Limitations and Scope for Future Research:The results of this study are somewhat limited by two reasons. The main limitation of this
study is the sample size. This study was conducted only on 60 respondents, 30 from each of
the companies, due to time and resource limitation. However, if sample size could be
enhanced then this study would give a better result. Moreover, this study could include other
qualitative factors that affect the buying behaviour of customers.
Although some conclusions are achieved in this study, there are still rooms leave to be
explored. First, effects of brand equity and perceived risk on brand loyalty are not confirmed
in this product category. This notion should be investigated across product categories to be
generalized.

36
Besides, satisfaction toward a brand may contain not only product related attributes, but also
service such as maintenance or warranty provided, especially for the durable. It can be
extended wider to include those invisible attributes as a whole construct when measuring
customer satisfaction.
Sizable literature indicates that loyalty is a multidimensional construct. Aaker (1996)
suggests that loyalty represents a barrier to entry, a basis for a price premium, time to
respond to competitor innovations, and a bulwark against deleterious price competition. In
this study, some questions related to re-purchase intention and word referrals are asked in
questionnaire survey, but these items are not extracted into independent factors. Researchers
may apply other measurement scales to capture more loyalty facets and investigate the
interrelationship in the conceptual model.
References1. Apgar, D., 2006. Risk Intelligence: Learning to Manage WhatWe Don’t Know,
Harvard University Press, Boston, MA.2. Atilgan, E., Aksoy, S. and Akinci, S., 2005. Determinants of the brand equity. A
verification approach in the beverage industry in Turkey, Marketing Intelligence
and Planning, Vol. 23 No. 3, pp. 237-48.

37
3. Bloemer, J. and Ruyter, K.D., 2008. On the relationship between Store Image, Store
Satisfaction and Store Loyalty, European Journal of Marketing, 32(5/6), 499-513.4. Böhm, G., 2001. Environmental Risks: Perception, Evaluation and Management.
JAI.5. Bravo, R., Fraj, E. and Martı´nez, E., 2007. Family as a source of consumer-based
brand equity, Journal of Product and Brand Management, Vol. 16 No. 3, pp. 188-99.6. Broyles, S.A., Schumann, D.W. and Leingpibul, T., 2009. Examining brand equity
antecedent/consequence relationships, The Journal of Marketing Theory and
Practice, Vol. 17 No. 2, pp. 145-61.7. Broyles, S.A., Leingpibul, T., Ross, R.H. and Foster, B.M., 2010. Brand equity’s
antecedent/consequence relationships in cross-cultural settings, Journal of Product
and Brand Management, Vol. 19 No. 3, pp. 159-69.8. Buil, I., de Chernatony, L. and Martı´nez, E., 2008. A cross-national validation of
the consumer-based brand equity scale, Journal of Product and Brand Management,
Vol. 17 No. 6, pp. 384-92.9. Chen, K.J., 2001. Using free association to examine the relationship between the
characteristics of brand associations and brand equity, The Journal of Product and
Brand Management, Vol. 10 No. 7, pp. 439-51.10. Christodoulides, G. and de Chernatony, L., 2010. Consumer-based brand equity
conceptualisation and measurement, International Journal of Market Research, Vol.
52 No. 1, pp. 43-66.11. Creswell, J.W., 2007. Research Design: Qualitative, Quantitative and Mixed
Methods Approach, Thousand Oak, Sage Publication, California. 12. Crossan, F., 2003. Research philosophy Towards an understanding, Nurse
Researcher, vol 11, no. 1, pp. 46-5513. De Zoysa, S. and Russell, A.D., 2003. Knowledge-based risk identification in
infrastructure projects, Canadian Journal of Civil Engineering, Vol. 30 No. 3, pp.
511-22.14. Dean, D.H., 2004. Evaluating potential brand associations through conjoint analysis
and market simulation, Journal of Product and Brand Management, Vol. 13 No. 7,
pp. 506-13.
15. Denscombe, M., 2007. The good research guide: for small-scale social research
projects (3rd Edn.), McGraw-Hill International.
16. Emblemsvag, J. and Kjolstad, L.E., 2002, Strategic risk analysis – a field version’,
Management Decision, Vol. 40 No. 9, pp. 842-53.

38
17. Erdem, T., Swait, J. and Valenzuela, A., 2006. Brand as signals: a cross-country
validation study, Journal of Marketing, Vol. 70, January, pp. 34-49.18. Fisher, C., 2007. Researching and Writing a Dissertation for Business Students (2nd
Edn). 19. Hoeffler, S. and Keller, K.K., 2003. The marketing advantages of strong brands,
Brand Management, Vol. 10 No. 6, pp. 421-45.20. Hsieh, M.H., 2004. Measuring global brand equity using cross-national survey data,
Journal of International Marketing, Vol. 12 No. 2, pp. 28-57.21. Jung, J. and Sung, E.-Y., 2008. Consumer-based brand equity: comparisons among
Americans and South Koreans in the USA and South Koreans in Korea, Journal of
Fashion Marketing and Management, Vol. 12 No. 1, pp. 24-35.22. Keller, K.L., 2003. Strategic Brand Management: Building, Measuring, and
Managing Brand Equity, 2nd ed., Prentice Hall, New York, NY.23. Keller, K.L. and Lehmann, D.R., 2006. Brands and branding: research findings and
future priorities, Marketing Science, Vol. 25 No. 6, pp. 740-59.24. Kim, H., Kim, W.G. and An, J.A., 2003. The effect of consumer-based brand equity
on firms’ financial performance, Journal of Consumer Marketing, Vol. 20 No. 4, pp.
335-51.25. Konecnik, M. and Gartner, W.C., 2007. Customer-based brand equity for a
destination, Annals of Tourism Research, Vol. 34 No. 2, pp. 400-21.26. Kotler, P., 2008. Principles of Marketing, 5th Ed, London: Pearson Education
Limited.27. Kumar and Ranjit, 2005. Research Methodology-A Step-by-step guide for Beginners
(2nd Edn), Singapore, Pearson Education28. Lavino, J.G. and Neumann, R.B., 2010. Psychology of Risk Perception. Nova
Science Publishers, Incorporated29. Lee, J.-S. And Back, K.-J., 2010. Re-examination of attendee-based brand equity,
Tourism Management, Vol. 31, pp. 395-401.30. Leone, R.P., Rao, V.R., Keller, K.L., Luo, A.M., McAlister, L. and Srivastava, R.,
2006. Linking brand equity to customer equity, Journal of Service Research, Vol. 9
No. 2, pp. 125-38.31. Liesch, P., Steen, J., Knight, G. and Czinkota, M.R., 2006. Problematizing the
internationalization decision: terrorism-induced risk, Management Decision, Vol. 44
No. 6, pp. 809-26.32. Mackay, M.M., 2001. Evaluation of brand equity measures: further empirical
results, Journal of Product and Brand Management, Vol. 10 No. 1, pp. 38-51.

39
33. Malhotra and Dash, 2011. Marketing Research (6th Edn.), Dorling Kindersley, India.
34. Martınez, E. and Pina, J.M., 2009. Modeling the brand extensions’ influence on
brand image, Journal of Business Research, Vol. 62 No. 1, pp. 50-60.35. Mercer, D., Leschine, T., Drew, C.H., Griffith, W. and Nyerges, T., 2005. Public
agencies and environmental risk: organizing knowledge in a democratic context,
Journal of KnowledgeManagement, Vol. 9 No. 2, pp. 129-48.36. Milberg, S.J. and Sinn, F., 2008. Vulnerability of global brands to negative feedback
effects, Journal of Business Research, Vol. 61, pp. 684-90.37. Neef, D., 2005. Managing corporate risk through better knowledge management,
The Learning Organization, Vol. 12 No. 2, pp. 112-24.38. Netemeyer, R., Krishnan, B., Pullig, C., Wang, G., Yagci, M., Dean, D., Ricks, J.
and Wirth, F., 2004. Developing and validating measures of facets of customer-
based brand equity, Journal of Business Research, Vol. 57, pp. 209-24.39. Neuman, W.L., 2009. Social Research Methods: Qualitative and Quantitative
Approaches, London, Pearson.40. Otterson, S., 2005. Transferring catastrophe risk management knowledge, Risk
Management, Vol. 52 No. 5, p. 46.41. Pappu, R., Quester, P.G. and Cooksey, R.W., 2005. Consumer-based brand equity:
improving the measurement. Empirical evidence, Journal of Product and Brand
Management, Vol. 14 No. 3, pp. 143-54.42. Pike, S., Bianchi, C., Kerr, G. and Patti, C., 2010. Consumer-based brand equity for
Australia as a long haul tourism destination in an emerging market, International
Marketing Review, Vol. 27 No. 4, pp. 434-49.43. Renn, O. and Rohrmann, B., 2000. Cross-Cultural Risk Perception: A Survey of
Empirical Studies. Springer44. Ricciardi, V., 2004. A Risk Perception Primer: A Narrative Research Review of the
Risk Perception Literature in Behavioral Accounting and Behavioral Finance,
Golden Gate University. NY.45. Saunders, M., Lewis, P. and Thornhill, A., 2009. Research Methods for Business
Students (5th Ed), Pearson Education, Harlow46. Seitz, V., Razzouk, N. and Wells, D.M., 2010. The importance of brand equity on
purchasing consumer durables: an analysis of home air-conditioning systems,
Journal of Consumer Marketing, Vol. 27 No. 3, pp. 236-42.47. Slovic, P., 2010. The Feeling of Risk: New Perspectives on Risk Perception.
Earthscan Publications48. Slovic, P., 2000. The Perception of Risk. Earthscan Publication.

40
49. sparkideasnl.wordpress.com 2013. Brand Equity Model [ONLINE] Available at:
(http://sparkideasnl.wordpress.com/tag/brand-equity/) [Accessed on 25 August, 2013]50. tescoplc.com 2013. About Tesco Plc. [Online] Information available at:
(www.tescoplc.com/about-tesco/) [Accessed on 24 August 2013]51. Verhaegen, T., 2005. Knowledge makes risks manageable, Business Insurance:
Industry Focus, Vol. 3, pp. 16-17.52. Verhoef, P.C., 2003. Understanding the Effect of Customer Relationship
Management Efforts on Customer Retention and Customer Share Development.
Journal of Marketing, 6, 30-45.53. Walker, D., 2002. Research Connection: Building Brand Equity through
Advertising.IPSOS-ASI: The Advertising Research Company. Paper presented at the
ARF Week of Workshops on October 8, 2002.54. Wang, Y., Kandampully, J.A., Lo, H. and Shi, G., 2006. The roles of brand equity
and corporate reputation in CRM: a Chinese study, Corporate Reputation Review,
Vol. 9 No. 3, pp. 179-97.55. Washburn, J.H. and Plank, R.E., 2002. Measuring brand equity: an evaluation of a
consumer-based brand equity scale, Journal of Marketing Theory and Practice, Vol.
10 No. 1, pp. 46-62.56. Whitelock, J. and Fastoso, F., 2007. Understanding international branding: defining
the domain and reviewing the literature, International Marketing Review, Vol. 24
No. 3, pp. 252-70.57. Won, C.H., 2008. Relationship between Marketing mix strategy and consumer
motive: An empirical study in major Tesco stores, Unitar e-journal, vol-4, no-2.58. Yasin, N.M., Noor, M.N. and Mohamad, O., 2007. Does image of country-of-origin
matter to brand equity?, Journal of Product and Brand Management, Vol. 16 No. 1,
pp. 38-48.59. Yoo, B. and Donthu, N., 2001. Developing and validating multidimensional
consumer-based brand equity scale, Journal of Business Research, Vol. 52, pp. 1-14.60. your.asda.com 2013. Your Asda [ONLINE] Available at: (http://your.asda.com/news-
and-blogs) [Accessed on 25 August 2013]

41
Appendix:Questionnaire:
Dear respondent,
This study is about the relationship between customers’ perceived risk and brand equity bytaking the comparison of Tesco and ASDA. Perceived risk is the consumers’ perception ofthe uncertainty and potential adverse consequences of buying a product from Tesco orASDA. There are some questions regarding the perceived risk and brand equity for both ofthe companies.
You have been identified as a respondent and I therefore request you kindly that you spare afew minutes of your busy schedules to fill this questionnaire. The responses will beaggregated to the organizations and used for academic research. Your honest and sincereresponses are highly appreciated and shall be treated with utmost confidentiality.
Section A: Demographic Information
42
Section B: Brand Equity Measures (BE)
Here, 1= strongly disagree, 2 = disagree, 3 = somewhat disagree, 4 = neutral, 5 = somewhat
agree, 6 = agree, 7 = strongly agree
Dimensions Likert ScalesSection B1: Brand awareness BE01 This Brand is known to me 1 2 3 4 5 6 7BE02 I can remember this brand before other brands. 1 2 3 4 5 6 7BE03 I am aware of this brand. 1 2 3 4 5 6 7BE04 This brand is well reputed. 1 2 3 4 5 6 7
Section B2: Brand association BE05 Brand image of this brand is unique. 1 2 3 4 5 6 7BE06 I have trust on this brand. 1 2 3 4 5 6 7BE07 I prefer the brand image of this retailer. 1 2 3 4 5 6 7
43
BE08 I can identify the product of this brand among other
brands
1 2 3 4 5 6 7
BE09 I feel nice when see the products or news of this
retailer.
1 2 3 4 5 6 7
Section B3: Perceived quality BE10 The products of this retailer are very functional 1 2 3 4 5 6 7BE11 Product of this retailer suits me well. 1 2 3 4 5 6 7BE12 I have trust in the product quality of this retailer 1 2 3 4 5 6 7BE13 Product of this brand lasts long. 1 2 3 4 5 6 7BE14 The products of this retailer provide value for money 1 2 3 4 5 6 7Section B4: Brand loyalty BE15 I purchase goods from this retailer repeatedly 1 2 3 4 5 6 7BE16 This brand is my best choice. 1 2 3 4 5 6 7BE17 I use loyalty program of this retailer rigorouslyBE18 When this brand is available I will not buy other
brand.
1 2 3 4 5 6 7
BE19 I prefer this retailer over all other retailersBE20 I would recommend this retailer to others 1 2 3 4 5 6 7Section C: Perceived Risk (PR)
This section covers the questions regarding the risk you perceive regarding the purchase
and use of productSection C1: Product Related Risk
PR1 The products of this retailer will not provide best
economic gain to me (Financial Risk)
1 2 3 4 5 6 7
PR2 I will incur loss due to poor warranty and high
maintenance cost (Financial Risk)
1 2 3 4 5 6 7
PR3 Some products of this retailer are unsafe and would
become unsafe in any time (physical risk)
1 2 3 4 5 6 7
PR4 The products of this retailer will create health
hazard to me (physical risk)
1 2 3 4 5 6 7
PR5 The products of this retailer would perform poorly
(Performance)
1 2 3 4 5 6 7
PR6 The products from this retailer will not satisfy my
needs (performance risk)
1 2 3 4 5 6 7
PR7 The is a lot of risk that the products from this
retailer will have to be redone or repaired frequently
(Time Risk)
1 2 3 4 5 6 7
Section C2: User Related Perceived Risks

44
PR8 If I purchase products from this retailer I will be
humiliated by my friends (Social Risk)
1 2 3 4 5 6 7
PR9 If I purchase products from this retailer my
relatives, friends and neighbours would think less
highly of me (Social Risk)
1 2 3 4 5 6 7
PR10 The products of this retailer will not match my self-
image or my mental setting (psychological risk)
1 2 3 4 5 6 7
!!!Thank You for Your Co-operation!!!