Embed Size (px)
Citation preview
The Relationship between Job Quality and Customer Satisfaction in Customer Contact Centers of Pakistan
Authors: Ammar Arshad Khurram Shahzad
Supervisor: Kiflemariam Hamde
Student
Umeå School of Business and Economics
Autumn semester, 2012
Master thesis, two-year, 30 hp
i
Acknowledgement
We are obliged to all the persons who helped us in completing this project. Above of them, we
are highly thankful to the kindness and support of our supervisor Dr. Kiflemariam Hamde
throughout this research work. Without his support and guidance, we might not be able to
complete this project.
Specially, we would like to thanks Mr. Rai Asif Hussain (Executive Quality Assurance,
Ufone), Mr. Adnan Raza Baloch (Telenor) and Mr. Nadeem Ashraf (PTCL) for their
commendable support in data collection.
Further, we are also thankful to Andreas Nilsson (Director of Studies, USBE), Vladimir
Vanyushyn (Lecturer, USBE), and Mathias Lundin (Lecturer, Statistics, USBE) for their acute
assistance in constructing analysis. In the end, we are extremely indebted to our parents who
supported us in high and low spirits of life. Their relentless encouragement enabled us to
complete this project.
ii
Abstract
Most of the researchers have discussed the phenomenon of job quality from different
perspectives in Customer Contact Center. The current study has highlighted this issue by
investigating the relationships of job quality within the organization and the external world.
The literature of the study thoroughly discussed the issue in a symmetric way. Further, the
hypothesis has been developed on the basis of previous literature and theory.
By considering the both employees and customer’s perspective, a dyadic approach has been
selected. The primary data were collected with the help of two questionnaires. Three sample
companies have been selected from Telecom Industry of Pakistan.
Subsequently, the empirical data is presented and tested by using statistical software (SPSS).
Finally, the hypotheses have been verified by using statistical tools. In concluding, a positive
indirect relationship has been found among the variables of job quality and customer
satisfaction. The contribution to study along with further research has been conferred.
iii
Table of Contents Chapter 1: Introduction ........................................................................................................................... 1
1.1 Introduction ................................................................................................................................... 1
1.2 Research Background .................................................................................................................... 3
1.2.1 Job quality .............................................................................................................................. 3
1.2.2 Customer satisfaction ............................................................................................................. 4
1.3 Problem statement ......................................................................................................................... 4
1.4 Research purpose ........................................................................................................................... 5
1.5 Research question .......................................................................................................................... 5
1.6 Importance of Study ...................................................................................................................... 5
1.7 Limitations..................................................................................................................................... 6
1.8 Key Terms ..................................................................................................................................... 6
1.9 Disposition of Thesis ..................................................................................................................... 7
Chapter 2: Methodology .......................................................................................................................... 8
2.1 Pre-conceptions ............................................................................................................................. 8
2.2 Choice of Study ............................................................................................................................. 8
2.3 Research Paradigm ........................................................................................................................ 9
2.3.1 Ontological Assumptions ........................................................................................................ 9
2.3.2 Epistemological Assumptions .............................................................................................. 10
2.4 Research Approaches .................................................................................................................. 11
2.5 Research Strategy ........................................................................................................................ 11
2.6 Research Design .......................................................................................................................... 12
2.7 Questionnaire Developing ........................................................................................................... 12
2.8 Sampling Technique .................................................................................................................... 13
2.9 Sample Design ............................................................................................................................. 14
2.10 Company Selection .................................................................................................................... 15
2.10.1 Inbound call center ............................................................................................................. 15
2.10.2 Size of Call Center.............................................................................................................. 15
2.11 Variable Selection ...................................................................................................................... 15
2.12 Measurement ............................................................................................................................. 16
2.12.1 Pilot Study .......................................................................................................................... 17
2.13 Ethical Considerations ............................................................................................................... 17
2.14 Source criticism ......................................................................................................................... 17
Chapter 3: Theoretical framework ......................................................................................................... 19
3.1 Customer Contact Center (CCC) ................................................................................................. 19
3.2 Defining CCC .............................................................................................................................. 20
iv
3.2.1 Classification of CCC ........................................................................................................... 20
3.3 Job quality in CCC setting ........................................................................................................... 21
3.4 CCC job quality dimensions by Dun et al., (2012) ..................................................................... 27
3.5 Customer Satisfaction .................................................................................................................. 28
3.6 Theories and Models ................................................................................................................... 30
3.6.1 The Service Profit Chain theory ........................................................................................... 30
3.6.2 Relationships among SPC variables ..................................................................................... 31
3.7 Models ......................................................................................................................................... 33
3.8 Relationship between Job quality and Customer satisfaction ..................................................... 36
3.8.1 Hypothesis development ...................................................................................................... 36
Chapter 4: Empirical Findings............................................................................................................... 41
4.1 Selection of Questions ................................................................................................................. 41
4.2 Questionnaire 1 ............................................................................................................................ 41
4.2.1 Profile of the Respondents.................................................................................................... 41
4.2.2 Job Quality ........................................................................................................................... 42
4.2.3 Job Satisfaction ..................................................................................................................... 49
4.3 Questionnaire 2 ............................................................................................................................ 50
4.3.1 Profile of Respondents ......................................................................................................... 50
4.3.2 Service Quality ..................................................................................................................... 51
4.3.3 Customer Satisfaction ........................................................................................................... 52
Chapter 5: Analysis ............................................................................................................................... 54
5.1 Demographic Information ........................................................................................................... 54
5.2 Reliability Test ............................................................................................................................. 62
5.3 Hypothesis Results ...................................................................................................................... 63
5.3.1 Hypothesis 1 ......................................................................................................................... 63
5.3.2 Hypothesis 2 ......................................................................................................................... 63
5.3.3 Hypothesis 3 ......................................................................................................................... 64
5.3.4 Hypothesis 4 ......................................................................................................................... 65
5.3.5 Hypothesis 5 ......................................................................................................................... 66
5.4 Correlations ................................................................................................................................. 66
5.5 Discussion ................................................................................................................................... 67
5.6 Final Model ................................................................................................................................. 71
Chapter 6: Conclusion ........................................................................................................................... 72
6.1 Concluding Remarks ................................................................................................................... 72
6.2 Contribution................................................................................................................................. 73
6.3 Further Research .......................................................................................................................... 73
v
6.4 Quality Criteria ............................................................................................................................ 74
6.4.1 Reliability ............................................................................................................................. 74
6.4.2 Validity ................................................................................................................................. 74
References ............................................................................................................................................. 76
Journal Articles .................................................................................................................................. 76
Internet Sources ................................................................................................................................. 80
Appendix ............................................................................................................................................... 81
Appendix 1: Employees Questionnaire (1) ....................................................................................... 81
Appendix 2: Customers questionnaire (2) ......................................................................................... 95
Appendix 3: Employee Questionnaire Responses ............................................................................. 98
Appendix 4: Customers Questionnaire Responses .......................................................................... 115
vi
List of Figures
Figure 1: Deductive and Inductive Method ........................................................................................... 11
Figure 2: Outline of methodology ......................................................................................................... 18
Figure 3: The links in Service Profit Chain (Heskett et al., 1994, p. 166) ............................................ 31
Figure 4: Capacity to Satisfy customer Model (Sergeant & Frenkel, 2000, p. 21 ) .............................. 33
Figure 5: The conceptual model of employee perceived service quality (Mukherjee & Malhotra, 2006,
p. 452) .................................................................................................................................................... 34
Figure 6: Conceptual Model of Employee turnover (Van der aa et al., 2012, p. 3930) ......................... 35
Figure 7: Job quality and customer satisfaction proposed model .......................................................... 39
Figure 8: Outline of Theoretical Framework ......................................................................................... 40
Figure 9: Respondent’s profile .............................................................................................................. 42
Figure 10: Role ambiguity ..................................................................................................................... 42
Figure 11: Information sharing .............................................................................................................. 43
Figure 12: Role Conflict ........................................................................................................................ 44
Figure 13: supervisor and feedback ....................................................................................................... 44
Figure 14: Learning from customers ..................................................................................................... 45
Figure 15: Learning from employees .................................................................................................... 45
Figure 16: Opportunity and challenge ................................................................................................... 46
Figure 17: Enjoying the work ................................................................................................................ 47
Figure 18: Easy tooling ......................................................................................................................... 47
Figure 19: Empowerment ...................................................................................................................... 48
Figure 20: Integrity ................................................................................................................................ 48
Figure 21: Atmosphere .......................................................................................................................... 49
Figure 22: Job satisfaction ..................................................................................................................... 49
Figure 23: Service users ........................................................................................................................ 50
Figure 24: Qualification of customers ................................................................................................... 51
Figure 25: Interaction rate ..................................................................................................................... 51
Figure 26: Problem resolution ............................................................................................................... 52
Figure 27: Authority of employees ........................................................................................................ 52
Figure 28: Overall customer experience ................................................................................................ 53
Figure 29: Overall customer satisfaction ............................................................................................... 53
Figure 30: Service users chart ............................................................................................................... 55
Figure 31: Age group of customers ....................................................................................................... 56
Figure 32: Gender division of customers .............................................................................................. 57
Figure 33: Education chart of customers ............................................................................................... 58
Figure 34: Age group of CSR ................................................................................................................ 59
Figure 35: Gender division of CSR ....................................................................................................... 60
Figure 36: Education of CSR ................................................................................................................ 61
Figure 37: Work Experience of CSR ..................................................................................................... 62
Figure 38: Final generated model .......................................................................................................... 71
vii
List of Tables
Table 1: Research Strategy, Developed from: (David & Sutton, 2011, p. 95) ....................................... 12
Table 2: Projected CCCs, (Aksin et al., 2007, p. 666) ........................................................................... 19
Table 3: An overview Job Quality dimensions and CCC Job Quality Dimensions (Dun et al., 2012, p.
192). ....................................................................................................................................................... 26
Table 4: Information about Sample Companies .................................................................................... 54
Table 5: Customers ................................................................................................................................ 54
Table 6: Age (Customers) ...................................................................................................................... 55
Table 7: Gender (Customers) ................................................................................................................. 56
Table 8: Education (Customers) ............................................................................................................ 57
Table 9: Age (CCC Employees) ............................................................................................................ 58
Table 10: Gender (CCC Employees) ..................................................................................................... 59
Table 11: Education (CCC employees) ................................................................................................. 60
Table 12: Work Experience ................................................................................................................... 61
Table 13: Reliability Test ....................................................................................................................... 62
Table 14: Job quality and job satisfaction ............................................................................................. 63
Table 15: Job satisfaction and service quality ....................................................................................... 63
Table 16: Job satisfaction and customer satisfaction ............................................................................. 64
Table 17: Service quality and customer satisfaction ............................................................................. 65
Table 18: Correlations ........................................................................................................................... 66
1
Chapter 1: Introduction
This chapter is aimed to clarify the research topic with the help of research question
formulation. It starts with the comprehensive background of literature related to customer
contact centers, job satisfaction and customer satisfaction, the integral parts of our study. The
background eventually narrows down to problem identification and finally to the development
of research question. The importance of the selection of this particular area of research and
its limitations are discussed later on. The chapter ends with the comprehensive outline of the
whole thesis.
1.1 Introduction
Several innovations have been introduced in the sector of service industry, during the last
decade. One of them is the ‘Customer Contact Center’ (Call Center). The Customer Contact
Center (CCC) became a key instrument in managing the customer services. The different
service oriented firms like Banks and Insurance companies have been utilizing the CCC
widely to keep in touch with their customers. The CCC enables the contact between company
employee and customer over the phone. The advancement in telephone and computer
integrated technology; cheap cost and customer’s expediency have geared up the growth of
CCC (Sergeant & Frenkel, 2000, p. 18).
The importance of CCC is continuously growing with the increasing demands of
globalization. The emphasis is on two aspects of CCC, its role as a channel of interaction and
the source of the information associated to the customers. CCCs have progressively becoming
an important part of the service marketing. According to a study, two third customers interact
with their relevant organization over the phone in United Kingdom (Malhotra & Mukherjee,
p. 173).
The phenomenon of job quality is defined by Dun et al., (2012, p. 188) as a difference
between employee’s expectation and experience of job. The Employees have a perception
about the characteristics of the job and when they experience the job in actual scenario, they
develop a perception of high or low quality job. The Variables that determine the job quality
like work environment, job characteristics, personal characteristics, and employee training
have a potential influence on employee satisfaction and service quality (Meyer & Allen,
1991). Similarly, Heskett et al., (1994, p. 164) mentioned some critical factors such as
technology, recruiting people, training and compensating employees plays a key role in
increasing the performance of the employees and profitability of the company.
Furthermore, Dun et al., (2012, & p. 188) found some critical differences between job quality
in CCC and job quality in general service industry. They have authenticated the existing job
quality dimensions and introduced the new dimensions in customer CCC context like learning
from customers, learning from employees, information sharing, integrity and ease of tools.
Although, there are some other dimensions discovered by the researchers aligned with the
previous studies such as opportunity and challenge, role ambiguity, role conflict, superior
feedback, atmosphere, enjoying the work, and empowerment.
2
Normally it is considered that organizations are not much concerned about the importance of
nature of the job quality that influences the job satisfaction and the service quality of
organization. The employees have the most important role in developing the organizational
image in customers mind and have a straight effect on customer satisfaction (Mukherjee &
Malhotra, 2004, p. 163). A research conducted by Van der aa et al., (2012, p. 3935) proved
that CCC job quality has a significant positive effect on job satisfaction. They found that CCC
job quality has also significant but small positive impact on effective commitment of CCC
employees. But, some other researchers contradicted this finding and showed a strong relation
between job quality and effective commitment (Van der aa et al., 2012, p. 3934). By
improving the level of CCC job quality, the organization can increase the job satisfaction. In
result, the turnover rate can be reduced which means, organization can save the cost of hiring
and training new employees and it will not affect the quality of the service (Van der aa et al,
2012, p. 3934).
The customer satisfaction is defined by Homburg & Stock (2004, p. 146) as an emotional
reaction towards the experience or a series of experiences, which a customer gets during the
interaction with the services organization’s employees. The customers have perceived
expectations in their mind belonging to the services of a particular organization. The
satisfaction of a customer depends on the difference between perceived and actual standards
of expectations, whether it meets or exceed the degree of assessment of customer that he
perceives from the organizational services. Every customer wants that he should be given a
more priority than others and should be treated in a special way, but the customers who are in
regular dealing with the organization in terms of finance, definitely expect high quality of
services (Miciak & Desmarais, 2001, p. 349).
One of the most important objectives of CCC is to satisfy the customers. The employees
working in CCC who directly deal with the customers are the most important source of
linkage between organizations and their customers and they need to know about the
customers’ expectation, to serve them in an efficient way (Burgers et al., 2000, p. 142). In
CCC settings, interaction generally takes place by telephone that restricts the physical
assessment of the service in contrast to the face-to-face serve encounters, so the customer
assessment of service depends on interpersonal characteristics of the customer contact
employee (Burgers et al., 2000, p. 143).
In addition, customer satisfaction towards the services organizations is supported by loyalty of
representative employees. An employee having eagerness and loyalty with organization will
build more productive relations with customers (Abbasi & Hollman, 2000, p. 334). The
question, how to improve employees job satisfaction, loyalty and service quality is addressed
by Dun, et al., (2012, p. 172). They argued that improvement in the job quality of CCC
employees positively effects the job satisfaction, loyalty and quality of services that will
ultimately increases the customer satisfaction.
Furthermore, researchers have highlighted an important relationship; the job satisfaction of
employees has significant effect on service quality. The satisfied employees create satisfied
customers (Malhotra & Mukherjee, 2004, p.163). Likewise, the service profit chain theory
explains that the importance of job satisfaction, the employee satisfaction and loyalty has
pivotal effect on customer satisfaction, customer loyalty and increases the organization profit
(Heskett et al., 1994). According to profit chain theory, increase in service quality can
increase customer satisfaction, customer loyalty, and reduce customer turnover (Heskett et al.
1997, p.165). In another study, Malhotra & Mukherjee (2004, p. 169) found that CCC
employee’s job satisfaction has significant effect on service quality. The job satisfaction can
increase the customer satisfaction. Similarly, it has been proved that employee satisfaction
3
increases customer satisfaction (Zeithaml & Bitner, 2000, p. 287). Another study shows that
job satisfaction has a significant positive effect on quality of the service which is provided to
the customers by CCC employees (Malhotra & Mukherjee, 2004, p. 174).
1.2 Research Background
1.2.1 Job quality
From the past two decades the phenomenon of job quality has been caught by hot discussion
due to the hasty growth and development of customer contact centers (CCC) (Hannif et al.,
2008, p. 271). Sergeant & Frenkel (2000, p. 18) have discussed some dimensions of job
quality (e.g., other department support, Technology, Supervisor support). The authors have
found that these dimensions of job quality have significant effect on employee’s capacity to
satisfy customers. Moreover, Gorjup et al., (2008, p.45) studied the job quality in customer
contact center with a specific focus on promotion opportunities in this sector. They also
examined the factors that affect the promotion opportunities. Furthermore, Connell & Hannif
(2009, p. 364) presented that job quality consists of job content, working hours, work-life
balance, and supervisory style. Another study which was conducted by Choi et al., (2012,
p.510) investigated the different dimensions of job quality such as; monetary rewards,
supervisor support, and career path. The authors explored these dimensions and studied their
relation with turnover ratio.
On the contrary, Malhotra & Mukherjee (2006, p. 445) conducted the study on job quality
from a different perspective. They argued that role clarity is a critical element in shaping the
employee’s perception about service quality. The authors proposed that feedback, autonomy,
participation, supervisory support, and team support are the key antecedents of role clarity
which has effect on organizational commitment, job satisfaction, and service quality. The
most comprehensive study on job quality, till date, have been conducted by Dun et al., (2012,
p. 171). The authors have proposed 12 dimensions of job quality for CCC. Subsequently, the
authors have articulated a job quality scale and tested its reliability and validity in CCC
setting. Previously, there are many researchers who conducted the studies on different
dimensions of job quality in CCC from employee perspective. But almost all researchers used
different concepts and dimensions of job quality (Dun et al., 2012, p. 173). Dun et al., (2012,
p. 3925) found in their study that job quality has a strong positive effect on job satisfaction
and effective commitment and indirect negative effect on employee turnover. They argued
that job quality is a critical element for reducing employee turnover. Their study provides
support to the manager in improving the job quality in CCC setting.
Similarly, Valverde et al., (2007, p. 155) steered the study on job quality in CCC setting. The
authors constructed a job quality index which is consisted of different dimensions like Job
stability, training and development opportunities, and salary. Dun et al., (2012, p. 188)
developed a job quality scale which consists of 12 dimensions of job quality and 57 questions.
The authors tested the validity, reliability and gerneralizability of the scale across different
industry in regard to CCC context.
4
1.2.2 Customer satisfaction
In CCC settings Burgers et al., (2000) investigated the relationship between customer
satisfaction and 13 critical variables associated with call centers. These variables are
discussed in detail in literature review. They found a significant, however a week association
of only 2 of the 13 variables on customer satisfaction. The study of these variables is also
conducted by Jaiswal (2008). Customer satisfaction is viewed by many researchers from
different perspectives. Dean (2001) emphasized his concerns on the minimum level of
expectations and predictions in a customer’s mind and compared it with level of service
quality set by organization. His study was aimed to investigate the differences between these
two levels. Different models are presented in the literature of customer satisfaction in CCC.
For instance Garnett et al (2002) investigated the design of contact centers with impatient
customers and modified the previously presented models. The new model was named as (M/
M/ N + M) model, which they claimed is feasible for the large organizations with CCCs.
Another model for measuring customer perceptions of service quality known as SERVQUAL
model was presented by Parasuraman et al., (1988). In the same context Burgers et al., (2000)
developed a measurement instrument to point out the main customer expectation dimensions
related to the behavior of the CCC employees. The connection between service quality,
customer satisfaction and purchase intension was tested by Cronin and Taylor (1992). They
found that the service quality is a predecessor of customer satisfaction. The significant
relationship was found between customer satisfaction and purchase intensions. In comparison
with customer satisfaction their study suggested minimal effect of service quality on purchase
intensions. Based on the relationship investigation, a dyadic analysis was conducted by
Homburg & Stock (2004) to test the significance between CCC employee’s job satisfaction
and customer satisfaction. Their results also present a positive significant relationship
between these two variables.
1.3 Problem statement
Previously, a lot of research is done on job quality, job satisfaction, and employee
commitment in call center context. Some researchers have discussed the job quality
dimensions and some others discussed the effect of job quality on job satisfaction, employee
commitment and service quality, which have been discussed above. The most recent study has
been done by Van der aa et al., (2012) about the job quality dimensions in call center context.
The authors did research on the job quality in customer contact center and introduced a 12
dimensional CCC job quality model. (Van der aa et al., 2012, p.188).
Furthermore, the relationship between CCC job quality (12 Dimensional Job Quality) and
employee turnover have been studied. But to the best of our knowledge, the link between job
quality (12 Dimensional of Job Quality) and customer satisfaction was not investigated. The
previous model of job quality had limited boundaries as it only defines the relationships of
variables within the organization. Although, on the other hand, the vast amount of literature is
available on the factors of customer satisfaction but mostly it is linked with the job
satisfaction, loyalty and commitment of employees and the service quality they deliver. We
will extend our research by studying the factors involved in the construction of job quality in
CCCs and look at its effect on customer satisfaction, moving beyond the organizational
boundaries. By going through the literature, we observed that there is a need to test the
relationship between job quality and customer satisfaction, therefore we will develop a model
to verify this connection.
5
1.4 Research purpose
Recently, the link between CCC job quality and Job Turnover has been discovered (Van der aa
et al., 2012). But according to our knowledge, no study has been conducted to explore the
links of CCC job quality outside of the organization. Therefore, the basic aim of our study is
to find the relationship between CCC job quality (12 Dimensional Job Quality) and customer
satisfaction.
1.5 Research question
Is there any relationship between CCC job quality and customer satisfaction?
1.6 Importance of Study
The CCC is becoming the interest of organizations during the last decade because of the rapid
change in overall business industry (Anton, 2000, p. 121). The companies concerns about
customer satisfaction are increasing and more companies are focusing on CCC to understand
and meet the demands of their customers in efficient way. On the other hand, the customer’s
perception and evaluations of the services encounter are also rapidly changing. As the
importance of understanding the customer expectations and level of satisfaction in CCC is
definite, the customer satisfaction with respect to the organization’s contact employees and
their job quality should also be taken into the consideration (Burgers et al., 2000, p. 143).
In the CCC context, management and customers use different standards to evaluate the
service excellence. Managers are more concerned about the internal factors that also have an
effect on job quality of employees (e.g. calls per hour). This does not go in accordance with
the customer expectations of ease of contact and first call problem resolution. Because
customers are the most important part of the CCCs, they should be the ultimate judge of the
quality of services provided by the employees of CCC (Miciak & Desmarais, 2001, p. 347).
The research we are conducting will be important because it is not only concerned with the
managers, supervisors, employees but also includes the customers, the crucial part of CCCs.
Moreover, the contribution of our study will be helpful for both researchers and practitioners.
From the research point of view, we will contribute to the literature by improving the
understanding of relationship between the CCC job quality of employees and its effect on
customer satisfaction in CCC context. From the organizational perspective our study will be
helpful for the CCC managers to clearly understand the factors that are helpful in improving
the job quality of employees and gain the maximum customer satisfaction.
6
1.7 Limitations
The area of research, we have selected is very broad and has been the interest of many
researchers in different perspectives. The excessive literature could be found on the job
quality and customer satisfaction, but due to the limitation of resources, time and access we
have focused more on the literature related to the relationship of both aspects (Job quality and
Customer satisfaction), specifically, in call center industry (CCC). There are a lot of service
industries, but our research is limited to the CCC. Furthermore, we faced difficulties to gain
access to the companies for data collection because of the lack of interest of managers and
companies that can result in a low response rate. Finally, the CCC job quality scale does not
cover monetary aspects of a job quality.
Another limitation of our research is that the selected companies are located in Pakistan.
Although English language is considered as secondary language of Pakistan, but still it is not
the primary language i.e. Urdu. We developed the questionnaire in English language.
However, we believe that contacting the people through their primary language is more
appropriate and it may cause any confusion in the mind of respondents.
1.8 Key Terms
Key Terms Explanation
CCC Customer Contact Center (Call Center)
CCC Job Quality 12 Dimensional Job quality (Van Dun Aa et
al., 2012)
CCC Employee Customer Contact Center Employee
(Customer Service Representative)
SPC Service Profit Chain

7
1.9 Disposition of Thesis
Chapter 1
Chapter 2
Chapter 3
Chapter 4
Chapter 5
Chapter 6
Introduction: This chapter introduces the topic and it’s Background.
The Problem Statement highlights the possible research gap,
following with research question. Finally, the importance of study
has been discussed.
Methodology: This chapter describes the scientific methods which
have been used in this study. It presents the arguments for
selection of methods. Further, it explains the different research
tools and their use in this study.
Literature Framework: This chapter illustrates the all important
aspects of the topic. It also discusses theory and models which have
been used in regard to research topic. In the end, hypotheses are
constructed after detail discussion.
Empirical Findings: This chapter covers primary data which has
been collected through questionnaire. The data is presented with
the help of diagrams and charts.
Analysis: This chapter presents the result of the hypothesis which
has been tested by using statistical tools. The later part of the
chapter contains the discussion part which is constructed on result
basis.
Conclusion: The final chapter includes concluding remarks. The
whole study is revisited. The contribution, limitation, and further
research have been discussed. .
8
Chapter 2: Methodology
The aim of this chapter is to present and explain the procedures adopted to conduct this
research. The reasons of selecting of particular methods and design are elaborated in detail.
The chapter starts with the pre-conceptions of the authors and choice of subject. Afterwards
the research paradigm, research approaches, research strategy and design are presented. The
last part of the chapter is followed by the questionnaire development, sampling technique,
sample design, company selection and the measurement techniques.
2.1 Pre-conceptions
The preconceptions of a researcher often affect research work. A researcher’s prior
knowledge, experience, exposure, and attitude have an impact on, how they think and
interpret the things. Similarly, we believe that our prior knowledge and experience will affect
our study. We both are business students and studied a variety of business courses throughout
our academic life. One of us belongs to field of marketing discipline and other from
management discipline. We have gone through different marketing and management theories,
literature, and models which helped us in this research. One of us has also two year
experience of doing marketing job in service industry which helped in our study. Although,
the other author does not have any practical job experience, but worked on different projects
related to the field of management. He has an exposure of different cultures, as he is fond of
visiting new places and countries to know about people, their behavior and cultures. As we
believe, practical learning is more long lasting as compared to academic learning. Overall, we
think that our academic and practical exposure has played a comprehensive role in completing
this research.
2.2 Choice of Study
The main field of both of the authors is business administration but have different
specializations i.e. Marketing and Management. This fact gave us a great opportunity to
explore and share our ideas on different aspects of marketing and management. We decided to
search for the topic that has a potential to create and maintain the interest for both of us. We
started reviewing the articles that developed our intention to study job quality from the
perspectives of management and customer’s satisfaction from the perspective of marketing.
We found a vast literature on both variables and come to know that job quality and customer
satisfaction are very broad topics. Already a lot of research has been done on each issue
separately in different perspectives.
After realizing the research gap, we decided to investigate the relationship between job
quality and customers satisfaction. In this regard we decided to study these two phenomena
from perspectives, employees and customers. Therefore, we decided to collect the data from
employees and customers and should do analysis from both employee and customer
perspectives. The choice of CCC industry was undertaken because of the organizations
growing concerns towards the installment of call centers and the need of better job quality to
satisfy the customers efficiently.
9
During the search of literature, we have gone through different variables that affect the job
quality of employees in CCC settings. Because the jobs in CCC are very stressful and mostly
companies are concerned about the effectiveness instead of efficiency, it is very important to
take care of the quality of jobs provided to the employees. We have found that the job
satisfaction is the possible variable to construct the relationship between job quality and
customer satisfaction. Finally we developed a model to give a visual understanding of
relationship between job quality, its constructs and the effect of job quality on customer
satisfaction.
2.3 Research Paradigm
The work of researchers is influenced by their knowledge and thoughts they have, related to
the research area. The researcher having an interest in the facts like quantity of resources
needed, probably have a different view of thinking than the researchers dealing with the
feelings and emotions of workers towards their managers. The research philosophy directs a
scientific approach to researchers that how they view the world and knowledge, especially the
development of new knowledge (Ponterotto, 2005, p. 127; Saunders et al., 2009, p. 108).
The two widely used research designs are epistemology and ontology. Both of them have
noticeable differences that effects the way in which we think about the research process.
2.3.1 Ontological Assumptions
Ontology is concerned with the philosophy of realism. Bryman & Bell (2011, p. 20) defines
ontology as a “theory of nature of social entities”. The ontological philosophy gives an idea
about the researchers that how they view the social reality. Reality can be either viewed as
objective and external to the individual or subjective and cognitively developed on self-basis.
Objective view assumes that knowledge is available to everyone theoretically, while the
knowledge depends on the individual experience and perceptions in a subjective view (Long
et al., 2000, p. 192-193). Further the ontological approach directs us to choose either
objectivism or constructionism approach. Objectivism approach infers to the “social
phenomena and their meanings have an existence that is independent of social actors”
(Bryman & Bell 2011, p. 716). While on the other hand, the constructionism refers to the
creation of social phenomena from the perception and resulting actions of social actors
(Saunders et al., 2009, p. 111).
We have selected the philosophy of objectivism because the root purpose of our study is to
investigate the relationship between job quality and customer satisfaction. In our study we
will discuss the different variables such as job quality, job satisfaction, service quality and
customer satisfaction that have tangible realities. Organizations develop their abilities to
satisfy customers in order to surge sales, but customer satisfaction is a different for every
entity. In order to boost up the sales through customer satisfaction, organizations concentrates
on job quality of employees, job satisfaction and service quality. But there is a variation of
goals followed by every organization. Organizations have some set of rules and the duties
assigned to the employees are expected to be accomplished as per instructions. Employees
have to report their supervisors and supervisor’s reports to the senior managers that show the
hierarchy of formal structure of the organization. Our study is concerned about the structural
aspect of management with the assumption of managerial similarities of job quality in CCC.
There may be differences in the aspects of the structure, but the core functions are almost the
10
same in all organizations. The variation of management in organizations is the function of
different objective aspects of management (Saunders et al., 2009, p. 110). We believe that our
undertaken variables have objective characteristics in organization, therefore having objective
realism. In accordance to our conception, the standards of job quality and level of customer
satisfaction will not be the same in different organizations and the relationship between them
will generate the different outcomes.
2.3.2 Epistemological Assumptions
Epistemology is concerned with generation of acceptable knowledge in the field of education
(Saunders et al., 2009, p. 110). In the same way Bryman & Bell (2011, p. 16) argues that in a
broader perspective epistemology can be defined as a study of knowledge. There are two
ways in which the knowledge can be viewed. According to Saunders et al., (2009, p. 112)
there are two types of researchers according their interest in the research. Firstly, the
researchers are more interested in gathering, analyzing and interpretation of factual data.
These kinds of researchers are used to rely on real objects, with a view that reality is outcome
of the reliable things like computers, trucks and machines and technological instruments. This
sort of objects have their own existence with distinctive attributes, therefore the data collected
by the researchers is objective having a less chances of biases. The philosophy of these
researchers is known as positivist philosophy towards the expansion of knowledge.
On the other hand the second kinds of researchers are concerned with feelings, behaviors and
attitudes of the people towards others. The study of theses researchers includes the
observation of emotions, feelings and behaviors as a social phenomenon which has nothing to
do with external reality. These attributes are neither visible nor calculated, as compared to the
computers, trucks, and machines and technological instruments. Hence, this form of
philosophy is called interpretivism. Obviously there could be possible ways in which peoples’
behaviors can be measured. It depends on the researchers that what kind of philosophy they
choose that is more suitable for their research .The positivist philosophy is more useful when
the data is collected in figures and facts, and statistical tools are applied to analyze that data,
to be presented in the form of tables and charts. While, in interpretivist philosophy the
collection and analysis is done in narrative form, depending more on the researchers point of
view (Saunders et al., 2009, p. 113).
The pattern of our research directed us to go with positivism view in epistemological
philosophy. The positivism view of research suggests that the hypothesis should be generated
to test them in a scientific way in order to get the knowledge of realism (Bryman & Bell,
2011, p. 15-16; Saunders et al., 2009, p. 113). We have selected the positivist approach
because after going through the previous research we assume that there is a relationship
between job quality and customer satisfaction, therefore aligned with the positivism. We will
deploy the previously presented theories and models in order to construct our hypothesis.
These hypotheses will then be used to check and validate the direct or indirect relationships
between the variables that could be helpful for extension of the theory. Our study is based on
the measurement of the facts of job quality of the employees in CCCs and its direct or indirect
effect on customer satisfaction. We will analyze the collected data with the help of statistical
tools. Our results will me more reliable and there will be less chances of error because of the
positivist stance, and the interpretation will be done on the basis of real facts instead of our
own thoughts.
11
2.4 Research Approaches
In academic writings, the use of theory is one of the critical parts of the thesis. It is important
in the beginning of the research, to have a clear understandability of the way the theory will
be used. The research design significantly dependents on the author’s understanding and
clarity of the theory. Two approaches widely used in research are deductive and inductive
approach. If the research is gone through by deductive approach, the hypothesis is generated
first and then research strategy is made to test that hypothesis. On the other side the inductive
research strategy is used by the researchers whose aim is to develop a theory by the
observations they make by their data analysis (Saunders et al., 2009, p. 124). The figure
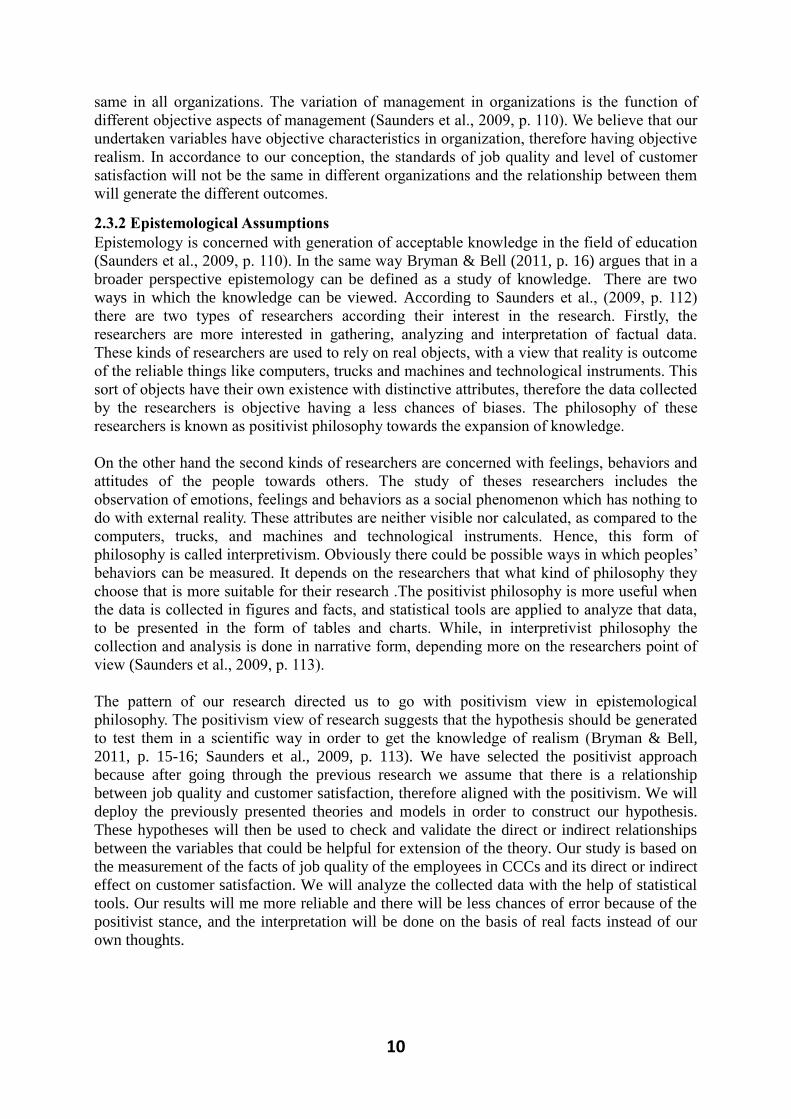
below shows the way in which deductive and inductive approach works.
Figure 1: Deductive and Inductive Method
In our study we are going through the method of deduction. The perspective of deductive
approach is to moves towards the specifications from a broader view. The deductive approach
does not produce a theory but the theories are utilized form the existing literature. Before the
collection of data, the previously presented theories are used in accordance with the present
requirements (Blaikie, 2000, p. 115). The need of this approach in our research is that, we will
present the job quality and customer satisfaction related theory in our theoretical framework.
We have developed different hypothesis in order to testify the relationships between different
variables. The data is collected from the employees about their perception of job quality and
job satisfaction, and from customers to know about service quality and customer satisfaction.
These factors will be analyzed and will be projected to give results on the basis of theory used
in our literature review. Finally, acceptance or rejection of significant or insignificant relations
of the variables presented in the theory is expected to be the results of study.
2.5 Research Strategy
Normally, every type of research is followed by some kind of measurements for data
collection and its analysis. There are different types of measurements used by the researchers,
such as nominal, ordinal, interval and ratio. These measurements can be applied to both
qualitative and quantitative research strategy (David & Sutton, 2011, p. 94), however nominal
and ordinal measurements are more appropriate for qualitative research strategy, while the
interval and ration measurements are suitable for quantitative research. The quantitative
research strategy is followed by the statistical tools for measuring chances of relationships
between different variables. While the researchers conducting qualitative research, are not
much concerned with the application of statistical tools. The purpose of qualitative research
might be the confirmation of presence or absence of some variable (David & Sutton, 2011, p.
95). The table below represents the examples of measurement tools discussed above:
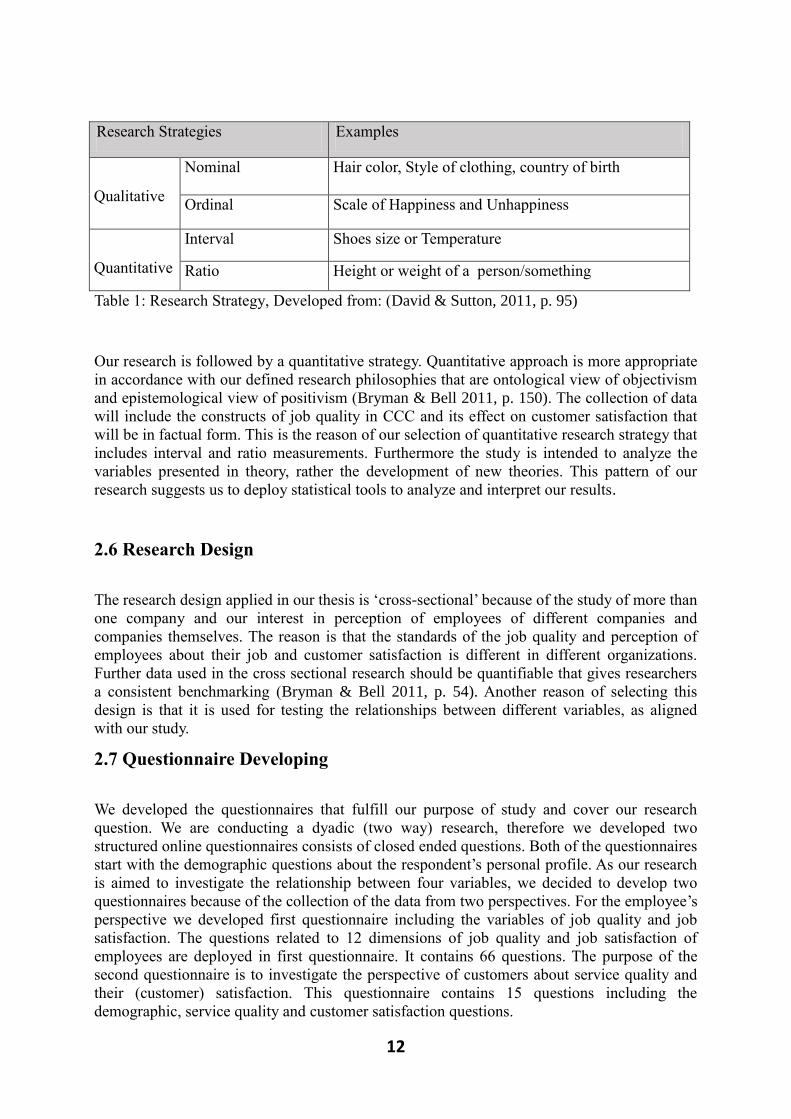
12
Research Strategies Examples
Qualitative
Nominal Hair color, Style of clothing, country of birth
Ordinal Scale of Happiness and Unhappiness
Quantitative
Interval Shoes size or Temperature
Ratio Height or weight of a person/something
Table 1: Research Strategy, Developed from: (David & Sutton, 2011, p. 95)
Our research is followed by a quantitative strategy. Quantitative approach is more appropriate
in accordance with our defined research philosophies that are ontological view of objectivism
and epistemological view of positivism (Bryman & Bell 2011, p. 150). The collection of data
will include the constructs of job quality in CCC and its effect on customer satisfaction that
will be in factual form. This is the reason of our selection of quantitative research strategy that
includes interval and ratio measurements. Furthermore the study is intended to analyze the
variables presented in theory, rather the development of new theories. This pattern of our
research suggests us to deploy statistical tools to analyze and interpret our results.
2.6 Research Design
The research design applied in our thesis is ‘cross-sectional’ because of the study of more than
one company and our interest in perception of employees of different companies and
companies themselves. The reason is that the standards of the job quality and perception of
employees about their job and customer satisfaction is different in different organizations.
Further data used in the cross sectional research should be quantifiable that gives researchers
a consistent benchmarking (Bryman & Bell 2011, p. 54). Another reason of selecting this
design is that it is used for testing the relationships between different variables, as aligned
with our study.
2.7 Questionnaire Developing
We developed the questionnaires that fulfill our purpose of study and cover our research
question. We are conducting a dyadic (two way) research, therefore we developed two
structured online questionnaires consists of closed ended questions. Both of the questionnaires
start with the demographic questions about the respondent’s personal profile. As our research
is aimed to investigate the relationship between four variables, we decided to develop two
questionnaires because of the collection of the data from two perspectives. For the employee’s
perspective we developed first questionnaire including the variables of job quality and job
satisfaction. The questions related to 12 dimensions of job quality and job satisfaction of
employees are deployed in first questionnaire. It contains 66 questions. The purpose of the
second questionnaire is to investigate the perspective of customers about service quality and
their (customer) satisfaction. This questionnaire contains 15 questions including the
demographic, service quality and customer satisfaction questions.

13
For the development of questionnaire we have used the facilities provided by Google for
online questionnaires. The online questionnaire is an electronic-self-completion method that is
used for the online collection of data, when interviewer is not physically present in front of
the interviewee Brace (2004, p. 36). Internet provides various ways to send a link to the
required person, such as via emails, pop ups ( a link can be posted on other web sites, the
respondents who visit these web sites will be directed to questionnaire by clicking on the link)
and some websites provided facilities to post banner ads Brace (2004, p. 38) . We used the one
of the tool of Google docs which is called survey tool. The survey tool helps to develop an
online questionnaire, spread it online and collect the data in a spread sheet automatically. It
also produces the graphs and bars, if you are using a close ended questionnaire for data
collection.
Although, we are doing quantitative research, for this purpose, we developed closed ended
questions because it is easy to get answer from the respondents and respondents do not feel
boredom while selecting an option instead of writing the few lines. The questionnaire is also
a self-completion online questionnaire. In our opinion, mostly, the respondents do not like to
give answer to the open ended questions. Mostly, the closed ended questions are developed in
the questionnaire with likert scale. We have applied 5 point likert scale to all of the questions
related to the four variables except demographic questions. On likert scale 1 means “Strongly
Disagree” while on the other extreme is 5 “Strongly Agree”.
Regarding the advantages of online questionnaire, Brace (2004, p. 36) argues that as
compared to the face to face survey the online self-completion questionnaires are inexpensive.
In the same way Hague et al., (2004, p. 156) argues that online questionnaire is easier and
cheaper even than postal survey. The researchers should not have to bear the printing, posting
and typing cost of questionnaire. Similarly Sue & Ritter (2007, p. 12) describes that for a
large and scattered sample size the most suitable and cheaper way for data collection is the
online questionnaire. At the same time online self-completion survey also have some
disadvantages. Hague et al., (2004, p. 156) argues that the accessibility to internet could be
the problem of online questionnaire because of the limited internet accessibility and may lead
to the biasness. However, Sue & Ritter (2007, p. 13) points out that in case of online
questionnaire, it is easier for respondents to jump through some questions and leave the
questionnaire incomplete. The probability of incompletion increases if the questionnaire is
lengthy.
2.8 Sampling Technique
Sampling techniques allow researchers to choose among the different methods that help them
to collect the data from the specifically required population instead of studying all the
possible elements (Saunder et al., 2009, p. 210). Two methods of sampling are widely used in
research, probability and non-probability sampling (Saunder et al., 2009, p. 213). Probability
sampling is a method of sampling in which the chance of selection of every element from the
whole population is known. While the non-probability sampling refers to the technique in
which the chance of selection of every element from the whole population is not known
(Saunder et al., 2009, p. 213).
14
Our choice of sampling technique is convenience sampling and snowball sampling that is a
type of non-probability sampling. Our aim is to study job quality and customers satisfaction;
therefore we developed the questionnaire for the employees of CCC and their customers. We
were not particularly interested in the employees and the customers of any specific CCC;
therefore we constructed a general but two different questionnaires for the employees and
customers of three companies. As we mentioned earlier, our study is the type of dyadic
research. It is a two way research similar to the research conducted by Homburg & Stock
(2004). They also investigated the linkage between job satisfaction and customer satisfaction
by considering the perspective of both, employees and customers.
The reason for choosing convenience sampling technique is that we were not able to directly
access the selected companies which are situated in Pakistan. We accessed the companies
through our personal references who are the mostly supervisors and team leaders. It was not
an easy task to follow up the employee questionnaires because it was mainly dependent on the
supervisors or team leaders to fill up the questionnaire. The main problem faced by the
supervisors was the unavailability of internet to CC employees in all three companies. The
team leaders and supervisors made special efforts and arranged one computer with internet
facility. It was also very hard for CC employees to give time to fill up the online questionnaire
because of their tight schedule of calling. However, they managed to fill up the online
questionnaire during their break times. These problems may be the reason for low response
rate.
In case of customer satisfaction questionnaire, both convenient and snowball sampling
technique were used. The questionnaires were sent to general public through email who were
using the services of any of the selected companies. They were also asked to forward the
questionnaire to their contacts, until we reached the target.
2.9 Sample Design
Sample design elaborates the author’s choice of selecting the elements form the whole
population and the way they adopt. In our research it was not possible to study the whole
population. We decided to select three companies to investigate the job quality and job
satisfaction from their employees. At the same time the aim was also to include the customers
of same companies in our investigation for testing the service quality and customer
satisfaction variables.
The consideration behind the sample selection was to get the general results from the
employees and customers of three companies. For the employees questionnaire we decided to
get the sample size of 150 employees, 50 from each company. We got 84 completed and 6
uncompleted questionnaires. Similarly, we took the same sample size (150) for customer
satisfaction questionnaire. In order to identify the specific company’s customers, a question
was asked to select one of three sample companies. The response rate from the customer’s
questionnaire was 86 completed questionnaires and 9 were incomplete. Ultimately, the
incomplete questionnaires have been discarded.
Afterward, we had to consider equal amount of responses from both questionnaires for sake of
analysis. So we performed analysis on 84 valid responses of both questionnaires and entered
data in SPSS. Therefore the completion rate of our estimated sample design is 56 % which is
considered acceptable for online questionnaires (Nulty, 2008, p. 305).
15
2.10 Company Selection
We have selected three companies from telecommunication sector. We have made this
selection to investigate the relationship of CCC job quality with customer satisfaction in
different companies within the same industry. The two companies are private limited and one
is public limited. We approached the companies through our personal relations. Further, we
have informally taken the consent of the relevant authority for conducting survey by calling
them via phone. Although, the companies have been selected by using convenient sampling
technique but we considered two basic conditions in selection of the companies.
PTCL (Public Limited)
U-fone (Private Limited)
Telenor (Private Limited)
2.10.1 Inbound call center
Firstly, we have made it sure that company should have an inbound call center because we
have conducting the research in inbound call centers only. An inbound call center is (See
chapter 3), where customer contact the company for any kind of complain, query, problem or
inquiry. The contact center employee only has a role to receive customer’s calls.
2.10.2 Size of Call Center
Secondly, we have assured that the relevant company should have an adequate size of the call
center. We have put a limit of minimum 60 employees per call center because we perceived
that 60 employees would be enough for our sample size.
2.11 Variable Selection Our study is based on the investigation of relationship between two variables, job quality and
customer satisfaction. From an extensive literature review we have found different constructs
related to these two variables. For instance Dun et al., (2012) studied the variable of job
quality, job satisfaction, affective commitment and employee turnover. The research work of
Malhotra & Mukherjee (2006) is also related but bit different. Their study includes three
variables that are organizational commitment, job satisfaction and service quality. The
connectivity between job satisfaction and customer satisfaction was testified by Homburg &
Stock (2012). However we were unable to find the literature based on the constructs of job
quality and customer satisfaction. Therefore the previous literature motivated us to include the
variables of job satisfaction and service quality to build a possible relationship between job
quality and customer satisfaction.

16
2.12 Measurement
We have selected the following constructs for measurement
CCC job quality
Job satisfaction
Service quality
Customer Satisfaction
In employee questionnaire to measure the CCC job quality, we have followed the Van dun aa
et al., (2012) scale which is consisted of 12 dimensions of job quality in CCC setting and 57
questions under these dimensions. We perceived that their scale for measuring job quality in
CCC is more reliable and generalizable than any other scale. Similarly, we have taken
questions to measure the job satisfaction from the previous study of Homburg & Stock (2004,
p. 155) and Sergeant, & Frenkel (2000, p. 29).
Likewise, in customer questionnaire, the questions, to measure the service quality variable,
have been taken from the previous literature (Malhotra & Mukherjee, 2004, p. 173). Further,
for measurement of customer satisfaction, we have adopted the questions from the previous
study of Homburg & Stock (2004, p. 155). We believe that these questions to measure the
above mentioned variables have already been tested in previous studies. So, we have adopted
these questions from previous studies instead of developing new questions. All the questions
of both questionnaires are measured on five point Likert scale which is ranged from ‘‘strongly
disagree to strongly agree.’’ Intentionally, we did not mention about the dimensions of all four
variables in both questionnaires with the consent of our supervisor. Because, we thought that
it might create any confusion in the mind of respondents which might direct them towards a
wrong answer. Although for the understanding of readers, we described below which
questions belong to which dimension.
In employee questionnaire, the questions 1 to 4 are demographic questions which are asked to
get some general information about the employees. The questions from 5 to 61 belong to job
quality variable. Further, the questions which are belonged to 12 dimensions of job quality are
as: the questions from 5 to 13 represent the dimension ‘‘Role Ambiguity’’. The questions
from 14 to 21 represent the dimension ‘‘Information Sharing’’. The questions 22 to 29
represent ‘‘Role Conflict’’. The questions from 30 to 36 represent ‘‘Superior Feedback’’. The
questions from 37 to 41 represent the dimension ‘‘Learning from Customers’’. The questions
from 42 to 44 represent the dimension ‘‘Learning from Employees’’. The questions from 45 to
47 represent the dimension ‘‘Opportunity and Challenge’’. The questions from 48 to 50
represent the dimension ‘‘Enjoying the Work’’. The questions from 51 to 53 represent the
‘‘Easy Tooling’’. The questions from 54 to 56 represent the ‘‘Empowerment’’. The questions
from 57 to 59 represent the dimension ‘‘Integrity’’. The questions from 60 and 61 represents
the dimension ‘‘Atmosphere’’. Similarly, the questions 62 to 67 represent the job satisfaction
variable
In customer questionnaire, similar to employee questionnaire, the questions from 1 to 5 are
demographic questions which are asked to get some basic information about customers. The
questions from 6 to 13 represent the Service quality variable. The questions 14 and 15
represent the customer satisfaction variable.
Furthermore, we used software (SPSS) for quantitative data analysis. We have analyzed the
variables though Chi-Square test. It is used to measure the relationships among variables.
17
Another test we performed for this purpose is spearman correlation that identifies the
relationships, presented in analysis chapter in detail. We have also performed and presented
the reliability and validity test to check the internal consistency of the collected data.
2.12.1 Pilot Study
In order to get best possible results from questionnaires, the pilot study was made prior to the
actual study. The purpose was to verify the adequacy of questionnaire for employees and
customers. In this regard we send the questionnaire to supervisors of the employees. Three
supervisors and two employees answered the questionnaire and confirmed that the questions
are easily understandable and answerable.
In the same we send five questionnaires to randomly selected customers and got their opinion
about the questions. All the questions were answered correctly and customers did not feel any
difficulty while responding to the questions.
2.13 Ethical Considerations
The ethical issues in research contain high importance that cannot be ignored (Saunders et al.,
2009, p. 187). In this regard we have tried our best to avoid any type of plagiarism throughout
the thesis. The data used form different resources is cited carefully and detailed references are
provided in the reference list. The data collected for analysis is also kept confidential. The
employees consent was taken by verbal communication, before sending them the
questionnaire. Both of the questionnaires contain a note that is to assure the respondents about
their privacy. We developed and presented the data without the disclosure of the respondent’s
identity. Further, no information was changed or modified therefore the data was kept as it is.
The results represent a true picture of the data analyzed by SPSS and the same kind of results
can be produced again if required.
2.14 Source criticism
We believe that it is very important to critically evaluate the secondary source which is used
in this study in order to assure the significance, relevancy, and reliability of secondary data.
We believe that the collected secondary data is significant and relevant to our topic. We
confined our search of literature within call center industry. We did not use material outside of
call center industry. Initially, the key terms like Job quality, Call center in Pakistan, and
Customer satisfaction are used to search the relevant data. In this, process, the irrelevant
articles have been discarded and only relevant material has been used throughout the literature
framework. However, we did not find sufficient data on job quality in Pakistani’s call center.
But this will not critically affect our study because we used immense literature on Indian call
center industry and from other part of world. We think that there are not so many differences
in regard to practices, rules, and regulations for call center business across South Asia. To
assess the reliability of secondary data, we mostly used the scientific articles and books
throughout this study, especially in literature framework. According to manual at USBE
(2012), the scientific articles are normally considered reliable and authentic. Further, we also
criticized the relevant literature and theory throughout this study.
18
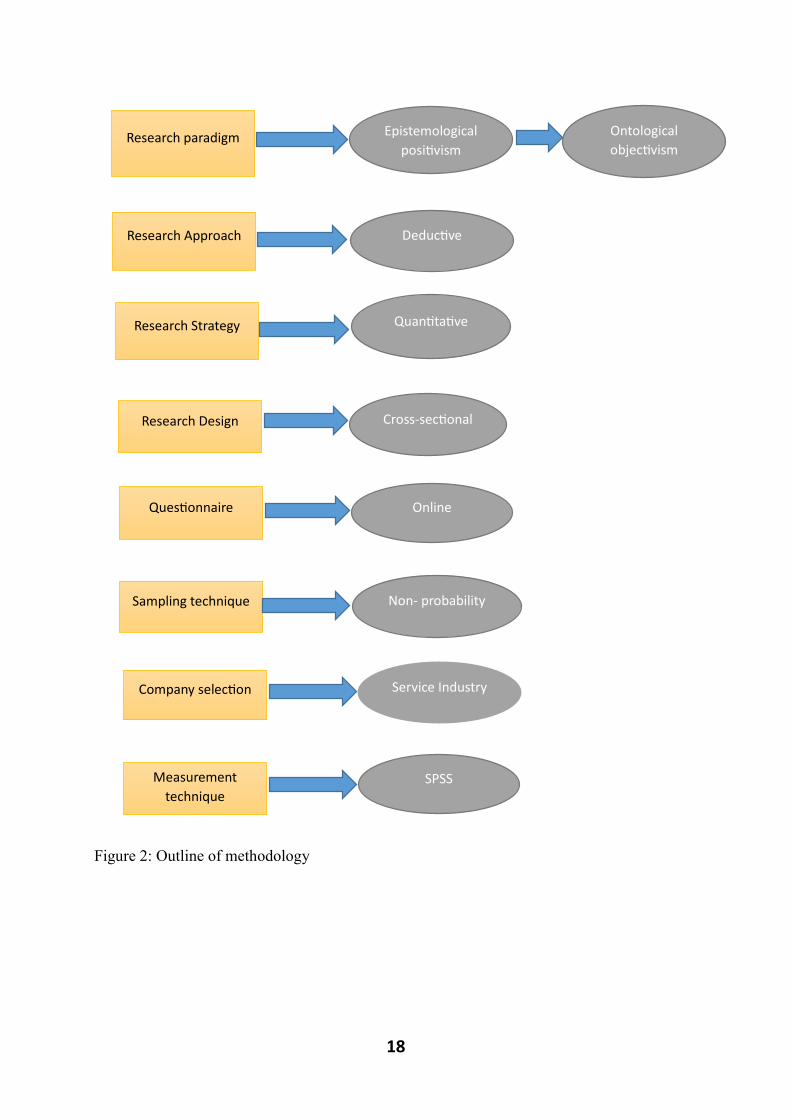
Figure 2: Outline of methodology
Measurement
technique
Company selection
SPSS
Service Industry
Sampling technique
Questionnaire
Research Design
Online
Non- probability
Cross-sectional
Research Strategy Quantitative
Research Approach Deductive
Research paradigm Ontological
objectivism
Epistemological
positivism
19
Chapter 3: Theoretical framework
The motive of this chapter is to present the literature related to the undertaken research while
designing a complete framework. The chapter starts with the explanation of customer contact
centers and its classification. Afterward the job quality, its 12 dimensions and customer
satisfaction are explained. The theory of profit service chain and other models related to
research are presented. Lastly the relationships of different variable are explained along with
the construction of hypothesis.
3.1 Customer Contact Center (CCC)
CCC are becoming the essential part of the present business industry, hiring billions of
employees around the world and acting as a basic customer interaction channel for
organizations in different businesses (Aksin et al., 2007, p. 665). The hiring ratio in CCC in
United Kingdom only, is more than the hiring ratio in coal, steel and automotive sectors all
together (Alferoff & knights, 2008, p. 29). The development of the industry of customer
services, particularly the CCC can be estimated by the increasing number of call centers. The
numbers of CCCs in 1996 were 63,000 and were expected to reach up to 115,000 in 2001.
There is still a great potential of development of CCC in Europe. The investment done in the
sector of CCC is 10 percent of the investment done in USA (Feinberg et al., 2000, p. 132).
Later on a research conducted by Aksin et al., (2007, p. 666) shows the growth and
development of CCC and they have mentioned their projection about CCC and their
employees in different countries in 2008.
Countries
CCC
Representative
Employees/Agents
United States 47,000 2.7 million
Europe, Middle East &
Africa
45,000 2.1 million
Canada and Latin America 305,500 730,000
Table 2: Projected CCCs, (Aksin et al., 2007, p. 666)
Along with continuous growth in CCC industry, the CCC has to deal with the variety of
complicated marketing and management challenges. There are several elements involved in
the growth of CCC industry, such as development of new management practices, reducing
cost of telecommunication and growing information technology in a large extent. Also there
are some other factors which have influence on organization’s operations and complexity. It
includes the knowhow of CCC being an influential customer network which is not only
concerned with the delivery of services but also the customer satisfaction, managing the
relationships and opportunities for sales (Aksin et al., 2007, p. 682). Formulating and
pursuing the operations in any kind of services industry, with the goal of creating stability
between the operational efficiency and service quality is always a great challenge for
20
organizations. Specifically this challenge contains more value and strictly followed by the
organizations, making it more complex in the telecommunication services industries (CCC)
particularly. The big organizations with CCC deals with a massive calls daily and every call is
expected to be answered in time and customers are provided with great deal of services
(Garnett et al, 2002, p. 208).
3.2 Defining CCC
The development and intense extension of call centers in business industry is rather a recent
phenomenon. Different definitions of call centers are available in the research making it hard
to specifically define the constituents of call centers. The most frequent term presently used is
“CCC” to express the different ways of approaching the customer irrespective of the involved
technologies (Valverde et al., 2007, p. 147). According to Valverde et al., (2007, p. 148) the
CCC can be traditionally defined as a business activity consisting of computers and other
information technologies, that precisely manages the incoming and outgoing calls in an
efficient way. The frequent interactions takes place between CCC representatives and their
customers, to provide a variety of services that includes marketing through telephone,
promotions, building image of the product in customer’s mind and others. Along with this
view of CCC, it is still hard to provide one definition because of the various models adopted
by the different organizations and their dedication in different activities. Mainly CCC is
classified into following different shapes.
3.2.1 Classification of CCC
1. In-house Contact Centers Versus Outsourced Contact Centers
In house CCCs are the internal call centers which are installed within the organization. The
organization hires employees on its own behalf who deals with the customers through
telephone. While the outsourced CCCs are the call centers having a different entity, that is
external to organization (Dormann & Zijlstra, 2003, p. 306). Due to the organizations
increased emphasis on their core competencies, the development in telecommunications
infrastructure has diverted organizations concerns to hire a third party to manage their whole
or a part of customer services through telephonic calls. These third party entities are called
outsourcers, who manages to provide customer services and are expected to meet the demands
of hiring organization (Aksin et al., 2007, p. 675).
2. Inbound Versus Outbound CCC
The function of inbound CCC is to manage the incoming calls initiated by the customers. The
duties of inbound CCC representatives/employees are to answer the questions, deal with the
inquiries and complains coming from the customers, making reservations and providing
aftersales services (Dormann & Zijlstra, 2003, p. 306; Jaiswal, 2008, p. 406). Inbound CCC
deals with the labor intensive functions, comprised by the employees who operate the calls
that contain 60 to 80% of the overall operating budget. The representative employees, dealing
with the calls are also known as ‘agents’ (Aksin et al., 2007, p. 665).
21
In outbound CCC, calls are initiated by the representative employees towards customers for
some particular purpose. The purpose contains searching for the customers for selling the
products, collection of debts, conducting the marketing research survey, and enhancement of
public relations. There are also the organizations which deal with both inbound and outbound
CCC at the same time. (Dormann & Zijlstra, 2003, p. 306; Jaiswal, 2008, p. 406).
3. Mass Production versus Professional Service Model
The organizations frequently use two kinds of models regarding CCC. These models have
different characteristics and are known as mass production and professional service models
(Batt & Moynihan, 2002, p 14). The organizations adopting mass production model focuses
more on high volume markets while they have limited concerns about providing value adding
services. The main purpose behind this model is to diminish the cost and the employees are
given extremely specified jobs. The employees are provided with a written script with clear
instructions that they use while handling the calls. In mass production settings the
representative employee are strictly monitored for their performance in terms of speed and
quality. The skills comprised by the representative employees are not very useful and taken
into account because of the strictly followed environment (Aksin et al., 2007, p. 678; Batt &
Moynihan, 2002, p. 16).
On the other hand there are organizations which adopts professional services model in CCC
settings with the goal of providing high value added services within the existing markets in
contrast to the mass production model. The jobs assigned to the representative employees
contains great extent of variability and are more complicated, therefore need highly skilled
and qualified employees (Valverde et al., 2007, p. 148). From the management perspective
these employees are also provided with the high compensations that includes attractive
remunerations, training and job security (Batt, 2002, p. 587).
3.3 Job quality in CCC setting
The past decade has shown the significant growth in information technology and marketing
techniques which brought a revolution in service delivery systems. Previously, service
delivery system was decentralized and service labor markets were local. The innovative
information systems and marketing techniques have made centralized customer service
through technology oriented CCC (Batt & Moynihan, 2002, p. 14). The interaction between
CCC employee and customer establish on phone (Aksin et al., 2007, p. 666).
Many researchers have studied the job quality in service industry. But a little work has been
done in identifying the dimensions of job quality in CCC setting (Dun et al., 2012, p. 172).
The CCC job quality is different on the basis of its characteristics as like stress, directly
confronting organizational flaws, and continuous performance monitoring, with general
service industry. The major difference between CCC job quality and job quality in other
industry is the amount of pressure and stress which is faced by the employee (Dun et al.,
2012, p. 3927, p. 175).
It is very important to identify the factors which construct the job quality in CCC settings in
order to distinguish between good job and bad job. But there is no standard list of factors that
construct the job quality (Valverde et al., 2007, p. 149). Furthermore, there are many
dimensions of job quality which overlap one another (See table 3) setting (Dun et al., 2012, p.
22
172). Hannif et al., (2008, p. 271. 277) proposed key elements like Income, Relationships
with co-workers, Occupational health and safety, Identification with work, Work Hours/
Work–life balance, Managerial Style and Strategies, Unionization, Employment Status,
Training and development opportunities, in order to analyze the job quality in CCC setting. In
their study, Connell & Hannif (2009, p. 364) analyzed some factors of job quality such as, Job
content, Working hours, Work life balance, Managerial/Supervisory style and strategies and
impact of these factors on CCCemployees working life. The most common dimensions have
been discussed by the researchers are compensation, non-salary benefits, training and
development, job stability, work flexibility, work control procedures, the organization of
work, and employee participation (Hunter, 2000, p, 463).
Further, Hunter (2000, p. 464) discussed that common idea of a job quality is consisted of pay,
remuneration, training, and future opportunities. But this theory does not intake the personal
perceptions and expectations of employees about the quality of the job. Extensive research
has been done on dimensions that set the perception about job quality. But all these studies
used different ideas about perception of job quality (Dun et al., 2012, p. 173). Although, the
behavioral scientists have been broadly discussed the psychological and perceptional issues of
employees but business researchers have recently started to study these issues (Aksin et al.,
2007, p. 666). Although, Every CCC manager is well aware from this fact that the perception
and behavior of the CC employee has a key influence on customer satisfaction and
organization performance (Aksin et al., 2007, p. 666).
Van der aa et al., (2012, p. 3928) defined CCC job quality as ‘‘the overall evaluation of the
job experience within the CCC, as perceived by employees.’’ The job quality is the difference
between employee expectation about the job quality and his/her actual experience of job
quality. If the employee experience of job quality is higher than his/her expectations, the job
quality will be positive. But employee experience of job quality is lower than his/her
expectations; the job quality will be negative. Thus job quality is tool to measure the
difference between employee expectation about job quality and his/her personal experience
about job quality. The service organization should identify and understand the expectations of
its employees and dimensions of job quality (Dun et al., 2012, p. 173). Furthermore, it is
argued that the quality of a job might be different across the industry. The author have
identified and compared different variables of job quality in CCC industry (Hunter, 2000,
p.149).
Moreover, the nature of CCC job does not give too much autonomy to CC employee
(Sergeant & Frenkel, 2000, p. 27). The employees in CCC are less empowered as compare to
employees of face to face contact center (Dun et al., 2012, p. 176, p. 3928). The CC
employees do not have influence on their work and other departments working style. The CC
employees have to follow the fixed procedures, rules and regulations which are already set by
the CCC management (Sergeant & Frenkel, 2000, p.27). The CC employees receive
complaints and suggestion about service improvement. But, they do not have the authority to
take necessary steps for service improvement which increases the employee dissatisfaction
(Dun et al., 2012, p. 176). The authors suggest that CC employees should have autonomy in
their work. The CC employees should completely understand their routine work and client’s
problem with sympathy (Dormann & Zijlstra, 2003, p. 306).
Besides that another dimension of job quality, the technology plays a key role in facilitating
the interaction between CC employee and customer. The quality of the interaction is largely
dependent on effectiveness of the technology (Sergeant & Frenkel, 2000, p. 27). Frenkel et
23
al., (1999, p. 87) indicated that the reliability and easiness of technology can enhance the CC
employee’s ability to serve the customer. Sergeant & Frenkel (2000, p. 26) argue that
Technology has intensively effect the ability and work of the CC employees and plays an
important role in increasing employee effectiveness.
One more dimension, Information sharing becomes more important in CCC as compare to in
any other industry. The CC employees have to directly confront with the customers and
answers their queries and complaints. Therefore, they need timely information from other
departments (e.g. launch of new marketing campaign, new product, and error in customer
invoice etc.) (Dun et al., 2012, p. 176). The CC employees have not to interact with other
departments on regular basis. They only have to contact other departments when the problem
or query of the customer is connected with other department (e.g., when there is misprinted or
miscalculation in monthly bill etc.)(Sergeant & Frenkel, 2000, p. 26).
Moreover, the relationship between other departments and CC employees has been
highlighted rigorously. There should be proper communication between other departments of
organization and CC employees. The CC employees should fully aware about any activity that
can influence their work. For example, if marketing department launched a promotional
campaign or new product. The marketing department should brief the CC employees about
the new product and its relevant information. So that, the CC employees can answers the
queries of the customers about new product. On other hand, when other departments support
CC employee, it promotes the integration among departments and CC employee commitment
towards organization. The lack of integration among other departments and CCC can
negatively influence the CC employee’s loyalty (Sergeant & Frenkel, 2000, p. 27).
Similarly, the CC employee gets frequent support from his/her colleague. However, the
employee has to attend the call and handle the customer himself/herself. The CC employee
can only seek help for his/her colleagues or supervisor when he/she fails to solve the problem
of the customers. The supervisor is liable to serve the customer in case of employee failed to
do so. But supervisor cannot influence the employee’s ability to serve the customer during the
interaction between employee and customer (Sergeant & Frenkel, 2000). Narayanan &
Moynihan (2006, p. 4) stressed on role of supervisor. The authors discussed that supervisor
feedback can increase the mindfulness (Remains in the present) and emotional well being of
the CCC employees. Thus, supervisor feedback on current performance keeps them focusing
on future performance and goals. The continuous supervisor feedback about performance,
improving skill and interaction with customers is a ongoing training which helps CCC
employees to focus on the present reality.
In their research, Witt et al., (2004, p. 151) found that when hardworking CCC employees do
not get supervisor support, autonomy, and participation in decision making, they get
frustrated. Thus it affect their working. When they get these resources, their performance can
be increased. Then CCC managers should carefully use supervisor support because it can
increase the employee’s turnover intentions (Choi et al., 2012, p.510). On the contrary, the
supervisor considerations may not play a pivotal role in establishing role clarity in CCC. The
work environment of CCC is well structured; technology oriented and consisted of already
established procedures and standards. So, the employee might not consider supervisor
perception important in enhancing role clarity (Mukherjee & Malhotra, 2006, p. 462). On the
other hand, team support also helps CC employee in understanding his/her role. Normally, the
CC employees are grouped into teams in CCC. The coordination and interaction among team
members enhance the role clarity in CCC. The learning from colleagues is proved very
important element to get additional knowledge about job in CCC (Mukherjee & Malhotra,
24
2006, p. 461). The team managers continuously monitor the interaction between customers
and CCC employees and discuss their performance with them. The overall team performance
is discussed in group meetings which is the best platform to share experience and practices
among team members (Jasmand et al., 2012, p. 26). Connell & Hannif (2009, p. 371) found
that CCC employees consider job variety an important factor and main reason for employee
absenteeism.
In addition, the learning from customers has been previously studied in face to face contact
centers. The perception and importance of this dimension might be different from CCC
because CC employees continuously deal with customers as compare to face to face contact
center employees. Moreover, the dimension learning form the employee can increase the
employee effective commitment towards his/her organization. Because the CC employee face
customer’s complaints on regular basis, so seeking their opinions can help organization to
remove its flaws, increase customer satisfaction and employee satisfaction. The dimensions,
learning from customers, learning from employees, and information sharing have been
researched before but not in the perspective of job quality in CCC setting (Dun et al., 2012, p.
176).
On the contrary, Mukherjee & Malhotra (2006, p. 459-462) have investigated the relationship
among the different dimensions of job quality (See figure 2). The authors contributed that the
CC employee’s participation in decision making, positive feedback from supervisor, and co-
workers plays an imperative role in increasing role clarity among CC employees. Team
support is also a way to establish role clarity through exchange of knowledge and experiences
among team members. So, it is vital to identify the key variables that contribute to the role
clarity in CCCs. The CC employee’s participation in decision making and team support has
significant effect on role clarity. Although, autonomy and supervisory consideration has not
any significant effect on role clarity. Further, the feedback to employee has direct impact on
role clarity of CC employee. The feedback helps customer contact employee to clearly
understand his/her role. The supervisor should give a positive feedback to CC employee about
his/her good and bad work. It will definitely help to increase him/her role clarity. These
findings are relevant to CCC as previously these variables have only been explored in face to
face contact customer center. (Mukherjee & Malhotra, 2006, p. 461).
Another dimension of job quality ‘Training’ has been discussed by researchers. The CCC
conducts the training for new hired employees. The employees learn how to operate the
different software to do routine work, detail information about company, products, and basic
skills of customer service. Mostly, the employees go through the training program in first year
of job (Valverde et al., 2007 p. 152). Most of the CCC scheduled their training programs at
the time of recruiting employees. Usually, the training program is consisted of giving
knowledge about the products, use of the software, developing and enhancing customer
service skills (Valverde et al., 2007, p. 152). Training and coaching strategies can be utilized
to increase the customer service skill of CCC employees. Adequate knowledge about products
and training should be given to CCC employees, so that, they can serve the customer in well
manner. This will not only positively affect the employee’s behavior but also increase their
performance (Munhurrun et al., 2009, p.5).
On other side, the operational matters, procedures, organizational rules and regulations can
influence the CC employee’s perception about organization and organization commitment.
Some organizations emphasize the cost reduction and profit generation policies which can
influence the CC employee’s commitment towards organization and customer service
(Sergeant & Frenkel, 2000, p. 27). CCC job quality is a good cure for the monotonous job
25
nature in the CCC (Van der aa et al., 2012, p. 3934). When CCC job quality increase, the
CCC job will be more challenging and less monotonous. In result, the employee satisfaction
will be increased and turnover ratio will be decreased. Ultimately, when CC employee will
not leave his/her job, it will not affect the overall quality of the CCC (Van der aa et al., 2012,
p. 3934) Job quality plays an important role in creating satisfied, committed, high-performing
employees. It can also reduce employee turnover, which remains a significant challenge to
CCCs. (Dun et al., 2012, p. 191).
Another important dimension of job quality has been discussed by Budhwar et al., (2009, p.
358). The authors stressed on the importance of career planning. The authors argued that
CCC’s should focus on the career planning, in order to attract and retain qualified employees.
In addition, career opportunity can decrease the employee turnover (Choi et al., 2012, p.510).
The promotion opportunities can increase the quality of job and managers should encourage
to use such practices in order to increae the level of job qulaity in CCC (Gorjup et al., 2008, p.
59). Budhwar et al., (2009, p.356) found in their research that three key factors (Money,
Career opportunities, and work enviornment) motivates the individual to work in CCC.
The CCC should emphasize on internal marketing to improve the relationship between
employees and management. It will also help to increase the overall performance of the
organization. Thus internal marketing can be a good tool to recruit and retain the qualified
personals who can deliver exceptional service to customers. Moreover, to cope with rising
issues, CCC should introduce internal marketing strategies which can encourage the CCC
employees to remain loyal to the organization and provide quality services to customers
(Budhwar et al., 2009, p.358). Similarly, Berry & Parasuraman (1991, p. 151) argued that the
needs and wants of internal customers (CCC employees) should be satisfied through internal
marketing. So that they can provide good services to external customers (CCC customers). In
other study, Cooper & Cronin (2000, p. 177) mentioned that organization tries to motivate its
employees to provide better services through internal marketing.
Dun et al., (2012, p. 173) assimilate different perceptions about job quality and formed the
possible dimensions of job quality in CCC setting. The authors conducted a rigorous research
in six CCCs from different industries. After conducting several focus group sessions and
quantitative analysis. The authors have identified 12 dimensions of job quality, specifically,
for CCC. Some dimensions overlap the previously discussed dimensions (These dimensions
have been presented in table 1). The seven dimensions have been previously discussed and
five dimensions have newly been invented which are following: role ambiguity, information
sharing, role conflict, coaching superior, learning from customers, learning from employees,
opportunity and challenge, enjoying the work, ease of tools, empowerment, integrity, and
atmosphere (Dun et al., 2012, p. 178).
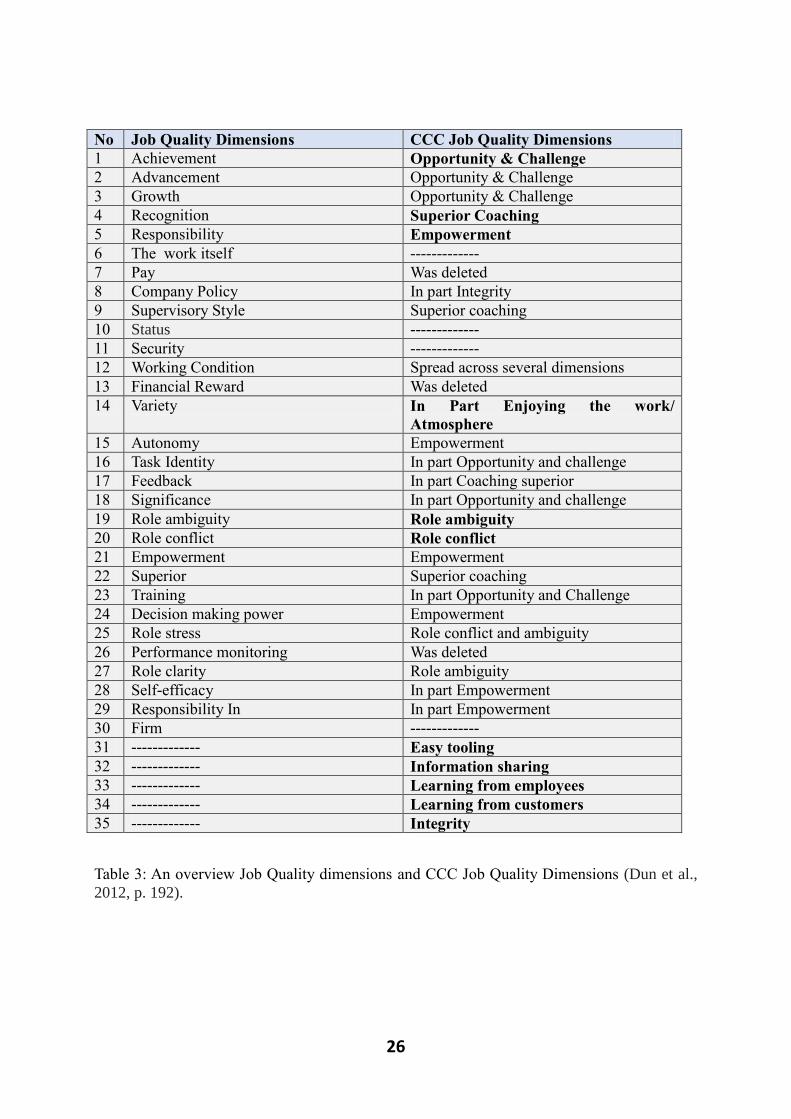
26
No Job Quality Dimensions CCC Job Quality Dimensions
1 Achievement Opportunity & Challenge
2 Advancement Opportunity & Challenge
3 Growth Opportunity & Challenge
4 Recognition Superior Coaching
5 Responsibility Empowerment
6 The work itself -------------
7 Pay Was deleted
8 Company Policy In part Integrity
9 Supervisory Style Superior coaching
10 Status -------------
11 Security -------------
12 Working Condition Spread across several dimensions
13 Financial Reward Was deleted
14 Variety In Part Enjoying the work/
Atmosphere
15 Autonomy Empowerment
16 Task Identity In part Opportunity and challenge
17 Feedback In part Coaching superior
18 Significance In part Opportunity and challenge
19 Role ambiguity Role ambiguity
20 Role conflict Role conflict
21 Empowerment Empowerment
22 Superior Superior coaching
23 Training In part Opportunity and Challenge
24 Decision making power Empowerment
25 Role stress Role conflict and ambiguity
26 Performance monitoring Was deleted
27 Role clarity Role ambiguity
28 Self-efficacy In part Empowerment
29 Responsibility In In part Empowerment
30 Firm -------------
31 ------------- Easy tooling
32 ------------- Information sharing
33 ------------- Learning from employees
34 ------------- Learning from customers
35 ------------- Integrity
Table 3: An overview Job Quality dimensions and CCC Job Quality Dimensions (Dun et al.,
2012, p. 192).
27
Explanation
This table is consists of two columns. The first column contains the dimensions of job quality
which have been discussed by different researchers. The second column contains the 12
dimensions of job quality which have been specifically identified for CCC. The table also
shows that some dimensions are overlapping one another in first column. These dimensions
have been fully or partially replaced by Dun et al., (2012) 12 dimensions.
3.4 CCC job quality dimensions by Dun et al., (2012)
1. Role ambiguity
The role ambiguity means that the employees should have clear goals. They should know
their duties and routine tasks to solve the customer’s problem.
2. Information sharing
This dimension describes that information should be shared among teams and other
departments of the organization. Moreover, CCC employees can share information which they
get from customers. It will help them to improve the overall performance of the organization.
3. Role conflict
Role conflict is related to the perception of employees about how they are regulated by the
higher authorities within their working environment. In simple words role conflict occurs
when employee get confused about some particular work, whether to do it in this way or that
way. For example in CCC employees have to answer the call as quick as possible and on
contrary they have to fully satisfy the customers.
4. Superior coaching
This dimensions contains that supervisor should give feedback to employees on their work in
order to improve their performance. The supervisor should support the employees in case of
employee facing problem and communicate with them to boast their morale.
5. Learning from customers
This dimension entails that CCC and employees should learn from customers. The employee
should learn from customers complaints and share this information with other departments in
order to improve the organization overall performance.
6. Learning from employees
This dimension describes that organization should learn from employees. The organization
should take suggestions from employees in order to improve customer services. The customer
oriented organizations often involve the employees in decision making process in order to
improve customer services.
7. Opportunity and challenge
The dimension sheds light on growth opportunities within the CCC. The employee should feel
that their role in CCC is meaningful and their job should be challenging.
8. Enjoying the work
This dimension denotes that employee should enjoy their work. Their job should be
diversified and should be able to answer customer query during their first call.
28
9. Ease of tools
Almost every CCC use automated tools. CCC should make it possible that tools should be
easy to access and operate. This dimension might be limited to CCC setting, where employees
are mostly dependent on automated tools to solve the problem of customers.
10. Empowerment
This dimension entails that CCC should give some power or authority to employees to solve
the problem of the customers.
11. Integrity
This dimension entails the honesty of organization towards its employees and customers. It is
also discussed the level of customer orientation in organization.
12. Atmosphere
This dimension discusses the atmosphere of the CCC. The CCC atmosphere should consist of
good relationship among team members and supervisor.
(Dun et al., 2012, p. 179-181)
3.5 Customer Satisfaction
The main objective of CCC is to provide efficient customer services in order to retain and
upsurge the customer satisfaction. A plenty of investment has been done by CCC in the field
of customer relationship management (CRM) that holds and maintains the information of
their customers and manage their interactions with CC employees of the organization. The
stimulating task of the mangers in CCC is to manage the organizational expenses by
designing quality of jobs for employees, along with the enhancement of organization’s
relationship with its customers (Aksin et al., 2007, p. 682). The more intensive customer
oriented organizations with CCC tries to distinguish themselves from the other CCC by
showing more care about their customers (providing 24 hour telephonic services), holds better
place in the customers mind than the organizations providing services with limitations
(Feinberg et al., 2000, p. 131; Jaiswal, 2008, p. 405).
The organization which fails to deliver the services as expected by the customers or the
services are not up to the mark as perceived, results in a dis-satisfaction of the customers. The
research on dis-satisfied customers shows that the big proportion of the customers who are not
satisfied with the services provided, do not complain to the organization but however most
likely to quit their association with the organization as a result of their dis-satisfaction. The
literature on CCC highlights the importance of its correlation with customer satisfaction as
80% of the organizations communicate with its customers via CCC, and 92% of the
customers’ perception about organization depends on their experience and dealing with the
CCC (Aksin et al., 2007, p. 681).
Furthermore, Customer satisfaction is a broad field of research and vast literature is available
by different researchers. The precise definition of customer satisfaction by Oliver (1997, p.
28) is “the consumer’s fulfillment response, the degree to which the level of fulfillment is
pleasant or unpleasant”. In the same way Zeithmal & Bitner (2000, p. 75) defines that the
judgment of customers depends on the products or services provided by the organization,

29
whether the product or services are up to their perceived expectations. The organizations
(CCC) focusing and perusing the customer orientation approaches, develop their strategies by
considering the three most likely questions (Feinberg et al., 2000, p. 131).
What is meant by the high quality of services?
What are the possible alternatives available to deliver those services?
How to maintain and enhance those services?
The previous research on customer satisfaction provides with several variables on perception
of customers about the quality of services (Kantsperger & Kunz, 2005, p.144). In CCC
context, there are 13 variables frequently used by different researchers to determine the
customer satisfaction (Feinberg et al., 2000, p. 133-134; Jaiswal, 2008, p. 408). These
variables may also be useful for CCC managers to consider while designing job quality:
1. ASA (average speed of answer)
2. Queue time (how much time the caller has to wait in a queue to get answered by the
agent/ representative employee)
3. First-call resolution (Percentage of the caller whose problem get resolved at first call
and got satisfied)
4. Abandonment rate (the percentage of calls dropped by customers, before they get
answered)
5. Average talk time (the time it takes to answer and satisfy the customer)
6. Adherence (the percentage of representative employees performing duties as
assigned?)
7. Average work time after call (how long does it take to make notes after the call or the
time it takes to completely process the call)
8. Percentage of calls blocked (the callers facing difficulties to connect a call because of
busy tune and even are not able to be placed in a queue)
9. Time before abandoning (average time the caller has to wait in a queue)
10. Call per agent (Inbound calls per CC representative (CCR) eight hour shift)
11. CCCR turnover (the representative employees who left specified time )
12. Total calls (The total number of calls dialed to the CCC)
13. Service levels (The proportion of number of calls answered within the agreed upon
time interval and total calls received)
The study conducted by (Feinberg et al., 2000) about ‘operational determinants of customer
satisfaction’ shows that some of the variables mentioned above are useful but only at low
levels. The significant but a week relationship was found between only two variables. These
two variables are ‘percentage of calls closed on first contact’ and ‘average abandonment’.
There could be some others that may affect the job quality of representative employees and
determines the caller (customer) satisfaction in CCC industry that should be taken into
account in a future research (Feinberg et al., 2000, p. 139). We have considered these
variables while designing the questionnaire about the variables of service quality and
customer satisfaction. The details and results of these questions are discussed in empirical
findings chapter.
30
3.6 Theories and Models
The theory and models which have been previously developed in regard to our study are as
follows:
3.6.1 The Service Profit Chain theory
The model of service profit chain is related to our research as it includes the variables of
employee’s satisfaction, commitment, loyalty, service quality, customer satisfaction and
loyalty in the services oriented organizations. Service profit chain (SPC) model is one of the
best models found in the literature to study the sustainable competitiveness of the
organizations struggling in services industries (Lau, 2000, p. 422). SPC proposes that the
employee’s satisfaction and loyalty is important if organization aims to deliver high quality of
services as perceived by its customers. In addition the customers who are satisfied with the
organization’s services become loyal to it and finally the whole business performance is
enhanced (Yee et al., 2011, p. 236). Loveman (1998) investigated the linkages within SPC
model while conducting his research on regional banks. His results show that the relationships
are confusing and were not explicitly validated in his study. However the research conducted
by Loveman (1998) was limited to single service organization, therefore his findings cannot
be generalized (yee et al., 2011, p. 237).
As our study directs us to test the relationships between job quality, satisfaction of employees
and its effect on customer satisfaction through quality of services provided by the
representative employees of CCC, the SPC will help us to build and testify these connections.
Heskett et al., (1994, p. 164-164) provides a depth analysis of SPC model and defines the
linkages between variables used. They argue that the income and progress of the organization
is basically the return of customer loyalty. Customers become loyal only when they are
satisfied. The customer satisfaction is attained by providing high quality services to the
customers. The image of the organization can be developed by the satisfied, committed and
productive employees. The satisfaction of employees, in return, is basically driven from the
high quality support services and strategies that give employees a provision of transforming
the positive response to organization’s customers. In their research on SPC Haskett et al.,
(1997, p. 12) argues that the strong associations were found in between these variables:
Revenue and customer loyalty
Employee loyalty and customer loyalty
Employee satisfaction and customer satisfaction.
In the service industries these relationships supports and highly dependent on each other. The
financial measures like revenue and growth are obviously important for all organizations but
in services industries the firms should focus on the dimension that are more essential to reach
expected financial results. Among these dimensions, the basic one is the quality of services
provided to the customers that satisfy and make them loyal. The organizations whose
strategies are successfully aligned with the SPC, gets higher returns. They make their rules
and policies by considering the factors of SPC and differentiate themselves from their
competitors. Moreover the author relates SPC with the game of chess. As there are various
strategies to make superior moves depending on the skills, the player possess, the SPC
concepts are also flexible enough that could be applied in different meaningful ways, as
derived from different studies (Haskett et al., 1997, p. 18). On the basis of above discussion,
we will use SPC model with the assumption that if the employees are provided with high
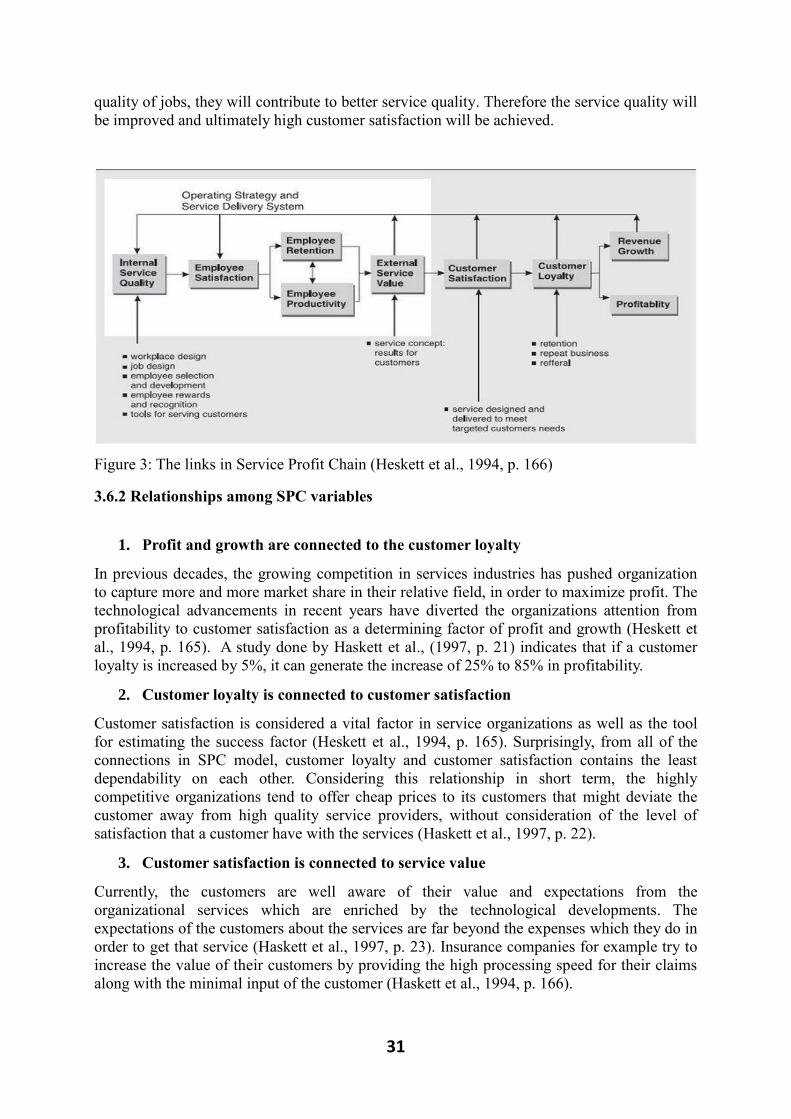
31
quality of jobs, they will contribute to better service quality. Therefore the service quality will
be improved and ultimately high customer satisfaction will be achieved.
Figure 3: The links in Service Profit Chain (Heskett et al., 1994, p. 166)
3.6.2 Relationships among SPC variables
1. Profit and growth are connected to the customer loyalty
In previous decades, the growing competition in services industries has pushed organization
to capture more and more market share in their relative field, in order to maximize profit. The
technological advancements in recent years have diverted the organizations attention from
profitability to customer satisfaction as a determining factor of profit and growth (Heskett et
al., 1994, p. 165). A study done by Haskett et al., (1997, p. 21) indicates that if a customer
loyalty is increased by 5%, it can generate the increase of 25% to 85% in profitability.
2. Customer loyalty is connected to customer satisfaction
Customer satisfaction is considered a vital factor in service organizations as well as the tool
for estimating the success factor (Heskett et al., 1994, p. 165). Surprisingly, from all of the
connections in SPC model, customer loyalty and customer satisfaction contains the least
dependability on each other. Considering this relationship in short term, the highly
competitive organizations tend to offer cheap prices to its customers that might deviate the
customer away from high quality service providers, without consideration of the level of
satisfaction that a customer have with the services (Haskett et al., 1997, p. 22).
3. Customer satisfaction is connected to service value
Currently, the customers are well aware of their value and expectations from the
organizational services which are enriched by the technological developments. The
expectations of the customers about the services are far beyond the expenses which they do in
order to get that service (Haskett et al., 1997, p. 23). Insurance companies for example try to
increase the value of their customers by providing the high processing speed for their claims
along with the minimal input of the customer (Haskett et al., 1994, p. 166).
32
4. Service value is connected to employee productivity
Haskett et al., (1994, 1997, p. 26) gave an example of Southwest Airlines and they argue that
the 86% of the employees of the company are unionized. Their duties are assigned in a way
that they are able to perform various tasks if needed. The companies procedures and practices
such as open seating and the using simple, color coded, reusable boarding passes, helps
employees to board much more passengers than the other competing airlines in United States.
The company utilizes their aircrafts more than other companies because of the efficient
reloading time i.e. two –third of its flights in just twenty minutes or lesser. This provides the
company with frequent availability of aircrafts and short-haul routes that does not need the
long stopovers for flight crews. Consequently, Southwest Airlines operates with
approximately 40% more aircrafts and pilots than the other service providers in US. The
factors in discussed in the example provides with the understanding that how the company
manages to lower its fare up to 60% to 70% than the companies working in the same industry.
5. Employee productivity is connected to loyalty
Previously the employee turnover in any service organization was taken as a loss of the cost
of hiring, developing and training. But nowadays, the firms have realized that the more
effecting factor of turnover is reduced productivity and customer satisfaction. The
organizations having low employee turnover rate becomes successful by enabling their
employees to know more about its valued customers and treating them accordingly (Haskett et
al., 1997, p. 28).
6. Employee loyalty is connected to employee satisfaction
The big organizations try to create the environment in which employees openly share their
vales and become frank to each other as a family. In some organizations like Southwest
Airlines, employees are not limited to meet each other with the office boundaries but arrange
some activities or parties outside the organization. The purpose behind the creation of this
kind of culture among employees is to increase their satisfaction and loyalty (Haskett et al.,
1997, p. 28).
7. Employee satisfaction is connected to internal quality
The internal quality of working environment is the most influencing factor of employee
satisfaction. The internal quality is derived by the perception of employee about his job, co-
workers and fellows in the organization. The research suggests that the most valuable thing
for representative employees in their job is the ability and authority to attain results for
customers. The employees feel more comfortable and satisfied, if they have to deal with the
customers on their own instead of frequently consulting supervisor on the behalf of customers
(Haskett et al., 1997, p. 29).
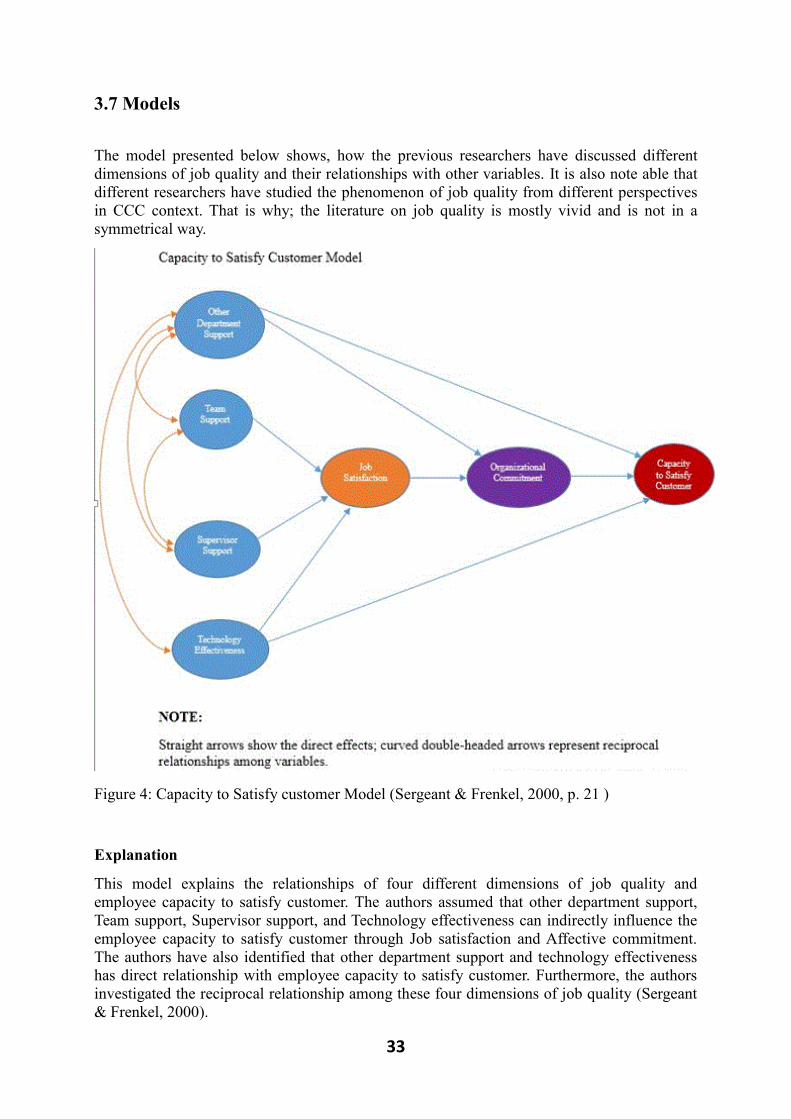
33
3.7 Models
The model presented below shows, how the previous researchers have discussed different
dimensions of job quality and their relationships with other variables. It is also note able that
different researchers have studied the phenomenon of job quality from different perspectives
in CCC context. That is why; the literature on job quality is mostly vivid and is not in a
symmetrical way.
Figure 4: Capacity to Satisfy customer Model (Sergeant & Frenkel, 2000, p. 21 )
Explanation
This model explains the relationships of four different dimensions of job quality and
employee capacity to satisfy customer. The authors assumed that other department support,
Team support, Supervisor support, and Technology effectiveness can indirectly influence the
employee capacity to satisfy customer through Job satisfaction and Affective commitment.
The authors have also identified that other department support and technology effectiveness
has direct relationship with employee capacity to satisfy customer. Furthermore, the authors
investigated the reciprocal relationship among these four dimensions of job quality (Sergeant
& Frenkel, 2000).
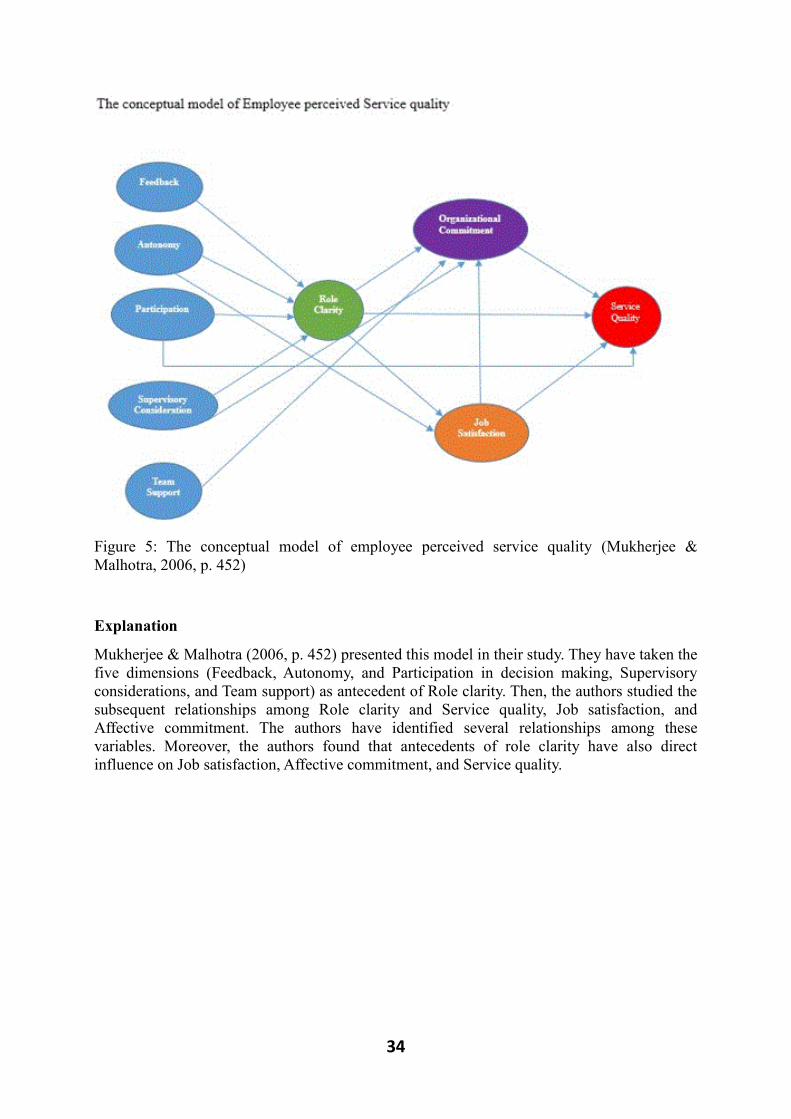
34
Figure 5: The conceptual model of employee perceived service quality (Mukherjee &
Malhotra, 2006, p. 452)
Explanation
Mukherjee & Malhotra (2006, p. 452) presented this model in their study. They have taken the
five dimensions (Feedback, Autonomy, and Participation in decision making, Supervisory
considerations, and Team support) as antecedent of Role clarity. Then, the authors studied the
subsequent relationships among Role clarity and Service quality, Job satisfaction, and
Affective commitment. The authors have identified several relationships among these
variables. Moreover, the authors found that antecedents of role clarity have also direct
influence on Job satisfaction, Affective commitment, and Service quality.
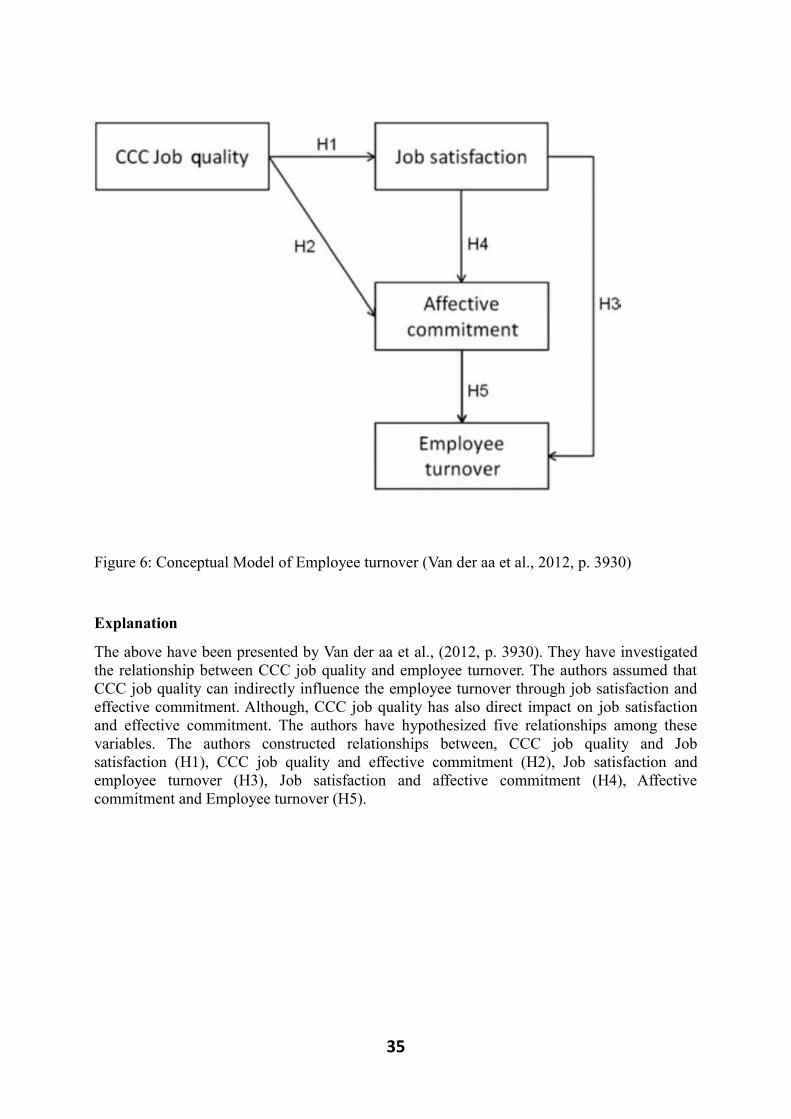
35
Figure 6: Conceptual Model of Employee turnover (Van der aa et al., 2012, p. 3930)
Explanation
The above have been presented by Van der aa et al., (2012, p. 3930). They have investigated
the relationship between CCC job quality and employee turnover. The authors assumed that
CCC job quality can indirectly influence the employee turnover through job satisfaction and
effective commitment. Although, CCC job quality has also direct impact on job satisfaction
and effective commitment. The authors have hypothesized five relationships among these
variables. The authors constructed relationships between, CCC job quality and Job
satisfaction (H1), CCC job quality and effective commitment (H2), Job satisfaction and
employee turnover (H3), Job satisfaction and affective commitment (H4), Affective
commitment and Employee turnover (H5).
36
3.8 Relationship between Job quality and Customer satisfaction
After thoroughly reviewing the previous literature on CCC and service industry, we did not
find any study on direct relationship between job quality and customer satisfaction. However,
we have found some variables that indicate an indirect relationship between job quality and
customer satisfaction. Previous researchers have studied the relationships among these
variables separately, but some of them have discussed and proposed some models to show
interdependencies between these variables (Sergeant & Frenkel, 2000, p. 19).
These variables and their relationships are discussed below:
3.8.1 Hypothesis development
1. Job quality and Job satisfaction
The job quality has a direct positive effect on job satisfaction (Van der aa et al., 2012, p.
3925). Mukherjee & Malhotra (2006, p. 461) mentioned in their paper, CC employees who
are clear about their roles will be satisfied with their jobs. Moreover another dimension of job
quality, work fairness has positive impact on job satisfaction (Bettencourt & Brown, 1997, p.
49). Furthermore Mukherjee & Malhotra (2006, p. 460-462) discussed that autonomy is
necessary in CCC because customer services cannot be fully standardized. The authors
suggested that CC employees should be given some leverage to serve the customer according
to circumstances. It will definitely increase the job satisfaction of the employee. The authors
investigated and found that role clarity and autonomy both has direct positive effect on job
satisfaction. Although, complete autonomy cannot be allowed in customer call center because
of fixed policies and procedures but some authority can be given to employees to serve the
customers. In the end, it will increase the employee’s job satisfaction (Mukherjee & Malhotra,
2006, p. 463).
Likewise, Sergeant & Frenkel (2000, p. 26) discovered that supervisor support, team support,
and technology has direct positive relationship with job satisfaction. Bettencourt & Brown
(1997, p. 54) have also discussed the key factors like job supervision, pay, job standards etc.,
contribute to job quality. The CC employees use technology extensively in CCC, definitely
the effectiveness of technology will affect their job satisfaction. Similarly, Bettencourt &
Brown (1997, p. 55) studied that one of the dimension of job quality, job supervision has very
significant effect on it. However, Sergeant & Frenkel (2000, p. 26) did not found any direct
relationship between department support and job satisfaction and this might be happened
because of low interaction between CC employees and other departments in daily routine
work. Supervisor feedback has also positive impact on job satisfaction. Specially, when a
supervisor discusses a particular issue or call with CC employee and gives some useful
suggestions to improve his/her skills. This can enhance employee’s job satisfaction (Sergeant
& Frenkel, 2000, p. 27).
In addition, Van der aa et al., (2012, p. 3930) referred that if job experience of the CC
employee’s will be positive and higher than their job expectation, job quality will be high. The
high level of job quality will enhance the job satisfaction. Likewise, Kantsperger & Kunz
(2005, p. 148) argued that organizations should learn from employee about their thoughts and
experience of job. It will not only increase their job satisfaction but also increase their loyalty
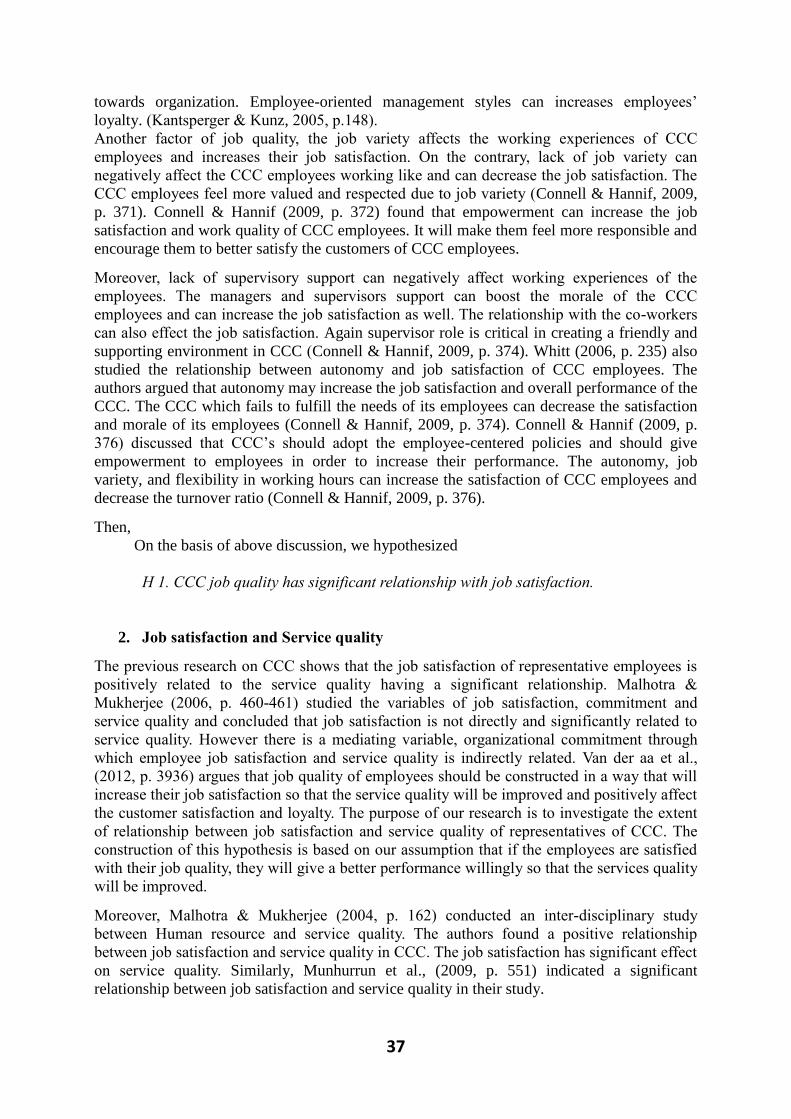
37
towards organization. Employee-oriented management styles can increases employees’
loyalty. (Kantsperger & Kunz, 2005, p.148).
Another factor of job quality, the job variety affects the working experiences of CCC
employees and increases their job satisfaction. On the contrary, lack of job variety can
negatively affect the CCC employees working like and can decrease the job satisfaction. The
CCC employees feel more valued and respected due to job variety (Connell & Hannif, 2009,
p. 371). Connell & Hannif (2009, p. 372) found that empowerment can increase the job
satisfaction and work quality of CCC employees. It will make them feel more responsible and
encourage them to better satisfy the customers of CCC employees.
Moreover, lack of supervisory support can negatively affect working experiences of the
employees. The managers and supervisors support can boost the morale of the CCC
employees and can increase the job satisfaction as well. The relationship with the co-workers
can also effect the job satisfaction. Again supervisor role is critical in creating a friendly and
supporting environment in CCC (Connell & Hannif, 2009, p. 374). Whitt (2006, p. 235) also
studied the relationship between autonomy and job satisfaction of CCC employees. The
authors argued that autonomy may increase the job satisfaction and overall performance of the
CCC. The CCC which fails to fulfill the needs of its employees can decrease the satisfaction
and morale of its employees (Connell & Hannif, 2009, p. 374). Connell & Hannif (2009, p.
376) discussed that CCC’s should adopt the employee-centered policies and should give
empowerment to employees in order to increase their performance. The autonomy, job
variety, and flexibility in working hours can increase the satisfaction of CCC employees and
decrease the turnover ratio (Connell & Hannif, 2009, p. 376).
Then,
On the basis of above discussion, we hypothesized
H 1. CCC job quality has significant relationship with job satisfaction.
2. Job satisfaction and Service quality
The previous research on CCC shows that the job satisfaction of representative employees is
positively related to the service quality having a significant relationship. Malhotra &
Mukherjee (2006, p. 460-461) studied the variables of job satisfaction, commitment and
service quality and concluded that job satisfaction is not directly and significantly related to
service quality. However there is a mediating variable, organizational commitment through
which employee job satisfaction and service quality is indirectly related. Van der aa et al.,
(2012, p. 3936) argues that job quality of employees should be constructed in a way that will
increase their job satisfaction so that the service quality will be improved and positively affect
the customer satisfaction and loyalty. The purpose of our research is to investigate the extent
of relationship between job satisfaction and service quality of representatives of CCC. The
construction of this hypothesis is based on our assumption that if the employees are satisfied
with their job quality, they will give a better performance willingly so that the services quality
will be improved.
Moreover, Malhotra & Mukherjee (2004, p. 162) conducted an inter-disciplinary study
between Human resource and service quality. The authors found a positive relationship
between job satisfaction and service quality in CCC. The job satisfaction has significant effect
on service quality. Similarly, Munhurrun et al., (2009, p. 551) indicated a significant
relationship between job satisfaction and service quality in their study.
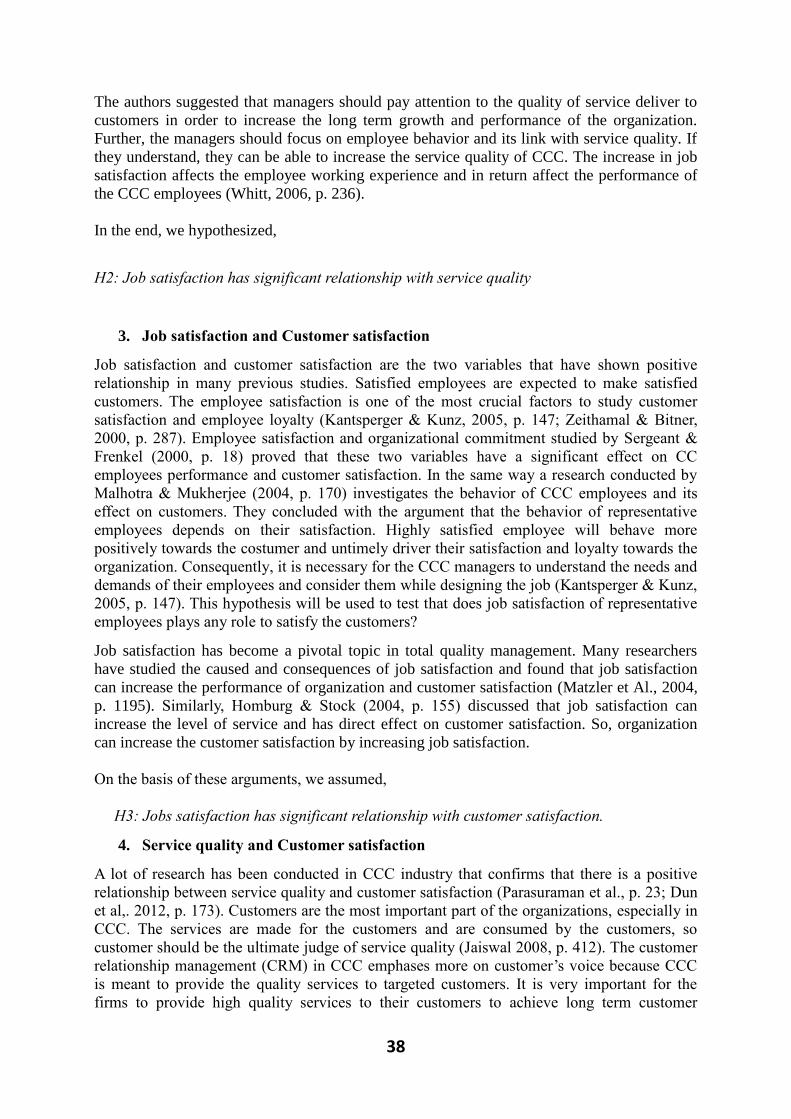
38
The authors suggested that managers should pay attention to the quality of service deliver to
customers in order to increase the long term growth and performance of the organization.
Further, the managers should focus on employee behavior and its link with service quality. If
they understand, they can be able to increase the service quality of CCC. The increase in job
satisfaction affects the employee working experience and in return affect the performance of
the CCC employees (Whitt, 2006, p. 236).
In the end, we hypothesized,
H2: Job satisfaction has significant relationship with service quality
3. Job satisfaction and Customer satisfaction
Job satisfaction and customer satisfaction are the two variables that have shown positive
relationship in many previous studies. Satisfied employees are expected to make satisfied
customers. The employee satisfaction is one of the most crucial factors to study customer
satisfaction and employee loyalty (Kantsperger & Kunz, 2005, p. 147; Zeithamal & Bitner,
2000, p. 287). Employee satisfaction and organizational commitment studied by Sergeant &
Frenkel (2000, p. 18) proved that these two variables have a significant effect on CC
employees performance and customer satisfaction. In the same way a research conducted by
Malhotra & Mukherjee (2004, p. 170) investigates the behavior of CCC employees and its
effect on customers. They concluded with the argument that the behavior of representative
employees depends on their satisfaction. Highly satisfied employee will behave more
positively towards the costumer and untimely driver their satisfaction and loyalty towards the
organization. Consequently, it is necessary for the CCC managers to understand the needs and
demands of their employees and consider them while designing the job (Kantsperger & Kunz,
2005, p. 147). This hypothesis will be used to test that does job satisfaction of representative
employees plays any role to satisfy the customers?
Job satisfaction has become a pivotal topic in total quality management. Many researchers
have studied the caused and consequences of job satisfaction and found that job satisfaction
can increase the performance of organization and customer satisfaction (Matzler et Al., 2004,
p. 1195). Similarly, Homburg & Stock (2004, p. 155) discussed that job satisfaction can
increase the level of service and has direct effect on customer satisfaction. So, organization
can increase the customer satisfaction by increasing job satisfaction.
On the basis of these arguments, we assumed,
H3: Jobs satisfaction has significant relationship with customer satisfaction.
4. Service quality and Customer satisfaction
A lot of research has been conducted in CCC industry that confirms that there is a positive
relationship between service quality and customer satisfaction (Parasuraman et al., p. 23; Dun
et al,. 2012, p. 173). Customers are the most important part of the organizations, especially in
CCC. The services are made for the customers and are consumed by the customers, so
customer should be the ultimate judge of service quality (Jaiswal 2008, p. 412). The customer
relationship management (CRM) in CCC emphases more on customer’s voice because CCC
is meant to provide the quality services to targeted customers. It is very important for the
firms to provide high quality services to their customers to achieve long term customer
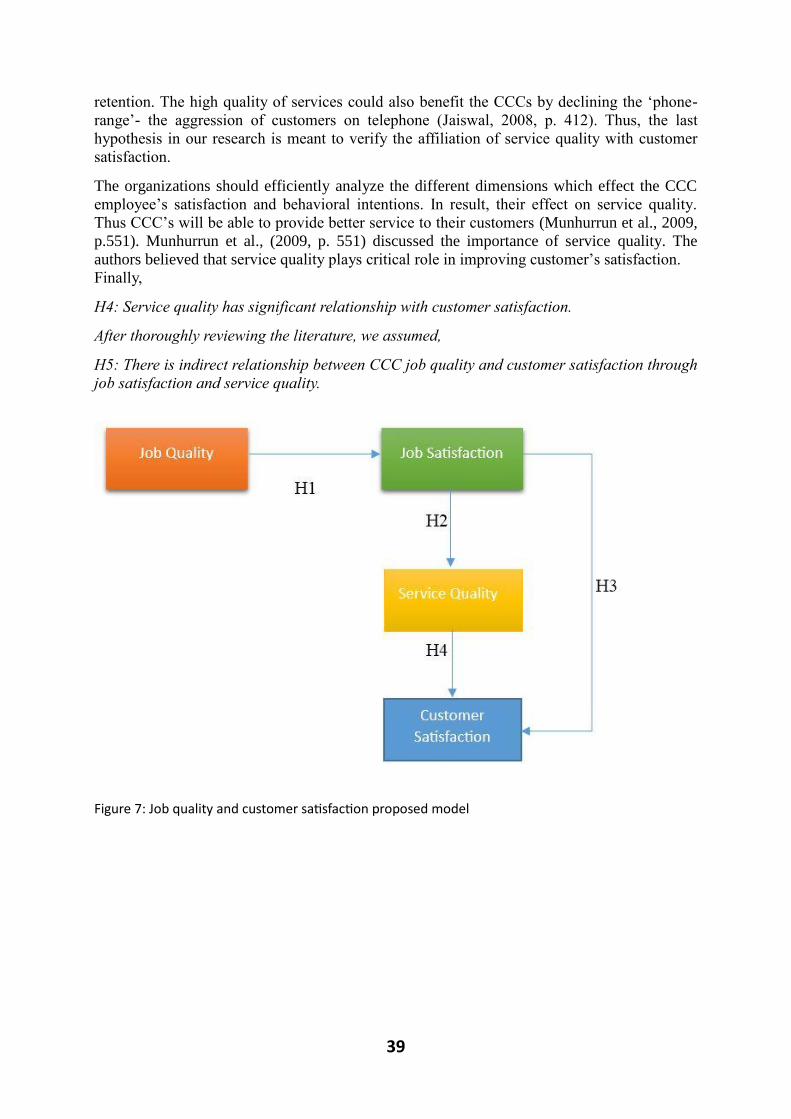
39
retention. The high quality of services could also benefit the CCCs by declining the ‘phone-
range’- the aggression of customers on telephone (Jaiswal, 2008, p. 412). Thus, the last
hypothesis in our research is meant to verify the affiliation of service quality with customer
satisfaction.
The organizations should efficiently analyze the different dimensions which effect the CCC
employee’s satisfaction and behavioral intentions. In result, their effect on service quality.
Thus CCC’s will be able to provide better service to their customers (Munhurrun et al., 2009,
p.551). Munhurrun et al., (2009, p. 551) discussed the importance of service quality. The
authors believed that service quality plays critical role in improving customer’s satisfaction.
Finally,
H4: Service quality has significant relationship with customer satisfaction.
After thoroughly reviewing the literature, we assumed,
H5: There is indirect relationship between CCC job quality and customer satisfaction through
job satisfaction and service quality.
Figure 7: Job quality and customer satisfaction proposed model
40
Figure 8: Outline of Theoretical Framework
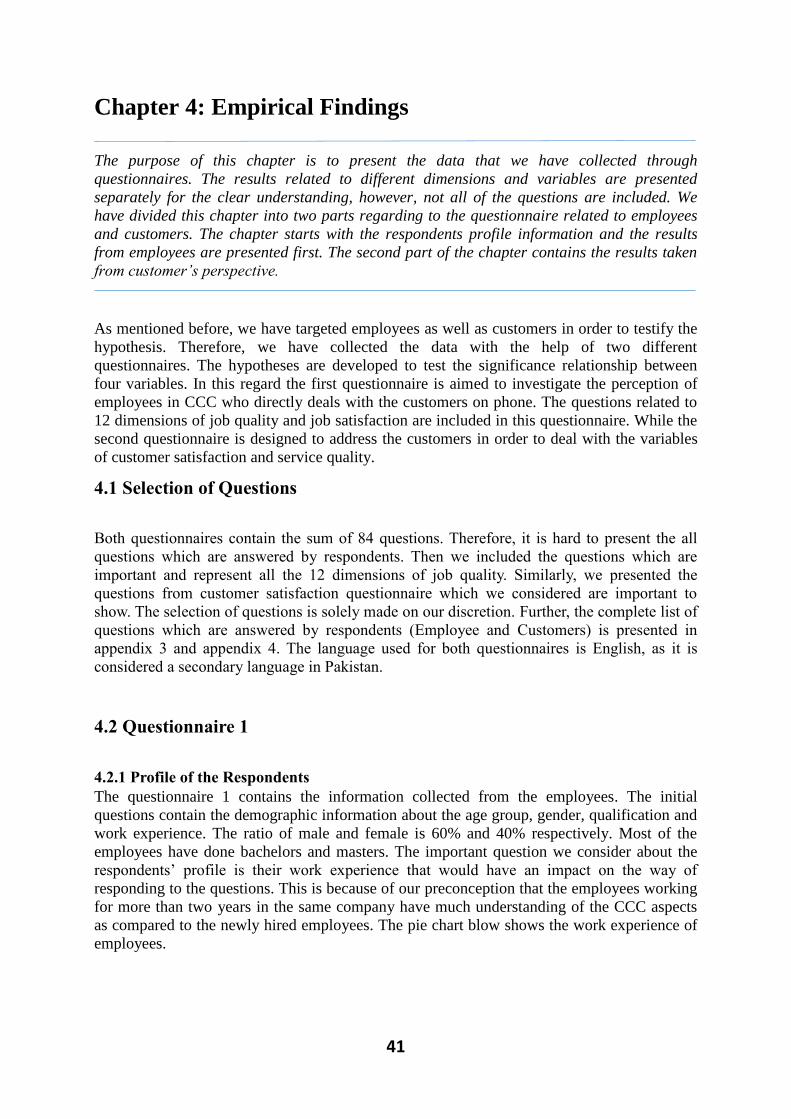
41
Chapter 4: Empirical Findings
The purpose of this chapter is to present the data that we have collected through
questionnaires. The results related to different dimensions and variables are presented
separately for the clear understanding, however, not all of the questions are included. We
have divided this chapter into two parts regarding to the questionnaire related to employees
and customers. The chapter starts with the respondents profile information and the results
from employees are presented first. The second part of the chapter contains the results taken
from customer’s perspective.
As mentioned before, we have targeted employees as well as customers in order to testify the
hypothesis. Therefore, we have collected the data with the help of two different
questionnaires. The hypotheses are developed to test the significance relationship between
four variables. In this regard the first questionnaire is aimed to investigate the perception of
employees in CCC who directly deals with the customers on phone. The questions related to
12 dimensions of job quality and job satisfaction are included in this questionnaire. While the
second questionnaire is designed to address the customers in order to deal with the variables
of customer satisfaction and service quality.
4.1 Selection of Questions
Both questionnaires contain the sum of 84 questions. Therefore, it is hard to present the all
questions which are answered by respondents. Then we included the questions which are
important and represent all the 12 dimensions of job quality. Similarly, we presented the
questions from customer satisfaction questionnaire which we considered are important to
show. The selection of questions is solely made on our discretion. Further, the complete list of
questions which are answered by respondents (Employee and Customers) is presented in
appendix 3 and appendix 4. The language used for both questionnaires is English, as it is
considered a secondary language in Pakistan.
4.2 Questionnaire 1
4.2.1 Profile of the Respondents
The questionnaire 1 contains the information collected from the employees. The initial
questions contain the demographic information about the age group, gender, qualification and
work experience. The ratio of male and female is 60% and 40% respectively. Most of the
employees have done bachelors and masters. The important question we consider about the
respondents’ profile is their work experience that would have an impact on the way of
responding to the questions. This is because of our preconception that the employees working
for more than two years in the same company have much understanding of the CCC aspects
as compared to the newly hired employees. The pie chart blow shows the work experience of
employees.
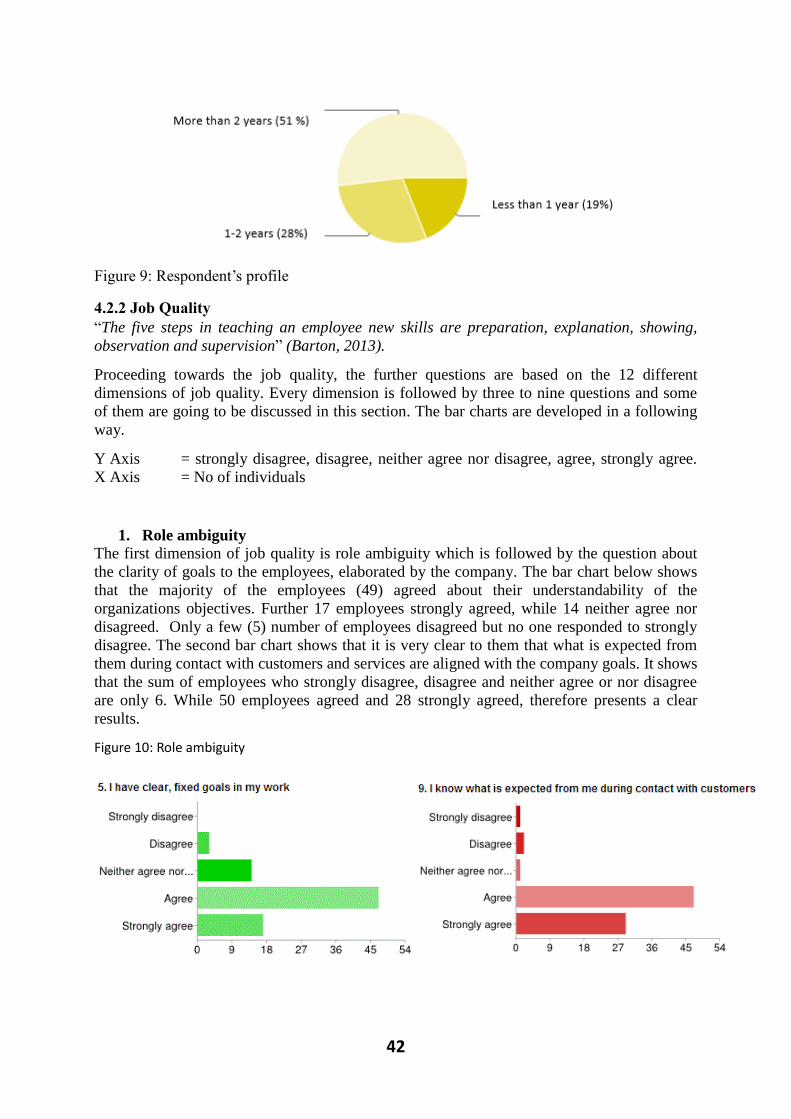
42
Figure 9: Respondent’s profile
4.2.2 Job Quality
“The five steps in teaching an employee new skills are preparation, explanation, showing,
observation and supervision” (Barton, 2013).
Proceeding towards the job quality, the further questions are based on the 12 different
dimensions of job quality. Every dimension is followed by three to nine questions and some
of them are going to be discussed in this section. The bar charts are developed in a following
way.
Y Axis = strongly disagree, disagree, neither agree nor disagree, agree, strongly agree.
X Axis = No of individuals
1. Role ambiguity
The first dimension of job quality is role ambiguity which is followed by the question about
the clarity of goals to the employees, elaborated by the company. The bar chart below shows
that the majority of the employees (49) agreed about their understandability of the
organizations objectives. Further 17 employees strongly agreed, while 14 neither agree nor
disagreed. Only a few (5) number of employees disagreed but no one responded to strongly
disagree. The second bar chart shows that it is very clear to them that what is expected from
them during contact with customers and services are aligned with the company goals. It shows
that the sum of employees who strongly disagree, disagree and neither agree or nor disagree
are only 6. While 50 employees agreed and 28 strongly agreed, therefore presents a clear
results.
Figure 10: Role ambiguity
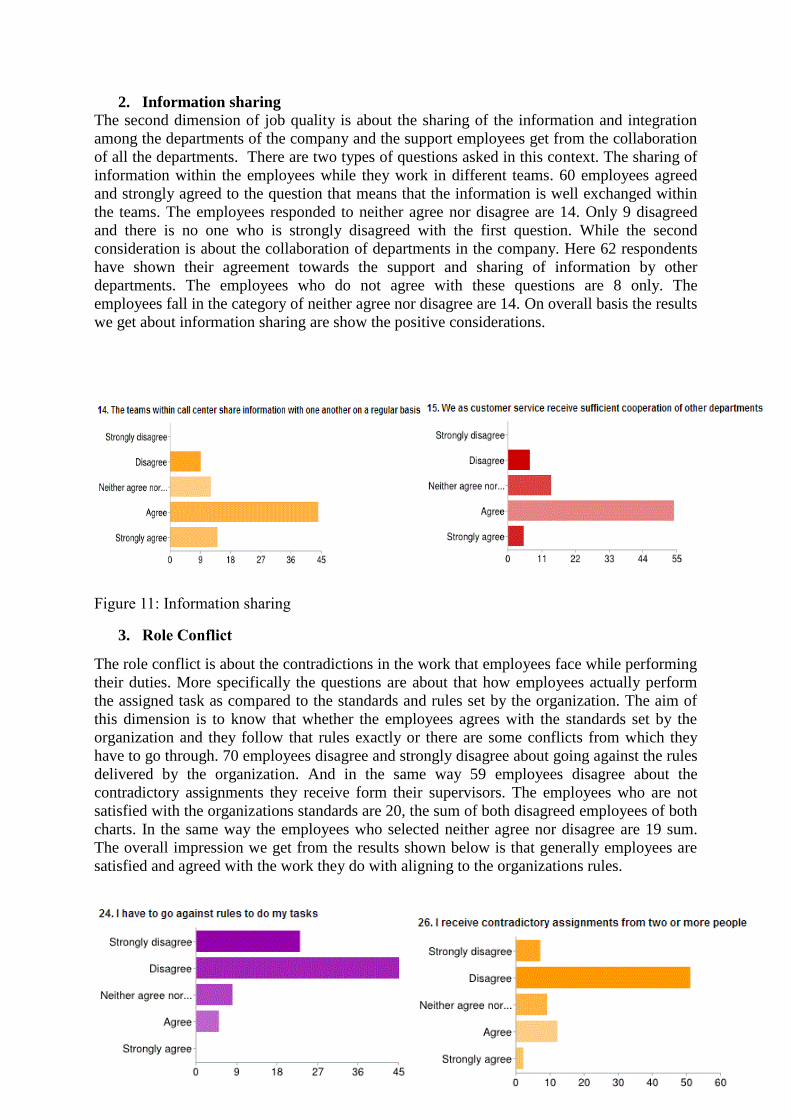
43
2. Information sharing
The second dimension of job quality is about the sharing of the information and integration
among the departments of the company and the support employees get from the collaboration
of all the departments. There are two types of questions asked in this context. The sharing of
information within the employees while they work in different teams. 60 employees agreed
and strongly agreed to the question that means that the information is well exchanged within
the teams. The employees responded to neither agree nor disagree are 14. Only 9 disagreed
and there is no one who is strongly disagreed with the first question. While the second
consideration is about the collaboration of departments in the company. Here 62 respondents
have shown their agreement towards the support and sharing of information by other
departments. The employees who do not agree with these questions are 8 only. The
employees fall in the category of neither agree nor disagree are 14. On overall basis the results
we get about information sharing are show the positive considerations.
Figure 11: Information sharing
3. Role Conflict
The role conflict is about the contradictions in the work that employees face while performing
their duties. More specifically the questions are about that how employees actually perform
the assigned task as compared to the standards and rules set by the organization. The aim of
this dimension is to know that whether the employees agrees with the standards set by the
organization and they follow that rules exactly or there are some conflicts from which they
have to go through. 70 employees disagree and strongly disagree about going against the rules
delivered by the organization. And in the same way 59 employees disagree about the
contradictory assignments they receive form their supervisors. The employees who are not
satisfied with the organizations standards are 20, the sum of both disagreed employees of both
charts. In the same way the employees who selected neither agree nor disagree are 19 sum.
The overall impression we get from the results shown below is that generally employees are
satisfied and agreed with the work they do with aligning to the organizations rules.
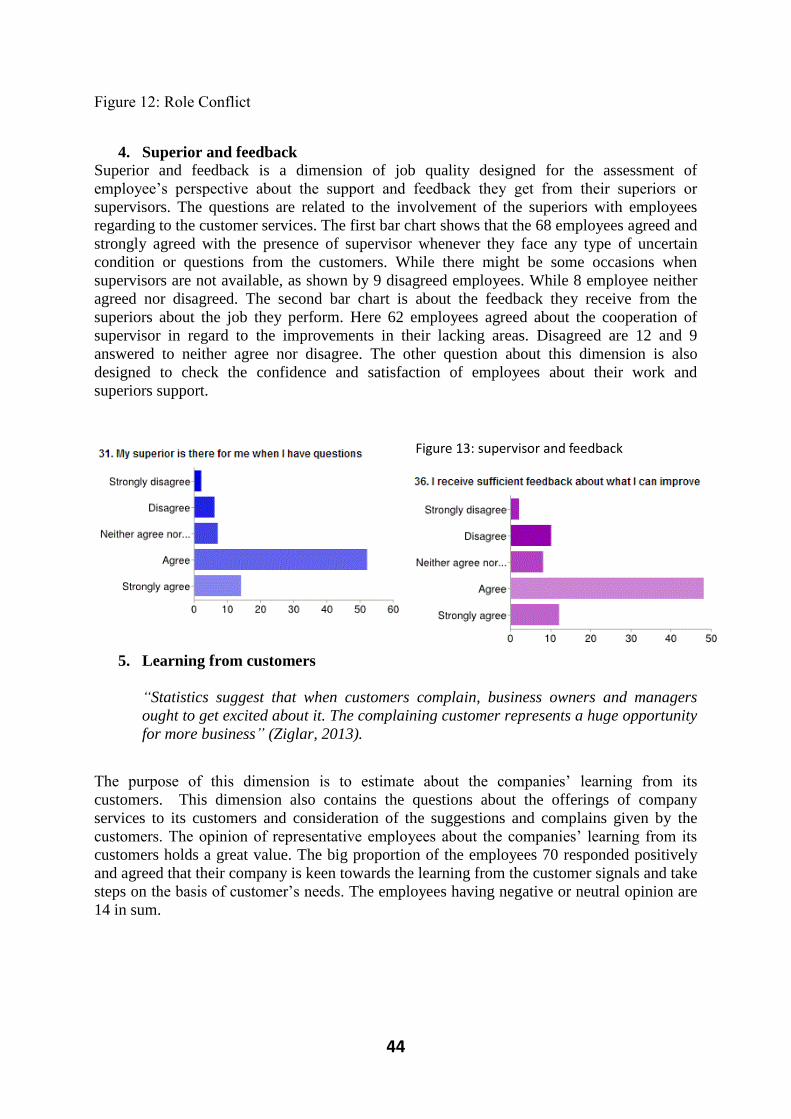
44
Figure 12: Role Conflict
4. Superior and feedback
Superior and feedback is a dimension of job quality designed for the assessment of
employee’s perspective about the support and feedback they get from their superiors or
supervisors. The questions are related to the involvement of the superiors with employees
regarding to the customer services. The first bar chart shows that the 68 employees agreed and
strongly agreed with the presence of supervisor whenever they face any type of uncertain
condition or questions from the customers. While there might be some occasions when
supervisors are not available, as shown by 9 disagreed employees. While 8 employee neither
agreed nor disagreed. The second bar chart is about the feedback they receive from the
superiors about the job they perform. Here 62 employees agreed about the cooperation of
supervisor in regard to the improvements in their lacking areas. Disagreed are 12 and 9
answered to neither agree nor disagree. The other question about this dimension is also
designed to check the confidence and satisfaction of employees about their work and
superiors support.
Figure 13: supervisor and feedback
5. Learning from customers
“Statistics suggest that when customers complain, business owners and managers
ought to get excited about it. The complaining customer represents a huge opportunity
for more business” (Ziglar, 2013).
The purpose of this dimension is to estimate about the companies’ learning from its
customers. This dimension also contains the questions about the offerings of company
services to its customers and consideration of the suggestions and complains given by the
customers. The opinion of representative employees about the companies’ learning from its
customers holds a great value. The big proportion of the employees 70 responded positively
and agreed that their company is keen towards the learning from the customer signals and take
steps on the basis of customer’s needs. The employees having negative or neutral opinion are
14 in sum.
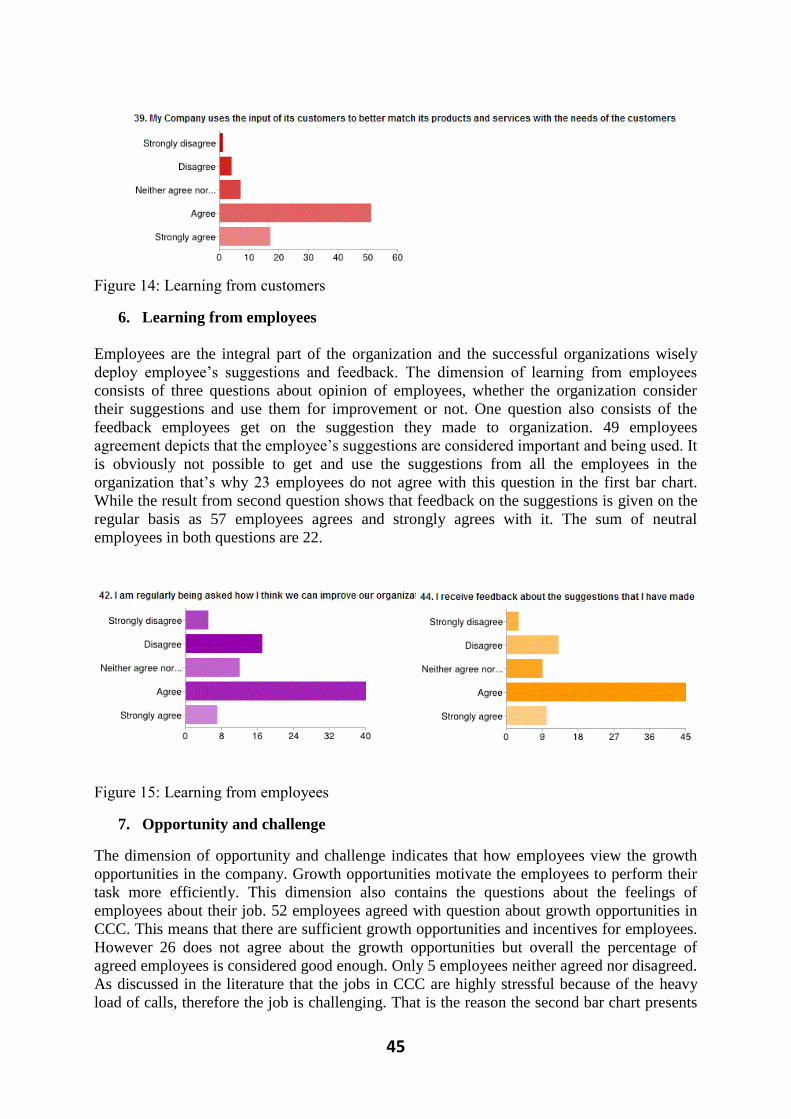
45
Figure 14: Learning from customers
6. Learning from employees
Employees are the integral part of the organization and the successful organizations wisely
deploy employee’s suggestions and feedback. The dimension of learning from employees
consists of three questions about opinion of employees, whether the organization consider
their suggestions and use them for improvement or not. One question also consists of the
feedback employees get on the suggestion they made to organization. 49 employees
agreement depicts that the employee’s suggestions are considered important and being used. It
is obviously not possible to get and use the suggestions from all the employees in the
organization that’s why 23 employees do not agree with this question in the first bar chart.
While the result from second question shows that feedback on the suggestions is given on the
regular basis as 57 employees agrees and strongly agrees with it. The sum of neutral
employees in both questions are 22.
Figure 15: Learning from employees
7. Opportunity and challenge
The dimension of opportunity and challenge indicates that how employees view the growth
opportunities in the company. Growth opportunities motivate the employees to perform their
task more efficiently. This dimension also contains the questions about the feelings of
employees about their job. 52 employees agreed with question about growth opportunities in
CCC. This means that there are sufficient growth opportunities and incentives for employees.
However 26 does not agree about the growth opportunities but overall the percentage of
agreed employees is considered good enough. Only 5 employees neither agreed nor disagreed.
As discussed in the literature that the jobs in CCC are highly stressful because of the heavy
load of calls, therefore the job is challenging. That is the reason the second bar chart presents
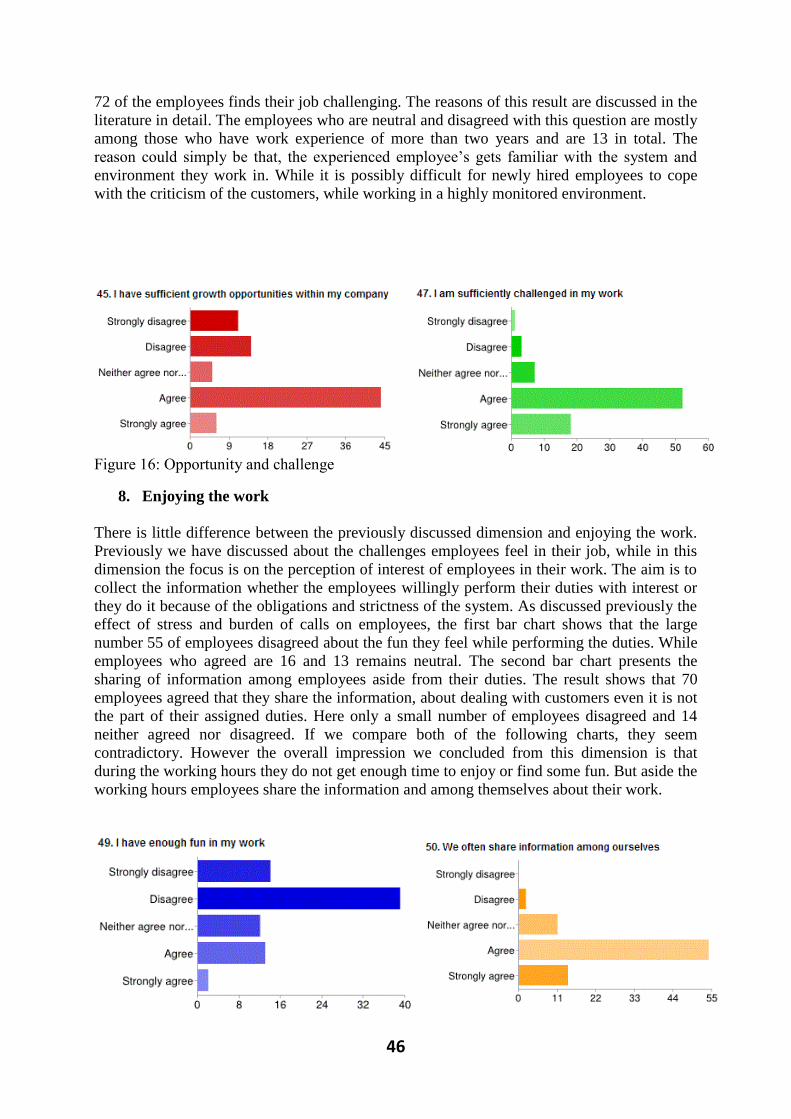
46
72 of the employees finds their job challenging. The reasons of this result are discussed in the
literature in detail. The employees who are neutral and disagreed with this question are mostly
among those who have work experience of more than two years and are 13 in total. The
reason could simply be that, the experienced employee’s gets familiar with the system and
environment they work in. While it is possibly difficult for newly hired employees to cope
with the criticism of the customers, while working in a highly monitored environment.
Figure 16: Opportunity and challenge
8. Enjoying the work
There is little difference between the previously discussed dimension and enjoying the work.
Previously we have discussed about the challenges employees feel in their job, while in this
dimension the focus is on the perception of interest of employees in their work. The aim is to
collect the information whether the employees willingly perform their duties with interest or
they do it because of the obligations and strictness of the system. As discussed previously the
effect of stress and burden of calls on employees, the first bar chart shows that the large
number 55 of employees disagreed about the fun they feel while performing the duties. While
employees who agreed are 16 and 13 remains neutral. The second bar chart presents the
sharing of information among employees aside from their duties. The result shows that 70
employees agreed that they share the information, about dealing with customers even it is not
the part of their assigned duties. Here only a small number of employees disagreed and 14
neither agreed nor disagreed. If we compare both of the following charts, they seem
contradictory. However the overall impression we concluded from this dimension is that
during the working hours they do not get enough time to enjoy or find some fun. But aside the
working hours employees share the information and among themselves about their work.
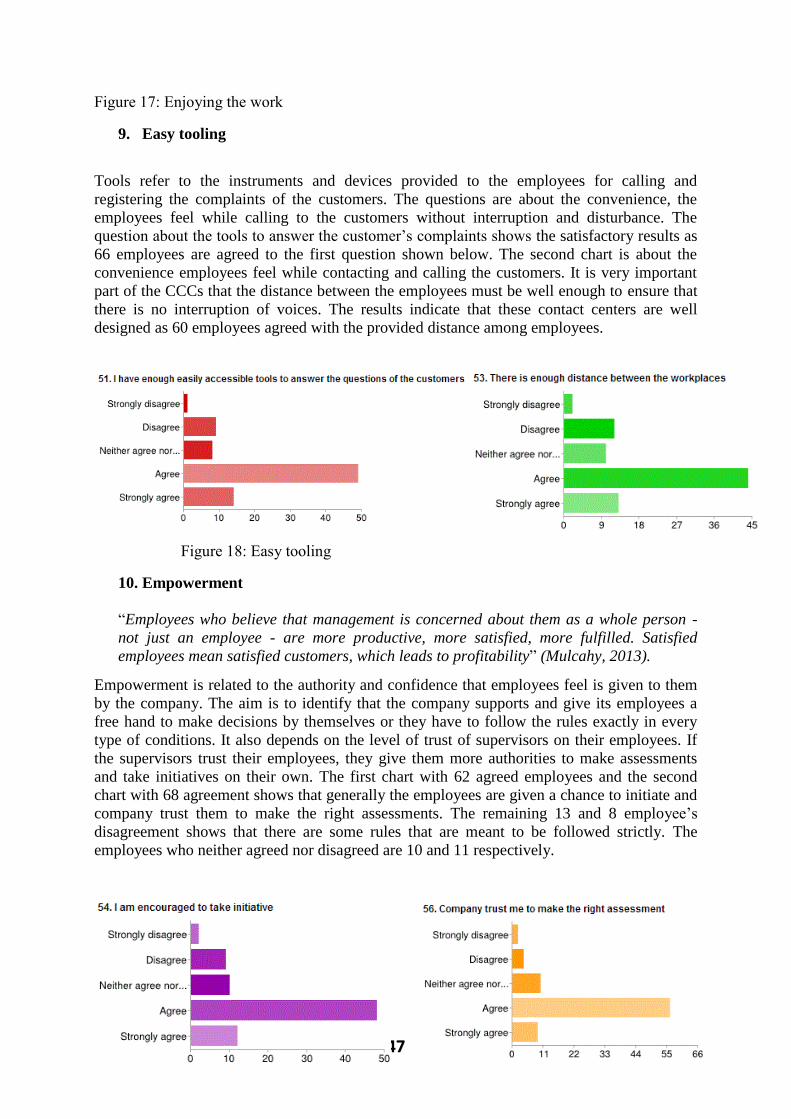
47
Figure 17: Enjoying the work
9. Easy tooling
Tools refer to the instruments and devices provided to the employees for calling and
registering the complaints of the customers. The questions are about the convenience, the
employees feel while calling to the customers without interruption and disturbance. The
question about the tools to answer the customer’s complaints shows the satisfactory results as
66 employees are agreed to the first question shown below. The second chart is about the
convenience employees feel while contacting and calling the customers. It is very important
part of the CCCs that the distance between the employees must be well enough to ensure that
there is no interruption of voices. The results indicate that these contact centers are well
designed as 60 employees agreed with the provided distance among employees.
Figure 18: Easy tooling
10. Empowerment
“Employees who believe that management is concerned about them as a whole person -
not just an employee - are more productive, more satisfied, more fulfilled. Satisfied
employees mean satisfied customers, which leads to profitability” (Mulcahy, 2013).
Empowerment is related to the authority and confidence that employees feel is given to them
by the company. The aim is to identify that the company supports and give its employees a
free hand to make decisions by themselves or they have to follow the rules exactly in every
type of conditions. It also depends on the level of trust of supervisors on their employees. If
the supervisors trust their employees, they give them more authorities to make assessments
and take initiatives on their own. The first chart with 62 agreed employees and the second
chart with 68 agreement shows that generally the employees are given a chance to initiate and
company trust them to make the right assessments. The remaining 13 and 8 employee’s
disagreement shows that there are some rules that are meant to be followed strictly. The
employees who neither agreed nor disagreed are 10 and 11 respectively.
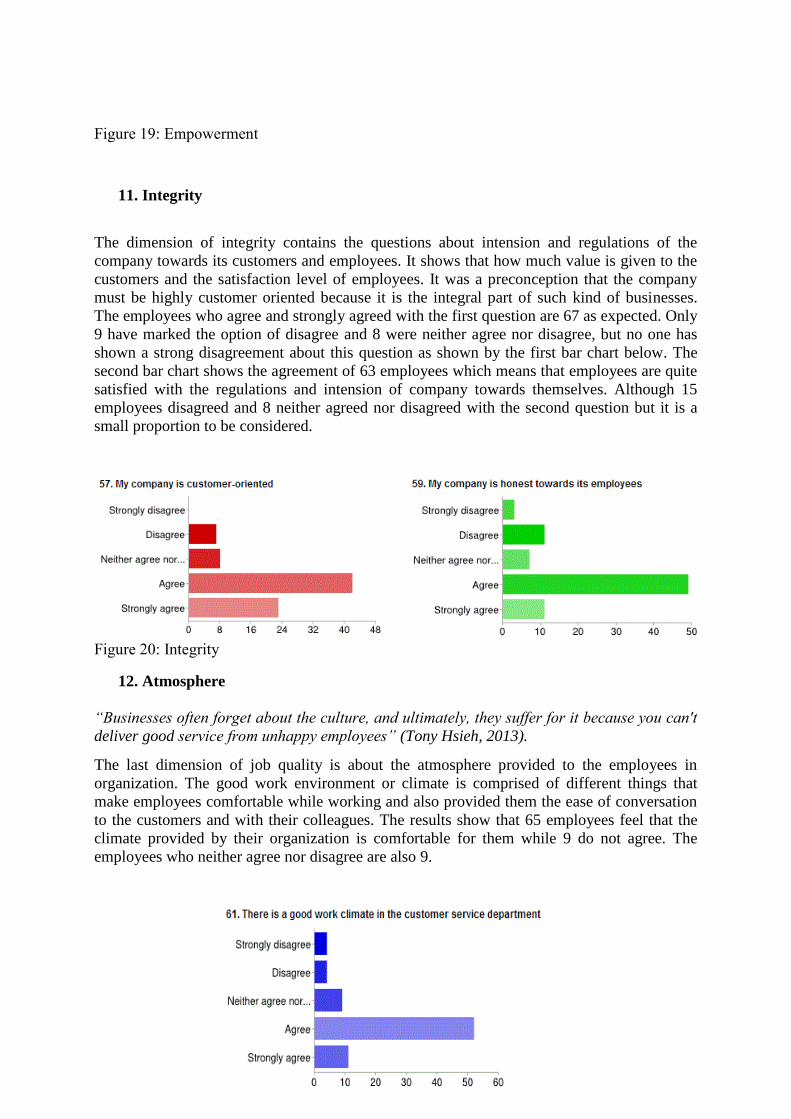
48
Figure 19: Empowerment
11. Integrity
The dimension of integrity contains the questions about intension and regulations of the
company towards its customers and employees. It shows that how much value is given to the
customers and the satisfaction level of employees. It was a preconception that the company
must be highly customer oriented because it is the integral part of such kind of businesses.
The employees who agree and strongly agreed with the first question are 67 as expected. Only
9 have marked the option of disagree and 8 were neither agree nor disagree, but no one has
shown a strong disagreement about this question as shown by the first bar chart below. The
second bar chart shows the agreement of 63 employees which means that employees are quite
satisfied with the regulations and intension of company towards themselves. Although 15
employees disagreed and 8 neither agreed nor disagreed with the second question but it is a
small proportion to be considered.
Figure 20: Integrity
12. Atmosphere
“Businesses often forget about the culture, and ultimately, they suffer for it because you can't
deliver good service from unhappy employees” (Tony Hsieh, 2013).
The last dimension of job quality is about the atmosphere provided to the employees in
organization. The good work environment or climate is comprised of different things that
make employees comfortable while working and also provided them the ease of conversation
to the customers and with their colleagues. The results show that 65 employees feel that the
climate provided by their organization is comfortable for them while 9 do not agree. The
employees who neither agree nor disagree are also 9.
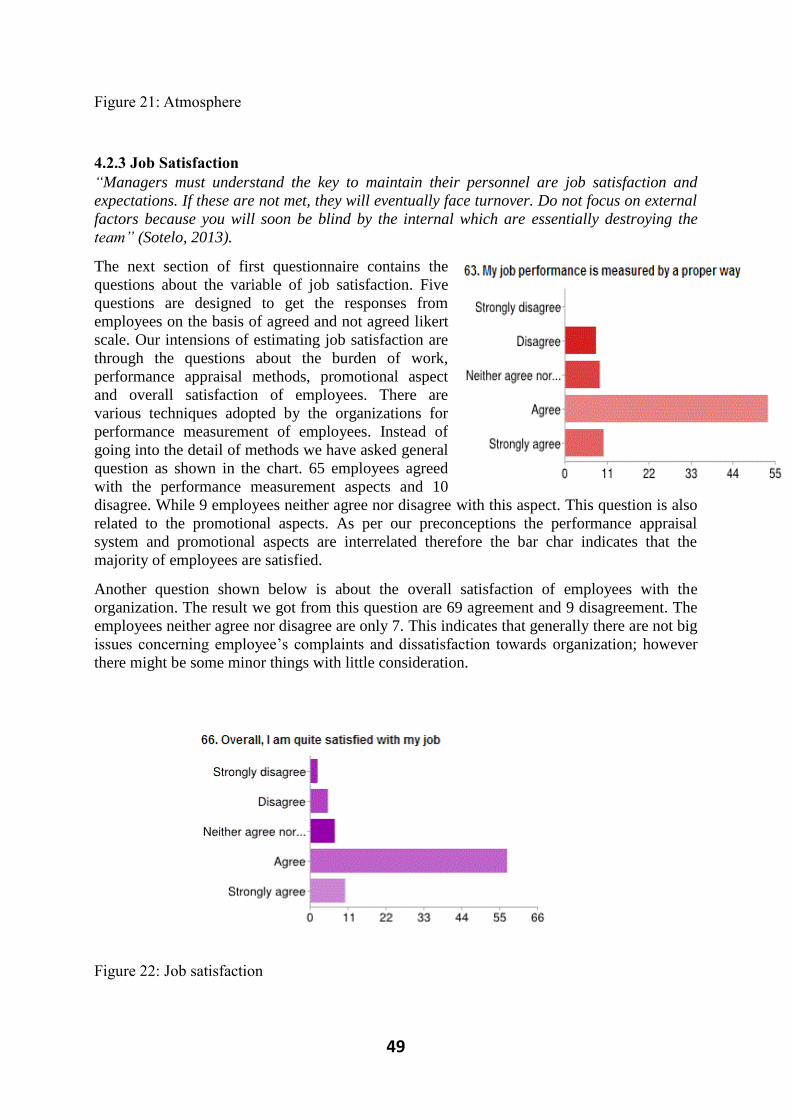
49
Figure 21: Atmosphere
4.2.3 Job Satisfaction
“Managers must understand the key to maintain their personnel are job satisfaction and
expectations. If these are not met, they will eventually face turnover. Do not focus on external
factors because you will soon be blind by the internal which are essentially destroying the
team” (Sotelo, 2013).
The next section of first questionnaire contains the
questions about the variable of job satisfaction. Five
questions are designed to get the responses from
employees on the basis of agreed and not agreed likert
scale. Our intensions of estimating job satisfaction are
through the questions about the burden of work,
performance appraisal methods, promotional aspect
and overall satisfaction of employees. There are
various techniques adopted by the organizations for
performance measurement of employees. Instead of
going into the detail of methods we have asked general
question as shown in the chart. 65 employees agreed
with the performance measurement aspects and 10
disagree. While 9 employees neither agree nor disagree with this aspect. This question is also
related to the promotional aspects. As per our preconceptions the performance appraisal
system and promotional aspects are interrelated therefore the bar char indicates that the
majority of employees are satisfied.
Another question shown below is about the overall satisfaction of employees with the
organization. The result we got from this question are 69 agreement and 9 disagreement. The
employees neither agree nor disagree are only 7. This indicates that generally there are not big
issues concerning employee’s complaints and dissatisfaction towards organization; however
there might be some minor things with little consideration.
Figure 22: Job satisfaction
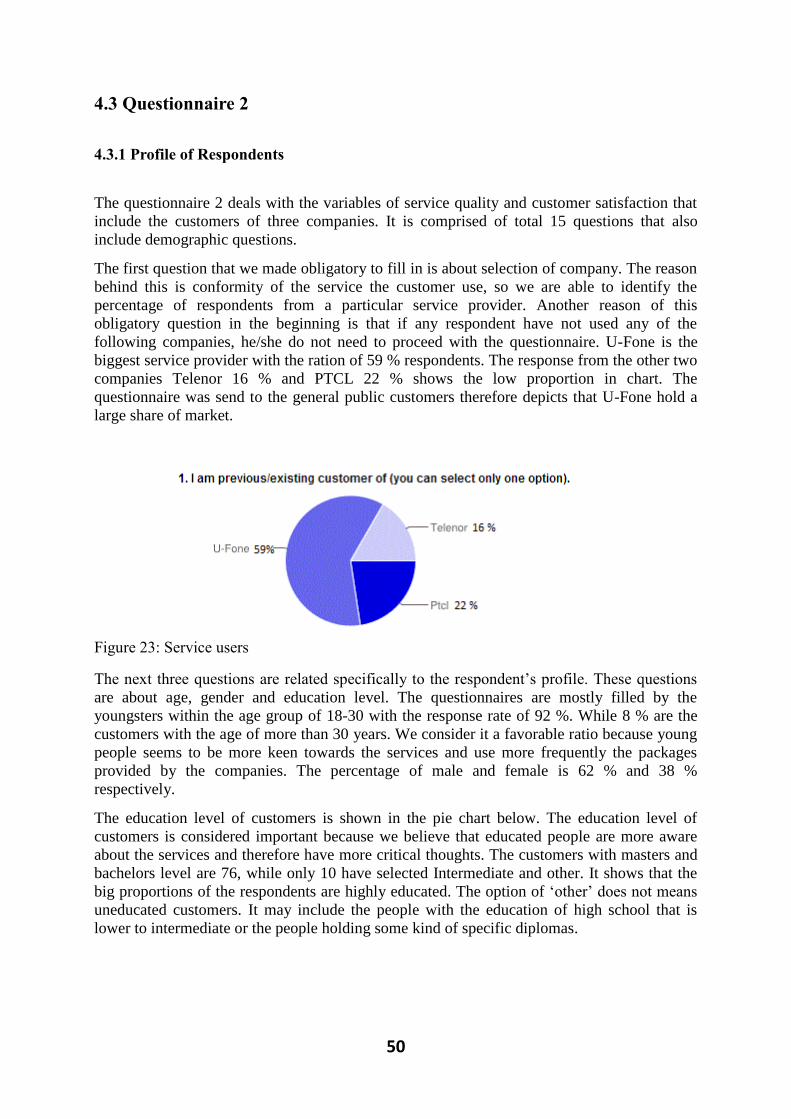
50
4.3 Questionnaire 2
4.3.1 Profile of Respondents
The questionnaire 2 deals with the variables of service quality and customer satisfaction that
include the customers of three companies. It is comprised of total 15 questions that also
include demographic questions.
The first question that we made obligatory to fill in is about selection of company. The reason
behind this is conformity of the service the customer use, so we are able to identify the
percentage of respondents from a particular service provider. Another reason of this
obligatory question in the beginning is that if any respondent have not used any of the
following companies, he/she do not need to proceed with the questionnaire. U-Fone is the
biggest service provider with the ration of 59 % respondents. The response from the other two
companies Telenor 16 % and PTCL 22 % shows the low proportion in chart. The
questionnaire was send to the general public customers therefore depicts that U-Fone hold a
large share of market.
Figure 23: Service users
The next three questions are related specifically to the respondent’s profile. These questions
are about age, gender and education level. The questionnaires are mostly filled by the
youngsters within the age group of 18-30 with the response rate of 92 %. While 8 % are the
customers with the age of more than 30 years. We consider it a favorable ratio because young
people seems to be more keen towards the services and use more frequently the packages
provided by the companies. The percentage of male and female is 62 % and 38 %
respectively.
The education level of customers is shown in the pie chart below. The education level of
customers is considered important because we believe that educated people are more aware
about the services and therefore have more critical thoughts. The customers with masters and
bachelors level are 76, while only 10 have selected Intermediate and other. It shows that the
big proportions of the respondents are highly educated. The option of ‘other’ does not means
uneducated customers. It may include the people with the education of high school that is
lower to intermediate or the people holding some kind of specific diplomas.
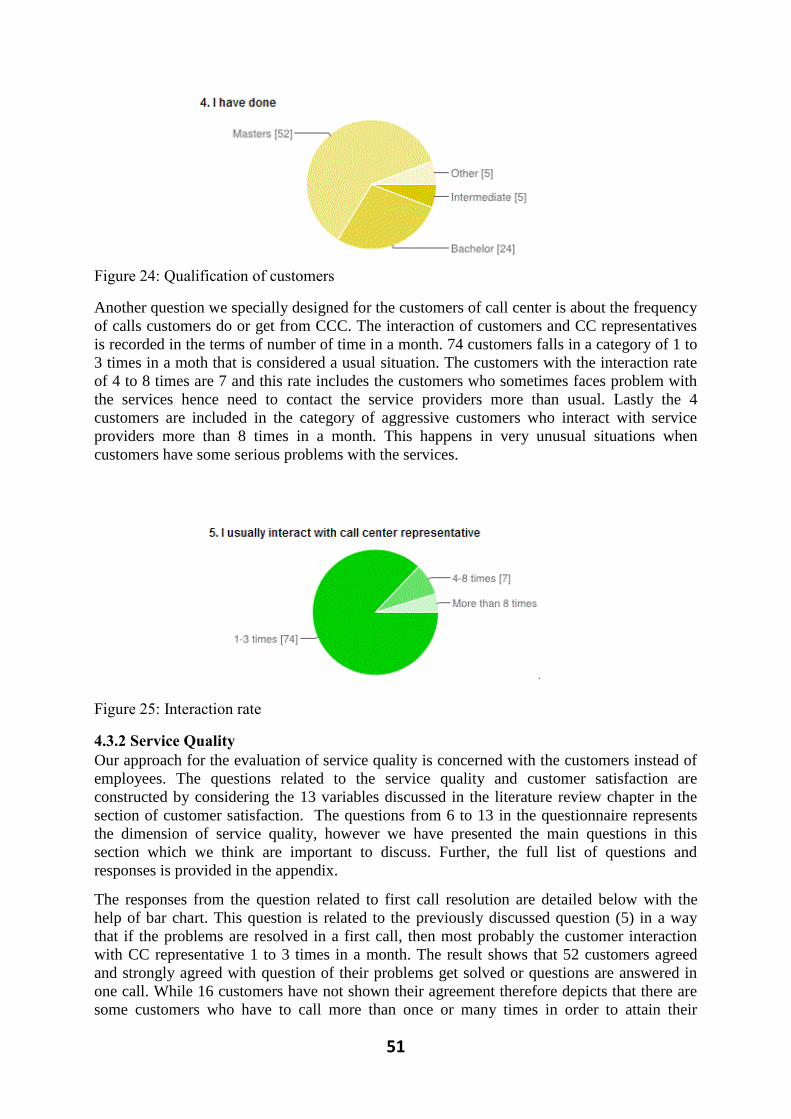
51
Figure 24: Qualification of customers
Another question we specially designed for the customers of call center is about the frequency
of calls customers do or get from CCC. The interaction of customers and CC representatives
is recorded in the terms of number of time in a month. 74 customers falls in a category of 1 to
3 times in a moth that is considered a usual situation. The customers with the interaction rate
of 4 to 8 times are 7 and this rate includes the customers who sometimes faces problem with
the services hence need to contact the service providers more than usual. Lastly the 4
customers are included in the category of aggressive customers who interact with service
providers more than 8 times in a month. This happens in very unusual situations when
customers have some serious problems with the services.
Figure 25: Interaction rate
4.3.2 Service Quality
Our approach for the evaluation of service quality is concerned with the customers instead of
employees. The questions related to the service quality and customer satisfaction are
constructed by considering the 13 variables discussed in the literature review chapter in the
section of customer satisfaction. The questions from 6 to 13 in the questionnaire represents
the dimension of service quality, however we have presented the main questions in this
section which we think are important to discuss. Further, the full list of questions and
responses is provided in the appendix.
The responses from the question related to first call resolution are detailed below with the
help of bar chart. This question is related to the previously discussed question (5) in a way
that if the problems are resolved in a first call, then most probably the customer interaction
with CC representative 1 to 3 times in a month. The result shows that 52 customers agreed
and strongly agreed with question of their problems get solved or questions are answered in
one call. While 16 customers have not shown their agreement therefore depicts that there are
some customers who have to call more than once or many times in order to attain their
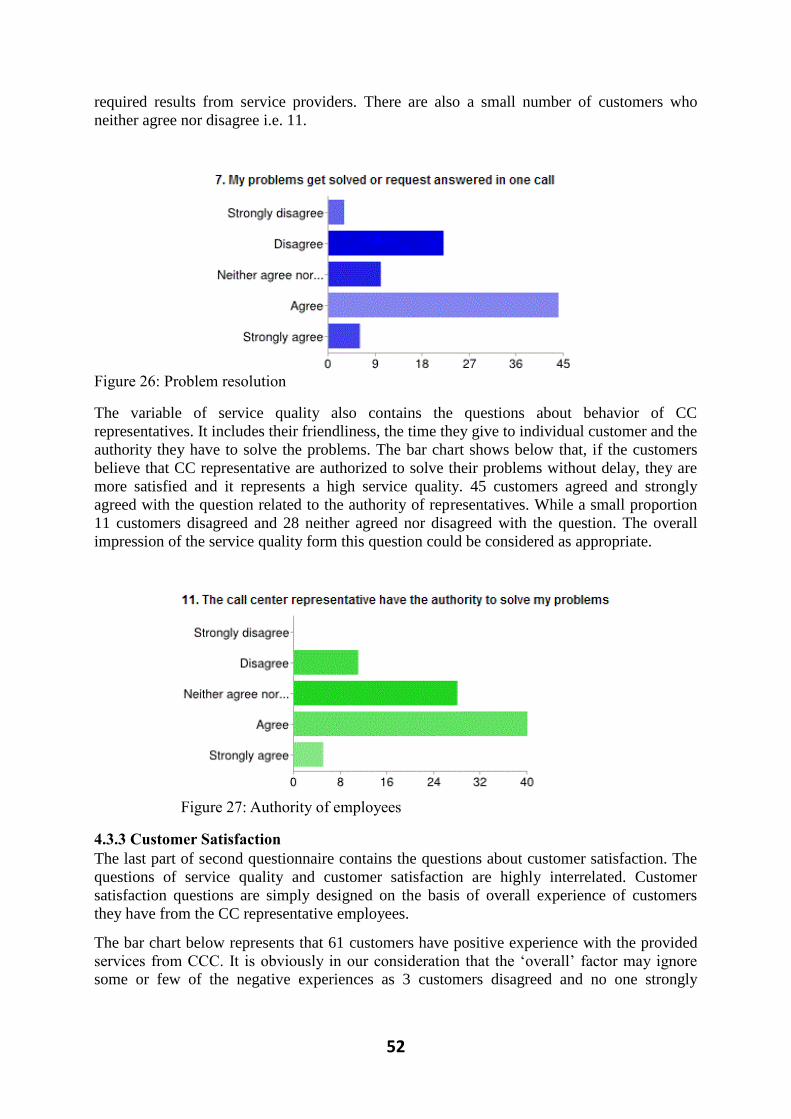
52
required results from service providers. There are also a small number of customers who
neither agree nor disagree i.e. 11.
Figure 26: Problem resolution
The variable of service quality also contains the questions about behavior of CC
representatives. It includes their friendliness, the time they give to individual customer and the
authority they have to solve the problems. The bar chart shows below that, if the customers
believe that CC representative are authorized to solve their problems without delay, they are
more satisfied and it represents a high service quality. 45 customers agreed and strongly
agreed with the question related to the authority of representatives. While a small proportion
11 customers disagreed and 28 neither agreed nor disagreed with the question. The overall
impression of the service quality form this question could be considered as appropriate.
Figure 27: Authority of employees
4.3.3 Customer Satisfaction
The last part of second questionnaire contains the questions about customer satisfaction. The
questions of service quality and customer satisfaction are highly interrelated. Customer
satisfaction questions are simply designed on the basis of overall experience of customers
they have from the CC representative employees.
The bar chart below represents that 61 customers have positive experience with the provided
services from CCC. It is obviously in our consideration that the ‘overall’ factor may ignore
some or few of the negative experiences as 3 customers disagreed and no one strongly
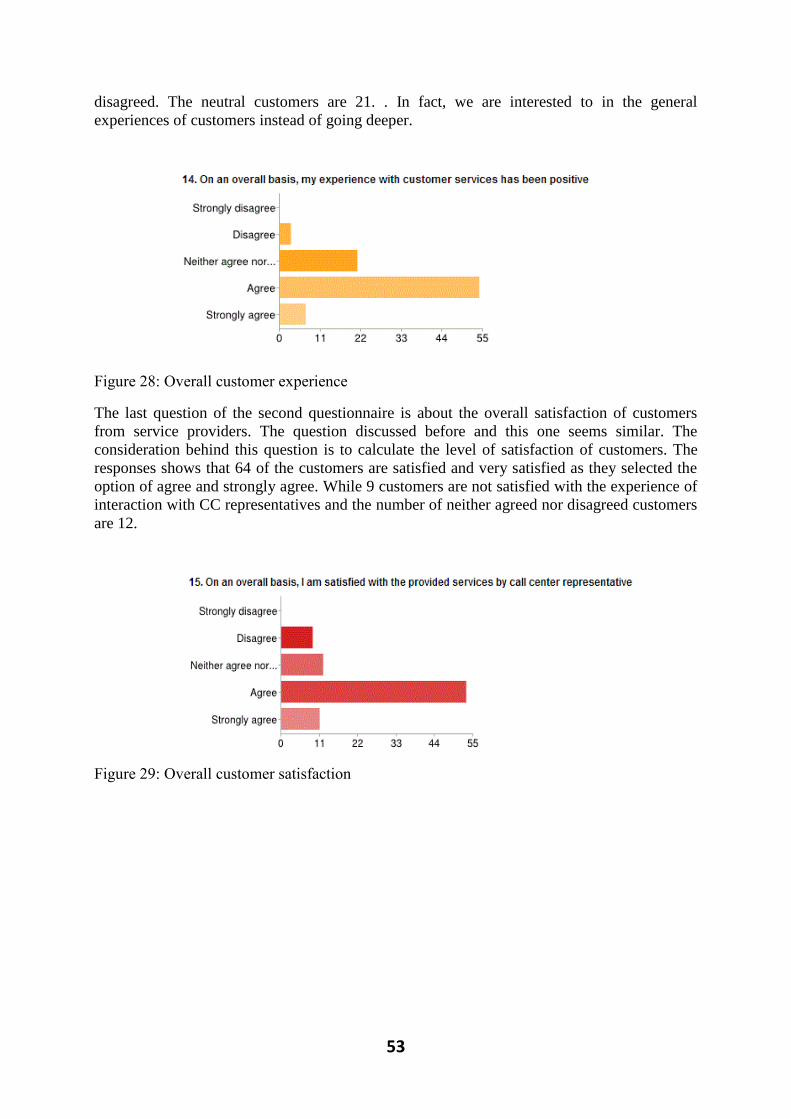
53
disagreed. The neutral customers are 21. . In fact, we are interested to in the general
experiences of customers instead of going deeper.
Figure 28: Overall customer experience
The last question of the second questionnaire is about the overall satisfaction of customers
from service providers. The question discussed before and this one seems similar. The
consideration behind this question is to calculate the level of satisfaction of customers. The
responses shows that 64 of the customers are satisfied and very satisfied as they selected the
option of agree and strongly agree. While 9 customers are not satisfied with the experience of
interaction with CC representatives and the number of neither agreed nor disagreed customers
are 12.
Figure 29: Overall customer satisfaction
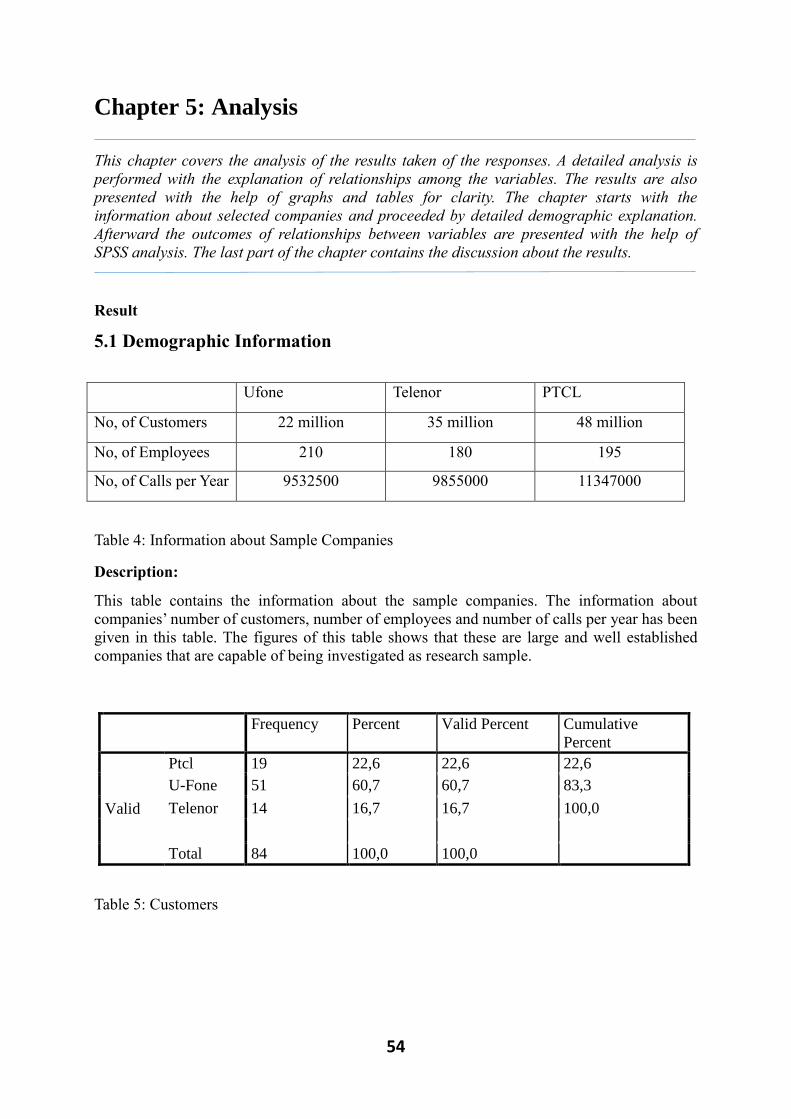
54
Chapter 5: Analysis
This chapter covers the analysis of the results taken of the responses. A detailed analysis is
performed with the explanation of relationships among the variables. The results are also
presented with the help of graphs and tables for clarity. The chapter starts with the
information about selected companies and proceeded by detailed demographic explanation.
Afterward the outcomes of relationships between variables are presented with the help of
SPSS analysis. The last part of the chapter contains the discussion about the results.
Result
5.1 Demographic Information
Ufone Telenor PTCL
No, of Customers 22 million 35 million 48 million
No, of Employees 210 180 195
No, of Calls per Year 9532500 9855000 11347000
Table 4: Information about Sample Companies
Description:
This table contains the information about the sample companies. The information about
companies’ number of customers, number of employees and number of calls per year has been
given in this table. The figures of this table shows that these are large and well established
companies that are capable of being investigated as research sample.
Frequency Percent Valid Percent Cumulative
Percent
Valid
Ptcl 19 22,6 22,6 22,6
U-Fone 51 60,7 60,7 83,3
Telenor 14 16,7 16,7 100,0
Total 84 100,0 100,0
Table 5: Customers
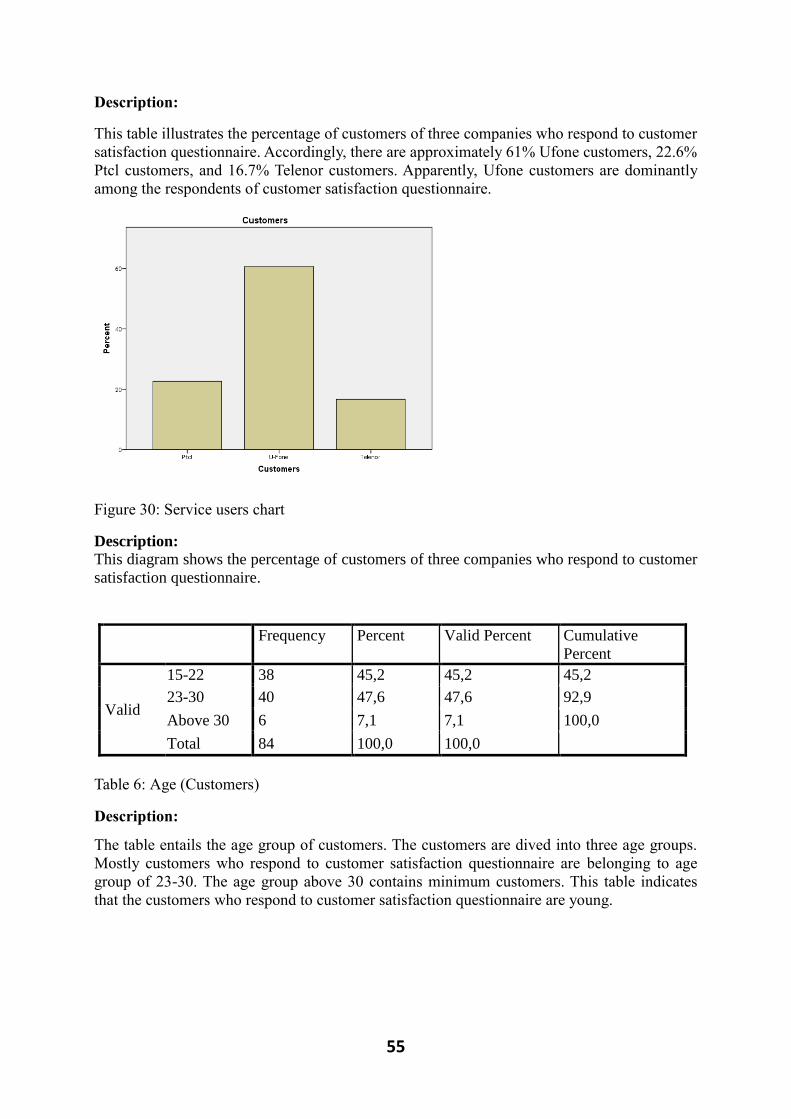
55
Description:
This table illustrates the percentage of customers of three companies who respond to customer
satisfaction questionnaire. Accordingly, there are approximately 61% Ufone customers, 22.6%
Ptcl customers, and 16.7% Telenor customers. Apparently, Ufone customers are dominantly
among the respondents of customer satisfaction questionnaire.
Figure 30: Service users chart
Description:
This diagram shows the percentage of customers of three companies who respond to customer
satisfaction questionnaire.
Frequency Percent Valid Percent Cumulative
Percent
Valid
15-22 38 45,2 45,2 45,2
23-30 40 47,6 47,6 92,9
Above 30 6 7,1 7,1 100,0
Total 84 100,0 100,0
Table 6: Age (Customers)
Description:
The table entails the age group of customers. The customers are dived into three age groups.
Mostly customers who respond to customer satisfaction questionnaire are belonging to age
group of 23-30. The age group above 30 contains minimum customers. This table indicates
that the customers who respond to customer satisfaction questionnaire are young.
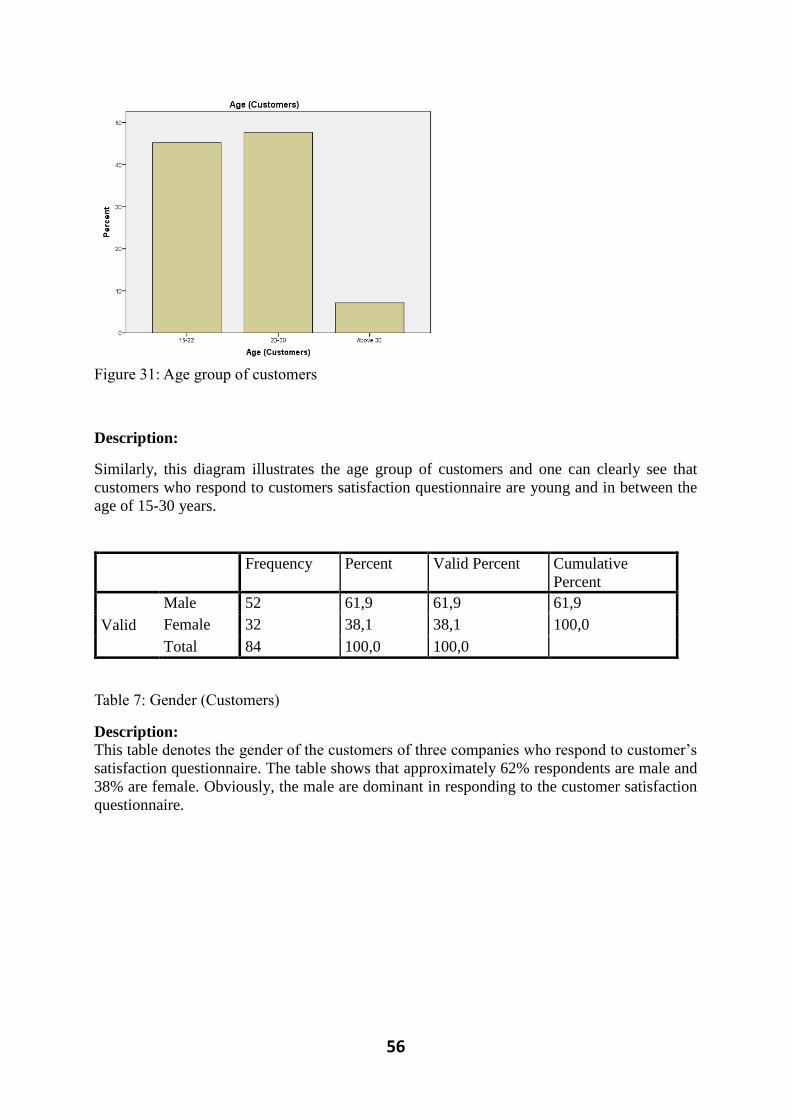
56
Figure 31: Age group of customers
Description:
Similarly, this diagram illustrates the age group of customers and one can clearly see that
customers who respond to customers satisfaction questionnaire are young and in between the
age of 15-30 years.
Frequency Percent Valid Percent Cumulative
Percent
Valid
Male 52 61,9 61,9 61,9
Female 32 38,1 38,1 100,0
Total 84 100,0 100,0
Table 7: Gender (Customers)
Description:
This table denotes the gender of the customers of three companies who respond to customer’s
satisfaction questionnaire. The table shows that approximately 62% respondents are male and
38% are female. Obviously, the male are dominant in responding to the customer satisfaction
questionnaire.
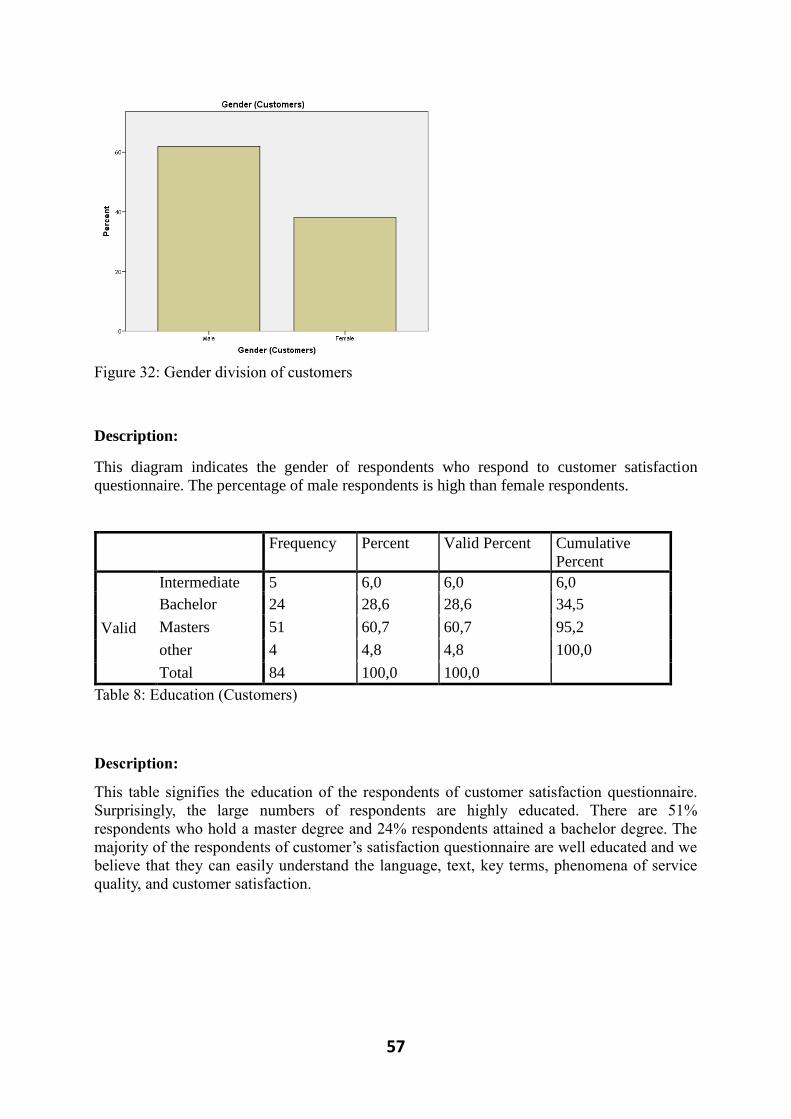
57
Figure 32: Gender division of customers
Description:
This diagram indicates the gender of respondents who respond to customer satisfaction
questionnaire. The percentage of male respondents is high than female respondents.
Frequency Percent Valid Percent Cumulative
Percent
Valid
Intermediate 5 6,0 6,0 6,0
Bachelor 24 28,6 28,6 34,5
Masters 51 60,7 60,7 95,2
other 4 4,8 4,8 100,0
Total 84 100,0 100,0
Table 8: Education (Customers)
Description:
This table signifies the education of the respondents of customer satisfaction questionnaire.
Surprisingly, the large numbers of respondents are highly educated. There are 51%
respondents who hold a master degree and 24% respondents attained a bachelor degree. The
majority of the respondents of customer’s satisfaction questionnaire are well educated and we
believe that they can easily understand the language, text, key terms, phenomena of service
quality, and customer satisfaction.
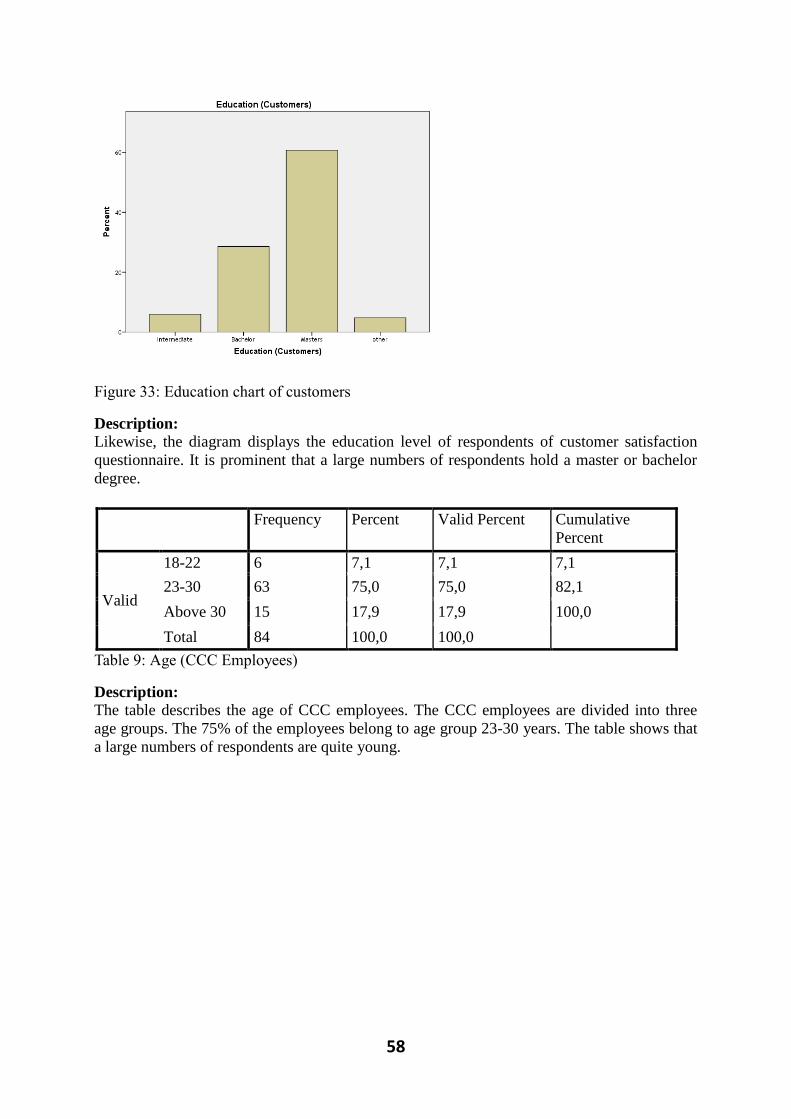
58
Figure 33: Education chart of customers
Description:
Likewise, the diagram displays the education level of respondents of customer satisfaction
questionnaire. It is prominent that a large numbers of respondents hold a master or bachelor
degree.
Frequency Percent Valid Percent Cumulative
Percent
Valid
18-22 6 7,1 7,1 7,1
23-30 63 75,0 75,0 82,1
Above 30 15 17,9 17,9 100,0
Total 84 100,0 100,0
Table 9: Age (CCC Employees)
Description:
The table describes the age of CCC employees. The CCC employees are divided into three
age groups. The 75% of the employees belong to age group 23-30 years. The table shows that
a large numbers of respondents are quite young.
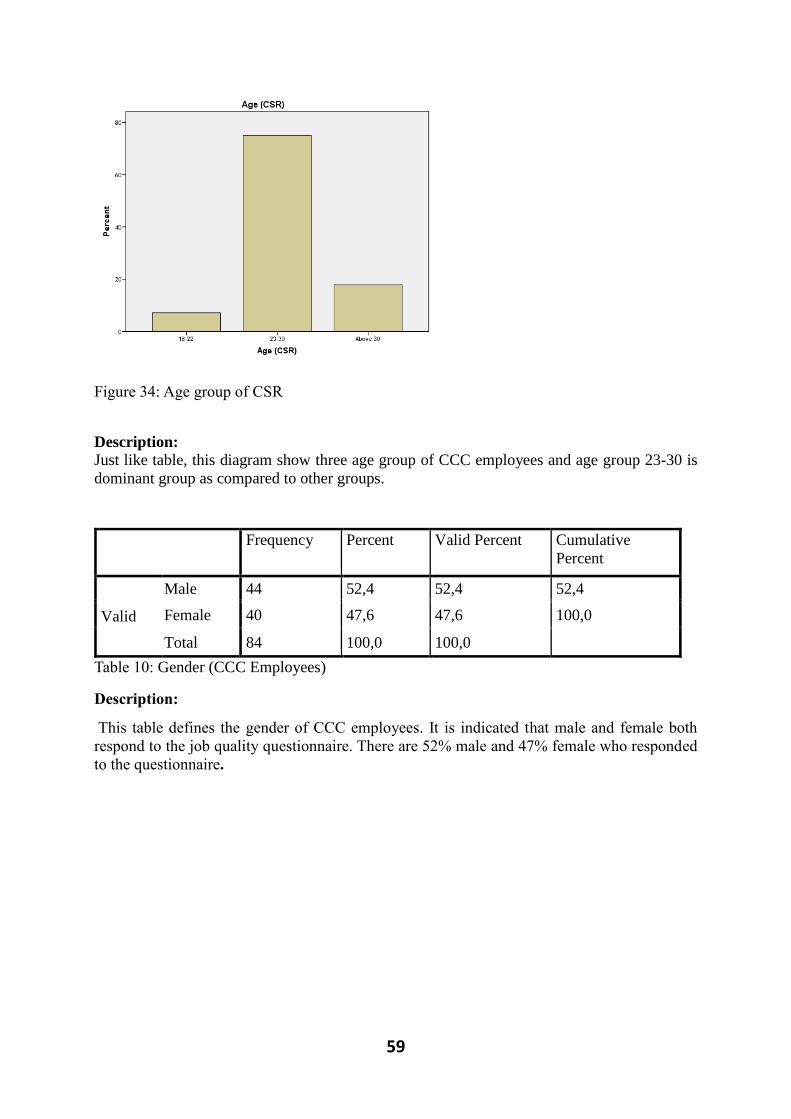
59
Figure 34: Age group of CSR
Description:
Just like table, this diagram show three age group of CCC employees and age group 23-30 is
dominant group as compared to other groups.
Frequency Percent Valid Percent Cumulative
Percent
Valid
Male 44 52,4 52,4 52,4
Female 40 47,6 47,6 100,0
Total 84 100,0 100,0
Table 10: Gender (CCC Employees)
Description:
This table defines the gender of CCC employees. It is indicated that male and female both
respond to the job quality questionnaire. There are 52% male and 47% female who responded
to the questionnaire.
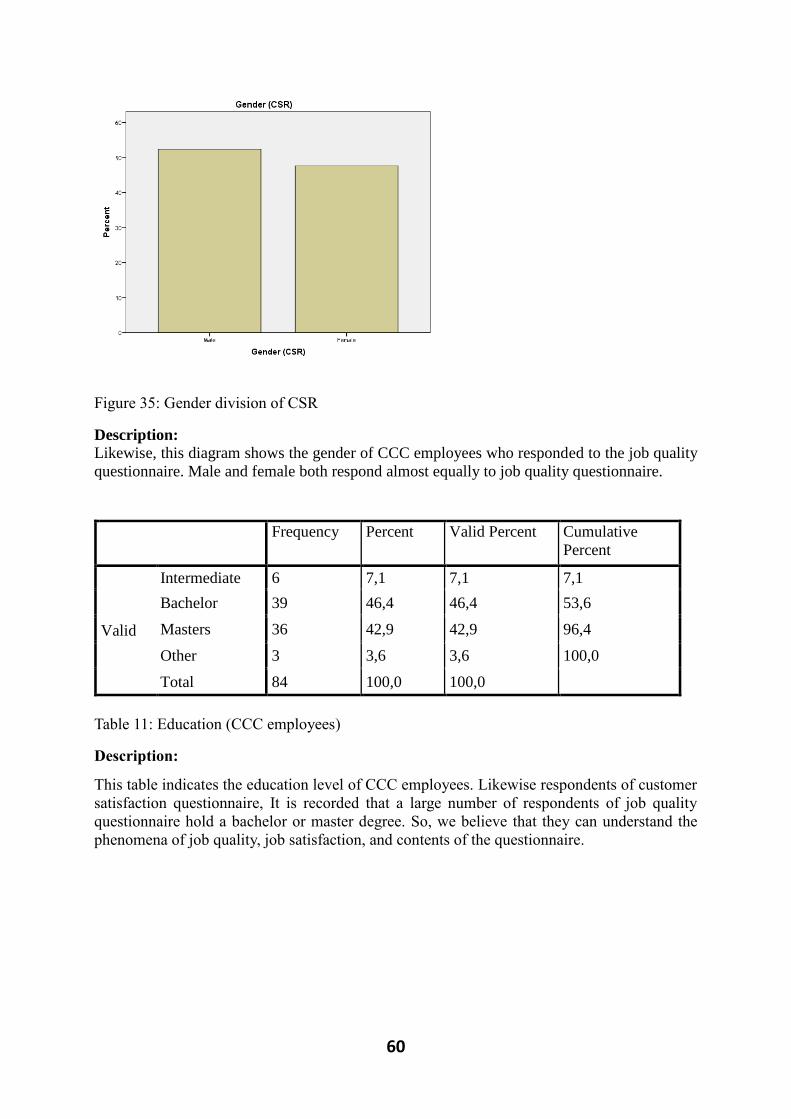
60
Figure 35: Gender division of CSR
Description:
Likewise, this diagram shows the gender of CCC employees who responded to the job quality
questionnaire. Male and female both respond almost equally to job quality questionnaire.
Frequency Percent Valid Percent Cumulative
Percent
Valid
Intermediate 6 7,1 7,1 7,1
Bachelor 39 46,4 46,4 53,6
Masters 36 42,9 42,9 96,4
Other 3 3,6 3,6 100,0
Total 84 100,0 100,0
Table 11: Education (CCC employees)
Description:
This table indicates the education level of CCC employees. Likewise respondents of customer
satisfaction questionnaire, It is recorded that a large number of respondents of job quality
questionnaire hold a bachelor or master degree. So, we believe that they can understand the
phenomena of job quality, job satisfaction, and contents of the questionnaire.
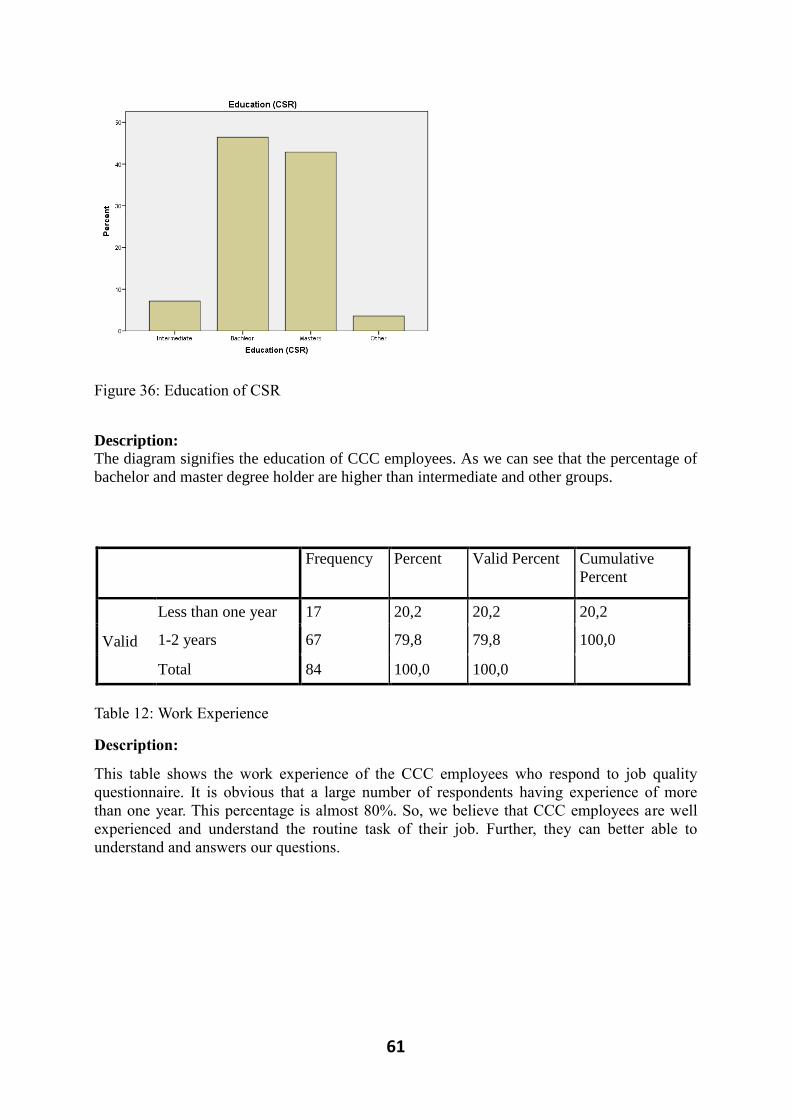
61
Figure 36: Education of CSR
Description:
The diagram signifies the education of CCC employees. As we can see that the percentage of
bachelor and master degree holder are higher than intermediate and other groups.
Frequency Percent Valid Percent Cumulative
Percent
Valid
Less than one year 17 20,2 20,2 20,2
1-2 years 67 79,8 79,8 100,0
Total 84 100,0 100,0
Table 12: Work Experience
Description:
This table shows the work experience of the CCC employees who respond to job quality
questionnaire. It is obvious that a large number of respondents having experience of more
than one year. This percentage is almost 80%. So, we believe that CCC employees are well
experienced and understand the routine task of their job. Further, they can better able to
understand and answers our questions.
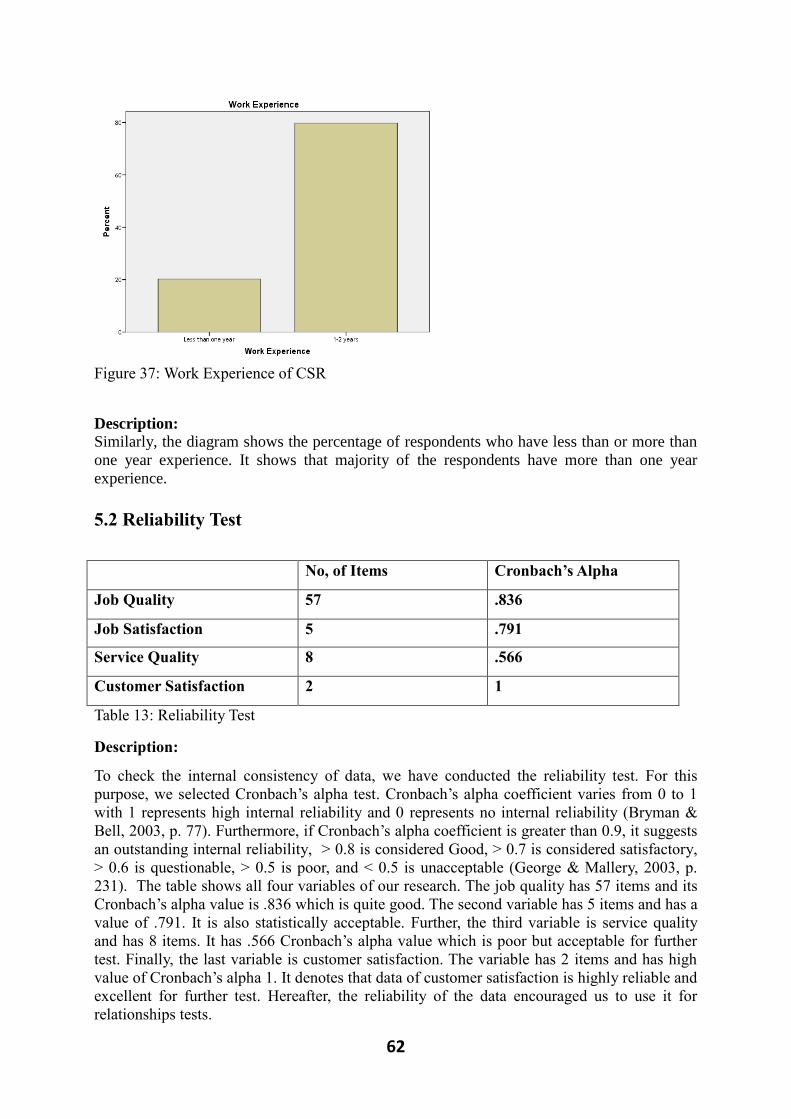
62
Figure 37: Work Experience of CSR
Description:
Similarly, the diagram shows the percentage of respondents who have less than or more than
one year experience. It shows that majority of the respondents have more than one year
experience.
5.2 Reliability Test
No, of Items Cronbach’s Alpha
Job Quality 57 .836
Job Satisfaction 5 .791
Service Quality 8 .566
Customer Satisfaction 2 1
Table 13: Reliability Test
Description:
To check the internal consistency of data, we have conducted the reliability test. For this
purpose, we selected Cronbach’s alpha test. Cronbach’s alpha coefficient varies from 0 to 1
with 1 represents high internal reliability and 0 represents no internal reliability (Bryman &
Bell, 2003, p. 77). Furthermore, if Cronbach’s alpha coefficient is greater than 0.9, it suggests
an outstanding internal reliability, > 0.8 is considered Good, > 0.7 is considered satisfactory,
> 0.6 is questionable, > 0.5 is poor, and < 0.5 is unacceptable (George & Mallery, 2003, p.
231). The table shows all four variables of our research. The job quality has 57 items and its
Cronbach’s alpha value is .836 which is quite good. The second variable has 5 items and has a
value of .791. It is also statistically acceptable. Further, the third variable is service quality
and has 8 items. It has .566 Cronbach’s alpha value which is poor but acceptable for further
test. Finally, the last variable is customer satisfaction. The variable has 2 items and has high
value of Cronbach’s alpha 1. It denotes that data of customer satisfaction is highly reliable and
excellent for further test. Hereafter, the reliability of the data encouraged us to use it for
relationships tests.
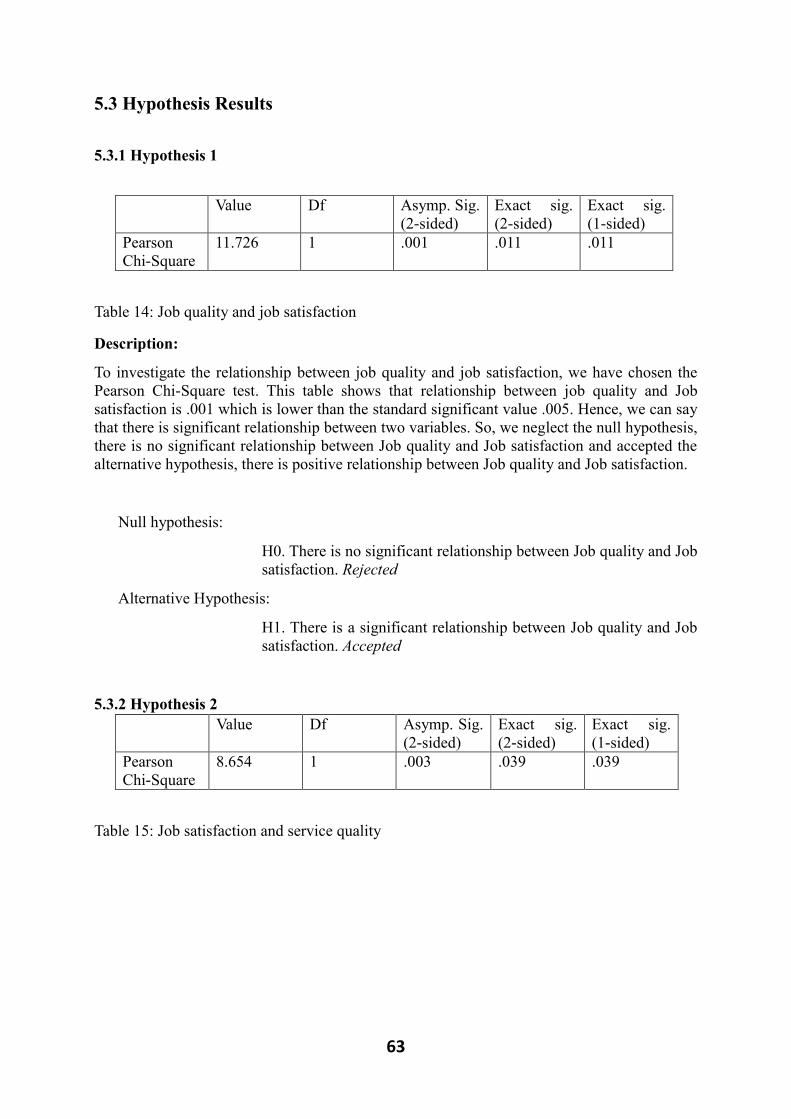
63
5.3 Hypothesis Results
5.3.1 Hypothesis 1
Value Df Asymp. Sig.
(2-sided)
Exact sig.
(2-sided)
Exact sig.
(1-sided)
Pearson
Chi-Square
11.726 1 .001 .011 .011
Table 14: Job quality and job satisfaction
Description:
To investigate the relationship between job quality and job satisfaction, we have chosen the
Pearson Chi-Square test. This table shows that relationship between job quality and Job
satisfaction is .001 which is lower than the standard significant value .005. Hence, we can say
that there is significant relationship between two variables. So, we neglect the null hypothesis,
there is no significant relationship between Job quality and Job satisfaction and accepted the
alternative hypothesis, there is positive relationship between Job quality and Job satisfaction.
Null hypothesis:
H0. There is no significant relationship between Job quality and Job
satisfaction. Rejected
Alternative Hypothesis:
H1. There is a significant relationship between Job quality and Job
satisfaction. Accepted
5.3.2 Hypothesis 2
Value Df Asymp. Sig.
(2-sided)
Exact sig.
(2-sided)
Exact sig.
(1-sided)
Pearson
Chi-Square
8.654 1 .003 .039 .039
Table 15: Job satisfaction and service quality
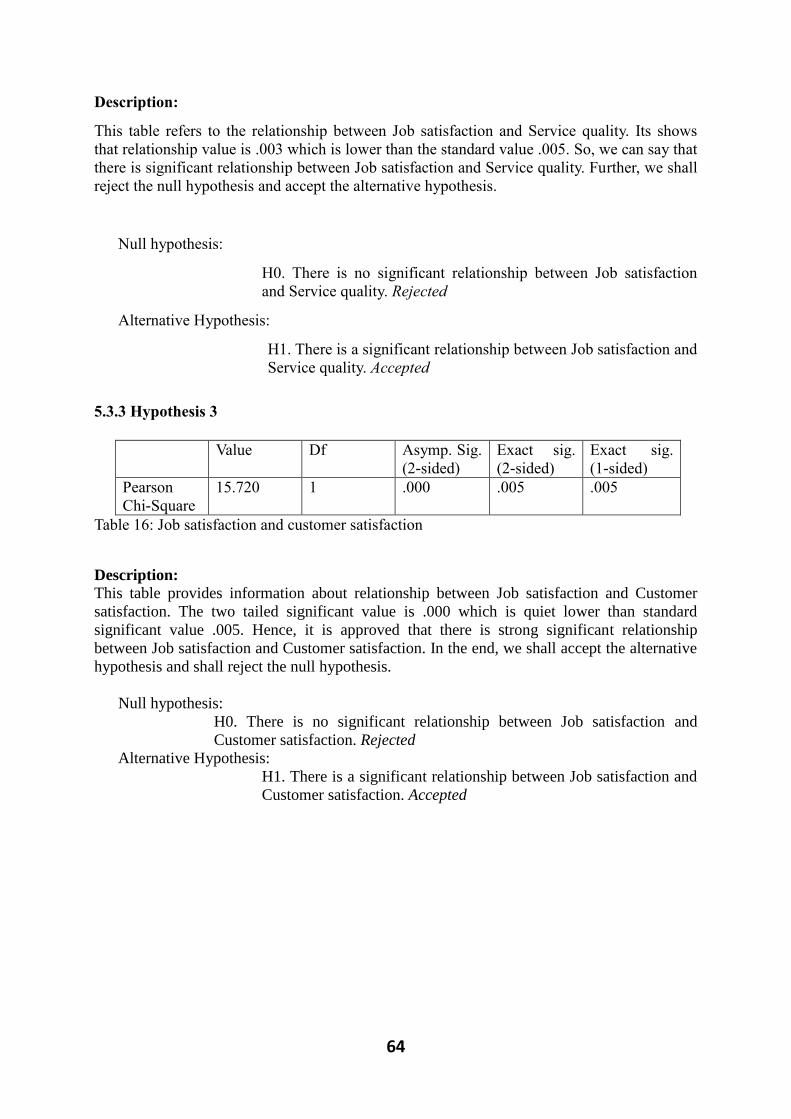
64
Description:
This table refers to the relationship between Job satisfaction and Service quality. Its shows
that relationship value is .003 which is lower than the standard value .005. So, we can say that
there is significant relationship between Job satisfaction and Service quality. Further, we shall
reject the null hypothesis and accept the alternative hypothesis.
Null hypothesis:
H0. There is no significant relationship between Job satisfaction
and Service quality. Rejected
Alternative Hypothesis:
H1. There is a significant relationship between Job satisfaction and
Service quality. Accepted
5.3.3 Hypothesis 3
Value Df Asymp. Sig.
(2-sided)
Exact sig.
(2-sided)
Exact sig.
(1-sided)
Pearson
Chi-Square
15.720 1 .000 .005 .005
Table 16: Job satisfaction and customer satisfaction
Description:
This table provides information about relationship between Job satisfaction and Customer
satisfaction. The two tailed significant value is .000 which is quiet lower than standard
significant value .005. Hence, it is approved that there is strong significant relationship
between Job satisfaction and Customer satisfaction. In the end, we shall accept the alternative
hypothesis and shall reject the null hypothesis.
Null hypothesis:
H0. There is no significant relationship between Job satisfaction and
Customer satisfaction. Rejected
Alternative Hypothesis:
H1. There is a significant relationship between Job satisfaction and
Customer satisfaction. Accepted

65
5.3.4 Hypothesis 4
Value Df Asymp. Sig.
(2-sided)
Exact sig.
(2-sided)
Exact sig.
(1-sided)
Pearson
Chi-Square
12.285 1 .000 .010 .010
Table 17: Service quality and customer satisfaction
Description:
The last hypothesis refers to the relationship between Service quality and Customer
satisfaction. The two tailed significant value is .000 which is lower than the standard value
.005. From this result, we can say that there is strong significant relationship between Service
quality and Customer satisfaction. Subsequently, we shall reject the null hypothesis and
accept the alternative hypothesis.
Null hypothesis:
H0. There is no significant relationship between Service quality and
Customer satisfaction. Rejected
Alternative Hypothesis:
H1. There is a significant relationship between Service quality and
Customer satisfaction. Accepted
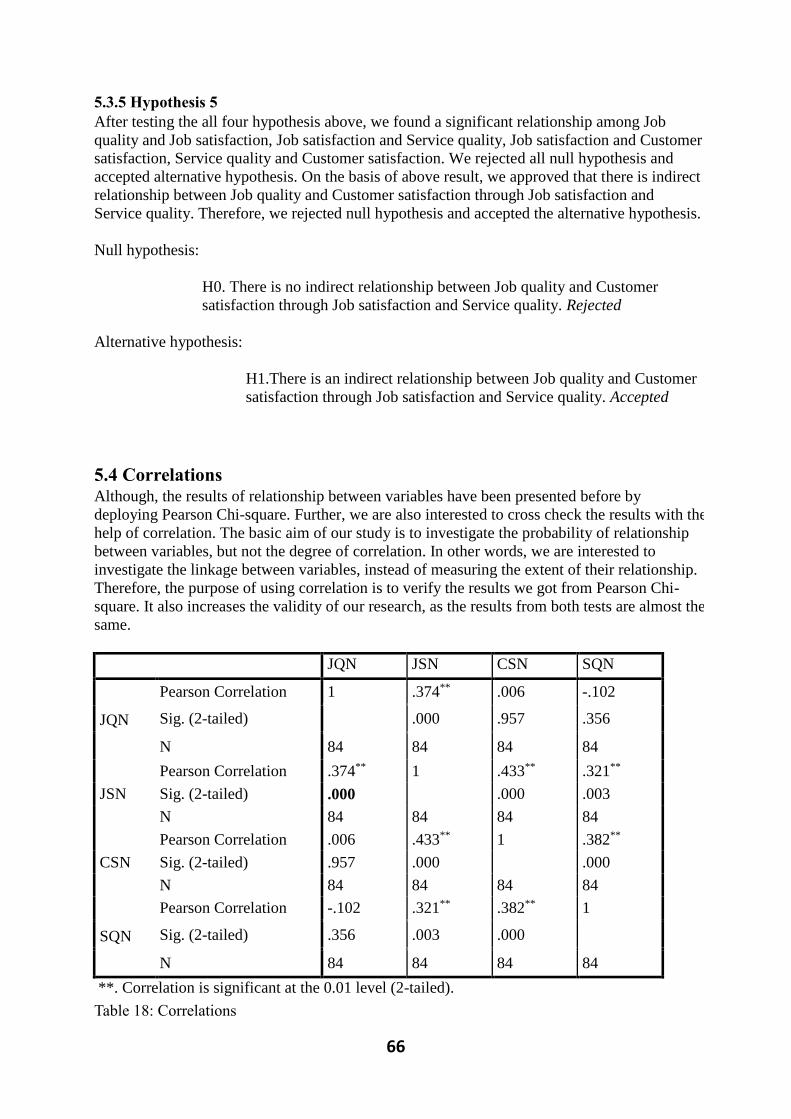
66
5.3.5 Hypothesis 5
After testing the all four hypothesis above, we found a significant relationship among Job
quality and Job satisfaction, Job satisfaction and Service quality, Job satisfaction and Customer
satisfaction, Service quality and Customer satisfaction. We rejected all null hypothesis and
accepted alternative hypothesis. On the basis of above result, we approved that there is indirect
relationship between Job quality and Customer satisfaction through Job satisfaction and
Service quality. Therefore, we rejected null hypothesis and accepted the alternative hypothesis.
Null hypothesis:
H0. There is no indirect relationship between Job quality and Customer
satisfaction through Job satisfaction and Service quality. Rejected
Alternative hypothesis:
H1.There is an indirect relationship between Job quality and Customer
satisfaction through Job satisfaction and Service quality. Accepted
5.4 Correlations Although, the results of relationship between variables have been presented before by
deploying Pearson Chi-square. Further, we are also interested to cross check the results with the
help of correlation. The basic aim of our study is to investigate the probability of relationship
between variables, but not the degree of correlation. In other words, we are interested to
investigate the linkage between variables, instead of measuring the extent of their relationship.
Therefore, the purpose of using correlation is to verify the results we got from Pearson Chi-
square. It also increases the validity of our research, as the results from both tests are almost the
same.
JQN JSN CSN SQN
JQN
Pearson Correlation 1 .374** .006 -.102
Sig. (2-tailed) .000 .957 .356
N 84 84 84 84
JSN
Pearson Correlation .374** 1 .433** .321**
Sig. (2-tailed) .000 .000 .003
N 84 84 84 84
CSN
Pearson Correlation .006 .433** 1 .382**
Sig. (2-tailed) .957 .000 .000
N 84 84 84 84
SQN
Pearson Correlation -.102 .321** .382** 1
Sig. (2-tailed) .356 .003 .000
N 84 84 84 84
**. Correlation is significant at the 0.01 level (2-tailed).
Table 18: Correlations
67
Description:
The table 18 indicates the correlation among all the variables. From this table, we can infer
that there is a strong significant relationship between Job quality and Job satisfaction (sig
=.000), Job satisfaction and customer satisfaction (sig =.000), job satisfaction and service
quality (sig 0 .003), and service quality and customer satisfaction (sig =. 000). Furthermore,
the relation between Job quality and Service quality is insignificant. We conducted the
correlation test to find out, is there similarity between the results of both tests. In result, we
concluded that both test results are similar.
So we concluded,
H1. There is significant relationship between Job quality and Job satisfaction. Accepted
H2. There is significant relationship between Job satisfaction and Service quality. Accepted
H3. There is significant relationship between Job satisfaction and Customer satisfaction.
Accepted
H4. There is significant relationship between Service quality and Customer satisfaction.
Accepted
H5. There is an indirect relationship between Job quality and Customer satisfaction through
Job satisfaction and Service quality. Accepted
5.5 Discussion
1. Job quality and Job satisfaction
One of the core elements of this study is CCC job quality. As we discussed earlier in literature
framework, the difference between job quality and CCC job quality. The CCC job quality is
comprised of 12 dimensions which were discovered by Van dun et al., (2012) and these
dimensions makes CCC job quality different from Job quality in other industry. While
reviewing the literature, we came to know that we have to test relationships of CCC job
quality with other variables (Job satisfaction and Service quality) in order to find out the
answer of our research question, ‘‘is there any relationship between CCC job quality and
Customer satisfaction.’’
Further, in order to find indirect relation between CCC job quality and customer satisfaction.
We tested the relationship between CCC job quality and job satisfaction. On the basis of the
result, we inferred, ‘‘There is a significant relationship between CCC job quality and Job
satisfaction.’’ The result confirms the hypothesis which was developed after discussing the
relationship between these two variables (CCC job quality and Job satisfaction) thoroughly in
literature framework. Similarly, the outcome is conformed to the study of Van der aa et al.,
2012, p. 3925) who found the direct positive link between these two variables. Previously, the
relationship between different dimensions of CCC job quality and Job satisfaction has been
discovered (Mukherjee & Malhotra, 2006, p. 461; Bettencourt & Brown, 1997, p. 49).
Moreover, Sergeant & Frenkel (2000) discussed the relationship between CCC job quality and
Job satisfaction. The author found the positive relationship between these two variables.
Likewise, many researchers have conducted the study on the relationship between Job quality
in CCC and Job satisfaction. All have confirmed a direct significant relationship between two
68
these factors (Kantsperger & Kunz, 2005; Connell & Hannif, 2009; Whitt, 2006). Moreover,
our findings also tested and confirmed the ‘‘Supply Profit Chain Theory’’ which has been
presented in Literature Framework chapter. According to theory, inter quality (Job quality)
has strong effect on job satisfaction. The employees feel comfortable and satisfy when
internal quality is increased (Haskett et al. 1997, p. 29).
Finally, we concluded that CCC job quality has direct positive influence on job satisfaction. A
strong positive relationship between these two variables has been proved through previous
research and our empirical findings.
2. Job satisfaction and Service quality
The resulting relationship of job satisfaction and service quality in our research is positive,
however not highly significant. The research conducted by Malhotra & Mukherjee (2006)
about the role clarity of CCC employees and service quality presents the results similar to our
research. The employees who are directly in contact with the customers play a key role in
creating the view of service quality of the organization in the customers mind. The CC
employees who have a clear understanding of what is expected from them, how much
authority they have and know their responsibilities will have a high level of job satisfaction
and organization commitment (Malhotra & Mukherjee, 2006, p. 460) and they ultimately
provide better service to customers. We have also considered these factors of job satisfaction
while designing our first questionnaire. The questions related to job satisfaction of employees
are included in the first questionnaire. The variable of service quality is included in the
customer satisfaction questionnaire. The positive but less significant relationship in our results
indicates that there might be some other factor that must be investigated to build a highly
significant connection between employee satisfaction and service quality.
Another research by Malhotra & Mukherjee (2004) presents the parallel results. They tested
the relationship of organizational commitment and job satisfaction with service quality in
CCC. Their results represent that both variables have a significant impact on service quality,
however effective commitment is strongly related to the service quality in comparison with
job satisfaction. The service profit chain model presented in the theory also creates indirect
link between employee satisfaction and external service value or service quality. The linkage
between these two variables is created through employee retention and employee productivity
in SPC model (Heskett et al. 1994). It verifies our results that job satisfaction and service
quality are connected with each other but the relationship is not highly significant.
Some researchers also have contradictory views about this relationship. The research
conducted by Parasuraman et al., (1988) represents that the job satisfaction of employees is an
antecedent of service quality. Later on this view was changed by the study of Cronin and
Taylor (1992) as their results suggested that service quality in reality is an antecedent of
employee satisfaction. Afterwards this relationship was confirmed by many researchers
including the study of Dun et al., (2012). Our study is aimed to test the relationship between
these variables. Therefore, we are not much concerned with these contradictions. The
empirical and analysis chapter presents the results as less significant, but a definite
relationship between job satisfaction and service quality.
69
3. Job satisfaction and Customer satisfaction
The attempt to testify the variables of job satisfaction and customer satisfaction resulted in
highly significant relationship in our study. One of the vital drivers of customer satisfaction is
satisfaction of employees (Homburg & Stock, 2004, p. 144). The satisfied employees
positively affect the customer’s satisfaction (Homburg & Stock, 2004, p. 155) in couple of
ways. The direct effect is through the process of emotional contagion and the indirect effect is
through the way of dealing (interaction) of representative employees to their customers. The
interaction between employees and customers are obviously high in CCC industry as
compared to the other service industries. Our research contributes to the previous literature
because of the inclusion of interaction factor in the investigation of customer’s satisfaction.
The high interaction rate between the customers and organizational representatives results in a
strong relationship among job satisfaction and customer satisfaction.
Mukherjee & Malhotra (2004, p. 170) concluded that the employees who are emotionally
attached towards their organization perform well, as they understand and contribute to achieve
the organizational goals. The loyal and satisfied employees willingly perform better and their
behavior results in a positive customer satisfaction. The indirect linkage between the job
satisfaction of employees and customer satisfaction is also presented and elaborated in profit
service chain model (SPC) presented in the literature review. SPC connects the customer
satisfaction through the external service value presented by the organization. External service
value is comprised of Employee retention and employee productivity that are the outcome of
employee satisfaction.
In accordance with our research another research conducted by Kantsperger & Kunz (2005)
presents a high association between job satisfaction and customer satisfaction. They argued
that the companies should understand and take care of the requirements of their employees.
The employees are given such an importance that makes easy to achieve the higher level of
their satisfaction. The literature indicates that the intense customer relationships could be
achieved by increasing the employee job satisfaction (Kantsperger & Kunz, 2005, p. 147).
4. Service quality and Customer satisfaction
The connection between service quality and customer satisfaction has been investigated by
many researchers. In our research these two variables are the part of second questionnaire that
shows the highly significant relationship. Cronin and Taylor (1992, p. 55) investigated the
relationships between service quality, customer satisfaction and purchase decisions. Aligning
to our research results, they found that customer satisfaction is and antecedent of service
quality. A recent study done by Dun et al., (2012, p. 173) also proved a positive linkage
between service quality and customer satisfaction.
Our scale to measure the service quality and customer satisfaction was based on 13 variables
that have been invested by researchers (Feinberg et al., 2000; Jaiswal, 2008) presented in
literature review. Although we have not deployed all 13 variables but considered some of
them while designing our second questionnaire. The interaction rate is considered important
while determining the relationship between service quality and customer satisfaction
(Homburg & Stock, 2004, p. 155). Our results depicts that the customers having a good
experience of interaction are more satisfied with the service quality. The positive behavior of
representative employees is a determinant of high service quality. As we have presented the
results of the second questionnaire in empirical findings.
70
Going back to the literature, the high quality of services makes customer feel free to call the
CC representatives that also increases their confidence. A good example of high service
quality is the results of a question about service quality which was asked from customers.
According to answer, more than 90 % customers agreed that the CC representative always
remains calm and friendly even if they (customers) get angry. We believe that this is also one
of the reasons of employee’s stress. Because they are strictly instructed to follow the
guidelines while talking to the customers. On the other hand the company highly monitors
their employees and their conversations because they do not want to compromise on their
service quality. The companies we have selected are highly customer oriented and results
present that they deliver a high quality of services also.
Our results are also similar with the definitions of service quality presented in SERVQUAL
model developed by (Parasuraman et al., 1988), presented in literature. The SPC established a
direct link between customer satisfaction and service value. Haskett et al., (1997, p. 23) the
developers of SPC argues that services quality is perceived and expected very high by the
customers. It is hard to compare what customers pay and what kind of services they expect.
The expectations of customers are much more than they pay for the services.
5. CCC Job quality and Customer satisfaction
As we mentioned earlier, our research purpose is to find a relationship between job quality
and customer satisfaction. After rigorously reviewing the literature, we did not find the
sufficient evidence on the direct relationship of both these variables. Although, we found an
indirect relationship between CCC job quality and customer satisfaction through two other
variables (Job satisfaction and Service quality). On the basis of literature, we hypothesized the
relationships among these variables. In order to find out the answer of our research question,
we tested these variables and found significant relationship among these variables. As we
discussed above, we found the significant relationships among all variables. Therefore we can
say that there is an indirect relationship between CCC job quality and customer satisfaction
through job satisfaction and service quality. The meausrement of strenghts or weaknesses of
theses relaitonships could be the concern of future research. The final model we presnted
below provides and confirms the relationship between job qualtiy and customer satisfacion on
the basis of anaylsis, therefore fullfills the requirements of our basic research question.
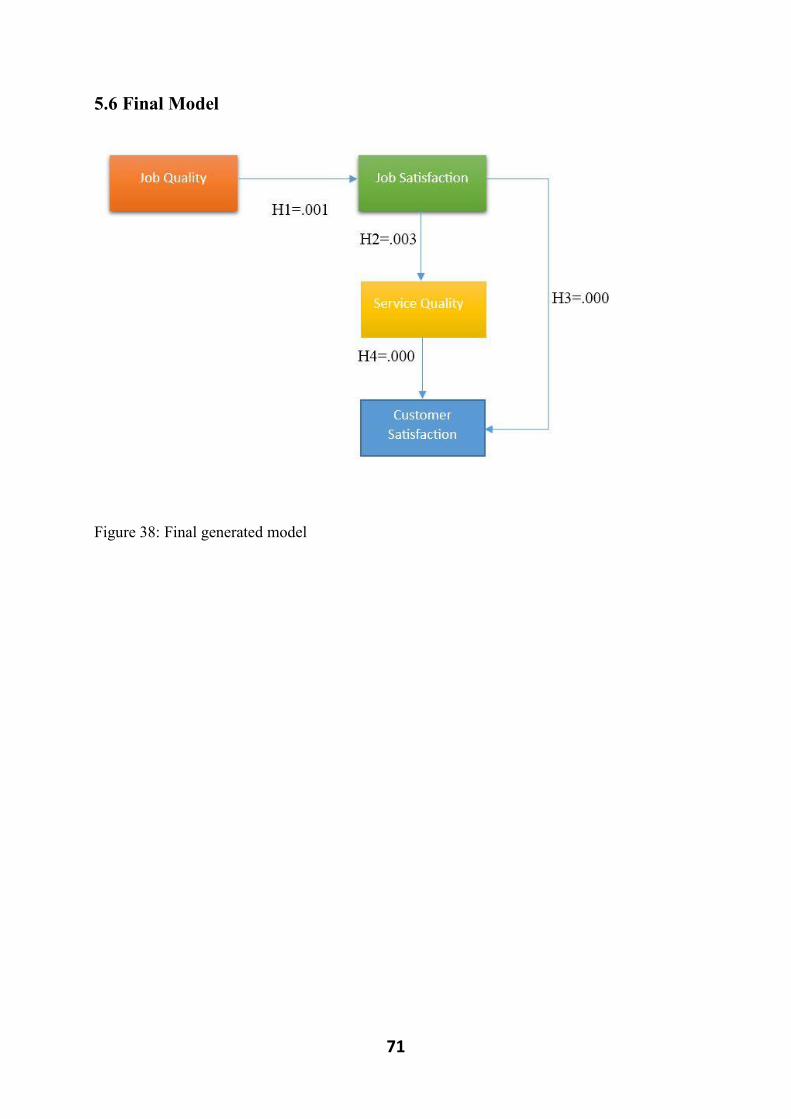
71
5.6 Final Model
Figure 38: Final generated model
72
Chapter 6: Conclusion
The last chapter is aimed to present the results of research question and hypothesis. It
provided the results aligning to the research objectives. It starts with the concluding remarks
and also contains the research contributions, future suggestions and limitations of the study.
6.1 Concluding Remarks
The purpose of this study was to investigate the relationship between job quality and customer
Satisfaction. The research question was, ‘‘Is there any relationship between CCC job quality
and customer satisfaction?’’ To find out the answer of this question, we rigorously went
through the previous literature. On the basis of empirical study result and earlier discussion,
our results show a significant relationship among all variables.
Further, all the hypothesis have been tested. The first hypothesis, ‘‘There is a significant
relationship between job quality and job satisfaction.’’ We found a significant relationship
between these two variables. Similarly, Van der aa et al., (2012) has also found direct
significant relationship between job quality and job satisfaction. Likewise, other researchers
have confirmed this relationship (Mukherjee & Malhotra, 2006; Sergeant & Frenkel 2000).
Moreover, second hypothesis was, ‘‘There is a significant relationship between Job
satisfaction and Service quality.’’ As per discussion in literature and analysis, we concluded
that there is a significant relationship between Job satisfaction and Service quality. Besides,
some other researchers also agree with our findings (Munhurrun et al., 2009; Whitt, 2006,).
Furthermore, the third hypothesis was developed, ‘‘There is a significant relationship between
job satisfaction and customer satisfaction.’’ The relationship between these two variables has
been tested and found significant. Interestingly, the relationship between two variables was
proven to be highly significant. The job satisfaction is critical element for customer
satisfaction (Kantsperger & Kunz, 2005, p. 147; Zeithamal & Bitner, 2000, p. 287).
Additionally, we tested our fourth hypothesis, ‘‘There is a significant relationship between
service quality and customer satisfaction.’’ Likewise, we found a highly significant
relationship between two above mentioned variables. This result is according to the previous
literature (Parasuraman et al., 1988; Dun et al., 2012) On the basis of these findings, we
concluded and confirmed our last hypothesis, ‘‘There is indirect relationship between Job
quality and customer satisfaction through job satisfaction and Service quality.’’
Finally, we believe that overall objective of the study has been achieved and the selected
research question has been answered in a scientific way. The highlights of the study are highly
significant relationships among the variables like, job quality and job satisfaction, job
satisfaction and customer satisfaction, service quality and customer satisfaction.
73
6.2 Contribution
We have studied and tested the existing knowledge. We have tested and affirmed the existing
theory (SPC). Further, we helped in increasing the validity and reliability of existing literature
and enhanced the understanding the phenomenon of job quality in CCC setting. As we
discussed earlier, this is an Intra-disciplinary study and we tried to find a link between two
broad subjects, Human Resources and Marketing. To the best of our knowledge, this
relationship has never been tested in regard to CCC context. There was a potential research
gap. We contributed to fill up this knowledge gap through our research findings.
This study is also helpful for managers of CCC. This study sheds light on the importance of
the job quality in CCC, its effect on employee satisfaction, service quality, and subsequently
effect on customer satisfaction. The manager should understand the phenomenon of job
quality and should make efforts to improve the job quality in CCC. They should work along
with employees to improve the working conditions and should encourage them to improve
service quality. Eventually, service quality will increase the customer satisfaction. In the end,
satisfied employees can make customers satisfied.
6.3 Further Research
We have adopted the quantitative study. For further research, qualitative study can be
conducted to check the reliability of the results.
Another variable effective commitment of employees can be tested in further research.
We presented the perspectives, customers and employees. But further research can be
conducted on single perspective, either employee or customers to increase harmony in
findings.
This job quality scale is only test in customer contact center. It can also be checked in
other departments like face to face customer contact centers.
We did not make any difference between contract employees and permanent
employees. Future research can be based on these two types of employment.
We only conducted study on inbound call centers. Further study can be focused on
outbound and outsourced call centers.
We have taken sample companies from Telecom industry. Other industry should also
be included in further research.
This topic should also be investigated in other departments of organization like, Face
to face customer contact center, Marketing department, and Sales department.
Our research has provided the linkage between job quality and customer satisfaction,
and connecting variables of job satisfaction and service quality. However in future, the
extent of these relationships could be investigated.
74
6.4 Quality Criteria
Reliability and validity test is considered important for quantitative research as it increases its
trustworthiness for researchers to use it for future and in the same discipline. In this regard,
we have tested the validity and reliability our research.
6.4.1 Reliability
Reliability refers the extent of consistency of data on which analysis is performed. In
particular, it portrays that up to what extent the contents of the research undertaken are
reliable, if deployed in the future research. The reliability gives an idea that for how long the
results of the study remain consistent except minor variations (Saunders et al., 2012, p.192).
Our data analysis is aligned with the theoretical framework and requirements of the study. As
discussed in methodology chapter, the data collection was done with the help of personal
references. Our analysis consists of various dimensions of job quality and other variables.
Therefore the measure of internal reliability is important to ensure the credibility of the
results. Bryman & Bell (2007, p.163) argues that reliability gives an estimate of responses that
how much the answers of the respondents on one indicator are aligned with the answers of the
other indicators.
As mentioned in the analysis chapter that we have deployed Cronbach’s Alpha. It helps to
measure the internal consistency of different entities that collectively form a single scale. Our
study is consistent of four variables having different dimension and our results are based on
the relationships among these variable of job quality, job satisfaction, service quality and
customer satisfaction. We believe that the results from reliability test presented in the analysis
are highly consistence as discussed and it will not change over time. This ensures that the
research conducted by us can be used and replicate in future without error.
6.4.2 Validity
Validity of the research is concerned about the accuracy of the findings, whether or not the
things are analyzed and defined in a way that it should be (Saunderset al., 2009, p. 157).
Particularly, validity provides with the idea that the variables used in the research are
measured efficiently as expected to be measured.
The important thing to be considered by the researchers is that the data collection is not
effected or influenced by themselves or others by any means. In order to attain the highest
level of validity the researchers should assure themselves that the survey questions exactly
measure the expected measurements without anyone’s influence (Bryman & Bell, 2007, p. 22-
29).
The validity of the contents was measured with the help of co-relation analysis in our
research. Our findings present a relationship between job quality and customer satisfaction,
through job satisfaction and service quality in the context of CCC. The results are presented
on the bases of dimension of the variables that showed their relation with each other.
75
The aim of the co-relation is to measure the interrelationships between the variables in the
context of similarities among different dimensions. It is also used to calculate the extent of
significance among different variables. The significance among the variables of job quality,
job satisfaction, and service quality and customer satisfaction are discussed in detail in the
chapter of analysis.

76
References
Journal Articles
Abbasi, D., & Hollman, D. (2000). Turnover: The Real Bottom Line. Public Personnel
Management, 29(3), 333-342.
Aksin, Z., Armony, M., & Mehrotra, V. (2007). The modern call center: a multi-
disciplinary perspective on operations management research. Production and Operations
Management, 16(6), 665-688.
Alferoff, C., & Knights, D. (2008). Customer relationship management in call centers:
The uneasy process of reforming the subject through the ‘people-by-numbers’ approach.
Information and Organization, 18, 29-50.
Anton, J. (2000). The past, present and future of customer access centers. International
Journal of Service Industry Management, 11(2), 120-130.
Batt, R. (2002). Managing customer services: human resource practices, quit rates, and
sales growth. Academy of Management Journal, 45(3), 587-597.
Batt, R., & Moynihan, L. (2002). The viability of alternative call center production
models. Human Resource Management Journal, 12(4), 14-34.
Bagozzi, R. P., Edwards, J. R. (1998). A general approach for representing constructs in
organizational research. Organizational Research Methods, 1 (1), 45–87.
Berry, L.L., & Parasuraman, A. (1991). Marketing Services: Competing through Quality.
New York: The Free Press.
Bettencourt, A. L., & Brown, W. S. (1997). Contact Employees: Relationships among
Workplace Fairness, Job Satisfaction and Pro-social Service Behaviors. Joumal of
Retailing, 73(1), 39-61.
Binter, M. (1990). Evaluating Service Encounters: The Effects of Physical Surroundings
and Employee Responses. Journal of Marketing, 54, 69-82.
Blaikie, N. (2000). Designing social Research. UK: Polity Press.
Bryman, A. & Bell, E. (2003). Business research method. 1st edition. New York: Oxford
University Press.
Bryman, A., & Bell, E. (2007). Business research methods. 2nd edition. UK: Oxford
university press.
Bryman, A. & Bell, E. (2011). Business Research Methods. 3rd edition. UK: Oxford
University Press.
Budhwar, S. P., Varma, A., Malhotra, N., & Mukherjee, A. (2009). Insights into the Indian
call centre industry: can internal marketing help tackle high employee turnover? Journal
of Services Marketing, 23(5), 351–362.
77
Burgers, A., Ruyter, K., Keen, C., & Streukens, S. (2000). Customer expectation
dimensions of voice-to-voice service encounters: a scale-development study. International
Journal of Service Industry Management, 11(2), 142-161.
Chevalier, A., Dessery, M., Boursier, F. M., Grizon, C., Jayet, C., Reymond, C., Thiebot,
M., Ramirez, Z. M., & Calvez, T. (2011). Working conditions and psychosocial risk
factors of employees in French electricity and gas company customer support
departments. Int Arch Occup Environ Health, 84, 7-18.
Choi, S., Cheong, K., & Feinberg, A. R. (2012). Moderating effects of supervisor support,
monetary rewards, and career paths on the relationship between job burnout and turnover
intentions in the context of call centers. Managing Service Quality, 22(5), 492 - 516.
Connell, J., & Hannif, Z. (2009). Call centers, quality of work life and HRM practices: An
in-house/outsourced comparison. Employee Relations, 31(4), 363 - 381.
Cooper, J. & Cronin, J.J. (2000). Internal marketing: a competitive strategy for the long-
term care industry. Journal of Business Research, 48(3), 177-81.
Cronin, J., & Taylor, S. (1992). Measuring Service Quality: A Reexamination and
Extension. Journal of Marketing, 56, 55-68.
David, M. & Sutton, C.D. (2011). Social Research: An Introduction. 2nd edition. UK: TJ
International Ltd.
Dean, A. (2001). Rethinking customer expectations of service quality: are call centers
different? Journal of Services Marketing, 18, 60-78.
Dormann, C., & Zijlstra, F. (2003). Call centers: High on technology—high on emotions.
European Journal of Work and Organizational Psychology, 12(4), 305-310.
Dun, Z., Bloemer, J., & Henseler, J. (2012). Job quality in the Customer Contact Center:
conceptual foundation and scale development. The Service Industries Journal, 32(2), 171-
196.
Feinberg, R., Kim, I., Hokama, L., Ruyter, K., & Keen, C. (2000). Operational
determinants of caller satisfaction in the call center. International Journal of Service
Industry Management, 11(2), 131-141.
Frenkel, Stephen, Marek Korcyznski, Karen Shire, and May Tam (1999). On the Front
Line: Organization of Work in the Information Economy. New York: Cornell University
Press.
Garnett, O., Mandelbaum, A., & Reiman, M. (2002). Designing a Call Center with
Impatient Customers. Manufacturing & Service Operations Management, 4(3), 208-227.
George, D., & Mallery, P. (2003). SPSS for Windows step by step: A simple guide and
reference. 11.0 update. 4th edition. Boston: Allyn & Bacon
Gorjup, T. M., Valverde, M., & Ryan, G. (2008). Promotion in call centres: opportunities
and determinants. Journal of European Industrial, 32(1), 45-62.
Gorjup, T. M., Valverde, M., & Ryan, G. (2009). In search of job quality in call centers.
Personnel Review, Emerald Group Publishing Limited, 38(3), 253-269.
Hannif, Z., Burgess, J., & Connell, J. (2008). Call Centres and the Quality of Work Life:
Towards a Research Agenda. Journal of Industrial Relations, 50(2), 271–284.
78
Harris, C., Daniels, K., & Briner, B. R. (2003). A daily diary study of goals and affective
well-being at work. Journal of Occupational and Organizational Psychology, 76, 401-
410.
Haskett, J., Sasser, W., & Schlesiner, L. (1997). The service profit chain: how leading
companies link profit and growth to loyalty, satisfaction, and value. New York: The free
press.
Hawcroft, J.B. & Beckett, A. (1993). Changes in UK bank branch networks: a customer
perspective. The Service Industries Journal, 13(4), pp. 267-88.
Heskett, J.L., Jones, T.O., Loveman, G.W., Sasser Jr., W.E., Schlesinger, L.A., (1994).
Putting the service–profit chain to work. Harvard Business Review, 72 (2), 164–174.
Homburg, C., & Stock, M. (2004). The Link between Salespeople’s Job Satisfaction and
Customer Satisfaction in a Business-to-Business Context: A Dyadic Analysis. Journal of
the Academy of Marketing Science, 32(2), 144-158.
Hunter, L. (2000). What determines job quality in nursing homes? Industrial and Labor
Relations Review, 53(3), 463-481.
Jaiswal, A. (2008). Customer satisfaction and service quality measurement in Indian call
centers. Managing Service Quality, 18(4), 405-416.
Jasmand, C., Blazevic, V., & Ruyter, &. K. (2012). Generating Sales While Providing
Service: A Study of Customer Service Representatives’ Ambidextrous Behavior. Journal
of Marketing, 76, 20-37.
Kantsperger, R. H. (2005). Managing overall service quality in customer care centers:
Empirical findings of a multi-perspective. International Journal of Service, 16(2), 135-
151.
Lau, R.S.M. (2000). Quality of work life and performance an ad hoc investigation of two
key elements in the Service Profit Chain Model, International Journal of Service Industry
Management, 11(5), 422-37.
Lengnick, H. A. (1996). Customer Contributions to Quality: A Different view of the
Customer Oriented Firm. Academy of Management Review, 21(3), 791-824.
Long, R. G., White, C. M., Friedman, W. H. & Brazeal, D.V. (2000). The ‘Qualitative’
versus ‘Quantitative’ research debate: A question of metaphorical assumptions.
International Journal of Value-based Management, 13, 189-197.
Loveman, G.W., (1998). Employee satisfaction, customer loyalty, and financial
performance: An empirical examination of the service profit chain in retail banking.
Journal of Service Research, 1 (1), 18–31.
Matzler, K., Fuchs, M., & Schubert, K. A. (2004). Employee Satisfaction: Does Kano's
Model Apply? Total Quality Management, 15(9-10), 1179-1198.
Meyer, J.P., & Allen, N.J. (1991). A three-component conceptualization of organizational
commitment. Human Resource Management Review, 1(1), 61-89.
79
Meyer, J.P., Allen, N.J. & Smith, C.A. (1993). Commitment to organizations and
occupations: extension and test of a three-component conceptualization. Journal of
Applied Psychology, 78(4), 538-51.
Miciak, A., & Desmarais, M. (2001). Benchmarking service quality performance at
business-to-business and business-to-consumer call centers. Journal of Business &
Industrial Marketing, 16(5), 340-353.
Munhurrun, R. P., Naidoo, P., & Bhiwajee, D. S. (2009). Employee perceptions of service
quality in a call centre. Managing Service Quality, 19(5), 541-557.
Mukherjee, A., & Malhotra, N. (2004). The relative influence of organizational
commitment and job satisfaction on service quality of CC employees in banking call
center. Journal of Services Marketing, 18(3), 162-174.
Mukherjee, A., & Malhotra, N. (2006). Does role clarity explain employee-perceived
service quality? International Journal of Service, 17(5), 444-473.
Narayanan, j., & Moynihan, L. (2006). Mindfulness at work: The beneficial effects on job
burnout in call centers. In: Academy of Management Best Conference Paper. U.K
Nulty, D. (2008). The adequacy of response rates to online and paper surveys: what can be
done? Assessment & Evaluation in Higher Education, 33(3), 301-314.
Oliver, R.L. (1997). Satisfaction: A Behavioral Perspective on the Consumer. New York:
McGraw-Hill.
Parasuraman, A., Zeithaml, V., & Berry, L. (1988). SERVQUAL: a multiple-item scale for
measuring consumer perceptions of service quality. Journal of Retailing, 64, 12-40.
Ponterotto, J. (2005). Qualitative research in counseling psychology: A primer on research
paradigms and philosophy of science. Journal of Counseling Psychology, 52 (2), 126-136.
Saunders, M., Lewis, P., & Thornhill, A., (2009). Research methods for business students.
5th edition. Harlow: Financial Times Prentice Hall.
Saunders, M., Lewis, P. & Thornhill, A., (2012). Research Methods for Business Students.
6th edition. Harlow: Pearson Education.
Sergeant, A., & Frenkel, S. (2000). When Do CC Employees Satisfy Customers? Journal
of Service Research, 3(1), 18-34.
Singh, J. (2000). Performance productivity and quality of frontline employees in service
organizations. Journal of Marketing, 64(2), 15-34.
Sue, M.V., & Ritter, L.A. (2007). Conducting Online Survey. Los Angeles: Sage
Publications Inc.
Valverde, M., Ryan, G., & Gorjup, T. M. (2007). An Examination of the Quality of Jobs in
the Call Center Industry. International Atlantic Economic Society, 13, 146–156.
80
Van der aa, Z., Bloemer, J. & Henseler, J. (2012). Reducing employee turnover through
customer contact center job quality. The International Journal of Human Resource
Management, 23(18), 3925–3941.
Whitt, W. (2006). The Impact of Increased Employee Retention on Performance in a
Customer Contact Center. Manufacturing & Service Operations Management, 8(3), 235–
252.
Witt, A. L., Andrews, C. M., & Carlson, S. D. (2004). When Conscientiousness Isn’t
Enough: Emotional Exhaustion and Performance Among Call Center Customer Service
Representatives. Journal of Management, 30(1), 149–160.
Yee, R., Yeung, A., & Cheng, T. (2011). The service profit chain: An empirical analysis in
high-contact service industries. International Journal of Production Economics, 130, 236-
245.
Zeithaml, V.A., Parasuraman, A. & Berry, L.L. (1990). Delivering Quality Service. New
York: The Free Press.
Zeithaml, V.A. & Bitner, M.J. (2000). Services Marketing. New York: McGraw-Hill.
Zeithaml, V.A. & Bitner, M.J. (2000). Services Marketing Integrating Customer Focus
Across the Firm. 2nd edition. London: Irwin McGraw Hill.
Internet Sources
Barton, B. (2013). American Congressman. Thinkexist.com
<http://thinkexist.com/quotation/the_five_steps_in_teaching_an_employee_new_skills/20
0784.html> [Retrieved 2013-2-3]
Brace, I. (2004). Questionnaire design: How to Plan, Structure, and Write Survey
Material for Effective Marketing Research. London: Kogan Page Ltd. E-book.
Hague, P., Hague, N., & Morgan, C. A. (2004). Market research in practice: A guide to
the basics. London: Kogan Page Ltd. E-Book.
Hsieh, T. (2013). Tony Hsieh Quotes. Brainy Quote
<http://www.brainyquote.com/quotes/authors/t/tony_hsieh.html> [Retrieved 2013-2-3]
Mulcahy, M. (2013). Anne M. Mulcahy Quotes. Brainy Quote
<http://www.brainyquote.com/quotes/authors/a/anne_m_mulcahy.html> [Retrieved 2013-
2-3]
Sotelo, M. (2013). Michael Sotelo Quotes & Sayings. Search Quotes
<http://www.searchquotes.com/quotes/author/Michael_Sotelo/> [Retrieved 2013-2-3]
Ziglar, Z. (2013). Customer Quotes. Brainy Quote
<http://www.brainyquote.com/quotes/keywords/customers.html> [Retrieved 2013-2-3]
81
Appendix
Appendix 1: Employees Questionnaire (1)
The purpose of this research is to investigate the phenomena of job quality in call center and
its effect on customer satisfaction. This survey is solely conducted for academic purpose.
Your information will be kept in secrecy and will not be commercialized.
1. My age is
18-22
23-30
above 30
2. I amGender
Male
Female
3. I have doneEducation
Intermediate
Bachlors
Masters
Other
4. My work experience of Current job is
Less than one year
1-2 years
More than 2 years
5. I have clear, fixed goals in my work
Strongly disagree
Disagree
Neither agree nor disagree
Agree
Strongly agree
82
6. I know my responsibilities in my work.
Strongly disagree
Disagree
Neither agree nor disagree
Agree
Strongly agree
7. I know exactly what is expected from me in my work
Strongly disagree
Disagree
Neither agree nor disagree
Agree
Strongly agree
8. I receive clear explanation of what is expected of me in my work
Strongly disagree
Disagree
Neither agree nor disagree
Agree
Strongly agree
9. I know what is expected from me during contact with customers
Strongly disagree
Disagree
Neither agree nor disagree
Agree
Strongly agree
10. I know how much service to give to customers
Strongly disagree
Disagree
Neither agree nor disagree
Agree
Strongly agree

83
11. I know how to handle objections of customers
Strongly disagree
Disagree
Neither agree nor disagree
Agree
Strongly agree
12. I know how to handle unexpected situations or problems
Strongly disagree
Disagree
Neither agree nor disagree
Agree
Strongly agree
13. I know how to handle criticism of customers
Strongly disagree
Disagree
Neither agree nor disagree
Agree
Strongly agree
14. The teams within call center share information with one another on a regular basis
Strongly disagree
Disagree
Neither agree nor disagree
Agree
Strongly agree
15. We as customer service receive sufficient cooperation of other departments
Strongly disagree
Disagree
Neither agree nor disagree
Agree
84
Strongly agree
16. There is good communication between customer service and other departments
Strongly disagree
Disagree
Neither agree nor disagree
Agree
Strongly agree
17. We share information from customer service with other departments
Strongly disagree
Disagree
Neither agree nor disagree
Agree
Strongly agree
18. Other departments use the information they receive from customer service
Strongly disagree
Disagree
Neither agree nor disagree
Agree
Strongly agree
19. We, as customer service, are informed in time about activities from other departments
that have an impact on customer service
Strongly disagree
Disagree
Neither agree nor disagree
Agree
Strongly agree
20. Within my company, all departments collaborate well
Strongly disagree
Disagree
85
Neither agree nor disagree
Agree
Strongly agree
21. The good quality of the products and services of other departments make sure that we do
not receive unnecessary calls from our customers
Strongly disagree
Disagree
Neither agree nor disagree
Agree
Strongly agree
22. I have to do things that should be done differently
Strongly disagree
Disagree
Neither agree nor disagree
Agree
Strongly agree
23. I have to do tasks without having the authority to do so
Strongly disagree
Disagree
Neither agree nor disagree
Agree
Strongly agree
24. I have to go against rules to do my tasks
Strongly disagree
Disagree
Neither agree nor disagree
Agree
Strongly agree
25. I work with two or more teams within call center that work very differently
86
Strongly disagree
Disagree
Neither agree nor disagree
Agree
Strongly agree
26. I receive contradictory assignments from two or more people
Strongly disagree
Disagree
Neither agree nor disagree
Agree
Strongly agree
27. I do things that one accepts but the other does not
Strongly disagree
Disagree
Neither agree nor disagree
Agree
Strongly agree
28. I receive assignments without the means to execute them
Strongly disagree
Disagree
Neither agree nor disagree
Agree
Strongly agree
29. I engage myself in needless matters
Strongly disagree
Disagree
Neither agree nor disagree
Agree
Strongly agree
87
30. My superior has faith in my abilities
Strongly disagree
Disagree
Neither agree nor disagree
Agree
Strongly agree
31. My superior is there for me when I have questions
Strongly disagree
Disagree
Neither agree nor disagree
Agree
Strongly agree
32. I experience positive stimulus from my superior
Strongly disagree
Disagree
Neither agree nor disagree
Agree
Strongly agree
33. My superior takes me seriously
Strongly disagree
Disagree
Neither agree nor disagree
Agree
Strongly agree
34. My coach/superior communicates and informs me well
Strongly disagree
Disagree
Neither agree nor disagree
Agree
Strongly agree
88
35. I receive sufficient feedback about what I do well
Strongly disagree
Disagree
Neither agree nor disagree
Agree
Strongly agree
36. I receive sufficient feedback about what I can improve
Strongly disagree
Disagree
Neither agree nor disagree
Agree
Strongly agree
37. My Company offers a good product portfolio to its customers
Strongly disagree
Disagree
Neither agree nor disagree
Agree
Strongly agree
38. My Company stays in touch with customers regularly to inform itself about its customers’
needs
Strongly disagree
Disagree
Neither agree nor disagree
Agree
Strongly agree
39. My Company uses the input of its customers to better match its products and services
with the needs of the customers
Strongly disagree
Disagree
89
Neither agree nor disagree
Agree
Strongly agree
40. My Company takes actions based on the customers’ complaints
Strongly disagree
Disagree
Neither agree nor disagree
Agree
Strongly agree
41. My Company learns from its customers’ signals
Strongly disagree
Disagree
Neither agree nor disagree
Agree
Strongly agree
42. I am regularly being asked how I think we can improve our organization
Strongly disagree
Disagree
Neither agree nor disagree
Agree
Strongly agree
43. I feel that my suggestions are being used
Strongly disagree
Disagree
Neither agree nor disagree
Agree
Strongly agree
44. I receive feedback about the suggestions that I have made
Strongly disagree
90
Disagree
Neither agree nor disagree
Agree
Strongly agree
45. I have sufficient growth opportunities within my company
Strongly disagree
Disagree
Neither agree nor disagree
Agree
Strongly agree
46. I feel that my work is meaningful
Strongly disagree
Disagree
Neither agree nor disagree
Agree
Strongly agree
47. I am sufficiently challenged in my work
Strongly disagree
Disagree
Neither agree nor disagree
Agree
Strongly agree
48. My work is diverse
Strongly disagree
Disagree
Neither agree nor disagree
Agree
Strongly agree
49. I have enough fun in my work
91
Strongly disagree
Disagree
Neither agree nor disagree
Agree
Strongly agree
50. We often share information among ourselves
Strongly disagree
Disagree
Neither agree nor disagree
Agree
Strongly agree
51. I have enough easily accessible tools to answer the questions of the customers
Strongly disagree
Disagree
Neither agree nor disagree
Agree
Strongly agree
52. I have easy tools to register the contacts with the customers
Strongly disagree
Disagree
Neither agree nor disagree
Agree
Strongly agree
53. There is enough distance between the workplaces
Strongly disagree
Disagree
Neither agree nor disagree
Agree
Strongly agree
92
54. I am encouraged to take initiative
Strongly disagree
Disagree
Neither agree nor disagree
Agree
Strongly agree
55. It is allowed to take initiative
Strongly disagree
Disagree
Neither agree nor disagree
Agree
Strongly agree
56. Company trust me to make the right assessment
Strongly disagree
Disagree
Neither agree nor disagree
Agree
Strongly agree
57. My company is customer-oriented
Strongly disagree
Disagree
Neither agree nor disagree
Agree
Strongly agree
58. My company is honest towards its customers
Strongly disagree
Disagree
Neither agree nor disagree
Agree
Strongly agree
93
59. My company is honest towards its employees
Strongly disagree
Disagree
Neither agree nor disagree
Agree
Strongly agree
60. The collaboration with my colleagues is pleasant
Strongly disagree
Disagree
Neither agree nor disagree
Agree
Strongly agree
61. There is a good work climate in the customer service department
Strongly disagree
Disagree
Neither agree nor disagree
Agree
Strongly agree
62. My workload is easily manageable
Strongly disagree
Disagree
Neither agree nor disagree
Agree
Strongly agree
63. My job performance is measured by a proper way
Strongly disagree
Disagree
Neither agree nor disagree
Agree
94
Strongly agree
64. Promotion is based on my efficiency of work
Strongly disagree
Disagree
Neither agree nor disagree
Agree
Strongly agree
65. There are no fundamental things I dislike about my job
Strongly disagree
Disagree
Neither agree nor disagree
Agree
Strongly agree
66. Overall, I am quite satisfied with my job
Strongly disagree
Disagree
Neither agree nor disagree
Agree
Strongly agree
95
Appendix 2: Customers questionnaire (2)
The purpose of this survey is to know the perception of the customers about the service quality of call
centers of below mentioned companies and to measure customer satisfaction. This data will be used
for academic purpose and will not be commercialized. This survey is not conducted on the behalf of
the below mentioned companies. (Call Center Representative = the employee of call center who
provides services on phone)
1. I am previous/existing customer of (you can select only one option). *
Ptcl
U-Fone
Telenor
2. My age is
15-22
23-30
Above 30
3. I am
Male
Female
4. I have done
Intermediate
Bachelor
Masters
Other
5. I usually interact with call center representative in a month
1-3 times
4-8 times
More than 8 times
6. I feel free to call for customer services of the selected company
Strongly disagree
Disagree
96
Neither agree nor disagree
Agree
Strongly agree
7. My problems get solved or request answered in one call
Strongly disagree
Disagree
Neither agree nor disagree
Agree
Strongly agree
8. I have to wait for a long time while connecting to the call center representative
Strongly disagree
Disagree
Neither agree nor disagree
Agree
Strongly agree
9. The call center representative takes enough time to understand and solve my problem
Strongly disagree
Disagree
Neither agree nor disagree
Agree
Strongly agree
10. The call center representative remains calm, if (even) I get angry
Strongly disagree
Disagree
Neither agree nor disagree
Agree
Strongly agree
11. The call center representative has the authority to solve my problems
Strongly disagree
97
Disagree
Neither agree nor disagree
Agree
Strongly agree
12. The behavior of call center representative increases my confidence
Strongly disagree
Disagree
Neither agree nor disagree
Agree
Strongly agree
13. The call center representatives are very friendly
Strongly disagree
Disagree
Neither agree nor disagree
Agree
Strongly agree
14. On an overall basis, my experience with customer services has been positive
Strongly disagree
Disagree
Neither agree nor disagree
Agree
Strongly agree
15. On an overall basis, I am satisfied with the provided services by call center representative
Strongly disagree
Disagree
Neither agree nor disagree
Agree
Strongly agree
SubmitBottom of Form
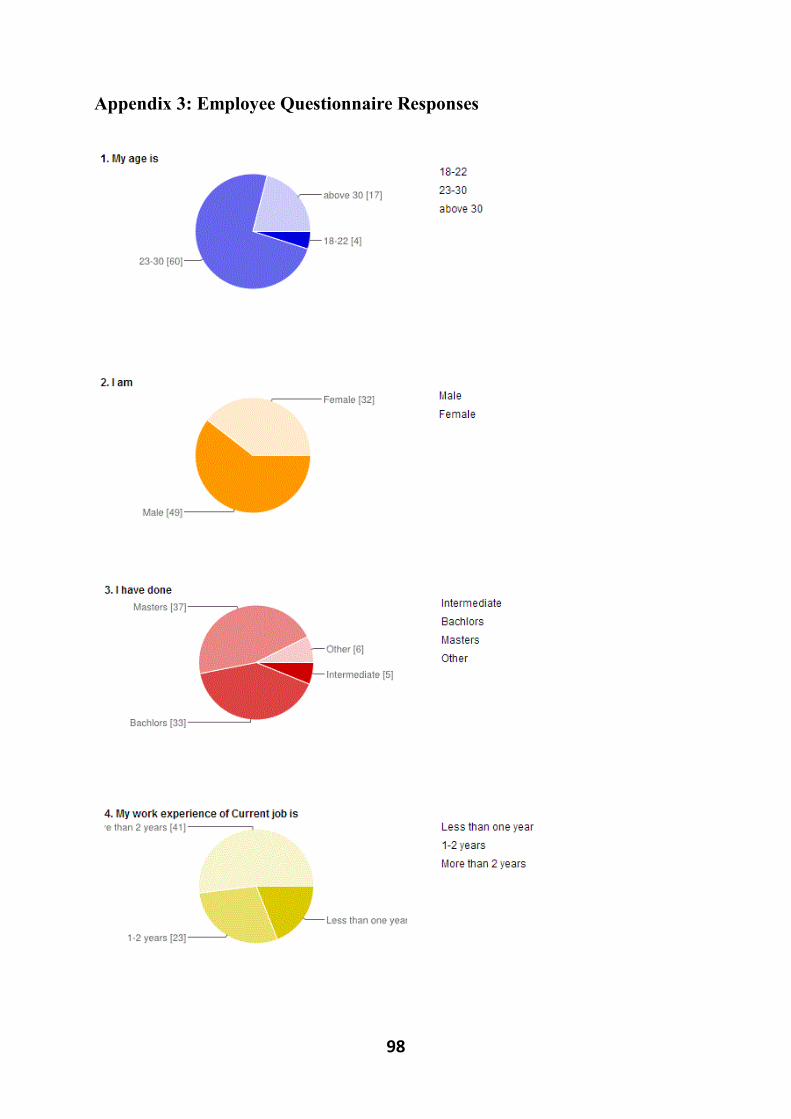
98
Appendix 3: Employee Questionnaire Responses
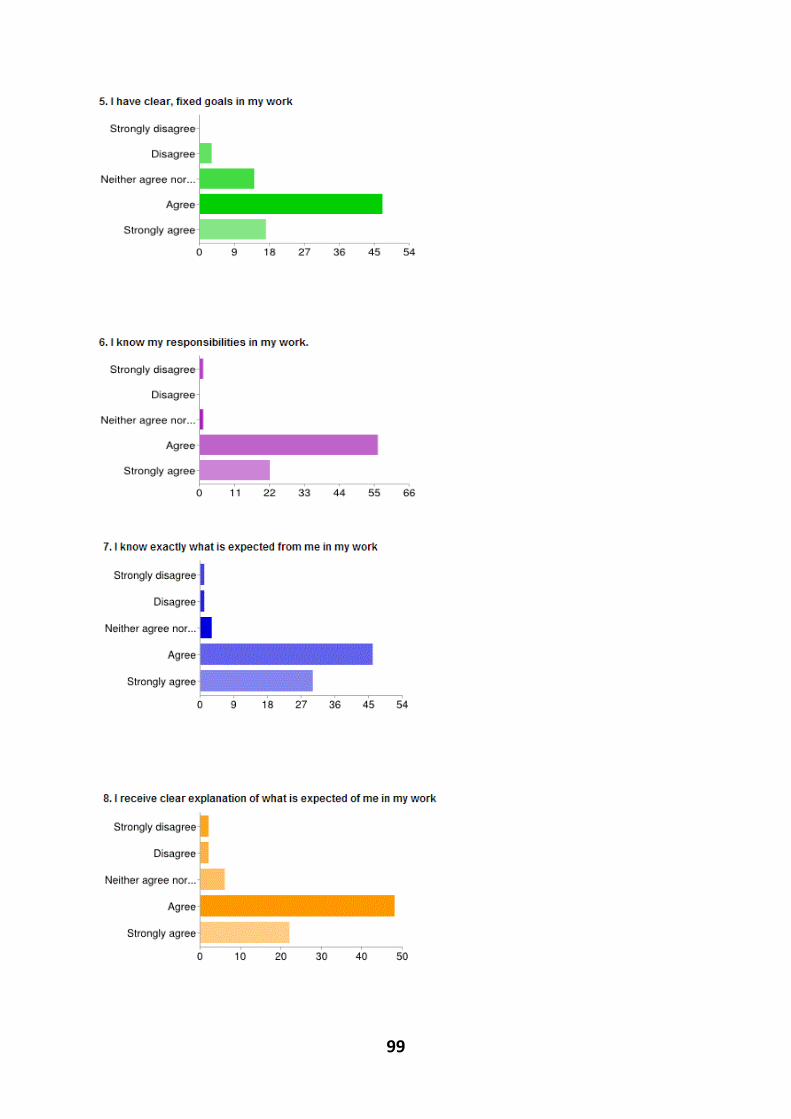
99
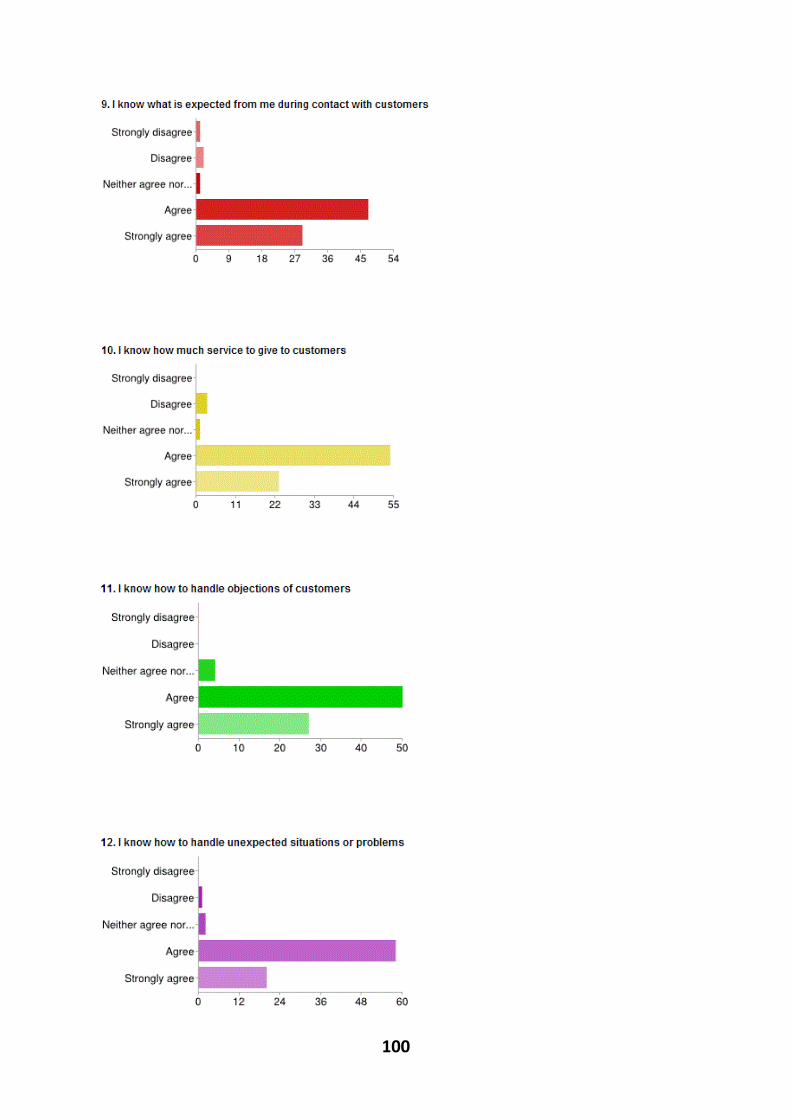
100
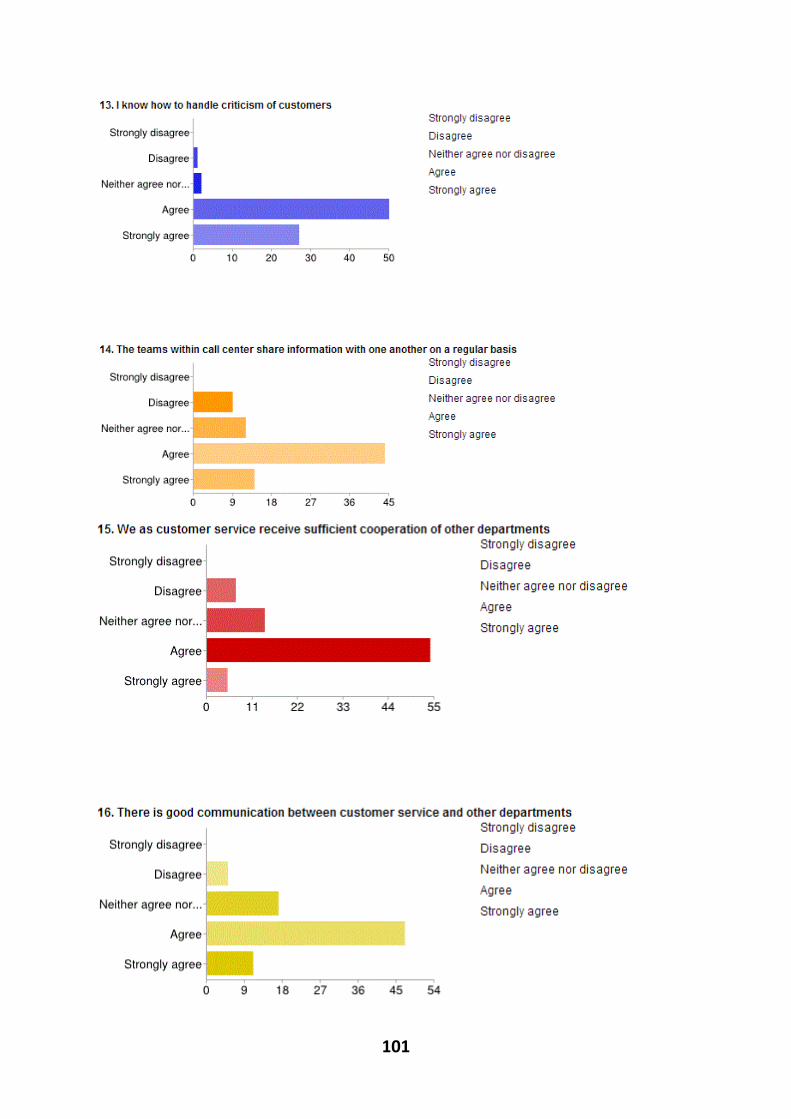
101
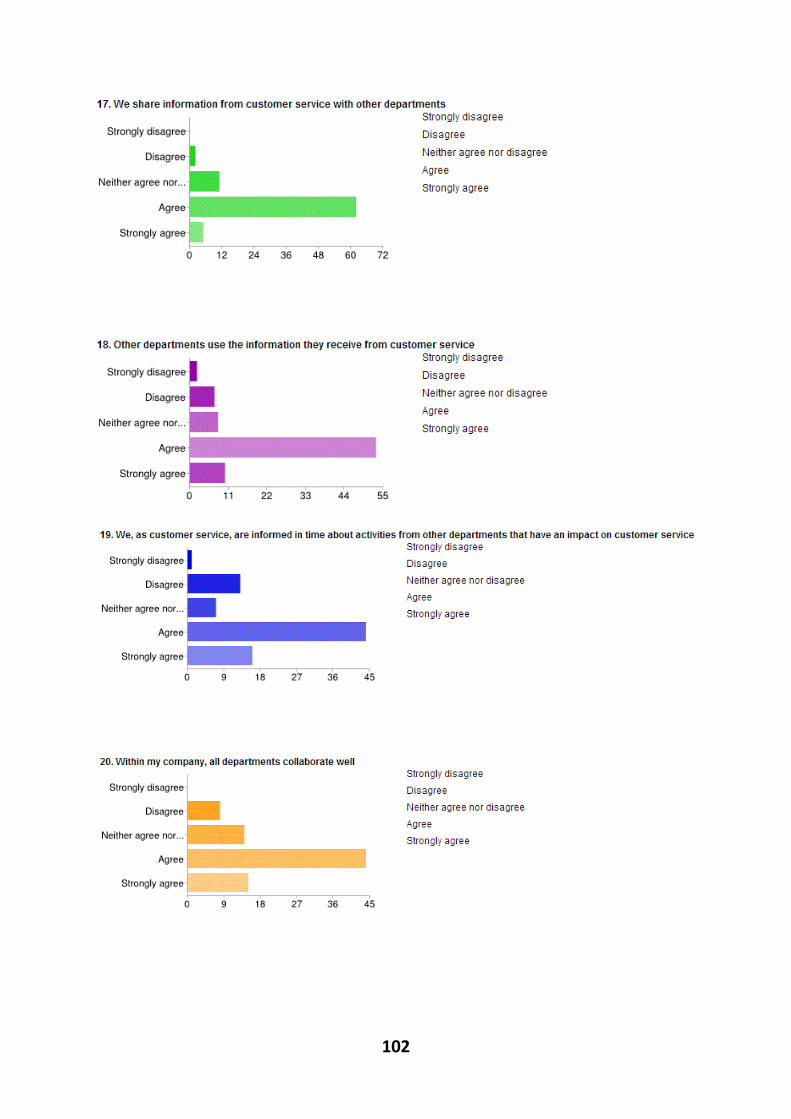
102
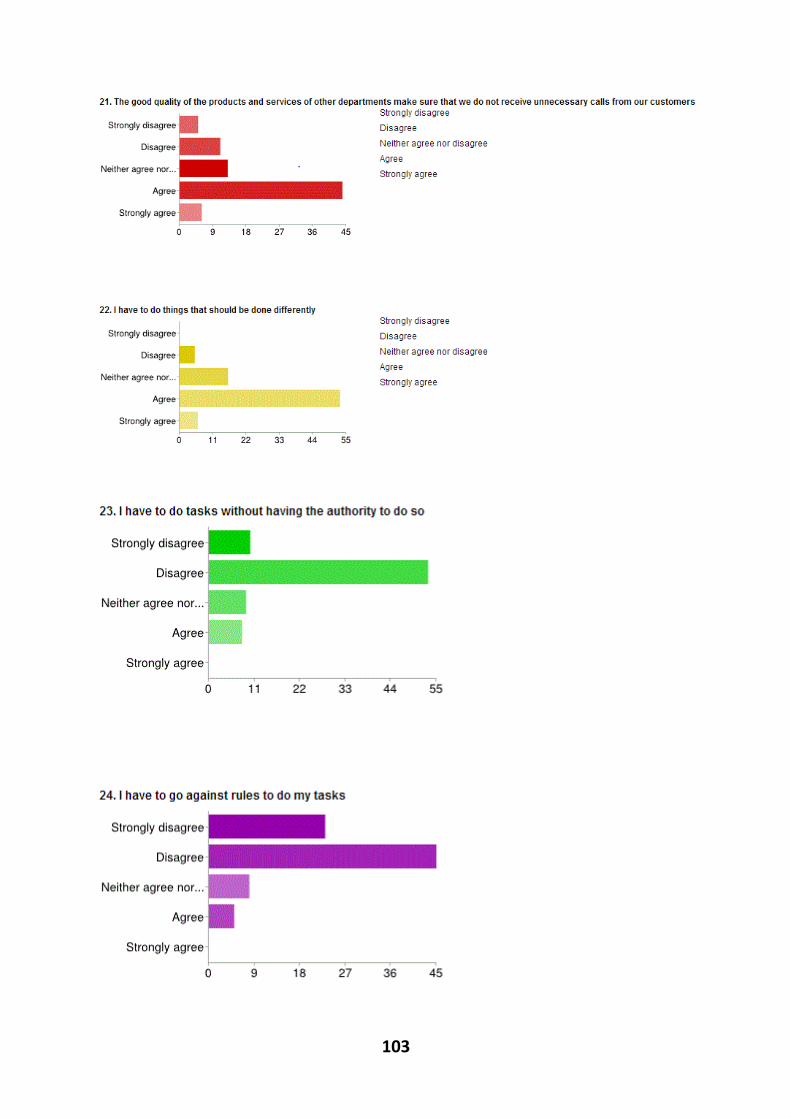
103
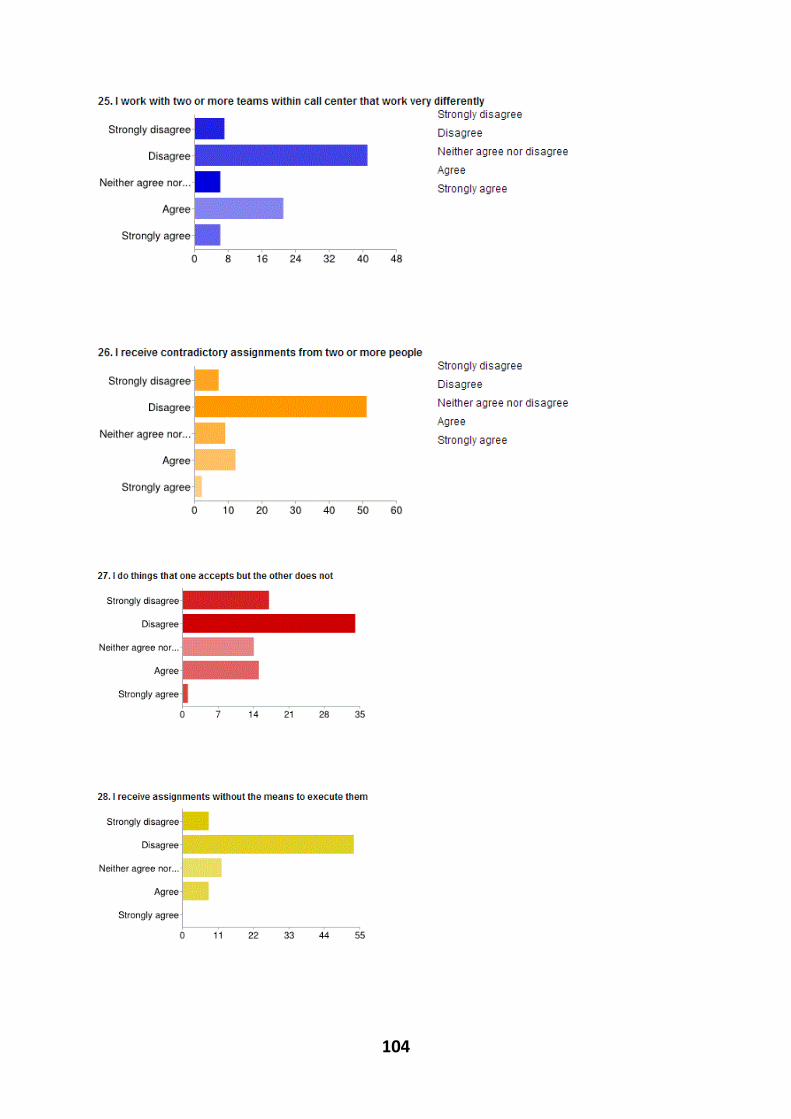
104
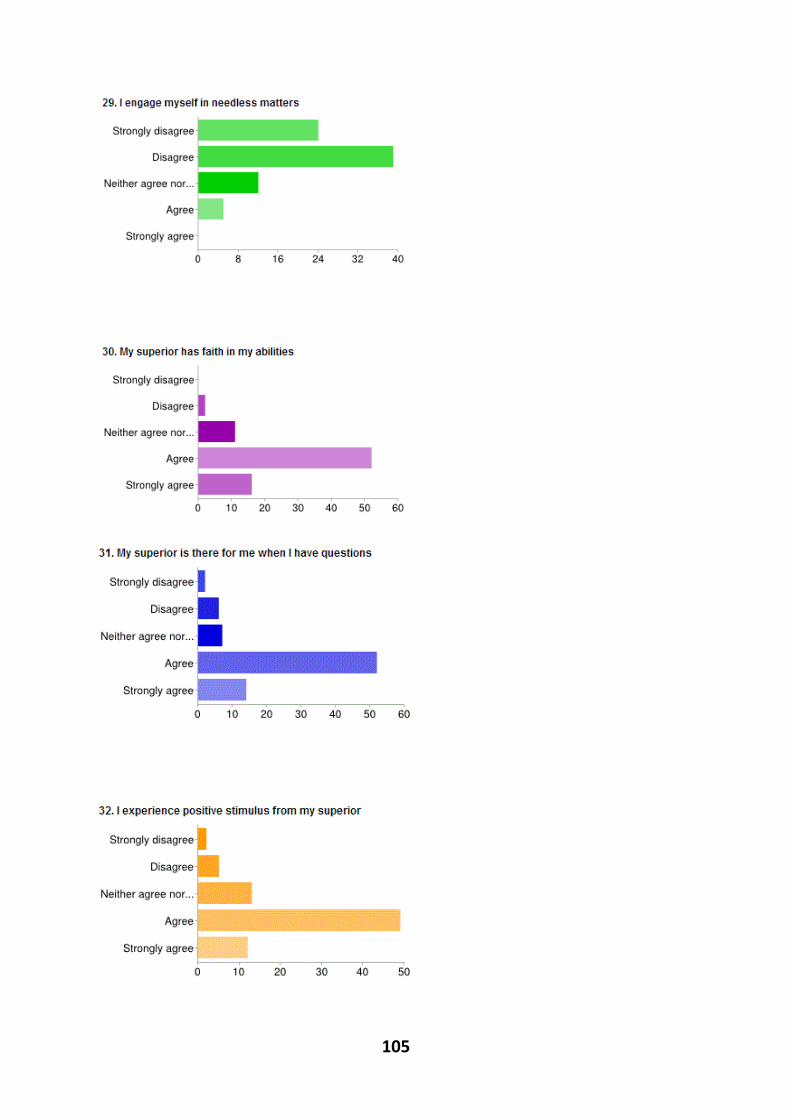
105
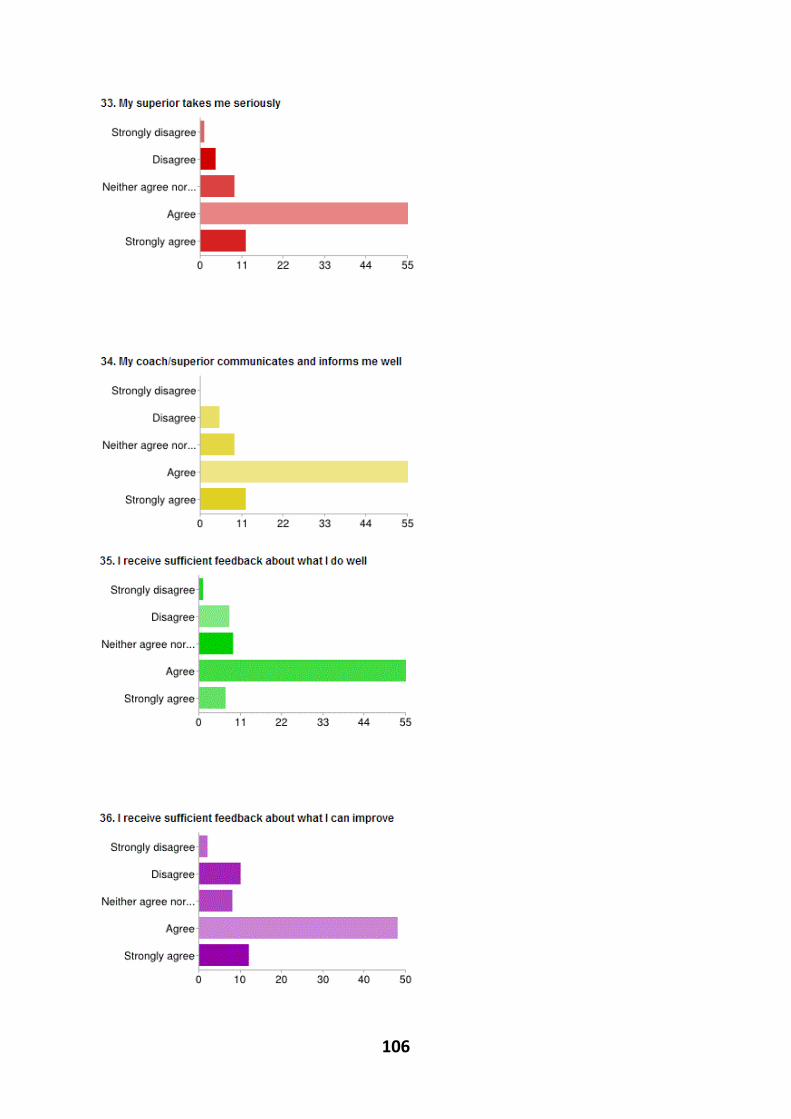
106
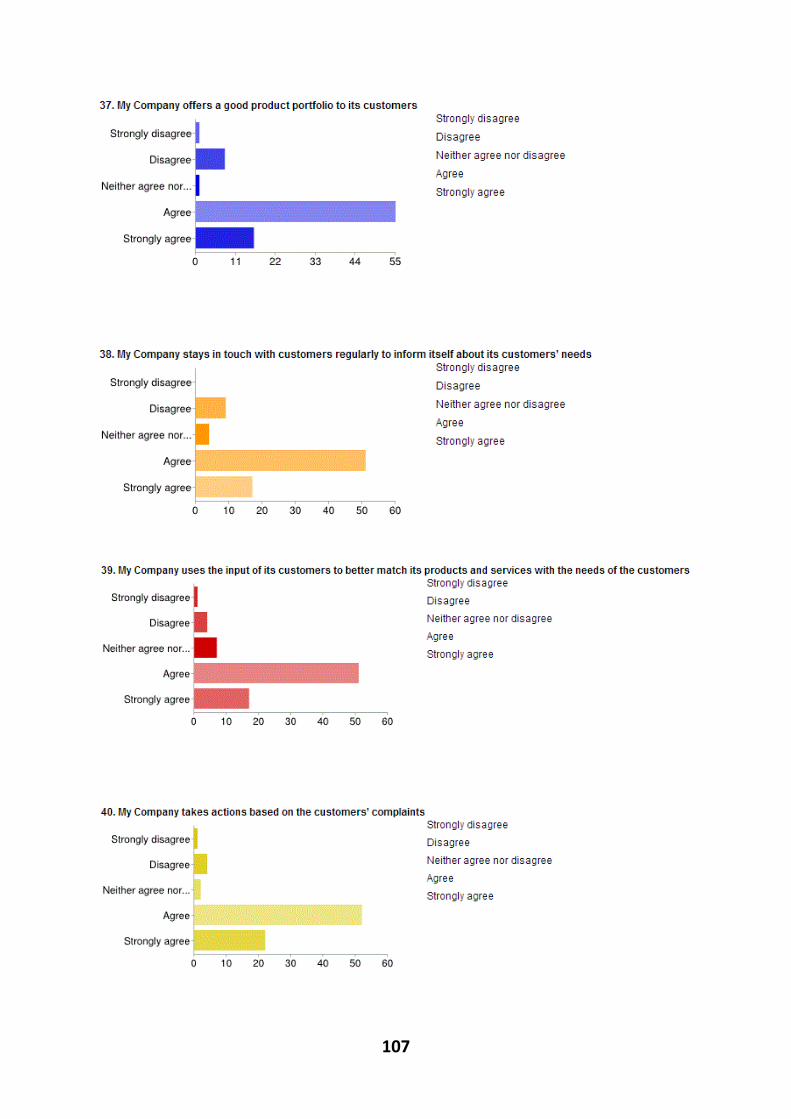
107

108
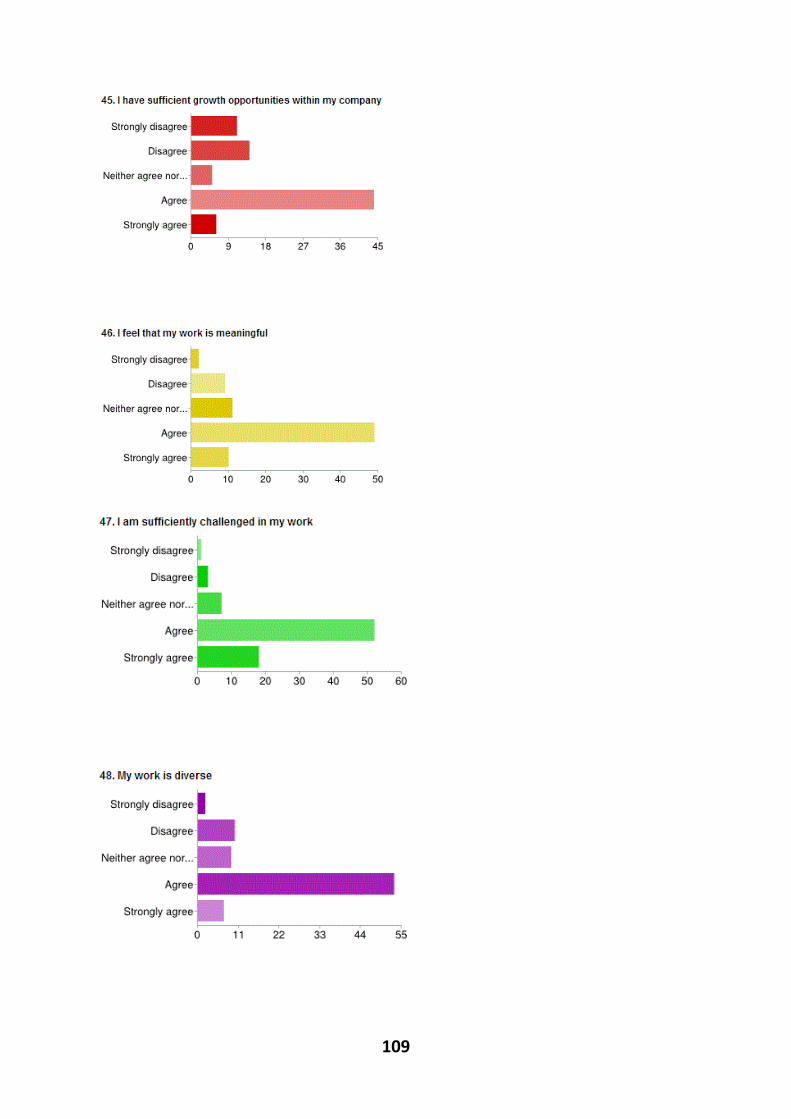
109

110
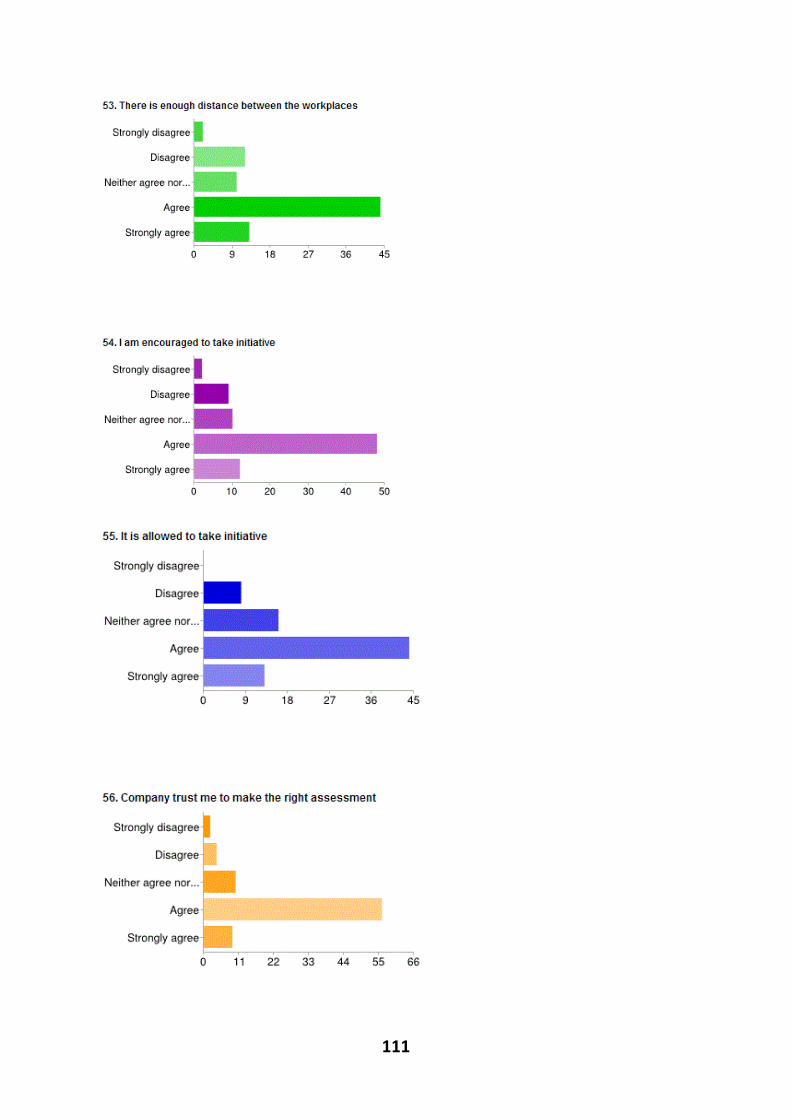
111
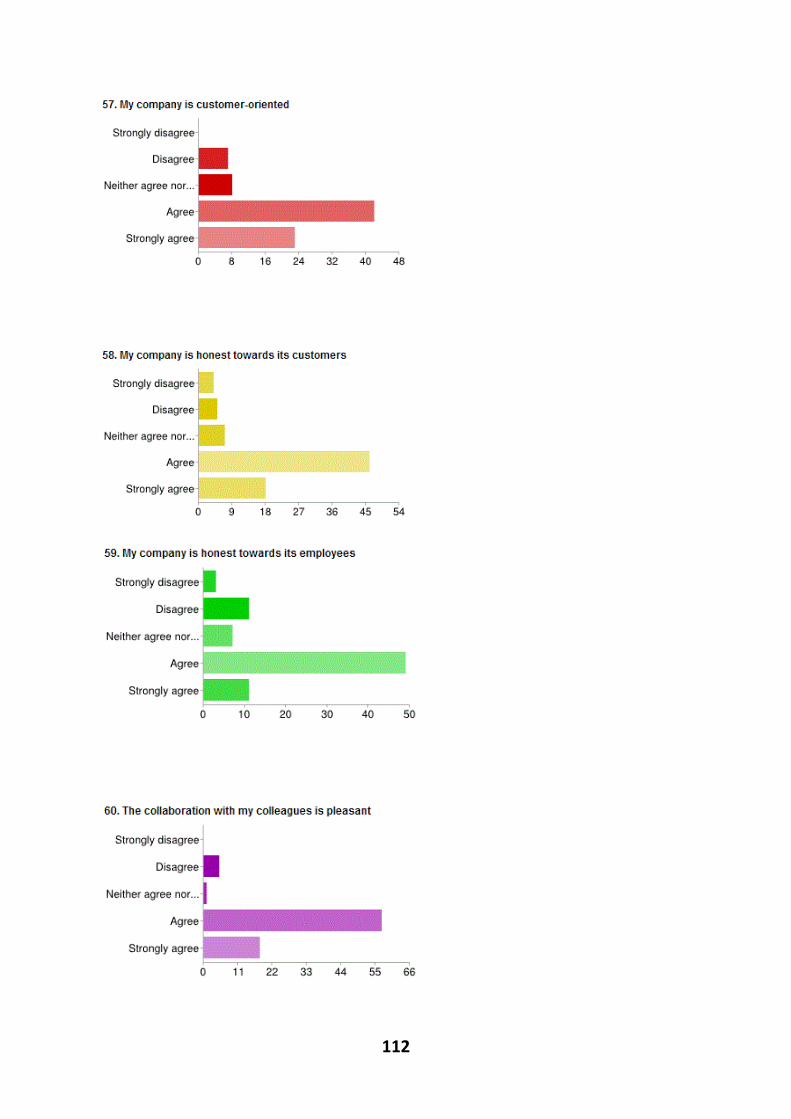
112
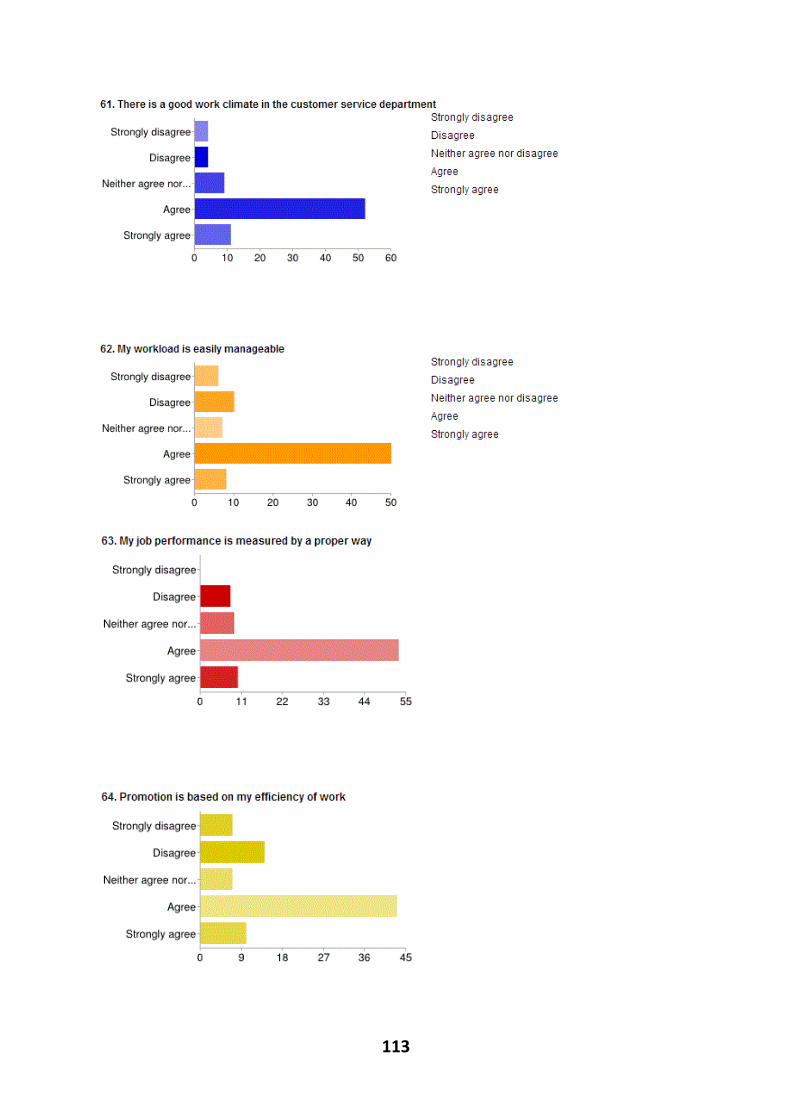
113

114
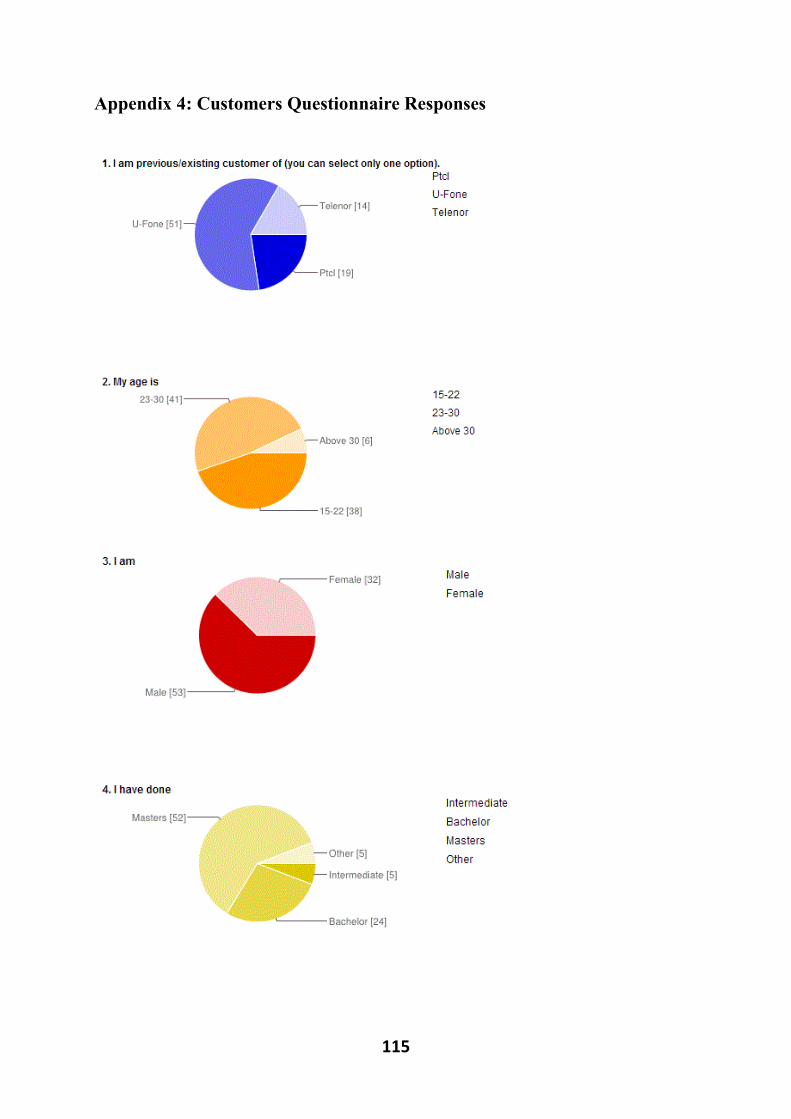
115
Appendix 4: Customers Questionnaire Responses
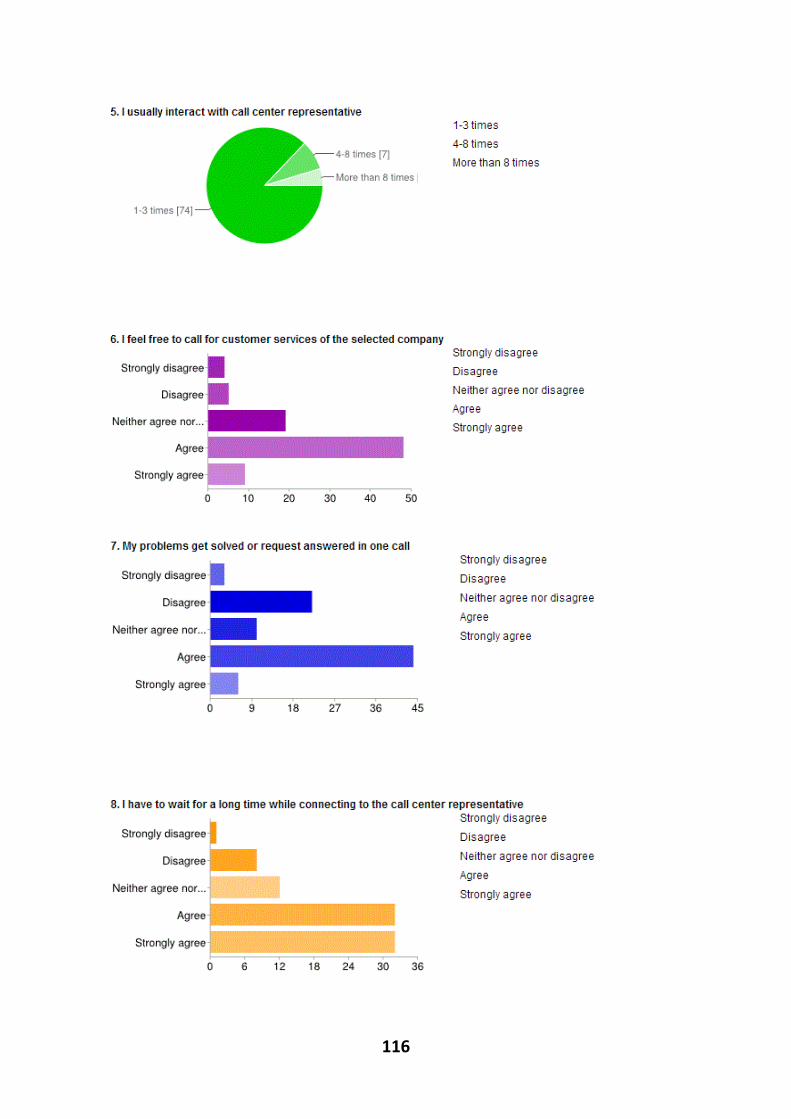
116
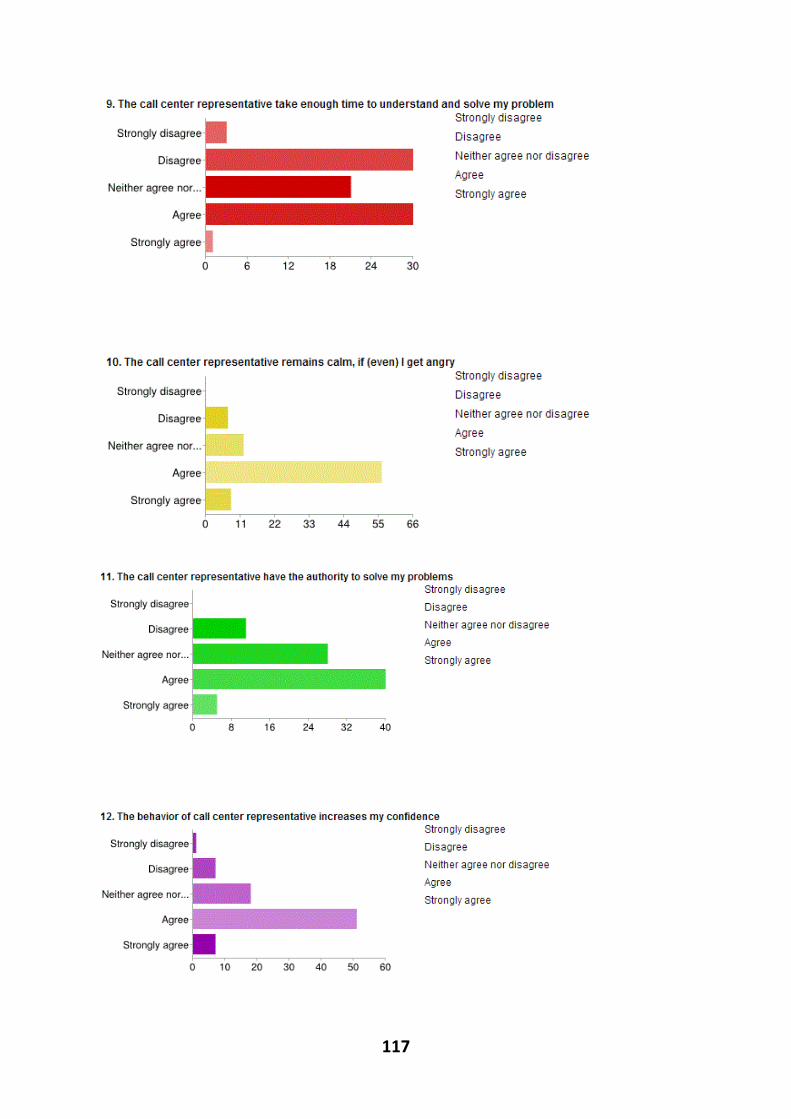
117
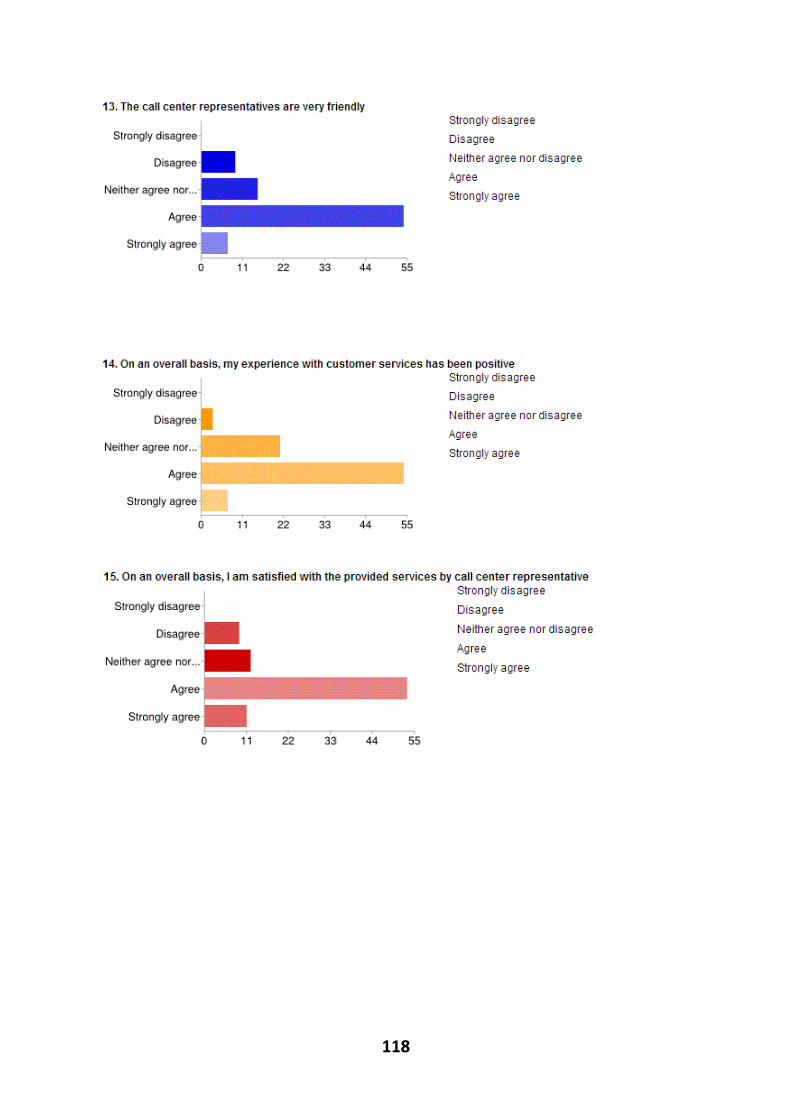
118