Embed Size (px)
Citation preview

1 Volume 36 Number 1 First Quarter 2002
ABSTRACT
INTRODUCTION
C H E R Y L W . V A N H O O K , P h . D .D E B O R A H W . T E G A N O , P h . D .
The Relationship BetweenCreativity and ConformityAmong Preschool Children
The current study investigated the relationship betweencreativity and conformity based on the work of Starkweather(1964). The subjects were 45 preschool children. Creativitywas assessed using the Multidimensional Stimulus FluencyMeasure (Moran, Sawyers, Fu, & Milgram, 1983), an originalthinking task. Two forms of conformity were assessed: socialconformity and impersonal conformity using the StarkweatherSocial Conformity Test and the Starkweather Form Boards Testrespectively (Starkweather, 1964). Starkweather’s hypothesisof a curvilinear relationship between conformity and creativitywas found for the social conformity task (X2 = 11.69, p < .01).The findings support the hypothesis that highly conformingand highly nonconforming children do not score as high oncreativity measurements as their freedom of expression (i.e.,not following a rigid pattern of conforming/nonconforming)counterparts. Chi-square analyses revealed significantly morechildren in the high creativity and freedom of expression groupas compared to the low creativity and conforming/nonconform-ing children. That is, significantly fewer children were found inthe low conformity/low creativity cell and more in the low con-formity/high creativity cell than were expected by chance. Nodifferences were found for impersonal conformity, perhaps dueto the insensitivity of the instrumentation to assess conformity.It is concluded that freedom of expression may be seen as animportant personality trait in the identification and nurturanceof creative potential and problem solving in young children.
Conformity and creativity have been theoretically linked, yetlittle current research documents this relationship, especially
2
Creativity And Conformity
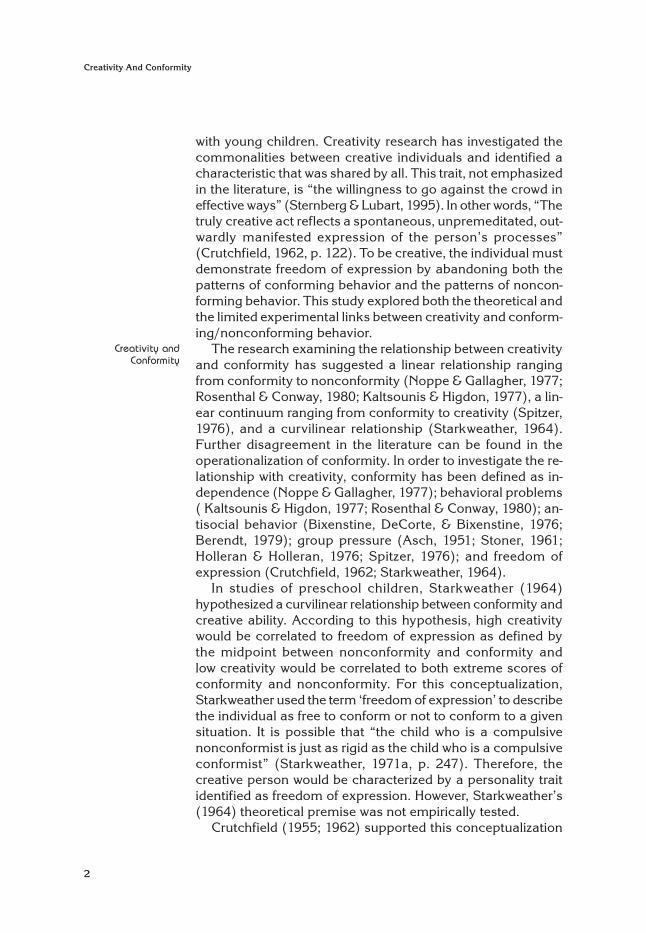
with young children. Creativity research has investigated thecommonalities between creative individuals and identified acharacteristic that was shared by all. This trait, not emphasizedin the literature, is “the willingness to go against the crowd ineffective ways” (Sternberg & Lubart, 1995). In other words, “Thetruly creative act reflects a spontaneous, unpremeditated, out-wardly manifested expression of the person’s processes”(Crutchfield, 1962, p. 122). To be creative, the individual mustdemonstrate freedom of expression by abandoning both thepatterns of conforming behavior and the patterns of noncon-forming behavior. This study explored both the theoretical andthe limited experimental links between creativity and conform-ing/nonconforming behavior.
The research examining the relationship between creativityand conformity has suggested a linear relationship rangingfrom conformity to nonconformity (Noppe & Gallagher, 1977;Rosenthal & Conway, 1980; Kaltsounis & Higdon, 1977), a lin-ear continuum ranging from conformity to creativity (Spitzer,1976), and a curvilinear relationship (Starkweather, 1964).Further disagreement in the literature can be found in theoperationalization of conformity. In order to investigate the re-lationship with creativity, conformity has been defined as in-dependence (Noppe & Gallagher, 1977); behavioral problems( Kaltsounis & Higdon, 1977; Rosenthal & Conway, 1980); an-tisocial behavior (Bixenstine, DeCorte, & Bixenstine, 1976;Berendt, 1979); group pressure (Asch, 1951; Stoner, 1961;Holleran & Holleran, 1976; Spitzer, 1976); and freedom ofexpression (Crutchfield, 1962; Starkweather, 1964).
In studies of preschool children, Starkweather (1964)hypothesized a curvilinear relationship between conformity andcreative ability. According to this hypothesis, high creativitywould be correlated to freedom of expression as defined bythe midpoint between nonconformity and conformity andlow creativity would be correlated to both extreme scores ofconformity and nonconformity. For this conceptualization,Starkweather used the term ‘freedom of expression’ to describethe individual as free to conform or not to conform to a givensituation. It is possible that “the child who is a compulsivenonconformist is just as rigid as the child who is a compulsiveconformist” (Starkweather, 1971a, p. 247). Therefore, thecreative person would be characterized by a personality traitidentified as freedom of expression. However, Starkweather’s(1964) theoretical premise was not empirically tested.
Crutchfield (1955; 1962) supported this conceptualization
Creativity andConformity
Journal of Creative Behavior
3
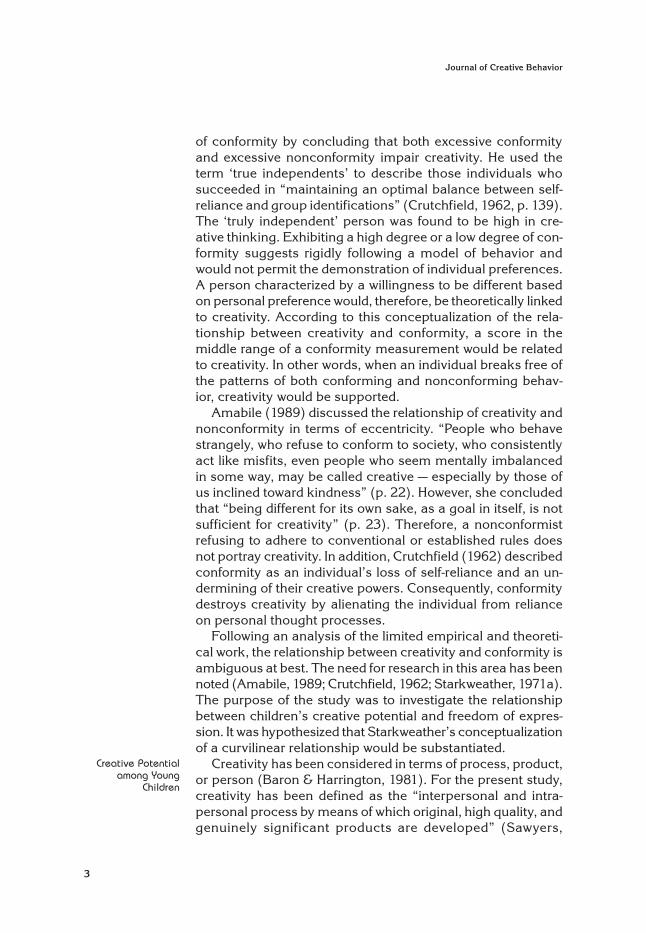
of conformity by concluding that both excessive conformityand excessive nonconformity impair creativity. He used theterm ‘true independents’ to describe those individuals whosucceeded in “maintaining an optimal balance between self-reliance and group identifications” (Crutchfield, 1962, p. 139).The ‘truly independent’ person was found to be high in cre-ative thinking. Exhibiting a high degree or a low degree of con-formity suggests rigidly following a model of behavior andwould not permit the demonstration of individual preferences.A person characterized by a willingness to be different basedon personal preference would, therefore, be theoretically linkedto creativity. According to this conceptualization of the rela-tionship between creativity and conformity, a score in themiddle range of a conformity measurement would be relatedto creativity. In other words, when an individual breaks free ofthe patterns of both conforming and nonconforming behav-ior, creativity would be supported.
Amabile (1989) discussed the relationship of creativity andnonconformity in terms of eccentricity. “People who behavestrangely, who refuse to conform to society, who consistentlyact like misfits, even people who seem mentally imbalancedin some way, may be called creative — especially by those ofus inclined toward kindness” (p. 22). However, she concludedthat “being different for its own sake, as a goal in itself, is notsufficient for creativity” (p. 23). Therefore, a nonconformistrefusing to adhere to conventional or established rules doesnot portray creativity. In addition, Crutchfield (1962) describedconformity as an individual’s loss of self-reliance and an un-dermining of their creative powers. Consequently, conformitydestroys creativity by alienating the individual from relianceon personal thought processes.
Following an analysis of the limited empirical and theoreti-cal work, the relationship between creativity and conformity isambiguous at best. The need for research in this area has beennoted (Amabile, 1989; Crutchfield, 1962; Starkweather, 1971a).The purpose of the study was to investigate the relationshipbetween children’s creative potential and freedom of expres-sion. It was hypothesized that Starkweather’s conceptualizationof a curvilinear relationship would be substantiated.
Creativity has been considered in terms of process, product,or person (Baron & Harrington, 1981). For the present study,creativity has been defined as the “interpersonal and intra-personal process by means of which original, high quality, andgenuinely significant products are developed” (Sawyers,
Creative Potentialamong Young
Children
Moran, & Tegano, 1990, p. 70). This developmental definition,grounded within an ecological framework (Bronfenbrenner,1979), focuses on the criterion of generating original ideas forchildren; quality of products for adolescents; and significanceof products for adults. For young children, the emphasis is onthe creative process rather than the generation of creativesolutions, thus, this process is termed creative potential. Re-searchers have found this definition effective in the evaluationof children’s creativity or creative potential through an assess-ment of their thinking processes. Ideational fluency (i.e., thegeneration of ideas), specifically original solutions, is a crite-rion measure of the potential for creative thinking in children.
Although numerous researchers have conceptualized andoperationalized conformity, there remains a lack of concep-tual clarity. The number and diversity of terms used to describeconformity impedes a clear, unambiguous analysis of the theo-retical concept. For example, the change in an individual’sbehaviors or cognitions resulting from the influence of othershas been variously termed conformity, compliance, uniformity,conventionality, identification, acceptance, internalization, andobedience. Refusing to align one’s behaviors and cognitionswith the standards of the social group has been called devi-ancy, dissent, innovation, anticonformity, nonconformity, andindependence. Unfortunately, these terms have often been usedinterchangeably, even though subtle differences in meaningcreate definitional confusion (Forsyth, 1983).
For the purposes of this study, the term conformity will beconsidered within the framework of freedom of expression.Starkweather (1964) suggested that freedom of expression wasa motivational personality characteristic associated with thecreative individual. Individuals who are free to express them-selves are more likely to demonstrate creative ability by gener-ating original responses to creativity tasks. Being a conformistor a nonconformist requires the individual to comply with aspecified model of behavior; thus, spontaneity and individualexpression become suppressed. A pattern of behavior that ischaracterized by originality, neither following a behavioral pat-tern of conformity nor nonconformity, is termed freedom ofexpression. To demonstrate freedom of expression, the childmust be able to break free of the powerful constraints ofhabitual thought and stereotyped perception as in both con-formity and nonconformity. A freedom of expression child isautonomous to make choices and determine alternativesaccording to individual preferences and thought-processes. The
Freedom ofExpression among
Young Children
4
Creativity And Conformity
Journal of Creative Behavior
5
trait freedom of expression, then, refers neither to the behav-ior of a habitual conformist nor a habitual nonconformist.
Starkweather’s (1970; 1971b) early research provides aframework for assessing conformity/nonconformity amongpreschool children. In Starkweather’s conceptualization thereare two contexts for the examination of conforming/noncon-forming behavior: a social context and an impersonal context.In this social context, the conforming child may structure hisor her behavior to be congruent with the desires and expecta-tions of others whereas the nonconforming children may fol-low a pattern of behavior that is the incongruent with socialexpectations. However, the freedom of expression child hasthe ability to shift paradigms depending on their independentthoughts and preferences.
According to Starkweather (1970), an impersonal contextmay also be used to define conformity/nonconformity. Thistype of conformity examined the child’s cognitive ability tomake a preferred choice, in the absence of pervasive socialinfluences. The child who agreed with the perceptions of oth-ers despite the opportunity for making a personal choice wasconsidered a conformist and the child who consistently dis-agreed with these perceptions was considered a nonconform-ist. The freedom of expression child was not constrained bythe perceptions of others and was able to make a preferredchoice.
A sample of 45 children (25 females and 20 males) with a meanage of 57 months (SD = 5.40) was randomly selected fromthree preschools in a southeastern city by obtaining parentalpermission to participate. Participants were predominantlywhite, middle-class children. The IQ of the sample ranged from97 to 133, with a mean of 117 and a standard deviation of 8.95.
Four instruments were used in this study. Two were designedto measure conforming behavior in young children. These testswere the Starkweather Form Boards Test, assessing impersonalconformity and the Starkweather Social Conformity Test(Starkweather, 1971b). The Multidimensional Stimulus FluencyMeasure (Moran, Milgram, Sawyers, & Fu, 1983) was used tomeasure creativity. The Information and Picture Completionsubscales of the Wechsler Preschool and Primary Scale ofIntelligence (Wechsler, 1967) were used to approximate intelli-gence scores.
Starkweather Form Boards Test. The Starkweather FormBoards Test was reconstructed from illustrations of the boards
METHOD
Participants
Instruments
depicted in Starkweather’s unpublished work. This instrumentconsisted of four form boards picturing scenes that werefamiliar to young children. These included a tree, a house, aplayground, and a barnyard. Each form board had five spaceswhere removable pieces would fit, similar to a puzzle. For eachof the five spaces on the form boards there were four pieces,each illustrating a different picture, that fit into the space andcould be used to complete the picture. The boards and pieceswere painted with various colors and the pictures behind eachform board were provided by black-and-white line drawings.These line drawings were on a thin board that could slide inbetween the front and back of the puzzle. This permitted theblack-and-white line drawings to be systematically changedfrom the initial testing session to the second session.
To illustrate how the form boards were used to assess con-forming behavior, the administration of one form board will bedescribed. In the tree form board, a piece of the trunk is miss-ing. The experimenter says, “Here is a tree. Look at the holesin the picture. I am going to let you fix the tree any way youwant it. See this hole? Both of these pieces will fit in here. Youput in the one you want.” A space reveals a black-and-whiteline drawing of a squirrel climbing a tree. To complete this partof the picture, the child was given the opportunity to choosebetween two pieces, a squirrel and a butterfly. If the childchooses the squirrel, the child is following the model; howeverwhether or not this is a conforming behavior cannot be an-swered until the child completes a second session with the formboards one week later. At the second session, the black-and-white line drawing would reveal the butterfly. The fundamentalassumption is that the child who really prefers the squirrel willselect the squirrel at both sessions, demonstrating a freedomto use both conforming and nonconforming behavior. Theconformist will choose the squirrel only when the line drawingof the squirrel is shown and the nonconformist will choose thesquirrel only when the butterfly is shown.
Throughout both testing sessions, each child was given80 choices between paired picture pieces. If the freedom ofexpression child selected the preferred picture, selectionsshould correspond to the line drawing fifty percent of the time.The scoring of the form boards test includes a numerical count-ing of the conforming and nonconforming responses made bythe child. A difference-score was calculated by subtracting thenumber of nonconforming responses from the number of con-forming responses for the 80 choices that were accumulated
6
Creativity And Conformity
Journal of Creative Behavior
7
during the testing sessions. The possible range of difference-scores is from –80 (complete nonconformity) to +80 (com-plete conformity). If the child demonstrated a preference for apicture by choosing that picture during each session, regard-less of the line drawing, the child would have a balanced differ-ence-score, approximating 0. For example, if the child selectedthe butterfly both times because of a preference for butterflies,this was scored as a nonconforming response (–1) and a con-forming response (+1); therefore, the difference-score wouldbe 0. Starkweather (1971b) established the validity of this pro-cedure through a Chi-square analysis of the frequency of highand low difference-scores for an experimental and controlgroup. Analyses revealed that children in the experimentalgroup were influenced by the opportunity to conform (X2 =32.203; p < .001). Starkweather did not include a measure ofexternal construct validity.
Starkweather Social Conformity Test. The StarkweatherSocial Conformity Test was designed to measure conformingand nonconforming behavior by providing young children withopportunities to make choices in a situation in which they canfollow a socially acceptable model or respond freely accord-ing to their individual preferences (Starkweather, 1970). Thesocial conformity test presents each child an opportunity toconform to other persons while constructing a small picturebook made of various colors of paper. This test is based on thepremise that nonconforming children will choose their favoritecolor without concern for social pressure (i.e., colors selectedby parents).
To substantiate Starkweather’s use of color preferences inpreschool children to be part of the evaluation criteria in theSocial Conformity Test, a preliminary study was conducted todetermine if preschool children do, indeed, have color prefer-ence that endure over a brief period of time. Subjects were 17preschool children, predominately middle-class children (11females and 6 males) ranging in age from 33 to 58 months.Each child was asked to rank order their preference of variouscolors by using a color wheel. In the second session, two weekslater, 94% of the children selected two out of three or three outof three of their favorite colors that were determined duringthe first session. For the least favorite colors, 82% of the chil-dren selected two out of three or three out of three of the samecolors that were chosen during the first session. The resultsconcurred with Starkweather’s presumption that preschoolchildren consistently have most preferred and least preferred
colors. This finding was important because the StarkweatherSocial Conformity Test relies on the child’s favorite and leastfavorite colors.
To illustrate how this test assessed conforming behavior, theselection of one page for the 20-page picture book will bedescribed. The experimenter selected pages for constructionof a picture book based on each child’s color preferences fromthe first session. Favorite and least favorite colors, specificallycolors rank-ordered at 1, 3, 6, 9, and 12, were systematicallypaired for presentation to the child two at a time. Presentedwith two different colored pieces of paper, for example red andbrown, with the same picture on each, the child was informed,“Both pages have a picture of an elephant. This brown page isfrom a book for your parents. You may select a red page or abrown page for your book. Choose the page you want.” Thechild was presented with the opportunity to select one of twopages (i.e., a page identical to that of the parents’ or a differ-ent colored page with the same picture) to construct an indi-vidual picture book for him/herself. For this test, conformitywas assessed by the child’s willingness to select a colored sheetmatching the one in the parent’s book, even when this choicewas inconsistent with the child’s color preference.
The scoring of the social conformity test consisted of anumerical count of conforming and nonconforming responsesmade by the child. A difference-score was determined by sub-tracting the number of nonconforming responses from thenumber of conforming responses. Difference-scores rangefrom –20 (complete nonconformity) to +20 (complete confor-mity). Starkweather’s (1970) analysis of the frequency of largeand small difference-scores indicated that children were influ-enced by the opportunity to conform to their parents.Starkweather (1970) did not provide a measure of constructvalidity for this instrument.
Multidimensional Stimulus Fluency Measure. Ideationalfluency tasks used by Ward (1968, 1969) and Williams andFlemming (1969) parallel those that Wallach and Kogan (1965)used with older subjects. The MSFM consisted of three subtestswith two items per subtest. In the first subtest, Instances, chil-dren named instances of a category, “Tell me all the thingsyou can think of that are round/red.” In the second task, Pat-terns, children provided possible interpretations for two objects,“Tell me all the things you think this [two odd shaped three-dimensional blocks] could be.” In the third subtest, Uses, chil-dren named uses for common objects, “Tell me all the things
8
Creativity And Conformity
Journal of Creative Behavior
9
you can do with a box/paper.” Each subtest was administeredaccording to established protocols and elicits a response hier-archy (i.e., a measure of ideational fluency) from which origi-nal responses were scored (Godwin & Moran, 1990). The MSFMwas presented to the children in an untimed nonevaluativeatmosphere.
To score the MSFM, the total number of responses were tal-lied to comprise the total fluency score. Each response wasthen scored as popular or original. Originality was defined asthose responses given by fewer that five percent of the normedpopulation. The choice of five percent is somewhat arbitrary,though guided by established scoring protocols for originalityon other measures of ideational fluency (Wallach & Kogan,1965). The originality score on the MSFM is used as the cre-ativity score. The originality score has been established as dis-tinct from intelligence (Moran et al., 1983). Stability of theMSFM over a two year period has also been established (Moore& Sawyers, 1987). The MSFM is a reliable and valid instrumentfor measuring originality in preschool children (Godwin &Moran, 1989; Moran et al., 1983). Raters independently scoredthe MSFM responses for each child. In this study, inter-raterreliability was 97.3%.
The Wechsler Preschool and Primary Scale of Intelli-gence. The Wechsler Preschool and Primary Scale of Intelli-gence (Wechsler, 1967) was used to extrapolate approximateIQ scores using the Information and Picture Completionsubtests, according to procedures established by Tellegen andBriggs (1967). A high validity coefficient of r = .85 was reportedby Sattler (1974) for these subtests with the full scale intelli-gence test. The use of subtests was based on consideration ofthe attention span and cooperation of young children to par-ticipate in the testing sessions.
All of the children with parental consent for participationwere asked to participate in two 30-minute interview sessionsspaced one week apart. The interviewer asked the child to comeout of the classroom to play a game in a private, quiet spacelocated at the preschool.
Session one. To begin the session, each child was asked toselect his/her favorite color(s) from a color wheel (consistingof twelve colored wedges attached to a cardboard wheel withvelcro) until all colors were rank ordered. The identification ofindividual color preferences is important for the administra-tion of the Starkweather Social Conformity Test. Then, eachchild was asked to complete four form boards from the
Procedure
Starkweather Form Boards Test. Each form board wasadministered twice using different pictures. At the end of thesession, the MSFM and the WPPSI were administered.
Session two. For the Starkweather Social Conformity Test,children were asked to construct a picture book using thechild’s color preferences selected from the first session. Dur-ing session two, children were also asked to complete theStarkweather Form Boards Test using a different set of linedrawings from the previous session.
For both impersonal and social conformity, a difference-scorewas computed by subtracting the number of nonconformingresponses from the number of conforming responses. Thepossible range of difference-scores was +80 (complete conformity)to –80 (complete nonconformity) for impersonal conformity.For social conformity, the possible range of difference-scores was +20 (complete conformity) to –20 (complete non-conformity).
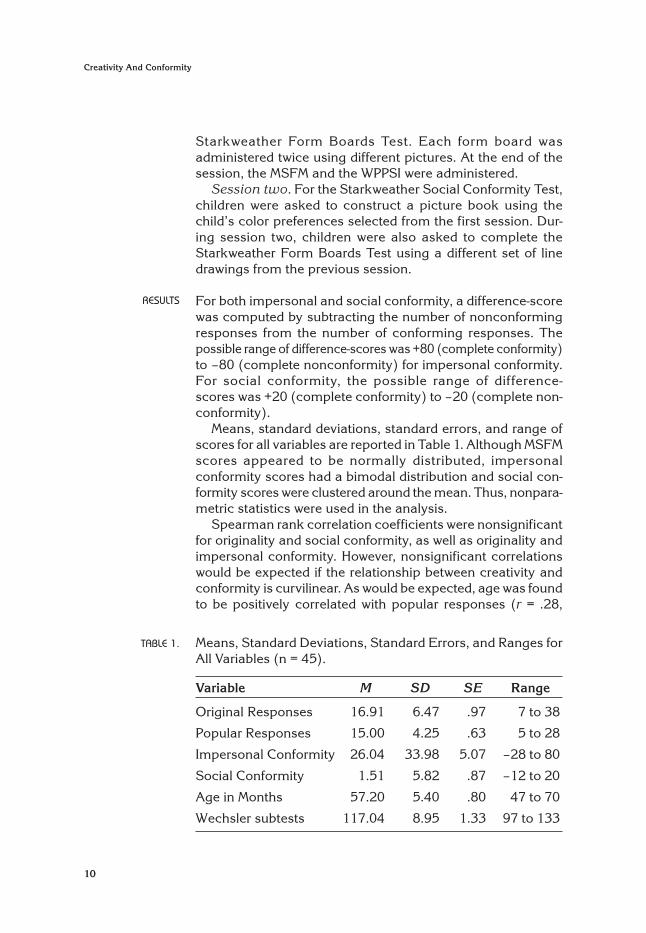
Means, standard deviations, standard errors, and range ofscores for all variables are reported in Table 1. Although MSFMscores appeared to be normally distributed, impersonalconformity scores had a bimodal distribution and social con-formity scores were clustered around the mean. Thus, nonpara-metric statistics were used in the analysis.
Spearman rank correlation coefficients were nonsignificantfor originality and social conformity, as well as originality andimpersonal conformity. However, nonsignificant correlationswould be expected if the relationship between creativity andconformity is curvilinear. As would be expected, age was foundto be positively correlated with popular responses (r = .28,
RESULTS
Means, Standard Deviations, Standard Errors, and Ranges forAll Variables (n = 45).
Variable M SD SE Range
Original Responses 16.91 6.47 .97 7 to 38
Popular Responses 15.00 4.25 .63 5 to 28
Impersonal Conformity 26.04 33.98 5.07 –28 to 80
Social Conformity 1.51 5.82 .87 –12 to 20
Age in Months 57.20 5.40 .80 47 to 70
Wechsler subtests 117.04 8.95 1.33 97 to 133
TABLE 1.
10
Creativity And Conformity
Journal of Creative Behavior
11
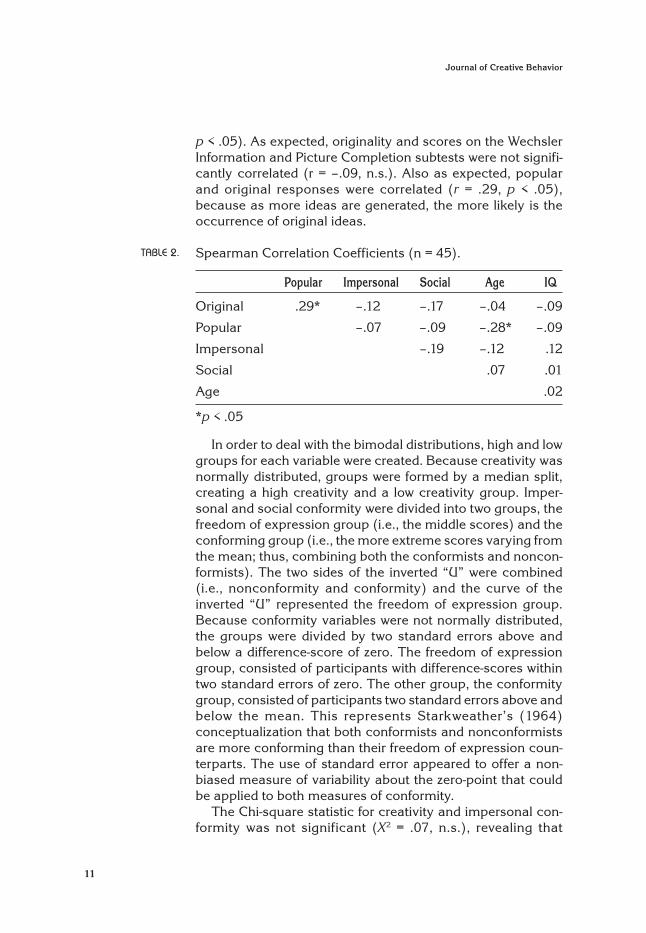
p < .05). As expected, originality and scores on the WechslerInformation and Picture Completion subtests were not signifi-cantly correlated (r = –.09, n.s.). Also as expected, popularand original responses were correlated (r = .29, p < .05),because as more ideas are generated, the more likely is theoccurrence of original ideas.
Spearman Correlation Coefficients (n = 45).
Popular Impersonal Social Age IQ
Original .29* –.12 –.17 –.04 –.09
Popular –.07 –.09 –.28* –.09
Impersonal –.19 –.12 .12
Social .07 .01
Age .02
*p < .05
In order to deal with the bimodal distributions, high and lowgroups for each variable were created. Because creativity wasnormally distributed, groups were formed by a median split,creating a high creativity and a low creativity group. Imper-sonal and social conformity were divided into two groups, thefreedom of expression group (i.e., the middle scores) and theconforming group (i.e., the more extreme scores varying fromthe mean; thus, combining both the conformists and noncon-formists). The two sides of the inverted “U” were combined(i.e., nonconformity and conformity) and the curve of theinverted “U” represented the freedom of expression group.Because conformity variables were not normally distributed,the groups were divided by two standard errors above andbelow a difference-score of zero. The freedom of expressiongroup, consisted of participants with difference-scores withintwo standard errors of zero. The other group, the conformitygroup, consisted of participants two standard errors above andbelow the mean. This represents Starkweather’s (1964)conceptualization that both conformists and nonconformistsare more conforming than their freedom of expression coun-terparts. The use of standard error appeared to offer a non-biased measure of variability about the zero-point that couldbe applied to both measures of conformity.
The Chi-square statistic for creativity and impersonal con-formity was not significant (X2 = .07, n.s.), revealing that
TABLE 2.
impersonal conformity did not differ among low and highcreativity groups.
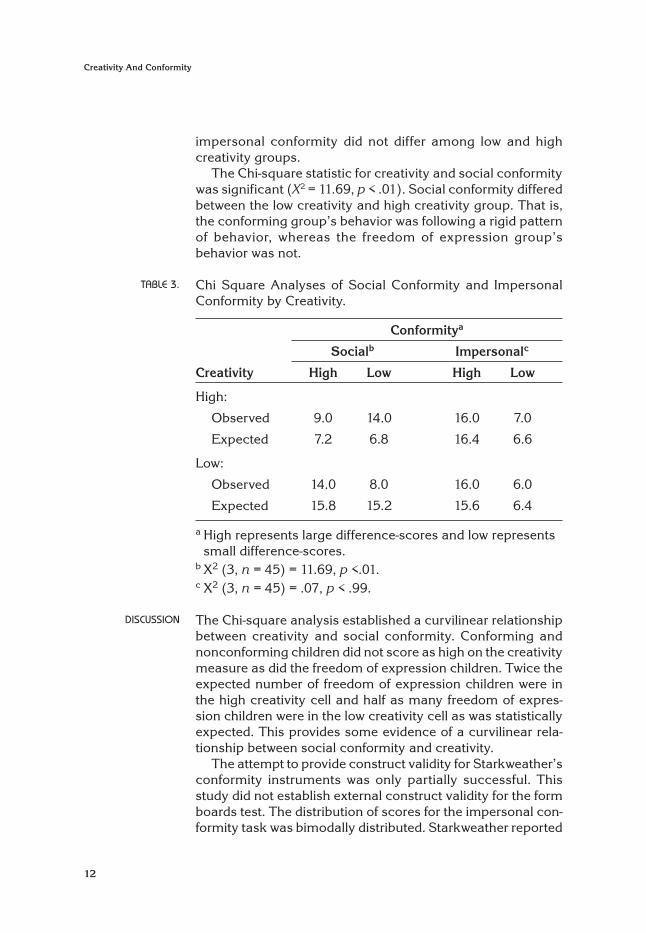
The Chi-square statistic for creativity and social conformitywas significant (X2 = 11.69, p < .01). Social conformity differedbetween the low creativity and high creativity group. That is,the conforming group’s behavior was following a rigid patternof behavior, whereas the freedom of expression group’sbehavior was not.
Chi Square Analyses of Social Conformity and ImpersonalConformity by Creativity.
Conformitya
Socialb Impersonalc
Creativity High Low High Low
High:
Observed 9.0 14.0 16.0 7.0
Expected 7.2 6.8 16.4 6.6
Low:
Observed 14.0 8.0 16.0 6.0
Expected 15.8 15.2 15.6 6.4
a High represents large difference-scores and low representssmall difference-scores.
b X2 (3, n = 45) = 11.69, p <.01.c X2 (3, n = 45) = .07, p < .99.
The Chi-square analysis established a curvilinear relationshipbetween creativity and social conformity. Conforming andnonconforming children did not score as high on the creativitymeasure as did the freedom of expression children. Twice theexpected number of freedom of expression children were inthe high creativity cell and half as many freedom of expres-sion children were in the low creativity cell as was statisticallyexpected. This provides some evidence of a curvilinear rela-tionship between social conformity and creativity.
The attempt to provide construct validity for Starkweather’sconformity instruments was only partially successful. Thisstudy did not establish external construct validity for the formboards test. The distribution of scores for the impersonal con-formity task was bimodally distributed. Starkweather reported
TABLE 3.
DISCUSSION
12
Creativity And Conformity
Journal of Creative Behavior
13
that the frequency of high and low difference-scores establishedvalidity because the instrument successfully influenced chil-dren to conform. However, there was no support for the curvi-linear relationship between creativity and conformity. This maybe due to the nature of the impersonal conformity task. Thatis, “until the child has the opportunity to learn both the normsof his group and that conformity brings rewards, there is nological reason to expect him to conform” (Costanzo & Shaw,1966, p. 968). The Starkweather Form Boards Test was de-signed to measure impersonal conformity and did not involvesocial inf luences. This may raise questions aboutStarkweather’s (1964) conceptualization of conformity as animpersonal personality characteristic. The work ofStarkweather was the only reference to an impersonal,cognitively oriented definition of conformity.
In addition, the form boards task was not ambiguous.Impersonal conformity does not involve the degree of ambigu-ity that is naturally found in social situations. Social pressurecannot operate when the perception of the task is unambigu-ous and stable (Berenda, 1950). Starkweather’s (1970) blackand white line drawings provide what the child may interpretas a correct or incorrect response. In fact, during the testingsessions, six of the children commented about “right” and“wrong” responses indicating that there was little room forambiguous thought. For young children, a non-evaluativeatmosphere appears to be a critical factor in the avoidanceof what Treffinger (1984) labels the “right answer fixation.”For these reasons, the Starkweather Form Board Test maynot be an appropriate instrument for assessing freedom ofexpression
Scores on the Starkweather Social Conformity Test wereclustered about the mean with a range of 32 (-12 to 20). Forsocial conformity, Starkweather’s validity is insufficient. Toexamine external construct validity, the most simple proce-dure would be to establish a correlation between the creativityscores and the conformity scores. However, the nature of thedistributions, coupled with the anticipated curvilinear relation-ship of conformity precluded the use of this statistical proce-dure. The Starkweather Social Conformity Test involves thesocial influence of parents to provide a source of conformity.This test is based on the assumption that conforming childrenwould be influenced by the parent’s booklet and would wantto construct a booklet identical to their parent’ even whenoffered an opportunity to select differing colors.
“During the preschool years individual differences can beseen in the need to conform, willingness to try the difficult,freedom to explore and inquire, and other characteristics whichprobably relate to expressions of creative ability” (Stark-weather, 1964, p. 6). Many of the personality traits associatedwith creative children are viewed as negative. Some highly cre-ative children may be perceived as anti-authoritarian, demand-ing, uncooperative, disorganized, sloppy, or absent-minded(Davis, 1986). For example, Torrance (1962) alluded to therelationship between creativity and conformity when he statedthat it is the responsibility of the school to help the creativechild become “less obnoxious” without diminishing creativity.In order to better understand and nurture children’s emergingcreativity, we must focus “not only on behaviors that are clearlyrecognizable as outstandingly creative but also on youthfulbehaviors that are less obviously identifiable as creative”(Fishkin, 1999, p. 4). Amabile (1989) found that very creativepeople experienced difficulty in school because they were‘being a little too creative’ for the school system. Consequen-tially, “Children who most strongly display these creativebehaviors are often punished and discouraged by parents andteachers who find creative behavior inconvenient and difficultto manage” (Torrance, 1981, p. 2). Perhaps, these “negative”behaviors associated with creativity should be examined andpossibly reinterpreted. Additional research needs to be con-ducted in order to better discern the personality traits relatedwith creativity.
The findings of this study offer support to the conceptualiza-tion of ‘freedom of expression’ as a new term to be used inassociation with conformity. The recognition that both thebehaviors of the nonconformist and the conformist may un-dermine creative potential is an important step in identifyingthe essential characteristics of thinking that enable one to func-tion as a creative person. The child who is free to accept orreject choices based on personal preferences may be moreapt to be creative and able to creatively solve problems. Thisfreedom is evident in the behavior of the creative person whomay conform or not at will. This person may appear uncon-ventional, but in spite of this unconventionality, he/she is suffi-ciently attuned to the ideas of others. The unconventionalbehavior of the creative person occurs in the course of hisbeing creative and not as a goal in itself. This new concep-tualization of the relationship between creativity and freedomof expression provides a better understanding of the processesthat may inhibit and encourage creativity in young children.
14
Creativity And Conformity
Journal of Creative Behavior
15
AMABILE, T. A. (1989). Growing up creative: Nurturing a lifetime ofcreativity. New York: Crown Publishers.
ASCH, S. E. (1951). Effects of group pressure and distortion of judgment. InH. Guetzkow (Ed.), Groups, leadership, and men (pp. 177-190).
BERENDA, R. W. (1950). The influence of the group on judgments ofchildren. New York: Kings Crown Press.
BERENDT, R. W. (1979). Developmental changes in conformity to peersand parents. Developmental Psychology, 15(6), 608-616.
BIXENSTINE, V. E., DECORTE, M. S., BIXENSTINE, B. A. (1976). Conformityto peer-sponsored misconduct at four age levels. DevelopmentalPsychology, 12, 226-236.
BRONFENBRENNER, U. (1979). The ecology of human development.Cambridge, MA: Harvard.
COSTANZO, P. R., & SHAW, M. E. (1966). Conformity as a function of agelevel. Child Development, 37, 967-975.
CRUTCHFIELD, R. S. (1955). Conformity and character. AmericanPsychologist, 10, 191-198.
CRUTCHFIELD, R. S. (1962). Conformity and creative thinking. In H. E.Gruber, G. Terrell, & M. Wertheimer (Eds.), Contemporary approachesto creative thinking: A symposium held at the University of Colorado.New York: Athgerton.
DAVIS, G. A. (1986). Creativity is forever (2nd ed.). Dubuque: Kendall/Hunt.
FISHKIN, A. S. (1999). Issues in studying creativity in youth. In Fishkin, A.S., Cramond, B., Olszewski-Kubilius, P. (Eds.), Investigating creativityin youth: Research and methods. Cresskill, NJ: Hampton.
FORSYTH, D. R. (1983). An introduction to group dynamics. Pacific Grove:Brooks/Cole.
GODWIN, L. J., & MORAN, J. D. III. (1990). Psychometric characteristics ofan instrument for measuring creativity in preschool children. Psychologyin the Schools, 27, 204-210.
HOLLERAN, B. P., HOLLERAN, P. R. (1976). Creativity revisited: A new rolefor group dynamics. Journal of Creative Behavior, 10(2), 131-137.
KALTSOUNIS, B., & HIGDON, G. (1977). School conformity and itsrelationship to creativity. Psychological Reports, 40, 715-718.
MOORE, L. C., & SAWYERS, J. K. (1987). The stability of original thinkingin young children. Gifted Child Quarterly, 31, 126-129.
MORAN, J. D. III, MILGRAM, R. M., SAWYERS, J. K., & FU, V. R. (1983).Original thinking in preschool children. Child Development, 54, 921-926.
NOPPE, L. D., & GALLAGHER, J. M. (1977). A cognitive style approach tocreative thought. Journal of Personality Assessment, 41, 85-90.
ROSENTHAL, D. A., & CONWAY, M. (1980). Adolescents’ creativity andnonconformity in school. Psychological Reports, 47(2), 668.
SATTLER, J. M. (1974). Assessment of children’s intelligence. Philadelphia:WB Saunders.
REFERENCES
SAWYERS, J. K., MORAN, J. D. III, & TEGANO, D. W. (1990). A theoreticalmodel of creative potential in young children. In C. W. Taylor (Ed.),Expanding awareness of creative potentials worldwide (pp. 69-73).Salt Lake City: Brain Talent-Powers Press.
SPITZER, D. R. (1976). The group in education: Toward conformity orcreativity? Educational Technology, 70(8), 37-40.
STARKWEATHER, E. K. (1964). Conformity and nonconformity asindicators of creativity in preschool children. Unpublished manuscript.Oklahoma State University, Agriculture and Applied Science, Stillwater.
STARKWEATHER, E. K. (1970). Starkweather social conformity test forpreschool children. (Report No. TM 004 963). Stillwater, OK: OklahomaState University, Research Foundation. (ERIC Document ReproductionService No. ED 115 689).
STARKWEATHER, E. K. (1971a). Creativity research instruments designedfor use with preschool children. Journal of Creative Behavior, 5(4),245-255.
STARKWEATHER, E. K. (1971b). Starkweather form boards test forpreschool children. Unpublished manuscript, Oklahoma StateUniversity, Stillwater.
STERNBERG, R. J. & LUBART, T. I. (1995). Defying the crowd: Cultivatingcreativity in a culture of conformity. New York: The Free Press.
STONER, J. A. (1961). A comparison of individual and group decisionsinvolving risk, Unpublished Master’s thesis, M.I.T.
TELLEGEN, A., & BRIGGS, P. F. (1967). Old wine in new skins: GroupingWechsler subtests into new scales. Journal of Consulting Psychology,31, 499-506.
TORRANCE, E. P. (1962). Guiding creative talent. Englewood Cliffs:Prentice-Hall.
TORRANCE, E. P. (1981). Thinking creatively in actions and movement:Administration, scoring, and norms manual. Bensenville, IL:Scholastic Testing Service.
TREFFINGER, D. J. (1984, April). Creative problem solving for teachers.Paper presented at Project Interact Spring Conference, Radford, VA.
WALLACH, M. A., & KOGAN, N. (1965). Modes of thinking in youngchildren: A study of the creativity-intelligence distinction. New York:Rinehart.
WARD, W. C. (1968). Creativity in young children. Child Development, 39,737-754.
WARD, W. C. (1969). Rate and uniqueness in children’s creative responding.Child Development, 40, 869-878.
WECHSLER, D. (1967). Manual for the Wechsler Preschool and PrimaryScale of Intelligence. New York: Psychological Corporation.
WILLIAMS, T. H., & FLEMING, J. W. (1969). Methodological study of therelationship between associative fluency and intelligence. Developmen-tal Psychology, 1, 155-162.
Cheryl W. Van Hook, Ph.D., Ohio University.Deborah W. Tegano, Ph.D., University of Tennessee, Knoxville
16
Creativity And Conformity