Embed Size (px)
Citation preview
1
The Relationship between Complementary & Alternative Healthcare versus Traditional Healthcare
By Brian Tinga Applied and Health Economics East Carolina University Special thanks to Marjorie L. Baldwin whose guidance and assistance on this paper can not be overstated.

2
Abstract
The purpose of this study is to ascertain the relationship between complementary
and alternative healthcare versus Traditional Healthcare. This study finds that all forms
of alternative care looked at are complements to traditional forms of healthcare. We find
that higher education and being married increase the likelihood of utilizing CAM.
Furthermore it is shown that white people and females tend to utilize more CAM
therapies than their counterparts. Additionally it is shown that living in the west
significantly increases ones’ chances of utilizing CAM. The importance of such a study
is justified by the increasing prevalence and usage of complementary and alternative
healthcare.

3
Introduction
The last decade has witnessed a substantial increase in the demand for
complementary and alternative medicine (CAM). CAM treatments include, for example,
acupuncture, chiropractic care, massage therapy and herbal remedies.[13] In 1997
Americans spent an estimated $27 to $33 billion on CAM. [1] A recent study by
Stanford University discovered “that nearly 7 in 10 Americans turn to alternative
treatments when traditional medicine fails”.[1, p.2] In a recent decision the Washington
Supreme court required insurers to cover certain types of CAM treatments. [1] The
growing popularity and acceptance of CAM makes this subject worthy of further review
and analysis. The purpose of this paper is to analyze whether CAM acts as a substitute or
complement to traditional medical treatments, and to identify the types of persons most
likely to utilize CAM.
Background
Prevalence of Complementary and Alternative Medicine
Complementary and alternative medicine (CAM) is a set of nontraditional
therapies that can be used to augment traditional approaches to health care.
Complementary care is the more popular form of CAM and is defined as nontraditional
care in conjunction with traditional therapy. Alternative care, on the other hand, is
nontraditional care used as a substitute to traditional western style medical approaches.[1]
Although CAM therapy takes numerous forms there do exist a few therapies that
comprise the vast majority of patient use and, therefore, medical expenditures. These are
chiropractic care (35% of all CAM expenditures), herbal remedies and supplements

4
(27%), and massage therapy (17%). [12] Acupuncture is another popular form of CAM
therapy, however it falls behind the others in frequency of use. It is difficult to determine
whether these therapies are complementing traditional therapy or replacing it. Both are
possible, however nearly 60 percent of patients state that their doctors have knowledge of
their CAM usage, which would indicate complementary care.[12] Given that the
majority of CAM patients are receiving traditional care, why do they seek non-traditional
treatments as well?
There are several reasons why Americans are turning to CAM treatments in
growing numbers. One reason for the growing popularity of CAM is the growing public
frustration with conventional medical practices. Some Americans resent the escalating
costs of health care and what they perceive as unfair and inequitable distribution of health
services. Another reason for increased CAM usage stems from the occasionally serious
side effects caused by aggressive and invasive treatment, such as surgery. Alternative
medicine rarely causes side effects even remotely as serious as those incurred by
conventional treatments. A third reason for the increased demand for CAM is
demographic. The baby boom generation is now approaching or passing middle age and
many are seeking ways to restore their lost youth. The shear size of this generation
coupled with their enormous buying power is an important factor driving the increased
utilization of CAM. The last reason for this recent development is peoples’ general
demand for healthcare treatments that are more preventive (CAM) rather than curative
(conventional medicine). This general emphasis on overall wellness is another driving
force behind the increasing popularity of complementary and alternative medicine.[6]
5
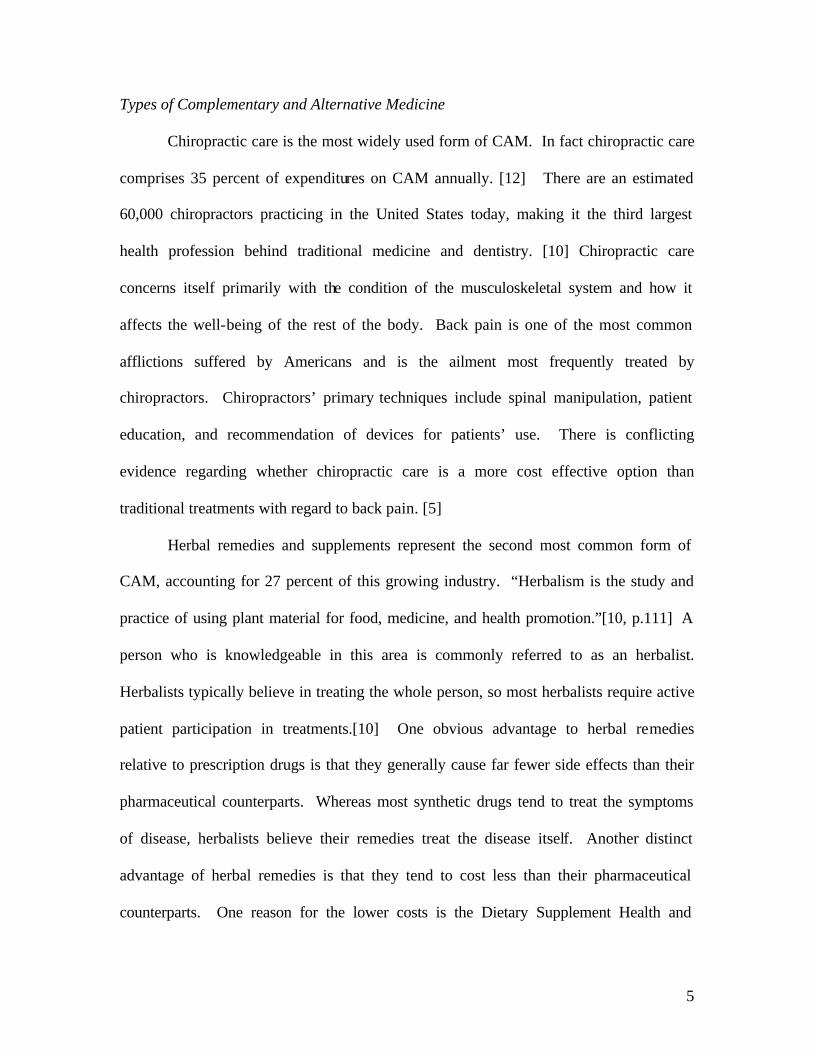
Types of Complementary and Alternative Medicine
Chiropractic care is the most widely used form of CAM. In fact chiropractic care
comprises 35 percent of expenditures on CAM annually. [12] There are an estimated
60,000 chiropractors practicing in the United States today, making it the third largest
health profession behind traditional medicine and dentistry. [10] Chiropractic care
concerns itself primarily with the condition of the musculoskeletal system and how it
affects the well-being of the rest of the body. Back pain is one of the most common
afflictions suffered by Americans and is the ailment most frequently treated by
chiropractors. Chiropractors’ primary techniques include spinal manipulation, patient
education, and recommendation of devices for patients’ use. There is conflicting
evidence regarding whether chiropractic care is a more cost effective option than
traditional treatments with regard to back pain. [5]
Herbal remedies and supplements represent the second most common form of
CAM, accounting for 27 percent of this growing industry. “Herbalism is the study and
practice of using plant material for food, medicine, and health promotion.”[10, p.111] A
person who is knowledgeable in this area is commonly referred to as an herbalist.
Herbalists typically believe in treating the whole person, so most herbalists require active
patient participation in treatments.[10] One obvious advantage to herbal remedies
relative to prescription drugs is that they generally cause far fewer side effects than their
pharmaceutical counterparts. Whereas most synthetic drugs tend to treat the symptoms
of disease, herbalists believe their remedies treat the disease itself. Another distinct
advantage of herbal remedies is that they tend to cost less than their pharmaceutical
counterparts. One reason for the lower costs is the Dietary Supplement Health and
6
Education Act, passed by Congress in 1994. This legislation allows the marketing of
vitamin and herbal supplements without the burden of FDA clearance [11], a process
which typically adds $230 million to the cost of developing a new pharmaceutical
product.[5] Pharmaceutical companies have been cautious about entering this growing
industry because natural plants, that are the source of herbal remedies, cannot be
patented, therefore profits are not guaranteed.[5]
Massage therapy is the third most common form of CAM, representing 17 percent
of this industry.[12] Massage therapy is defined as the kneading or pummeling of the
body’s soft tissues. It is believed that massages can “relieve pain, increase blood and
lymphatic flow, relax tense muscles and decrease blood pressure”.[3, p.296] Massage
therapy is generally accepted by physicians as a legitimate treatment with favorable
outcomes. Massage therapy is most often used to treat musculoskeletal conditions,
recipients have also reported positive experiences in the treatment of “arthritis, asthma,
headache, circulatory problems, digestive disorders, insomnia, immune function, and
stress”.[5, p.605]
Acupuncture has not attained the same levels of utilization as the above therapies
but it is one of the fastest growing forms of healthcare in America. A report by the FDA
in 1993 estimated that approximately 9 to 12 million Americans receive acupuncture
treatment annually. The low cost, safety, and effectiveness of acupuncture are the main
reasons behind its growing acceptance and popularity as a form of medical treatment.
The World Health Organization has deemed acupuncture an acceptable form of treatment
for over 43 conditions, and 41 states in America recognize acupuncture as a legitimate
medical treatment.

7
The theory behind acupuncture is that the life force (Qi) becomes blocked and is
unable to move freely through the body’s meridians, which are a system of channels that
run through the body. Acupuncture uses extremely thin needles to correct the
imbalances, restoring the body’s natural flow of Qi. Some of the ailments for which
acupuncture is recommended include: allergies, asthma, back pain, carpal tunnel
syndrome, colds and flu, constipation, depression, gynecological disorders, headaches,
heart problems, infertility, insomnia, premenstrual syndrome, sciatica, sports injuries,
tendonitis, and stress”.[5, p. 498]
Types of People who Utilize CAM
A study by Eisenberg in 1997 found that 50 percent of all CAM utilization
occurred in persons between ages 35 and 49. His analysis also showed that 49 percent of
females reported some type of CAM utilization, while only 38 percent of males reported
the same. Eisenberg’s research determined that 51 percent of those persons with some
college reported some form of CAM utilization. More whites reported CAM utilization
(45 percent) than blacks (33 percent). Finally, Eisenberg found that 48 percent of people
with incomes greater than $50,000 reported CAM utilization, while those with incomes
below $50,000 reported CAM utilization at a rate of 43 percent. [21]
A study by Astin in 1997 found that 42 percent of all CAM utilization occurred in
persons between ages 35 and 49, while 35 percent of CAM utilizers were above the age
of 64. His analysis also showed that 41 percent of females reported some type of CAM
utilization, while only 39 percent of males reported the same. Astin’s research
determined that 45 percent of college graduates and 50 percent of those with graduate
8
degrees reported some form of CAM utilization. More whites reported CAM utilization
(41 percent) than blacks (29 percent). Forty percent of Hispanics also reported using
some form of CAM. Finally, Astin found that 44 percent of people with incomes greater
than $40,000 reported CAM utilization, while those with incomes below $40,000
reported CAM utilization at a rate of 33 percent. [22]
Palinkas and Kabongo found that 54 percent of all CAM utilization occurred in
people less than 40 years old. [12] They also discovered that women account for 67
percent of all CAM utilization and married persons account for 58. When evaluating
race/ethnicity the researchers found that whites account for 57 percent of CAM usage,
American Indian- 1%, African Americans- 6%, Hispanics- 23%, Asians- 7%, and others-
6%. College graduates accounted for the majority of CAM usage (52%). Finally, in
contrast to the results of other studies, Palinkas and Kabongo report that CAM usage
rates are split equally between people earning less than $50,000 and more. [12]
In sum, the research suggests that those who utilize CAM tend to be females with
incomes larger than $50,000 and 35 years of age or older. The research also is in basic
agreement with respect towards white people utilizing the majority of CAM therapies.
One area of interest not covered in the research above is the regional variations in the
utilization of CAM. All of the studies rely on descriptive statistics, rather than
multivariate analysis to define trends in CAM utilization.
Model
One purpose of this paper is to investigate the relationship between traditional
forms of healthcare and complementary and alternative medicine. This study focuses on

9
four types of alternative care, namely acupuncture, chiropractic care, massage therapy,
and herbal remedies. The main question of interest is whether CAM therapies are
substitutes or complements to traditional medicine.
According to economic theory, two goods are substitutes if the demand for one
good increases when the price of the other good increases. An example of goods that are
substitutes would be a brand-name prescription drug and its generic counterpart. When
lower-priced generic drugs enter the market after the patent on a brand-name drug
expires, sales of the brand-name drug decline sharply, typically as much as 80 percent.
[20]
Two goods are complements if the demand for one good increases when the price
of the other good decreases. An example of goods that are complements would be the
various drugs that are used together to treat HIV/AIDS patients, commonly referred to as
cocktails. Two drugs that are used together in this manner are the protease inhibitors
ritonavir and saquinavir. If the price of ritonavir were to fall then the demand for
saquinavir is expected to increase because the drug ‘cocktail’ is more affordable. [15]
The main research question of this paper is whether CAM therapies primarily act
as substitutes or complements to traditional care. Some CAM therapies might be
effective alternatives to traditional care, such as substituting chiropractic care for physical
therapy. A person might also substitute acupuncture in place of psychiatric care. In
these examples the patient who uses CAM consumes less traditional care than similar
patients who do not use CAM. Some CAM therapies may act as complements to
traditional forms of medicine, such as when an orthopedic physician recommends

10
massage therapy for back pain. A patient may also use herbal remedies to complement
pharmaceutical products prescribed by a physician.
To operationalize the definitions of substitutes and complements with observable
variables in my data, I assume that: (1) traditional medicine and CAM are substitutes if
expenditures on traditional medicine decrease as expenditures on (utilization of) CAM
increases (2) traditional medicine and CAM are complements if expenditures on
traditional medicine increase as expenditures on (utilization of) CAM increases. In the
regression model, the level of expenditures on traditional care is the dependent variable.
The four types of CAM therapies are reviewed separately and expressed either as a
binary variable or an expenditure level in the model. A negative coefficient for CAM
indicates that CAM and traditional care are substitutes while a positive coefficient
indicates they are complements.
The second question the paper seeks to answer is what types of people utilize
CAM therapies. A probit model is used to estimate the relationship between different
types of characteristics and a person’s likelihood of utilizing CAM. I investigate the
following characteristics that have been shown to be significantly correlated with the
utilization of one or more types of CAM therapies in previous research: age, education,
ethnicity, income, marital status, race, and sex. In addition, I investigate the relationship
between CAM utilization and the region of the country in which a person lives as well as
health status indicators.

11
Other Factors that Influence Health Care Expenditures
Other variables that influence healthcare spending can be categorized into three
basic groups. The first group is socio-demographic variables, which include age,
education, ethnicity, race, sex, marital status, and region of the country. Healthcare
expenditures increase with age because, as the Grossman model suggests, as age
increases people will consume a greater amount of healthcare to reach their optimal level
of health. [23] Healthcare spending is expected to increase with education because
persons with higher education place a greater emphasis on preventive measures, such as
routine checkups and proper diet. Ethnicity and race may be correlated with healthcare
spending because of cultural differences and attitudes. For example, it has been
suggested that minorities do not utilize preventive therapies nearly as much as whites.
[18] Furthermore, minorities may underutilize health facilities because their quality is
below average in the areas minorities live. [18] This barrier to access based on race or
ethnicity is closely related to income. [18] Sex is also an important determinant of
expenditures, because men and women typically encounter different types of shocks to
their health capital. Marital status is also of great importance since married couples,
especially those with children, have a greater incentive to stay healthy in order to care for
one another and their children. Married people may also make decisions pertaining to
lifestyle that promote better health. Regional variations in lifestyle are also expected to
influence healthcare spending.
The second category of control variables is incomes. I assume that healthcare is a
normal good, so healthcare spending increases with income. Previous research has
confirmed this basic relationship with the higher earners consuming more healthcare.

12
The final category includes measures of physical and mental health status. It is
assumed that those with better health consume less healthcare, all else equal. Here it is
important to point out that such people may take preventive measures that do not show up
in healthcare expenditure variables.
Methodology
The main research question of this paper is whether alternative care acts as a
substitute or complement for traditional healthcare. I use ordinary least squares
regression to estimate healthcare cost functions where expenditures on traditional
healthcare are expressed as a function of alternative care utilization, controlling for other
factors that influence spending. The basic model is:
ενβα +++= XAY (1)
where the dependent variable, Y, equals a measure of expenditures on traditional
healthcare, α is the intercept, and A is a measure of different types of alternative care use,
namely: acupuncture, chiropractic care, massage therapy, and herbal remedies. The sign
of the coefficient β indicates the relationship between alternative care and traditional
care: if β is positive, this indicates that traditional care and alternative care are
complements; if β is negative, traditional care and alternative care are substitutes. The
vector of control variables, X=[S, I, H] includes socio-demographic characteristics (S),
income (I), and measures of health status (H). The error term, ε, is assumed to be
distributed normally with an expected value of zero. [17]
I estimate two types of models: (1) where A is a continuous variable measuring
expenditures on alternative care, (2) where A is a binary variable identifying persons who

13
received alternative care. Several variants of the basic model are estimated to consider
different types of CAM therapies.
Model 1: Total Spending on Alternative Care
The purpose of the first regression is to determine whether alternative care
treatment as a whole is a complement or substitute for traditional medical treatment. The
dependent variable in the regression is total expenditures on healthcare in 1998, including
expenditures on prescription drugs. The main independent variable of interest represents
total spending on alternative care. The basic equation for this regression is as follows:
TTTTTT HbIbSbAE εβα +++++= 321 (2)
The dependent variable TE represents the natural log of total healthcare expenditures and
A equals total expenditures on alternative care.
Models (2-4): Acupuncture, Chiropractic Care, and Massage Therapy
The purpose of the second regression is to determine whether acupuncture
treatment is a complement or substitute for traditional medical treatment. The dependent
variable is identical to that in Model 1 except expenditures on prescription drugs are
excluded because these forms of CAM have more in common with traditional healthcare
providers than prescription drugs. The main independent variable of interest is a dummy
variable which identifies persons who have been treated by an acupuncturist. The basic
equation for this regression is as follows:
AAAAAA HbIbSbAE εβα +++++= 321 (3)

14
Similar models are estimated for chiropractic care and massage therapy. In all of these
models a binary variable is used to indicate utilization of alternative care because
expenditure data for individual types of CAM therapies are not available in the data.
Model 5: Herbal Remedies
The purpose of the fifth regression is to determine whether herbal remedies
complement or substitute for prescription drugs. The dependent variable in the
regression is total expenditures on prescription drugs. The main independent variable of
interest is a dummy variable which identifies persons who purchased herbal remedies.
The basic equation for this regression is as follows:
HHHHHH HbIbSbAE εβα +++++= 321 (4)
In all cases (Models 1-5) the dependent variable HE is the natural log of the expenditures
variable.
Probit Analysis
To address the second research question, which asks what types of people are
more likely to utilize CAM, I obtain maximum likelihood estimates of the probability of
receiving alternative care. Assume there is an underlying latent variable y* that measures
the propensity to consume alternative care. The basic model is as follows:
]0*[1,* 0 >=++= yyexy γγ (5)
We cannot observe y*; instead we observe y which takes on the value of 1 (consumes
CAM) if y*>0 and 0 (does not consume CAM) otherwise.

15
The response probability for y is:
)|)(()|0*()|1( 0 xxePxyPxyP γγ +−>=>== (6)
Assuming that e has a standard normal distribution, estimates of 0γ and γ can be
obtained by maximizing the likelihood function: [16]
)](1log[)1()](log[)( γγγ iiiii xGyxGy −−+=l (7)
where G is the standard normal cdf (cumulative distribution function).
Five different probit models are estimated where the dependent variable is a
dichotomous variable identifying persons who utilize: (1) any type of CAM therapy, (2)
acupuncture, (3) chiropractic care, (4) massage therapy, or (5) herbal remedies. The
independent variables in x include the vectors: H, S, and I, described below.
Control Variables
The vector H includes two health status variables describing self-reported
physical and mental health status. Both of these variables use a ranking system whereby
1 represents poor health status and 5 represents excellent health status. Theory would
suggest that the better a person’s health status the less they would spend on health care,
all else equal.
The vector S represents socio-demographic characteristics which theory suggests
have an impact on healthcare expenditures. These include dichotomous variables
identifying: gender (male=1); race and ethnicity (White, Black, Hispanic, Asian, and
Indian); region (northeast, midwest, west, south); education (high school dropout, high
school graduate, some college, and college graduate); and marital status (married,

16
married previously, or never married). Age is also included in the vector of socio-
demographic characteristics. This variable is top-coded at 90.
The vector I represents the income category. Total income is a continuous
variable, which sums the following sources of income: wage income, retirement income,
self-employment income, social security income, transfer payments, and other income.
In Model 1, “A” equals an expenditure variable indicating the total amount spent
on CAM. In Models 2-4 “A” equals one of the dummy variables identifying persons who
consume acupuncture, chiropractic care or massage therapy. In model 5 “A” identifies
persons who purchased herbal remedies.
Data
The data are derived from the 1998 Medical Expenditure Panel Survey (MEPS).
The National Center for Health Statistics and the Agency for Healthcare Research and
Quality cosponsored the MEPS data collection process. The MEPS data is a continuation
of a series of national surveys that strives to observe changes in the health care industry
over time. This dataset also provides national estimates pertaining to healthcare
expenditures, healthcare utilization, and payment sources. Such information is intended
to evaluate current healthcare policy in the United States.
The MEPS data is comprised of three different files: a Full Year Consolidated
File, a Medical Conditions File, and a Jobs File. The data were collected in 1998 and are
limited to respondents in the U.S. The full year consolidated file (HC-028) is the
foundation of this study’s research. It contains various healthcare expenditure variables
along with demographic characteristics such as age, education, income, race, sex and

17
region of the country. Health status, both physical and mental, is recorded in order to
assess the general well-being of the respondent. Other variables in the MEPS data
describe medical services, fees, healthcare access, satisfaction with healthcare, and
payment sources. [19] The original data set contains 24,072 observations and 1,262
variables.
The data for this analysis are restricted to persons age 17 and older. Observations
where marital status is unknown are deleted. Observations that have missing values for
physical and/or mental health status are deleted as well. Finally, people with negative
total incomes are excluded from the dataset. These restrictions reduce the total number
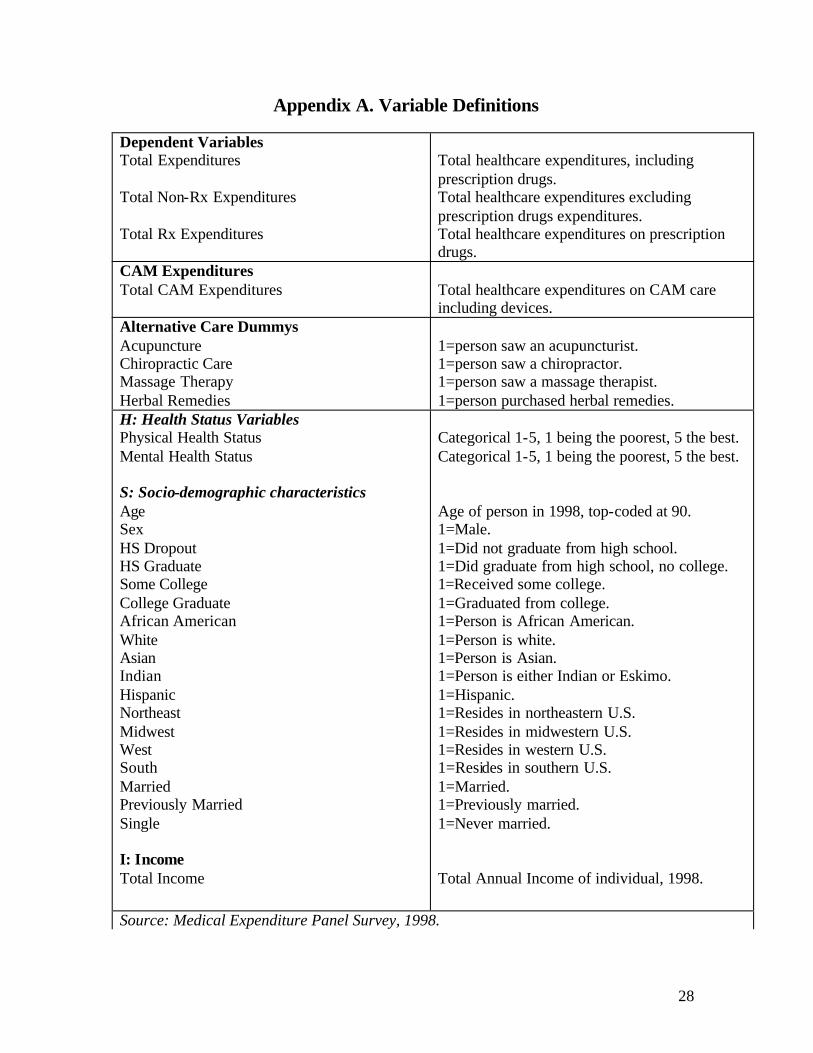
of observations to 16,560. All the variables used in the analyses are defined in Appendix
A.
Results
Sample Statistics
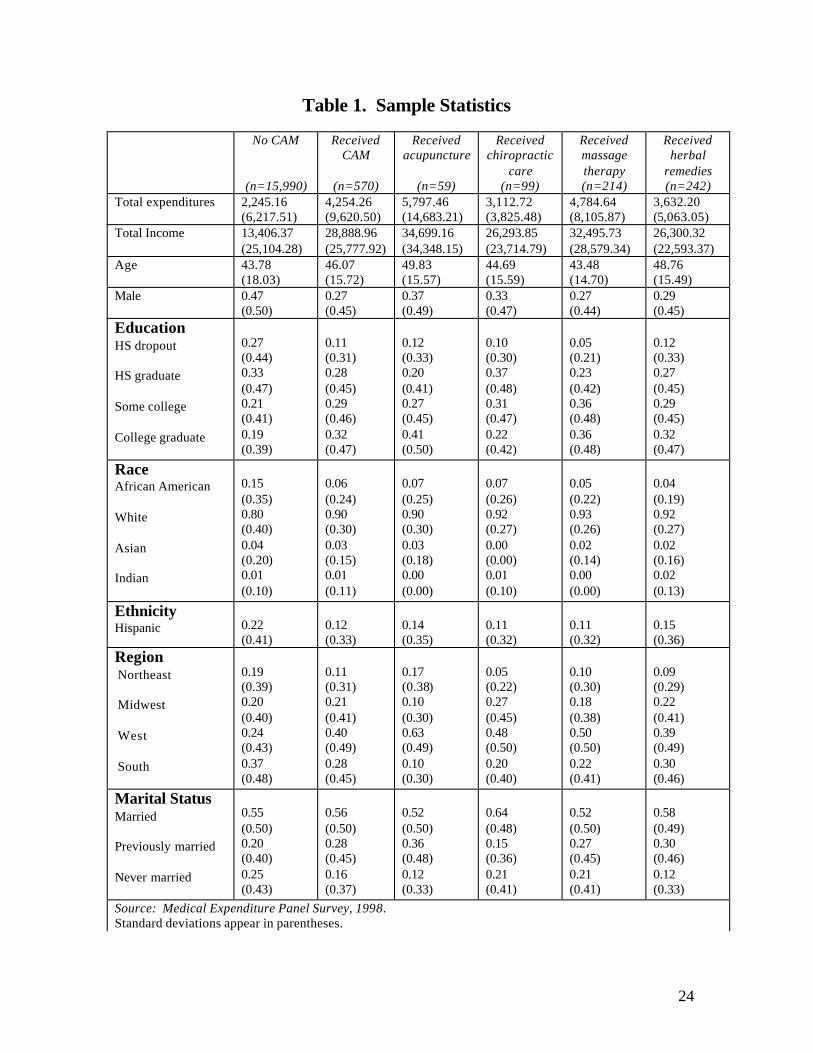
The sample statistics in Table 1 compare characteristics of persons who utilize
CAM versus those who do not. On average, persons who utilize CAM spend
approximately $2,000 more on overall healthcare expenditures than persons who do not
utilize CAM. Also, the total income of those who use CAM is greater than those who do
not across the board. The average age of CAM users tends to be in the mid to late forties,
slightly older than those who do not use CAM. One of the most striking details is that
women consume far more CAM therapies than men.
The results suggest that people with greater amounts of education tend to
consume more CAM therapies. Also, whites tend to consume relatively more CAM than
18
blacks or Hispanics. Surprisingly, Asians are also under-represented among the CAM
groups, even for acupuncture.
The group that consumes CAM includes a greater proportion of previously
married persons, and smaller proportion of never married persons, than the group with no
CAM. There are also differences in the types of CAM therapies chosen by persons of
different marital status. Married persons receive a disproportionate amount of
chiropractic care, while previously married people tend to select acupuncture, massage,
and herbal remedies.
There are pronounced regional differences in the utilization of CAM. People
living in the west tend to consume more CAM therapies than people living in other
regions. People in the midwest tend to consume more chiropractic care than people in the
northeast or south, but people in the west consume more of all types of CAM. Indeed, 63
percent of those who receive acupuncture live in the west.
Table 2 describes the self- reported physical and mental health status of CAM
users versus non-CAM users. Both the physical and mental health status of persons who
consume CAM tend to be slightly poorer than among those who do not consume any
CAM. The results also suggest that people who use acupuncture tend to have poorer
physical and mental health than any other group. One may speculate that acupuncture is
a therapy of ‘last resort’. That is, persons seek acupuncture after other therapies have
failed to improve their condition.

19
Coefficient Estimates for the Health Care Cost Functions
Table 3 reports OLS estimates of the coefficients that relate CAM utilization to
traditional healthcare expenditures. Because the natural log is used as the dependent
variable, the log points are shown in the table. The percentage effects can be computed
by taking the inverse log of the coefficient estimate and subtracting one. That is,
1^
−= βeEffectPercentage
where ∧β represents an estimated coefficient. However, any variable that has a
coefficient below 0.15 is close to its actual percentage value; a conversion is not
necessary.
Model 1 estimates the relationship between traditional health care expenditures,
including expenditures on prescription drugs, and total CAM expenditures. The
independent variables in this model explain 24 percent of the variation in healthcare
expenditures. The variable of main interest is total CAM expenditures. The estimated
coefficient is positive and significant, suggesting that CAM is a complement to
traditional health care. However, the coefficient is very small, close to 0 percent.
In Models 2-4 the coefficient estimates of the CAM utilization variables are all
positive and significant. The dependent variable in these models is the same as in model
1 except prescription drugs are no longer included. The results indicate that people who
use acupuncture spend twice as much on traditional healthcare, as people who do not.
People who use chiropractic care spend 72 percent more on traditional care and massage
therapy users spend 177 percent more. Thus, the results consistently show that CAM
therapies and traditional medicine are complementary.

20
In Model 5 the dependent variable is expenditures on prescription drugs. Here the
results suggest that people who use herbal remedies spend 30 percent more on
prescription drugs than people who do not use herbal remedies, but this coefficient is
only significant at the .10 level. Again, it appears that herbal remedies are used as
complements to traditional medicine.
The results for other variables are not the main focus of this paper, but they do
reveal some interesting trends. Referring to Model 1, total income is significant but its
coefficient is roughly zero, indicating it has very little effect on traditional healthcare
expenditures. Age is significant and the data suggest that for every extra year older a
person becomes their traditional healthcare expenditures increase by 4 percent. Of
particular interest is that males consume 68 percent less on healthcare than women do.
Education proves to be an important indicator as well, for higher educated people tend to
consume significantly more healthcare than high school graduates. Those people with
just some college consumed 72 percent more healthcare than high school graduates,
while college graduates consumed 93 percent more. The data also suggest that minorities
consume a significantly lower amount of healthcare than whites do. African Americans
and Asians consume approximately 56 percent less healthcare than whites do. Hispanics
also consume a significantly lower amount of healthcare (63 percent) than non-Hispanics.
The region of the country a person lives also is an important indicator of
healthcare expenditures. In model 1 the only significant value is for those people in the
midwest who spend 20 percent more on healthcare than people in the south. People who
are married also tend to spend significantly more (13 percent) on healthcare than those

21
who have never been married. Good physical health suggests lower expenditures on
healthcare; good mental health has a much smaller positive effect.
Maximum Likelihood Estimates of the Probability of Receiving CAM
Table 4 shows maximum likelihood estimates of the probit models of receiving
different types of CAM therapies. Model 1 confirms previous research with respect to
education, marital status, race/ethnicity, and sex. Higher education and being previously
married have a significantly positive effect on CAM utilization. The probit model also
finds that males are significantly less likely to utilize CAM than females. Finally,
consistent with previous research whites are more likely to consume CAM than any other
racial or ethnic group. A source of disagreement with previous studies arises when we
observe the effects of age and income. The probit results for Model 1 show that
increasing age and income have a negligible impact on CAM utilization, whereas
previous research suggests that higher age and income increases CAM utilization.
Model 1 also evaluates the effects of additional variables on CAM utilization,
including region and health status. Here we find that people living in the west are
significantly more likely to utilize CAM therapies than people in the south. It is also
determined that those people living in the northeast utilize significantly less CAM
therapies than people in the south. Those people with better physical health are also
shown to be significantly less likely to utilize CAM therapies.
When looking across different forms of CAM therapies, we find that increased
age significantly decreases one’s chances of utilizing massage therapy, while it
significantly increases the chances of utilizing herbal remedies. Increased income is
22
shown to have a significantly positive impact on massage therapy utilization, although
the effect is small. Another notable observation is that living in the northeast has a
significantly positive effect when it comes to acupuncture utilization. Finally, the last
interesting observation is that persons who utilize chiropractic care have no poorer
physical health status than those who do. This is consistent with allegations that
chiropractors treat less severe cases than medical doctors, on average. [24]
Conclusion
This study suggests that CAM therapies act as complements to traditional forms
of healthcare. Although the percentages may vary, every form of CAM analyzed
indicated a complementary relationship to traditional healthcare. One limitation of the
research is the absence of more precise objective health measures. Such measures could
provide a more accurate assessment with respect to the relationship between CAM
utilization and traditional healthcare. Also the MEPS dataset did not provide an
individual breakdown of CAM expenditures, which would have been useful.
The probit estimates confirm the conclusions taken from previous research
pertaining to education, marital status, race/ethnicity, and sex. Here we find that higher
education and being married increase the likelihood of utilizing CAM. Furthermore it is
shown that white people and females tend to utilize more CAM therapies than their
counterparts. Additionally it is shown that living in the west significantly increases ones’
chances of utilizing CAM. The effects of age and income did not parallel those found in
previous research, hence their impact on CAM utilization remains debatable.

23
As mentioned previously, Americans spent an estimated $27 to $33 billion on
CAM in 1997 [1] This fact alone warrants additional research pertaining to this issue.
Future research should strive to find more precise health measures and more accurate
measures of CAM expenditures. Such research is important for it appears that the future
growth of CAM therapies is a trend that will not reverse itself.
24
Table 1. Sample Statistics
No CAM
(n=15,990)
Received CAM
(n=570)
Received acupuncture
(n=59)
Received chiropractic
care (n=99)
Received massage therapy (n=214)
Received herbal
remedies (n=242)
Total expenditures 2,245.16 (6,217.51)
4,254.26 (9,620.50)
5,797.46 (14,683.21)
3,112.72 (3,825.48)
4,784.64 (8,105.87)
3,632.20 (5,063.05)
Total Income 13,406.37 (25,104.28)
28,888.96 (25,777.92)
34,699.16 (34,348.15)
26,293.85 (23,714.79)
32,495.73 (28,579.34)
26,300.32 (22,593.37)
Age 43.78 (18.03)
46.07 (15.72)
49.83 (15.57)
44.69 (15.59)
43.48 (14.70)
48.76 (15.49)
Male
0.47 (0.50)
0.27 (0.45)
0.37 (0.49)
0.33 (0.47)
0.27 (0.44)
0.29 (0.45)
Education HS dropout HS graduate Some college College graduate
0.27 (0.44) 0.33 (0.47) 0.21 (0.41) 0.19 (0.39)
0.11 (0.31) 0.28 (0.45) 0.29 (0.46) 0.32 (0.47)
0.12 (0.33) 0.20 (0.41) 0.27 (0.45) 0.41 (0.50)
0.10 (0.30) 0.37 (0.48) 0.31 (0.47) 0.22 (0.42)
0.05 (0.21) 0.23 (0.42) 0.36 (0.48) 0.36 (0.48)
0.12 (0.33) 0.27 (0.45) 0.29 (0.45) 0.32 (0.47)
Race African American White Asian Indian
0.15 (0.35) 0.80 (0.40) 0.04 (0.20) 0.01 (0.10)
0.06 (0.24) 0.90 (0.30) 0.03 (0.15) 0.01 (0.11)
0.07 (0.25) 0.90 (0.30) 0.03 (0.18) 0.00 (0.00)
0.07 (0.26) 0.92 (0.27) 0.00 (0.00) 0.01 (0.10)
0.05 (0.22) 0.93 (0.26) 0.02 (0.14) 0.00 (0.00)
0.04 (0.19) 0.92 (0.27) 0.02 (0.16) 0.02 (0.13)
Ethnicity Hispanic
0.22 (0.41)
0.12 (0.33)
0.14 (0.35)
0.11 (0.32)
0.11 (0.32)
0.15 (0.36)
Region Northeast Midwest West South
0.19 (0.39) 0.20 (0.40) 0.24 (0.43) 0.37 (0.48)
0.11 (0.31) 0.21 (0.41) 0.40 (0.49) 0.28 (0.45)
0.17 (0.38) 0.10 (0.30) 0.63 (0.49) 0.10 (0.30)
0.05 (0.22) 0.27 (0.45) 0.48 (0.50) 0.20 (0.40)
0.10 (0.30) 0.18 (0.38) 0.50 (0.50) 0.22 (0.41)
0.09 (0.29) 0.22 (0.41) 0.39 (0.49) 0.30 (0.46)
Marital Status Married Previously married Never married
0.55 (0.50) 0.20 (0.40) 0.25 (0.43)
0.56 (0.50) 0.28 (0.45) 0.16 (0.37)
0.52 (0.50) 0.36 (0.48) 0.12 (0.33)
0.64 (0.48) 0.15 (0.36) 0.21 (0.41)
0.52 (0.50) 0.27 (0.45) 0.21 (0.41)
0.58 (0.49) 0.30 (0.46) 0.12 (0.33)
Source: Medical Expenditure Panel Survey, 1998. Standard deviations appear in parentheses.

25
Table 2. Distribution of Sample by Self-Reported Health Status No CAM
(n=15,990)
Received CAM
(n=570)
Received Acupuncture
(n=59)
Received Chiropractic
Care (n=99)
Received massage therapy (n=214)
Received herbal
remedies (n=242)
Physical Health Status
Poor 4.18 % 5.96 % 10.17 % 5.05 % 5.61 % 4.96 % Fair 10.63 14.04 16.95 14.14 13.08 12.40 Good 28.26 27.37 22.03 34.34 25.70 27.27 Very Good 30.05 30.35 32.20 28.28 28.97 34.30 Excellent 26.88 22.28 18.64 18.18 26.64 21.07 Mental Health Status
Poor 1.94 % 2.98 % 5.08 % 2.02 % 1.87 % 1.65 % Fair 5.83 7.72 6.78 9.09 6.54 7.85 Good 26.10 27.54 23.73 34.34 26.17 28.51 Very Good 29.30 29.47 30.51 29.29 29.91 34.30 Excellent 36.82 32.28 33.90 25.25 35.51 27.69 Source: Medical Expenditure Panel Survey, 1998.

26
Table 3. Coefficient Estimates for Health Care Cost Functions
Model 1 Total
expenditures
Model 2 Acupuncture
Model 3 Chiropractic
care
Model 4 Massage therapy
Model 5 Herbal remedies
CAM expenditures
0.0003*** (0.00008)
CAM utilization
1.10*** (0.35)
0.54** (0.27)
1.02*** (0.19)
0.26* (0.15)
Total Income
4.59 E -5*** (9.16 E –7)
5.20 E –5 (9.44 E –7)
5.23 E –5*** (9.44 E –7)
5.13 E –5 (9.44 E –7)
6.44 E –8 (8.31 E –7)
Age
0.04*** (0.001)
0.04*** (0.001)
0.04*** (0.004)
0.04*** (0.001)
0.05*** (0.001)
Male
-1.14*** (0.04)
-1.11*** (0.04)
-1.11*** (0.04)
-1.10*** (0.04)
-0.95*** (0.04)
Education HS dropout Some college College graduate
-0.14** (0.06) 0.54*** (0.06) 0.66*** (0.06)
-0.15*** (0.06) 0.56*** (0.06) 0.68*** (0.06)
-0.15*** (0.06) 0.55*** (0.06) 0.69*** (0.06)
-0.15** (0.06) 0.55*** (0.06) 0.68*** (0.06)
-0.13*** (0.05) 0.35*** (0.05) 0.32*** (0.06)
Race African American Asian Indian
-0.80*** (0.06) -0.87*** (0.11) -0.32 (0.20)
-0.84*** (0.06) -0.81*** (0.11) -0.35* (0.21)
-0.84*** (0.06) -0.81*** (0.11) -0.36* (0.21)
-0.83*** (0.06) -0.80*** (0.11) -0.34 (0.21)
-0.62*** (0.06) -0.84*** (0.10) -0.07 (0.18)
Hispanic
-0.99*** (0.06)
-0.96*** (0.06)
-0.96*** (0.06)
-0.96*** (0.06)
-0.67*** (0.05)
Region Northeast Midwest West
0.08 (0.06) 0.18*** (0.06) 0.09 (0.05)
0.19*** (0.06) 0.22*** (0.06) 0.16*** (0.06)
0.19*** (0.06) 0.21*** (0.06) 0.16*** (0.06)
0.20*** (0.06) 0.22*** (0.06) 0.15*** (0.06)
-0.23*** (0.05) -0.05 (0.05) -0.16*** (0.05)
Marital Status Married Previously married
0.13** (0.06) -0.04 (0.07)
0.09 (0.06) -0.06 (0.08)
0.09 (0.06) -0.05 (0.08)
0.09 (0.06) -0.06 (0.08)
0.03 (0.05) -0.05 (0.07)
Health Status Physical Mental
-0.60*** (0.02) 0.05* (0.03)
-0.55*** (0.03) 0.07** (0.03)
-0.55*** (0.03) 0.07** (0.03)
-0.55*** (0.03) 0.07** (0.03)
-0.68*** (0.02) -0.02 (0.02)
Adj. R-Squares 0.24 0.20 0.20 0.20 0.30 Notes: In Model 1 the dependent variable is the natural log of total healthcare expenditures. In Models 2-4 the dependent variable is the natural log of total non-Rx healthcare expenditures. In Model 5 the dependent variable is the natural log of Rx expenditures.***=0.01 significance level, **=0.05 significance level, *=0.10 significance level. Standard errors appear in parentheses. N=16,560 Source: Source: Medical Expenditure Panel Survey, 1998.

27
Table 4. Maximum Likelihood Estimates of the Probability of Receiving Alternative Care
Model 1
All CAM
Model 2 Acupuncture
Model 3 Chiropractic
care
Model 4 Massage therapy
Model 5 Herbal
remedies Male -0.37***
(0.04) -0.09 (0.10)
-0.20*** (0.08)
-0.35*** (0.06)
-0.27*** (0.06)
Age -0.0006 (0.001)
0.003 (0.003)
-0.0009 (0.003)
-0.004** (0.002)
0.004** (0.002)
Total Income 1.09 E-6 (7.54E-7)
1.56 E-6 (1.47 E-6)
6.29E-7 (1.44 E-6)
2.05 E-6** (9.78 E-7)
-1.18 E-6 (1.12 E-6)
Education HS dropout Some college College graduate
-0.31*** (0.07) 0.20*** (0.05) 0.33*** (0.05)
-0.11 (0.16) 0.22 (0.14) 0.41*** (0.13)
-0.34*** (0.13) 0.08 (0.09) 0.02 (0.11)
-0.48*** (0.12) 0.30*** (0.07) 0.36*** (0.08)
-0.25*** (0.09) 0.20*** (0.07) 0.34*** (0.07)
Race African American Asian Indian
-0.40*** (0.07) -0.40*** (0.12) 0.07 (0.19)
-0.18 (0.18) -0.24 (0.25) -4.65 (8864.2)
-0.25* (0.14) -4.83*** (4631.60) -0.064 (0.39)
-0.39*** (0.11) -0.55*** (0.20) -5.05 (5,470.80)
-0.52*** (0.12) -0.33** (0.17) 0.18 (0.22)
Hispanic -0.28*** (0.06)
-0.16 (0.14)
-0.30** (0.12)
-0.28*** (0.09)
-0.11 (0.08)
Region Northeast Midwest West
-0.15** (0.06) 0.04 (0.06) 0.35*** (0.05)
0.36** (0.17) 0.14 (0.18) 0.75*** (0.14)
-0.24 (0.16) 0.22** (0.11) 0.49*** (0.10)
-0.08 (0.10) 0.06 (0.09) 0.49*** (0.07)
-0.25*** (0.09) 0.03 (0.07) 0.24*** (0.06)
Marital Status Married Previously married
0.08 (0.06) 0.22*** (0.07)
0.10 (0.15) 0.34** (0.17)
0.03 (0.10) -0.15 (0.14)
-0.003 (0.08) 0.19** (0.10)
0.17** (0.08) 0.30*** (0.10)
Health Status Physical Mental
-0.07*** (0.02) -0.04 (0.02)
-0.12** (0.05) 0.02 (0.06)
-0.07 (0.04) -0.07 (0.05)
-0.09** (0.03) -0.0005 (0.04)
-0.008 (0.03) -0.06* (0.03)
Log Likelihood -2,270.78 -345.77 -556.30 -1,010.39 -1,171.30
***=0.01 significance level, **=0.05 significance level, *=0.10 significance level Standard errors appear in parentheses. N=16,560 Source: Source: Medical Expenditure Panel Survey, 1998.
28
Appendix A. Variable Definitions
Dependent Variables Total Expenditures Total Non-Rx Expenditures Total Rx Expenditures
Total healthcare expenditures, including prescription drugs. Total healthcare expenditures excluding prescription drugs expenditures. Total healthcare expenditures on prescription drugs.
CAM Expenditures Total CAM Expenditures
Total healthcare expenditures on CAM care including devices.
Alternative Care Dummys Acupuncture Chiropractic Care Massage Therapy Herbal Remedies
1=person saw an acupuncturist. 1=person saw a chiropractor. 1=person saw a massage therapist. 1=person purchased herbal remedies.
H: Health Status Variables Physical Health Status Mental Health Status S: Socio-demographic characteristics Age Sex HS Dropout HS Graduate Some College College Graduate African American White Asian Indian Hispanic Northeast Midwest West South Married Previously Married Single I: Income Total Income
Categorical 1-5, 1 being the poorest, 5 the best. Categorical 1-5, 1 being the poorest, 5 the best. Age of person in 1998, top-coded at 90. 1=Male. 1=Did not graduate from high school. 1=Did graduate from high school, no college. 1=Received some college. 1=Graduated from college. 1=Person is African American. 1=Person is white. 1=Person is Asian. 1=Person is either Indian or Eskimo. 1=Hispanic. 1=Resides in northeastern U.S. 1=Resides in midwestern U.S. 1=Resides in western U.S. 1=Resides in southern U.S. 1=Married. 1=Previously married. 1=Never married. Total Annual Income of individual, 1998.
Source: Medical Expenditure Panel Survey, 1998.
29
Bibliography 1. Atkinson, William. “The next big benefit boom.” Business & Health. Sept.
1999: p. 24. 2. Blackledge, Cath. “Herbal remedies rouse drugs firms.” The European. 31 Aug.
1998: p. 22. 3. Diamond, John W. M.D. The Clinical Practice of Complementary, Alternative, and Western Medicine, CRC Press. Washington D.C. 2001. 4. DT. “Pharmaceutical Care, Alternative Medicine.” Drug Topics. 19 April 1999:
p. 80. 5. Faass, Nancy. Integrating Complementary Medicine into Health Systems, Aspen Publishers, Inc. Gaithersburg, Maryland, 2001. 6. Gordon, Rena J. PhD. Alternative Therapies “Expanding Options in Health
Care” , Springer Publishing Company. New York, NY, 1998. 7. Levy, Sandra. “Alternative care launches: It’s only the beginning.” Drug Topics.
19 July 1999: p. 44. 8. Lewith, George. Clinical Research in Complementary Therapies “Principles,
Problems and Solutions”, Harcourt Publishers Ltd. London, 2002. 9. MHW. “Alternative care is treatment of choice for depression and anxiety, say
survey.” Mental Health Weekly. 26 March 2000: p. 5. 10. Micozzi, Marc S. Phd/MD. Fundamentals of Complementary and Alternative
Medicine, Churchill Livingstone. NewYork, NY, 1996. 11. MMM. “Back to the future: research drug companies market branded herbal
remedies.” Medical Marketing & Media. Dec. 1998: p. 6. 12. Palinkas, Lawrence A. & Kabongo, Martin L. “The Use of Complementary and
Alternative Medicine by Primary Care Patients: A Surf*Net Study.” Journal of Family Practice Dec. 2000: Vol. 49, p. 1121.
13. Schiff, Lisa. “Washington State Insurers Must Cover Alternative Care.” Medical
Economics April 2000: p.12. 14. Tarlach, Gemma M. “New Ground: big drug firms tiptoeing into alternative
medicine.” Drug Topics. 3 Nov. 1997: p. 64.
30
15. “Aids Cocktails”, Rense.com, www.rense.com/cocktails.htm, accessed July 10, 2002
16. Wooldridge, Jeffery M. “Introductory Econometrics: A Modern Approach”
South-Western College Publishing. USA, 2000.
17. Lewis-Beck, Michael S. “Applied Regression: An Introduction”, Sage Publications. Newbury Park, CA. 1980.
18. Joseph, Alun E & Phillips, David R. “Accessibility & Utilization: Geographical
Perspectives on Health Care Delivery” Harper & Row. New York, 1984.
19. Household Component 1998 Full Year Files. January 2002. Agency for Healthcare Research and Quality, Rockville, MD. http://www.meps.ahrq.gov/Data_Pub/hc_fydata98.htm
20. Harris, Gardiner. “Judge Permits Cheap Knockoff of Bristol Drug” Wall Street
Journal. March 14, 2001.
21. Eisenberg, D. et al, “Trends in Alternative Medicine Use in the United States.” Journal of the American Medical Association, 1998: Vol. 280, No. 18, pp. 1569-1575.
22. Astin, J, “Why Patients Use Alternative Medicine: Results of a National Study.”
Journal of the American Medical Association, 1998: Vol. 279, No. 19, pp. 1548-1553.
23. Schweitzer, Stuart O. Pharmaceutical Economics and Policy, New York: Oxford
University Press, 1997.
24. Johnson, William G., Baldwin, Majorie L., Butler, Richard J. The Journal of Risk and Insurance, 1999, Vol. 66, No.2, 185-205.