Embed Size (px)
Citation preview
The Relationship between Climatic Patterns
and Staple Crop Yields in USA, China, and India
Abstract
As our global population grows, so does the demand for food and
by 2050, the world population is projected to reach 9.7 billion.
Nevertheless, many countries, especially in Africa, are already
suffering from food shortages resulting in starvation. Most of the
countries that are experiencing food shortages are also facing crop
failure due to extreme weather events including drought making
them unable to farm and produce food for themselves. Therefore,
the effects of climate change should be taken into account and
monitored when looking for a solution to food insecurity. In this
project, data was collected from 1961 to 2013 in three countries:
China, India, and the United States of America. This study focuses
on the area harvested, and the weighted yield of six different crops
including barley, maize, rice, sorghum, soybean and wheat. The
climatic variables looked at includes drought and El Nino Southern
Oscillation (ENSO). Droughts were measured using the Palmer
Drought Severity Index (PDSI). Additionally, the effects of carbon
dioxide (CO2) levels were also taken into consideration. Lastly,
using multiple linear regression, the impacts of these variables on
crop yield were identified. Results showed the positive correlations
between these variables and weighted crop yield in these countries
from 1961 to 2013.
Introduction
As the World Food Summit defines, “Food security exists
when all people, at all times, have physical and economic access to
sufficient, safe and nutritious food that meets their dietary needs
and food preferences for an active and healthy life”. Today, about
one billion people in the world are undernourished suffering
endless food shortages. When looking for a solution to the
problem of global food insecurity, climate change is a very
important factor to take into account as most crop failure is due to
extreme climatic events like drought.
In this project, data was collected from the years 1961 to 2013.
The study also focused on three countries: China, India, and the
United States of America as they are some of the most populated
and highly agricultural, as well as being some of the biggest
exporters providing food to the rest of the world. Lastly,
the harvested area and yield for six different crops including
barley, maize, rice, sorghum, soybean and wheat was collected
from the Food and Agriculture Organizations of the United
Nations website. These six crops were chosen because they are
the most nutritious and provide most of the calories taken by most
of the world, humans and animals. The climatic variables looked
at were the El Niño Southern Oscillation (ENSO) and droughts.
ENSO is a natural cycle in the Pacific Ocean in terms of winds,
temperatures, and clouds and swings between La Niña, Neutral,
and El Niño. El Niño is unpredictable and can bring extreme
weather of different types to different parts of the world. Droughts
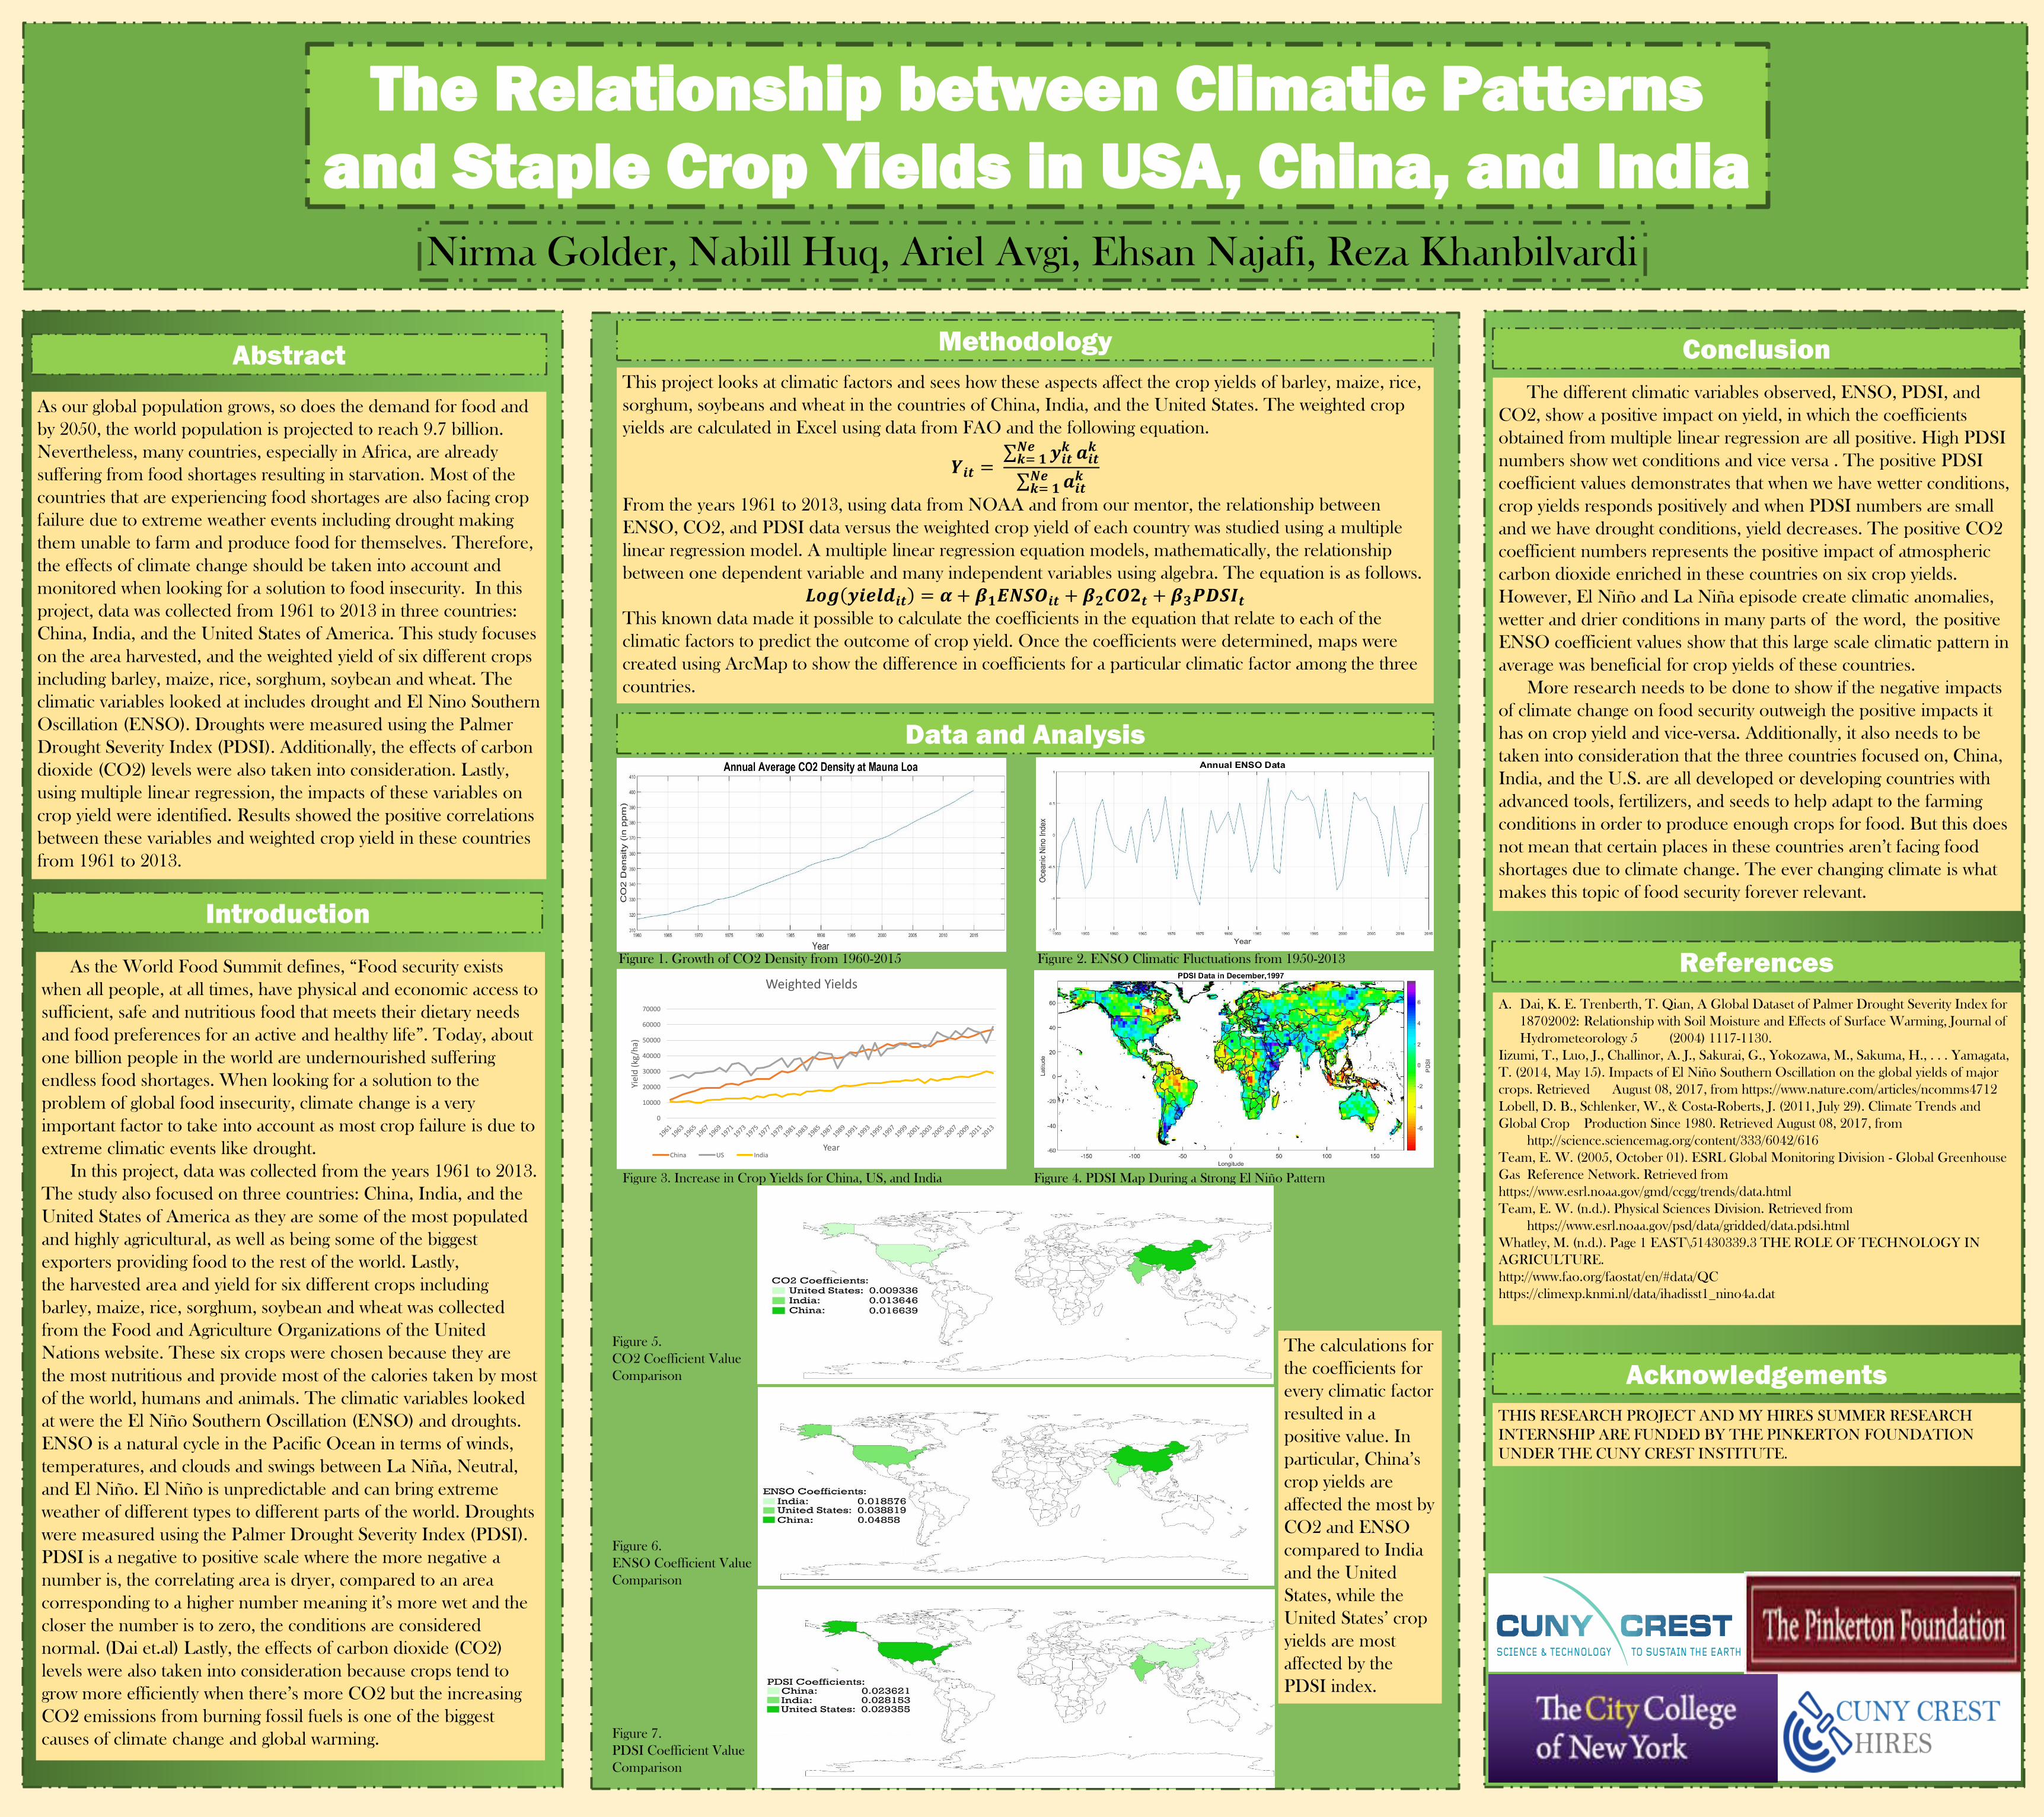
were measured using the Palmer Drought Severity Index (PDSI).
PDSI is a negative to positive scale where the more negative a
number is, the correlating area is dryer, compared to an area
corresponding to a higher number meaning it’s more wet and the
closer the number is to zero, the conditions are considered
normal. (Dai et.al) Lastly, the effects of carbon dioxide (CO2)
levels were also taken into consideration because crops tend to
grow more efficiently when there’s more CO2 but the increasing
CO2 emissions from burning fossil fuels is one of the biggest
causes of climate change and global warming.
Methodology
Data and Analysis
Conclusion
Acknowledgements
References
Nirma Golder, Nabill Huq, Ariel Avgi, Ehsan Najafi, Reza Khanbilvardi
THIS RESEARCH PROJECT AND MY HIRES SUMMER RESEARCH
INTERNSHIP ARE FUNDED BY THE PINKERTON FOUNDATION
UNDER THE CUNY CREST INSTITUTE.
This project looks at climatic factors and sees how these aspects affect the crop yields of barley, maize, rice,
sorghum, soybeans and wheat in the countries of China, India, and the United States. The weighted crop
yields are calculated in Excel using data from FAO and the following equation.
𝒀𝒊𝒕 =σ𝒌= 𝟏𝑵𝒆 𝒚𝒊𝒕
𝒌 𝒂𝒊𝒕𝒌
σ𝒌= 𝟏𝑵𝒆 𝒂𝒊𝒕
𝒌
From the years 1961 to 2013, using data from NOAA and from our mentor, the relationship between
ENSO, CO2, and PDSI data versus the weighted crop yield of each country was studied using a multiple
linear regression model. A multiple linear regression equation models, mathematically, the relationship
between one dependent variable and many independent variables using algebra. The equation is as follows.
𝑳𝒐𝒈 𝒚𝒊𝒆𝒍𝒅𝒊𝒕 = 𝜶 + 𝜷𝟏𝑬𝑵𝑺𝑶𝒊𝒕 + 𝜷𝟐𝑪𝑶𝟐𝒕 + 𝜷𝟑𝑷𝑫𝑺𝑰𝒕This known data made it possible to calculate the coefficients in the equation that relate to each of the
climatic factors to predict the outcome of crop yield. Once the coefficients were determined, maps were
created using ArcMap to show the difference in coefficients for a particular climatic factor among the three
countries.
The calculations for
the coefficients for
every climatic factor
resulted in a
positive value. In
particular, China’s
crop yields are
affected the most by
CO2 and ENSO
compared to India
and the United
States, while the
United States’ crop
yields are most
affected by the
PDSI index.
The different climatic variables observed, ENSO, PDSI, and
CO2, show a positive impact on yield, in which the coefficients
obtained from multiple linear regression are all positive. High PDSI
numbers show wet conditions and vice versa . The positive PDSI
coefficient values demonstrates that when we have wetter conditions,
crop yields responds positively and when PDSI numbers are small
and we have drought conditions, yield decreases. The positive CO2
coefficient numbers represents the positive impact of atmospheric
carbon dioxide enriched in these countries on six crop yields.
However, El Niño and La Niña episode create climatic anomalies,
wetter and drier conditions in many parts of the word, the positive
ENSO coefficient values show that this large scale climatic pattern in
average was beneficial for crop yields of these countries.
More research needs to be done to show if the negative impacts
of climate change on food security outweigh the positive impacts it
has on crop yield and vice-versa. Additionally, it also needs to be
taken into consideration that the three countries focused on, China,
India, and the U.S. are all developed or developing countries with
advanced tools, fertilizers, and seeds to help adapt to the farming
conditions in order to produce enough crops for food. But this does
not mean that certain places in these countries aren’t facing food
shortages due to climate change. The ever changing climate is what
makes this topic of food security forever relevant.
A. Dai, K. E. Trenberth, T. Qian, A Global Dataset of Palmer Drought Severity Index for
18702002: Relationship with Soil Moisture and Effects of Surface Warming, Journal of
Hydrometeorology 5 (2004) 1117-1130.
Iizumi, T., Luo, J., Challinor, A. J., Sakurai, G., Yokozawa, M., Sakuma, H., . . . Yamagata,
T. (2014, May 15). Impacts of El Niño Southern Oscillation on the global yields of major
crops. Retrieved August 08, 2017, from https://www.nature.com/articles/ncomms4712
Lobell, D. B., Schlenker, W., & Costa-Roberts, J. (2011, July 29). Climate Trends and
Global Crop Production Since 1980. Retrieved August 08, 2017, from
http://science.sciencemag.org/content/333/6042/616
Team, E. W. (2005, October 01). ESRL Global Monitoring Division - Global Greenhouse
Gas Reference Network. Retrieved from
https://www.esrl.noaa.gov/gmd/ccgg/trends/data.html
Team, E. W. (n.d.). Physical Sciences Division. Retrieved from
https://www.esrl.noaa.gov/psd/data/gridded/data.pdsi.html
Whatley, M. (n.d.). Page 1 EAST\51430339.3 THE ROLE OF TECHNOLOGY IN
AGRICULTURE.
http://www.fao.org/faostat/en/#data/QC
https://climexp.knmi.nl/data/ihadisst1_nino4a.dat
Figure 1. Growth of CO2 Density from 1960-2015 Figure 2. ENSO Climatic Fluctuations from 1950-2013
0
10000
20000
30000
40000
50000
60000
70000
Yiel
d (
kg/h
a)
Year
Weighted Yields
China US India
Figure 3. Increase in Crop Yields for China, US, and India Figure 4. PDSI Map During a Strong El Niño Pattern
Figure 5.
CO2 Coefficient Value
Comparison
Figure 6.
ENSO Coefficient Value
Comparison
Figure 7.
PDSI Coefficient Value
Comparison