Embed Size (px)
Citation preview

The Relational Model and Normalization
R. Nakatsu

The Relational Model
• Data is represented in two-dimensional tables– Each of the tables is a matrix consisting of a
series of row/column intersections– Tables are also called relations– Columns of the tables are attributes
• Information in more than one table can be easily extracted and combined
• E.F. Codd defined well-structured “normal forms” of relations

Functional Dependency
Notation: X YEach value of X determines one and
only one value of Y
Examples:SID Major, LastName, FirstNameComputerSerialNumber
MemorySize(SID, CourseNumber) Grade

Functional DependencyWhat are the functional dependencies
in the relation below?

A B relationships
A B and B A one-to-oneA B but B not A many-to-oneA not B and B not A many-to-many
Another way to write not is . For example:
A B and B A (A multi-determines B and B multi-determines A)

KeyA group of one or more attributes that uniquely identifies a row.
A relation has one primary key and may also have additional keys called candidate keys.

Composite Keyis a key that contains two or more
attributes

Normalization
Normalization is a process that assigns attributes (fields) to tables such that data redundancies are eliminated or reduced, thereby reducing the likelihood of data anomalies.
Stages of Normalization (Normal Forms):1NF, 2NF, 3NF, BCNF, 4NF(Ensure that tables are at least 3NF;
higher forms are far less likely to be encountered).

Normalization ProcessObjective: Ensure that each table conforms to the concept of well-formed relations. –Each table represents a single subject–No data item will be unnecessarily stored in more than one table–All nonkey attributes in a table are dependent on the primary key–Each table is void of insertion, update, and deletion anomalies

Anomaly
An undesirable consequence of data modification in which two or more different themes are entered (insertion anomaly) in a single row or two or more themes are lost if the row is deleted (deletion anomaly).
Example
State the deletion and insertion anomalies.
SID Activity Fee
100 Skiing 200
100 Golf 65
150 Swimming
50
175 Squash 50
175 Swimming
50
200 Swimming
50
200 Golf 65

First Normal Form (1NF)
Any table of data that meets the definition of a relation:
• No multi-valued attributes allowed.• No repeating groups.• No two rows can be identical (need a primary
key).• Order of the rows is insignificant.• All entries in a column are of the same kind.• Each column must have a unique name.

Table Not in 1NF

Table Not in 1NF

Order Table Attributes
1. Order ID2. Order Date3. Shipping Date4. Customer ID5. Customer Name6. Shipping Address7. Book 1 Title8. Book 1 Price9. Book 1 Qty
10.Book 2 Title11.Book 2 Price 12.Book 2 Qty
13. Book 3 Title14. Book 3 Price15. Book 3 Qty16. Book 4 Title17. Book 4 Price18. Book 4 Qty19. Book 5 Title20. Book 5 Price 21. Book 5 Qty
(Title, Price, Qty) is a repeating group
Table Not in 1NF

Second Normal Form (2NF)
If it is in 1NF and all its nonkey attributes are dependent on all of the key.
No partial dependencies are allowed.
Partial dependency: Functional dependence in which the determinant is only part of the primary key.

Not in 2NF. Why?
SID Activity Fee
100 Skiing 200
100 Golf 65
150 Swimming
50
175 Squash 50
175 Swimming
50
200 Swimming
50
200 Golf 65

Tables in 2NF

Third Normal Form (3NF)
If it is in 2NF and has no transitive dependencies.
Transitive Dependency: One nonkey attribute functionally depends on another nonkey attribute.
What is the transitive dependency in this example?

Tables in 3NF

Boyce-Codd Normal Form (BCNF)
If it is in 3NF and every determinant is a candidate key.
© 2000 Prentice Hall

Database Systems, 9th Edition 22

Fourth Normal Form (4NF)
If it is in BCNF and has no multi-valued dependencies.
A multi-valued dependency occurs when one key determines multiple values of two other attributes, and those attributes are independent of one another.
Given two independent attributes A and B:
Key AKey B

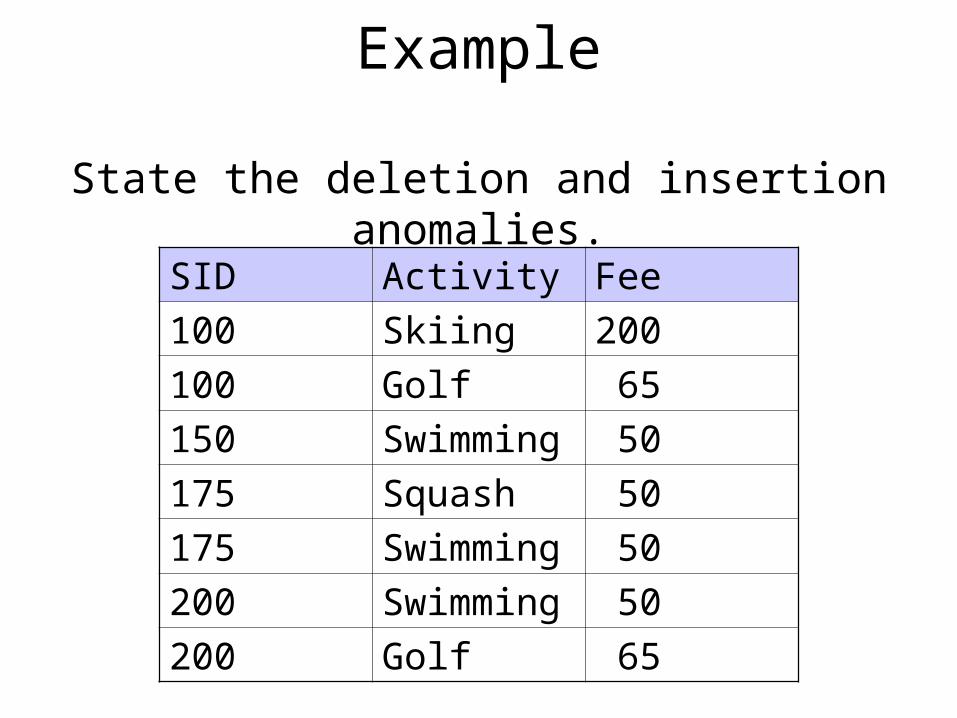
Not in 4NF. Why?
SID Major Activity
100 Music Swimming
100 Accounting
Swimming
100 Music Tennis
100 Accounting
Tennis
150 Math Jogging

Tables in 4NF
© 2000 Prentice Hall

Summary of Normal Forms
• 1NF: Must meet the definition of a relation• 2NF: No partial dependencies• 3NF: No transitive dependencies• BCNF: Every determinant is a candidate key• 4NF: No multi-valued dependencies• 5NF and DKNF: Not covered (of theoretical
interest only)
These normal forms are nested.

Dependency Diagram
A dependency diagram depicts all dependencies found within given table structure
– Helps to get an overview of all relationships among table’s attributes
– Makes it less likely that an important dependency will be overlooked
– The arrows on the top indicate that the Relation is in 1NF; that is, the primary key determines all other attributes.

Database Systems, 9th Edition 28

Solution

Example:Using ER Diagramming and
Normalization TogetherEmployee (Employee Number, Last Name,
First Name, Job Class, Hourly Rate)
In this example, HourlyRate is dependent on JobClass. What is the problem with this table?
Employee Number Last Name First Name Job Class Hourly Rate
11 Smith John Mechanic 20
12 Jones Susan Technician 18
13 McKay Bob Mechanic 20
14 Owens Paula Clerk 15
15 Chang Steve Mechanic 20
16 Sarandon Sarah Mechanic 20
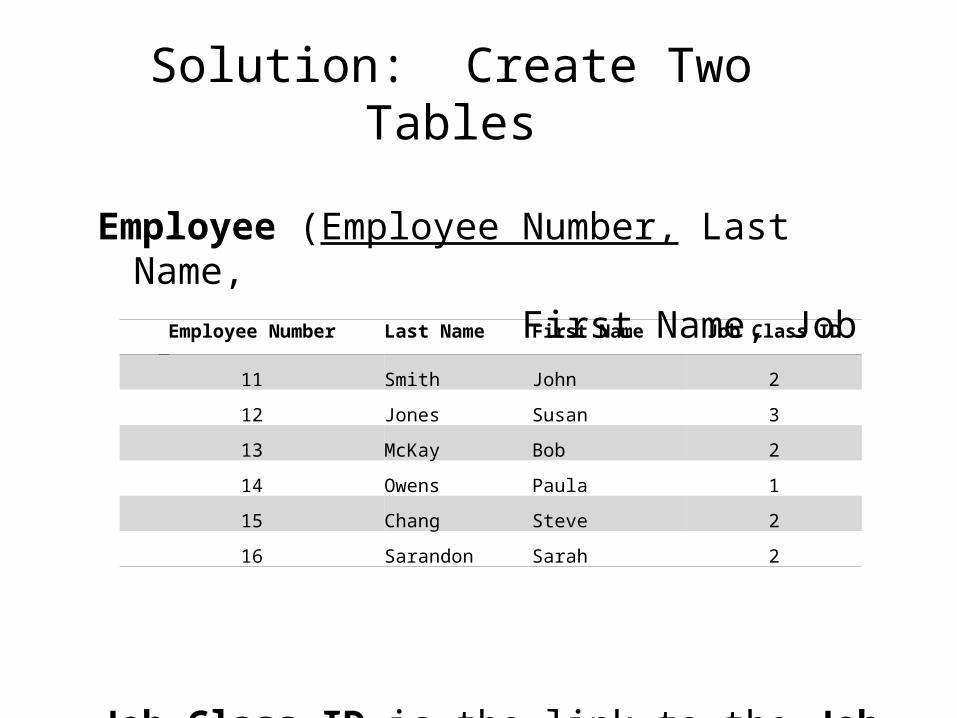
Solution: Create Two Tables
Employee (Employee Number, Last Name,
First Name, Job Class ID)
Job Class ID is the link to the Job Class table.
Employee Number Last Name First Name Job Class ID
11 Smith John 2
12 Jones Susan 3
13 McKay Bob 2
14 Owens Paula 1
15 Chang Steve 2
16 Sarandon Sarah 2
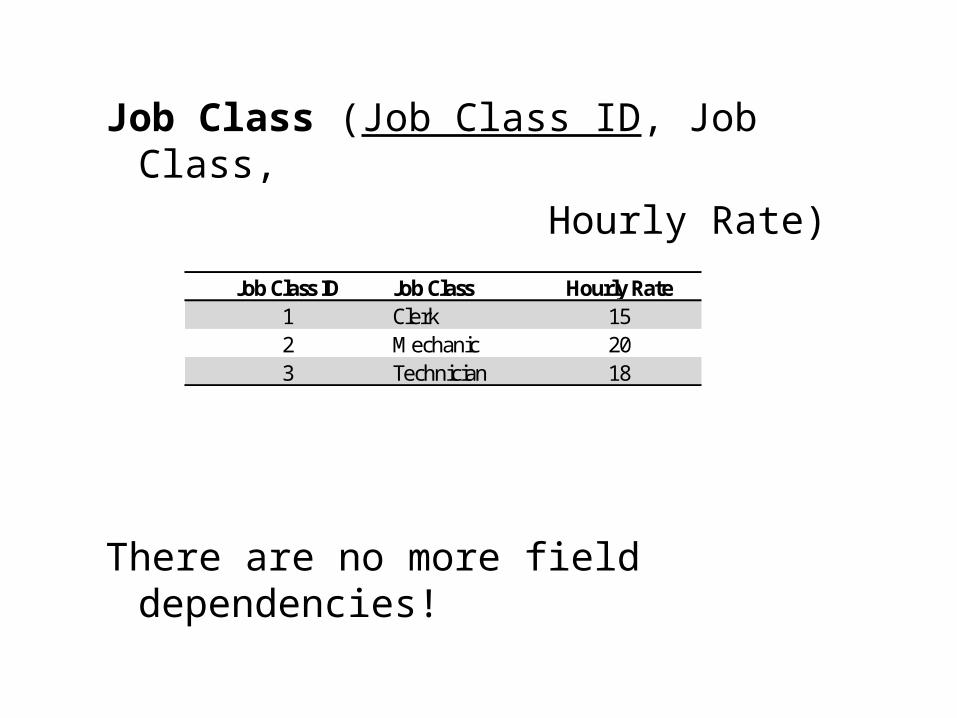
Job Class (Job Class ID, Job Class, Hourly Rate)
There are no more field dependencies!
Job Class ID Job Class Hourly Rate1 Clerk 152 Mechanic 203 Technician 18
De-Normalization
• Sometimes normalization is not worth it. When a table is split into two or more tables, the cost of the extra processing (i.e., joins) may not be worth it.
• Controlled Redundancy: For performance reasons, however, it is sometimes appropriate to duplicate data intentionally.