Embed Size (px)
Citation preview

Directorate-General for Research
WORKING PAPER
The Reform of Taxation in EU Member States
Economic Affairs Series ECON 127 EN

This publication is available in
EN (original)
FR
DE.
At the end of this document you will find a full list of recent Economic Affairs Series Publications.
PUBLISHER: European Parliament
L-2929 Luxembourg
AUTHORS: Centre d'Études et d'Information Internationales (CEPII) Paris.
(Agnès Bénassy-Quéré, Stéphane Dées, Lionel Fontagné, Guillaume Gaulier Arjan Kadareja and Amina Lahrèche-Révil. Scientific advice: Jean-Pierre Laffargue. Research assistance: Stephan Fahr).
EDITOR: Ben Patterson
Directorate General for Research
Economic, Monetary and Budgetary Affairs Division
Tel.: (00352)4300-24114
Fax: (00352)4300-27721
e-mail: [email protected]
The opinions expressed in this working paper are those of the authors and do not necessarily reflect the position of the European Parliament.
Reproduction and translation of this publication are authorised, except for commercial purposes, provided that the source is acknowledged and that the publisher is informed in advance and supplied with a copy.
Manuscript completed in May 2001.

Directorate-General for Research WORKING PAPER
The Reform of Taxation in EU Member States
Economic Affairs Series ECON 127 EN
07-2001


TAX REFORMS
PE 306.075 3
Contents EXECUTIVE SUMMARY...................................................................................................................................7
1. METHODOLOGY ..............................................................................................................................................8 1.1. The impact of tax reforms in a comprehensive macroeconomic framework (Part I) .............................8 1.2. The impact of corporate tax reforms (Part II) ........................................................................................8 1.3. VAT harmonisation and the operation of the Single market (Part III) ...................................................9
2. MAIN RESULTS ...............................................................................................................................................9 2.1. The impact of tax reforms in a comprehensive macroeconomic framework (Part I) .............................9 2.2. The impact of corporate tax reforms (Part II) ......................................................................................10 2.3. VAT harmonisation and the operation of the Single market (Part III) .................................................10
3. POLICY CONCLUSIONS...................................................................................................................................11 3.1. National tax independence versus EU integration ...............................................................................11 3.2. Country size and location.....................................................................................................................11 3.3. The role of firms behaviour ..................................................................................................................12
INTRODUCTION...............................................................................................................................................13
1. FROM THE SINGLE CURRENCY TO TAX HARMONISATION...............................................................................13 2. THE COMMON FEATURES OF THE ONGOING TAX REFORMS ............................................................................13 BOX 1 : AN OVERVIEW OF ONGOING TAX REFORMS IN THE EUROPEAN UNION .................................................14 3. ANALYSING THE CURRENT EVOLUTION OF TAX POLICIES IN THE EU.............................................................15
PART I: THE MACROECONOMIC IMPACT OF TAX REFORMS IN THE EUROPEAN UNION: SIMULATIONS OF A MACRO-ECONOMETRIC MODEL .......................................................................17
I.1. INTRODUCTION ...........................................................................................................................................17 BOX 2: HOW TO SIMULATE A SHOCK ON A TAX RATE ........................................................................................19 I.2. THE IMPACT OF AN ISOLATED TAX CUT.......................................................................................................21
I.2.1. Isolated tax cut in an EMU country ...................................................................................................21 BOX 3: MARMOTTE: A MACRO-ECONOMETRIC MODEL CENTRED ON EUROPEAN COUNTRIES .......................22
I.2.2. Isolated tax cut outside the EMU .......................................................................................................26 I.2.3. General comments..............................................................................................................................27
I.3. THE IMPACT OF A SIMULTANEOUS TAX CUT................................................................................................28 I.4. CONCLUSIONS FOR ONGOING TAX REFORMS ...............................................................................................28 BOX 4: HOW TO APPROXIMATE THE ONGOING REFORMS IN TERMS OF A SIMULATION FOR MARMOTTE ............30 I.5. ADDITIONAL TABLES..................................................................................................................................31
PART II: INTEGRATION OF CAPITAL MARKETS AND CORPORATE TAXATION........................45
II.1. INTRODUCTION..........................................................................................................................................45 II.1.1. Tax co-ordination in Europe in an historical perspective ................................................................46 II.1.2. Our focus ..........................................................................................................................................47
II.2. THE IMPACT OF CORPORATE TAXATION ON THE LOCATION OF FIRMS ........................................................47 II.2.1. The existing literature .......................................................................................................................47 II.2.2. The impact of tax differentials on FDI flows: new empirical evidence.............................................50
II.3. THE IMPACT OF ONGOING TAX REFORMS IN THE EUROPEAN UNION ..........................................................54 II.3.1. The impact of isolated tax reforms....................................................................................................55 II.3.2. The aggregate impact of tax reforms in the EU................................................................................59
II.4. THE FUTURE OF TAX CO-ORDINATION IN EUROPE......................................................................................61 II.4.1. Generalised tax competition .............................................................................................................62 II.4.2. Tax co-ordination policies to avoid costly competition ....................................................................63
II.5. CONCLUSION .............................................................................................................................................66
PART III: INTEGRATION OF GOODS MARKETS AND TAX POLICY � AN APPLICATION TO THE EUROPEAN AUTOMOBILE MARKET ...............................................................................................69
III.1. INTRODUCTION ........................................................................................................................................69 III.2. PRICE DISPARITIES IN THE EU ..................................................................................................................70
III.2.1. The problem.....................................................................................................................................70 III.2.2. Evaluating price disparities within the EU......................................................................................71
III.3. THE IMPACT OF TAXES ON PRICES ...........................................................................................................74 III.4. SIMULATING A TAX HARMONISATION: QUANTITY IMPACTS ...................................................................76

TAX REFORMS
PE 306.075 4
III.5. CONCLUSION............................................................................................................................................80
REFERENCES....................................................................................................................................................81
APPENDIX A: ONGOING TAX REFORMS IN THE EUROPEAN UNION..............................................87
AUSTRIA ...........................................................................................................................................................87 BELGIUM...........................................................................................................................................................87 DENMARK.........................................................................................................................................................87 FINLAND ...........................................................................................................................................................87 FRANCE.............................................................................................................................................................88 GERMANY.........................................................................................................................................................88 GREECE.............................................................................................................................................................88 IRELAND ...........................................................................................................................................................89 ITALY................................................................................................................................................................89 LUXEMBOURG...................................................................................................................................................89 NETHERLANDS..................................................................................................................................................89 PORTUGAL ........................................................................................................................................................90 SPAIN ................................................................................................................................................................90 SWEDEN............................................................................................................................................................90 UNITED KINGDOM ............................................................................................................................................91
APPENDIX II-1: CORPORATE-TAX DISCREPANCIES IN THE EU ......................................................93
1. NOMINAL TAX RATES....................................................................................................................................93 2. EFFECTIVE TAX RATES ..................................................................................................................................94 3. TAXATION AND THE REAL COST OF CAPITAL .................................................................................................96
APPENDIX II-2: TAX DISCREPANCIES AND FDI: ECONOMETRIC METHODOLOGY..................99
CONTROL VARIABLES .......................................................................................................................................99 Market potential ..........................................................................................................................................99 Size of the investing country ........................................................................................................................99 Bilateral openness .......................................................................................................................................99 Difference in market sizes .........................................................................................................................100 Transportation costs..................................................................................................................................100 Dummies....................................................................................................................................................100
POLICY VARIABLES .........................................................................................................................................100 Corporate taxes .........................................................................................................................................100 Exchange rate volatility.............................................................................................................................100
APPENDIX II-3: TAX DISCREPANCIES AND FDI: ECONOMETRIC RESULTS (1985-1995)..........101
APPENDIX II-4: IMPACT OF A GENERALISATION OF THE EXEMPTION TAX SCHEME .........102
APPENDIX III-2 : THEORETICAL FOUNDATIONS OF HEDONIC PRICES......................................104
APPENDIX III-2: DESCRIPTION OF THE DATA SET ............................................................................106
COUNTRIES .....................................................................................................................................................106 CHARACTERISTICS ..........................................................................................................................................106 BRAND (PRODUCERS') MARKET SHARES:.........................................................................................................106 DEFINITION OF THE MARKET SEGMENTS: ........................................................................................................106
APPENDIX III-3: VAT AND PURCHASE TAXES ON NEW VEHICLES IN THE EU, IN 1999 ..........108

TAX REFORMS
PE 306.075 5
Tables and Charts TABLE I- 1. BILATERAL OPENNESS RATE AS A PERCENTAGE OF GDP*.............................................25
TABLE A1: DECREASE IN SOCIAL CONTRIBUTION RATE IN GERMANY BY 5% (PERCENTAGE DEVIATION FROM THE BASELINE) ..............................................................................................................33
TABLE A2: DECREASE IN CORPORATE TAX RATE IN GERMANY BY 5% (PERCENTAGE DEVIATION FROM THE BASELINE) ..............................................................................................................34
TABLE A3: DECREASE IN THE RATE OF HOUSEHOLDS� INCOME TAX IN GERMANY BY 5% (PERCENTAGE DEVIATION FROM THE BASELINE) ..................................................................................35
TABLE A4: DECREASE IN SOCIAL CONTRIBUTION RATE IN THE UNITED KINGDOM BY 5% (PERCENTAGE DEVIATION FROM THE BASELINE) ..................................................................................36
TABLE A5: DECREASE IN CORPORATE TAX RATE IN THE UNITED KINGDOM BY 5% (PERCENTAGE DEVIATION FROM THE BASELINE) ..................................................................................37
TABLE A6: DECREASE IN THE RATE OF HOUSEHOLDS� INCOME TAX IN THE UNITED KINGDOM BY 5% (PERCENTAGE DEVIATION FROM THE BASELINE) .....................................................................38
TABLE A7: DECREASE IN SOCIAL CONTRIBUTION RATE IN THE EURO AREA BY 5% (PERCENTAGE DEVIATION FROM THE BASELINE) ..................................................................................39
TABLE A8: DECREASE IN CORPORATE TAX RATE IN THE EURO AREA BY 5% (PERCENTAGE DEVIATION FROM THE BASELINE) ..............................................................................................................40
TABLE A9: DECREASE IN THE RATE OF HOUSEHOLDS� INCOME TAX IN THE EURO AREA BY 5% (PERCENTAGE DEVIATION FROM THE BASELINE) ..................................................................................41
TABLE A10 : CALIBRATING ONGOING TAX REFORMS............................................................................42
TABLE A11: SIMULATION OF THE ON-GOING TAX REFORMS (PERCENTAGE DEVIATION FROM THE BASELINE) .................................................................................................................................................43
TABLE II-1 TAX SCHEMES APPLIED TO REPATRIATED COUNTRIES IN SELECTED OECD COUNTRIES. .......................................................................................................................................................48
FIGURE II-1. THE TAX SENSITIVITY OF FDI ACCORDING TO TAX SCHEMES ....................................49
TABLE II-2- STATUTORY CORPORATE TAX RATES (IN %) .....................................................................54
TABLE II-3- EFFECTIVE TAX RATES (IN % OF OPERATING SURPLUS).................................................55
TABLE II-4. THE IMPACT OF THE 2000 TAX REFORM IN GERMANY.....................................................57
TABLE II-5. THE IMPACT OF THE ANNOUNCED TAX REFORMS IN DENMARK, FRANCE, ITALY AND THE UK (STATUTORY RATES, 1995)....................................................................................................58
TABLE II-6. THE IMPACT OF THE IRISH TAX REFORM (STATUTORY RATES, 1995)..........................59
TABLE II- 7. THE AGGREGATE IMPACT OF ANNOUNCED TAX REFORMS IN THE EU (STATUTORY RATES, 1995).......................................................................................................................................................60
TABLE II- 8. IMPACT OF COMPETITION/DUMPING ON INWARD FDI (1995) ........................................64
TABLE II- 9. IMPACT ON INWARD FDI OF THE GENERALISATION OF CREDIT SCHEMES IN THE EU (1995) .............................................................................................................................................................66

TAX REFORMS
PE 306.075 6
TABLE III- 1: RESULTS OF THE ESTIMATION OF QUALITY ADJUSTED PRICES.................................73
TABLE III- 2: CORRELATIONS BETWEEN DISPERSION (COEFFICIENT OF VARIATION) AND AVERAGE PRICE ...............................................................................................................................................74
FIGURE III- 1: AUTOMOBILE PRICES, FIRST SEMESTER OF 1999...........................................................75
FIGURE III- 2: IMPACT ON PRICE DISPERSION OF COMPLETE TAX HARMONISATION ...................76
TABLE III- 3: EFFECT OF HARMONISATION ON EU COUNTRIES� AUTOMOBILE PRICES ................76
TABLE III- 4: EFFECT OF TAXES ON CAR SALES AND CAR STOCKS ACROSS EU COUNTRIES, 1999..............................................................................................................................................................................78
TABLE III- 5: TAXES ON CARS ACROSS THE EU IN 1999 (IN PERCENT) ...............................................79
TABLE III- 6: EFFECT OF HARMONISATION ON CAR REGISTRATIONS AND FISCAL RECEIPTS....79
FIGURE AII-1-1: STATUTORY TAX RATE AND WEIGHTED DISTANCE, EU, IN 1995. .........................94
FIGURE AII-1-2: LONG-RUN EVOLUTION OF EFFECTIVE CORPORATE TAX RATES.........................95
FIGURE AII-1-3- EFFECTIVE TAX RATE AND WEIGHTED DISTANCE, OECD, IN 1995. ......................96
TABLE AII-1- 1- BILATERAL COST OF CAPITAL (SUBSIDIARY FINANCED BY NEW EQUITY) FOR SELECTED EU COUNTRIES (1991) .................................................................................................................97
TABLE AII-4-1- IMPACT ON INWARD FDI OF THE GENERALISATION OF EXEMPTION SCHEMES IN THE EU (1995)..............................................................................................................................................103

TAX REFORMS
PE 306.075 7
Executive Summary
In the late 1990s, most European Union members engaged in a process of tax reform which should affect virtually every field of taxation. In most countries, these reforms aim at limiting the disincentive impact of high marginal tax rates on labour, production and investment, and at neutralising the distortions associated with the tax system. Hence, most reforms can be seen as supply-side oriented, aiming at increasing potential growth in the European countries that implement them.
However, given the large and multiple interdependencies that exist between EU Member States, the reforms implemented in each country will probably have external consequences for EU partners. For this reason, they raise the long-standing problem of policy co-operation: the decentralised process of tax reforms may prove inefficient due to the fact that each country neglects the spillover effects of its own programme on its partners. Hence, ongoing tax reforms in the EU may give a new impetus to tax harmonisation.
The tax harmonisation process, which has been reviving over the last decade, is designed to meet different objectives which are still relevant. Historically, its first goal was to facilitate the completion of the Single Market, through the harmonisation of VAT systems, which is one necessary condition for prices to converge across the EU.
The second goal of tax harmonisation is to avoid the negative externalities that can follow an individual tax reform in one country, and which are linked to the strong interdependencies existing between EU countries (through trade, capital flows and monetary policy). More specifically, cutting taxes in one country raises the competitiveness and/or attractiveness of this country relative to others. The resulting flows of goods, capital - and also, possibly, high-skilled labour - is detrimental to partner countries both in terms of economic activity and in terms of tax revenues. Hurt partners may react through cutting taxes too.
Although lower taxes can yield significant efficiency gains, there is a risk that the financing of public goods and social protection will be shifted to the least mobile tax bases, namely labour; or that the production of public goods and the welfare systems will be endangered, especially in those countries where income redistribution, social protection and public goods provision are given a high weight in social preferences.
In brief, a trade-off must be made in the EU between, on the one hand, higher efficiency of markets towards higher growth and, on the other hand, using the tax system to re-distribute income and produce public goods in conformity with the State-specific social preferences. This is, indeed, a crucial political choice. This study tries to quantify such trade-offs; to place the EU's ongoing reforms in this framework; and to make explicit the tools that could be used to implement a commonly-agreed trade-off between market efficiency and tax independence.
Since the reforms being implemented in the EU concern virtually all taxes, the study offers a multidimensional analysis. It starts with a comprehensive, macroeconomic assessment of efficiency gains and redistribution effects associated with tax cuts, and of existing externalities across EU members (Part I). The specific impact of corporate tax reforms on the location of firms in the EU is subsequently studied, and the risk of a �race to the bottom� is discussed (Part II). Finally, the impact of a VAT harmonisation for one remaining derogatory system (the car industry) is analysed in terms of the price convergence in this sector and in terms of loss of State ability to tax (Part III).
TAX REFORMS
PE 306.075 8
1. Methodology The results and policy conclusions of the study are backed by quantitative analyses that differ according to the scope of the analysis (general macroeconomic assessment, or specific corporate tax/VAT analysis).
1.1. The impact of tax reforms in a comprehensive macroeconomic framework (Part I) The tax reforms implemented in the EU mostly concern three instruments: social contributions, corporate taxation and personal income taxation. In most EU countries, these taxes are to be cut, either alternatively, or together. Some of these measures are intended to enhance domestic demand (this is the case for some personal income tax cuts). However, most are supply-side oriented: they aim at reducing existing distortions in the tax systems, as well as limiting the disincentive impact of high marginal tax rates on labour, production and investment. Hence, most tax reforms aim to raise factor supply and potential output.
To investigate the impact of these supply-side oriented reforms, we use the Marmotte macro-econometric model jointly developed by the CEPII and the CEPREMAP. This supply-side model offers both a careful description of EU economies, including significant structural asymmetries, and a comprehensive description of the interactions between EU members as well as with other countries in the world, through trade, capital flows and either the common monetary policy (for EMU members) or nominal exchange rates. The model is run to simulate the impact of different tax reforms in EU countries on various key variables, including production, prices, employment and fiscal balances. The results are compared in relation to the specific tax which is lowered (social security contributions, personal income tax, corporate tax); in relation to the country which implements the reform (EMU versus non-EMU country); and according to what happens in partner countries (simultaneous reform versus isolated reform). Finally, a very rough calibration of ongoing reforms is simulated.
1.2. The impact of corporate tax reforms (Part II) A significant part of the ongoing tax reforms in the EU is devoted to corporate taxation, which is being cut in most EU countries. These measures aim, in the first place, to raise investment and production incentives and, in some cases, to remove existing tax distortions (this is the case in countries where the tax regime for profits is unified � see the German case). However, corporate tax cuts are likely to encompass negative externalities for neighbouring countries, given the increasing mobility of capital in the EU. Hence the risk of tax competition is especially high in the case of corporate taxation.
To investigate the impact of ongoing corporate tax reforms and measure the risk of corporate tax competition, we use an original empirical measure of the tax-sensitiveness of foreign direct investment (FDI thereafter) to tax incentives. More specifically, we estimate a relationship which measures the impact of bilateral tax discrepancies on bilateral FDI flows across OECD countries, accounting for the tax regimes imposed on repatriated profits (credit versus exemption schemes), and controlling for other FDI incentives (such as the natural attractiveness of each country). The equation is then used to simulate the impact of the corporate reforms currently being implemented in various EU countries, and to show the inefficiency stemming from a simultaneous �race to the bottom�. The impact of the tax regimes applied to repatriated profits is subsequently analysed.

TAX REFORMS
PE 306.075 9
1.3. VAT harmonisation and the operation of the Single market (Part III) The issue of tax harmonisation is not only directed to the avoidance of non co-operative actions by EU governments. Indeed, it is also deeply related to the operation of the Single Market, as tax discrepancies (and especially VAT discrepancies) hinder the convergence of prices to a common, EU-level. This problem has added significance in the EMU countries, since nominal exchange-rate movements no longer affect the behaviour of prices.
The harmonisation of VAT was the first measure of this kind, but resulted in only a transitional regime within the EU (the "definitive" VAT scheme is still to come). Given the non-fulfilment of the VAT harmonisation in the EU, there is still some room for examining the impact of tax discrepancies on the operation of the Single market, and the prospects for tax harmonisation.
The automobile market is a very good case for analysing the impact of tax differentials on the operation of the Single Market, as this market operates under a "special regime" (VAT is paid in the country of the purchaser, not in the country where the purchase has occurred) and with very different sales taxes. This makes possible an examination of the extent to which post-tax prices have converged, the strategy of producers in terms of pre-tax prices, and the potential consequence of a tax harmonisation on sales prices and volumes.
One of the main difficulties in analysing price convergence lies in the availability of prices in markets where differentiation strategies leaves little room for the comparability of the products. As a first step, comparable prices are calculated using the hedonic price method1, and the impact of taxes is measured. The impact of a complete harmonisation of taxes is then simulated both on prices and on sales.
2. Main Results
2.1. The impact of tax reforms in a comprehensive macroeconomic framework (Part I) As far as medium-term supply effects are concerned, any tax cut (either on social security contributions, personal income or corporate taxes) ends in higher production in the reforming country. The major difference between tax tools is the impact on the relative use of capital and labour, as these tax instruments differently affect the relative cost of factors. Despite the rise in output, tax cuts create a sizeable fiscal deficit which could prove inconsistent with the Stability and Growth Pact requirements (although demand stimulation, not accounted for in the model, alleviates the negative impact on fiscal balances in the very short run). Despite the difficulties in meeting Pact requirements in the short and medium run, a rise in tax revenues or a cut in public spending needs to be implemented in the long run. The Marmotte model shows that efficiency gains are preserved if the compensatory tax increase or spending cut is lump-sum, i.e. if it does not introduce new distortions in suppliers' incentives (but it should be noted that such lump-sum reform is difficult to implement in practice).
1 Hedonic prices, as defined by Rosen (1974), are equilibrium prices on the market for particular characteristics.

TAX REFORMS
PE 306.075 10
As expected, tax cuts in one country hurt the economy of partner countries. This is because a tax cut allows prices to decline in the reforming country relative to its partners. The impact of tax cuts is shown to depend on the reforming country's membership of EMU: in this case, the adjustment of the real exchange rate falls on prices, whereas for non-EMU countries the nominal exchange rate depreciates relative to non-reforming countries. The size of the reforming country is also relevant: while large countries are not much affected by the externalities from small countries, the reverse is not true for small countries, which are negatively affected by a tax cut in a central EU country.
As a consequence, large countries are relatively indifferent between cutting taxes alone or doing it at the same time as other EU countries. But this is not the case for small countries, where it is no longer worth cutting taxes if other EU countries do the same. Hence, small countries have more incentive to cutting taxes more than large countries, which could show up as an impediment to the implementation of tax co-operation.
2.2. The impact of corporate tax reforms (Part II) The empirical analysis of foreign direct investment shows that firms do react to tax discrepancies when deciding their location: a tax cut in one country attracts FDI to this country, at the expense of other countries. However the location of production is also highly dependent on geography and on agglomeration effects. This means that a �central� country like Germany could keep its corporate tax rate above that of �peripheral� countries such as Ireland without distorting incentives for firms. Nevertheless each country has an incentive to lower corporate taxes below the level that would be consistent with its natural position. This could end in a simultaneous �race to the bottom� where no country would be able to attract more FDI from EU partners whereas the financing of public spending would be shifted to less mobile bases.
The various countries of the EU may not make the same trade-off between efficiency on the one hand, equity and the provision of public goods on the other hand. A way of respecting each country�s social preferences would be to generalise the credit scheme already applied to repatriated profits in the UK and in Ireland. This scheme allows repatriated profits to be taxed according to the law of the mother firm, hence removing tax incentives to locate abroad. Such a reform would yield a one-shot cost in low tax countries, and it would hurt �peripheral� countries which could no longer attract foreign capital through low taxes. However it would preserve at least part of the ability of each country to tax profits differently from its neighbours, while avoiding endless discussions on the way of harmonising both tax rates and tax bases.
2.3. VAT harmonisation and the operation of the Single market (Part III) By affecting the behaviour of producers, tax discrepancies can lead to market inefficiencies, and to unequal treatment of consumers, with potential losses of welfare across the EU.
The calculations made in the case of the car industry show that higher tax rates tend to lower pre-tax, quality-adjusted prices, hence that producers' mark-ups absorb part of the taxation. Indeed, pre-tax prices tend to be less dispersed than post-tax prices, suggesting that the lack of harmonisation introduces inequality between the consumers of various EU countries.
However, the strategy of firms strongly depends on the market segment under consideration, as the geographic dispersion of pre-tax prices is lower for the most expensive market segments. This suggests that consumers of the highest quality segments are able to arbitrate between markets, forcing a convergence in pre-tax prices which is not so for lower-quality segments.

TAX REFORMS
PE 306.075 11
A harmonisation of tax rates in remaining derogated sectors will sooner or later come on the European agenda. Such a co-ordinated move towards harmonised tax rates would significantly reduce the discrepancies that are currently observed between domestic prices, promoting convergence both of pre-tax and post-tax prices. The simulations also show that such harmonisation would have an impact on car sales in the EU, and therefore on tax revenues.
The simulations on car sales and tax revenues underline the issues that are traditionally at the heart of the discussions on tax harmonisation. On the one hand, tax harmonisation would increase the efficiency of the market: firms would no longer be able to discriminate, and the corresponding surplus would be shifted to the consumers. On the other hand, harmonisation would lead some countries to cut VAT or sales taxes, at the very time when such taxes were used as an environmental policy tool; and they would no longer be able to use VAT and miscellaneous taxes to meet their State-specific social preferences.
3. Policy conclusions A set of conclusions arise from this study, which allows for a political economy analysis of the ongoing tax reforms and of future issues.
3.1. National tax independence versus EU integration In a highly integrated area such as the EU, a trade-off arises between efficiency on the one hand, and fairness and the provision of public goods on the other hand. Lower taxes (as an outcome of tax competition, for instance) are consistent with the first objective at the expense of the second. Higher taxes (resulting from tax harmonisation, for instance) favour the second goal at the expense of the first.
However the various EU Member States may not want the same trade-off, due to differing social preferences, or to natural characteristics. This makes tax harmonisation difficult: agreeing on a minimum tax rate (either statutory or effective) could make tax rates converge to this bottom rate, and national fiscal policies would have to conform to the median social preferences of EU members.
The study illustrates the importance of this problem in various ways. Part I shows that tax cuts indeed lead to sizeable efficiency gains, but that they must be compensated sooner or later by tax rises or by spending cuts. Part II highlights the importance of the tax scheme applied to repatriated profits to enhance (exemption scheme) or reduce (credit scheme) the scope for corporate tax competition: the generalisation of exemption schemes would give more impetus to tax competition, while the generalisation of credit scheme would give back some policy independence to national governments. Finally, Part III underscores the efficiency gains that would stem from harmonising VAT and miscellaneous sales taxes in a specific sector (the car industry), at the expense of independent national tax policies (in this sector, taxes sometimes aim at discouraging the use of cars for ecological purposes).
3.2. Country size and location The study also highlights the importance of size and location asymmetries for designing tax co-operation among EU members.

TAX REFORMS
PE 306.075 12
From Part I, it clearly appears that small countries have a stronger incentive than large ones to cut taxes alone, or to cut taxes more than their neighbours. This is because similar cuts in partner countries have a strong negative effect on them that compensates for the positive efficiency effect of domestic cuts. The ongoing process of reforms might therefore be less favourable to small countries, as they implement their own reforms together with a set of big countries like Germany or France. Small countries could subsequently feel an incentive to further tax cuts, which could trigger tax competition. Conversely, they should be interested in a harmonisation of taxes which would end in a co-ordinated rise in taxes (little macroeconomic losses, more fiscal room of manoeuvre).
Conversely, large countries can be indifferent to what happens elsewhere, since their relative autarky isolates them from the consequences of tax reforms elsewhere. Consequently, they should normally not take a lead in tax competition. Moreover, they will not have much incentive to take a lead in tax harmonisation either.
Part II delivers a complementary message. It shows that �small� or �peripheral� countries need lower corporate taxes than �large� or �central� ones to attract capital. Hence, any harmonisation process should allow for some tax discrepancies to exist, consistent with discrepancies in attractiveness. However such harmonisation would be difficult to implement, because each country would feel an incentive to lower taxes beyond their �normal� level.
3.3. The role of firms behaviour At a more micro-economic level, this study also sheds light on the efficiency of tax policies in a situation where economic agents act strategically. It shows that the strategies of agents turn into inefficiencies in tax policy.
Indeed, the mobility of firms magnifies the sensitivity of FDI to corporate tax discrepancies; this is demonstrated in Part II. Such sensitivity offers incentives for tax competition, which, we argue, could be circumvented by the establishment of credit schemes in the EU. The strategic location choices by multinationals could then be limited, if not avoided. This would be made at the expense of a common policy in the EU, which seems very difficult to implement as long as the mobility of firms increases the incentives for governments to cut taxes.
Along the same lines, Part III examines the case of a goods market where the tax system relies on the payment of taxes in the country of the purchaser. Such a system preserves the independence of national governments in the setting of tax rates. In this case, governments can pursue environmental objectives. But here too, the strategic behaviour of firms introduces inefficiencies, as firms use this market segmentation to discriminate between markets.
Hence, in both cases, strategic action by firms introduces elements of inefficiency in the operation of national tax systems. One of the interesting aspects of this study is to underline two instances of such a game between firms and governments. Curing the negative effects of such situations (through competition policies for instance) is however beyond the study's scope.

TAX REFORMS
PE 306.075 13
Introduction
1. From the Single currency to tax harmonisation Since the 1990s, a wind of tax reforms has been blowing through the European Union. It started in Spain, where some reforms began as early as 1995, and spread to most other Member States, including Germany, which launched an ambitious reform in the summer of 2000. In most countries, theses reforms aim at reducing the disincentive impact of high marginal tax rates on labour, production and investment, and neutralising the distortions associated with the tax system. Hence, although income-tax cuts were introduced in various countries, most reforms can be seen as supply-side oriented, aiming at increasing potential growth in the European countries that implement them.
Although motivated by domestic concerns, these reforms arise in a situation where European countries have attempted since the early 1990s to co-operate on taxation issues. Strikingly, the needs for tax co-operation today are very similar to the reasons for the creation of Economic and Monetary Union in the 1990s. At the end of the 1980s, it appeared that a single currency would be needed on two grounds: first to ease the completion of the Single Market by eliminating the impediments to trade embodied in exchange rate volatility; and second, to make impossible the potentially harmful effects of competitive devaluations.
The same kinds of arguments are called today in support of tax harmonisation. It was already clear at the beginning of the 1990s that discrepancies in tax rates produced impediments to the completion of the Single Market, since they prevented the convergence of prices in the European market. This was one of the rationales of the attempt to harmonise VAT. But it also quickly became clear that, having dropped their national monetary policy tools, EMU members could use taxes more actively as an instrument of economic policy. More specifically, competitive tax cuts could replace former competitive devaluations.
Of course, tax cuts and devaluations are not perfect substitutes, for two main reasons. The first is that only the former affect the real economy in the long run. The second is that the scope for tax cuts is reduced by the Stability and Growth Pact. However, given the recent recovery of aggregate demand in the EU, these two characteristics have encouraged tax cuts which are expected to raise production capacity without incurring deteriorating fiscal balances.
Hence, tax co-operation can be viewed as the next step after the creation of the euro for reducing both impediments to the completion of the Single Market and the scope for non co-operative behaviours in this highly integrated area.
2. The common features of the ongoing tax reforms A brief overview of ongoing tax reforms in EU Member States (see Box 1 and Appendix 1) leaves the impression that the timing and goals of these reforms is very similar. However it must be stressed that they stem from non co-operative moves.
Germany has launched one of the most ambitious tax reforms; but, with the exception of Finland which has raised the corporate tax rate, all Member States aim to reduce the tax pressure on firms as well as on labour. Supply-side measures, such as a negative income tax or refundable tax credits for modest incomes, have been introduced. The reforms have had four major objectives.

TAX REFORMS
PE 306.075 14
♦ The first has been to enhance the neutrality of national tax systems, i.e. to reduce existing distortions which can make the allocation of resources inefficient. Cuts in social security contributions, reforms in the personal tax systems or in the corporate tax systems (such as the suppression of the distinction between distributed and reinvested profits) can be viewed as part of this objective.
♦ The second objective has been to increase the fairness or the redistribution of national tax systems, in accordance with the principles established by the European Union, that labour should not be overtaxed and capital under-taxed. Generally speaking, these reforms do not end, however, in higher corporate taxes; but most European reforms include a reduction in top and entry income tax rates, or some kind of negative taxation for the most modest households.
Box 1 : An overview of ongoing tax reforms in the European Union
♦ Reduction in the corporate tax rate in Belgium, Denmark, France, Germany, Italy, Luxembourg, the Netherlands, Portugal, the United Kingdom. Rise in Finland
♦ Introduction of reduced rates for SMEs in France. Removal of VAT for SMEs in the UK.
♦ Broadening of the corporate tax base in Austria, Denmark, Germany. Eligibility of intangibles (such as know-how, brand recognition, customer base) for amortisation in the calculation of the taxable profit in Belgium.
♦ Reduced taxation of capital gains in Germany; increase in Portugal and Sweden.
♦ Reduction in social security contributions in Belgium, Finland, Germany, Greece, Italy, the Netherlands, Spain. Cuts in selected social contributions rates in Ireland and Sweden (self employed).
♦ Reduction in VAT on labour intensive services in Belgium, Greece, Italy, Luxembourg, Portugal, Spain.
♦ Income tax reform, noticeably by reducing top/entry rates in Austria, Belgium, Finland, France, Germany, Ireland, Italy, Luxembourg, Portugal, and the United-Kingdom. For families with children in Greece and the United Kingdom. Rise in income tax thresholds in Sweden.
♦ Introduction of a refundable tax credit for individuals with modest incomes in Belgium; introduction of a negative income tax for labour in France. Tax credits for firms hiring adult long-term unemployed in Italy. Employment tax credit to be introduced in the United Kingdom.
♦ Rise in miscellaneous duties generally aiming at taking benefit of a double-dividend policy (soft drinks, tobacco, electric light bulbs) in Denmark. Increase in energy taxes in the Netherlands.
♦ Creation of a withholding tax of 25% on dividends distributed to a parent company located outside the EU in Denmark. Reform of the exemption regime for direct investment dividends received by Finnish companies from abroad. In discussion in the Netherlands, the replacement of the exemption scheme applied to repatriated profits from foreign subsidiaries to a partial credit scheme, for passive EU companies (provided the shareholding is of 5% or more). Provisional withholding tax of 25% on dividends or profits paid by subsidiaries to their foreign parent, in case of a minimum 25% participation in the capital of the subsidiary in Portugal. Agreement on a number of new double taxation treaties in Austria.

TAX REFORMS
PE 306.075 15
♦ The third objective has been to raise potential output through increased incentives to work and to invest. This objective is complementary to the second as far as lower-skilled workers are concerned, since lower marginal taxation for low-paid workers should both encourage labour supply and labour demand, and reduce the so-called �poverty trap�. Reduced social security contributions for low wages, and reduced VAT on labour-intensive activities follow this rationale.
♦ The final objective of the ongoing tax reforms is to increase the international attractiveness of national economies, which is mostly done by cutting corporate tax rates, but also by cutting taxes on labour.
3. Analysing the current evolution of tax policies in the EU Is it possible to reach these various and potentially conflicting objectives simultaneously? How does the integrated nature of the EU affect the trade-off? Three kinds of question arise from the ongoing European process:
♦ Will tax reforms increase the efficiency of production in the EU? What will be the cost of this process? What is the trade-off between higher efficiency on the one hand, fiscal balance and the respect of social preferences on the other hand?
♦ How do independent policies at the national level impact on partner countries? Do �small� or �peripheral� countries face the same incentives and constraints as �large� or �central� ones? Will ongoing reforms trigger tax competition, and raise the risk of an unfair shift of the tax burden to non-mobile revenue-earners? What kind of co-ordination can be considered?
♦ How do tax policies interact with the building of the Single Market? These questions are raised throughout the three parts of this report.
A comprehensive assessment of the efficiency gains associated to tax reforms and of macroeconomic tax externalities across EU members is provided in Part I. Simulations are performed with the Marmotte model, elaborated jointly by CEPII and CEPREMAP. Marmotte provides a comprehensive macro-econometric framework for studying the impact of tax reforms in the country where it is implemented and in partner countries. In addition, this model offers detailed supply-side mechanisms which are at the centre of ongoing reforms. Hence, the model is perfectly suited for measuring efficiency gains as well as the distribution of the gains across labour and capital. It also makes possible an assessment of the various forms of interdependence (through trade and through monetary policy) between EU Member States which are at the root of co-operation problems.
Finally, orders of magnitude concerning the impact of the reforms in terms of fiscal balances can also be provided. In brief, the simulations can be used to assess how ongoing reforms modify the trade-off between efficiency and the implementation of State-specific social preferences.
Part II deals with the specific impact of corporate tax reforms on the location of firms in the EU. Macro-econometric models do not account for interdependence through foreign direct investment. However, the main concerns about tax competition arise when the tax base is highly mobile, and therefore mostly concern savings and capital taxation. We focus on capital taxation because the implications in terms of growth and employment for each country involved in the competition are larger than for taxes on savings, and because ongoing reforms also focus on corporate taxation.
TAX REFORMS
PE 306.075 16
Having measured the impact of corporate taxes on the location of firms, we simulate the impact of various reforms and assess the risks associated with tax competition on corporate taxes in the EU. Measures aiming at limiting double-taxation are shown to be of great importance for tax competition, and we propose concrete steps towards neutralising the bulk of this competition, i.e. towards preserving some independence in the choice of corporate taxation consistent with member-specific social preferences.
Part III is devoted to the study of tax impediments to the completion of the Single Market. Indeed, taxation, and especially consumption taxation, is a significant element of the Single Market completion, as tax differences can limit the effective convergence of prices in the EU, and as differing taxation schemes can introduce barriers to the international operation of firms. The harmonisation of VAT systems from the beginning of 1993 partially tackled these issues by implementing a partial harmonisation of tax rates and a harmonisation of most VAT systems. As a consequence, the VAT cuts that are scheduled in the ongoing tax reforms fit into a harmonised VAT system.
However the harmonisation of VAT systems has not yet been carried out in some EU markets. This is the case in particular for the automobile market, where a "special regime" is in operation. This situation has ambiguous effects in the twin prospect of tax co-ordination and Single Market completion.
On the one hand, the derogated system, defined by the fact that VAT is paid in the country of the purchase (as opposed to the origin principle), allows for greater taxation autonomy for governments, and provides them with an economic policy tool, which can be seen as a positive situation.
On the other hand, tax rate discrepancies are huge in the automobile market. This introduces unfairness as far as the welfare of consumers is concerned. This is also a source of inefficiency, as the strategic response of firms is to reduce mark-ups where taxes are important: the system allows firms to discriminate across markets.
Although this issue is not directly included in the ongoing tax reform process, it will probably come back to the European agenda, as it one of the latest impediments to price convergence. Part III of the Report examines the impact of potential VAT (and other specific taxes) harmonisation in the automobile market.

TAX REFORMS
PE 306.075 17
Part I: The Macroeconomic Impact of Tax Reforms in the European Union: Simulations of a Macro-econometric Model
I.1. Introduction The tax reforms that were recently announced or implemented in EU countries will affect all aspects of national taxation. Indeed, these reforms should affect the taxation of personal income, of corporate income, and of labour, mostly through reforms on social security contribution (see the general introduction and Appendix A of this study). While some of these can be assimilated as a way of increasing the purchasing power of households (e.g. reforms of personal income taxation), most are supply-oriented. Lowering taxes on capital or social security contributions should reduce firms� costs, and should increase investment and employment. The implementation of tax credits for low-income households is also a way to reduce poverty traps that appear in complex welfare systems. In this case, labour supply is expected to increase. Finally, the outcome of most of these tax reforms is expected to be an increase in potential output (European Commission, 2000, Chapter IV).
Given the very large scope of these reforms, it is highly likely that they will have a rather complex impact on both national economies and on EU economic behaviour as a whole. Indeed, while a single reform in an individual country can reasonably be forecast, the cumulative effect of various reforms in various countries will be much less clear-cut, both in individual countries and in the region as a whole.
The reasons are twofold. First, joint tax reforms affect several relative prices (or costs) in an economy, while a single tax reform only affects the relative price of one factor of production. Secondly, European countries are interdependent (through trade, and through the sharing of a single currency for euro area members), so that a tax change in one country can have feedback effects on its partners. Hence, assessing the macroeconomic consequences of tax reforms at a global level requires the explicit specification of these interactions between countries. In this context, macro-econometric models can prove very valuable. In a world characterised by distortions (related to taxation or nominal rigidities), it is also impossible to study such problems through a purely theoretical model. The solution is therefore to simulate the reforms with a macro-econometric model.
In Part I of this study, we use the macro-econometric model Marmotte, developed jointly in the CEPII and the CEPREMAP, to provide some insights into the tax reforms in Europe in terms of the sustainability of these measures and of their effects on product and labour markets. The version of Marmotte used in this study contains 11 modelled countries: 7 EMU members (Germany, France, Italy, Spain, the Netherlands, Ireland and the Economic Union of Belgium-Luxembourg), 2 European countries that are not members of the EMU (the U.K. and Denmark), Japan and the US2. As Marmotte integrates detailed models for each European country, it is likely to be a good tool for assessing how EMU can influence the transmission of tax measures across all the European countries.
Asymmetries in size are also taken into account. In the context of tax competition, this feature is of considerable importance, since countries of different sizes have different incentives to engage in tax competition.
2 The complete version of Marmotte is made up of 17 countries (Austria, Canada, Finland, Greece, Portugal and Sweden are also modelled). In the present study, these 6 remaining countries are brought together in the rest of the world. This grouping was done in order to introduce some consistency between Part I and Part II.

TAX REFORMS
PE 306.075 18
There is another feature of the Marmotte model that makes it a good candidate model for assessing the impact of tax shocks in the EU: the model formalises the supply-side. As tax reforms are mostly supply-side oriented, they are best simulated and analysed using a model where the behaviour of the supply-side of the economy is properly described. For this reason, the outcome of the model should be considered a satisfactory tool for estimating the medium-to-long run consequences of tax changes in the EU.
The model has been used to simulate different shocks. We have envisaged three kinds of shock: a permanent cut in
• the social contribution rate; • the corporate tax rate; and • the income tax rate paid by households.
For each kind of shock, three simulations were run. In the first, a tax decrease occurs only in a member of the euro area, Germany. In the second, it occurs in a European country which is not a member of the EMU, the United Kingdom. Finally, we have simulated the case in which all the EMU-members decrease their tax rate.
For all these shocks, we have simulated a 5% decrease in the corresponding tax rate. For instance, a decrease by 5% in the social contribution rate in Germany would lead to a fall in the effective rate from 25% to 23.75%. Higher tax rates are assumed to fall more in percentage points than low rates, leading to a downward convergence (see justification in Box 2). This is indeed what is being observed in the EU. We need to understand their transmission across the European countries and the size of their effects on the main macro-economic variables.
A final simulation concerns the aggregate effects of the ongoing tax reforms. Several assumptions have been made to calibrate the current or proposed tax reductions in terms of shocks able to be simulated by the model. Even if this simulation is not easy to interpret, it offers some insights of the effects in the medium-long term of the most likely tax measures.
The framework of the model assumes an economy in which agents optimise their behaviour and form rational expectations. This modelling links the short term (characterised by multiple rigidities) to the long term (towards which the economy converges).
The model is then based on three principles:
• the optimising behaviour of agents; • rational expectations; and • the identification of structural rigidities.
Firms maximise the present value of their cash flows in the framework of a putty-clay production function. Households maximise the discounted sum of their utilities at each period under their inter-temporal budget constraints. In Marmotte, most taxes distort in the sense that relative prices are distorted, leading to an inefficient allocation of resources. Hence, reducing taxes raises output. However, the model deals with the financing of tax cuts by progressively compensating the cut in the distorting tax by an increase in a lump-sum tax.
Marmotte is well-suited to investigate the domestic and cross-country consequences of tax changes. However, as far as the issue of tax competition is concerned (and since corporate tax rate cuts, which are frequently suspected of being led by tax-competition, will be analysed), it should be borne in mind that the macro-econometric model cannot be used to gauge normative issues concerning tax competition.

TAX REFORMS
PE 306.075 19
Indeed, Marmotte does not assume that public goods and services enter the utility function of households. It cannot therefore investigate the Tiebout argument3 that households compare the benefits of public goods to the costs of taxes in determining the optimal level of tax rates, which are anyway likely to differ across countries.
Box 2: How to simulate a shock on a tax rate
There are two ways to simulate a shock on a tax rate: by changing the tax rate by a percentage of its value or by reducing (or increasing) it by a percentage point. This box aims at showing that the choice is not neutral on the results of the simulation, especially for the sake of comparison across countries, and provides a justification of the choice made in the present study.
Percentage shock
In this case, one multiplies the tax rate (x0) by a factor (a). For example, a decrease by 5 percent of the social contribution rate leads to multiply x0 by 0.95 (1-0.05).
Let us compare the effect of the shock on the real wage.
The new real wage (Wa) is equal to the pre-shock wage (W0) times the change in the tax factor:
0
00 1
1x
axWWa +
+=
The change in the real wage (Wa/W0) can be written as follows:
( )1lnln 00 −≈−=∆ axWWw aa ,
i.e. the initial social contribution rate times the change in percentage.
If one simulates the same shock in a second country (characterised by a star), one has similarly:
( )1lnln *0
*0
** −≈−=∆ axWWw aa
If one wants to compare the effects of the shock between the two countries:
( )( )1*00
* −−≈∆−∆ axxww aa
The size of the shock is not identical in the two countries; it is larger in the country with the highest initial tax rate.
Percentage point shock
In this case, one adds to the tax rate the percentage point change (b). For example, a decrease by 5 percentage point of the social contribution rate leads to subtract 0.05 to x0.
The previous example on the effect of the shock on the real wage becomes (with b = -5):
0
00 1
1x
bxWWb +
++=
3 For more details, see Tiebout (1956).

TAX REFORMS
PE 306.075 20
The change in the real wage (Wb/W0) can be written as follows:
bWWw bb ≈−=∆ 0lnln
Similarly:
bWWw bb ≈−=∆ *0
** lnln
And the effect of the shock between the two countries is equal to zero:
0* ≈∆−∆ bb ww
The size of the shock is identical in the two countries.
Conditions to find an equivalent percentage shock
If, in the first case, the percentage change (a) is equivalent to a percentage point change (b), then a is equal to:
( )0
0 11xbabax +=⇔=−
In this case, to have an equivalent shock abroad, the percentage shock must be equal to
*0
* 1xba += ,
which is different from a.
Justification of the method used in the present study
The second method (as a percentage point) rests upon the linear approximation of the percentage change by the logarithm difference. However, the approximation is valid only if (x0) is low, that is not the case here. For this reason, we have chosen the first method (as a percentage). It is justified for the present case since the study is in keeping with a process of converging tax rates.
Similarly, as there are no external economies between firms which are located in proximity to one another, we cannot investigate the thesis advanced by Baldwin and Krugman (2000): that firms can be taxed more highly in the centre of Europe, where they have a strong inducement to locate, than in its periphery. (This argument could be used to derive the optimal tax rate in each economy, taking into account its natural attractive force).
Marmotte assumes that labour cannot migrate from country to country. But labour supply is sensitive to taxation, because of arbitrage between labour and leisure, and because the result of bargaining between trade unions and firms is sensitive to the taxation of labour. Financial capital can flow easily from country to country.
Things are more complicated for physical capital. The imperfect substitutability between goods limits the mobility of capital between countries. Thus, we can see that Marmotte does not deal properly with the problem of industrial relocation (see Part II).
TAX REFORMS
PE 306.075 21
However, the market for goods is in perfect competition: firms have no rent, related to a particular localisation for example, which simplifies the problem of the mobility of capital. In conclusion, even if the mobility of capital is imperfect in Marmotte, capital is much less fixed than labour, but labour can avoid taxes by flying to unemployment or inactivity (see Box 3 for details).
This part is organised as follows. Section 2 presents the results of the simulations when the shocks occur in an EMU-member country. These results are then compared to the case of a reform implemented in a non-member country. All these simulations refer to the case of an isolated reform: only one country implements a tax reform. The second section comments on the results corresponding to a simultaneous decrease in tax rates inside the EMU. It provides some evidence for assessing whether simultaneous tax cuts are better or not for European countries as a whole. The final section provides some concluding remarks concerning the ongoing tax reforms.
I.2. The impact of an isolated tax cut
I.2.1. Isolated tax cut in an EMU country The first simulation implemented concerns a decrease of 5% in a tax rate in Germany. All the other countries keep their tax rates unchanged. Germany can then be considered as the origin of an isolated shock. The results are displayed in Table A1 for the shock on social contribution rates: in Table A2 for the shock on corporate tax rates; and Table A3 for the shock on the households� income tax rates. The results are in percentage deviation from the baseline, except trade balance and budget balance (as a percentage of GDP), and real interest rates (difference). The results for Germany are commented on first, the effects on the other countries being analysed thereafter.
What are the benefits for the country where the reform occurs? Let us first consider the decrease in the social contribution rate. The benefits of this measure are shared between firms and workers: the real cost of labour decreases and the real wage rate increases. These movements increase labour demand and labour supply, so employment increases permanently by 0.4%. The change in employment implies an equivalent increase in production which in turn leads to an opposite move of prices: the higher supply of German goods decreases its price relative to foreign goods. This is realised via both a decrease in price level and a depreciation in the nominal exchange rate of the euro4. To face the increase in production, firms need to create new production units by investing more in the short run. Investment increases by 1.9% immediately5.
In the long run, the effect on GDP is equal to +0.4%. In the short-term, the strong rise in investment is balanced by a negative move in consumption and the trade balance. The decrease in consumption is due to an increase in the real interest rate. This results from the deflation process initiated by the decrease in German production price in a context where the nominal interest rate is set by the ECB.
4 As the nominal wage is partly indexed on past prices, the decrease in the production price raises the real cost of labour for one year. 5 Of course, the new production units are more labour intensive than before.

TAX REFORMS
PE 306.075 22
Box 3: MARMOTTE: A macro-econometric model centred on European countries
MARMOTTE is the multi-country model of CEPII, built with the collaboration of CEPREMAP. This is an annual model focusing on the medium-term. It considers that agents optimise inter-temporally and have rational expectations. It includes detailed models for the European economies to permit study, in particular, of the structural differences between these countries and the consequences for the EU economic integration process.
General Philosophy of Marmotte Marmotte is close to the models of the IMF (Multimod Mark 3) and the European Commission (Quest 2). Like these models, Marmotte has a strong theoretical background. However, Marmotte is not as pure as Real Business Cycle models, and some market imperfections have been introduced in some equations (e.g. in the consumption function, we have included households� disposable income to account for liquidity constraints and the past level of consumption to account for habit formation).
Each equation has the same structure whatever the country. It has been estimated econometrically on panel data. In a preliminary estimation, we assumed that all the parameters were the same across countries, Then, progressively, we have relaxed this restriction and tested it. As a result, we have retained differences across countries only when they have been justified statistically.
Brief description of the model behavioural equations a) Supply
The production function is a putty-clay form, i.e. capital can be substituted for labour only in the long run. In each period, a new vintage of capital is installed. The capital-labour ratio, chosen in the technological menu available then, remains unchanged until the firm decides to scrap this vintage. This capital-labour ratio is determined so that the present value of marginal capital productivity, over the expected lifetime of this new unit, equals its instalment cost.
The expected lifetime of a new unit depends on its expected profitability. In each period, the profitability of every vintage unit of capital, inherited from the past, is reassessed, and the unprofitable units are scrapped. Labour and investment demands are derived in a consistent way and their costs are simultaneously taken into account.
b) Wage curve (labour supply)
The wage curve, which defines labour supply, links the real wage per effective unit to the wedge (reflecting the spread between the purchasing power of the wage for the worker and the effective labour cost to the firm) and to the employment rate, which accounts for the effect of labour market conditions on wage bargaining. Nominal rigidities, coming for example from multi-period wage contracts have been implemented in the model by adding an inflation term to the real wage equation.
c) Consumption
There are two types of consumers in the economy. The first faces liquidity constraints; its consumption is entirely dependent on its current income. The second type corresponds to a representative agent choosing his consumption path in order to maximise the expectation of the discounted sum of instantaneous utilities under his inter-temporal budget constraint.
The utility function is assumed to be time-separable, but lagged consumption enters the current utility. Hence, we account for the habit formation of the consumer. The interest of such a model is that it introduces some stickiness into consumption, which becomes less sensitive to unanticipated shocks.
d) Foreign trade

TAX REFORMS
PE 306.075 23
For each country, we have computed three indicators: world demand for this country; the price of the competitors on export markets; and import prices. This implies weighted sums that account for bilateral trade flows. The trade equations are traditional: they include a demand term and a price competitiveness term.
e) Money, finance and exchange rates
Nominal exchange rates are determined from an uncovered interest rate parity equation including a country-specific risk premium that depends on the country�s net foreign assets. Between the countries of the euro area, the exchange rates are fixed. Hence, a single exchange rate is defined for the EMU countries: the �/$.
There are three interest rates per country: the short-term interest rate; the long-term interest rate; and the firms' discount rate.
The short-term interest rate is defined by a monetary policy rule implemented by the central bank of each non-EMU country and the European Central Bank for the euro area countries. The goal of the central bank is to stabilise inflation around a target according to a Taylor-type monetary rule.
The long-term interest rate is linked to the short-term rate by a term structure equation. The firm�s discount rate is equal to the short-term interest rate augmented by a risk premium determined by the return on investment.
f) Government
The tax revenue of Government is composed of VAT, social security contributions, corporate taxes, income tax and other taxes. Other taxes are also used as a device to stabilise public debt and prevent Government from entering a Ponzi finance process. They are modelled as a fiscal policy rule that implies an increase in these taxes when public debt is larger than the target set by the Government.
Marmotte as a simulation tool of fiscal reforms: advantages and limits
Marmotte is a large model, with about 50 equations per countries. This size allows the introduction simultaneously of a variety of distortions and market imperfections which are likely to exist in the real world, but which would be difficult to deal with in a small theoretical model.
However, Marmotte has some limits in answering the questions which are considered in this paper. First, the three taxes we are interested in are distorting. Public budgets include an item, called �other taxes�, which covers the difference between lump sum taxes and lump sum transfers. These taxes are non-distorting, and increase with public debt so as to cover the inter-temporal solvency of Governments. Thus, in our exercise, a decrease in the rates of the three taxes in which we are interested substitutes a non distortionary tax for a distortionary tax, which is raised 10 years after the initial tax reform. This feature partially explains why such a reform has beneficial effects.
Second, the model does not address the short-term, demand-enhancing impact of tax cuts. These demand effects are likely to alleviate the fiscal constraints in the very short run. In addition, the short-run spillovers on partner countries are likely to be positive, whereas they are generally negative in the medium and long run.

TAX REFORMS
PE 306.075 24
Concerning the external trade effect, the investment boom in Germany is satisfied by a surge in imports leading to a deterioration in the trade balance (-0.53% of GDP for the first year). The depreciation of the German real exchange rate progressively reduces this trade deficit. After two years the effect is halved. After ten years, the real depreciation has a positive effect on trade balance (+0.27% of GDP).
The tax cut has a negative effect on public balances. The reduction by 5% in the social contribution rate causes a deterioration of the government budget by 0.6% of GDP in the first year. The rise in miscellaneous taxes in order to insure public solvency occurs only after 10 years in the simulation. After two years, the negative effect is still equal to 0.54% of GDP. This negative budget effect is reducing with time but at a slow pace (after 10 years the effect is still equal to �0.3% of GDP).
Table A2 gives simulation results for a 5 percent cut in the German corporate tax rate. The effects on production, GDP and employment are similar to those of the previous simulation. Now, the profitability of firms increases, which induces them to increase the number of their production units.
Although these units are more capital intensive than before, the demand for labour increases which drives real wages to a higher level6. However, as firms and workers do not have a tax reduction to share, as before, the increase in real wages is small. As previously, we have a decrease in the national price level. In the previous simulation, as the new production units were more labour intensive, the increase in production was accompanied by a higher increase in employment. In the present simulation, firms chose more capital-intensive production units, implying a lower rise in employment than in output. As the new units are more capital intensive, the upward change in investment in the short term is larger than in the previous simulation (+2.64% in the first year instead of 1.86%). The effect on Government deficit is also more limited (less than 0.1% of GDP). This is mainly explained by the lower weight of corporate taxes in the German government receipts compared to the receipts coming from social contributions.
The last shock on Germany is a decrease of 5% in the income tax rate paid by households. The effects displayed in Table A3 are similar to those of Table A1. With our calibration, a decrease in social contributions mostly benefits workers. Here the decrease in income tax wholly benefits workers and increases their (post tax) wage rate. Hence, the supply of labour increases. This drives the real cost of labour to a lower level and we have the same mechanisms as for the first shock. No Keynesian effects appear in this simulation because the decrease in a distorting tax (income tax rate) is replaced by an increase in a non-distorting tax (lump-sum tax). This increase introduces Ricardian equivalence in the long run and reduces significantly the demand effects of the tax measure.
What are the consequences for neighbouring countries? The three tax reductions investigated in Germany give similar results for this country itself: production and employment increase, production prices decrease. The only differences between the three tax reductions concern the capital intensity of new production units and on the real wage rate: the first and the last tax reductions benefit labour and the second tax reduction benefits capital.
6 The first year is special. The unanticipated deflation, and the partial indexation of nominal wage to past price, drives the real wage rate to a high level for this year.

TAX REFORMS
PE 306.075 25
In consequence, the effects of these three tax reductions on the other countries are also similar. Hence, we will present in the following comments only figures concerning the first shock corresponding to Table A1 (decrease in the social contribution rate). A quick overview of the two other tables (Table A2 and A3) shows that the effects on the other countries bear the same signs.
The decrease in social contributions in Germany increases the efficiency of the production of German goods without modifying the efficiency of the production of goods produced by other countries. The expected effects are:
1) an increase in the production of German goods;
2) a decrease in the real relative prices of German goods;
3) an increase in the real prices of foreign goods relative to German goods;
4) a decrease in the production of foreign goods due to a loss of competitiveness, except in countries producing goods which are strongly in demand by Germans or which cannot be substituted for by German goods;
5) the exchange rate regime should not matter for the effects on production and real prices, except in the short run.
Table A1 shows that
1) Production increases in Germany;
2) Real prices relative to Germany increase everywhere. But the increase is very high in the Netherlands;
3) Production strongly decreases in the Netherlands, decreases in Denmark, increases in Belgium and in Ireland, and does not move in other countries.
Table I- 1. Bilateral openness rate as a percentage of GDP* Germany Denmark Spain France UK Ireland Italy Netherlands Bel-Lux
Germany 0,0 4,6 2,6 3,1 2,3 8,5 3,1 8,3 12,0 Denmark 0,5 0,0 0,1 0,2 0,3 0,8 0,2 0,7 0,7 Spain 1,0 0,6 0,0 1,8 0,8 2,2 1,2 1,3 2,3 France 2,6 1,4 3,9 0,0 1,9 7,4 2,7 3,6 11,7 UK 2,1 2,4 1,7 2,1 0,0 18,1 1,5 4,9 7,2 Ireland 0,1 0,2 0,1 0,1 1,2 0,0 0,1 0,3 0,3 Italy 2,0 1,1 1,9 2,1 1,1 3,1 0,0 2,8 4,8 Netherlands 1,6 1,0 0,7 0,9 1,3 3,9 0,5 0,0 7,8 Belg-Lux 1,5 0,6 0,6 1,7 1,1 5,5 0,6 5,8 0,0 Euro 8,8 9,4 9,7 9,6 9,7 30,6 8,2 22,1 38,8 Europe 2,6 2,4 1,9 2,3 0,3 18,8 1,7 5,6 7,9 Sample 14,1 13,8 12,6 13,8 12,9 63,3 12,0 29,7 51,1 Source: CHELEM-CEPII * exports of countries in column towards the countries in line as a percentage of GDP of countries in column.

TAX REFORMS
PE 306.075 26
Trade relationships and the openness degree to each partner are crucial in understanding the results of the simulations and the transmission of a shock to the different countries as a whole. Table I- 1 shows the bilateral openness rates as a percentage of GDP. Inside the euro area, production prices increase everywhere, except in Germany.
This effect is mainly driven by the ECB objective function. The euro area inflation rate being controlled by the ECB, the resulting average inflation should remain constant. Hence, as German prices decrease, the other euro area countries register a price increase. This price increase should induce a decrease in the real cost of labour, because the nominal wage rate is partly indexed on consumption prices, which should increase less than production prices. This is always the case, but to very different extents. This movement induces some substitution of capital for labour. Thus employment has a less unfavourable trend than production.
I.2.2. Isolated tax cut outside the EMU In a second step, the three previous shocks have been implemented in the UK instead of Germany. A shock outside the EMU can be considered as a symmetric shock for all EMU members. The European Central Bank could adjust its monetary policy to this shock whereas in the previous case, the power of the central bank was limited since the shock had opposite effects on the different members of the EMU.
For the country where the shock occurs (i.e. the UK), the same mechanisms are at work. However, a noticeable difference concerns the effects on prices. The explanation is that the real depreciation of the exchange rate required to balance the excess supply of British goods is almost entirely realised through a nominal depreciation. The pound is more affected than the euro was when the shock occurred in Germany. The reason is that in the case of the UK, the exchange rate reacts only relative to the British economic situation whereas in the case of Germany, the exchange rate reaction takes into account the situation of the euro area as a whole. Hence, German prices have to move to complete the real exchange rate adjustment. When the shock occurs in the UK this price adjustment is less necessary.
A real depreciation of the pound affects countries that have close trade links with the UK. According to Table 1, three countries are likely to be significantly affected: Ireland (exports to the UK represent more than 18% of Irish GDP), Belgium and, to a lesser extent, the Netherlands. Table A4 shows the results of this simulation. For the Netherlands, we see an inverted J-curve: the net effect of a depreciation of the pound vis-à-vis the euro is a decrease in import prices and an increase in net exports by value (+0.4% of GDP). In the long run the quantity effect is larger, leading to a deterioration in the trade balance (-0.2% of GDP).
We have the opposite effect in Ireland and Belgium. These two economies are more open than the Netherlands (exports represent more in terms of GDP � more than 60% for Ireland and more than 50% for Belgium); lower import prices depress domestic prices (especially for Ireland) and, as a consequence, export prices.
These price movements lead to an improvement in Irish and Belgian competitiveness vis-à-vis the rest of the euro area. This is reflected by an increase in the net exports in the long run. This effect is larger for Ireland (net exports increase by 0.2% of GDP after 10 years) whose prices fall by a large amount (-1.4% less than the baseline during the first year). In the short-run, as the price of exports fall, the trade balance worsens in Ireland by 0.42% of GDP for the first year.

TAX REFORMS
PE 306.075 27
Table A5 (decrease in the UK corporate tax rate) and A6 (decrease in the UK households� income tax rate) shows similar patterns, except that the effect on Irish prices and trade balance is even larger. However, this larger effect is misleading since it reflects only the fact that the corporate tax rate and the income tax rate in the UK are higher than the social contribution rate.
I.2.3. General comments Tax cuts always have a positive impact on the country where the reform occurs. Even if the price adjustments reduce the effect of tax reforms on real labour costs, the effect on output and employment is permanently positive. Nevertheless, the effects on employment strongly depend on the kind of tax under consideration, due to different substitution effects between capital and labour. With a social contribution cut, the new production units are more labour intensive and the increase in production implies a higher increase in employment. With a corporate tax cut, as the new production units are more capital-intensive, the rise in employment is lower than output7.
The only drawbacks of such cuts concern the deterioration in the budget balance and the short-term decrease in consumption. The effect on public balance is easily understandable. The effect on output is actually not sufficient to finance the negative effect on public balance only by growth. The negative effect on consumption is explained by the large proportion of consumers whose behaviour is influenced by movements in real interest rates and, conversely, the low proportion influenced by changes in their current disposable income.
As the reform occurs in only one country, the tax decrease has strong effects on the main trade partners. However, the response of these partners depends on the exchange rate regime. If the country and its trade partners are members of a monetary union, the effects on partners are negative. As the nominal exchange rate adjusts only partly to the shock, the real exchange rate adjustment is made through large domestic price movements.
If, on the contrary, the exchange rate regime between the country and its partners is flexible, then the exchange rate adjustment prevents the partner�s domestic economy suffering from the external shock. In that case, the positive supply shock in the country where the reform is implemented can push output and employment up permanently.
A last remark concerns the size and the degree of openness of countries. The most affected countries are the small, open economies. The large economies are relatively immune from the effects of a neighbour country implementing a tax reform.
It is worth noting that all the effects presented in these simulations are medium-term. This is due to the properties of the model. As a supply-side model, Marmotte is not able to account for the short-term dynamics that could arise just after the shock. Indeed, in the very short run, some effects coming from the demand side should be significant. A neo-Keynesian model could account for such effects. However, as tax reforms act principally in the medium to long run, the demand effects are likely to vanish rapidly as the supply-side effects arise.
7 Hence, our conclusions differ from Bond et al. (2000) who implicitly assume that capital and labour are complementary, which implies an equivalence of the various taxes as far as labour is concerned.

TAX REFORMS
PE 306.075 28
I.3. The impact of a simultaneous tax cut In the previous paragraph, we have shown that a tax cut in one EMU country produces a positive effect on the reforming country but a negative externality on EMU partners. Since most EMU countries are presently reforming their tax system, the net outcome is ambiguous a priori for each country. This is why we implement a simulation where taxes are reduced simultaneously in all the EMU countries. Instead of having a decrease in a single country of the EMU, each country of the euro area decreases its tax rate by the same percentage as the other members. Tables A7, A8 and A9 present the results for the three different tax measures.
Tax reductions have a positive effect on employment and output in all the countries where the measure occurs. All the countries of the euro area can now benefit from the tax reform without suffering from the consequences of shock transmission due to trade linkages. Comparing Table A1 and Table A7 for Germany gives some indications in terms of response differences between the isolated case and the simultaneous case. The effect on output, employment, real labour costs, real wages and public balances are almost similar in the short, medium and long term.
The noticeable difference concerns the effects on the demand side, i.e. the response of investment, consumption and trade balance. The effects seem to be smoother with the simultaneous case relative to the isolated one. We can interpret these results as a shock in a closed economy, whereas the previous simulations referred to the open-economy case. In a closed economy, the investment increase falls on domestic production. This increases the prices of goods and decreases consumption. In an open economy, on the contrary, the increase in investment can be satisfied by imports of foreign goods. The adjustment of the economy to the higher level of capital can be realised more quickly through higher investment in the first years.
The last difference concerns the effects on trade. In the isolated case, the response in terms of trade balance was quite significant. In the simultaneous case, the trade balance is barely affected (-0.01% of GDP during the first year; +0.1% of GDP in the long run). The explanation is related to the real exchange rate adjustment. This adjustment is larger in the case of the isolated tax decrease, especially in terms of domestic price movements. An asymmetric shock leads to imbalances between countries that must be solved by relative price movements and that imply significant trade balance effect. On the contrary, these imbalances are lower in the symmetric case and the required adjustment is less.
To sum up, the difference for the country implementing the reform between the isolated case and the simultaneous case concerns just the speed of adjustment which is more rapid in the first case. The magnitude of the effects is relatively similar especially in the long term.
For the other countries, the simultaneous case is preferable to the isolated case. All the countries benefit from the supply shock � in terms of production as well as employment �. The only exception is Ireland. The effects of the tax reform on Irish production are very low for the decrease in the rate of social contribution and the rate of income tax (Table A3 and A9) and even negative with the decrease in the corporate tax rate (Table A6).
These results are partly due to low levels of initial tax rates. Hence, the positive effects of the supply shock are low and are not sufficient to balance the negative effect on prices related to the demand shocks coming from the tax decreases in the neighbouring countries.
I.4. Conclusions for ongoing tax reforms The simulations implemented in these studies give some idea of the macro-economic effects of tax measures on the European countries. We can draw several conclusions.

TAX REFORMS
PE 306.075 29
• First, a tax decrease is beneficial for the country where the measure is implemented. Whatever the tax rate concerned, the decrease acts as a supply shock that pushes production and employment up permanently. However, the effect on employment depends significantly on the tax to be decreased, and particularly on the effects of capital-labour substitution. As a cut in social contribution tax fosters a more labour intensive technology, this measure is the best for employment.
• Secondly, tax cuts have strong implications in terms of public balance. For instance, in Germany, cutting social contribution rates from 25% to 23¾% would imply a decrease in public balance equal to 0.6% of GDP in the short run and 0.3% in the long run. Hence, more significant tax cuts would threaten the Stability and Growth Pact seriously. In the model, the distorting tax cuts are compensated by increases in lump-sum taxes. However, this simple assumption does not hide the fact that, to be realistic, a tax reform package must account for these strong budget costs.
• Thirdly, a tax decrease implemented in an isolated euro-area country is detrimental for neighbouring countries, especially when these countries are small and open to the country where the reform occurs. This negative effect is due to the real exchange rate adjustment required to balance the supply-demand equilibrium. As the nominal exchange rate is constrained by the economic condition of the euro area as a whole, the competitiveness adjustment is realised through strong price movements that have negative effects for the small economies. This conclusion disappears when the reform is implemented in a country which is non-member of the EMU. In that case, the reform acts as a shock that stimulates the trade of partners without implying adjustments to real exchange rates related to the exchange rate regime, since in that case the real exchange rate adjustment is realised through nominal depreciation.
• Fourthly, to avoid negative effects due to the membership of EMU, a simultaneous decrease inside the euro area is the best policy for allowing the EMU countries to benefit from the supply shock implied by the reform. However, it is important to note that the negative effect on neighbouring countries due to a tax cut in an isolated euro-area country is significant only when the isolated country is large. When the isolated tax cut is implemented in a small country, we find the same positive results on output and employment, but the effect on the neighbours are almost negligible8.
• Fifthly, this asymmetric gain from tax competition which is evidenced through these simulations provide part of the explanation for the current difficulties of the harmonisation process, as big countries do not really need harmonisation, and small countries feel more incentive to cut taxes than to co-ordinate on tax rates.
• Sixthly, the benefits related to an isolated tax cut are larger for a small country than for a large one. Take the effect of a decrease in the social contribution rate by 5%. When the tax cut is implemented in Germany only, the long run effect on output is equal to 0.39%. When it is implemented simultaneously in the euro area, the effect on German output is lower (0.35%). For Ireland, an isolated tax cut leads to an improvement by 0.17% in the long run, whereas it is only equal to 0.08% if it is implemented simultaneously in the euro area. As a consequence, tax competition is more beneficial for small countries.
8 For instance, we have simulated a decrease in social contribution rate in Ireland by 5 percent. The long run effect is equal to 0.17% on output and 0.2% on employment. The effects on other countries are not significant.
TAX REFORMS
PE 306.075 30
• Finally, another important difference between small and large countries is the effect on the nominal exchange rate of the euro: the larger the country, the larger the effect on the exchange rate. This is because the weight of each country in the EMU average inflation depends on its share in euro area GDP. As this average inflation enters the monetary rule of the ECB, it acts on the nominal exchange rate via the interest parity condition. For a small country, as the euro does not adjust for the shock, the real exchange rate adjustment implied by the shock requires a larger movement in domestic prices.
Box 4: How to approximate the ongoing reforms in terms of a simulation for Marmotte
In all the countries of the sample, the ongoing tax reforms focus at reducing nominal taxation. Since the Marmotte model is specified in terms of effective taxation, simulating these reforms implies making assumptions on the way nominal tax cuts translate into effective tax cuts. As we do not know the future elasticity of the tax base to nominal tax rates, we adopted here the straightest assumption, hypothesising that nominal tax cuts end in identical effective tax cuts.
This is rather an extreme hypothesis, which has to be considered more as a benchmark than as a likely outcome of tax reforms. Indeed, tax rebates are very unlikely to end in an equivalent reduction in tax revenues, since most tax cuts are implemented together with a broadening of the tax basis. Hence, effective taxation will probably not fall more than nominal taxation. In will probably decrease less, and might even increase (ex post) the effective tax burden, if tax cuts foster investment, employment or demand, and therefore increase the tax revenues more than proportionally to GDP.
The assumptions that underlie the simulation exercise are detailed in the Table A10. It should be noted that no precision was available on the rate of decrease of social security contributions; hence we defined an ad hoc rate of decrease of 5%, which is of course questionable, but reasonable.
The table also defines the assumptions that were adopted concerning corporate taxation: in some of the countries of the sample, tax cuts differ according to the nature of domestic firms, SMEs benefiting more from the tax cuts than other firms. We assumed that 80% of the tax basis was composed of standard firms, and 20% of SMEs, in order to have a more refined hypothesis on effective tax cuts. In Germany, and consistent with the estimation exercise produced in Part II of the report, we supposed that 50% of profits were reinvested and 50% distributed, in order to get an average nominal tax rate. Finally, in Ireland, the tax system was until 2001 very beneficial to foreign firms located in some specific areas. The tax system is to be unified in 2003. In order to get an average impact of the joint cut in tax rates for domestic firms and increase in taxation for multinationals, we supposed that 50% of the tax basis was attributable to FMNs.
Finally, the case of personal income taxation is probably the most difficult to handle, given progressive taxation schemes and the different tax rebates and tax credits that contribute to affect the taxable income. For the sake of simplicity, and in order to treat all countries equally, we assumed that global effective tax cut would be equal to the average of tax cuts on the highest and the lowest tax rates. Some additional assumptions were made for countries where information was incomplete. They are detailed in the table.
In the simulations, we do not take account of the timing of the ongoing tax reforms, and assume that they all take place at the same time in all countries. This is justified on the ground that the Marmotte model is mostly efficient when focusing on medium-run issues. Hence, we look at the medium-run impact of the ongoing tax reforms, and the sequence of the reform is of limited importance.

TAX REFORMS
PE 306.075 31
To get a rough picture of the long-run effects of the ongoing tax measures, we have attempted to translate the current or planned reforms in Europe in terms of shocks capable of simulation with Marmotte. Box 4 explains all the assumptions required to run this last simulation. Table A11 gives the results on the European countries after 2 and 10 years. Even though the results are difficult to interpret, the obvious result is that the countries where the cuts are important benefit the most from the tax reform (see results on Germany, Netherlands, the UK and France), especially when the country is large and not too open to the rest of the world. As Spain does not intend to implement tax reforms (already done in the 1990s), it suffers from the reform in the neighbouring countries.
The last interesting result concerns the response of the nominal exchange rate of the euro. The ongoing tax reforms would have a strong effect in terms of euro depreciation in the long run. However, this result is strongly related to the specification and the calibration of the model. All the results displayed in Table A11 are just approximate figures and are useful in order to have an idea of the signs of the effects of the ongoing tax reforms. The magnitude of the effects is too dependent on the model calibration and assumptions in terms of simulated shocks to be taken literally.
I.5. Additional Tables Detailed results are provided below in ten additional tables referred to A1- to A10 above:
♦ Table A1 : Decrease in social contribution rate in Germany by 5%;
♦ Table A2 : Decrease in corporate tax rate in Germany by 5%;
♦ Table A3 : Decrease in the rate of households� income tax in Germany by 5%;
♦ Table A4: Decrease in social contribution rate in the United Kingdom by 5% ;
♦ Table A5: Decrease in corporate tax rate in the United Kingdom by 5;
♦ Table A6: Decrease in the rate of households� income tax in the United Kingdom by 5%;
♦ Table A7: Decrease in social contribution rate in the Euro area by 5%;
♦ Table A8: Decrease in corporate tax rate in the Euro area by 5%;
♦ Table A9: Decrease in the rate of households� income tax in the Euro area by 5%;
♦ Table A10 : Calibrating ongoing tax reforms;
♦ Table A11: Simulation of the ongoing tax reforms.

TAX REFORMS
PE 306.075 32

TAX REFORMS
PE 306.075 33
Table A1: Decrease in social contribution rate in Germany by 5% (percentage deviation from the baseline) Production Employment Real labor
costs Real
wages Investment Consumption GDP Public
balance* Trade balance*
Exchange rate
Prices Real interest rate
Germany 0.03 0.05 0.22 1.70 1.86 -0.37 0.20 -0.60 -0.53 0.08 -0.86 0.03 2y 0.22 0.23 -0.18 1.30 1.29 -0.23 0.34 -0.54 -0.23 0.13 -0.78 0.03
Country where the shock occurs 10y 0.39 0.42 -0.15 1.48 0.18 0.09 0.39 -0.30 0.27 0.25 -0.12 0.02
France 0.01 0.01 -0.17 -0.10 -0.25 0.05 -0.03 -0.03 0.41 0.08 0.33 0.00 2y -0.02 -0.01 -0.02 0.04 -0.16 0.04 -0.05 -0.01 0.20 0.13 0.36 0.00 10y -0.02 -0.01 -0.01 0.02 0.07 0.05 -0.01 0.00 -0.20 0.25 0.35 0.00 Italy 0.00 0.01 -0.16 -0.09 -0.19 0.05 -0.02 -0.05 0.08 0.08 0.30 0.00 2y -0.02 -0.01 -0.02 0.04 -0.12 0.04 -0.03 -0.02 0.04 0.13 0.34 0.00 10y -0.01 -0.01 -0.01 0.02 0.07 0.05 -0.02 -0.01 -0.04 0.25 0.35 0.00 Spain -0.03 -0.04 -0.14 -0.10 -0.22 0.03 -0.03 -0.03 0.00 0.08 0.25 0.00 2y -0.01 -0.00 -0.02 0.02 -0.06 0.03 -0.02 -0.01 0.00 0.13 0.29 0.00
Euro area Large countries
10y -0.01 -0.00 -0.01 0.02 0.03 0.04 -0.01 0.00 0.00 0.25 0.35 0.00 Netherlands 0.33 0.56 -0.95 -0.47 -3.28 0.31 -0.57 -0.23 2.03 0.08 2.16 0.01 2y -0.36 -0.26 -0.07 0.36 -2.61 0.15 -1.05 -0.25 0.89 0.13 1.94 0.01 10y -0.34 -0.29 -0.01 -0.04 1.30 -0.02 -0.24 0.00 -0.93 0.25 0.11 0.00 Ireland -0.00 -0.01 0.15 0.07 0.92 -0.03 0.20 -0.03 -0.14 0.08 -0.29 0.00 2y 0.09 0.06 0.00 -0.08 0.55 0.01 0.24 -0.05 -0.05 0.13 -0.17 0.00 10y 0.07 0.06 -0.01 0.02 -0.32 0.07 0.00 -0.03 0.07 0.25 0.41 0.00 Belgium -0.01 -0.01 0.08 0.01 1.01 0.03 0.23 0.01 -0.86 0.08 -0.15 0.00 2y 0.10 0.08 0.00 -0.05 0.66 0.06 0.25 -0.01 -0.37 0.13 -0.02 0.00
Euro area Small countries
10y 0.06 0.07 0.00 0.06 -0.46 0.12 -0.14 -0.05 0.41 0.25 0.49 0.00 U.K. 0.00 0.01 -0.01 0.03 -0.15 0.02 -0.02 0.00 0.03 -0.15 0.00 0.00 2y -0.01 -0.00 -0.01 0.02 -0.09 0.02 -0.03 0.00 0.01 -0.13 0.01 0.00 10y -0.01 -0.01 -0.01 0.01 0.02 0.04 -0.02 0.00 -0.01 -0.06 0.04 0.00 Denmark 0.00 0.01 -0.02 0.13 -0.98 0.11 -0.17 -0.01 1.21 -0.64 0.01 0.00 2y -0.08 -0.05 -0.04 0.09 -0.52 0.10 -0.20 -0.02 0.38 -0.51 0.02 0.00
Other European countries
10y -0.06 -0.04 -0.02 0.00 0.27 0.09 -0.05 0.00 -0.65 0.01 0.06 0.00 U.S. 0.00 0.00 0.00 0.00 -0.01 0.00 0.00 0.00 0.00 0.00 0.00 0.00 2y 0.00 0.00 0.00 0.00 0.00 0.01 0.00 0.00 0.00 0.00 0.00 0.00 10y 0.00 0.00 0.00 0.00 0.01 0.01 0.00 0.00 0.00 0.00 0.00 0.00 Japan 0.00 0.00 0.00 0.01 -0.01 0.01 0.00 0.00 0.00 -0.01 0.00 0.00 2y -0.00 0.00 0.00 0.01 0.00 0.01 0.00 0.00 0.00 -0.02 0.01 0.00
Rest of the world
10y 0.00 0.00 0.00 0.00 0.00 0.01 0.00 0.00 0.00 -0.04 0.05 0.00 *Absolute change as a percentage of GDP
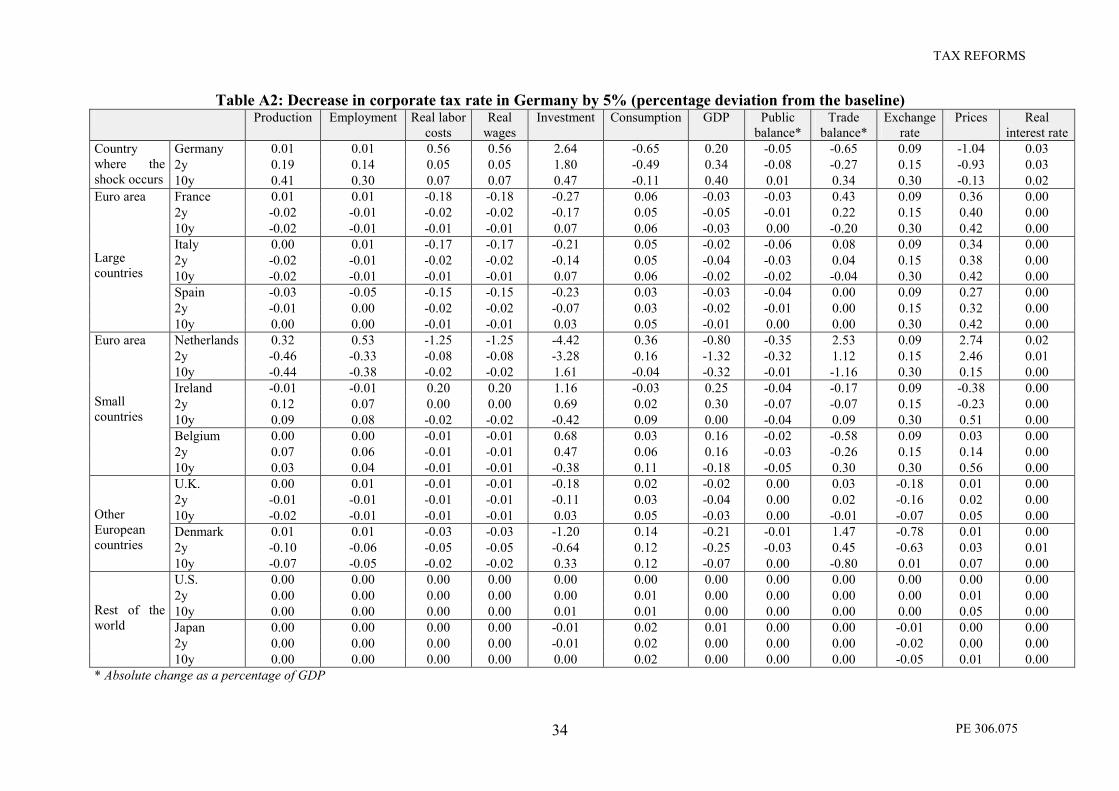
TAX REFORMS
PE 306.075 34
Table A2: Decrease in corporate tax rate in Germany by 5% (percentage deviation from the baseline) Production Employment Real labor
costs Real
wages Investment Consumption GDP Public
balance* Trade
balance* Exchange
rate Prices Real
interest rate Germany 0.01 0.01 0.56 0.56 2.64 -0.65 0.20 -0.05 -0.65 0.09 -1.04 0.03 2y 0.19 0.14 0.05 0.05 1.80 -0.49 0.34 -0.08 -0.27 0.15 -0.93 0.03
Country where the shock occurs 10y 0.41 0.30 0.07 0.07 0.47 -0.11 0.40 0.01 0.34 0.30 -0.13 0.02
France 0.01 0.01 -0.18 -0.18 -0.27 0.06 -0.03 -0.03 0.43 0.09 0.36 0.00 2y -0.02 -0.01 -0.02 -0.02 -0.17 0.05 -0.05 -0.01 0.22 0.15 0.40 0.00 10y -0.02 -0.01 -0.01 -0.01 0.07 0.06 -0.03 0.00 -0.20 0.30 0.42 0.00 Italy 0.00 0.01 -0.17 -0.17 -0.21 0.05 -0.02 -0.06 0.08 0.09 0.34 0.00 2y -0.02 -0.01 -0.02 -0.02 -0.14 0.05 -0.04 -0.03 0.04 0.15 0.38 0.00 10y -0.02 -0.01 -0.01 -0.01 0.07 0.06 -0.02 -0.02 -0.04 0.30 0.42 0.00 Spain -0.03 -0.05 -0.15 -0.15 -0.23 0.03 -0.03 -0.04 0.00 0.09 0.27 0.00 2y -0.01 0.00 -0.02 -0.02 -0.07 0.03 -0.02 -0.01 0.00 0.15 0.32 0.00
Euro area Large countries
10y 0.00 0.00 -0.01 -0.01 0.03 0.05 -0.01 0.00 0.00 0.30 0.42 0.00 Netherlands 0.32 0.53 -1.25 -1.25 -4.42 0.36 -0.80 -0.35 2.53 0.09 2.74 0.02 2y -0.46 -0.33 -0.08 -0.08 -3.28 0.16 -1.32 -0.32 1.12 0.15 2.46 0.01 10y -0.44 -0.38 -0.02 -0.02 1.61 -0.04 -0.32 -0.01 -1.16 0.30 0.15 0.00 Ireland -0.01 -0.01 0.20 0.20 1.16 -0.03 0.25 -0.04 -0.17 0.09 -0.38 0.00 2y 0.12 0.07 0.00 0.00 0.69 0.02 0.30 -0.07 -0.07 0.15 -0.23 0.00 10y 0.09 0.08 -0.02 -0.02 -0.42 0.09 0.00 -0.04 0.09 0.30 0.51 0.00 Belgium 0.00 0.00 -0.01 -0.01 0.68 0.03 0.16 -0.02 -0.58 0.09 0.03 0.00 2y 0.07 0.06 -0.01 -0.01 0.47 0.06 0.16 -0.03 -0.26 0.15 0.14 0.00
Euro area Small countries
10y 0.03 0.04 -0.01 -0.01 -0.38 0.11 -0.18 -0.05 0.30 0.30 0.56 0.00 U.K. 0.00 0.01 -0.01 -0.01 -0.18 0.02 -0.02 0.00 0.03 -0.18 0.01 0.00 2y -0.01 -0.01 -0.01 -0.01 -0.11 0.03 -0.04 0.00 0.02 -0.16 0.02 0.00 10y -0.02 -0.01 -0.01 -0.01 0.03 0.05 -0.03 0.00 -0.01 -0.07 0.05 0.00 Denmark 0.01 0.01 -0.03 -0.03 -1.20 0.14 -0.21 -0.01 1.47 -0.78 0.01 0.00 2y -0.10 -0.06 -0.05 -0.05 -0.64 0.12 -0.25 -0.03 0.45 -0.63 0.03 0.01
Other European countries
10y -0.07 -0.05 -0.02 -0.02 0.33 0.12 -0.07 0.00 -0.80 0.01 0.07 0.00 U.S. 0.00 0.00 0.00 0.00 0.00 0.00 0.00 0.00 0.00 0.00 0.00 0.00 2y 0.00 0.00 0.00 0.00 0.00 0.01 0.00 0.00 0.00 0.00 0.01 0.00 10y 0.00 0.00 0.00 0.00 0.01 0.01 0.00 0.00 0.00 0.00 0.05 0.00 Japan 0.00 0.00 0.00 0.00 -0.01 0.02 0.01 0.00 0.00 -0.01 0.00 0.00 2y 0.00 0.00 0.00 0.00 -0.01 0.02 0.00 0.00 0.00 -0.02 0.00 0.00
Rest of the world
10y 0.00 0.00 0.00 0.00 0.00 0.02 0.00 0.00 0.00 -0.05 0.01 0.00 * Absolute change as a percentage of GDP
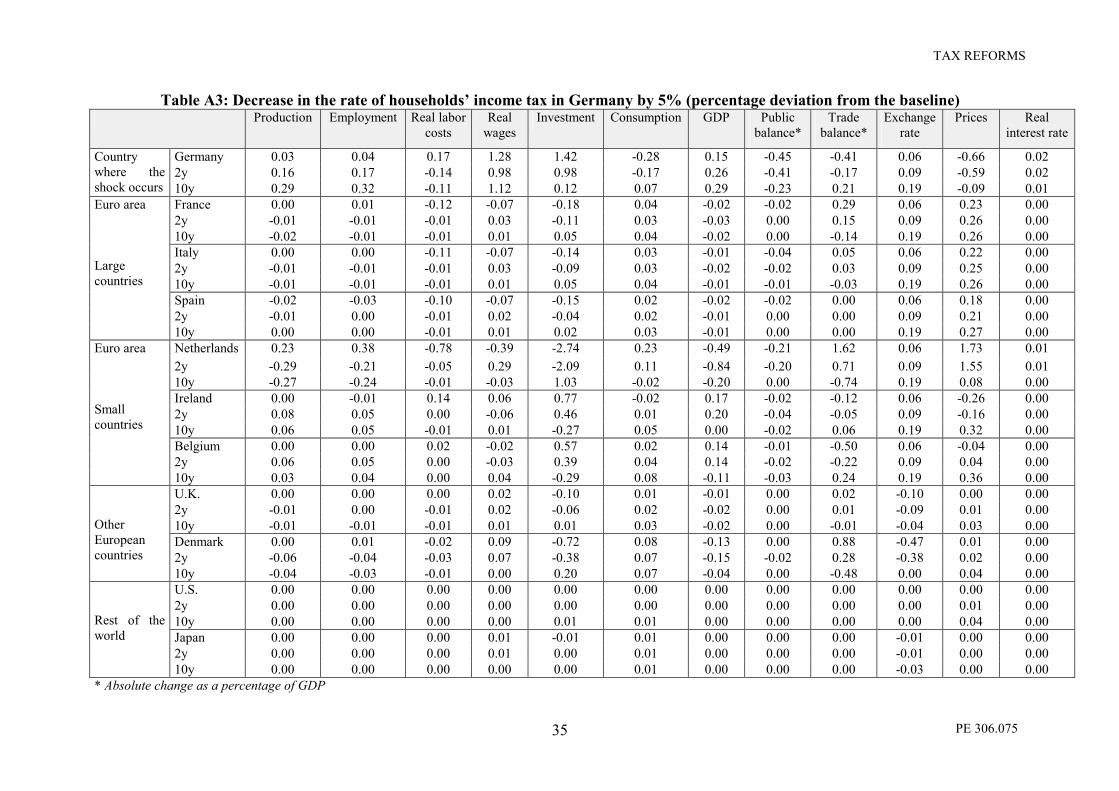
TAX REFORMS
PE 306.075 35
Table A3: Decrease in the rate of households� income tax in Germany by 5% (percentage deviation from the baseline) Production Employment Real labor
costs Real
wages Investment Consumption GDP Public
balance* Trade
balance* Exchange
rate Prices Real
interest rate
Germany 0.03 0.04 0.17 1.28 1.42 -0.28 0.15 -0.45 -0.41 0.06 -0.66 0.02 2y 0.16 0.17 -0.14 0.98 0.98 -0.17 0.26 -0.41 -0.17 0.09 -0.59 0.02
Country where the shock occurs 10y 0.29 0.32 -0.11 1.12 0.12 0.07 0.29 -0.23 0.21 0.19 -0.09 0.01
France 0.00 0.01 -0.12 -0.07 -0.18 0.04 -0.02 -0.02 0.29 0.06 0.23 0.00 2y -0.01 -0.01 -0.01 0.03 -0.11 0.03 -0.03 0.00 0.15 0.09 0.26 0.00 10y -0.02 -0.01 -0.01 0.01 0.05 0.04 -0.02 0.00 -0.14 0.19 0.26 0.00 Italy 0.00 0.00 -0.11 -0.07 -0.14 0.03 -0.01 -0.04 0.05 0.06 0.22 0.00 2y -0.01 -0.01 -0.01 0.03 -0.09 0.03 -0.02 -0.02 0.03 0.09 0.25 0.00 10y -0.01 -0.01 -0.01 0.01 0.05 0.04 -0.01 -0.01 -0.03 0.19 0.26 0.00 Spain -0.02 -0.03 -0.10 -0.07 -0.15 0.02 -0.02 -0.02 0.00 0.06 0.18 0.00 2y -0.01 0.00 -0.01 0.02 -0.04 0.02 -0.01 0.00 0.00 0.09 0.21 0.00
Euro area Large countries
10y 0.00 0.00 -0.01 0.01 0.02 0.03 -0.01 0.00 0.00 0.19 0.27 0.00 Netherlands 0.23 0.38 -0.78 -0.39 -2.74 0.23 -0.49 -0.21 1.62 0.06 1.73 0.01 2y -0.29 -0.21 -0.05 0.29 -2.09 0.11 -0.84 -0.20 0.71 0.09 1.55 0.01 10y -0.27 -0.24 -0.01 -0.03 1.03 -0.02 -0.20 0.00 -0.74 0.19 0.08 0.00 Ireland 0.00 -0.01 0.14 0.06 0.77 -0.02 0.17 -0.02 -0.12 0.06 -0.26 0.00 2y 0.08 0.05 0.00 -0.06 0.46 0.01 0.20 -0.04 -0.05 0.09 -0.16 0.00 10y 0.06 0.05 -0.01 0.01 -0.27 0.05 0.00 -0.02 0.06 0.19 0.32 0.00 Belgium 0.00 0.00 0.02 -0.02 0.57 0.02 0.14 -0.01 -0.50 0.06 -0.04 0.00 2y 0.06 0.05 0.00 -0.03 0.39 0.04 0.14 -0.02 -0.22 0.09 0.04 0.00
Euro area Small countries
10y 0.03 0.04 0.00 0.04 -0.29 0.08 -0.11 -0.03 0.24 0.19 0.36 0.00 U.K. 0.00 0.00 0.00 0.02 -0.10 0.01 -0.01 0.00 0.02 -0.10 0.00 0.00 2y -0.01 0.00 -0.01 0.02 -0.06 0.02 -0.02 0.00 0.01 -0.09 0.01 0.00 10y -0.01 -0.01 -0.01 0.01 0.01 0.03 -0.02 0.00 -0.01 -0.04 0.03 0.00 Denmark 0.00 0.01 -0.02 0.09 -0.72 0.08 -0.13 0.00 0.88 -0.47 0.01 0.00 2y -0.06 -0.04 -0.03 0.07 -0.38 0.07 -0.15 -0.02 0.28 -0.38 0.02 0.00
Other European countries
10y -0.04 -0.03 -0.01 0.00 0.20 0.07 -0.04 0.00 -0.48 0.00 0.04 0.00 U.S. 0.00 0.00 0.00 0.00 0.00 0.00 0.00 0.00 0.00 0.00 0.00 0.00 2y 0.00 0.00 0.00 0.00 0.00 0.00 0.00 0.00 0.00 0.00 0.01 0.00 10y 0.00 0.00 0.00 0.00 0.01 0.01 0.00 0.00 0.00 0.00 0.04 0.00 Japan 0.00 0.00 0.00 0.01 -0.01 0.01 0.00 0.00 0.00 -0.01 0.00 0.00 2y 0.00 0.00 0.00 0.01 0.00 0.01 0.00 0.00 0.00 -0.01 0.00 0.00
Rest of the world
10y 0.00 0.00 0.00 0.00 0.00 0.01 0.00 0.00 0.00 -0.03 0.00 0.00 * Absolute change as a percentage of GDP

TAX REFORMS
PE 306.075 36
Table A4: Decrease in social contribution rate in the United Kingdom by 5% (percentage deviation from the baseline) Production Employment Real labor
costs Real
wages Investment Consumption GDP Public
balance* Trade
balance* Exchange
rate Prices Real
interest rate U.K. 0.05 0.06 -0.06 0.38 0.54 -0.04 0.08 -0.26 -0.06 0.39 0.02 0.01 2y 0.09 0.08 -0.05 0.39 0.36 0.00 0.12 -0.29 -0.03 0.42 0.06 0.01
Country where the shock occurs 10y 0.18 0.17 -0.02 0.43 0.12 0.10 0.18 -0.11 0.01 0.40 0.16 0.01
Germany 0.00 0.00 0.01 0.01 -0.01 0.00 0.00 0.00 -0.01 -0.04 -0.02 0.00 2y 0.00 0.00 0.00 0.00 -0.01 0.01 0.00 0.00 -0.01 -0.04 -0.02 0.00 10y 0.00 0.00 0.00 0.00 -0.01 0.01 -0.01 0.00 0.00 -0.02 0.01 0.00 France 0.00 0.00 0.00 0.01 -0.05 0.01 -0.01 0.00 0.07 -0.04 0.01 0.00 2y 0.00 0.00 0.00 0.01 -0.03 0.01 -0.01 0.00 0.03 -0.04 0.01 0.00 10y 0.00 0.00 0.00 0.00 0.01 0.01 -0.01 0.00 -0.04 -0.02 0.01 0.00 Italy 0.00 0.00 0.01 0.01 -0.02 0.01 0.00 0.00 0.01 -0.04 -0.01 0.00 2y 0.00 0.00 0.00 0.00 -0.01 0.01 0.00 0.00 0.00 -0.04 -0.01 0.00 10y 0.00 0.00 0.00 0.00 0.00 0.01 0.00 0.00 0.00 -0.02 0.01 0.00 Spain 0.00 0.00 0.00 0.01 -0.03 0.01 0.00 0.00 0.00 -0.04 0.00 0.00 2y 0.00 0.00 0.00 0.01 -0.02 0.01 0.00 0.00 0.00 -0.04 0.00 0.00
Euro area Large countries
10y 0.00 0.00 0.00 0.00 0.01 0.01 0.00 0.00 0.00 -0.02 0.01 0.00 Netherlands 0.04 0.07 -0.20 -0.09 -0.80 0.06 -0.15 -0.06 0.43 -0.04 0.41 0.00 2y -0.08 -0.06 -0.01 0.08 -0.56 0.03 -0.23 -0.05 0.18 -0.04 0.36 0.00 10y -0.08 -0.07 0.00 -0.01 0.27 -0.01 -0.06 -0.00 -0.20 -0.02 -0.03 0.00 Ireland -0.02 -0.04 0.74 0.46 2.92 -0.17 0.57 0.04 -0.42 -0.04 -1.43 0.00 2y 0.28 0.18 0.01 -0.21 1.64 -0.05 0.70 -0.07 -0.15 -0.04 -1.19 0.00 10y 0.22 0.17 -0.01 0.04 -0.89 0.08 0.06 -0.02 0.20 -0.02 0.13 0.00 Belgium 0.00 0.00 0.01 0.01 0.04 0.01 0.01 0.00 -0.05 -0.04 -0.02 0.00 2y 0.01 0.00 0.00 0.00 0.04 0.01 0.01 0.00 -0.04 -0.04 -0.01 0.00
Euro area Small countries
10y 0.00 0.00 0.00 0.01 -0.06 0.02 -0.03 0.00 0.02 -0.02 0.03 0.00 Denmark 0.00 0.00 0.00 0.01 -0.12 0.02 -0.02 0.00 0.13 -0.07 0.00 0.00 2y -0.01 -0.01 0.00 0.01 -0.07 0.01 -0.02 0.00 0.04 -0.06 0.00 0.00
Other European country 10y -0.01 -0.01 0.00 0.00 0.03 0.01 -0.01 0.00 -0.09 -0.01 0.01 0.00
U.S. 0.00 0.00 0.00 0.00 0.00 0.00 0.00 0.00 0.00 0.00 0.00 0.00 2y 0.00 0.00 0.00 0.00 0.00 0.00 0.00 0.00 0.00 0.00 0.01 0.00 10y 0.00 0.00 0.00 0.00 0.00 0.01 0.00 0.00 0.00 0.00 0.02 0.00 Japan 0.00 0.00 0.00 0.00 0.00 0.00 0.00 0.00 0.00 0.00 0.00 0.00 2y 0.00 0.00 0.00 0.00 0.00 0.00 0.00 0.00 0.00 -0.01 0.00 0.00
Rest of the world
10y 0.00 0.00 0.00 0.00 0.00 0.00 0.00 0.00 0.00 -0.02 0.00 0.00 * Absolute change as a percentage of GDP
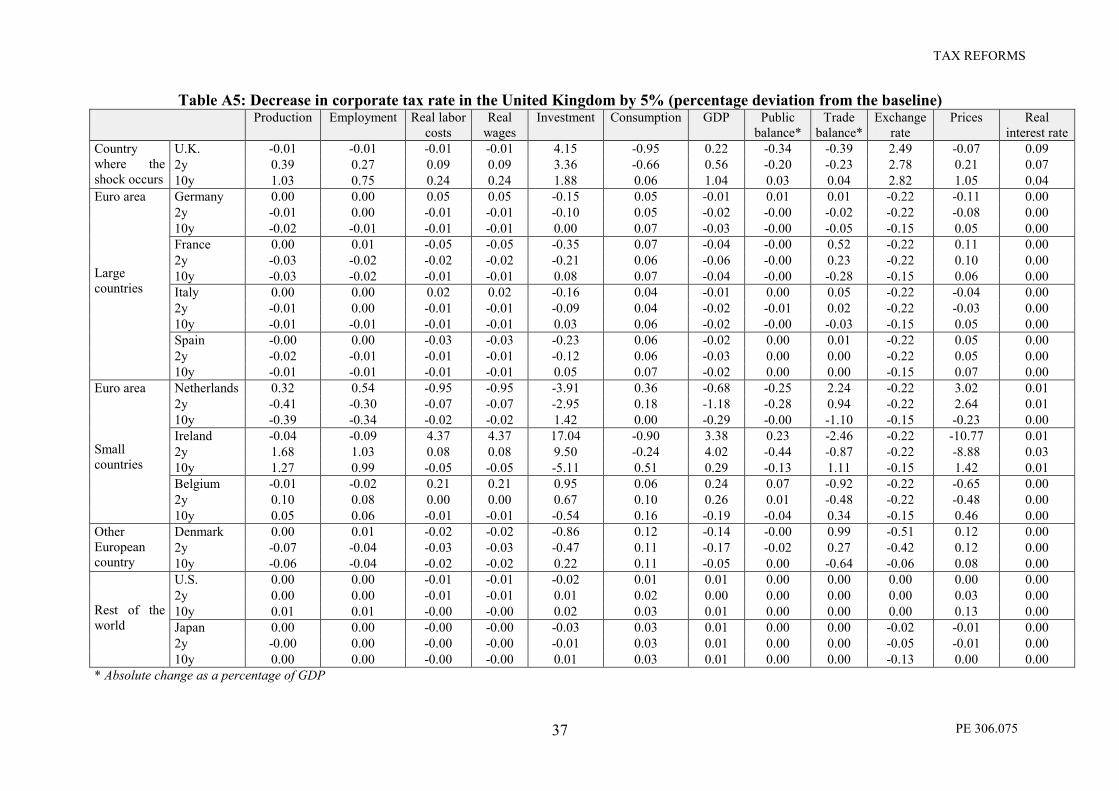
TAX REFORMS
PE 306.075 37
Table A5: Decrease in corporate tax rate in the United Kingdom by 5% (percentage deviation from the baseline) Production Employment Real labor
costs Real
wages Investment Consumption GDP Public
balance* Trade
balance*Exchange
rate Prices Real
interest rate U.K. -0.01 -0.01 -0.01 -0.01 4.15 -0.95 0.22 -0.34 -0.39 2.49 -0.07 0.09 2y 0.39 0.27 0.09 0.09 3.36 -0.66 0.56 -0.20 -0.23 2.78 0.21 0.07
Country where the shock occurs 10y 1.03 0.75 0.24 0.24 1.88 0.06 1.04 0.03 0.04 2.82 1.05 0.04
Germany 0.00 0.00 0.05 0.05 -0.15 0.05 -0.01 0.01 0.01 -0.22 -0.11 0.00 2y -0.01 0.00 -0.01 -0.01 -0.10 0.05 -0.02 -0.00 -0.02 -0.22 -0.08 0.00 10y -0.02 -0.01 -0.01 -0.01 0.00 0.07 -0.03 -0.00 -0.05 -0.15 0.05 0.00 France 0.00 0.01 -0.05 -0.05 -0.35 0.07 -0.04 -0.00 0.52 -0.22 0.11 0.00 2y -0.03 -0.02 -0.02 -0.02 -0.21 0.06 -0.06 -0.00 0.23 -0.22 0.10 0.00 10y -0.03 -0.02 -0.01 -0.01 0.08 0.07 -0.04 -0.00 -0.28 -0.15 0.06 0.00 Italy 0.00 0.00 0.02 0.02 -0.16 0.04 -0.01 0.00 0.05 -0.22 -0.04 0.00 2y -0.01 0.00 -0.01 -0.01 -0.09 0.04 -0.02 -0.01 0.02 -0.22 -0.03 0.00 10y -0.01 -0.01 -0.01 -0.01 0.03 0.06 -0.02 -0.00 -0.03 -0.15 0.05 0.00 Spain -0.00 0.00 -0.03 -0.03 -0.23 0.06 -0.02 0.00 0.01 -0.22 0.05 0.00 2y -0.02 -0.01 -0.01 -0.01 -0.12 0.06 -0.03 0.00 0.00 -0.22 0.05 0.00
Euro area Large countries
10y -0.01 -0.01 -0.01 -0.01 0.05 0.07 -0.02 0.00 0.00 -0.15 0.07 0.00 Netherlands 0.32 0.54 -0.95 -0.95 -3.91 0.36 -0.68 -0.25 2.24 -0.22 3.02 0.01 2y -0.41 -0.30 -0.07 -0.07 -2.95 0.18 -1.18 -0.28 0.94 -0.22 2.64 0.01 10y -0.39 -0.34 -0.02 -0.02 1.42 0.00 -0.29 -0.00 -1.10 -0.15 -0.23 0.00 Ireland -0.04 -0.09 4.37 4.37 17.04 -0.90 3.38 0.23 -2.46 -0.22 -10.77 0.01 2y 1.68 1.03 0.08 0.08 9.50 -0.24 4.02 -0.44 -0.87 -0.22 -8.88 0.03 10y 1.27 0.99 -0.05 -0.05 -5.11 0.51 0.29 -0.13 1.11 -0.15 1.42 0.01 Belgium -0.01 -0.02 0.21 0.21 0.95 0.06 0.24 0.07 -0.92 -0.22 -0.65 0.00 2y 0.10 0.08 0.00 0.00 0.67 0.10 0.26 0.01 -0.48 -0.22 -0.48 0.00
Euro area Small countries
10y 0.05 0.06 -0.01 -0.01 -0.54 0.16 -0.19 -0.04 0.34 -0.15 0.46 0.00 Denmark 0.00 0.01 -0.02 -0.02 -0.86 0.12 -0.14 -0.00 0.99 -0.51 0.12 0.00 2y -0.07 -0.04 -0.03 -0.03 -0.47 0.11 -0.17 -0.02 0.27 -0.42 0.12 0.00
Other European country 10y -0.06 -0.04 -0.02 -0.02 0.22 0.11 -0.05 0.00 -0.64 -0.06 0.08 0.00
U.S. 0.00 0.00 -0.01 -0.01 -0.02 0.01 0.01 0.00 0.00 0.00 0.00 0.00 2y 0.00 0.00 -0.01 -0.01 0.01 0.02 0.00 0.00 0.00 0.00 0.03 0.00 10y 0.01 0.01 -0.00 -0.00 0.02 0.03 0.01 0.00 0.00 0.00 0.13 0.00 Japan 0.00 0.00 -0.00 -0.00 -0.03 0.03 0.01 0.00 0.00 -0.02 -0.01 0.00 2y -0.00 0.00 -0.00 -0.00 -0.01 0.03 0.01 0.00 0.00 -0.05 -0.01 0.00
Rest of the world
10y 0.00 0.00 -0.00 -0.00 0.01 0.03 0.01 0.00 0.00 -0.13 0.00 0.00 * Absolute change as a percentage of GDP

TAX REFORMS
PE 306.075 38
Table A6: Decrease in the rate of households� income tax in the United Kingdom by 5% (percentage deviation from the baseline) Production Employment Real labor
costs Real
wages Investment Consumption GDP Public
balance* Trade
balance* Exchange
rate Prices Real
interest rate U.K. 0.10 0.13 -0.12 0.79 1.13 -0.09 0.17 -0.55 -0.12 0.80 0.05 0.03 2y 0.19 0.18 -0.10 0.81 0.76 -0.01 0.25 -0.46 -0.07 0.88 0.13 0.02
Country where the shock occurs 10y 0.37 0.35 -0.05 0.91 0.25 0.20 0.38 -0.26 0.02 0.83 0.34 0.01
Germany 0.00 0.00 0.02 0.02 -0.02 0.01 0.00 0.00 -0.01 -0.07 -0.05 0.00 2y 0.00 0.00 0.00 0.00 -0.02 0.01 0.00 0.00 -0.01 -0.07 -0.04 0.00 10y -0.01 0.00 0.00 0.01 -0.01 0.02 -0.01 0.00 -0.01 -0.05 0.01 0.00 France 0.00 0.00 -0.01 0.01 -0.10 0.02 -0.01 0.00 0.15 -0.07 0.02 0.00 2y -0.01 -0.01 0.00 0.02 -0.06 0.02 -0.02 0.00 0.07 -0.07 0.02 0.00 10y -0.01 -0.01 0.00 0.01 0.02 0.02 -0.01 0.00 -0.08 -0.05 0.02 0.00 Italy 0.00 0.00 0.01 0.02 -0.05 0.01 0.00 0.00 0.01 -0.07 -0.02 0.00 2y 0.00 0.00 0.00 0.01 -0.02 0.01 0.00 0.00 0.00 -0.07 -0.02 0.00 10y 0.00 0.00 0.00 0.00 0.01 0.02 0.00 0.00 -0.01 -0.05 0.01 0.00 Spain 0.00 0.00 -0.01 0.01 -0.07 0.02 -0.01 0.00 0.00 -0.07 0.01 0.00 2y -0.01 0.00 0.00 0.02 -0.04 0.02 -0.01 0.00 0.00 -0.07 0.01 0.00
Euro area Large countries
10y 0.00 0.00 0.00 0.01 0.01 0.02 -0.01 0.00 0.00 -0.05 0.02 0.00 Netherlands 0.09 0.15 -0.39 -0.18 -1.59 0.12 -0.29 -0.12 0.86 -0.07 0.82 0.01 2y -0.16 -0.12 -0.03 0.15 -1.12 0.05 -0.45 -0.11 0.36 -0.07 0.71 0.00 10y -0.15 -0.13 -0.01 -0.02 0.54 -0.01 -0.11 0.00 -0.41 -0.05 -0.07 0.00 Ireland -0.03 -0.06 1.61 1.01 6.41 -0.37 1.25 0.09 -0.92 -0.07 -3.06 0.01 2y 0.61 0.38 0.03 -0.45 3.55 -0.12 1.51 -0.16 -0.33 -0.07 -2.55 0.01 10y 0.47 0.36 -0.02 0.09 -1.93 0.17 0.11 -0.05 0.42 -0.05 0.30 0.01 Belgium 0.00 0.00 0.03 0.02 0.13 0.02 0.04 0.01 -1.54 -0.07 -0.06 0.00 2y 0.02 0.01 0.00 -0.01 0.11 0.03 0.04 0.00 -0.97 -0.07 -0.04 0.00
Euro area Small countries
10y 0.00 0.00 0.00 0.02 -0.13 0.05 -0.07 -0.01 0.53 -0.05 0.07 0.00 Denmark 0.00 0.00 -0.01 0.03 -0.25 0.04 -0.04 0.00 0.29 -0.15 0.00 0.00 2y -0.02 -0.01 -0.01 0.02 -0.14 0.03 -0.05 0.00 0.08 -0.13 0.01 0.00
Other European country 10y -0.02 -0.01 -0.01 0.00 0.06 0.03 -0.02 0.00 -0.19 -0.02 0.02 0.00
U.S. 0.00 0.00 0.00 0.00 0.00 0.00 0.00 0.00 0.00 0.00 0.00 0.00 2y 0.00 0.00 0.00 0.00 0.00 0.01 0.00 0.00 0.00 0.00 0.01 0.00 10y 0.00 0.00 0.00 0.00 0.01 0.01 0.00 0.00 0.00 0.00 0.04 0.00 Japan 0.00 0.00 0.00 0.01 -0.01 0.01 0.00 0.00 0.00 -0.01 0.00 0.00 2y 0.00 0.00 0.00 0.01 0.00 0.01 0.00 0.00 0.00 -0.02 0.00 0.00
Rest of the world
10y 0.00 0.00 0.00 0.00 0.00 0.01 0.00 0.00 0.00 -0.04 0.00 0.00 * Absolute change as a percentage of GDP

TAX REFORMS
PE 306.075 39
Table A7: Decrease in social contribution rate in the Euro area by 5% (percentage deviation from the baseline) Production Employment Real labor
costs Real
wages Investment Consumption GDP Public
balance* Trade
balance* Exchange
rate Prices Real
interest rate Germany 0.03 0.05 -0.29 1.39 0.60 -0.17 0.03 -0.70 -0.01 0.54 0.11 0.03 2y 0.14 0.18 -0.22 1.45 0.68 -0.07 0.13 -0.56 0.03 0.68 0.22 0.03 10y 0.35 0.38 -0.15 1.50 0.59 0.22 0.33 -0.30 0.09 0.97 0.56 0.02 France 0.07 0.12 -0.28 1.91 0.85 -0.18 0.06 -0.87 -0.34 0.54 -0.01 0.04 2y 0.18 0.20 -0.29 1.89 0.76 -0.05 0.15 -0.74 -0.19 0.68 0.09 0.04 10y 0.48 0.47 -0.20 1.97 0.68 0.33 0.43 -0.39 0.01 0.97 0.40 0.03 Italy 0.07 0.12 -0.29 0.93 0.49 -0.06 0.05 -0.62 0.01 0.54 0.30 0.03 2y 0.10 0.11 -0.17 1.05 0.40 0.01 0.07 -0.51 0.00 0.68 0.41 0.02 10y 0.28 0.27 -0.11 1.08 0.47 0.24 0.24 -0.27 -0.02 0.97 0.67 0.02 Spain -0.04 -0.06 -0.43 0.77 -0.08 -0.04 -0.05 -0.62 0.00 0.54 0.48 0.02 2y 0.08 0.10 -0.17 1.03 0.26 0.03 0.05 -0.48 0.00 0.68 0.59 0.02 10y 0.24 0.25 -0.11 1.05 0.40 0.25 0.21 -0.27 -0.01 0.97 0.77 0.01 Netherlands -0.02 -0.03 0.30 1.99 2.96 -0.26 0.50 -0.49 -1.24 0.54 -1.14 0.03 2y 0.40 0.36 -0.22 1.49 2.20 -0.05 0.80 -0.40 -0.52 0.68 -0.88 0.03 10y 0.65 0.63 -0.17 1.78 -0.12 0.41 0.63 -0.23 0.58 0.97 0.57 0.02 Ireland 0.02 0.04 -0.37 0.41 0.13 0.09 0.09 -0.40 -0.02 0.54 0.54 0.01 2y 0.04 0.05 -0.14 0.65 0.22 0.10 0.09 -0.33 -0.02 0.68 0.69 0.01 10y 0.08 0.10 -0.12 0.73 -0.16 0.20 -0.04 -0.20 0.05 0.97 1.22 0.01 Belgium 0.05 0.08 0.03 1.42 2.04 -0.07 0.37 -0.56 -1.30 0.54 -0.44 0.03 2y 0.29 0.27 -0.18 1.21 1.42 0.08 0.54 -0.50 -0.50 0.68 -0.24 0.03
Countries where the shock occurs Euro area
10y 0.49 0.49 -0.11 1.36 0.12 0.40 0.49 -0.27 0.40 0.97 0.62 0.02 U.K. 0.02 0.03 -0.03 0.16 -0.85 0.09 -0.13 0.01 0.16 -0.64 0.02 0.01 2y -0.06 -0.03 -0.05 0.13 -0.49 0.10 -0.19 0.00 0.08 -0.55 0.06 0.01 10y -0.06 -0.05 -0.03 0.04 0.22 0.16 -0.09 0.01 -0.06 -0.07 0.15 0.00 Denmark 0.01 0.02 -0.06 0.30 -2.35 0.28 -0.40 -0.01 2.83 -1.46 0.02 0.01 2y -0.19 -0.11 -0.09 0.21 -1.19 0.25 -0.47 -0.05 0.79 -1.17 0.06 0.01
Other European countries
10y -0.13 -0.10 -0.04 0.01 0.62 0.25 -0.13 0.01 -1.51 -0.02 0.13 0.00 U.S. 0.00 0.00 -0.01 0.01 -0.02 0.01 0.00 0.00 0.01 0.00 0.01 0.00 2y 0.00 0.00 -0.01 0.01 0.00 0.01 0.00 0.00 0.00 0.00 0.03 0.00 10y 0.01 0.01 -0.01 0.01 0.02 0.04 0.01 0.00 -0.01 0.00 0.13 0.00 Japan 0.00 0.00 0.00 0.02 -0.05 0.04 0.01 0.00 0.00 -0.06 0.00 0.00 2y 0.00 0.00 -0.01 0.02 -0.03 0.04 0.01 0.00 0.00 -0.08 0.01 0.00
Rest of the world
10y 0.00 0.00 0.00 0.02 0.01 0.05 0.01 0.00 0.00 -0.15 0.02 0.00 * Absolute change as a percentage of GDP
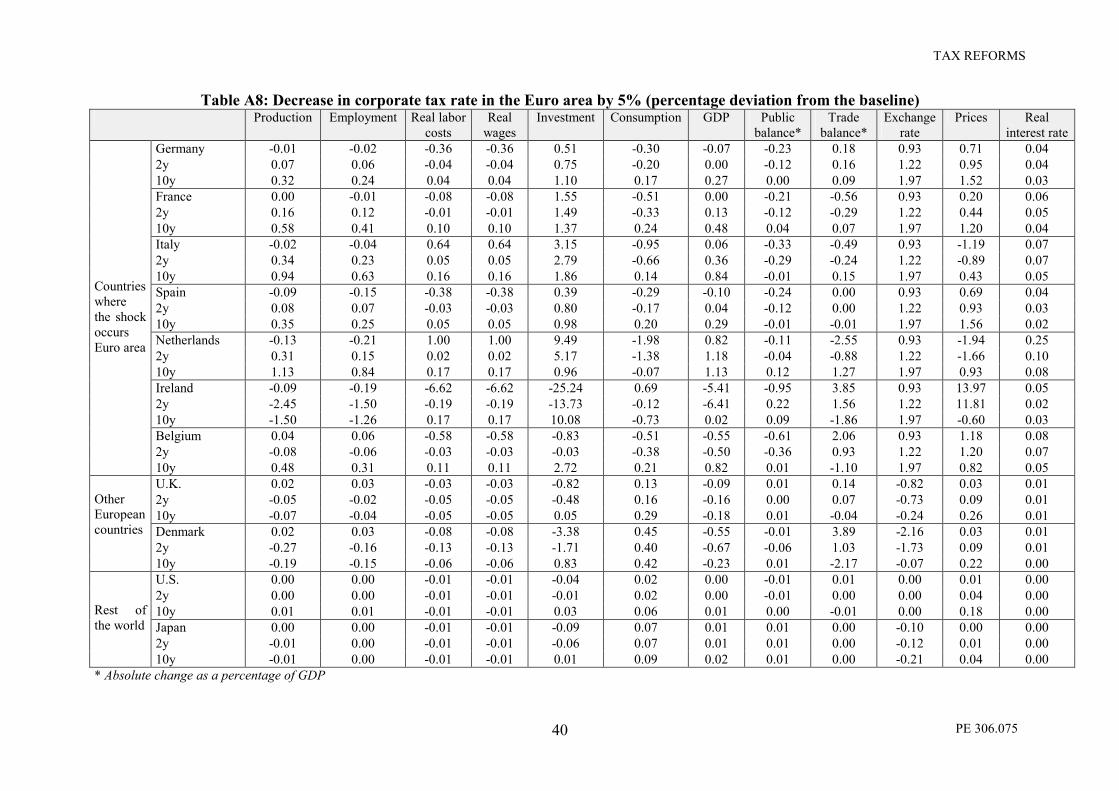
TAX REFORMS
PE 306.075 40
Table A8: Decrease in corporate tax rate in the Euro area by 5% (percentage deviation from the baseline) Production Employment Real labor
costs Real
wages Investment Consumption GDP Public
balance* Trade
balance* Exchange
rate Prices Real
interest rate Germany -0.01 -0.02 -0.36 -0.36 0.51 -0.30 -0.07 -0.23 0.18 0.93 0.71 0.04 2y 0.07 0.06 -0.04 -0.04 0.75 -0.20 0.00 -0.12 0.16 1.22 0.95 0.04 10y 0.32 0.24 0.04 0.04 1.10 0.17 0.27 0.00 0.09 1.97 1.52 0.03 France 0.00 -0.01 -0.08 -0.08 1.55 -0.51 0.00 -0.21 -0.56 0.93 0.20 0.06 2y 0.16 0.12 -0.01 -0.01 1.49 -0.33 0.13 -0.12 -0.29 1.22 0.44 0.05 10y 0.58 0.41 0.10 0.10 1.37 0.24 0.48 0.04 0.07 1.97 1.20 0.04 Italy -0.02 -0.04 0.64 0.64 3.15 -0.95 0.06 -0.33 -0.49 0.93 -1.19 0.07 2y 0.34 0.23 0.05 0.05 2.79 -0.66 0.36 -0.29 -0.24 1.22 -0.89 0.07 10y 0.94 0.63 0.16 0.16 1.86 0.14 0.84 -0.01 0.15 1.97 0.43 0.05 Spain -0.09 -0.15 -0.38 -0.38 0.39 -0.29 -0.10 -0.24 0.00 0.93 0.69 0.04 2y 0.08 0.07 -0.03 -0.03 0.80 -0.17 0.04 -0.12 0.00 1.22 0.93 0.03 10y 0.35 0.25 0.05 0.05 0.98 0.20 0.29 -0.01 -0.01 1.97 1.56 0.02 Netherlands -0.13 -0.21 1.00 1.00 9.49 -1.98 0.82 -0.11 -2.55 0.93 -1.94 0.25 2y 0.31 0.15 0.02 0.02 5.17 -1.38 1.18 -0.04 -0.88 1.22 -1.66 0.10 10y 1.13 0.84 0.17 0.17 0.96 -0.07 1.13 0.12 1.27 1.97 0.93 0.08 Ireland -0.09 -0.19 -6.62 -6.62 -25.24 0.69 -5.41 -0.95 3.85 0.93 13.97 0.05 2y -2.45 -1.50 -0.19 -0.19 -13.73 -0.12 -6.41 0.22 1.56 1.22 11.81 0.02 10y -1.50 -1.26 0.17 0.17 10.08 -0.73 0.02 0.09 -1.86 1.97 -0.60 0.03 Belgium 0.04 0.06 -0.58 -0.58 -0.83 -0.51 -0.55 -0.61 2.06 0.93 1.18 0.08 2y -0.08 -0.06 -0.03 -0.03 -0.03 -0.38 -0.50 -0.36 0.93 1.22 1.20 0.07
Countries where the shock occurs Euro area
10y 0.48 0.31 0.11 0.11 2.72 0.21 0.82 0.01 -1.10 1.97 0.82 0.05 U.K. 0.02 0.03 -0.03 -0.03 -0.82 0.13 -0.09 0.01 0.14 -0.82 0.03 0.01 2y -0.05 -0.02 -0.05 -0.05 -0.48 0.16 -0.16 0.00 0.07 -0.73 0.09 0.01 10y -0.07 -0.04 -0.05 -0.05 0.05 0.29 -0.18 0.01 -0.04 -0.24 0.26 0.01 Denmark 0.02 0.03 -0.08 -0.08 -3.38 0.45 -0.55 -0.01 3.89 -2.16 0.03 0.01 2y -0.27 -0.16 -0.13 -0.13 -1.71 0.40 -0.67 -0.06 1.03 -1.73 0.09 0.01
Other European countries
10y -0.19 -0.15 -0.06 -0.06 0.83 0.42 -0.23 0.01 -2.17 -0.07 0.22 0.00 U.S. 0.00 0.00 -0.01 -0.01 -0.04 0.02 0.00 -0.01 0.01 0.00 0.01 0.00 2y 0.00 0.00 -0.01 -0.01 -0.01 0.02 0.00 -0.01 0.00 0.00 0.04 0.00 10y 0.01 0.01 -0.01 -0.01 0.03 0.06 0.01 0.00 -0.01 0.00 0.18 0.00 Japan 0.00 0.00 -0.01 -0.01 -0.09 0.07 0.01 0.01 0.00 -0.10 0.00 0.00 2y -0.01 0.00 -0.01 -0.01 -0.06 0.07 0.01 0.01 0.00 -0.12 0.01 0.00
Rest of the world
10y -0.01 0.00 -0.01 -0.01 0.01 0.09 0.02 0.01 0.00 -0.21 0.04 0.00 * Absolute change as a percentage of GDP
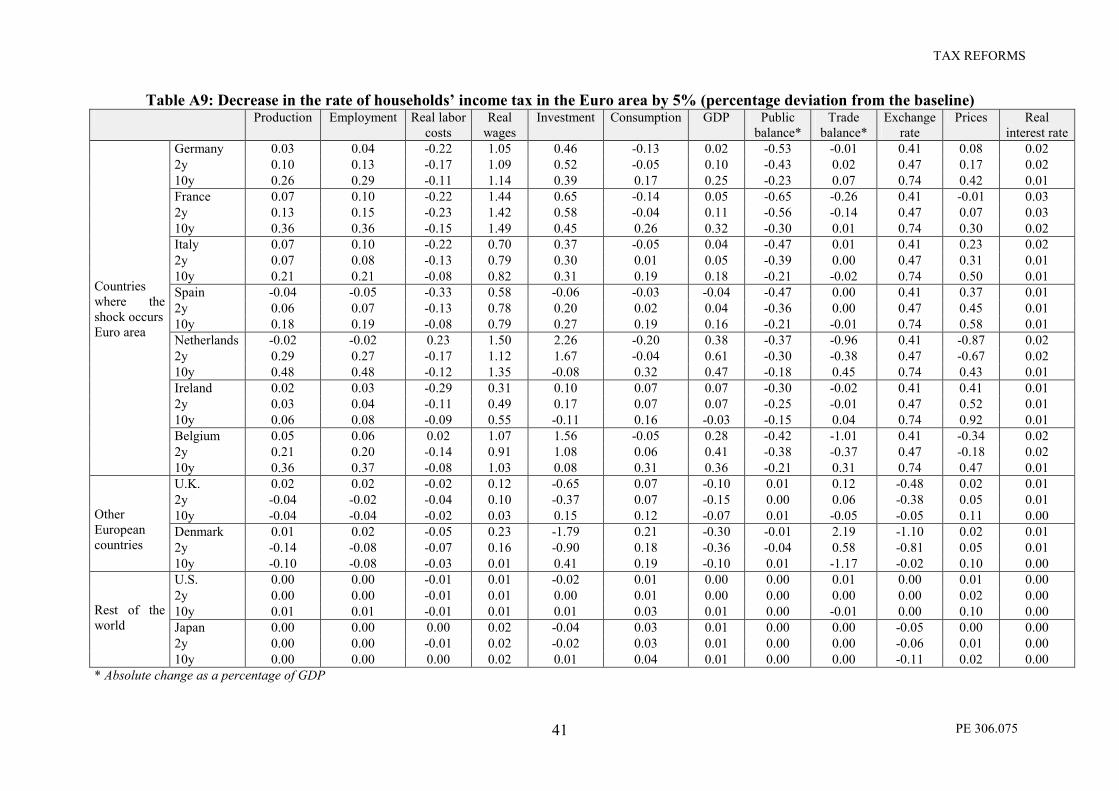
TAX REFORMS
PE 306.075 41
Table A9: Decrease in the rate of households� income tax in the Euro area by 5% (percentage deviation from the baseline) Production Employment Real labor
costs Real
wages Investment Consumption GDP Public
balance* Trade
balance* Exchange
rate Prices Real
interest rate Germany 0.03 0.04 -0.22 1.05 0.46 -0.13 0.02 -0.53 -0.01 0.41 0.08 0.02 2y 0.10 0.13 -0.17 1.09 0.52 -0.05 0.10 -0.43 0.02 0.47 0.17 0.02 10y 0.26 0.29 -0.11 1.14 0.39 0.17 0.25 -0.23 0.07 0.74 0.42 0.01 France 0.07 0.10 -0.22 1.44 0.65 -0.14 0.05 -0.65 -0.26 0.41 -0.01 0.03 2y 0.13 0.15 -0.23 1.42 0.58 -0.04 0.11 -0.56 -0.14 0.47 0.07 0.03 10y 0.36 0.36 -0.15 1.49 0.45 0.26 0.32 -0.30 0.01 0.74 0.30 0.02 Italy 0.07 0.10 -0.22 0.70 0.37 -0.05 0.04 -0.47 0.01 0.41 0.23 0.02 2y 0.07 0.08 -0.13 0.79 0.30 0.01 0.05 -0.39 0.00 0.47 0.31 0.01 10y 0.21 0.21 -0.08 0.82 0.31 0.19 0.18 -0.21 -0.02 0.74 0.50 0.01 Spain -0.04 -0.05 -0.33 0.58 -0.06 -0.03 -0.04 -0.47 0.00 0.41 0.37 0.01 2y 0.06 0.07 -0.13 0.78 0.20 0.02 0.04 -0.36 0.00 0.47 0.45 0.01 10y 0.18 0.19 -0.08 0.79 0.27 0.19 0.16 -0.21 -0.01 0.74 0.58 0.01 Netherlands -0.02 -0.02 0.23 1.50 2.26 -0.20 0.38 -0.37 -0.96 0.41 -0.87 0.02 2y 0.29 0.27 -0.17 1.12 1.67 -0.04 0.61 -0.30 -0.38 0.47 -0.67 0.02 10y 0.48 0.48 -0.12 1.35 -0.08 0.32 0.47 -0.18 0.45 0.74 0.43 0.01 Ireland 0.02 0.03 -0.29 0.31 0.10 0.07 0.07 -0.30 -0.02 0.41 0.41 0.01 2y 0.03 0.04 -0.11 0.49 0.17 0.07 0.07 -0.25 -0.01 0.47 0.52 0.01 10y 0.06 0.08 -0.09 0.55 -0.11 0.16 -0.03 -0.15 0.04 0.74 0.92 0.01 Belgium 0.05 0.06 0.02 1.07 1.56 -0.05 0.28 -0.42 -1.01 0.41 -0.34 0.02 2y 0.21 0.20 -0.14 0.91 1.08 0.06 0.41 -0.38 -0.37 0.47 -0.18 0.02
Countries where the shock occurs Euro area
10y 0.36 0.37 -0.08 1.03 0.08 0.31 0.36 -0.21 0.31 0.74 0.47 0.01 U.K. 0.02 0.02 -0.02 0.12 -0.65 0.07 -0.10 0.01 0.12 -0.48 0.02 0.01 2y -0.04 -0.02 -0.04 0.10 -0.37 0.07 -0.15 0.00 0.06 -0.38 0.05 0.01 10y -0.04 -0.04 -0.02 0.03 0.15 0.12 -0.07 0.01 -0.05 -0.05 0.11 0.00 Denmark 0.01 0.02 -0.05 0.23 -1.79 0.21 -0.30 -0.01 2.19 -1.10 0.02 0.01 2y -0.14 -0.08 -0.07 0.16 -0.90 0.18 -0.36 -0.04 0.58 -0.81 0.05 0.01
Other European countries
10y -0.10 -0.08 -0.03 0.01 0.41 0.19 -0.10 0.01 -1.17 -0.02 0.10 0.00 U.S. 0.00 0.00 -0.01 0.01 -0.02 0.01 0.00 0.00 0.01 0.00 0.01 0.00 2y 0.00 0.00 -0.01 0.01 0.00 0.01 0.00 0.00 0.00 0.00 0.02 0.00 10y 0.01 0.01 -0.01 0.01 0.01 0.03 0.01 0.00 -0.01 0.00 0.10 0.00 Japan 0.00 0.00 0.00 0.02 -0.04 0.03 0.01 0.00 0.00 -0.05 0.00 0.00 2y 0.00 0.00 -0.01 0.02 -0.02 0.03 0.01 0.00 0.00 -0.06 0.01 0.00
Rest of the world
10y 0.00 0.00 0.00 0.02 0.01 0.04 0.01 0.00 0.00 -0.11 0.02 0.00 * Absolute change as a percentage of GDP

TAX REFORMS
PE 306.075 42
Table A10 : Calibrating ongoing tax reforms Simulated impact of the ongoing reforms
on the effective tax rate associated to Simulation hypothesis for
Social contributions
Corporate tax Personal income
Social contributions
Corporate tax Personal income
Belgium -5,0 -32,8 -11,5 Ad hoc 80% of the tax cut explained by the reform on standard firms (from 40 to 30%). 20% by the reform on the SMEs corporate tax (from 40 to 15%).
Cut in the entry rate set to the European average (-15.9%). Cut in the top rate set to the European average (-8.5%).
Denmark -6,3 0 Nominal tax cut from 32 to 30%. The base broadening is not taken into account.
No cuts
France -19,0 -14,9 80% of the tax cut explained by the reform on standard firms (from 36.6 to 33.3%). 20% by the reform on the SMEs corporate tax (from 36.6 to 15%).
Cut in the top rate from 54 to 52.5% Cut in the entry rate from 9.6 to 7.0%
Germany -27,1 -26,1 50% of the cut due to the reduction in tax rates on retained profits (from 40 to 25%). 50% of the cut due to the reduction in tax rates on distributed profits (from 30 to 25%).
Cut in the top rate from 53.8 to 45.3% Cut in the entry rate from 22.9 to 15%
Ireland -11,5 -6,3 50% of the cut due to the reduction in tax rates for domestic firms (from 24 to 12.5%). 50% of the tax cut due to the increase in tax rates for FMNs (from 10 to 12.5%).
Cut in the top rate from 46 to 44% Cut in the entry rate from 24 to 22%
Italy -5,0 -5,4 -4,8 Ad hoc Nominal tax cut from 37% to 35%. Cut in the top rate from 46 to 44% Cut in the entry rate from 19 to 18%
Luxembourg -20,0 0 Cut in the effective corporate tax rate from 37.5 to 30%. No cuts Netherlands -5,0 -5 -14,6 Ad hoc Cut in the statutory tax rate for the first 50,000 NGL. Cut in the top rate from 60 to 52%
Cut in the entry rate set to the European average (-15.9%)
Spain 0 0 No tax reform No cuts United Kingdom
-9,1 -6,4 Cut in the statutory tax rate, from 33 to 30%. Cut in the top rate set to the European average (-8.5%) Cut in the entry rate from 23 to 22%
Belgium-Luxembourg
-26,4 -5,7 For the Belgium-Luxembourg aggregate, we weight 50% of the Belgian tax reform, and 50 % of the Luxembourg tax reform
For the Belgium-Luxembourg aggregate, we weight 50% of the Belgian tax reform, and 50 % of the Luxembourg tax reform
General assum
ption: the tax cut comes for 50%
of the cut in the top rate, and for 50%of the cut
in the entry rate

TAX REFORMS
PE 306.075 43
Table A11: Simulation of the on-going tax reforms (percentage deviation from the baseline) Production Employment Real labor
costs Real
wages Investment Consumption GDP Public
balance* Trade
balance* Exchange
rate Prices Real
interest rate
Germany 2y 1.37 1.32 -0.78 0.05 10.08 -2.22 1.80 -2.64 -0.80 3.71 -2.13 0.28
10y 3.21 2.88 -0.34 0.06 5.32 0.93 2.91 -1.15 1.70 7.14 3.59 0.21
France 2y 0.92 0.73 -0.34 0.01 6.95 -1.34 0.91 -1.24 -2.04 3.71 0.21 0.24
10y 2.75 2.08 0.09 0.02 5.36 1.43 2.17 -0.27 1.13 7.14 4.37 0.18
Italy 2y 0.37 0.38 -0.55 1.08 2.41 -0.17 0.17 -1.71 0.16 3.71 3.31 0.15
10y 1.41 1.15 -0.20 1.09 3.62 1.39 1.13 -0.74 -0.24 7.14 6.11 0.10
Spain 2y -0.33 -0.14 -0.42 0.01 -2.03 0.90 -0.57 -0.14 0.05 3.71 7.97 0.05
10y -0.26 -0.12 -0.22 0.01 0.84 1.22 -0.40 0.05 -0.07 7.14 9.57 0.03
Netherlands 2y 2.60 2.19 -0.83 1.80 15.95 -0.57 5.32 -1.40 -2.91 3.71 -5.13 0.25
10y 3.91 3.59 -0.55 1.83 -1.42 2.96 2.62 -1.03 3.37 7.14 5.94 0.19
Ireland 2y -0.30 -0.11 -0.48 0.02 -0.95 -0.81 -1.64 -1.61 0.55 3.71 5.08 0.15
10y 1.08 0.71 -0.09 0.02 6.23 0.71 1.13 -0.86 -0.29 7.14 5.00 0.14
Belgium 2y -0.49 -0.35 -0.72 1.70 -3.12 -3.87 -1.61 -4.77 2.34 3.71 5.90 0.59
10y 0.22 -0.44 0.00 1.64 3.61 -0.50 0.73 0.03 -2.63 7.14 5.82 0.37
U.K. 2y 0.63 0.56 -0.24 0.01 4.21 -0.51 0.35 -0.95 -0.06 2.45 1.38 0.22
10y 1.96 1.55 0.16 0.01 4.51 1.63 1.57 -0.21 -0.18 5.48 3.87 0.12
Denmark 2y -0.25 -0.12 -0.29 0.01 -1.09 -0.21 -1.26 -0.52 3.12 -1.25 0.88 0.14
10y 0.52 0.35 0.00 0.00 3.94 0.93 0.18 0.00 -2.728 3.43 2.77 0.10
*Absolute change as a percentage of GDP

TAX REFORM
PE 306.075 44
TAX REFORM
PE 306.075 45
Part II: Integration of Capital Markets and Corporate Taxation
II.1. Introduction In recent years, most EU countries have been engaged in reducing corporate taxation. This is obviously the case in Germany, where nominal corporate tax rates are to be cut from a maximum of 40% in 1999 to 25% in 2001, but also in Belgium, Denmark, France, Italy, Luxembourg, Portugal and the United Kingdom (see Appendix A). In Ireland, the standard corporate tax rate is to fall dramatically (from 24% in 2000 to 12.5% in 2003, 2001 for SMEs), although the derogatory 10% rate is to be removed.
The macroeconomic impact of such cuts has been examined in Part I of this report, which has examined the efficiency impact of such tax reforms. In the previous Chapter, it was also clear that international spillovers through trade, interest rates and exchange rates are crucial for assessing the impact of corporate tax cuts.
However the concerns which arise in the case of non-cooperative corporate tax cuts also depend on another type of spillover, not accounted for by macro-econometric models: namely, that some countries could use tax cuts to attract foreign firms with the aim of raising domestic employment at the expense of foreign countries. This concern is especially acute since increasing capital market integration in the EU gives an impetus to capital mobility, and hence to the tax-sensitivity of location decisions. Moreover, the launching of the euro reduces transaction costs and cancels exchange-rate uncertainty in the euro-zone, magnifying capital mobility. Finally, the euro abolishes the possibility of intra-European devaluation. Having lost the tool of competitive devaluation, inflationary countries could feel the temptation to offset increasing unit costs by implementing tax reduction schemes.
As argued in Part I, the only thing that might really deter a country from reducing taxes would be the fiscal-balance implications of tax cuts. However corporate taxes account for a relatively small share of fiscal receipts in all EU countries (2% of GDP in average in the EU, compared for instance to 12% for social contributions). In addition, if foreign direct investment is highly sensitive to tax differentials, then a tax cut raises the corporate tax base, and the outcome can be ambiguous for corporate tax receipts (see Gropp and Kostial, 2000). Hence, a �race to the bottom� in corporate tax rates is not unlikely in the EU9.
The consequence of such tax competition could be a welfare-reducing deformation of the tax structure (with higher rates on less mobile bases, e.g. non-qualified labour or sticky activities)10, and possibly a deterioration in fiscal balances. Indeed, although the fiscal implication of an isolated tax cut can be unclear, a generalisation of tax cuts all over the EU would unambiguously deteriorate fiscal balances since no country would be able to attract investment from its EU partners through lower corporate taxation.
Such fears justify examining in depth the impact of corporate tax rate cuts within the framework of an integrated economy allowing for capital mobility. Clearly, the corresponding measures are only part of the ongoing tax reforms, since the latter also concern personal income taxation, but they magnify the risks associated with non-cooperative decisions implemented by Member States.
9 Appendix II-1 analyses whether such downward convergence has already started in the EU. 10 Such distortion should however be weighted against the benefits from higher domestic investment.

TAX REFORM
PE 306.075 46
While European officials have regularly been advocating co-ordinated tax reforms, designed both to improve the neutrality of taxation and to avoid the adverse impact of one country cutting its taxes and reaping investment from its partners, the ongoing reforms do not stem from any co-operative action between European states. This trend is a source of worry, as it could be the tangible manifestation of growing tax competition in Europe. Advocates of tax harmonisation have nevertheless been active in the EU through the 1990s, and some measures have been implemented.
II.1.1. Tax co-ordination in Europe in an historical perspective Since the beginning of the 1990s, there has been a growing concern in the European Union about the possible perverse effects of corporate tax competition. The increasing mobility of capital gives room for tax-induced location choices by firms, which could force European countries to cut corporate tax rates in order to attract capital, and could lead the tax burden to fall more and more heavily on less mobile revenue-earners, mostly workers.
This has led to increasing calls for tax harmonisation11, which first resulted in technical reforms, mainly directed to reduce the possibilities for double taxation of multinational profits (parent-subsidiary directive of 1990).
The second step of the harmonisation process in Europe was taken by the Ruding committee, which submitted its report to the Commission in 1992. The importance of tax neutrality in Europe was reasserted, one of the recommendations being the extension of the 1990 Directive to interests and royalties paid by foreign affiliates to their mother firms. In the meantime, the harmonisation of transfer pricing rules in Europe was advocated, as some form of control of tax incentives. In addition, the Committee called for a harmonisation of tax rates and of tax bases, in order for nominal tax rate harmonisation to end in effective tax rate harmonisation. However, the conclusions of the Ruding committee failed to be incorporated in any Directive proposal, and it became clear that tax harmonisation would not be easily reached through technical provisions.
The European Commission therefore undertook the third and latest step of the harmonisation process, by including corporate tax issues in a more general discussion on taxes. The negative consequences of the unanimity needed to adopt any agreement on tax issues could therefore be circumvented by the fact that most countries could make a trade-off between the favourable and unfavourable consequences, with respect to their own situation, on the �tax package�. This tax package included a Code of conduct, planning the removal of the 66 harmful tax measures later identified in the Primarolo Report in 199912. It also included provisions concerning the taxation of savings income, noticeably the treatment of investment funds and of international bonds13.
The strong political sensitiveness of some issues included in the tax package (for instance the taxation of savings income, or the emphasis placed on some harmful tax measures which contribute to the wealth of the European countries implementing them) delayed the adoption of a common agreement, which was finally reached at the Feira Council in June 2000. However, full agreement on the exchange of information was postponed to 2010.
11 In the mid-seventies, the Commission had already proposed a Directive designing the harmonisation of tax systems around some European average. This early proposal proved however to be short lived (Gammie and Radaelli, 2000). 12 Mrs Primarolo, Financial Secretary at the UK Treasury. 13 For an analysis of the economic rationale of the Code of Conduct, see Genser and Haufler (1999).

TAX REFORM
PE 306.075 47
II.1.2. Our focus The aim of Part II is to assess the impact of tax differentials on the location of firms, and therefore to appraise the impact of ongoing corporate tax reforms, as well as the potential for tax competition. The consequences of tax co-operation within the EU are also studied, tax co-operation being defined either as some harmonisation of tax rates (such as an agreement on a minimum rate), or as the harmonisation of tax systems: i.e. the way taxes are collected.
Section II.2 provides an assessment on the impact of corporate tax differentials on foreign direct investment between OECD countries. Although the existing literature is inconclusive on this issue, we provide unambiguous results through working on bilateral data and accounting for differences in tax schemes: differentials in corporate tax rates matter as far as FDI inflows are concerned.
In Section II.3, the impact of ongoing corporate tax reforms on the location of investment across the EU is simulated, and we compare the impact of various isolated reforms to the impact of joint reforms in the various EU countries.
Section II.4 is devoted to longer term issues. We study what could happen if ongoing reforms were to trigger a generalised corporate tax competition, and we analyse which type of tax co-operation - a harmonisation of rates or of schemes � would be helpful. Section II.5 concludes.
II.2. The impact of corporate taxation on the location of firms
II.2.1. The existing literature Tax considerations can affect the location decisions of firms through two different channels. The first is the differential in tax levels, which impacts on investment decisions because taxes enter the cost function. The second concerns the way taxes are collected (i.e. tax systems), which affects the sensitiveness of location to tax incentives.
II.2.1.1. Tax differentials vs. tax schemes With the development of the literature of economic geography, the impact of tax differentials on the location of firms has become a matter of controversy. Indeed, while traditional tax competition literature has produced clear-cut arguments, concluding that firms do react to tax differentials, recent developments in economic geography suggest that this reaction might well disappear with agglomeration economies.
According to traditional tax competition literature, tax differentials affect the location decisions of firms. Since taxes belong to the production costs of firms, and as long as capital is mobile, firms will try to avoid higher tax-induced costs, and will not locate in high-tax countries (Hines, 1996).
This conclusion holds in competitive frameworks with perfect mobility of capital. However, when elements of imperfect competition are introduced into the theoretical framework, these clear-cut conclusions can dramatically change. Indeed, the concentration of firms in one location can give rise to agglomeration economies (at least to the point where congestion occurs), which tend to reduce the future mobility of multinational firms (MNFs thereafter), as hysteresis in the location of firms arises. As a consequence, mobile factors may be insensitive to marginal tax rate changes if they are locked in an industrial cluster (Andersson & Forslid, 1999).

TAX REFORM
PE 306.075 48
Tax differentials can therefore survive even in a highly integrated economy, since agglomeration creates rents for the mobile factor that can be taxed (Baldwin & Krugman, 2000)14. More specifically, a �big� country can even impose a higher tax on FDI earnings than �small� countries without producing a disincentive for MNFs to locate their production in this big country (Haufler & Wooton, 1999).
The impact of tax incentives on FDI flows does not only depend on the mobility of capital and on agglomeration effects. Indeed, the magnitude of tax incentives highly depends on the scheme ruling the taxation of repatriated profits in the country of the mother firm.
The taxation of repatriated profits can follow one of two different schemes, which are both designed to avoid double taxation problems. The first is the full exemption scheme, implemented in most European countries (see Table II-1). Under this scheme, profits made by an affiliate in a foreign country are taxed according to the tax rules and rates of this country. If the profits are repatriated by the mother firm, they will bear no taxes in the home country of the mother firm (they are fully exempted from taxation). Under such a scheme, multinational firms feel an incentive to locate their affiliates in countries where the corporate tax rate is low, since they will save the difference between the (high) home country tax rate and the (low) foreign country rate. Hence, concerns about tax competition are relevant under such a scheme.
Table II-1 Tax schemes applied to repatriated countries in selected OECD countries.
Origin country of investor Principle of taxation at home Remark Belgium Exemption at 95% Considered as full exemption
Luxembourg Full exemption France Full exemption Assumption: application of the parent-
subsidiary directive in all cases Germany Full exemption Ireland Partial Credit scheme
Italy Exemption at 95% Considered as full exemption Netherlands Full exemption
Spain Full exemption United-Kingdom Partial Credit scheme
United States Partial Credit scheme Japan Partial Credit scheme
Source: Baker and McKenzie (1999), OFCE (1999), Wilson (1999) and Baker and McEnzie Report (1999).
The second tax scheme has been adopted in Europe by the United Kingdom and Ireland, and by the United States and Japan elsewhere. Under such a scheme, the profits made by an affiliate are still taxed according to the rules in force in this country. But when profits are repatriated, the mother firm is given a credit for taxes paid abroad, and has to pay taxes in the home country according to the domestic tax rules.
14 This does not preclude the possibility of tax competition, but implies that tax competition, if it appears, will be more subtle than a simple race to the lowest rate. Indeed, attractive countries will tend to set tax rates that are higher than those of less attractive ones, but low enough to dissuade them from setting low tax rates (as the tax differentials they would be able to offer then would not be enough to attract activities).

TAX REFORM
PE 306.075 49
Hence, under such a scheme, multinational firms are indifferent to tax differentials as long as the domestic rate is above the foreign one, since they will pay the home tax rate anyhow. They will only react to tax differentials when the domestic tax rate is below the foreign one, because they are not refunded for excess taxes paid abroad, (only partial credit schemes are applied). Under such a scheme, the effect of tax competition is radically different to what happens with the exemption scheme, since the sensitivity of FDI to tax rebates abroad disappears (see Figure II-1).
Figure II-1. The tax sensitivity of FDI according to tax schemes
Origin country
Host country
Foreign tax indifference
Tax sensitivity (negative)
Origin country
Host country
Tax sensitivity (negative)Tax sensitivity (positive)
Tax
leve
lT
ax le
vel
Partialcredit schemes
Exemption schemes
Source: authors� construction.
II.2.1.2. Empirical evidence
II.2.1.2.1. Tax regimes and country-level analysis
Most early studies focused on the tax-determinants of FDI from and to the United States, and highlighted the role of tax schemes. Their main conclusion was that FDI stemming from exemption-scheme countries is more sensitive to high taxes in the host country (Slemrod, 1990, Auerbach and Hassett, 1993, Swenson, 1994, Hines, 1996).
Recent studies working on diversified samples of countries do not always confirm these results. Gropp and Kostial (2000), working on a sample of 12 OECD countries, show that exemption countries tend to display more outward FDI than credit countries, and that tax levels matter. But Hubert & Pain (2000) fail to find any significant impact of tax-related determinants for German FDI to the EU, whereas agglomeration economies and public expenditure are shown to matter.

TAX REFORM
PE 306.075 50
II.2.1.2.2. Firm-level analysis
In line with the economic geography literature, some studies underscore the leading role of agglomeration economies, which leave tax considerations well behind (Wheeler and Mody, 1992, Mayer and Mucchielli, 1999, Head et al., 1999).
However, other studies show tax considerations to be relevant in investment decisions This is particularly the case when they are conditional to the prior decision to produce abroad rather than to export (Devereux & Griffith, 1998, Friedman et al., 1992), or when the nature of FDI (greenfield versus acquisitions) is taken into account (Smith and Florida, 1994).
II.2.1.2.3. The limits of estimation strategies so far
The mixed results obtained so far might be due to the testing strategies used in the papers. As a matter of fact, at a very micro level, distance or agglomeration economies are shown to dominate taxation issues markedly. This is all the more true since we have very little information on tax rebates or the advantages that local authorities, for instance, can offer for new investors. Hence, firm-level analysis can hardly provide a comprehensive picture of the relative tax-attractiveness of the various EU territories.
Moreover, at a more macro level, existing work dealing with the impact of corporate taxation on FDI focuses either on a single host or investing country (often the United States), or on a limited number of countries vis-à-vis the �rest of the world�. Studying only one country allows the detailing of tax incentives vis-à-vis each partner. However, the conclusion can result from a country-specific effect. In addition, the empirical analysis itself encounters small-sample problems. Conversely, working on a larger set of countries allows the drawing of more general conclusions. However, if FDI data is aggregated between partner countries (either hosts or investing ones), tax incentives must be aggregated too and it is difficult to control fully for tax schemes. We believe working on comprehensive bilateral data is necessary when assessing the role of tax incentives for the location of output.
II.2.1.2.4. Our strategy
As mentioned above, the existing literature points to taxation systems as a key determinant of tax incentives for the location of MNFs� output, while emphasising the importance of accounting for agglomeration effects. Our estimation strategy builds on these conclusions: tax differentials are thoroughly corrected for tax systems. In addition, size effects and agglomeration economies are allowed for through the inclusion of a market potential determinant of FDI. Finally, we relate bilateral FDI flows to various measures of bilateral tax differentials.
Our analysis is general in the sense that it covers cross FDI between 11 countries rather than FDI in or out one single country. In particular, both flows across EU members and flows between EU and non-EU members are covered. This will make it possible to catch the impact of EU reforms on FDI coming from non-EU countries. Working on a large cross-country sample over a relatively large time span (1985-1995) also permits reliable estimates.
II.2.2. The impact of tax differentials on FDI flows: new empirical evidence We study the impact of tax differentials on FDI flows between OECD countries, through controlling for tax schemes and for the �structural� determinants of FDI behaviour underlined in the economic geography literature. The definition of the variables used in the econometric estimation as well as the data sources are detailed in Appendix II-2.

TAX REFORM
PE 306.075 51
We assume that the decision of a MNF to locate in a given country translates into an increase in inward FDI flows in this country, from the country of the mother-firm. Hence, location decisions are proxied by (bilateral) inward FDI flows, which are expressed in constant dollars in order to correct for the disturbing impact of inflation in the valuation of FDI flows.
The use of bilateral data allows us to draw very general conclusions (not dependent on a specific investing or host country) and to allow for world consistency (since outflows are considered as mirror data of inflows and tax incentives are proxied by tax differentials). The flows account for FDI in all sectors, and the corresponding data come from Eurostat data bases. We use a panel of 9 European countries (EU12 less Portugal and Greece due to the lack of data, Belgium and Luxembourg being treated together), plus third countries (Japan and the United States), on a time sample covering the years 1985 to 1995.
We use effective and statutory tax rate differentials successively as potential determinants of FDI, while accounting for taxation schemes (credit vs. exemption)15. Control variables include economic geography variables such as market access, but also gravitational variables such as transportation costs or the size of the investing country, as well as exchange-rate volatility. Panel estimations are carried out with fixed effects on host countries and on time.
II.2.2.1. Control variables Recent findings in economic geography emphasise how the market potential of alternative locations impacts on the choice of MNFs (Baldwin and Krugman, 2000). Consequently this must be considered in the design of corporate tax policies by governments: tax cuts are needless for a highly attractive country as far as encouraging FDI in concerned. In order to take this effect into account, we introduce as a first control variable the market potential of the recipient country. Obviously, the relevant market potential is not limited to the domestic market of the host country: exports towards neighbouring countries have to be taken into account, which is all the more true when the integrated, European market is concerned. We therefore build market potential data, inspired from Isard (1954) and Harris (1954). The market potential is a distance-to-host weighted average of GDPs of EU regions, including the average internal distance between regions in the host country. In order to catch demand expectations rather than a joint determination of market potential and of FDI, we use the rationally-expected (one period ahead) market potential, which is expected to have a positive impact on inward FDI.
Aside from agglomeration-led factors, FDI flows are also empirically known to be determined by �gravitational� variables, i.e. the distance between exporting and recipient country, and the relative size of both countries (Fontagné & Pajot, 2000). These are also introduced as control variables into the analysis.
First, the size of the origin country, proxied by its GDP, is introduced as a supply variable, on the ground that large countries have a greater potential than small countries for investing abroad.
Secondly, we also introduce differences in market sizes (normalised GDP difference), hypothesising that they tend to limit the potential for foreign production if external economies of scale matter (according to Helpman and Krugman, 1985, external economies of scale lead to the concentration of the production in the larger country).
15 Estimations using the cost of capital (calculated by Devereux and Pearson, 1995, and by Hugounenq et al., 1999) were also carried out, but the results are not reported here as the capital cost did not show up as significant.

TAX REFORM
PE 306.075 52
Thirdly, transportation costs, proxied here by the distance between the investing and the host country, are another important determinant of the decision to invest abroad versus to export. According to the �proximity-concentration trade-off�, large transportation costs between the origin and destination country favour FDI at the expense of trade, for a given level of returns to scale. Hence, a positive impact of distance on FDI should be observed. However this view is generally not supported by empirical evidence, which highlights the fact that FDI flows and trade are complements (Fontagné, 1999). In the latter view, distance has a negative impact on both trade and FDI which are co-determined by geographic, but also non- geographic factors (language, culture, border effect). In order to account for this co-determination, we add the bilateral openness ratio as an explanatory variable: pairs of countries trading a lot must also invest a lot on their respective markets. Alternatively, if tariff jumping is the prominent motive for investing abroad, trade openness would be negatively related to FDI.
Finally , we introduce nominal exchange rate volatility as a measure of profit uncertainty, on the ground that an increasing literature now emphasises the impact of uncertainty (and more especially exchange rate uncertainty) as a major determinant of the decision to invest (see for instance Kulatilaka and Kogut, 1996).
II.2.2.2. Tax variables Tax-friendly countries are expected to attract more FDI if tax discrepancies are not fully balanced by differences in distance, access to market or purchasing power. Accordingly, the regressions are run on tax differentials, not on tax levels. But a proper calculation of these differences implies that tax schemes be fully accounted for. While tax schemes are usually identified through a dummy variable (see for instance Gropp and Kostial, 2000), we develop a more precise method, which allows us to distinguish carefully the impact of tax differential according to the tax schemes in operation.
As a first step, bilateral differences in tax rates (referred to as �tax differentials� below) are calculated as simple differences between the corporate tax rates in the host and in the investing country. This calculation is made for both statutory and effective tax rates, the latter being defined as a percentage of the operating surplus16. Indeed, considering effective tax rates rather than statutory rates is more realistic but is potentially obscured by the fact that multinational firms will locate profits in tax-friendly countries; hence, effective taxation could appear heavier ex post than it is ex ante (Hines and Rice, 1994). Hence, both measures are needed to assess properly the impact of taxation on location decisions.
In a second step, we control for the differences in taxation regimes in the sample by setting to zero the tax differential when the investor comes from a credit-scheme country and the host country exhibits lower taxation. The United States, the United Kingdom, Japan and Ireland apply such partial credit schemes to their firms: firms originating from these countries will be sensitive to tax differentials only to the extent that the tax rate abroad is higher than the one at home (see Figure II-1 above), and hence will only be affected by negative tax incentives. Conversely, an exemption scheme is applied to investors from other countries, which makes them sensitive to any tax discrepancy17.
16 Regressions were also performed with employers� social contributions (as a percentage of employees� compensations). However this variable did not show up as significant. 17 Notice that running these simulations relies on the assumption that all profits from multinationals are repatriated, which is an extreme assumption. However, according to the UNCTAD, repatriated profits are significant in proportion to FDI inflows (about 30%), which justify such a benchmark simulation
TAX REFORM
PE 306.075 53
II.2.2.3. Estimation results The results are provided in Appendix II-3. All the variables included in the empirical analysis significantly explain the behaviour of inward FDI, in the direction that was theoretically expected.
II.2.2.3.1. Control variables
In line with the most recent economic geography literature, the market potential associated with a given location has a positive impact on inward FDI. It should be remembered that this effect is obtained through considering not only the domestic market, as far as European countries are concerned, but also the market in other European countries of the sample. This means that foreign firms, when they decide to invest in Europe, are strongly influenced by the accessibility of other European markets.
As expected, the size of the investing country has a positive impact on its investment abroad, which reflects a supply effect, large countries having a greater potential for investing abroad. The differences in size between the investing and the host countries reduce the bilateral investment ceteris paribus. Large countries prefer to invest in large countries, because they can exploit economies of scale when accessing to a large market, and small countries do not have the financial scope to invest efficiently in large countries.
A larger bilateral openness is associated with more bilateral FDI, departing from the argument of tariff jumping, but consistent with the hypothesis that trade and FDI are complements. This is confirmed by the fact that the distance between the investing and the recipient country plays a negative role in the location decision of firms. Hence, firms do not invest in order to get into a protected market, but � on the contrary � because they already have trade links with the market under consideration.
Higher bilateral exchange rate volatility reduces inward investment, evidence of the impact of monetary uncertainty on FDI flows. Note that this effect is symmetrical: more volatility reduces FDI flows in both directions between two countries. This increase in cross-country FDI flows is an expected outcome of EMU. It is welfare-enhancing to the extent that investors previously refrained from investing abroad due to exchange-rate uncertainty.
II.2.2.3.2. Tax differentials
Turning to tax variables, the estimates show that a higher corporate taxation in the host country relative to the investing country always tends to reduce FDI inflows to the recipient country18. The impact of tax discrepancies is always significant on FDI, and does not depend on the use of effective or statutory taxation measures19. More importantly, this result holds in a situation where the forces that should counteract the impact of tax differentials on FDI (agglomeration economies or structural determinants of FDI) are taken into account. This suggest that tax incentives are a robust determinant of FDI flows.
18 If corporate taxes are standardised by the value added (not reported), the parameter is raised since the value added is by definition larger than the operating surplus. However the significance level is reduced. The poor evidence obtained by value-added standardised taxation might be the consequence of the quality of the data: since value-added data are not always available from the OECD for all countries and all years, some of them have to be constructed. 19 The coefficient is smaller for statutory tax rates, due to the larger values of the tax variable, but it is nevertheless significant.

TAX REFORM
PE 306.075 54
Given this result, one cannot reject the hypothesis of tax competition. Indeed, even if geographic variables have a strong and dominant impact on FDI flows, there still remains the possibility for countries to create tax incentives in order to attract foreign direct investment. The only limit to this potential competition is that it would probably be limited to countries which lie at a comparable distance from the investor. However, the magnitude of the potential competition should not be underestimated, since most European countries are close one to the other, and tend to have intense FDI links: the stake of tax competition is therefore of considerable importance.
In the following, we use our empirical estimates to simulate various scenarios in the EU, starting with the impact of ongoing reforms (Section II.3) and then moving to longer-term issues (Section II.4).
II.3. The impact of ongoing tax reforms in the European Union Since the mid-eighties, corporate tax rates have tended to converge in the European Union. This is true both for statutory and effective tax rates. As no harmonisation of tax rates was carried out during this period, there is a strong suspicion that some form of tax competition took place in Europe. Indeed, as shown in Table II-2 and Table II-3, the improved integration in European goods and capital markets has resulted in a convergence in statutory corporate tax rates to around 35% in 1997, the average nominal tax rate being lower at the end of the 1990 than a few years before.
Table II-2- Statutory corporate tax rates (in %)
1990 1991 1993 1994 1997 2003* Germany 43.0 43.0 43.0 37.5 37.5 25.0 Belgium 43.0 39.0 39.0 39.0 39.0 30.0 Denmark 40.0 38.0 38.0 34.0 34.0 30.0 Spain 35.0 35.0 35.0 35.0 35.0 35.0 France 39.5 38.0 34.0 33.3 37.7 33.3 Ireland** 43.0/10.0 43.0/10.0 40.0/10.0 40.0/10.0 38.0/10.0 12.5 Italy 36.0 36.0 36.0 36.0 36.0 35 Netherlands 35.0 35.0 35.0 35.0 35.0 35.0 United-Kingdom 35.0 34.0 33.0 33.0 33.0 30.0 United States 34 34 34 34 34 - Japan 37.5 37.5 37.5 37.5 37.5 - Average EU 38.8/35.2 37.9/34.2 37.0/33.7 35.9/32.5 35.6/32.5 29.5 Standard deviation
3.4/9.4 3.1/8.9 3.1/8.8 2.3/8.2 2.0/8.2 6.8
Source: European Commission and OECD (2000). Assumption: 50% of the dividends are re-invested in the subsidiary.
* Latest scheduled year for the implementation of the planned reforms (in France, Ireland and Italy). ** In Ireland, the rate to be applied to manufacturing industry and some services was reduced to 10% until December 31, 2000, and will be set to 12.5% from January 1st, 2001. Hence the first figure concerns domestic firms, the second one foreign firms locating in tax-favourable areas. The discrepancy in tax rates is to be abolished for 2003.
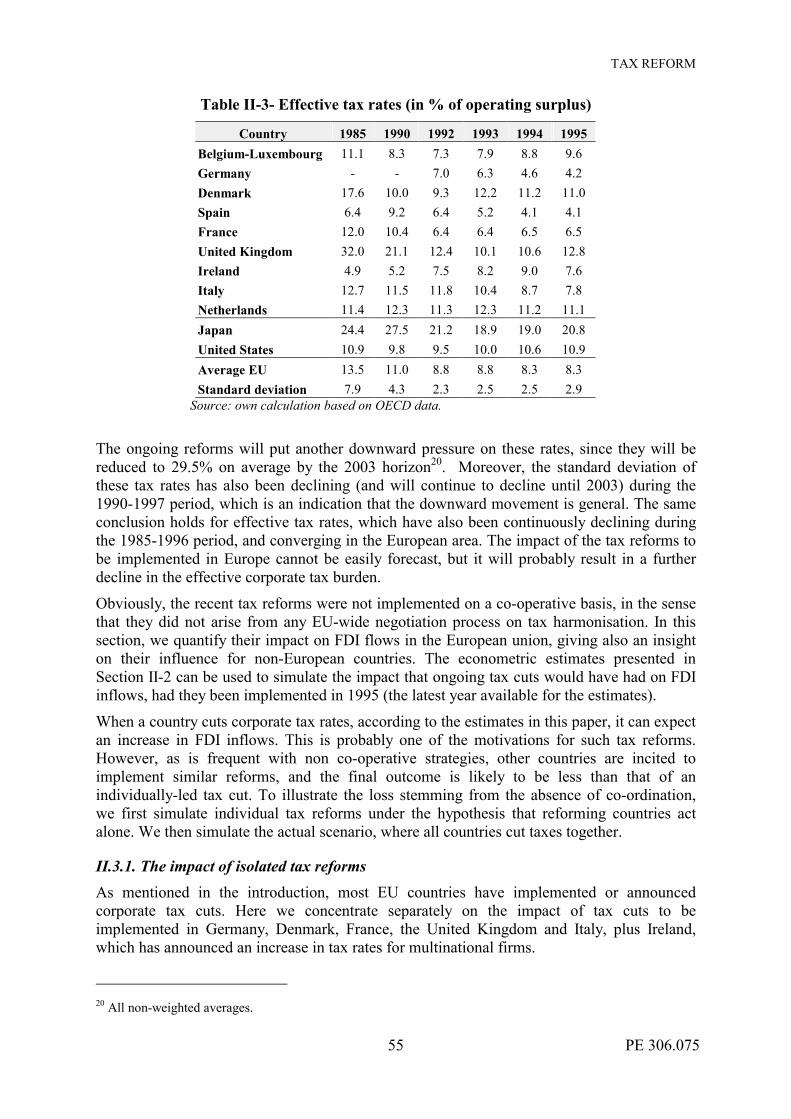
TAX REFORM
PE 306.075 55
Table II-3- Effective tax rates (in % of operating surplus)
Country 1985 1990 1992 1993 1994 1995 Belgium-Luxembourg 11.1 8.3 7.3 7.9 8.8 9.6 Germany - - 7.0 6.3 4.6 4.2 Denmark 17.6 10.0 9.3 12.2 11.2 11.0 Spain 6.4 9.2 6.4 5.2 4.1 4.1 France 12.0 10.4 6.4 6.4 6.5 6.5 United Kingdom 32.0 21.1 12.4 10.1 10.6 12.8 Ireland 4.9 5.2 7.5 8.2 9.0 7.6 Italy 12.7 11.5 11.8 10.4 8.7 7.8 Netherlands 11.4 12.3 11.3 12.3 11.2 11.1 Japan 24.4 27.5 21.2 18.9 19.0 20.8 United States 10.9 9.8 9.5 10.0 10.6 10.9 Average EU 13.5 11.0 8.8 8.8 8.3 8.3 Standard deviation 7.9 4.3 2.3 2.5 2.5 2.9
Source: own calculation based on OECD data.
The ongoing reforms will put another downward pressure on these rates, since they will be reduced to 29.5% on average by the 2003 horizon20. Moreover, the standard deviation of these tax rates has also been declining (and will continue to decline until 2003) during the 1990-1997 period, which is an indication that the downward movement is general. The same conclusion holds for effective tax rates, which have also been continuously declining during the 1985-1996 period, and converging in the European area. The impact of the tax reforms to be implemented in Europe cannot be easily forecast, but it will probably result in a further decline in the effective corporate tax burden.
Obviously, the recent tax reforms were not implemented on a co-operative basis, in the sense that they did not arise from any EU-wide negotiation process on tax harmonisation. In this section, we quantify their impact on FDI flows in the European union, giving also an insight on their influence for non-European countries. The econometric estimates presented in Section II-2 can be used to simulate the impact that ongoing tax cuts would have had on FDI inflows, had they been implemented in 1995 (the latest year available for the estimates).
When a country cuts corporate tax rates, according to the estimates in this paper, it can expect an increase in FDI inflows. This is probably one of the motivations for such tax reforms. However, as is frequent with non co-operative strategies, other countries are incited to implement similar reforms, and the final outcome is likely to be less than that of an individually-led tax cut. To illustrate the loss stemming from the absence of co-ordination, we first simulate individual tax reforms under the hypothesis that reforming countries act alone. We then simulate the actual scenario, where all countries cut taxes together.
II.3.1. The impact of isolated tax reforms As mentioned in the introduction, most EU countries have implemented or announced corporate tax cuts. Here we concentrate separately on the impact of tax cuts to be implemented in Germany, Denmark, France, the United Kingdom and Italy, plus Ireland, which has announced an increase in tax rates for multinational firms.
20 All non-weighted averages.
TAX REFORM
PE 306.075 56
Given the lack of FDI data, it is not possible to simulate the impact of tax reforms in the other EU countries (namely Austria, Finland and Portugal). It is also impossible to simulate the impact of the tax reform in Belgium and Luxembourg, because FDI data do not distinguish between these two countries21. However, given the linearity of the estimated econometric equation, the impact of a tax cut in one country is similar to the impact of a cut of the same magnitude in another country. Hence, the results obtained from the countries of the sample can be easily transposed to other countries22.
Simulations are carried out on statutory taxation, on the basis of Equation (2) (see Appendix II-3). Indeed, it is very difficult to forecast the impact of a nominal tax change on the effective tax burden, given the absence of information about the reaction of tax bases to tax rates. A decrease in nominal tax rates should have the direct effect of reducing tax receipts, hence reducing the tax burden. However, tax cuts are frequently associated with a broadening of the definition of the tax base, which makes the final impact less clear, since more tax revenues can be potentially levied. Moreover, there can be an indirect effect of tax cuts: if mobile factors tend to locate where taxation is cheaper, the tax base is endogenously broadened, and the ex-post effective taxation can increase. For these reasons, we chose to circumscribe the simulation to nominal taxation.
Three kinds of tax reforms are identified: the very wide tax reform in Germany, the small-sized tax cuts in Denmark, France, Italy and the UK, and the tax increase for foreign multi-nationals in Ireland. It should be remembered that, in this first step, each reform is simulated as if other countries were not implementing reforms at the same time. This assumption is removed in Section II.3.2 where the joint effect of all reforms is studied.
II.3.1.1.Germany: a significant tax cut As detailed in the general introduction and in Appendix A, in the summer of 2000, the German government announced an important tax reform, directed at reviving investment and consumption in Germany. One of the most striking features of this plan was the impressive cut in corporate tax rates, which should be reduced from a maximum rate of 40% in 1999 to 25% in 2001, leading to a significant decrease in effective taxation as well.
The impact the German reform could have on FDI is presented in Table II-4. Due to tax cuts, inward FDI in Germany should rise, whereas FDI outflows should decline given that German MNFs are granted an exemption tax scheme for repatriated profits. The gain for Germany would be rather sizeable, since this country would record an annual $1.8 billion increase of inward FDI, corresponding to 1.7% of total inward investment in the countries of the sample. This increase stems from all the countries of the sample. It also comes from countries applying credit schemes, due to the initial very high level of German tax rates: the high initial level of tax rates was an impediment to FDI stemming from credit-countries like the USA or the UK (and of course Japan or Ireland). Cutting these taxes reduces the disincentive to invest, and hence generates FDI.
The other European countries of the sample would record a loss in terms of inward FDI, due to their relative loss in terms of attractiveness. This loss is due to the fact that German firms would cut their investments outside Germany.
21 The corporate tax reform in the Netherlands was not simulated, as it only holds for the first bracket of taxable profits. Since it is only partial, its impact on the average tax rate is not easily forecastable. 22 This is also the reason why the simulations should be taken as illustrations rather than forecasts.

TAX REFORM
PE 306.075 57
Table II-4. The impact of the 2000 tax reform in Germany
Country Observed inward FDI
(millions USD)
Impact of the German tax
reform (millions
USD)
Gains in % of total inward FDI in the
countries of the sample
Bel-Luxg 5,507 -229 -0.2 Germany 21,815 1,826 1.7 Denmark 1,387 -234 -0.2 Spain 1,051 -253 -0.2 France 6,917 -218 -0.2 U-K 28,554 -220 -0.2 Ireland 4,968 -240 -0.2 Italy 2,106 -256 -0.2 Japan 5,516 -207 -0.2 Netherlands 4,378 -222 -0.2 United States 24,154 -221 -0.2 Total 106,354 -475 -0.4
Sub total EU15 76,683 -47 0.0
Note: we simulate the impact of a one-shot drop in the nominal corporate tax rate in Germany from 37.5% (average of the 45% and 30% rates) to 25%, in 1995 (last year available in our sample).
The impact is not neutral for the EU as a whole, which loses from the tax reform in Germany. This is due to the fact that Germany attracts fewer FDI from countries operating credit schemes23 than these countries lose in terms of inward German FDI. As a consequence, there is a net (but very limited) loss for the EU.
The loss is recorded also outside Europe. Hence, this simulation exercise confirms the negative externality associated with a non-co-operative tax strategy aiming at attracting FDI: FDI is attracted, but to the detriment of other partner countries.
II.3.1.2. Small-sized tax cuts in Denmark, France, Italy and the UK Most ongoing corporate tax cuts in the EU are of less ambitious magnitude than in Germany. For instance, taxes are to be cut from 33% to 30% in the UK, or from 32 to 30% in Denmark (see Appendix A). These tax reforms tend to narrow the range of statutory tax rates observed in the European Union, and they appear as a convergence of these rates to the average of the EU.
Given the limited magnitude of the tax cuts, their impact on FDI inflows should be also limited. Indeed, the results presented in Table II-5 show that these cuts, if they were implemented by only one country at a time (we assume that each country would undertake the tax reform alone), would be almost neutral for this country, and for its partners as well.
23 Remember that MNFs submitted to tax credit schemes will only be sensitive to the reduction in the disincentive that previously arose from the high corporate tax rates in Germany. Hence, they will invest less in Germany that MNFs benefiting from exemption schemes, which can take advantage of the whole cut in tax differentials.
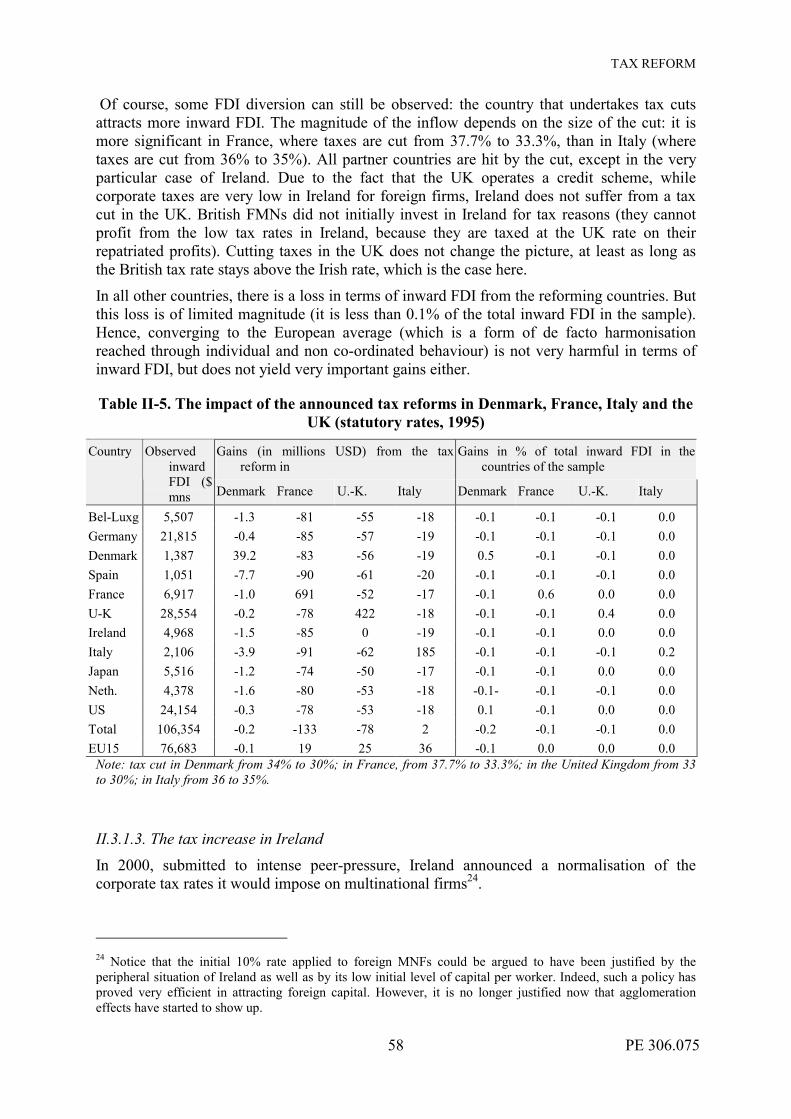
TAX REFORM
PE 306.075 58
Of course, some FDI diversion can still be observed: the country that undertakes tax cuts attracts more inward FDI. The magnitude of the inflow depends on the size of the cut: it is more significant in France, where taxes are cut from 37.7% to 33.3%, than in Italy (where taxes are cut from 36% to 35%). All partner countries are hit by the cut, except in the very particular case of Ireland. Due to the fact that the UK operates a credit scheme, while corporate taxes are very low in Ireland for foreign firms, Ireland does not suffer from a tax cut in the UK. British FMNs did not initially invest in Ireland for tax reasons (they cannot profit from the low tax rates in Ireland, because they are taxed at the UK rate on their repatriated profits). Cutting taxes in the UK does not change the picture, at least as long as the British tax rate stays above the Irish rate, which is the case here.
In all other countries, there is a loss in terms of inward FDI from the reforming countries. But this loss is of limited magnitude (it is less than 0.1% of the total inward FDI in the sample). Hence, converging to the European average (which is a form of de facto harmonisation reached through individual and non co-ordinated behaviour) is not very harmful in terms of inward FDI, but does not yield very important gains either.
Table II-5. The impact of the announced tax reforms in Denmark, France, Italy and the UK (statutory rates, 1995)
Gains (in millions USD) from the tax reform in
Gains in % of total inward FDI in the countries of the sample
Country Observed inward FDI ($ mns Denmark France U.-K. Italy Denmark France U.-K. Italy
Bel-Luxg 5,507 -1.3 -81 -55 -18 -0.1 -0.1 -0.1 0.0 Germany 21,815 -0.4 -85 -57 -19 -0.1 -0.1 -0.1 0.0 Denmark 1,387 39.2 -83 -56 -19 0.5 -0.1 -0.1 0.0 Spain 1,051 -7.7 -90 -61 -20 -0.1 -0.1 -0.1 0.0 France 6,917 -1.0 691 -52 -17 -0.1 0.6 0.0 0.0 U-K 28,554 -0.2 -78 422 -18 -0.1 -0.1 0.4 0.0 Ireland 4,968 -1.5 -85 0 -19 -0.1 -0.1 0.0 0.0 Italy 2,106 -3.9 -91 -62 185 -0.1 -0.1 -0.1 0.2 Japan 5,516 -1.2 -74 -50 -17 -0.1 -0.1 0.0 0.0 Neth. 4,378 -1.6 -80 -53 -18 -0.1- -0.1 -0.1 0.0 US 24,154 -0.3 -78 -53 -18 0.1 -0.1 0.0 0.0 Total 106,354 -0.2 -133 -78 2 -0.2 -0.1 -0.1 0.0 EU15 76,683 -0.1 19 25 36 -0.1 0.0 0.0 0.0
Note: tax cut in Denmark from 34% to 30%; in France, from 37.7% to 33.3%; in the United Kingdom from 33 to 30%; in Italy from 36 to 35%.
II.3.1.3. The tax increase in Ireland In 2000, submitted to intense peer-pressure, Ireland announced a normalisation of the corporate tax rates it would impose on multinational firms24.
24 Notice that the initial 10% rate applied to foreign MNFs could be argued to have been justified by the peripheral situation of Ireland as well as by its low initial level of capital per worker. Indeed, such a policy has proved very efficient in attracting foreign capital. However, it is no longer justified now that agglomeration effects have started to show up.
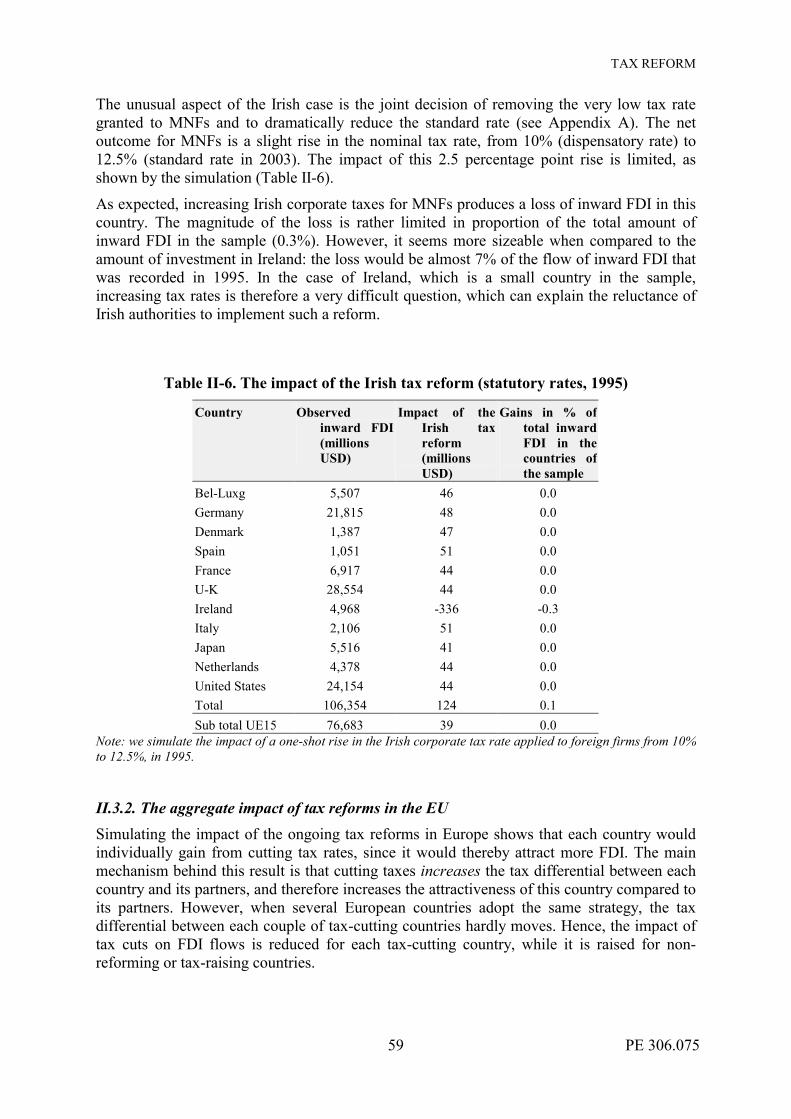
TAX REFORM
PE 306.075 59
The unusual aspect of the Irish case is the joint decision of removing the very low tax rate granted to MNFs and to dramatically reduce the standard rate (see Appendix A). The net outcome for MNFs is a slight rise in the nominal tax rate, from 10% (dispensatory rate) to 12.5% (standard rate in 2003). The impact of this 2.5 percentage point rise is limited, as shown by the simulation (Table II-6).
As expected, increasing Irish corporate taxes for MNFs produces a loss of inward FDI in this country. The magnitude of the loss is rather limited in proportion of the total amount of inward FDI in the sample (0.3%). However, it seems more sizeable when compared to the amount of investment in Ireland: the loss would be almost 7% of the flow of inward FDI that was recorded in 1995. In the case of Ireland, which is a small country in the sample, increasing tax rates is therefore a very difficult question, which can explain the reluctance of Irish authorities to implement such a reform.
Table II-6. The impact of the Irish tax reform (statutory rates, 1995)
Country Observed inward FDI (millions USD)
Impact of the Irish tax reform (millions USD)
Gains in % of total inward FDI in the countries of the sample
Bel-Luxg 5,507 46 0.0 Germany 21,815 48 0.0 Denmark 1,387 47 0.0 Spain 1,051 51 0.0 France 6,917 44 0.0 U-K 28,554 44 0.0 Ireland 4,968 -336 -0.3 Italy 2,106 51 0.0 Japan 5,516 41 0.0 Netherlands 4,378 44 0.0 United States 24,154 44 0.0 Total 106,354 124 0.1 Sub total UE15 76,683 39 0.0
Note: we simulate the impact of a one-shot rise in the Irish corporate tax rate applied to foreign firms from 10% to 12.5%, in 1995.
II.3.2. The aggregate impact of tax reforms in the EU Simulating the impact of the ongoing tax reforms in Europe shows that each country would individually gain from cutting tax rates, since it would thereby attract more FDI. The main mechanism behind this result is that cutting taxes increases the tax differential between each country and its partners, and therefore increases the attractiveness of this country compared to its partners. However, when several European countries adopt the same strategy, the tax differential between each couple of tax-cutting countries hardly moves. Hence, the impact of tax cuts on FDI flows is reduced for each tax-cutting country, while it is raised for non-reforming or tax-raising countries.

TAX REFORM
PE 306.075 60
Table II- 7 shows the impact of implementing all ongoing tax reforms at the same time in the EU. As expected, the countries that undertake tax cuts gain less in terms of inward FDI than if they cut taxes alone, and those that either do not cut taxes or raise them lose even more.
The countries that plan to implement rather ambitious tax cuts (Germany and, to a lesser extent, Denmark, France and the UK) record a reduced gain. Those, like Italy, which only plan on a limited tax cut switch from a gain to a loss in terms of FDI. In Italy, the loss is indeed due to the fact that other countries cut their tax rates even more, so that in the end, tax differentials are even more detrimental to FDI inflows25.
Table II- 7. The aggregate impact of announced tax reforms in the EU (statutory rates, 1995)
Gains from the tax reform in Recall: gains of the individual tax reform in the reforming country
Country Observed inward FDI (mns USD) Millions
USD % of total FDI
in the sample
Millions USD
% of total FDI in the sample
Bel-Luxg 5,507 -419 -0.4 - - Germany 21,815 1,693 1.6 1,826 1.7 Denmark 1,387 254 0.2 543 0.5 Spain 1,051 -454 -0.4 - - France 6,917 377 0.4 691 0.6 U-K 28,554 80 0.1 422 0.4 Ireland 4,968 -757 -0.7 -336 -0.3 Italy 2,106 -255 -0.2 185 0.2 Japan 5,516 -371 -0.3 - - Netherlands 4,378 -399 -0.4 - - United States 24,154 -397 -0.4 - - Total 106,354 -641 -0.6 - - Sub total EU15 76,683 127 0.1 - -
Note: detail of the simulation.
Although the EU-average corporate tax rate declines dramatically, the increase in FDI inflows for the EU as a whole is negligible because the non-EU countries of the sample � Japan and the United States � apply a partial credit scheme to the repatriated profits of their MNFs. As shown in Figure II-1, Japanese and US MNFs react to tax cuts only to the extent that foreign tax rates remain above Japanese or US rates; since pre-reform rates are already lower than Japanese rates and not far above US ones, the bulk of EU tax cuts has no impact on FDI outflows from these two countries. Conversely, Japan and the United States become less attractive for MNFs originating in exemption EU countries. Hence, Japanese and the United States clearly lose from ongoing tax cuts in the EU: European tax cuts do not benefit MNFs of these two countries, while EU investors are less willing to invest in the United States or in Japan.
25 Tax cuts could be much more ambitious in Italy should the opposition leader Berlusconi win the May election, see, for instance, Financial Times, October 16, 2000.
TAX REFORM
PE 306.075 61
This simulation illustrates the perverse mechanism embodied in tax competition: in order to reap gains from tax competition, a country must not only cut taxes, but also cut taxes more that its partners. This is the reason why tax competition could end in zero taxation (or at least a very low taxation), with no FDI gain at the aggregate level and a deterioration in fiscal balances. The welfare impact of such an outcome is unclear since increased domestic investment stemming from reduced corporate taxation would have to be weighted against the deformation of the tax structure26 and the possible under-provision of public goods.
Hence the ongoing tax reforms in the EU will probably not be the end of the story. In the longer run, the EU could experience either a generalised corporate-tax competition, or a co-operative reaction from EU members, in the form of a harmonisation of tax rates or of tax schemes. This alternative is analysed in the next section through additional simulations.
II.4. The future of tax co-ordination in Europe As shown in the previous section, tax competition is a natural, non-cooperative outcome of the tax-sensitiveness of investment location evidenced through our econometric estimations. Even though the main focus of ongoing reforms is not to attract FDI through tax competition, each reforming country may initially overestimate the impact of its tax cuts by neglecting those implemented in neighbouring countries. Indeed, non-reforming countries may also start cutting taxes in order to maintain their tax attractiveness. In the end, each partner could try to reduce taxes more than the others. Even if the initial aim is not to implement harmful tax competition, the result might be the same, all tax rates being inefficiently pushed downwards.
Of course, the hypothesis of a race to the bottom is not universally shared. Less pessimistic views draw on the fact that corporate income revenues tend to be stable in proportion to GDP; that capital is not as mobile as it could be theoretically (the Feldstein-Horioka puzzle); and that there is some balance between tax levels and the provision of public goods.
Moreover, tax systems are already opaque, which is paradoxically a protection against tax competition, since governments and firms hardly know the exact working of tax systems elsewhere. In the same vein, harmonisation could finally ease tax competition, by increasing the transparency of tax systems (see Gammie and Radaelli, 2000, Besson, 1999).
Finally, the convergence of tax rates to zero would not necessarily be the final outcome of tax competition, as argued by Baldwin and Krugman (2000) in a geographic economy framework. Indeed, tax competition could take a more subtle shape, attractive countries choosing to charge a corporate tax rate that is just low enough to dissuade the peripheral countries to engage in a race to the bottom, because they would not be able to compensate their location disadvantage through a tax differential.
However, the risk of tax competition should not be underestimated: foreign companies are often granted preferential treatments, corporate tax rates exhibit a long term downwards trend in Europe that is not the consequence of harmonisation. Recent tax reforms in European countries like Germany prove that international tax competition is becoming a reality27.
26 With possible efficiency problems, if the increase of tax pressure on less-mobile tax bases reduces the marginal profitability of tax increases on them (Laffer curve). 27 It is true that nominal tax rates in Germany used to be abnormally high with respect to European standards; but after the reform, they will be significantly lower than the present European average

TAX REFORM
PE 306.075 62
Given the difficulties of the harmonisation process, is very unlikely that an agreement can be reached soon about the range of nominal tax rates that can be seen as acceptable in the EU. As a consequence, tax competition might well continue in the EU, ending ultimately in a zero taxation of capital. We simulate the impact of such a generalised competition in the EU on the location of investment across the Union. We discuss this scenario in relation to a hypothetical harmonisation of tax rates.
We however argue that a generalisation of credit schemes would remove the incentives for tax competition while allowing each government to set nominal corporate tax rates consistent with its own set of social preferences and its own territory attractiveness (measured in terms of agglomeration economies). We simulate the impact of such a reform.
II.4.1. Generalised tax competition According to the tax competition literature, a country trying to attract foreign investment through a cut in corporate tax rates would soon be followed by its European partners, and tax competition could end in a �race to the bottom�. Here we define the �bottom� in two different ways. In the first simulation (�competition� hereafter), tax competition is assumed to stop when further cuts would endanger the provision of public goods that are directly used by MNFs. This level is arbitrarily defined here by the lowest tax rate observed in the EU. However it is conceivable that the burden of financing public goods would be entirely shifted to less mobile bases. In the second scenario (�dumping� hereafter), tax rates converge to zero.
As argued above, agglomeration economies could result in residual tax differentials even in a competition or dumping scenario, central countries being able to tax more than peripheral ones. However the amount of �normal� tax differentials is not clear-cut since it will also depend on the provision of public goods in each country. Here we just illustrate the impact of tax competition through very simple scenarios where all EU corporate tax rates converge towards the same rates, as it is currently observed.
As pointed out by the Primarolo Report, tax competition does not only take the form of nominal tax cuts. Reduced bases or increased allowances are also concerned. Accordingly, we successively simulate a downward convergence of nominal rates and of effective rates. Indeed, the �bottom� rate in the competition scenario is the Irish one (10%) for nominal taxation, but the German one (4.2%) for effective taxes28. The results are shown in Table II-8.
The first striking result is that, for each kind of tax rate (statutory/effective), both scenarios (competition/dumping) yield the same results as far as FDI across EU countries is concerned. This is due to the fact that a common tax policy brings tax differentials across EU countries to zero, whatever the overall level of taxes. Hence, at the intra-EU level, the simulations only allow measurement of the impact of sharing the same tax policy in all EU countries. However, the various scenarios have a differentiated impact on FDI inflows for Japan and the United States, since the latter countries do not implement tax cuts.
Let us firstly consider statutory rates. Not surprisingly, the country that initially charged the lowest statutory tax rate, namely Ireland, loses in terms of inward FDI, since its very favourable tax differential against other member countries is cancelled. Ireland loses $3.5 billion, out of $5 billions. The benefits are spread over all other EU countries, the United Kingdom being the least concerned because its initial tax rate is very close to the European average.
28 The scenarios are defined relative to the pre-reform situation.

TAX REFORM
PE 306.075 63
In total, there is a slight positive effect for the EU15 (0.6% increase in inward FDI), which is due to the special tax schemes in the UK and in Ireland. Indeed, both countries operate under credit schemes and low nominal tax rates. This is an incentive for their own firms not to export capital, since they would otherwise pay the difference between the foreign tax and the national tax rate.
The disincentive is not negligible for Ireland, since the tax rate spread is always superior to 20 points, whatever the European partner. The standardisation of tax rates cancels the discrepancy between domestic and foreign tax rates, thus removing the disincentive for Irish and British firms to locate abroad; the impact is large enough to generate a global gain for the EU29. Conversely, Japan and the United States increase their investments in the EU only as far as their own rates stay higher than EU ones, i.e. no more than in the �ongoing reforms� scenarios.
Third countries are affected by the growing competition of European locations as EU countries race to the bottom. The loss is large � 3% to 5% of total inward investment in the sample for both Japan and the United States � and it is of course larger in the dumping scenario than in the competition scenario. Hence, both countries suffer from a non-cooperative game within the EU.
Turning to effective tax rates, the conclusions are similar as far as inward FDI in the EU is concerned, but the distribution of gains and losses among EU countries differs from the nominal tax scenario. In this case, Germany and Spain are the main losers, instead of Ireland, due to their initially low effective tax rate. Similar to the simulation with nominal tax rates, the United States and Japan become less attractive to European investment when EU countries race to the bottom although their losses are smaller, because the dispersion of effective tax rates is less than the dispersion of nominal tax rates.
II.4.2. Tax co-ordination policies to avoid costly competition In order to avoid costly tax competition, two ways are open for European co-ordination. The first is to implement a harmonisation of tax rates and tax bases. It is the option advocated by the official reports, which all call for the harmonisation of tax rates inside a given range. The second way is to implement a co-ordination of tax systems. Notwithstanding the implementation difficulties, this approach would present the double advantage of increasing government autonomy in the setting of tax rates, and of limiting the scope for tax competition.
II.4.2.1. Tax-rate harmonisation Harmonising tax rates can be seen as the easiest way to limit the effects of tax competition. It consists in defining a range of �normal� tax rates, on which all European countries would agree. The definition of a range of tax rates is needed to take the individual preferences and the specific attractiveness of countries into account: countries willing to finance infrastructures may impose higher tax rates, while less attractive countries could try to compensate their lack of attractiveness by offering lower taxes.
A complete equalisation of tax rates (either nominal or effective) would have similar effects to tax competition as far as cross-EU investment flows are concerned. This is because in both scenarios tax differentials across EU countries converge to zero. The only difference then would be a reduced externality for non-EU countries.
29 It should be remembered that the EU aggregate does not cancel out cross-EU investments.

TAX REFORM
PE 306.075 64
Table II- 8. Impact of competition/dumping on inward FDI (1995)
Downward convergence of statutory tax rates
Downward convergence of effective tax rates
Country
Inward FDI millions USD Gains in millions
USD Gains in % of total
inward FDI in he countries of the sample
Gains in millions USD
Gains in % of total inward FDI in the countries of the sample
Competition
Dumping Competition
Dumping Competition
Dumping Competition
Dumping
Bel-Lux. 5,507 1,106 1.0 970 0.9 Germany 21,815 836 0.8 -1,700 -1.6 Denmark 1,387 164 0.2 1,711 1.6 Spain 1,051 379 0.4 -1,818 -1.7 France 6,917 816 0.8 -550 -0.5 U.-K. 28,554 -5 0.0 2,620 2.5 Ireland 4,968 -3,535 -3.3 -65 -0.1 Italy 2,106 589 0.6 53 0.1 Netherl. 4,378 333 0.3 1,714 1.6 EU15 76,683 683 0.6 2,936 2.8 Japan 5,516 -3,430 -4,919 -3.2 -4.6 -2,196 -4,377 -2.1 -4.1 U.S. 24,154 -3,239 -5,254 -3.0 -4.9 -2,227 -4,557 -2.1 -4.3 Total 106,354 -5,986 -9,490 -5.6 -8.9 -1,486 -5,998 -1.4 -5.6
Note: downward convergence of statutory rates to 10% (competition) or to 0% (dumping); downward convergence of effective rates to 4.2% (competition) or 0% (dumping).
However, indicative ranges of tax rates provided so far in official reports (for instance the Ruding committee) are rather wide (statutory rates between 30 and 40%), which more or less cover the actual range of tax rates. Indeed, the ongoing tax reforms tend, in most cases, to set nominal tax rates around 30%, which is similar to harmonising most tax rates around the EU average. Hence, harmonising tax rates would mean freezing tax rates to their post-reform levels, i.e. avoiding further cuts. The impact on FDI flows is illustrated in Section II.3.2 (aggregate impact of ongoing reforms). Adding more countries to the simulation would not change dramatically the picture. This impact can be contrasted with that of competition as simulated in Section II.4.2.
Nevertheless harmonising nominal or effective tax rates would only limit tax competition, without removing its effects. Indeed, as long as capital is sensitive to tax differentials, there will be an incentive for governments to set the corporate tax rate at the lowest level allowed. Hence, tax harmonisation would not necessarily give more room for manoeuvre to European countries, which would not be able to set higher tax rates than their partners, unless they accepted the risk of seeing capital (partially) flying away.
II.4.2.2. Tax-scheme harmonisation As argued above, implementing tax-rate harmonisation would be difficult. Apart from the definition of a �normal� range and of a possible race to the bottom of this range, a harmonisation of tax bases would be necessary to reach similar effective taxation across EU member countries. Yet, harmonising tax bases means harmonising accounting rules, which is of course politically very difficult to reach, especially in the context of the required unanimity for tax issues.

TAX REFORM
PE 306.075 65
Here, we propose to adopt a completely different view on tax co-ordination in Europe, and to focus, not on the harmonisation of tax rates, but rather on the harmonisation of tax schemes. Indeed, applying exemption schemes everywhere in the EU would mean maximising the sensitivity of capital flows to tax incentives, hence the risk of tax competition. On the other hand, imposing credit schemes in all European countries would drastically limit the sensitivity of capital flows to tax incentives, since lower taxes in one country would no longer attract FDI from other EU countries. This is a potential positive outcome of credit schemes, which has to be weighed against the costs of implementing such a reform, a cost that we can evaluate in terms of FDI inflows30.
Hence, we simulate a scenario of a general move to a (partial) credit scheme. Since Ireland and the UK already implement such schemes, this results in a generalisation of this scheme to Continental Europe. The alternate scenario of a generalisation of the exemption scheme would exacerbate tax competition, as illustrated in Appendix II-4. In both scenarios, tax levels are kept at their pre-reform levels, in order to disentangle tax rate from tax scheme issues.
According to the simulation implemented with statutory tax rates, a generalisation of the credit system would reduce the total amount of FDI in the sample by 4.8% of total inward investment per year. This outcome can easily be explained: once all countries apply credit schemes, there is no longer an opportunity for investors to escape high tax rates at home through investing in tax-friendly countries, such as Ireland.
This is a rather important loss, which is mainly explained by the loss that Ireland would record. Indeed, since Ireland offers the lowest nominal tax rate in Europe, and since most of its partners presently offer exemption schemes to their multinationals, Ireland receives a very important amount of FDI thanks to its attractive taxation. The imposition of credit schemes at the European level cancels the Irish tax advantage, and dramatically reduces the flow of inward investment to this country. Other European countries lose a much smaller amount of FDI inflows (around 0.2% of the total amount of inward FDI in the countries of the sample).
The simulation performed with effective rates provides a similar picture: harmonising on credit schemes has a negative impact on total FDI, of an even greater magnitude (roughly $5 billion, which is due to the higher elasticity of FDI flows to effective tax rate differentials). However, the distribution of the impact across the various countries is very different. Germany and Spain are the most affected ones; this result is not surprising since these two countries display the lowest effective tax rates in 1995 among developed countries. The impact is very large for Spain since it would record gross FDI outflows.
Whether the reduction in cross-EU investment flows following the generalisation of a credit scheme should be interpreted as a cost is an open question. On the one hand, the removal of tax incentives would be welfare-enhancing to the extent that tax-led FDI flows do not participate in an efficient allocation of resources. On the other hand, those who point out the distortionary impact of corporate taxes would view credit schemes as detrimental barriers to otherwise welfare-enhancing competition among states. In addition, it can be argued that a country � say Ireland � needs first to attract capital through very low taxation before agglomeration effects allow it to raise tax rates towards EU standards.
30 See Giovannini and Hines (1990) for an early call for such tax schemes for Europe.

TAX REFORM
PE 306.075 66
Table II- 9. Impact on inward FDI of the generalisation of credit schemes in the EU (1995)
Statutory rates Effective rates Country Inward FDI (millions USD) (observed)
Gains in million USD
Gains in % of total inward FDI in the countries of the sample
Gains in million USD
Gains in % of total inward FDI in the countries of the sample
Bel-Lux. 5,507 0 0.0 -186 -0.2 Germany 21,815 -34 0.0 -1,702 -1.6 Denmark 1,387 -305 -0.3 -11 0.0 Spain 1,051 208 -0.2 -1,818 -1.7 France 6,917 21 0.0 -839 -0.8 United Kingdom 28,554 -409 -0.4 0 0.0 Ireland 4,968 -3,535 -3.3 -613 -0.6 Italy 2,106 -129 -0.1 -594 -0.6 Japan 5,516 -29 0.0 0 0.0 Netherlands 4,378 -182 -0.2 0 0.0 United States 24,154 -288 -0.3 -19 0.0 Total 106,354 -5,140 -4.5 -5,781 -5.4 Sub total UE15 76,683 -4,823 -4.8 -5,762 -5.4 Source: own calculations.
In a word, advocating a generalisation of credit schemes is consistent with claiming that tax competition is potentially harmful in terms of the provision of public goods and in terms of the fairness of the tax structure. Such a claim must be qualified for countries whose catch-up can be speeded up through tax-attracted foreign capital.
In addition, it is clear that the implementation of credit schemes will probably face the opposition of multinational firms, for which such a reform would raise the overall amount of taxes they have to pay. They could react through transfer pricing, for instance. Given these qualifications, however, reforming tax schemes can be more straightforward, transparent and quicker than all efforts of effective tax harmonisation.
II.5. Conclusion Since the 1980s, there has been a significant downward trend in statutory as well as effective corporate taxation in Europe. The tax reforms currently being implemented and/or planned in the EU will probably enhance this long-term movement in tax rates, since corporate tax cuts are scheduled in most of them.
The steady reduction in corporate tax rates is a source of concern however, since it raises fears of emerging tax competition in Europe. Tax competition arises when countries try to attract mobile revenues through tax rebates. Since capital is the most mobile factor, the current cuts in corporate taxes can be seen as an attempt to attract foreign firms to the detriment of other European countries. To avoid the adverse effects of this negative externality, the European countries have engaged since the 1990s in a negotiation process aiming at implementing tax harmonisation at the European level.

TAX REFORM
PE 306.075 67
The relevance of the debate on tax competition can be questioned, however, since it depends on the tax sensitivity of capital movements. In the tax competition literature, the mobility of capital must lead corporate tax rates to inefficiently low levels, possibly converging on zero. However, if location decisions are led mostly by the will to exploit agglomeration economies, the effective mobility of capital is limited to the countries that provide such positive externalities to producers. This situation allows a persistence in tax discrepancies between countries even in an integrated area, since attractive countries can receive FDI without cutting their tax rates to zero (Baldwin and Krugman, 2000).
The possible outcome of the increasing integration of capital markets in the EU on national tax policies is therefore a much debated issue. Settling this issue requires carefully looking at the actual impact of taxation on the location decisions of firms. This part of the study offers an empirical analysis of the impact of taxation on inward FDI flows, which allows both for non-tax determinants of FDI and for two crucial features of taxation: namely tax differentials and tax schemes. We conclude that, although considerations of economic geography matter heavily for FDI decisions, tax differentials are significant in explaining location decisions by multinational firms, and that tax schemes should be taken into account in order to weight the impact of tax competition on the behaviour of firms correctly.
This empirical analysis enables us to draw some conclusions on the possible outcomes of the ongoing tax reforms in the EU. We show that non co-ordinated tax cuts are mostly worthless as far as attracting foreign activity is concerned. Indeed, simulating the impact of an isolated tax cut shows that an individual country can hope to attract FDI through such a tax policy, at the expense of most of its European partners. For instance, according to our simulations, the tax reform in Germany could increase FDI in the country by approximately 1.7% of the total FDI inflows in the countries under study. However, this would be gained at the expense of European and non-European countries.
As far as European partners are concerned, they would probably react to such a German policy by cutting their tax rates too, and this is what they actually do. When we simulate the German corporate tax reform together with the other scheduled reforms in the EU, it appears clearly that Germany would gain much less in terms of inward flows of FDI. The same conclusion holds for all the countries of the sample. The aggregate impact of all EU tax reforms on the attractiveness of each reforming country therefore is reduced compared with a situation where the country is the only one to cut corporate taxes. In this part of the study, we also provide some simulations that give an insight on the future of tax policy in Europe.
Two broad kinds of situations are identified. The first outcome of the absence of co-ordination could be that all countries cut their taxes one after the other, ending in very low tax rates, or even in zero taxation. We show that such a situation would not attract much more FDI in the EU as a whole, whereas it would be very penalising to non-European partners (namely the U.S. and Japan), and might lead to international economic struggles. Moreover, European countries would lose tax revenues (corporate tax revenues amount to 2% of GDP on average in the EU), which would have to be shifted to other, less mobile tax bases, questioning the fairness of the tax structure.
Given the perverse effects of tax competition, tax co-ordination should obviously be one objective of EU members. The current harmonisation process however is difficult, since it consists in a progressive harmonisation of effective taxation in the EU (through the removal of �harmful� tax provisions, for instance).
TAX REFORM
PE 306.075 68
Of course the objective is not one of unification, which would be very unrealistic from both a political and an economic (given structural differences in attractiveness due mainly to geographic factors) point of view. Indeed, the harmonisation process has proved very hard so far, since countries are not very prone to accept to lose from the negotiation.
For this reason, it might prove more efficient to seek, not a reduction in competition, but rather a reduction in the incentives for competition. This is the last issue addressed in this part of the study. We suggest that tax credit schemes, because they cancel the incentive for a multinational firm to locate in a low-tax country, efficiently reduce the risk of tax competition when they are generalised. Of course, the implementation of such schemes could be costly, at least for those countries which make use of low taxes to attract capital (these would record a decrease in FDI inflows). But in the meantime, the incentive for tax competition would be strongly reduced, and national governments would recover some freedom in the setting of their tax policies.

TAX REFORM
PE 306.075 69
Part III: Integration of Goods Markets and Tax Policy � An application to the European Automobile Market
III.1. Introduction The unification of European markets, initiated with the launching of the Single Market, implies the progressive abolition of all impediments to trade. The underlying and ultimate objective is to reinforce potential growth in Europe, through the exploitation of the economies of scale provided by a market of 350 million people.
According to the philosophy of this unification process, all kinds of trade barriers are to be abolished, leading, through the strengthening of competition, to a more transparent market, where the law of one price will be the main driving force of prices.
In this context, tax issues are considered to be crucial, because taxes affect the neutrality of incentives. As far as trading goods and services is concerned, the existence of various and very different VAT systems across Europe can be seen a one major impediment to the implementation of the Single market. Hence, tax harmonisation can be called for on the ground of at least two reasons:
• VAT can be an impediment to the free trade in goods and services in the EU, and create inequalities between consumers in different Member States;
• The coexistence of very different tax rate and tax collecting systems implies costs for firms operating in various Member States, and breaks the neutrality of VAT as regards incentives.
For these reasons, a two-step reform of European VAT systems was introduced in 1989. A �transitional� system was to be followed by a generalised reshaping and harmonisation of VAT systems in EU countries. This second step is, however, still to come.
The transitional system implemented a double-sided reform, implying, on the one hand, a partial harmonisation of tax rates across the EU; and, on the other, the implementation (with exceptions) of the �origin country� principle. Hence, most goods are taxed in the country where they are purchased, which implies lower costs for firms, more competition on the goods and services markets, and also a redistribution of tax revenues across European countries.
This attempt to harmonise VAT systems, combined with the reinforcement of competition in the European market, has indeed led to some price convergence. But this convergence remains limited, and is very unevenly distributed across sectors (cf. Haller (2000), De Ghellinck (1993)). This is especially the case in the automobile sector, which is also characterised by the operation of a �special régime�, since VAT is paid in the country of the purchaser, not in the country where the purchase has occurred.
Harmonising VAT systems in the automobile market is of some considerable significance: the car industry is important in Europe, and since cars are one of the major expenses of European households, tax-induced price discrepancies in Europe produce unjustified welfare inequalities. On the other hand, it has been argued that harmonising VAT could remove one of the last economic policy tools available to European countries hit by asymmetric shocks (Guichard and Lefebvre, 1997). The impact of tax harmonisation is therefore an issue of major importance when assessing the progress in achieving the Single market, and in the process of European economic unification.
TAX REFORM
PE 306.075 70
We estimate the impact of the diversity of taxes (VAT and other taxes on purchases) between countries on prices and quantities. We are then able to study the likely impact of tax harmonisation. Would it favour price convergence? Would it mean major fiscal adjustments?
We use an original database including prices and characteristics for EU best selling models from 1993 to 1999 to estimate prices, adjusted for quality effect. Subsequently econometric estimations and simulations are carried out to evaluate the impact of tax heterogeneity and the effects of a harmonisation of taxes rate across EU countries. We also take into account the dispersion of prices effect; market size (number of registrations); and fiscal effect.
III.2. Price disparities in the EU
III.2.1. The problem Despite the integration process of European countries, large deviations from the �law of one price� remain on several markets. This is especially true in the automobile market, where price convergence is a very sensitive issue. The distribution system in the automobile industry is characterised by exclusive territories as well as exclusive and selective distribution channels31. In this oligopolistic sector, firms� strategic behaviour leads to market segmentation and persistent price gaps between countries. Producers profit from differences between countries not only in the level of incomes, but also in tax systems.
As far as taxes are concerned, the aim of an unique VAT rate is far from being achieved: Member States have so far only agreed on a minimum VAT rate of 15%. Sales taxes vary from zero in France, for instance, to over 200% for some cars in Denmark. We will see that this implies large price discrepancies.
Moreover, in the automobile sector, VAT is not levied under the origin country principle. Taxes are paid in the country of the consumer (the �destination� principle). Such a system does avoid tax competition: there is no incentive for a consumer to purchase a car in another Member State, since he would pay taxes in his home country anyhow. As a result, tax discrepancies can remain high in this sector. However, the strategies of firms making use of their market power can produce unexpected effects: high taxes are partially compensated for by lower pre-tax prices, creating further distortions in the overall pricing system.
A recent CEPII study on automobile prices in Europe shows that exchange rate fluctuations have been the main impediment to price convergence (defined as a falling price dispersion). But it also shed some light on the importance of tax systems in explaining cross-country price differences. Large differences in tax systems are an impediment to the Single Market, since they imply large tax-included price differences. But they also imply pre-tax differences since firms take tax discrepancies into account when setting prices across segmented markets.
For instance, pre-tax prices are significantly lower in countries imposing a high VAT rate, such as Denmark or Finland. Since taxes are paid in the customer�s country independently of where the car is being purchased (an exception to the VAT general rule), producers accept lower mark-ups in high tax countries in order to maintain market share. This behaviour partly compensates for the impact of tax discrepancies on tax-included prices.
Taxes rates rise with car size or horse power. Taxes are thus especially high for the consumers who are the more likely ones to benefit from price differences between countries (they can afford the information costs). 31 Such a distribution system is possible thanks to an exemption to general competition rules; this �block exemption�, number 1475/95, will come up for renewal in September 2002.

TAX REFORM
PE 306.075 71
III.2.2. Evaluating price disparities within the EU The first step consists in computing aggregate prices for countries using a detailed database with prices for car models in EU Member States. Models are not necessarily present in the database at each period and for all countries (even if sold in a country a model can have a very low market share compared to another country): proper comparisons between countries over time means computing prices of a same theoretical model. For that purpose we make use of a quasi-hedonic econometric regression which allows the capture of such theoretical prices (see Appendix III-1).
III.2.2.1. The data In order to increase market transparency, the European Commission requests car producers to communicate the list of prices of their best selling models in EU countries. Pre-tax prices are available for about 75 automobile models in 10 countries from the beginning of the period (first semester of 1993) onwards; 12 countries from the first semester of 1995 onwards; and finally 15 in the last semester (first semester of 1999). The observation period contains 13 biannual dates in all.
Special sales tax32 rates, as well as Value Added Tax rates, are available from ACEA (Association des Constructeurs Européens de l'Automobile). Prices including taxes are computed from pre-tax prices and tax rates.
Exchange rates against the ECU/� are the averages of monthly rates computed over each semester.
The technical characteristics of the models (see Appendix III-2 for details) as well as the brand33 and market segment, from lower economy to luxury, are also available. However, characteristics are assumed to be identical for a given model across countries at every date. Technical characteristics of vehicles (horsepower, type and engine capacity, dimensions, fuel consumption and acceleration capacity) are taken from La Revue Automobile.
III.2.2.2. Construction of aggregate prices For a given automobile vehicle i, in a market j, at time t, we regress the logarithm of its ECU/� pre-tax price over a linear combination of the logarithm of its characteristics, and a set of dummies which capture fixed effects.
tjitbtjstiecu
tji DDDzp ,,,,,,, ln.)ln( εα ++++= (1)
We focus on pre-tax prices because they are the relevant prices for arbitrage between markets. Purchases of any car may be made in any country, where the price is lower than the one paid for the same item in the home country. However, taxes are to be paid in the home country (destination principle). Hence, what matters to the consumer is the pre-tax price34. Taxation on the origin principle, the general rule applied for others products, would create unsustainable tax competition, given the huge differences in car sales taxation across the EU (see Appendix III-3).
32 See appendix for the various definitions between countries. 33 The dataset includes US and Japanese brands on the European market. 34 The relevant decision variable for firms is also the price net of taxes

TAX REFORM
PE 306.075 72
),( tiZ is the matrix containing the characteristics of model i at date t (we take the logarithm of the continuous characteristics), sD is a market segment dummy standing for the belonging of the model to the segment s, tjD , is a cross fixed effect ''market/time'', finally, tbD , stands for a fixed effect ''brand/time''. The estimated coefficient for 1.98,FiatD , for instance, indicates how much the price of Fiat cars departed from the average in the first semester of 1998.
Regressions should be weighted by tjiw ,, , i.e. the market share of model i, in market j at date t. However, the only available data was the brand�s market share in each country, and at each date35. This allows some amount of observable market structure heterogeneity between countries to be taken into account. However, our main results are robust to the use of any weighting scheme.
Our main focus is the construction of aggregate prices. This is done by simulating the estimated equation fixing all variables to their mean values except for the tjD , , as they are intended to capture country/time specific effects. We refer to tjh , as the aggregate price for country j at time t. Table III- 1 summarises the results for 3 specifications of the base equation (1): equation (1a), equation (1b) when each car�s fuel consumption is differentiated by market segment (variable LCONS) and equation (1c) with tax rate. The three estimated equations36 have a large explanatory power, and all the variables used in the regression have a significant impact on the price, except for horsepower. Because of multicolinearity between characteristics, the interpretation of the coefficients on these variables may be dubious. However, it is still of interest that one additional percent of engine capacity results in a 0.56% price increase of the car.
Concerning fuel consumption, the equations 1a and 1c exhibit an unexpected, positive coefficient for this variable. This is a consequence of the multicolinearity problems mentioned above. Differentiating fuel consumption with respect to the market segment (Equation 1b in table 1) shows that this characteristic is valued in a negative way for the first three segments (the cheapest) � one extra litre of fuel consumption diminishes the price of the cheapest cars � while in the market segments 4 and 5, this feature will be valued in a positive way. However, using the quasi-hedonic method does not aim at estimating how observable characteristics are valued by consumers. Our goal was to compute aggregate prices adjusted for quality. Consequently, it is legitimate to abstract from the multicolinearity problem and focus on the fixed effects tjD , .
Aggregate prices cannot provide any information as to the impact of market segmentation on the dispersion of both pre-tax and tax-inclusive prices. In order to shed light on this relationship, we compute average model prices across countries for each date. We also evaluate the dispersion of model prices across countries at the same dates. Our aim is to establish a link between both variables: i.e. to find out whether price dispersion across countries for a given model is correlated with the average price of this model in Europe. We show the corresponding correlations in table 2 for both pre-tax (P) and tax-inclusive prices (TI).
35 So as to obtain weights for the models, we divided brand market share by the number of models. 36 We used pooled OLS over the whole sample.

TAX REFORM
PE 306.075 73
Table III- 1: Results of the estimation of quality adjusted prices Variables (1a) (1b) (1c)
INT -5.57 (-12.56) -6.35 (-13.83) -5.45 (-12.27)
LCAP 0.56 (39.87) 0.55 (40.90) 0.56 (39.95)
LHPWR 0.04 (1.55) 0.02 (0.61) 0.04 (1.56)
DOORS 0.002 (5.74) 0.03 (9.81) -0.02 (5.76)
LSIZE 0.16 (6.18) 0.20 (7.77) 0.16 (6.98)
LWEIGHT 0.51 (17.88) 0.32 (10.95) 0.51 (17.90)
LSPEED 0.85 (18.05) 1.11 (23.65) 0.85 (18.07)
LACCEL 0.19 (8.42) 0.24 (10.96) 0.19 (8.42)
LCONS 0.03 (2.28) - 0.03 (2.24)
LCONS1 - -0.21 (-6.62) -
LCONS2 - -0.23 (-9.72) -
LCONS3 - -0.13 (-6.01) -
LCONS4 - 0.36 (18.94) -
LCONS5 - 0.18 (3.68) -
LTAXR - - -0.04 (3.43)
R²(1a) = R²(1b) = R²(1c) = 0.97
In parenthesis: t-statistics
Equation (1b): equation (1a) with LCONS differentiated by market segment
Note: Variables are defined in Annex 1. Sources: Authors� calculations.
Table III-2 shows, for each date, the correlation between the mean price37 and the coefficient of variation. A negative correlation exists between pre-tax prices and their dispersion, while the reverse holds between tax-inclusive prices and their coefficients of variation. The latter means that pre-tax price gaps between markets for a single automobile model are lower for the most expensive market segments (segments 4 and 5 in our sample). This suggests that consumers for those segments do arbitrate more across markets. This is possibly due to better access to information and lower search and transportation costs relative to the value of the purchase.
Comparison of the results obtained for pre-tax and tax-inclusive prices shows that the dispersion in tax rates increases with the segment: in many countries, tax rates increase with engine capacity or fiscal power (see Appendix III-3). This is sufficiently significant to transform the negative pre-tax correlation into a positive tax-inclusive correlation (prices inclusive of tax).
37 Average prices are simple arithmetic means.

TAX REFORM
PE 306.075 74
Table III- 2: Correlations between dispersion (coefficient of variation) and average price
Semester N (models) Correlation (P) Correlation (TI)
May 1993 72 0.157 (0.20) 0.651 (0.0001)
Nov 1993 72 -0.024 (0.84) 0.642 (0.0001)
May 1994 74 -0.416 (0.0002) 0.439 (0.0001)
Nov 1994 76 -0.456 (0.0001) 0.493 (0.0001)
May 1995 75 -0.224 (0.054) 0.545 (0.0001)
Nov 1995 77 -0.164 (0.15) 0.462 (0.0001)
May 1996 77 -0.154 (0.18) 0.576 (0.0001)
Nov 1996 75 -0.250 (0.03) 0.491 (0.0001)
May 1997 75 -0.440 (0.0001) 0.279 (0.015)
Nov 1997 72 -0.451 (0.0001) 0.374 (0.001)
May 1998 74 -0.370 (0.001) 0.324 (0.005)
Nov 1998 76 -0.504 (0.0001) 0.364 (0.001)
May 1999 75 -0.422 (0.0002) 0.697 (0.0001)
In parenthesis: P-value of the coefficient of correlation Sources: Authors� calculations.
III.3. The Impact of Taxes on Prices Figure III-1 shows the estimated pre-tax aggregate prices for all countries in the first semester of 1999, as well as the tax-inclusive prices (the latter are obtained by applying tax rates to aggregate pre-tax prices). Pre-tax prices appear to be lower on average in countries where taxes are higher. This observation, made for the first semester of 1999, is consistent with the coefficient of the tax variable obtained in the second version of the hedonic regression (see Table 1). High rates of taxation induce firms to set low pre-tax prices, in order to be able to continue to sell cars in those countries (for instance Denmark). Such producer behaviour has been studied by Kirman and Schueller (1990). They show the influence of heterogeneity in taxation systems on the pricing strategies of firms, when domestic producers play as Stackelberg leaders in their home market.
Under these circumstances, and assuming symmetrical preferences across countries, pre-tax prices are higher in markets where indirect taxes are low. Moreover, since the automobile sector is covered by a special VAT regime, consumers cannot arbitrate in favour of low tax countries: VAT is paid in the purchaser�s home country. This regime eliminates tax competition between countries, but transfers the avoidance of tax by purchasers to the pre-tax prices charged by firms. It can explain the persistence of a huge heterogeneity of taxation systems. The smoothing effect of firms� pricing behaviour in high tax markets implies that local consumers have no interest in buying cars abroad (since taxes paid on such purchases are the local ones and foreign pre-tax prices are higher), and that for the same reason rational foreign consumers should buy their cars in markets exhibiting low pre-tax prices.

TAX REFORM
PE 306.075 75
Figure III- 1: Automobile prices, first semester of 1999
0 5 0 0 0 1 0 0 0 0 1 5 0 0 0 2 0 0 0 0 2 5 0 0 0
D e n m a r k
G r e e c e
F in la n d
N e th er la n d s
S p a in
P o r tu g a l
I r e la n d
I ta ly
S w e d e n
B e lg iu m
L u x e m b o u r g
F r a n c e
A u s t r i a
G e r m a n y
U n i te d K in g d o m
T a x - In c lu d e dP R IC E
P r e t a xP R I C E
However, this impact of taxes on pre-tax prices does not compensate for the huge observed variability in tax rates (see Appendix III-3 and Table III-5): the dispersion of tax-inclusive prices is higher than that of pre-tax prices.
In the quasi-hedonic regression (Table III- 1) the coefficient for LTAXR, the tax rate by country, is significant and negative. Nevertheless, this coefficient is very weak, which allows us to infer that the influence of tax is relatively weak across the time dimension of the panel.
For this reason, we estimate the influence of tax on price in a cross section. We regress the logarithm of countries pre-tax price on the logarithm of tax rate in 1999. It turns out that for the last semester of our sample, the tax effect is significant (T-Stat is �4.74) and equal to -0.1 (the R² is 0.63). Given the variability of taxes this coefficient implies for instance more than 20% price difference between the German and the Danish prices due to taxes alone38.
Using the former estimate, we can simulate the effects of complete tax harmonisation. Figure III-3 gives the results.
Considering a common tax rate of 30% (the average of actual tax rate is, in 1999, 44% without weighting for the relative importance of countries, 27% using population as weighting) we get the following change in dispersion: pre-tax price dispersion decreases by 38% (from 8.8% to 5.5%), tax-inclusive prices fall by 70% (from 18.6% to 5.5%).
Hence, not surprisingly, tax rate harmonisation would have the effect of triggering price convergence, and hence of completing the Single Market. But it would also probably have an impact on the volume of sales, and therefore on other components of tax revenues, such as taxes on fuel.
38 One should bear in mind, however, that this date corresponds to the entry of Denmark and Finland into the data set. As taxes are very high in these countries, this increases substantially the variability of LTAXR.

TAX REFORM
PE 306.075 76
Figure III- 2: Impact on price dispersion of complete tax harmonisation
0
0.04
0.08
0.12
0.16
without taxes with taxes
actual taxes
after fiscal harmonisation
Table III- 3: Effect of harmonisation on EU countries� automobile prices % change in: Pretax Prices Prices inclusive of taxes
Austria 0.3 -0.4 Belgium -3.6 3.8 Denmark 17.4 -38.7 Finland 14.3 -30.8 France -3.8 3.9
Germany -6.2 5.3 Greece 5.7 -9.7 Ireland 5.4 -9.2
Italy -3.1 3.4 Luxembourg -6.8 5.5 Netherlands 5.0 -8.3
Portugal 5.7 -9.7 Spain -0.8 1.1
Sweden -1.9 2.3 United Kingdom -5.3 4.9
III.4. Simulating a Tax Harmonisation: Quantity Impacts Apart from changes in prices, what would be the consequences of fiscal harmonisation on the volumes of sales? Would the countries having to increase their taxes experience large decreases in the size of their auto markets? Finally, what would be the effect on revenues?
Clearly, tax revenues would fall (VAT and car taxes, and also fiscal receipts from taxes on fuel) if the tax rate increase did not compensate for the shrinking tax base. Symmetrically, countries should also experience an increase in their market size, that would eventually contradict environmental or energy policies. Our simulations will abstract from macro effects and will not take into account impacts on other markets (substitution between cars and public transportation for instance). This restrictive partial equilibrium focus should be kept in mind when considering the results. Nevertheless our study gives useful insight into the most important (first order) effects expected from a tax harmonisation.

TAX REFORM
PE 306.075 77
To shed some light on those issues we estimate equations linking registrations of new cars (or number of cars in use in the member countries) to their average prices and to the price of fuel. Differences in automobile prices or fuel prices between European countries are to a large extent due to differences in taxes (VAT, others sale taxes, fuel taxes); taxes will then also be introduced individually in order to verify their role. Prices are not the only determinant of market size. We introduce GDP (converted at PPP) per capita as a control variable. This turns out to be highly significant: for a given population, the number of registrations or number of cars in use is higher for rich countries. Because we do not have data for the 15 countries before 1999, we only consider this year and estimate cross-section regressions (using OLS estimator).
The dependant variable is registrations of new cars or number of cars in use, both divided by the level of population (POP). All variables are in logarithms.
For car registration the estimated equation is:
( ) ( ) iiiii
PFuelPAutoPOPGDP
POPRegistrCar εααα +⋅+⋅+�
�
���
�⋅=��
���
� lnln.ln.ln 321
with i for country (15 countries in 1999), PAuto et PFuel, respectively prices of automobiles and fuel. Table III-4 shows the results.
A one percent increase in GDP per capita leads to about a one percent (1.17) increase in the number of registrations per capita. The number of cars in use being a stock variable, we cannot have the same interpretation. The 0.59 coefficient on per capita GDP in equation (3) suggests that a country 10% richer than another will own a automobile stock 5.9% larger. In the following we would prefer the equations using registration numbers because they do take into account flow variables on both sides of the equation. The number of cars depends on registrations in the past (and number of years cars are used), thus on the macro context and fiscal system at these dates.
Automobile prices (via tax rate) are highly significant in all equations. A 10% increase implies a decrease of registrations by 8.5%. Fuel prices also have a negative impact on registrations, but the elasticity is not significant. Fuel taxes are significant in equation (2) but only at a 10% significance level. In equations (3) and (4) fuel price (or tax rate) is not significant and point estimates are positive.
Applying the same methodology as supra we simulate a complete harmonisation. We make the following assumption: harmonisation of VAT and of other sales taxes.
As far as fuel taxes are concerned, their harmonisation could have been on the agenda, given the concerns with the current fuel crisis. The issue is of importance given that, for instance, French tax revenues from fuel are higher than those generated by income tax. However, tax competition is not very great in the case of fuel taxes: only citizens living close to a border can take advantage of differences in tax rates. The issue raised by the energy crisis is much more that of a general decrease in fuel taxes. Differences in fuel taxes are not so large as for sales taxes (see Table III-5 for comparison): the dispersion is 11% for the former compared with 88% for the latter.
For all countries (and for the EU as a whole) we estimate both the change in the number of registrations and in the fiscal revenues that the two schemes of harmonisation would induce (Table III-6).

TAX REFORM
PE 306.075 78
Table III- 4: Effect of taxes on car sales and car stocks across EU countries, 1999 Registrations per 100 inhabitants Cars in use for 100 inhabitants
(1) (2) (3) (4)
GDP per capita 1.17
0.16 (0.0001)
1.11
-
0.59
0.17 (0.0047)
0.5
0.14 (0.0051)
Prices of vehicules -0.85
0.26 (0.068)
- -0.75
0.26 (0.0141)
-
V.A.T. and others sales taxes (rate)
-0.24
0.05 (0.0007)
-0.19
0.05 (0.0025)
Fuel Price -0.26
0.26 (0.33)
- 0.24
0.26 (0.37)
-
Fuel Taxes -0.64
0.34 (0.0862)
0.36
0.32 (0.28.48)
Adjusted R² 0.84 0.87 0.61 0.73
Notes: All variables are in logarithms; estimations are made by OLS. Below the coefficient are the standard errors and the p-values. Sources: Authors� calculations.
As a consequence of fiscal harmonisation, car registrations would increase in initially high tax countries (Denmark, Finland, Greece) but decrease in relatively low tax countries (Germany, Luxembourg, UK). Knowing that the countries likely to be hurt are big countries � and also the home countries of car manufacturers � this reduces the likelihood of harmonisation. The common tax rate could, alternatively, be set so as not to induce damage for auto markets in big, moderately taxed countries. But this would increase the fiscal cost for small countries, which rely heavily on auto tax receipts for their budgets39.
For a majority of countries the fiscal impact would nevertheless be low. Tax receipts from automobiles (excluding fuel tax receipts) as a share of total tax receipts are low in the majority of countries (1% in France, 1.6% in Germany and Italy) but reach an average of 5% in Finland, Greece, Portugal and Denmark. Fiscal receipts would fall in Denmark and Finland by as much as 1% of GDP.
The fiscal issue does not therefore seem to be the main obstacle to harmonisation.
We must also emphasise again the limits of this partial equilibrium exercise, which assumes the same elasticities in all countries. It is possible that, for instance, different environmental concerns lead Nordic consumers to react in a different manner from those in Latin countries to changes in fiscal policy concerning automobiles.
39 If, as mentioned above, the price-elasticity is lower, for some countries, that our cross-section estimate, then the effect on market size could be lower but the fiscal effect would then be higher.

TAX REFORM
PE 306.075 79
Table III- 5: Taxes on cars across the EU in 1999 (in percent)
V.A.T & sales taxes Share of Taxes in Fuel Price Denmark Finland Portugal Greece Ireland Netherlands Austria Spain Sweden Italy Belgium France UK Germany Luxembourg
149 115 52 52 51 49 31 28 25 22 21 20 17 16 15
66 67 56 53 59 65 59 57 65 65 60 69 76 70 54
Coefficient of variation EU (median)
88% 28
11% 65
Sources: Authors� calculations from European Commission, Union Routière de France and Motorsat.
Table III- 6: Effect of Harmonisation on Car Registrations and Fiscal Receipts % Change in: Cars Registrations Fiscal Receipts in
percent of Total Receipts
Fiscal Receipts in percent of GDP
Austria Belgium Denmark Finland France Germany Greece Ireland Italy Luxembourg Netherlands Portugal Spain Sweden United Kingdom
0.3 -3.1 51.7 36.7 -3.2 -4.3 9.0 8.5 -2.8 -4.5 7.6 9.1 -0.9 -1.9 -4.0
-0.04 0.49 -3.01 -3.41 0.44 1.30 -1.94 -1.51 0.54 0.98 -0.74 -1.92 0.23 0.22 0.88
-0.01 0.21 -1.02 -0.95 0.17 0.34 -0.41 -0.48 0.21 0.41 -0.32 -0.62 -0.06 0.08 0.32
Sources: Authors� calculations. Government Receipts are from World Bank
It is not possible to state whether the simulated changes can be said to be welfare improving or not. Many factors would have to be taken into account before passing such a judgement.
For instance, the results for Denmark � a large increase in the size of the automobile market � might not be seen as a positive phenomenon. No Danish car maker would take advantage of the increase, and new cars would eventually increase pollution and congestion above the level socially tolerated in this country. The Danish government would also have to raise other taxes if it wanted to balance its budget.

TAX REFORM
PE 306.075 80
Foreign auto makers might benefit from a more dynamic Danish car market, but not all by the same amount, given their different market shares in this country. German firms would surely be among the winners; but that would not compensate for the losses in their own home market. V.A.G could decide to cut activity in production sites not located in Germany�
III.5. Conclusion Using estimated average prices for European countries in the car market, we have been able to identify the effect of taxes on price dispersion. A strong cross-sectional, negative effect of taxes on pre-tax prices has been highlighted. So far it has played no role in the convergence process since taxes have remained constant.
In the long run, the EU will probably implement a single standard rate of VAT. Member States have already agreed to a minimum rate of VAT (15%); but they have rejected the proposal for a 25% maximum rate.
In any case, sales taxes create much greater price dispersion. There is a current plan to harmonise sales taxes by moving towards a system based on fuel consumption and the degree of pollution created. Nevertheless Member States appear reluctant to apply it.
We simulate a complete harmonisation of taxes. We show that it would strongly reduce price differences across EU, for both pre-tax and tax-inclusive prices. The (positive) effect on car registrations is large for small high tax countries (Denmark, Finland, Greece). Germany, France, UK and Italy would all see a moderate but significant fall in their market size. Those countries being the major producers, lobbying by car manufacturers could well block harmonisation.
The fiscal impact would generally be low, except for Denmark and Finland, and does not seem to be the main obstacle to harmonisation.

TAX REFORM
PE 306.075 81
References
Anderson S.P., and Ginsburgh V. (1999), "International Pricing with Costly Consumer Arbitrage", Review of International Economics, Vol. 7, No. 1, pp. 126-139.
Andersson F., Forslid R. (1999), "Tax Competition and Economic Geography", CEPR Discussion Paper, 2220.
Artus P. (2000), "Le début de la concurrence fiscale en Europe ?", Caisse des Dépôts et Consignations, Flash, No.2000-151, September 1st.
Auerbach A.J., and Hassett K. (1993), "Taxation and Foreign Direct Investment in the United States: A reconsideration of the evidence", in Giovannini, A., Hubbard, R.G., and J. Slemrod, eds., Studies in International Taxation, Chicago University Press, Chicago, 119-44.
Baker and McKenzie (1999), Survey of the Effective Tax Burden in the European Union, Amsterdam, January 15, Report to the Dutch Ministry of Finance.
Baldwin R., and Krugman P. (2000), "Agglomeration, Integration and Tax Harmonization", CEPR Discussion Paper, 2630.
Baldwin R., and Krugman P. (2000), "Agglomeration, Integration and Tax Harmonization", CEPR Discussion Paper, No. 2630.
Barrell R., and Pain N. (1999), "Trade Restraints and Japanese Direct Investment Flows", European Economic Review, 43, 29-45.
Bartik T. (1987), "The Estimation of Demand Parameters in Hedonic Price Models", Journal of Political Economy, Vol. 95, No. 1, pp. 81-88.
Bond S., et al. (2000), Corporate Tax Harmonisation in Europe: A Guide to the Debate, Institute for Fiscal Studies, London.
Boss A. (1999), "Do we Need tax Harmonisation in the EU", Kiel Working Papers, 916.
Bresson G., and Mathieu C. (1992) "Différenciation Horizontale et Verticale des Produits : une Application à l'Industrie Automobile", Annales d'Économie et de Statistique, No. 27, pp. 116-146.
Buijink W., Janssen, B., and Schols Y. (1999), Corporate Effective Tax Rates in the European Union, Report to the Ministry of Finance in the Netherlands, University of Maastricht.
Coughlin C.C., Terza J.V., Arromdee V. (1991), "State Characteristics and the Location of Foreign Direct Investment within the United States", Review of Economics and Statistics, 675-683.
Couton C., Gardes F., and Thépaut Y. (1996), "Hedonic Prices for Environmental and Safety Characteristics and the Akerlof Effect in the French Car Market", Applied Economics Letters, Vol. 3, pp. 435-440.
Danzon P.M., and Chao L-W. (2000), "Cross-National Price Differences for Pharmaceuticals: How Large and Why?", Journal of Health Economics, Vol. 19, pp. 159-195.
Devereux M.P. (1999), "Prospects for Co-ordination of Corporate Taxation and the Taxation of Interest Income in the EU: A Comment", Fiscal Studies, 20 (2), June, 155-161.
Devereux M.P., and Griffith R. (1998), "Taxes and the location of Production: Evidence from a Panel of US Multinationals", Journal of Public Economics, 68, 335-367.
TAX REFORM
PE 306.075 82
Devereux M.P., and Pearson M. (1995), "European Tax Harmonisation and Production Efficiency", European Economic Review, 39, 16557-1681.
Dixit A.K., and Pindyck R. S. (1994), Investment under Uncertainty, Princeton University Press, Princeton.
Dutton J. (1982), "The Optimal of International Investment Income: A Comment", Quarterly Journal of Economics, 46, 373-380.
European Commission, Directorate-General IV-Competition, Car Prices Within the European Union, reports from May 1993 to May 1999.
European Commission (2000), "Public Finance in EMU, 2000", European Economy, 3, 1-298.
Fontagné L. (1999), "Foreign Direct Investment and International Trade: Complements or Substitutes?", STI Working Papers, 1999-3, OECD-DSTI.
Fontagné L., and Freudenberg M. (1999-a), "Endogenous Symmetry of Shocks in a Monetary Union", Open Economies Review, 10, (3), 263-287.
Fontagné L., and Freudenberg M. (1999-b), "Marché unique et développement des échanges", Economie et Statistique, (326-327), 71-95.
Fontagné L., and Pajot M. (2000), "Foreign Trade and FDI Stocks in British, US and French Industries: Complements or Substitutes?", in Pain, N., ed., Inward Investment, technological Change and Growth. The Impact of Multinational Corporations on the UK Economy, Palgrave, December.
Fontagné L. (1999), Links between Direct Investment and Trade: Short and Long-Term Effects, Industry Committee, Statistical Working Party, 18-19 November 1999, DSTI/EAS/IND/SWP(99)15.
Friedman J., Gerlowski D., and Silberman J. (1991), "What Attracts Foreign Multinational Corporations? Evidence from Branch Plant location in the United-States", Journal of Regional Science, 32, (4), 403-418.
Gammie M., and Radaelli C. (2000), The Future of Tax Policy in the EU, from "Harmful" Tax Competition to EU Corporate Tax Reform, Report of the CEPS Tax Task Force, Centre for European Policy Studies, Brussels.
Gaulier G., and Haller S. (2000), "The Convergence of Automobile Prices in the European Union: an Empirical Analysis for the period 1993-1999", Document de Travail du CEPII, forthcoming.
Genser B., and Haufler A. (1999), "Harmonization of Corporate Income Taxation in the EU", Aussenwirtschaft, 54(3), 319-348.
Ginsburgh V., and Mertens Y. (1985), "Product Differentiation and Price Discrimination in the European Community: The Case of Automobiles", Journal of Industrial Economics, Vol. 34, pp. 151-165.
Ginsburgh V., and Vanhamme G. (1989), "Price Differences in the EC Car Market. Some Further Results", Annales d'Économie et de Statistique, No. 15/16, pp. 138-149.
Giovannini A., and Hines J. A. (1990), "Capital Flight and Tax Competition: Are There Viable Solutions to Both Problems?", NBER Discussion Paper, 3333, April.
Goldberg P., and Verboven F. (1998), "The Evolution of Price Discrimination in the European Car Market", N.B.E.R. Working Paper, No. 6818.

TAX REFORM
PE 306.075 83
Gordon, R.H., and Bovenberg, A.L., (1996), "Why is Capital so Immobile Internationally? Possible Explanations and Implications for Capital Income Taxation", American Economic Review, 86, (5), 1057-1075.
Gropp R., and Kostial K. (2000), "The Disappearing Tax Base: Is Foreign Direct Investment Eroding Corporate Income Taxes?", paper presented a the European Economic Association Meeting, Bozen-Bolzano, August.
Guimbert S. (1999), "La fiscalité, déterminant de l'attractivité ?", mimeo, Ministère de l'Economie et des Finances, B1-99-069-/D2-99-239.
Haller S. (2000), Intégration européenne, prix unique et concurrence: éléments d'analyse et application, PhD dissertation, University Paris-I Panthéon-Sorbonne, forthcoming.
Harris C. (1954), "The Market as a Factor in the Localization of Industries in the United States", Annals of the Association of American Geographics, 64, 315-348.
Hasset. K.A., and Hubbard R.G. (1996), "Trade Policy and Investment", NBER Working Paper, 5683.
Haufler A. (1999), "Prospects for Co-ordination of Corporate Taxation and the Taxation of Interest Income in the EU", Fiscal Studies, 20 (2), June, 133-153.
Haufler A., and Wooton I. (1999), "Country Size and Tax Competition for Foreign Direct Investment", Journal of Public Economics, 71, 121-139.
Head K., and Mayer T. (2000), "Non-Europe: the Magnitude and Causes of Market Fragmentation in the EU", forthcoming in Weltwirtschaftliches Archiv.
Head K., Ries J., and Swenson D. (1999), "Attracting Foreign Manufacturing: Investment Promotion and Agglomeration", Regional Science and Urban Economics, (29), 197-218.
Helpman E., and Krugman P. (1985), Market Structure and Foreign Trade, Wheatsheef Boods, Harvester Press, MIT.
Hines J.R., and Rice E.M. (1994), "Fiscal Paradise: Foreign Tax Havens and American Business", Quarterly Journal of Economics, 109, (1), 149-182.
Hines J. R. (1996), "Tax Policy and the Activities of Multinational Corporations", NBER Working Paper, No. 5586, May.
Hines J. R. (1999), "Lessons from Behavioral Responses to International Taxation", National Tax Journal, 52, (2), 305-323.
Hines J.R. (1996), "Altered States: Taxes and the Location of Foreign Direct Investment in America", American Economic Review, 86, (5), 1076-94, and NBER 4397.
Horst T. (1980), "A Note on the Optimal of International Investment Income", Quarterly Journal of Economics, 44, 793-798.
Hugounenq R., Le Cacheux J., and Madiès T. (1999), "Diversité des fiscalités européennes et risque de concurrence fiscale", Revue de l'OFCE, (70), 63-109.
Isard W. (1954), "Location Theory and International and Interregional trade Theory", Quarterly Journal of Economics, 68, 1, 97-114.
Janeba E. (1998), "Tax Competition in Imperfectly Competitive Markets", Journal of International Economics, 11, 135-153.
Janeba E., and Wilson J.D. (1999), "Tax Competition and Trade protection", NBER Working Paper, 7402.

TAX REFORM
PE 306.075 84
Jayet H., Bénard R., and Rajaonarison D. (1999), "L'environnement souhaité par les entreprises", Économie et Statistique, 326-327, 6/7, 177-188.
Kirman A.P., and Schueller N. (1990), "Price Leadership and Discrimination in the European Car Market", Journal of Industrial Economics, Vol. 34, pp. 69-91.
Kulatilaka N., and Kogut B. (1996), "Direct Investment, Hysteresis, and Real Exchange Rate Volatility", Journal of the Japanese and International Economies, 10(1), 1996, 12-36.
Lancaster K. J. (1966), "A New Approach to Consumer Theory", Journal of Political Economy, Vol. 74, pp. 132-156.
Mayer T., and Mucchielli J.L. (1999), "La localisation à l'étranger des entreprises multinationales. Une approche d'économie géographique hiérarchisée appliquée aux entreprises japonaises en Europe", Économie et Statistique, (326-327), 159-176.
OECD (1998), Harmful Tax Competition: An Emerging Global Issue, OECD Report, Paris France.
OFCE (1999), La concurrence fiscale en Europe, Rapport pour le Sénat, Fondation Nationale des Sciences Politiques, Paris.
OECD (2000), "Tax Burdens: Alternative Measures", OECD Tax Policy Studies, No.2, Paris France.
Persson T., and Tabellini G. (1992), "The Politics of 1992: Fiscal Policy and European Integration", Review of Economic Studies, 59, 689-701.
Primarolo Group (1999), Anticompetitive Corporate Taxation Systems, Report for the European Council of November 29, 1999, http://eur-op.eu.int/opnews/499/en/t04011.htm.
Rose A. (1999), "One Money, One Market? Estimating the Effect of Common Currencies on Trade", CEPR Discussion Paper, 2329.
Rosen S. (1982), "Hedonic Prices and Implicit Markets: Product Differentiation in Pure Competition", Journal of Political Economy, Vol. 82, pp. 34-55.
Schlitzer G., and Zaghini A. (1998), "Investimenti diretti esteri e regimi fiscali: un con fronto tra paesi europei", Mimeo, Banca d'Italia, November.
Slemrod J. (1990), "Tax Effects of Foreign Direct investment in the United States: Evidence from a Cross-Country Comparison", in A. Razin and J. Slemrod eds, Taxation in a Global Economy, Chicago University press, Chicago, 79-117.
Smith D.F., and Florida R. (1994), "Agglomeration and Industrial Location: An Econometric Analysis of Japanese-Affiliated Manufacturing Establishments in Automotive-Related Industries", Journal of Urban Economics, 36, 23-41, 23-41.
Swenson D. (1994), "The Impact of US Tax Reform on Foreign Direct Investment in the United States", Journal of Public Economics, 54, (2), 243-266.
Tanzi V. (1995), Taxation in an Integrating World, The Brookings Institution, Washington, D.C.
Tiebout C. (1956), "A Pure Theory of Local Expenditures", Journal of Political Economy, 57, p 416-24.
Tiebout C.M. (1956), "A Pure Theory of Local Expenditures", Journal of Political Economy 64, 416-24.
UNCTAD (1999), World Investment Report, Geneva.

TAX REFORM
PE 306.075 85
Union Routière de France (2000), Faits et chiffres 1999: les comptes de la route.
Verboven F. (1996), "International Price Discrimination in the European Car Market", Rand Journal of Economics, Vol. 27, No. 2, pp. 240-268.
Wheeler D., and Mody A. (1992), "International Investment Location Decisions, the Case of US Firms", Journal of International Economics, 33, 57-76.
Wilson J.D. (1999), "Theories of Tax Competition", National Tax Journal, 52, (2), 269-304.

TAX REFORM
PE 306.075 86
TAX REFORM
PE 306.075 87
Appendix A: Ongoing Tax Reforms in the European Union
Austria • Cut in income taxation (marginal entry/middle rates, family allowances). Further cuts
announced for after 2003.
• Reduction in the corporate tax base in 2000 through increased R&D allowance and deemed interest deduction on equity investment. Broadening of the corporate tax base in 2001 through reduced allowances, loss carry-forward restrictions, slower amortisation�
• Agreement on a number of new double taxation treaties, including with Germany and Finland, to be implemented in 2002. Cuts in corporate taxation announced for after 2003.
• Extension to non-residents payees of the domestic, 25% withholding tax on bank and savings interest (not to be applied to inter-company loans, commercial loans or interests paid by private individuals), effective 2001. Abolition of anonymous savings accounts.
Belgium • Income tax reform for 2001: introduction of a refundable tax credit for individuals with
modest incomes, increase in the lump-sum expense deduction from 20% to 25% for individuals subject to the lowest tax rate, adjustment of tax brackets for middle-income taxpayers, abolition of the top 52.5% and 55% tax rates, acceleration of the removal of the 3% �crisis surcharge� introduced in 1994. Further cuts expected for years 2004-2006.
• Reduction in social security contributions, especially for the low paid.
• Reduction in VAT on labour intensive services in 2000.
• Reduction in corporate tax rate from 40.17% to 30% (15% for certain categories of companies, such as technology SMEs). Since 1998, eligibility of informal capital (such as know-how, brand recognition, customer base) for amortisation in the calculation of the taxable profit (but not for the accounting profit).
Denmark • Shortening of deadlines for paying VAT and other levies on employers.
• Reduction in corporate tax rates from 32% to 30%. Base broadening.
• Creation of a withholding tax of 25% on dividends distributed to a parent company located outside the EU if Denmark has no income tax treaty with that country.
• Rise in miscellaneous duties (energy, soft drinks, tobacco, electric light bulbs).
Finland • 1% increase in thresholds and 0.5 point cut in marginal rates for income tax in 2000.
Further 1.5 percentage points average reduction in 2001. Restoration of the special flat income tax rate of 35% for �foreign key persons who come to work in Finland�. This benefit was introduced in 1996. It was suspended in 2000, but the government has proposed to restore it in 2001 following the European Commission favourable statement on this benefit.
• Cut in social security contributions.
• Corporate tax rate and tax rate on capital income increased from 28% to 29% in 2000. Coverage extended to interest on bank accounts.
TAX REFORM
PE 306.075 88
• Reform of the exemption regime for direct investment dividends received by Finnish companies from abroad: tax exemption no longer triggers extra compensatory tax liability. Effective 2000.
• Other tax reform projects (real estate, VAT, environment, energy taxes, income taxes) to be implemented by 2003.
France • Reduction in top/entry income tax rates from 54%/9.59% in 2000 to 53.25%/8.25% in
2001, 52.75%/7.5% in 2002, 52.5%/7.0% in 2003. Introduction of a negative income tax (�prime pour l�emploi�) for labour income ranging from 0.3 minimum wage to 1.2 minimum wage (with a maximum at minimum wage).
• Cut in the professional tax.
• Reduction in corporate tax rates from 36.6% to 33.3% over 2001-2003. Reduced rate of 25% in 2001 and 15% in 2002 onwards for SMEs on the first EUR38m. Tightening of amortising rules and tax credits.
• Cut in domestic fuel taxes. Introduction of a �floating pump tax� designed to compensate for crude oil price fluctuations. Removal of vehicle registration tax.
Germany • Reduction in top/entry income tax rates from 51.0%/22.9% in 2000 to 48.5%/19.9% in
2001, 47.0%/17.0% in 2003, 43.0%/15.0% in 2005. Including the solidarity surcharge, the top/entry rates should decline from 53.8%/22.9% in 2000 to 44.3%/15% in 2005.
• Cut in social security contributions to the pension system (by 0.8 of a percentage point).
• Reduction in corporate tax rates for retained/distributed profits from 40%/30% in 2000 to 25% in 2001. The effective business taxation (including the local trade tax and the solidarity surcharge) should decline from about 52% in 2000 to about 39% in 2001. Reduction in depreciation allowances for machinery and equipment.
• Taxation of distributed dividends at half the personal income tax rate of the recipient in addition to the company taxes already paid (instead of a credit system for German corporate taxes already paid, and double taxation for foreign corporate taxes already paid).
• Elimination of taxes on capital gains of share sales by corporations as of 2002 if these shares have been held for at least one year. Non-incorporate companies (paying personal income taxes) can still save tax-free money for later investment.
• Rise in ecological taxes.
Greece • Reduced income tax for low incomes and for families with children.
• Reduction in social security contributions at minimum wage and for firms hiring new staff.
• Reduction in VAT for labour-intensive services.

TAX REFORM
PE 306.075 89
Ireland • Reduction in entry/standard income tax rates from 24%/46% in 1999/00 to 22%/44% in
2000/01 (fiscal years). Increase in the exemption threshold. Move from income deductibility to tax credits for various items.
• Ceiling on social security contributions removed. Cuts in selected social contributions rates (self-employed). Otherwise, employees earning more than IEP 36,600 will cost employers an additional 12% of the excess over that amount per year. Shortening of tax life of plant and machinery used for trading purposes from 7 to 5 years.
• 1 percentage point cut in VAT in 2001 (from 21 to 20%). Further cuts planned.
• Reduction in the standard corporate tax rate from 24% in 2000 to 20% in 2001, 16% in 2002 and 12.5% in 2003 (financial years). 12.5% rate effective in 2001 for SMEs.
Italy • Reduction in entry/top income tax rates from 19%/46% in 1999 to 18%/44% in 2002.
Increase threshold for the entry rate which will be applied to incomes between Lit12m-Lit20m, instead of Lit9.1m-Lit15m previously.
• Reduction in social security contributions. Tax credits for firms hiring adult long-term unemployed and investing in less developed areas (the latter measure being rejected by the EU Commission as it violates single market rules).
• Reduction in VAT for labour-intensive services.
• Reduction in the top statutory corporate tax rate from 37% in 2000 to 36% in 2001 and 35% in 2003, while the minimum rate will remain at 19% (for re-invested earnings). Effective tax burden (including the regional VAT) to be cut from about 48% in 2000 to about 44% in 2003 (source Goldman Sachs).
• Following May 13, 2001 general election: ambitious tax-cuts programme by incoming Premier Berlusconi, who wants to replace 100 different taxes with just 8 tax headings and bring tax burden down by 10-15 percentage points over 5 years.
Luxembourg • Reduction in top marginal income tax rate from 46% in 2000 to 42% in 2001 and 38% in
2002. Reduction in entry rate to 14% in 2001 and 10% in 2002. Increase in the 0% income tax bracket.
• Reduction in VAT on labour-intensive services.
• Reduction in the effective corporate tax rate from 37.49% in 2000 to 30% in 2002.
Netherlands • Introduction of a �box� system for income taxation, effective 2001. Box 1 includes
income from labour and home ownership, which is taxed at a progressive rate (up to 52%). Box 2 includes �income from a substantial (business) interest� and is taxed at a fixed 25% rate. Box3 includes savings and investment income, which is taxed at a fixed 30% rate (however gains accrued from privately owned shares are tax free provided the shares have been held for at least 12 months and satisfy other conditions).

TAX REFORM
PE 306.075 90
• Individual taxation and general levy rebate aimed at encouraging the two partners to seek for paid job. Reduction in the top tax rate on labour income from 60 to 52%, rise in capital income taxation. Replacement of the �35 percent ruling� by a �30 percent ruling� for tax exemptions applied to foreign employees assigned in the Netherlands, effective 2001.
• Reduction in social security contributions for low paid workers.
• Increase in VAT (from 17.5% to 19%) and in energy taxes. Cut in VAT for some labour-intensive services.
• Reduction in the corporate tax rate for the first NLG 50,000 of taxable profit by 5 percent to 30%. Effective 2000. 20% tax surcharge applied to certain �excessive dividends�, effective 2001 to 2005. Exemption of taxes on capital gains for corporate shareholders if the shares have been held for at least one year.
• Reduction in the capital duty rate from 1% to 0.9% in 2000 and to 0.55% in 2001.
• In discussion: replacement of the exemption scheme applied to repatriated profits from foreign subsidiaries to a partial credit scheme, for passive EU companies (provided the shareholding is of 5% or more).
Portugal • Cut in entry/top income tax rates by 12%/1%, effective 2002.
• Reduction in VAT for labour-intensive services.
• Reduction in the corporate tax rate from 32% in 2000 to 30% in 2002 and maybe 25% in 2006.
• Abolition of the tax exemption previously granted for capital gains on shares held for a period of more than 12 months. Rise in the tax rate on capital gains for shares held for less than 12 months. Starting in 2001, the tax base ranges from 75% of the capital gain (shares held for less than 12 months) to 30% (shares held for 60 months or more). The gains are then aggregated to other net income and are subject to the progressive personal income tax. For non-resident individuals, withholding tax of 20% on capital gains for shares held less than 12 months (instead of 10% previously). For non-resident corporations, rise in the taxation of capital gains.
• Provisional withholding tax of 25% on dividends or profits paid by subsidiaries to their foreign parent, in case of a minimum 25% participation in the capital of the subsidiary. If this minimum participation is maintained after 2 years, a refund can be requested.
Spain • Social security contributions reduced for permanent contracts (0.2 percentage point for
employers� contributions, 0.05 percentage point for employees� contributions)
• Reduction in VAT for labour intensive services.
Sweden • 25% cut in taxable income for the first 3 years of a �key� foreign individual�s
employment in Sweden. 25% reduction of the basis for calculating employer�s social security contributions. Tax exemption for reimbursements of expenses related to a reassignment in Sweden (move over and back, school fees�). Effective 2001 (fiscal year). Rise in income tax thresholds in 2001.

TAX REFORM
PE 306.075 91
• Reduction in social security contributions from 32.92%/31.11% for employers/self employed in 2000 to 32.82/31.01 in 2001.
• Cut in VAT on passenger traffic from 12% in 2000 to 6% in 2001.
• Cut in real estate income taxation in 2001. Creation of a net wealth tax starting in tax year 2001.
• Proposed abolishment of capital gains taxes, provided the gains relate to the disposal of �shares held for business reasons� (minimum 10% of voting rights).
United Kingdom • Reduction in the basic rate of income tax from 23% to 22% in 2000/01 (fiscal year).
Suppression of several allowances (mortgage tax relief, married couple allowance, except for elder people). Children tax credit introduced in 2001/02. Employment tax credit planned for 2003.
• Removal of VAT for SMEs with a turnover up to £54,000. Reduction in VAT for firms with a turnover between £54,000 and £100,000.
• Reduction in corporate tax rate from 33% to 30%.
• Removal of the withholding tax on international bonds, and also on payments of interests and royalties between companies in the UK.

TAX REFORM
PE 306.075 92

TAX REFORM
PE 306.075 93
Appendix II-1: Corporate-tax discrepancies in the EU
The pattern of European tax rates is marked by two important features. On the one hand, European tax rates tend to converge over the long run. Since they converge to a decreasing average level, there is a suspicion that the main force at work is tax competition. However, this convergence has not led to the standardisation of tax rates yet, and considerable tax discrepancies still persist at the European level. This latter conclusion is particularly striking when very precise and micro-economic calculations of effective tax rates are undertaken.
1. Nominal tax rates During the 1990, there was a convergence in statutory corporate tax rates. The (non-weighted) average tax rate decreased from 38.8% to 35.6% in the EU15 over 1990-1997, with a standard deviation falling from 3.4% to 2.0%. Only in Ireland do corporate tax rates differ substantially from the EU average, with a 10% rate being applied to many activities (until January 1st, 2000 for new investors). Taking this non-converging tax rate into account, the standard deviation across countries still fell from 9.4% in 1990 to 8.2% in 1997. The scheduled reforms in corporate taxation will speed this movement up, as the (non-weighted) average tax rate will be pushed down to 29.5%, and the standard deviation will be cut to 6.8%.
Of course, and consistent with the recent developments of the economic geography literature, a part at least of these tax differentials should compensate for location disadvantages, as very distant or much less developed countries need tools to attract the capital that is needed for them to catch up. Figure AII-1-1 below plots nominal tax rates against the weighted average distance of each country to its European partners. The intuition concerning the location advantage seems validated, since there seems to be a U-shaped relationship between distance and tax rates: for relatively small distances, the larger the distance, the lower taxes in order to compensate for the location disadvantage.40 But for large distances, competing by lowering taxes is not worth because firms will not move anyhow; hence, tax rates increase with the distance. However, this figures also suggests that there are outliers in the EU: with a tax rate of 10%, Ireland seems to apply much lower tax rates than what would be consistent with its location disadvantage.
This U-shaped relationship is of course essentially illustrative. Indeed, removing Ireland from the sample or adding non EU countries makes the distance no longer significant41. However, considering effective tax rates instead of statutory ones makes the relationship more robust, as evidenced in the next section.
40 The estimation result (for year 1995) is: 200.0,10192.09.117 22
]109.0[
4
]101.0[]034.0[=+−= − RDISTDISTNTAX , where
NTAX denotes the nominal tax rate and DIST is the weighted average distance to other EU countries. P-values into brackets 41 Not reported here to save space.

TAX REFORM
PE 306.075 94
Figure AII-1-1: Statutory tax rate and weighted distance, EU, in 1995.
ESPITADNKFRA
NLDGBR
DEUBEL
IRL
0
5
10
15
20
25
30
35
40
45
200 400 600 800 1000 1200 1400
Weighted distance
Nom
inal
tax
rate
(in
%)
Source: authors� calculations, based on OECD data.
2. Effective tax rates Looking at statutory tax rates is not enough to assess the degree of tax convergence in Europe, since the definition of the base varies to a large extent across countries. Hence, ex ante (statutory) tax rates must be complemented by ex post (effective) ones in order to draw a conclusion about the behaviour of corporate taxation in Europe. Effective tax rates as a percentage of the operating surplus are displayed in Table II-3 (Part II).
Two kinds of comments can be drawn from the analysis of effective tax rates.
• First, statutory rates and effective rates show rather large discrepancies. In particular, countries with low statutory rates do not necessarily display low effective rates. This is especially the case in the UK which has one of the smallest nominal rates in the EU and nevertheless the highest effective rate. Attractive places such as the UK charge higher taxes in absolute terms through attracting more activity. However, the effective tax burden has been continuously decreasing in the UK since 1985 (from 32.0% of the operating surplus to 12.8 in 1995), a trend which signals the influence of implementing more favourable accounting rules.42
• Secondly, effective tax rates have been converging downwards on average in the EU countries of the sample. To us, this cannot be explained by business cycle determinants only: effective tax rates have remained constant in the US, while they have followed a non monotonous path in Japan. Hence, tax competition may have contributed to the downward trend in Europe.
42 Germany seems to have been in the opposite case in the past. However, OECD data on effective taxation in Germany are biased, since they do not take into account the fact that most SMEs pay taxes under the personal income tax system, and not under the corporate tax system. Indeed, firm level studies (Buijink, Janssen and Schols, 1999) indicate that the effective corporate tax rate in Germany is one of the highest in Europe, even if Germany remains, according to this study, one of the countries with the highest discrepancy between nominal and effective tax rates.
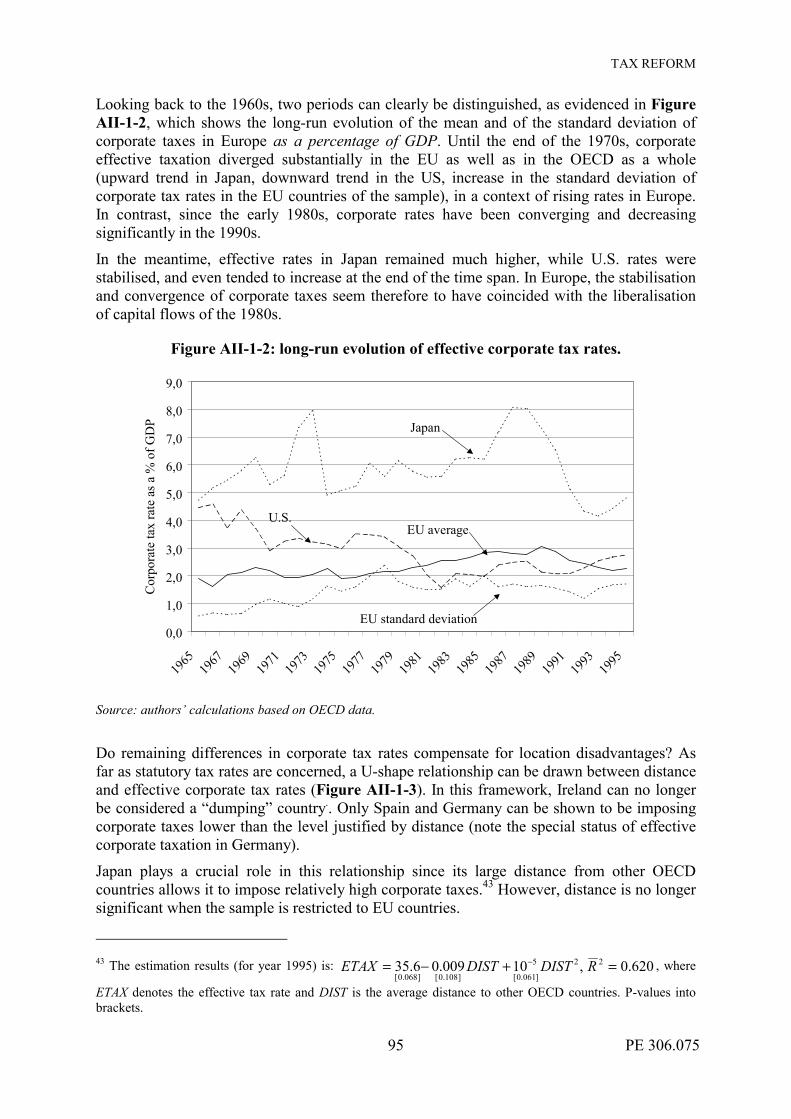
TAX REFORM
PE 306.075 95
Looking back to the 1960s, two periods can clearly be distinguished, as evidenced in Figure AII-1-2, which shows the long-run evolution of the mean and of the standard deviation of corporate taxes in Europe as a percentage of GDP. Until the end of the 1970s, corporate effective taxation diverged substantially in the EU as well as in the OECD as a whole (upward trend in Japan, downward trend in the US, increase in the standard deviation of corporate tax rates in the EU countries of the sample), in a context of rising rates in Europe. In contrast, since the early 1980s, corporate rates have been converging and decreasing significantly in the 1990s.
In the meantime, effective rates in Japan remained much higher, while U.S. rates were stabilised, and even tended to increase at the end of the time span. In Europe, the stabilisation and convergence of corporate taxes seem therefore to have coincided with the liberalisation of capital flows of the 1980s.
Figure AII-1-2: long-run evolution of effective corporate tax rates.
0,0
1,0
2,0
3,0
4,0
5,0
6,0
7,0
8,0
9,0
1965
1967
1969
1971
1973
1975
1977
1979
1981
1983
1985
1987
1989
1991
1993
1995
Cor
pora
te ta
x ra
te a
s a %
of G
DP
EU average
Japan
U.S.
EU standard deviation
Source: authors� calculations based on OECD data.
Do remaining differences in corporate tax rates compensate for location disadvantages? As far as statutory tax rates are concerned, a U-shape relationship can be drawn between distance and effective corporate tax rates (Figure AII-1-3). In this framework, Ireland can no longer be considered a �dumping� country.. Only Spain and Germany can be shown to be imposing corporate taxes lower than the level justified by distance (note the special status of effective corporate taxation in Germany).
Japan plays a crucial role in this relationship since its large distance from other OECD countries allows it to impose relatively high corporate taxes.43 However, distance is no longer significant when the sample is restricted to EU countries.
43 The estimation results (for year 1995) is: 620.0,10009.06.35 22
]061.0[
5
]108.0[]068.0[=+−= − RDISTDISTETAX , where
ETAX denotes the effective tax rate and DIST is the average distance to other OECD countries. P-values into brackets.

TAX REFORM
PE 306.075 96
Figure AII-1-3- Effective tax rate and weighted distance, OECD, in 1995.
JPN
USAGBR
NLD, DNKBEL
ITAIRLFRA
DEUESP
0,0
5,0
10,0
15,0
20,0
25,0
0 2000 4000 6000 8000 10000 12000
Global distance
Cor
pora
te ta
xes (
% o
f ope
ratin
g su
rplu
s)
Source: own calculations based on OECD data.
3. Taxation and the real cost of capital Tax discrepancies do not only stem from differences in nominal or effective tax rates. Indeed, taxation generally differs according to the way FDI is financed � retained earnings, new equity or debt. In addition, since firms are ultimately owned by their shareholders, personal income taxation should be taken into account. Measuring tax differentials in Europe at a micro-economic level therefore implies consideration not only of tax rates, but also the complex system of taxation built by each country, and to compare countries pair by pair.
Devereux and Pearson (1995) provide an attempt to measure the �real cost of capital�, through the computation of the cost of capital in European countries for �a given post-corporate tax, pre-personal tax rate of return� of 5%. The computation is made on a strictly bilateral basis, and by type of financing.
Their results are shown in Table AII-1- 1, and indicate that tax discrepancies can be even more important at the micro-economic level than on macro-economic data. Indeed, rates range from 2% for German investment in Greece financed by new equity, to 19.9% for Irish investment in Portugal financed in the same way.44 Given the technical difficulties of such calculations, it is not possible to work on significant time series in order to assess the convergence of tax rates in the EU. However, recent calculations by Hugounenq, Le Cacheux and Madiès (1999), based on the same methodology, show that discrepancies are much smaller than those observed in 1991, reflecting the convergence in the effective tax rates associated with the combination of various systems of taxation within the EU.45 Hence, looking at the micro-economic tax discrepancies yields the same conclusion: that average tax rates tend to decrease and to converge.
44 Similar calculations are performed in the Baker and McKenzie report on taxation (1999), but calculations are done on a country basis (and not a bilateral basis), which prevents any comparisons with other works. 45 Hugounenq, Le Cacheux and Madiès (1999) introduce a distinction between three types of investments: machinery, buildings and inventories. According to their calculations, pre tax rates range from 4.4% (Belgian investment in Germany) to 6.7% (Dutch investment in Belgium) in our sample of EU countries.

TAX REFORM
PE 306.075 97
Table AII-1- 1- Bilateral cost of capital (subsidiary financed by new equity) for selected EU countries (1991)
Country of the subsidiary Belgium France Germany Ireland Italy Netherlands Spain United
Kingdom Belgium 5.4 8.5 6.5 4.6 7.0 6.4 8.1 5.4
France 6.7 5.4 4.1 4.1 6.5 6.1 8.1 6.0
Germany 7.2 6.6 5.5 3.3 9.8 6.1 6.5 4.8
Ireland 6.9 7.8 5.8 5.1 5.8 6.6 19.7 7.2
Italy 7.4 11.1 3.9 10.2 6 8.9 9.1 9.8
Netherlands 6.1 7.6 6.2 4.4 5.1 5.7 7.2 5.2
Spain 7.2 8.1 6.2 7.4 6.7 6.1 6.1 6.3
Orig
in c
ount
ry
of th
e pa
rent
United Kingdom
5.9 7.8 5.8 7.7 5.1 6.0 7.2 5.9
Source: Devereux and Pearson (1995)
It should be observed, however, that these calculations do not take into account the various (favourable) specific regimes for the headquarters of foreign firms applied in numerous countries (Belgium, France, Great Britain, Netherlands), and hence do not give a perfect picture of tax discrepancies in Europe either. And since multinational firms can partially evade taxes by manipulating internal transfer prices, one can expect that locations offering attractive taxation regimes will be chosen as a beachhead for subsidiaries charging inflated internal prices. The very high average unit value of Irish exports (Fontagné, Freudenberg, 1999-b) validates such a theory.

TAX REFORM
PE 306.075 98

TAX REFORM
PE 306.075 99
Appendix II-2: Tax discrepancies and FDI: econometric methodology
The following notations are used: i is the host country, j the investing country, t the period under consideration. We consider marginal location decisions and hence tackle the determinants of FDI flows. The dependent variable is the annual inward bilateral flow of foreign direct investment at constant prices (the deflator being the price index of the gross capital formation in the recipient country � source OECD, line 90).
Control variables
Market potential We tabulate SGDP as an indicator of market potential, taking into account internal transportation costs in the host country and transportation costs between the host country and the regional market, including internal transportation costs on these foreign markets. The first step is to compute distances weighted by the regional GDPs within Europe. One considers regions belonging to European countries i and j and computes weighted distances between these regions. This gives us average distances between countries i and j. The formula is the following:
j
kk
kk
kik jk
kkkij
GDPGDP
zGDPiGDP
z
zdzd
''
'''
, ≡≡
���
����
�=� �
∈ ∈
In a second step, one introduces these transportation costs in the calculation of market potentials, using national GDPs in purchasing power parity (source: IMF and CEPII-CHELEM). This gives us the variable SGDP that will be used in the estimations.
USAJapan, if
Europe, if
==
∈+= �
jd
GDPSGDP
jid
GDPd
GDPSGDP
iit
itijt
i ijt
jt
iit
itijt
Finally, we use the (one period ahead) rationally expected market potential, SDGPij,t+1.
Size of the investing country GDPjt corresponds to the PPP GDP of the investing country. This is to allow for the fact that larger countries invest more, other things being equal (source: CHELEM-CEPII).
Bilateral openness OPENij is the sum of bilateral exports and imports over the GDP of the reporting country (not in percentage). We do not expect to capture hindrances to trade with such a variable, but the general common determinants of trade and investment not controlled elsewhere. Direction of Trade Statistics (IMF) is the data source.
it
ijtijtij PIB
MXOPEN
+=

TAX REFORM
PE 306.075 100
Difference in market sizes The difference in market sizes is simply defined as the difference in PPP GDPs (source: CHELEM-CEPII) between countries i and j, using the Balassa normalisation procedure. This variable is identical whether i is larger or lower than j.
( ) ( )2ln
1ln1ln1 wwwwDGDPijt−−++= , with
jtit
it
GDPGDPGDPw
+=
Transportation costs We consider the great arc cycle distances between i and j economic centres, noted DISTij.
There might be a potential problem in using distance as an explanatory variable in our estimates, since distance enters the computation of the market potential. Notice however that we do not use exactly the same definition of distance (great arc cycle distance here). Moreover, we have checked for the absence of correlation between market potential and distance.
Dummies DU6 : UK/USA 1995
DU11 : USA/Japan 1990.
Policy variables
Corporate taxes To build TAXCijt, we first compute the difference between i and j taxes on corporate income. Then, the calculated value is corrected for the fiscal regime: • if the investing country has adopted an exemption scheme, the above calculation applies;
• if the investing country has adopted a (partial) credit scheme and the effective tax rate in i is larger than the effective rate in j, then the above calculation applies;
• if the investing country has adopted a (partial) credit scheme and the effective tax rate in j is larger than the effective rate in i, then TAXCijt=0.
Both statutory tax rates and effective tax rates are used. To compute effective tax rates, defined as corporate tax revenues standardised by the operating surplus, we use the following data:
• taxes on corporate income as a % of GDP (Line 18 OECD, Financial and Fiscal Affairs, Compendium), available for 1985, 1990, 1992 to 1995;
• GDP in local currency (OECD, national accounts);
• Operating surplus in local currency (OECD, national accounts);
Exchange rate volatility Exchange rate volatility is defined as the coefficient of variation of monthly nominal bilateral exchange rate (monthly standard deviation of the nominal bilateral exchange rate divided by its average) over the current year, here multiplied by 100 (IMF, International Financial Statistics, line rf).
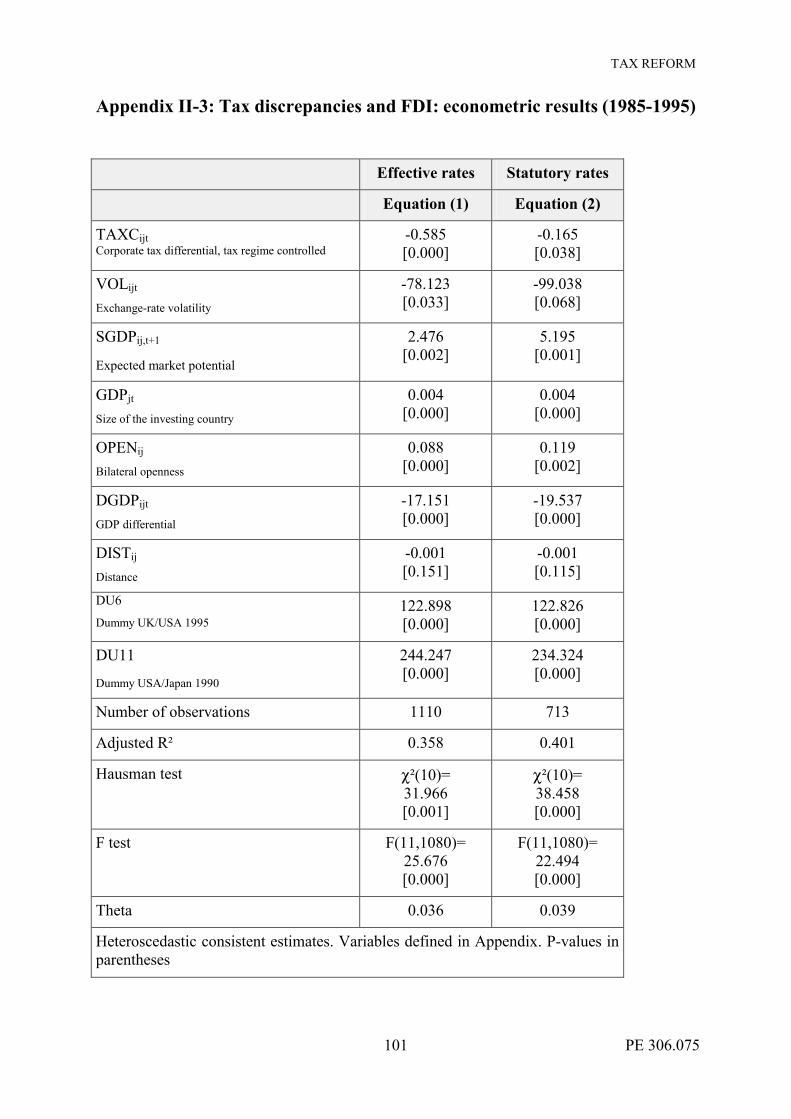
TAX REFORM
PE 306.075 101
Appendix II-3: Tax discrepancies and FDI: econometric results (1985-1995)
Effective rates Statutory rates
Equation (1) Equation (2)
TAXCijt Corporate tax differential, tax regime controlled
-0.585 [0.000]
-0.165 [0.038]
VOLijt
Exchange-rate volatility
-78.123 [0.033]
-99.038 [0.068]
SGDPij,t+1
Expected market potential
2.476 [0.002]
5.195 [0.001]
GDPjt
Size of the investing country
0.004 [0.000]
0.004 [0.000]
OPENij
Bilateral openness
0.088 [0.000]
0.119 [0.002]
DGDPijt
GDP differential
-17.151 [0.000]
-19.537 [0.000]
DISTij
Distance
-0.001 [0.151]
-0.001 [0.115]
DU6
Dummy UK/USA 1995 122.898 [0.000]
122.826 [0.000]
DU11
Dummy USA/Japan 1990
244.247 [0.000]
234.324 [0.000]
Number of observations 1110 713
Adjusted R² 0.358 0.401
Hausman test χ²(10)= 31.966 [0.001]
χ²(10)= 38.458 [0.000]
F test F(11,1080)= 25.676 [0.000]
F(11,1080)= 22.494 [0.000]
Theta 0.036 0.039
Heteroscedastic consistent estimates. Variables defined in Appendix. P-values in parentheses

TAX REFORM
PE 306.075 102
Appendix II-4: Impact of a generalisation of the exemption tax scheme
A generalised move to the exemption scheme within the EU (Japan and the United States remaining in a credit scheme) would allow firms to partially evade taxation by locating their affiliates in low taxation countries. Only two investing countries are potentially concerned by the change in the taxation scheme: Ireland and the United Kingdom.
As these countries display the two lowest statutory tax rates within the sample, Irish and British investors, presently submitted to credit schemes, already experience a disincentive to invest abroad. The situation is not reversed by the shift to the exemption scheme. The only bilateral relationship that would be affected by the move to an exemption scheme would be the one between the UK and Ireland, as British investors would take the opportunity to invest in the low-tax neighbour country after the move; the corresponding amount is however quite small: around USD 400 million Table AII-4-1).
The simulation with effective rather than statutory tax rates produces a much greater increase in FDI inflows: $3.4 billion, against $0.4 billion. Germany and Spain are the most positively affected: because they offer the lowest effective rate in the EU, they become attractive for foreign investors (especially British) who previously operated in credit schemes. Note, however, that effective taxation data are biased in the case of Germany, since most corporate revenues are taxed under the personal income system, and hence are not registered as corporate tax revenues.
Similarly to the simulation with statutory rates, ¾ of the additional inward investment in these two countries from European partners comes from the UK, the rest stemming from Ireland. Since other EU countries were already using exemption schemes, their investors were already taking into account tax differentials with the UK. After the move, the UK remains with a higher effective rate and unchanged differentials; hence, no country will modify its investments to the UK. There is potentially one exception however, namely Ireland, but the latter country was operating in a credit scheme with a lower tax rate than Great Britain.

TAX REFORM
PE 306.075 103
Table AII-4-1- Impact on inward FDI of the generalisation of exemption schemes in the EU (1995) Statutory rates Effective rates Country Inward FDI
(millions USD) (observed) Gains in
million USDGains in % of
total inward FDI in the countries of
the sample
Gains in million USD
Gains in % of total inward FDI
in the countries of the sample
Belgium/Luxembourg 5,507 0 0.0 206 0.2
Germany 21,815 0 0.0 816 0.8
Denmark 1,387 0 0.0 120 0.1
Spain 1,051 0 0.0 869 0.8
France 6,917 0 0.0 459 0.4
United Kingdom 28,554 0 0.0 0 0.0
Ireland 4,968 441 0.4 350 0.3
Italy 2,106 0 0.0 359 0.3
Japan 5,516 0 0.0 0 0.0
Netherlands 4,378 0 0.0 104 0.1
United States 24,154 0 0.0 118 0.1
Total 106,354 441 0.4 3,400 3.2
Sub total UE15 76,683 441 0.4 3,282 3.1
Source: own calculations.

TAX REFORM
PE 306.075 104
Appendix III-2 : Theoretical foundations of hedonic prices46
The theory of characteristics assumes that consumers maximise their utility with respect to the amounts of characteristics of each good. Consumer preferences for the characteristics offered may differ. Demand is derived from the maximisation of utility within the space of characteristics. Note U the utility function, Y the consumer's revenue, ix the quantity of good
i (i=1...n) and kz the quantity of characteristic k (k=1...m):
)...( 1 mzzUMax
�=
=n
iiikk xbz
1 (4)
�=
=n
iii xpY
1 (5)
(4) is the technological constraint and (5) is the budget constraint. The n first order conditions are:
�=
⋅���
����
�
∂∂≥
m
kik
ki b
zzUp
1
)(1λ
i = 1�n
λ is the Lagrange multiplier of the programme associated with the budget constraint, and can, as always, be interpreted as the marginal utility of revenue. The expression in brackets stands for the implicit price of characteristic k. The equality holds when good i is actually consumed.
46 Hedonic prices as defined by Rosen (1974) are equilibrium prices on the market for characteristics. According to Rosen, optimal supply of characteristics should also be considered, which raises the empirical issue of the endogeneity of consumers' and producers' decisions. The estimation bias due to the simultaneity of the decisions can however be circumvented using instrumental variables techniques, as has been suggested by Bartik (1987).

TAX REFORM
PE 306.075 105

TAX REFORM
PE 306.075 106
Appendix III-2: Description of the data set
Countries • From 1993.1 to 1999.1 (semestrial data), EU 10 = Belgium, France, Germany, Ireland,
Italy, Luxembourg, the Netherlands, Portugal, Spain, the United Kingdom
• From 1995.1 to 1999.1, EU 12 = EU 10 + Austria, Sweden
• In 1999.1, EU 15 = EU 12 + Denmark, Finland, Greece
Characteristics (L.characteristic = Log(characteristic))
CAP = capacity (cubic centimeters)
DOORS = 0 if 3 doors and 1 if 5 doors
WEIGHT = no-load weight in kg
HPWR = horsepower
LENGTH = length in cm
WIDTH = width in cm
HEIGHT = height in cm
SIZE = LENGTH*WIDTH*HEIGHT (in cm3)
SPEED = theoretical maximal speed in km/h
ACCELER = acceleration from 0 to 100 km/h in s
CONS = average gas consumption (average over urban and extra urban cycles, in l.)
TAXR = tax rate
ECU = exchange rate vis-à-vis ECU
Brand (producers') market shares: are publicly available for the EU 15 from the C.C.F.A. (Comité des Constructeurs Français d�Automobiles) yearly brochures and from MotorSat (http://perso.club-internet.fr/motorsat/Voitures/immeuropmarq.html)
Definition of the market segments: 1: Lower economy segment ; 2: Lower medium, segment ; 3: Uper medium segment ; 4: Uper and luxury segments ; 5: 4×4 and miscellaneous

TAX REFORM
PE 306.075 107

TAX REFORM
PE 306.075 108
Appendix III-3: VAT and purchase taxes on new vehicles in the EU, in 1999
Country VAT(%) Purchase taxes Registration fees (in local
currency)
Austria 20 Based on fuel consumption.
Maximum=16%
842 to 1269 SCH
Belgium 21 Based on capacity and age 2500 FB
Denmark 25 105 % if price < 50800 DKR,
180 % if price > 50800 DKR
1070 DKR
Finland 22 100 % - 4600 FM (*) None
France 20.6 (#) None Local tax 102 to 195 FF (+
parafiscal charges)
Germany 16 None 50 DM
Greece 18 16 to 128 % None
Ireland 21 22.5 to 30 % depending on engine
capacity
None
Italy 20 Provincial, based on fiscal power 300000 to 720000 L
Luxembourg 15 None 1128 LFR
Netherlands 17.5 Gasoline: 45.2 % - 3394 G (*)
Diesel: 45.2 % - 1278 G (*)
None
Portugal 17 Based on engine capacity 5000 ESC
Spain 16 7% if engine capacity < 1.6l
12% if engine capacity > 1.6l
10250 PTA
Sweden 25 None None
United-Kingdom 17.5 None None
(*) A fixed amount is subtracted from the tax after applying the indicated rate. (#) 19.6% in 2000. 1 Euro = 13.76 SCH, 38.38 FB, 7.07 DKR, 5.66 FM, 6.56 FF, 1.86 DM, 1842.22 L, 38.38 LFR, 2.10 G, 200.48 ESC , 158.30 PTA Source : Association des Constructeurs Européens d�Automobiles.

Addendum: 1
New .eu Domain
Changed Web and E-Mail AddressesThe introduction of the .eu domain also required the web and e-mail addresses of the European institutions to be adapted. Below please find alist of addresses found in the document at hand which have been changed after the document was created. The list shows the old and newlist of addresses found in the document at hand which have been changed after the document was created. The list shows the old and newaddress, a reference to the page where the address was found and the type of address: http: and https: for web addresses, mailto: for e-mailaddress, a reference to the page where the address was found and the type of address: http: and https: for web addresses, mailto: for e-mailaddresses etc.addresses etc.
Page: 2Type: mailto
Old: mailto:[email protected]: mailto:[email protected]