Embed Size (px)
Citation preview

The Realm of Macroeconomics
Where the telescope ends, the microscope begins.Which of the two has the grander view?VICTOR HUGO

Drawing a Line Between Macro and Microeconomics
The Foundations of Aggregation– During economic fluctuations, markets tend to move
up or down together.

Drawing a Line Between Macro and Microeconomics
Macroeconomics focuses on economic aggregates
Three major economic aggregates Output / GDP General price level / Inflation Employment / Unemployment

Objectives
Output --- Growth General price level --- price stability, low
inflation rate Employment --- full employment, low
unemployment rate

Two evils: Recession and inflation Two evils: Recession and inflation
RecessionRecession– High unemploymentHigh unemployment– Stagnate economic growth Stagnate economic growth
InflationInflation– Rapid increase in the price levelRapid increase in the price level
Recession versus expansionRecession versus expansion
RecessionRecession– Slow/negative growth Slow/negative growth – High unemployment rate High unemployment rate
expansionexpansion– Raid growth Raid growth – Low unemployment rateLow unemployment rate
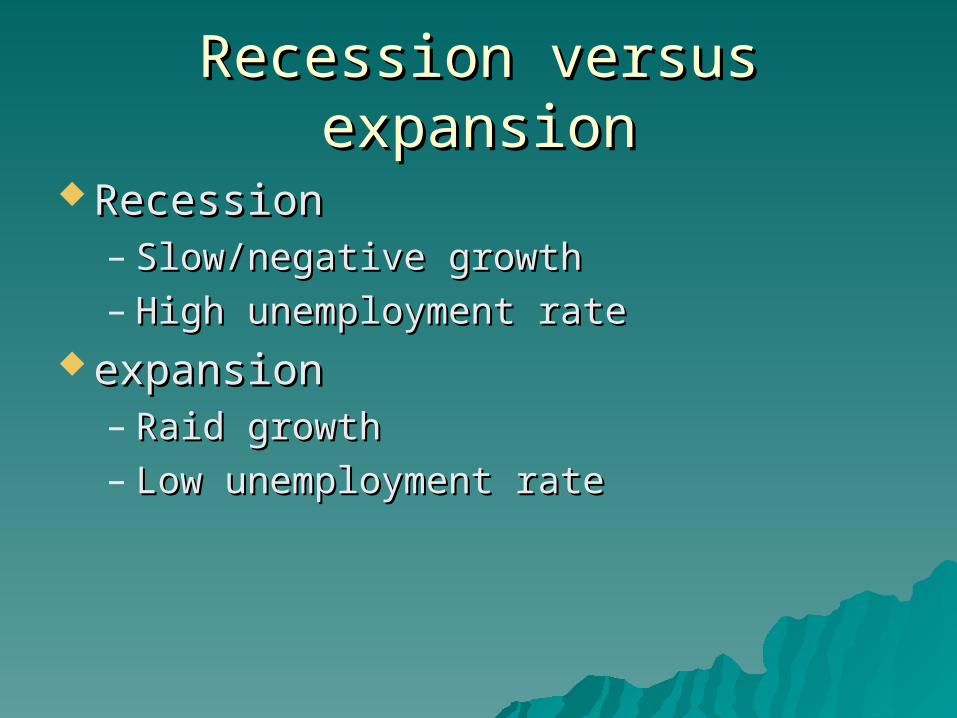
Major economic events Major economic events
The Great Depression, 1929-33The Great Depression, 1929-33 The New Economics and growth in the The New Economics and growth in the
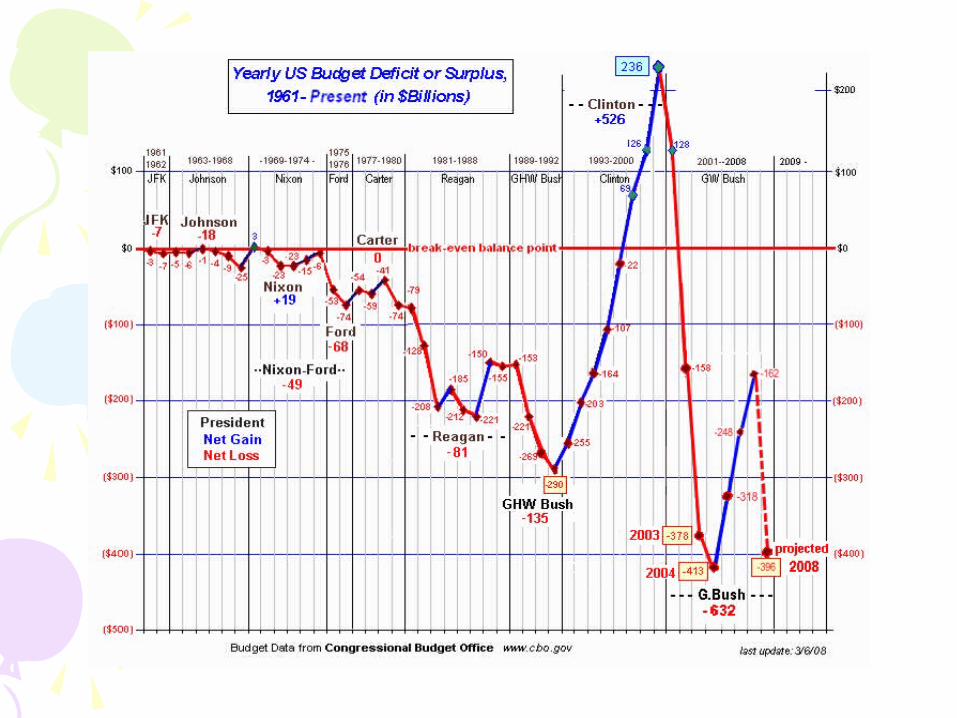
mid-60smid-60s The Stagflation, 1973-1980The Stagflation, 1973-1980 Reaganomics, 1981-1992Reaganomics, 1981-1992 Clintonomics, 1993 – 2000Clintonomics, 1993 – 2000 Deficit surge and financial crisis under the Deficit surge and financial crisis under the
Bush’s term, 2001 – 2008Bush’s term, 2001 – 2008 Obama’s term: slow economic recoveryObama’s term: slow economic recovery
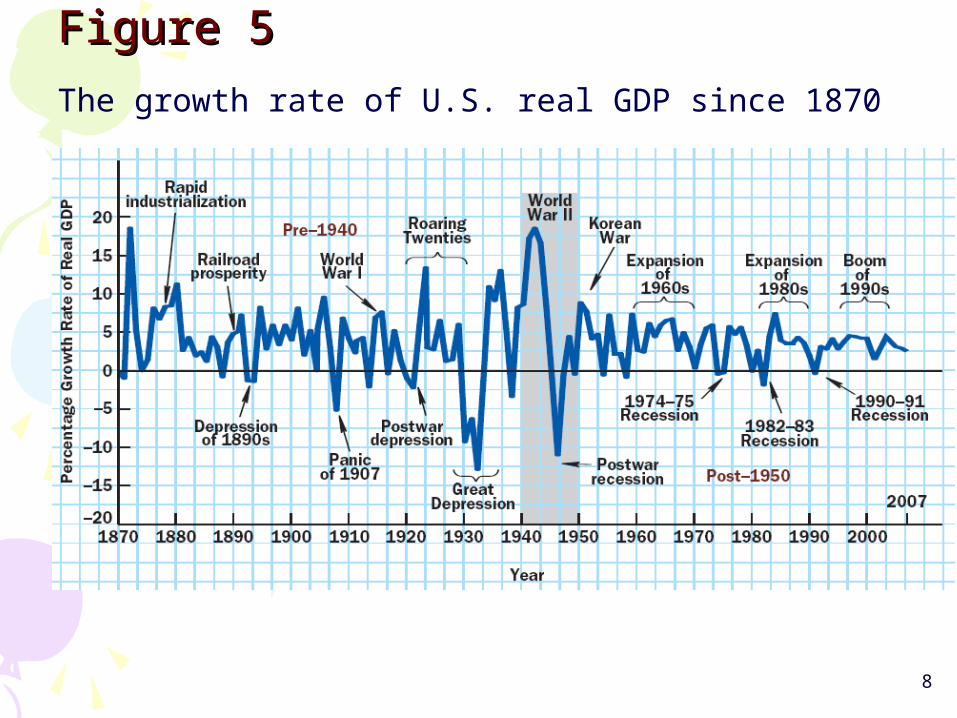
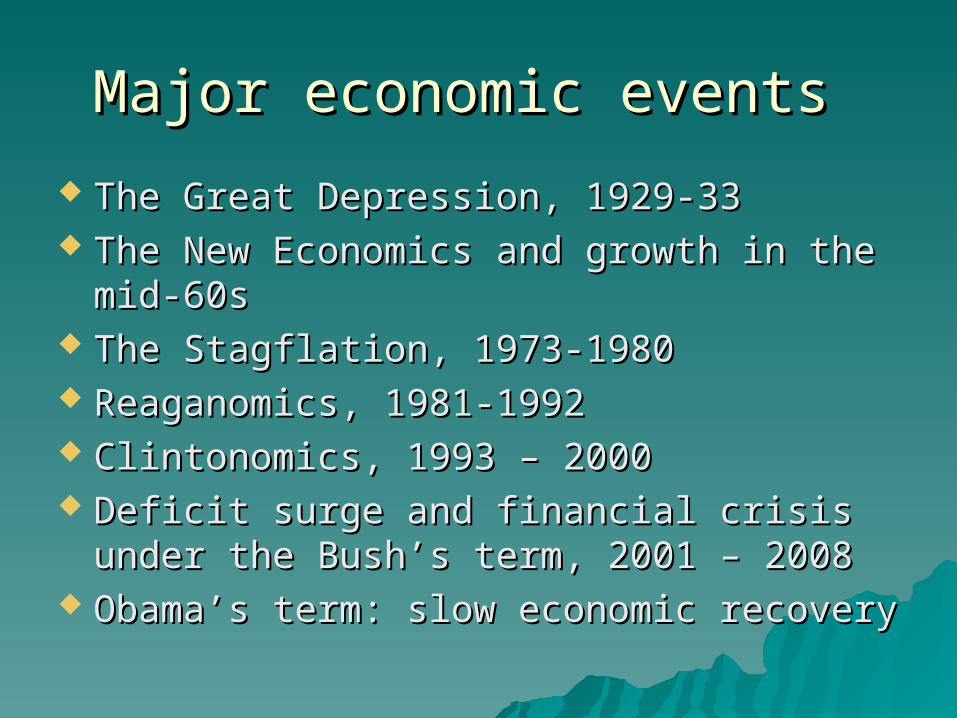
The growth rate of U.S. real GDP since 1870
Figure 5Figure 5
8
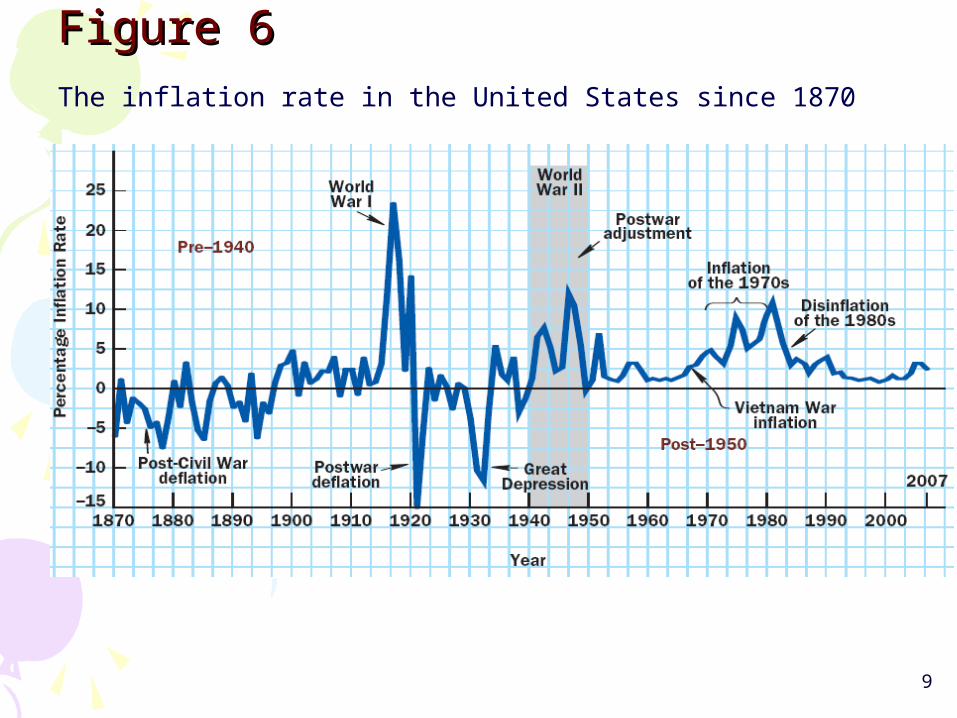
The inflation rate in the United States since 1870
Figure 6Figure 6
9
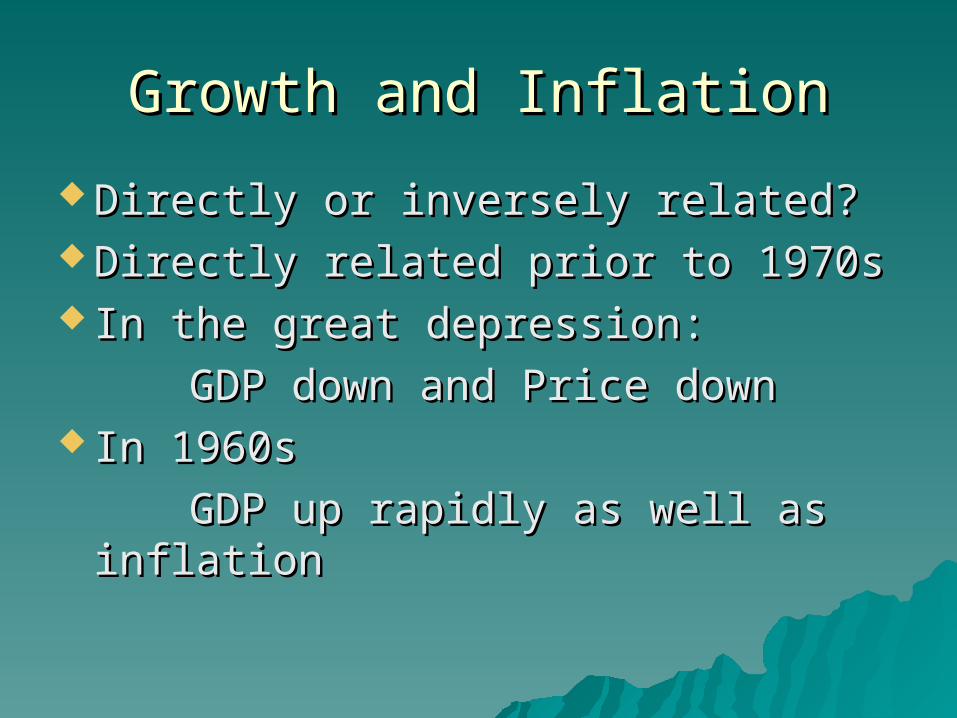
Growth and InflationGrowth and Inflation
Directly or inversely related?Directly or inversely related? Directly related prior to 1970sDirectly related prior to 1970s In the great depression: In the great depression:
GDP down and Price downGDP down and Price down In 1960sIn 1960s
GDP up rapidly as well as GDP up rapidly as well as inflationinflation
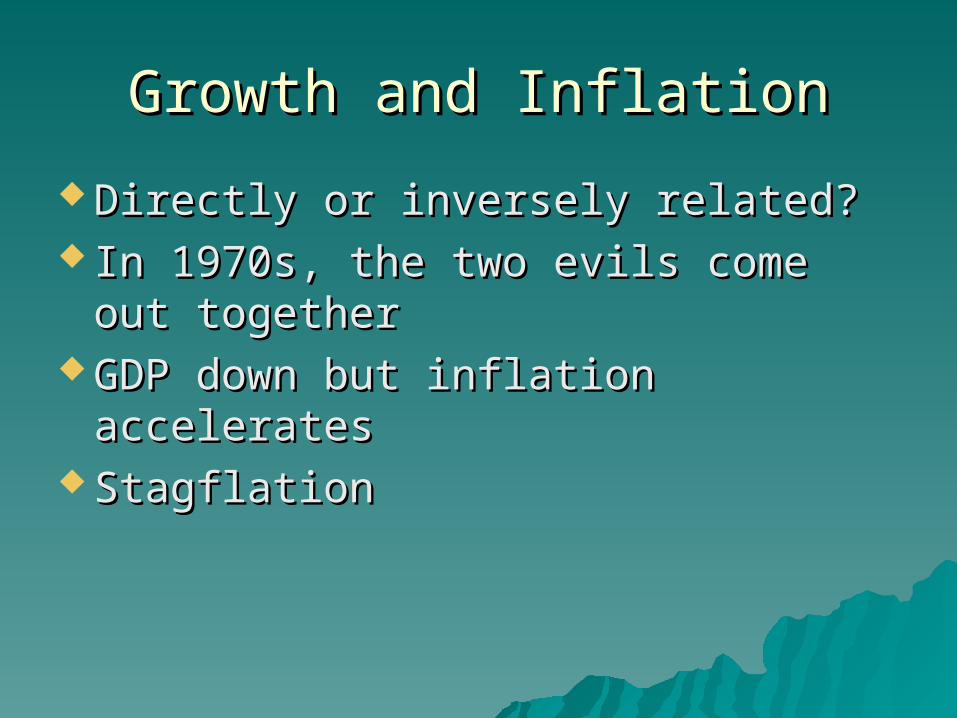
Growth and InflationGrowth and Inflation
Directly or inversely related?Directly or inversely related? In 1970s, the two evils come out In 1970s, the two evils come out
togethertogether GDP down but inflation acceleratesGDP down but inflation accelerates StagflationStagflation

Supply and Demand in Supply and Demand in MacroeconomicsMacroeconomics
Aggregate supply (AS)Aggregate supply (AS) Aggregate demand (AD)Aggregate demand (AD)
Demand side shiftsDemand side shifts
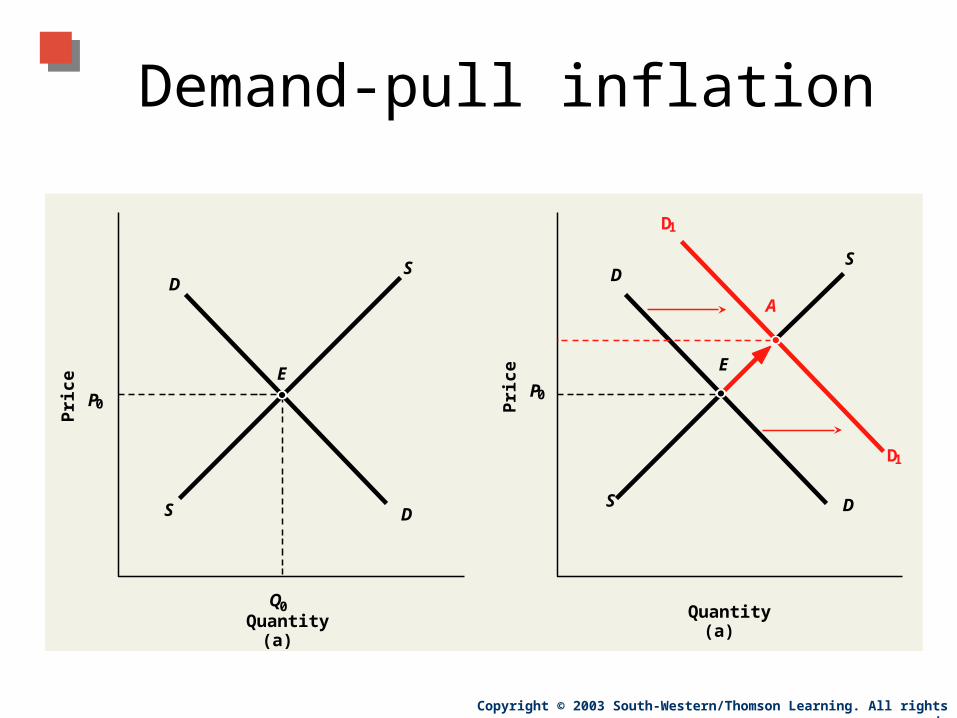
Demand-pull inflationDemand-pull inflation
GDP (y) GDP (y) and P and P Example: 1960sExample: 1960s
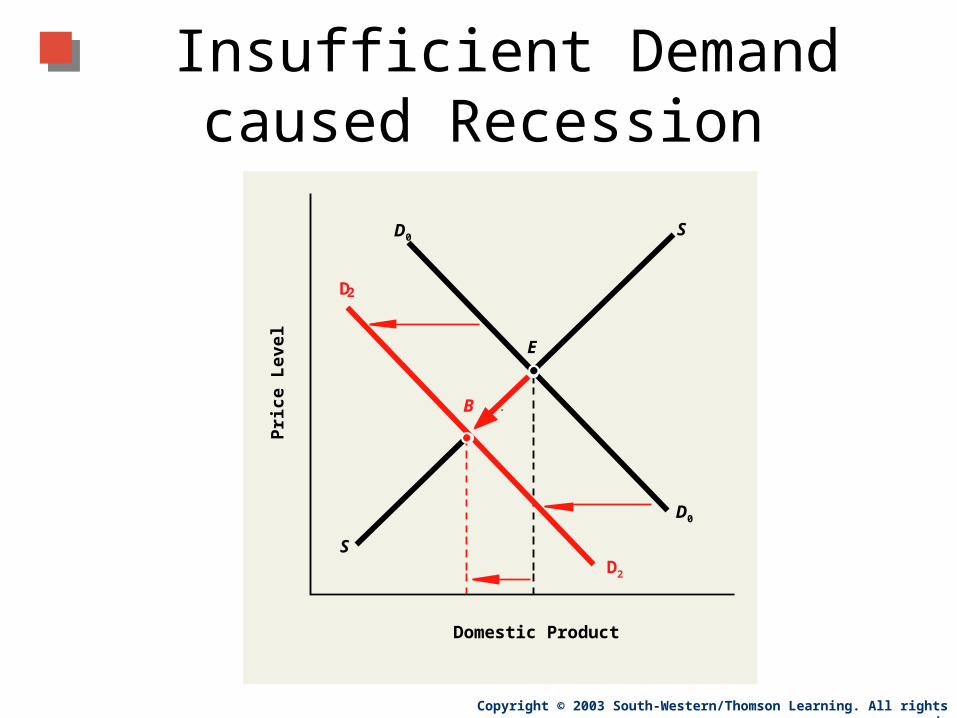
Insufficient Demand caused Insufficient Demand caused RecessionRecession
GDP (y) GDP (y) and P and P
Example: Great depressionExample: Great depression
Insufficient Demand caused Recession
Copyright © 2003 South-Western/Thomson Learning. All rights reserved.
D2
B
Pri
ce L
evel
S
D0
D0
S
E
Domestic Product
D2
Demand-pull inflation
Copyright © 2003 South-Western/Thomson Learning. All rights reserved.
Q0
Pri
ce
P0
D1
A
S
D
D
S
E
Quantity(a)
Pri
ce
P0
S
D
D
S
E
Quantity(a)
D1
Supply-side shiftsSupply-side shifts
Cost-push inflationCost-push inflation
GDP (y) GDP (y) and P and P Example: In the 1970s, stagflationExample: In the 1970s, stagflation
Productivity-induced growthProductivity-induced growth
GDP (y) GDP (y) and P and P Example: In the 1990s during the Example: In the 1990s during the Clinton’s period. Rapid growth and Clinton’s period. Rapid growth and low inflation rate.low inflation rate.
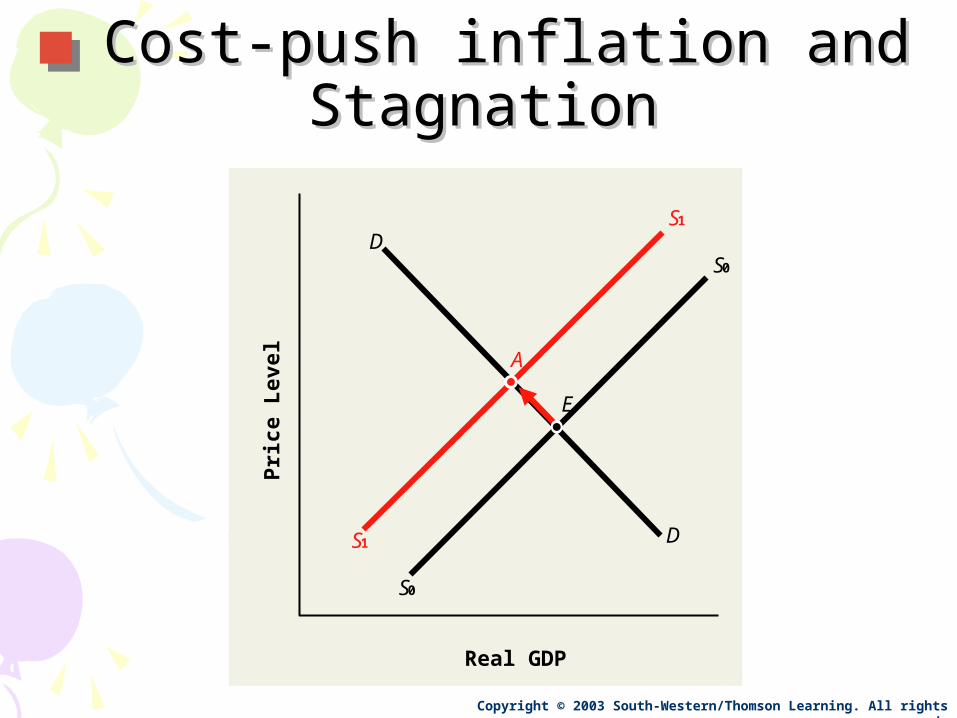
Cost-push inflation and Cost-push inflation and StagnationStagnation
Copyright © 2003 South-Western/Thomson Learning. All rights reserved.
S1
S1 D
D S0
S0
Pri
ce L
evel
Real GDP
A
E
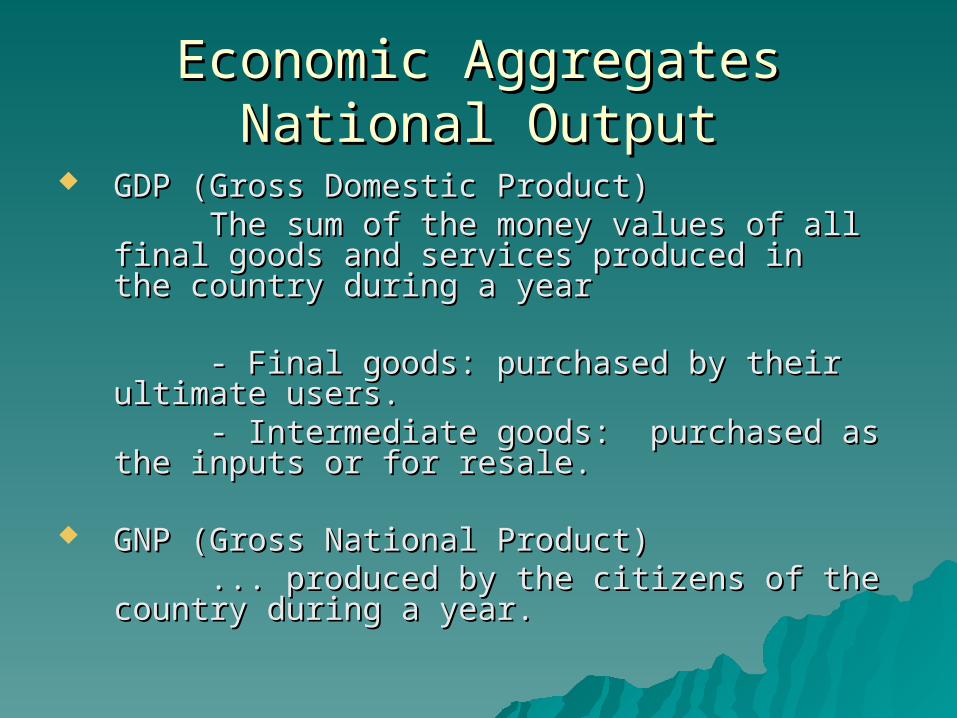
Economic AggregatesEconomic AggregatesNational OutputNational Output
GDP (Gross Domestic Product)GDP (Gross Domestic Product)The sum of the money values of all final The sum of the money values of all final
goods and services produced in goods and services produced in the country the country during a yearduring a year
- Final goods: purchased by their ultimate - Final goods: purchased by their ultimate users. users.
- Intermediate goods: purchased as the - Intermediate goods: purchased as the inputs or for resale.inputs or for resale.
GNP (Gross National Product)GNP (Gross National Product)... produced by the citizens of the country ... produced by the citizens of the country
during a year.during a year.
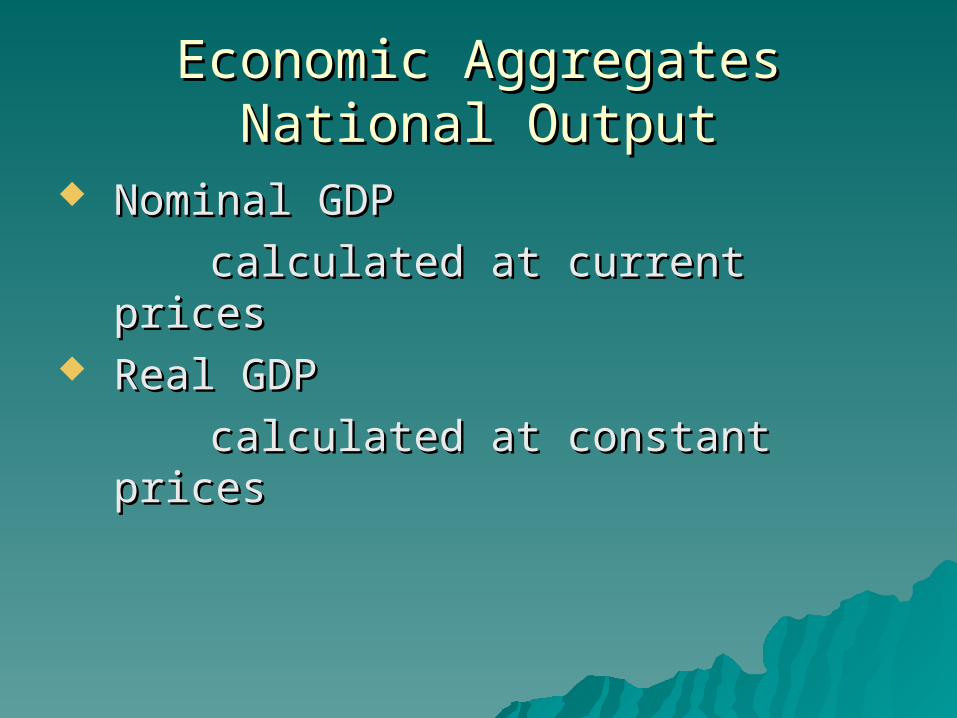
Economic AggregatesEconomic AggregatesNational OutputNational Output
Nominal GDPNominal GDP
calculated at current pricescalculated at current prices Real GDPReal GDP
calculated at constant pricescalculated at constant prices
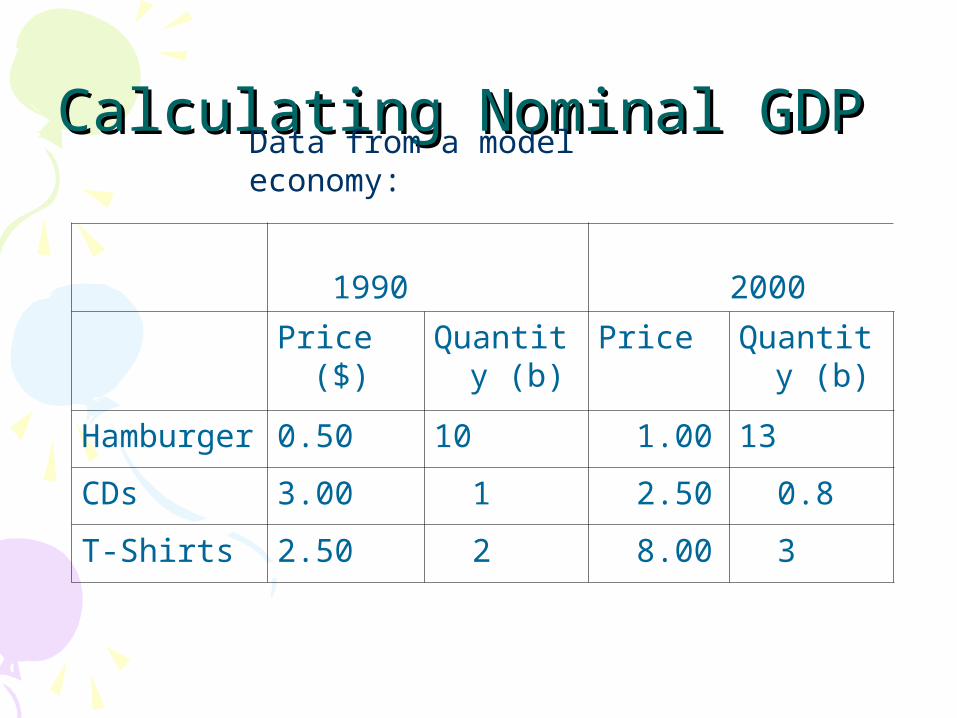
Calculating Nominal GDP Calculating Nominal GDP Data from a model economy:
1990 2000
Price ($) Quantity (b)
Price Quantity (b)
Hamburger 0.50 10 1.00 13
CDs 3.00 1 2.50 0.8
T-Shirts 2.50 2 8.00 3
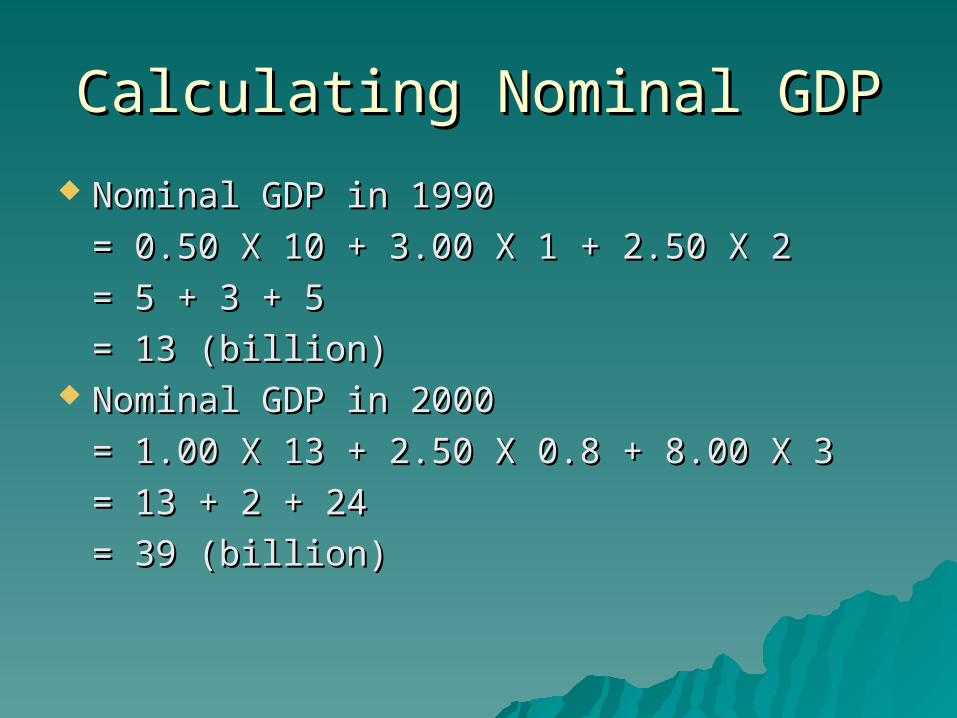
Calculating Nominal GDPCalculating Nominal GDP
Nominal GDP in 1990Nominal GDP in 1990
= 0.50 X 10 + 3.00 X 1 + 2.50 X 2 = 0.50 X 10 + 3.00 X 1 + 2.50 X 2
= 5 + 3 + 5 = 5 + 3 + 5
= 13 (billion)= 13 (billion) Nominal GDP in 2000Nominal GDP in 2000
= 1.00 X 13 + 2.50 X 0.8 + 8.00 X 3 = 1.00 X 13 + 2.50 X 0.8 + 8.00 X 3
= 13 + 2 + 24 = 13 + 2 + 24
= 39 (billion)= 39 (billion)
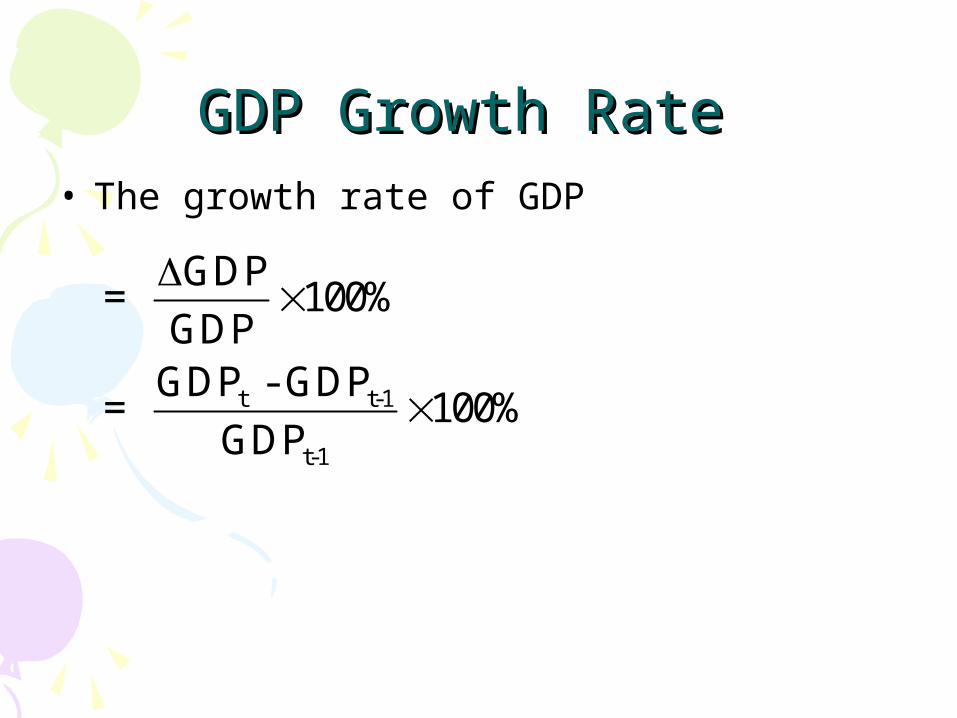
GDP Growth Rate GDP Growth Rate • The growth rate of GDP
t t-1
t-1
GDP= 100%
GDPGDP - GDP
= 100%GDP
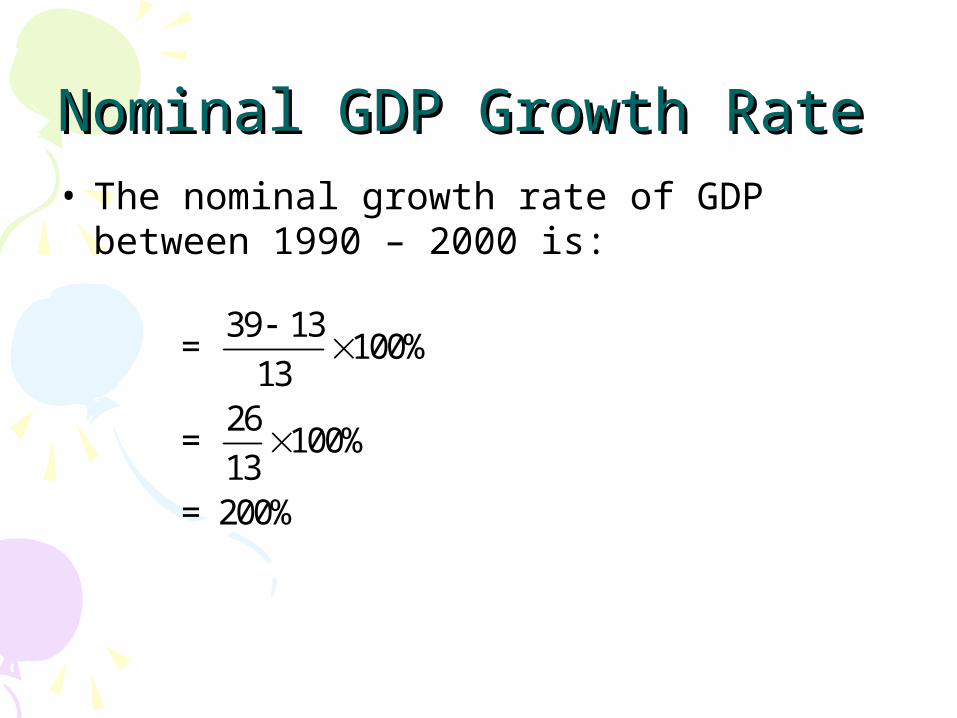
Nominal GDP Growth Rate Nominal GDP Growth Rate • The nominal growth rate of GDP
between 1990 – 2000 is:
39 13= 100%
1326
= 100%13
= 200%
Real Growth RateReal Growth Rate
Nominal Growth is misleading Nominal Growth is misleading because it has NOT corrected for because it has NOT corrected for inflationinflation
To correct for inflation, we rely on the To correct for inflation, we rely on the concept of real growth.concept of real growth.

Real GDP Real GDP
Real GDP is calculated at common Real GDP is calculated at common price (base-year price, constant price (base-year price, constant price). price).
Real GDP can be derived by Real GDP can be derived by
1. Adding up at common prices1. Adding up at common prices
2. Deflating the Nominal GDP 2. Deflating the Nominal GDP by the inflation rateby the inflation rate
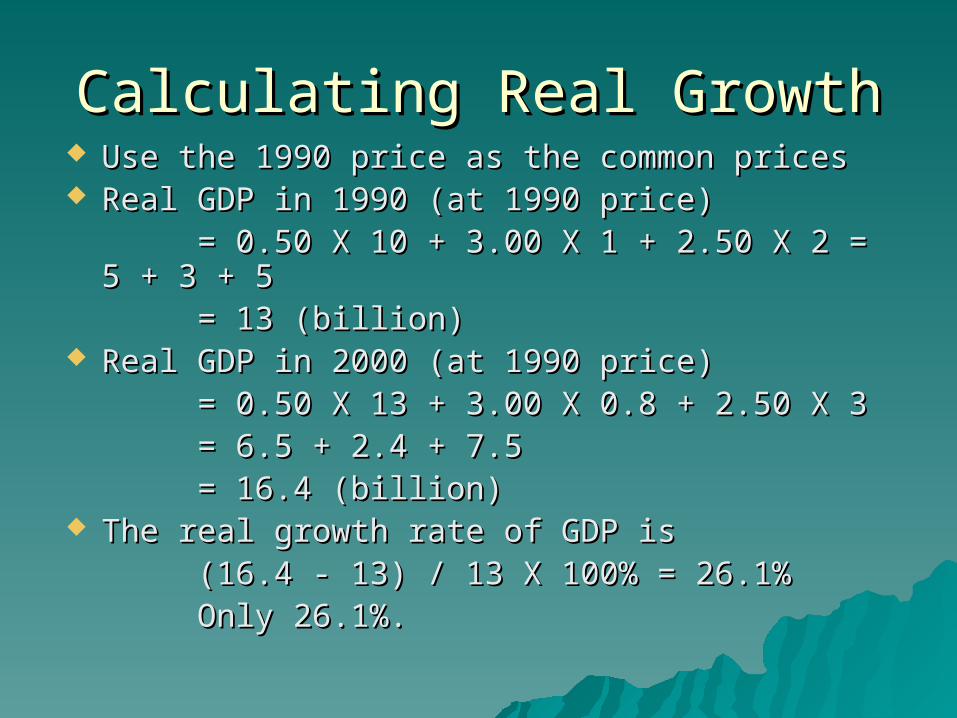
Calculating Real GrowthCalculating Real Growth Use the 1990 price as the common pricesUse the 1990 price as the common prices Real GDP in 1990 (at 1990 price)Real GDP in 1990 (at 1990 price)
= 0.50 X 10 + 3.00 X 1 + 2.50 X 2 = 5 + 3 = 0.50 X 10 + 3.00 X 1 + 2.50 X 2 = 5 + 3 + 5 + 5
= 13 (billion)= 13 (billion) Real GDP in 2000 (at 1990 price)Real GDP in 2000 (at 1990 price)
= 0.50 X 13 + 3.00 X 0.8 + 2.50 X 3 = 0.50 X 13 + 3.00 X 0.8 + 2.50 X 3 = 6.5 + 2.4 + 7.5 = 6.5 + 2.4 + 7.5 = 16.4 (billion)= 16.4 (billion)
The real growth rate of GDP is The real growth rate of GDP is (16.4 - 13) / 13 X 100% = 26.1%(16.4 - 13) / 13 X 100% = 26.1%Only 26.1%.Only 26.1%.
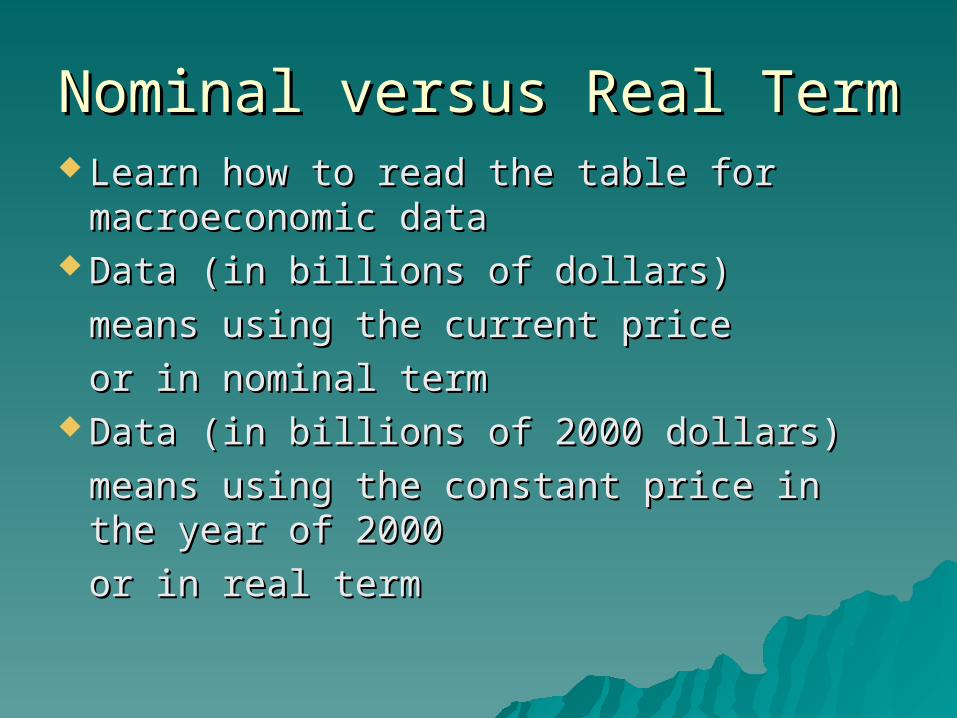
Nominal versus Real TermNominal versus Real Term Learn how to read the table for Learn how to read the table for
macroeconomic datamacroeconomic data Data (in billions of dollars) Data (in billions of dollars)
means using the current pricemeans using the current price
or in nominal termor in nominal term Data (in billions of 2000 dollars) Data (in billions of 2000 dollars)
means using the constant price in means using the constant price in the year of 2000the year of 2000
or in real termor in real term
Nominal versus Real Growth Nominal versus Real Growth in the recessionsin the recessions
Nominal growth data is misleading Nominal growth data is misleading in economic recessionin economic recession
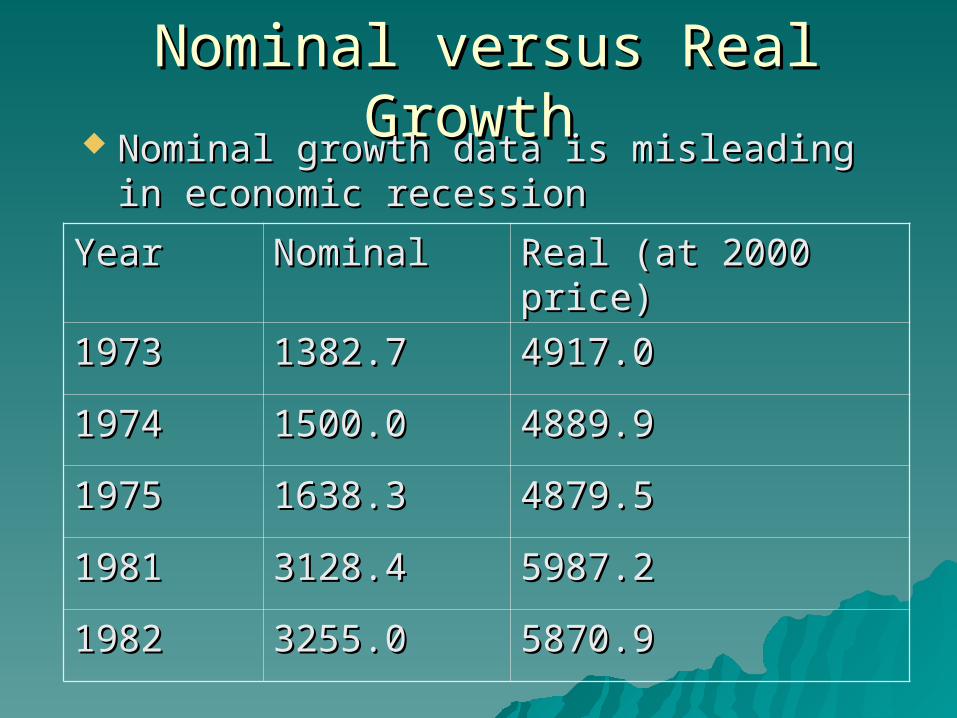
Nominal versus Real Growth Nominal versus Real Growth Nominal growth data is misleading in Nominal growth data is misleading in
economic recessioneconomic recession
YearYear NominalNominal Real (at 2000 price)Real (at 2000 price)
19731973 1382.71382.7 4917.04917.0
19741974 1500.01500.0 4889.94889.9
19751975 1638.31638.3 4879.54879.5
19811981 3128.43128.4 5987.25987.2
19821982 3255.03255.0 5870.95870.9
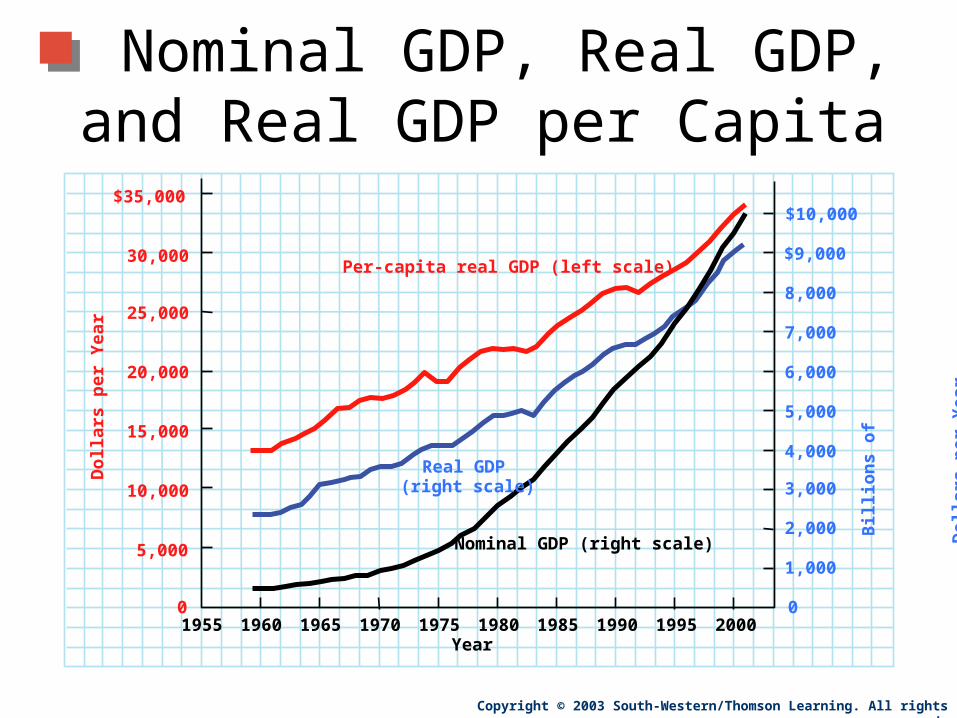
Nominal GDP, Real GDP, and Real GDP per Capita
Copyright © 2003 South-Western/Thomson Learning. All rights reserved.
1955 1960 1965 1970 1975 1980 1985 1990 2000 1995 Year
Nominal GDP (right scale)
Bill
ion
s o
f
Do
llars
per
Yea
r
$10,000
$9,000
7,000
5,000
3,000
8,000
6,000
4,000
1,000
2,000
0
Per-capita real GDP (left scale)
Do
llars
per
Yea
r
$35,000
25,000
15,000
Real GDP (right scale)
30,000
20,000
5,000
10,000
0

Limitations of GDP Limitations of GDP
Only market activity is included in Only market activity is included in GDP (underground, housekeeping GDP (underground, housekeeping work by housewives, etc). work by housewives, etc).
Other welfare factors are Other welfare factors are overlooked, such as leisure, security, overlooked, such as leisure, security, education, health, etc.education, health, etc.
International comparison can be International comparison can be misleading. (undervalued misleading. (undervalued currencies in developing countries)currencies in developing countries)