Embed Size (px)
Citation preview

The Real Effect of Financial Disclosure: International Evidence
Presented by
Dr Xi Li
Associate Professor of Accounting London School of Economics and Political Science
#2016/17-11
The views and opinions expressed in this working paper are those of the author(s) and not necessarily those of the School of Accountancy, Singapore Management University.

The Real Effect of Financial Disclosure: International Evidence
Xi Li London School of Economics
[email protected] 44 (0)20-7955-7932
Fariborz Moshirian Australian School of Business
UNSW Australia [email protected]
61(02) 938-55859
Xuan Tian Kelley School of Business
Indiana University [email protected]
(812) 855-3420
Bohui Zhang Australian School of Business
UNSW Australia [email protected]
61(02) 938-55834
Current Version: August 2016
* We thank Zhengyuan Wang for his early contribution to this paper. We also thank comments from Zachary Kaplan (discussant) and participants at the 2016 FARS mid-year meeting and 2016 AAA annual meeting. We remain responsible for all errors and omissions.

The Real Effect of Financial Disclosure: International Evidence
Abstract
Rajan and Zingales (1998, 2003) argue that good accounting standards and disclosure rules reduce the wedge between the cost of internal and external funds and enhance growth. We test the causal link between financial reporting and growth using a quasi-natural experiment – the mandatory adoption of International Financial Reporting Standards (IFRS) across the world - and examine its effect on innovation, a corporate activity that directly drives economic growth. Our Difference-in-Differences (DiD) results suggest that improved financial reporting leads to more innovation in the long run – it generates more patents and patents with higher impact. We also find that the positive effect of improved financial reporting on innovation is more pronounced among industries with higher dependence on external financing, consistent with the role of good financial reporting in reducing the cost of external financing. In addition, we find results consistent with the managerial learning hypothesis that managers are able to learn from the stock market after improved financial transparency. Our paper sheds new light on the real effects of financial reporting.
JEL Classifications: G15; G19; M41; M42 Keywords: Financial reporting; IFRS; Innovation; Patents; Citations

1
1. Introduction
Innovation is vital to a firm’s business success and a country’s long-term economic
growth. From the perspective of the accounting literature, it is intriguing to understand the role
of financial disclosure on corporate innovation. Overwhelmingly, the recent literature finds
that firm innovation is impeded by several disclosure mechanisms such as financial analysts
(He and Tian, 2013), media coverage (Dai, Shen, and Zhang, 2015), accounting conservatism
(Chang et al., 2016), and mutual fund holding disclosure (Agarwal, Vashishtha, and
Venkatachalam, 2016). This dark side evidence raises a fundamental concern about whether
transparency is a recipe for innovation.
To answer this important research question, we take advantage of the mandatory
adoption of International Financial Reporting Standards (IFRS) as a quasi-natural experiment
that provides plausibly exogenous variation in financial reporting, and explore its effect on
corporate innovation around the world. The European Commission (EC) Regulation No.
1606/2002 requires that all firms which have traded in major stock exchanges of the European
Union (EU) adopt IFRS from 2005 onwards. Australia and South Africa also mandated IFRS
adoption in 2005, followed by New Zealand in 2007, and Israel and Turkey in 2008. This event
represents one of the largest changes in the history of financial reporting, and the IFRS adoption
has substantially improved firms’ accounting practices and transparency.
Financial reporting can promote corporate innovation through two channels. First,
motivating innovation is a challenge for most firms. According to the World Bank Enterprise
Surveys (2006-2010), almost 40% of firms cite insufficient access to finance as the foremost
obstacle to their operations and growth. Innovation is a long-term process that tends to exhaust
internal capital and entails uncertainty, which hinders effective communication with outside
investors (Bhattacharya and Ritter, 1983). Innovative firms thus suffer more severely from
limited external financing. Rajan and Zingales (1998, 2003) argue that an accounting and

2
disclosure system that promotes transparency is essential to the development of a country’s
financial system, because it directly affects the ability of firms to raise external funds and thus
affects capital-allocation efficiency in the economy. Therefore, we expect enhanced financial
reporting to increase a firm’s innovation output via this financial constraint channel.
Second, financial reporting can affect corporate innovation through facilitating the
feedback effects of outsiders. Allen and Gale (1999) state that innovative projects are usually
difficult to evaluate, because information about their prospects is either sparse or hard to
process. Financial reporting discloses firms’ investment information to the public and allows
outsiders’ to judge the prospects of firms’ investment opportunities, which, in turn, affects firm
managers’ real investment decisions. For example, Loureiro and Taboada (2015) document
that the improvement in financial reporting increases insiders’ ability to learn from outsiders
measured by investment-to-price sensitivity and the relation between the market reaction to
merger and acquisition (M&A) deal announcements and the likelihood of deal completion. In
addition, uniformed financial reporting increases comparability across firms and allows
managers to learn from their peers and make better investment decisions. Thus, we expect that
the feedback role of financial reporting can improve firms’ investment efficiency in innovation.
We term this mechanism the feedback channel.
An alternative hypothesis predicts the opposite effect. A high level of information
transparency and comparability could create high capital-market pressure and thus lead to
managerial myopia aiming to improve short-term profitability, which, in turn, could be
detrimental to firms’ long-term value (e.g. Stein, 1989; Bhojraj and Libby, 2005). For example,
Graham, Harvey, and Rajgopal (2005) survey 401 chief financial officers (CFOs) in the U.S.
and find that the majority of CFOs are willing to sacrifice long-term value, such as R&D
spending, for short-term performance because they are pressured to meet short-term targets.
He and Tian (2013) find that financial analysts impose short-term pressures on managers and

3
reduce market’s tolerance for failure. Therefore, financial reporting and transparency can also
impede firm innovation.
To test these two competing views, we focus on the changes in firms’ innovation output
before and after the mandatory adoption to evaluate the real effect of financial reporting). We
employ a difference-in-differences (DiD) approach by using mandatory IFRS adopters as the
treatment group and two alternative control groups. The first control group includes non-IFRS
adopters from countries that did not mandate IFRS adoption during our sample period, i.e.
2001-2009. The second control group includes firms that voluntarily adopted IFRS before their
countries’ mandatory adoption date. We collect innovation data from the Orbis database for
individual firms, and build two proxies to capture a firm’s innovation output – patent count and
patent citation count – following the innovation literature (e.g. Hall, Jaffe, and Trajtenberg,
2001; Hsu, Tian, and Xu, 2014).
Our baseline analysis shows that mandatory IFRS adoption is positively correlated
with corporate innovation. Mandatory IFRS adopters generate 8.7% more patents and their
patents receive 8.5% more citations, compared to non-adopters from non-IFRS adopting
countries after the mandatory adoption. We also find that mandatory adopters generate 3.3%
more patents and their patents receive 1.5% more citations, compared to voluntary adopters
domiciled in the same countries after the mandatory adoption date. To further examine the
timing of the change, we use a dynamic DiD approach. The result indicates that there are no
significant differences in innovation performance between mandatory IFRS-adopters and non-
IFRS adopters or voluntary adopters prior to the mandatory adoption dates. IFRS-adopters start
to exhibit better innovation performance only after the adoption and incrementally more
innovation two years after the adoption, consistent with the view that it takes time for firms to
make strategic adjustments to increase their innovation output.

4
Next, we explore the financial constraint channel through which mandatory IFRS
adoption may facilitate innovation. Innovative firms are more likely to be subject to internal
capital constraints (Brown, Fazzari, and Petersen; 2009) and thus rely more on external finance.
Prior literature documents reduced costs of capital and improved cross-border financing
following mandatory IFRS adoption (Li, 2010; Chen, Ng, and Tsang, 2014), which could
potentially improve a firm’s ability to innovate, especially for financially constrained firms.
Building on an exogenous measure of dependence on external finance, we find evidence
suggesting that country-level transparency score is positively associated with firm innovation
among industries with high dependence on external finance in pre-IFRS adoption period. After
the mandatory IFRS adoption, firms from external-finance-dependent industries experience a
disproportionally higher improvement of innovation output.
Lastly, we explore the feedback channel through which mandatory IFRS adoption may
encourage more innovation. We first find evidence consistent with the argument that IFRS
adoption increases insiders’ ability to learn from capital market, measured as an average
increase in investment-to-price sensitivity in our sample of mandatory adopters after the
adoption. We then document evidence suggesting that the positive effect of IFRS adoption on
innovation is more pronounced among firms from industries experiencing improvement in
managerial learning.
This paper contributes to the finance and accounting literature in the following ways.
First, it contributes to the literature examining the real effect of financial reporting. There is a
large body of literature in accounting examining the role of accounting in capital markets (see
Kothari (2001) for a review). However, very little research has been devoted to examining the
real effect of accounting. Kedia and Phillipon (2009) examine the real economic consequences
of fraudulent accounting practices and find that earnings management distorts resource
allocation, as misreporting firms hire and invest excessively and shrink quickly after the fraud

5
is detected. Our paper complements theirs by showing the bright side of improved financial
reporting – its encouragement of corporate innovation, which plays a critical role in sustaining
economic growth.
Our paper also contributes to the rapidly growing body of literature on motivating
technological innovation, especially in a global market. Holmstrom (1989) points out that
innovation activities may mix poorly with routine activities in an organization. Manso (2011)
theoretically discussed several mechanisms to motivate innovation. There are a range of factors
identified by the literature exhibiting positive or negative effects on corporate innovation,
including the timing of financial markets (Nanda and Rhodes-Kropf, 2013), laws (Acharya and
Subramanian, 2009; Brown, Martinsson, and Petersen, 2013), financial market development
(Hsu et al., 2014), firm boundaries (Seru, 2014), stock liquidity (Fang et al., 2014), analyst
coverage (He and Tian, 2013), banking competition (Cornaggia et al., 2015), product market
competition (Aghion et al., 2005), and institutional investors (Aghion et al., 2013; Chemmanur
et al., 2014). To the best of our knowledge, our paper is among the first to take the perspective
of financial reporting as a motivation for corporate innovation.
This paper also contributes to studies examining institutional features as determinants
for innovation. Brown et al. (2013) use accounting standards as a proxy for a firm’s ease of
access to external financing, as Rajan and Zingales (1998) argue that a country’s accounting
system facilitates external equity financing. However, as Brown et al. (2013) observe and point
out in earlier literature also, a country’s accounting system is largely static and endogenously
determined by other institutional features, such as legal origin and market demand. Using an
exogenous change in a country’s accounting system enables us to draw the casual link between
transparency and innovation.
This paper is related to the literature examining IFRS adoption on investment efficiency.
Using reported accounting numbers, such as capital expenditures, R&D expenditures, earnings
6
and cash flows, Schleicher, Tahoun, and Walker (2010), Shroff, Verdi, and Yu (2014), and
Chen, Young, and Zhuang (2013) find that mandatory IFRS adoption leads to a higher level of
investment efficiency. They attribute their findings to better external information environments
and better comparability among peers that leads to better monitoring and lower agency
problems. Our paper differs from these in several ways. First, we do not rely on financial
statement information to measure the output. The IFRS has drastically changed firms’ financial
reporting, including the measurement and recognition of earnings, investments, and R&D
expenditures. The differential results documented by prior studies using reported accounting
numbers to measure investment efficiency might be confounded by the changes in reporting
rules. Second, Koh and Reeb (2015) find that many innovative US firms strategically avoid
reporting R&D expenditures in their financial statements. Studies that treat firms without R&D
expenditures reported in financial statements as having zero R&D significantly underestimate
firms’ innovation activities. Interestingly, they find that after forced auditor change, firms that
did not report R&D before start to report substantial amounts of R&D expenditure, suggesting
that not-reporting R&D is a discretionary reporting choice rather than a lack of innovative
activities. Considering the consistent reporting standards on R&D and strong enforcement in
the US, our sample of international firms is even more likely to be subject to such reporting
discretion. Therefore, results relying on reported R&D expenditures as the dependent variable
are confounded by the concern that firms strategically disclose more R&D under the IFRS
regime.1 Third, innovation output is fundamentally different from investment efficiency. Firms
could have high investment efficiency but lack innovation, and vice versa.
The rest of the paper proceeds as follows. Section 2 introduces the database of
innovation, explains the proxies for innovation and describes the sample selection procedure.
1 The reason why a firm wants to record more R&D expenditure under IFRS could be to take extra expenditure during the current period in order to create a buffer for future earnings management.

7
Section 3 presents model specifications and reports empirical findings of the baseline and
dynamic models. In Sections 4 and 5, we discuss the financial constraint channel and feedback
channel through which mandatory IFRS affects corporate innovation, and provide empirical
evidence. Finally, Section 6 concludes.
2. Data and Sample Selection
In this section, we introduce the global patent database used in this study, and explain
the construction of key innovation variables. We also describe the sample selection process
and present summary statistics.
2.1. Patent Database
We use the Bureau Van Dijk’s Orbis patent database to construct our innovation
variables. This database is sourced from the European Patent Office’s (EPO) Worldwide Patent
Statistical Database (PATSTAT). Similar to the USPTO, the EPO is one of the largest and most
important patent offices in the world. The Orbis patent database offers a comprehensive
coverage of more than 88 million patent applications worldwide since 1850.3 These patents are
filed by various types of entities, including publicly-traded and privately-held firms,
individuals, governments and universities through 94 regional, national and international patent
offices.
Because of its worldwide coverage, the Orbis patent database is more suitable for
international studies. Many prior innovation studies, such as Hall, Jaffe, and Trajtenberg (2005)
and Aghion, Van Reenen, and Zingales (2013) among many others, are based on a single
country, in most cases the US, and thus relies on the NBER patent database compiled from the
United States Patent and Trademark Office (USPTO). Although the NBER patent database is
3 This number is by October 2014. Out of 88 million patents, 37.3 millions are granted patents.

8
an excellent source of patents filed in the US, its exclusion of international patents from other
patent offices is an obvious limitation for international studies. An exception is Hsu, Tian, and
Xu (2014) who use the distribution of US patents filed by foreign firms to estimate innovation
activities in corresponding countries. However, observed foreign patenting activities may be
very different from domestic innovation. For example, Goto and Motohashi (2007) compare
data from the USPTO and the Japan Patent Office (JPO), and find that the distribution of
USPTO patents filed by Japanese firms is quite different from the distribution of domestic
Japanese patents filed in the JPO. In addition, inconsistent administrative procedures across
patent offices may contaminate the data and thus proper adjustments may be necessary (Webb
et al., 2005). Using the Orbis patent database can help us overcome these shortcomings of the
NBER patent database and enable us to more accurately identify innovation at the firm-level.
2.2. Innovation Measures
Following the innovation literature, we construct two measures for innovation: total
number of granted patents and the total number of citations. The first measure is the total
number of patents granted to each firm in every year. This variable captures the output side of
innovation instead of the traditional input side of innovation such as R&D expense used in
prior literature (e.g. Brown, Martinsson, and Petersen 2013). The availability of patent count
is better than R&D expenditure, because the latter is generally not reported consistently during
our sample period by non-US firms. We use a patent’s application year to match other financial
data because it usually takes years before a patent is eventually granted.
We only aggregate patents for those without priority numbers to prevent overestimating
patent count. The priority number is commonly used in the international patent system as “the
number of the application in respect to which priority is claimed, i.e., it is the same as the
application number of the claimed priority document” (Orbis manual). A simple example
illustrates the functionality of priority number. For example, the Japanese car manufacturer

9
Toyota generates an invention and applies for a patent to the JPO. Several months later, Toyota
applies for a patent to the USPTO for the same invention expecting to have protection in the
US. This subsequent USPTO patent is associated with a priority number, which is the
application number of the prior JPO patent, indicating that the same invention has been applied
for a patent before. So this USPTO patent is not considered as a novel new invention, and only
one patent is counted for Toyota.
The raw patent count is subject to a truncation problem as shown by Hall, Jaffe, and
Trajtenberg (2001, 2005). Due to the application-grant lag, many patents may not have been
granted if they were applied for in the last several years of database coverage. Our download
of the Orbis database is up to July 2014, so we follow Hall, Jaffe, and Trajtenberg’s (2001,
2005) method to adjust the raw patent count in the last few years of database coverage (2009-
2014) using the application-grant lag distribution of 2004-2008. Specifically, we define the
application-grant lag distribution (𝑊𝑊𝑠𝑠), as the percentage of patents applied for in a given year
that are granted in s years. For the truncation-adjusted patent count (𝑃𝑃𝑎𝑎𝑎𝑎𝑎𝑎), we compute 𝑃𝑃𝑎𝑎𝑎𝑎𝑎𝑎 =
𝑃𝑃𝑟𝑟𝑟𝑟𝑟𝑟∑ 𝑊𝑊𝑠𝑠2014−𝑡𝑡𝑠𝑠=0
, where 𝑃𝑃𝑟𝑟𝑎𝑎𝑟𝑟 is the raw patent count at year t and 2009 ≤ t ≤ 2014. After the
adjustment of truncation, we need to transform the value. As the patent count is a discrete
variable and highly right-skewed with a large number of zero patent observations in the sample,
we use the logarithm of one plus the discrete patent count as the dependent variable in the
regression analysis following the innovation literature such as Atanassov (2013) and Hsu, Tian,
and Xu (2014).
The second innovation measure we build is the number of citations received by patents.
This measure captures the quality of innovation (Hall, Jaffe, and Trajtenberg, 2001) because a
patent is very likely to be of great technological importance if it receives a high volume of
citations from future patents. The raw citation count is subject to the truncation problem as well
(Hall, Jaffe, and Trajtenberg, 2001) because a patent may keep receiving future citations after

10
the end of the database coverage period. Another issue artificially distorting the raw citation
count is the inconsistency of administration procedures implemented by different patent offices.
Webb et al. (2005) and Goto and Motohashi (2007) document that citations received by USPTO
patents are significantly higher than citations received by EPO or JPO patents. They find the
reason for this discrepancy is due to different administrative procedures among these patent
offices. As the USPTO imposes a legal requirement on applicants to supply a complete list of
citations at the time of application, applicants are likely to provide more than the necessary
citations in order to avoid any punishments. However, USPTO patent examiners may not have
enough time to verify every citation (Webb et al., 2005). In contrast, the EPO does not impose
any similar requirements. In the EPO, it is the patent examiners’ duty to determine appropriate
citations. The EPO follows a parsimonious philosophy by including only the most relevant and
important citations. The JPO’s policy has changed several times, and its current policy is a
mixture of the USPTO and the EPO. Additionally, the JPO’s citation system contains some
other unique features, described by Goto and Motohashi (2007). To reduce noise in the raw
data, we choose a fixed effect adjustment approach suggested in Hall, Jaffe, and Trajtenberg
(2001). Specifically for the raw citation count of each patent, we divide the raw value by the
average raw number of citations across all patents from the same patent offices and in the same
year. This approach helps reduce year and patent office effects. After making this adjustment,
we then aggregate the total number of citations received by patents for each firm in every year.
As with patent counts, citation counts are a discrete variable, also. As a result, we use the
logarithm of one plus patent counts (citation counts) in our regressions.
Although using patenting activities to measure innovation has been widely used, it is
important to note that this type of measure has its own limitations. For example, not all kinds
of innovation are well captured by patents. As filing a patent requires public disclosure of
technological details, some firms may choose to keep their inventions secret instead of seeking

11
protection by filing patents. Other conceptual innovation or operational optimization type
innovations are not eligible to file patents under current regulations. There are other formats of
intellectual property protection such as trademarks or copyright. Firms in different industries
may choose different ways to materialise their innovation. Furthermore, patents only reflect
successful innovative activities, leaving unsuccessful innovative attempts unobserved.
Nevertheless, there are no other widely accepted innovation measures yet (Acharya and
Subramanian, 2009). Despite these imperfections, patenting activities still reflect very
important technological innovations that are available for public access, and can be
quantitatively measured. We carefully design additional controls which help strengthen the
credibility of the findings.
2.3. Sample Selection
We employ firms from countries with mandatory IFRS adoption during our sample
period, i.e. 2001-2009, as a treatment group. Since the majority of our sample countries adopted
IFRS in 2005, in order to analyse firms’ innovation activities during pre- and post-IFRS
mandatory adoption periods, our sample period is a nine-year (2001-2009) window centred
around the mandatory adoption year of 2005. This length of sample period is appropriate,
because a longer period may introduce unnecessary noise due to other events, while a shorter
period may not sufficiently reflect the changes of innovation given its nature as a long-term
activity. For the treatment sample, we only keep firms that switched to IFRS for the first time
at the mandatory adoption date, following the IFRS literature (such as Li, 2010; Christensen,
Hail, and Leuz, 2013). These firms are referred to as mandatory IFRS adopters. Other firms
which are domiciled in IFRS-adopting countries but voluntarily adopted IFRS before their
countries’ adoption date are excluded from the treatment sample but instead used as a control
group. We use non-IFRS adopters from non-IFRS adopting countries during our sample period

12
as another control group. Similarly, we remove firms that voluntarily adopted IFRS from this
group.
We obtain firm-year financial data from the Worldscope and Compustat Global
databases and require every firm to have at least two years’ data (one before and one after the
mandatory adoption date for the mandatory adopters and voluntary adopters and two
observations during the whole sample period for non-adopters). We impose a restriction on the
eligible sample countries to have a minimum of two firms and one patent record during our
sample period. We use the two-digit SIC code to classify industries and exclude financial
industries (SIC 60-69) and utility industries (SIC code 49) from the sample. Finally, our
regression analysis controls for macroeconomic variables obtained from the World Bank. As a
result, countries (regions) lacking macroeconomic data are not included.
After imposing the above conditions, our final treatment sample consists of 3,217
mandatory adopters from 24 IFRS-adopting countries. Our first control sample consists of
20,740 non-adopters from 14 non-IFRS countries. Our second control sample consists of 916
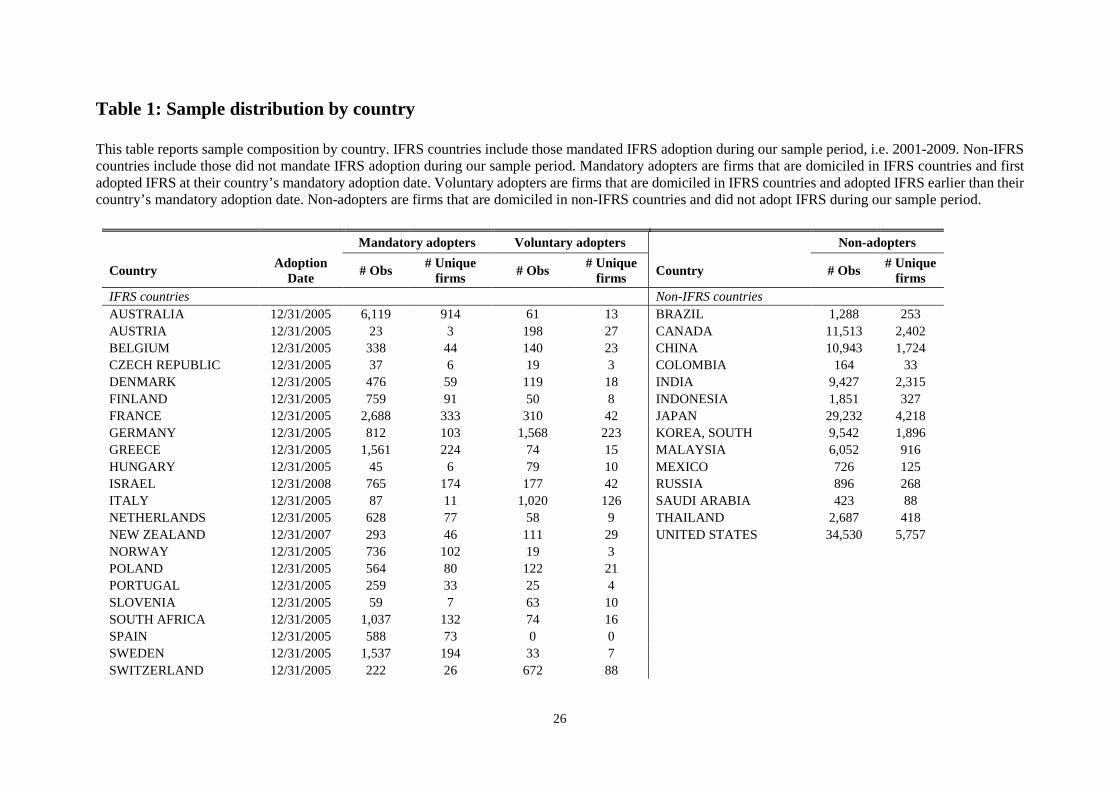
voluntary adopters from 23 IFRS-adopting countries (Spain has been dropped). Table 1 reports
sample distribution. Within the treatment group, Australia and the UK are the two largest
countries with 914 and 455 firms in our sample, respectively. Within the non-IFRS country
group, the US with 5,757 firms is ranked first, followed by Japan with 4,218 firms. Table 2
reports sample distribution by calendar year of financial information. Both the treatment and
control samples are evenly distributed during our sample period.
3. Research Design and Empirical Results
3.1. Baseline Model Specification
We employ a DiD approach in the baseline analysis. Specifically, we estimate the following
model:

13
Log(1+Innovationi,t+2 )= α + β1 Mandatoryi×Post_IFRSi,t + β2 Post_IFRSi,t+ Controls (1)
where Innovationi,t+2 is one of the two innovation measures constructed in the previous section
for firm i in year t+2. As discussed above, we use the patent application year to determine the
timing of innovation. Because it takes time to observe innovation output and the effect of
mandatory adoption on firm innovation could be lagged, we approximate the gap between IFRS
and patent application by a two-year lag in our main analysis. The two-year gap is comparable
to most other existing innovation studies such as Tian and Wang (2014), Atanassov (2013),
and Hsu, Tian, and Xu (2014). Mandatoryi is a binary variable that equals one for mandatory
adopters i from mandatory IFRS adoption countries and zero otherwise. Post_IFRSi,t is a binary
variable that equals one for fiscal years ending on or after the country’s mandatory adoption
date (listed in Table 1) and zero otherwise. It is set as zero for firms from non-IFRS adopting
countries.
We include a set of firm-, industry-, and country-level time-varying control variables
that may affect innovation in the regressions. Following Atanassov (2013), Hsu, Tian, and Xu
(2014) and Brown, Martinsson, and Petersen (2013), we use total assets, market-to-book ratio,
leverage, return on assets (ROA), tangible assets scaled by total assets, capital expenditures
scaled by total assets, percentage of insider holdings, percentage of institutional ownership,
and the number of analysts following as firm-level control variables. At the industry-level, we
control for industry concentration measured by the sales Herfindahl index for each two-digit
SIC industry in every country. We include its squared term to control for any non-linear
relationship between industry concentration and innovation (Aghion et al., 2005; Atanassov,
2013). At the country-level, we control for the logarithm of Gross Domestic Production (GDP)
per capita and total stock market capitalisation scaled by GDP as proxies for country and capital
market development. Our model includes firm fixed effect to alleviate the concern of time-
invariant omitted variables such as unobservable firm characteristics that may drive our results.

14
The firm-level variable Mandatoryi is subsumed by firm fixed effects. Year fixed effect is
controlled to absorb external annual shocks such as the global financial crisis in 2008.
Our main variable of interest is the coefficient estimate of the interaction term 𝛽𝛽1. If 𝛽𝛽1
is positively significant, it means that there is a significant improvement in innovation for
mandatory IFRS adopters during the post-IFRS adoption period compared to the control group.
We cluster standard errors at the country level to address the correlations among residuals
within the same country.
3.2. Baseline Result
Table 3 reports the summary statistics for variables used in our regressions separately
for the treatment group, i.e. mandatory adopters from IFRS-adopting countries, and two control
groups, i.e. non-adopters from non-IFRS adopting countries and voluntary adopters from IFRS-
adopting countries.
Table 4 reports the result of the baseline analysis. In the first column, the coefficient
estimate of Mandatory × Post_IFRS is 0.087 and is significant at the 1% level. The magnitude
of the coefficient estimate suggests that during the post-IFRS adoption period, mandatory IFRS
adopters generate about 8.7% more patents, on average, than non-IFRS adopters. This
observation is not only statistically significant, but also economically sizeable. In the second
column when citation count is the dependent variable, the coefficient estimate of the interaction
term is 0.085 and is significant at the 1% level. It means that mandatory IFRS adopters receive
about 8.5% more citations, on average, than non-IFRS adopters during the post-IFRS period.
In columns (3) and (4), we exclude the US from the control sample and get similar results. In
columns (5) and (6), we use voluntary adopters from IFRS-adopting countries as the control
group. These firms are from the sample countries as the mandatory adopters, mitigating the
concern that the results are driven by different country institutions across IFRS-adopting and
non-adopting countries. We continue to find positive and significant coefficients on Mandatory

15
× Post_IFRS, suggesting that, relative to voluntary adopters who adopted IFRS earlier,
mandatory adopters generate more patents and citations after the mandatory adoption date. The
coefficient estimate on Post_IFRS is negative and largely insignificant, suggesting that
innovation for voluntary adopters do not change after their countries’ mandatory adoption date.
Across all columns, the adjusted R-squared values are reasonably high indicating a good fit for
our specification. Overall, our baseline result empirically shows that mandatory IFRS adoption
facilitates innovation.
3.3. Dynamics
A critical assumption of the DiD approach is the parallel trend assumption in the treatment and
control groups before the event. Therefore, we introduce a dynamic model to verify this
assumption by investigating whether there was an existing difference in innovation between
mandatory IFRS adopters and non-IFRS adopters before 2005. In the dynamic model, we
repeat Equation (1) by replacing the Post_IFRSi,t indicator with three separate event window
indicators, including the two years leading up to the adoption (Pre_IFRSi,t-2,t-1), the first two
years after the adoption (Post_IFRSi,t,t+1), and the remaining years (Post_IFRSi,>=t+2).
Pre_IFRSi,t-2,t-1 is thus defined as being one for observations from the IFRS countries and with
fiscal years ending on or after Month -24 (relative to the IFRS adoption date) and before Month
0, and zero otherwise. Post_IFRSi,t,t+1 is defined as being one for observations from the IFRS
countries and with fiscal years ending on or after Month 0 and before Month +24, and zero
otherwise. Post_IFRSi,>=t+2 is defined as being one for observations from the IFRS countries
and with fiscal years ending on or after Month +24 and zero otherwise. Other control variables
and fixed effects are the same as those in the baseline regressions.
Table 5 reports the results of the dynamic model. In the first column, we find that the
coefficient estimate of Mandatoryi×Pre_IFRSi,t-2,t-1 is not significant. Therefore, there is no
evidence showing that there is an existing difference in innovation between the treatment and

16
control group before the IFRS adoption. The assumption of DiD is unlikely to be violated. We
also observe that throughout the sub-periods after the IFRS adoption, the coefficient of
Mandatoryi×Post_IFRSi,>=t-1 is more positive and significant than the coefficient of
Mandatoryi×Post_IFRSi,t,t+1. This observation suggests that mandatory IFRS adopters become
incrementally more innovative compared to control firms about two years after the adoption.
This finding is consistent with our conjecture that it takes time for firms to adjust their
operations in response to policy changes. It is also consistent with the long-term nature of
innovation discussed before.
4. Financial Constraint Channel
As Rajan and Zingales (1998, 2003) argued, the accounting system affects a firm’s
ability to raise external funds, which could affect their innovative activities. According to the
existing accounting literature, IFRS improves a firm’s external financing ability for at least two
reasons. Firstly, IFRS enhances financial disclosure because IFRS generally requires more
disclosure than local accounting rules (Ashbaugh and Pincus, 2001). Enhanced disclosure helps
lower the cost of capital by mitigating information asymmetry (Diamond and Verrecchia, 1991)
or by lowering systematic risk (Barry and Brown, 1985; Lambert, Leuz, and Verrecchia, 2007).
Secondly, adoption of IFRS increases cross-border comparability of financial information
(DeFond et al., 2011; Yip and Young; 2012). Chan, Covrig, and Ng (2005) and Covrig, DeFond,
and Hung (2007) argue that the cost of acquiring and processing information, particularly faced
by foreign investors, is reduced as a consequence of IFRS. De Franco, Kothari, and Verdi (2011)
find that analyst following and the accuracy of forecasts are positively correlated with
accounting information comparability. Therefore, it is reasonable to expect a drop in the cost
of capital when the information cost is lowered. Indeed, Daske et al. (2008) and Li (2010)
provide evidence that the cost of capital is reduced following mandatory IFRS adoption.

17
Based on above findings, we hypothesize that improved ability to obtain external
financing is one underlying channel through which mandatory IFRS adoption facilitates
innovation. Brown, Fazzari, and Petersen (2009) argue that innovative firms are more likely to
be subject to capital constraints thus relying on external financing. Brown, Martinsson, and
Petersen (2012), Brown, Martinsson, and Petersen (2013) and Hsu, Tian, and Xu (2014) all
empirically document that increased availability of external finance promotes corporate
innovation.
We conduct two analyses to test this hypothesis. First, we examine whether innovation
is positively associated with the transparency of a country’s accounting system among
industries with high dependence on external finance during the pre-IFRS adoption period. To
measure a country’s transparency in the pre-IFRS adoption period, we use country-level
opacity scores constructed by Leuz, Nanda, and Wysocki (2003) and subsequently updated by
Leuz (2010) using data from 1996-2005. To match this sample, we re-construct our sample
period to 1996-2004. We exclude the year 2005 to make sure our sample firms are not affected
by the IFRS adoption in 2005.
We follow Rajan and Zingales (1998) to measure the dependence on external finance
as the portion of capital expenditures not internally generated, i.e., capital expenditures minus
cash flow from operations divided by capital expenditures.4 We first obtain information on all
US firms with non-missing annual data on capital expenditures and cash flows from operations
as covered by Compustat North America during the same sample period, i.e. 1996-2004. To
smooth temporal fluctuations, we then sum each firm’s capital expenditure minus cash flow
from operations over the sample period and then divide it by the sum of capital expenditures
4 Rajan and Zingales (2003)’s approach has been widely used in the literature (such as Gupta and Yuan, 2009; Brown, Martinsson, and Petersen, 2013; Hsu, Tian, and Xu, 2014). Brown, Martinsson, and Petersen (2013) propose a modified version of dependence on external finance by dividing the amount of capital expenditure not funded by operational cash flow over the total amount of capital expenditure plus R&D costs. However, due to the concerns about R&D disclosure as pointed out by Koh and Reeb (2015), we do not use the Brown et al. measure.

18
over the sample period. This procedure creates the firm-level external finance dependence
measure. Lastly, we create the industry-level external finance dependence measure by taking
the industry medians at the two-digit SIC level. Although this measure is calculated using US
data, we apply it to the same industry across all countries, as Rajan and Zingales (1998) argued
that dependence on external finance is an inherent firm characteristic mainly driven by
technological reasons and thus is unlikely to be affected by a country’s accounting system or
to vary across countries. We follow Rajan and Zingales (1998) and conduct the analysis at the
country-industry-year level using the model below:
Log(1+Innovationj,k,t+2 )= α + β1 Transparencyk × External Dependencej + Controls (2)
where Innovationj,k,t+2 is the total number of patents or citations in industry j of country k in
year t+2. Transparencyk is a time-invariant country-level opacity score for country k obtained
from Leuz (2010). We multiply the score by -1, so that a higher score indicates a higher level
of transparency. External Dependencej the time-invariant external dependence ratio for
industry j as described above. We include various industry- and country-level controls and
additionally industry, country, and year fixed in this regression. Therefore, the main effects of
Transparencyk and External Dependencej are subsumed. We expect the coefficient estimate
𝛽𝛽1 to be positive, as industries with higher dependence on external finance are more innovative
in countries with more transparent accounting systems. We follow a similar sample selection
approach as described in Section 2.3. We exclude US firms from this analysis as US firms are
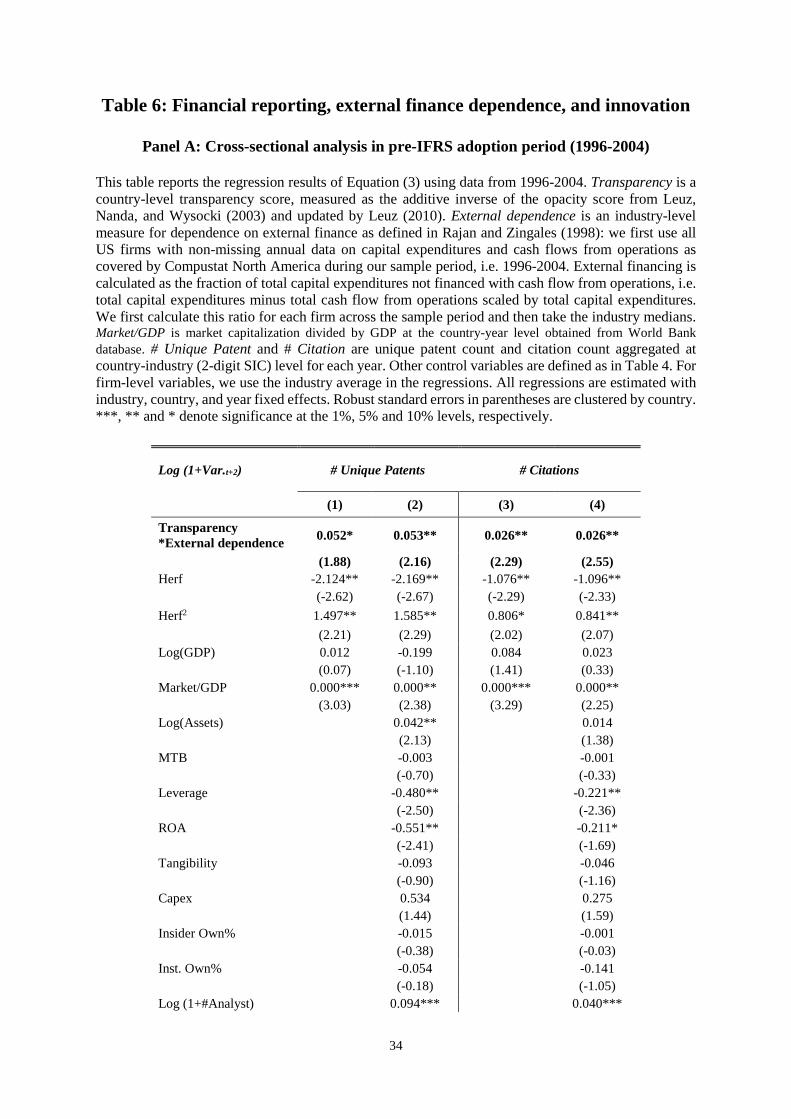
used to calculate the external financing dependence variable. The results are reported in Table
6, Panel A. Consistent with our prediction that transparency leads to higher innovation among
industries with high dependence on external finance, we find the coefficient on the interaction
term Transparencyk×External Dependencej is positive and significant in all models.
However, a potential concern with the above approach is that a country’s financial
reporting system rarely changes over time and a cross-sectional association may be subject to

19
an endogeneity concern. To address this concern, our second approach takes advantage of the
change in a country’s accounting standards, i.e. IFRS adoption, to mitigate this concern. If
mandatory IFRS adoption facilitates innovation through a firm’s ability to obtain external
finance, then firms which are more dependent on external finance should experience a
disproportionally higher increase in innovation following mandatory IFRS adoption. Similar
to above, we use data from US firms to measure dependence on external finance. Now we use
data from 1999-2009 to map our sample period of IFRS adoption analysis. We use the median
value of external financing for each industry across our sample period. Industries which fall
into the top 50% of the sample are classified as having high external financing dependence and
the bottom 50% are classified as having low external financing dependence. We then split our
sample into industries with high and low external financing dependence. We report the result
in Table 6, Panel B.
We find that the coefficients on Mandatory × Post_IFRS have a larger magnitude in
the subsample with high external finance dependence than those in the subsample with low
external finance dependence in all specifications. The differences in the coefficients across the
high and low subsamples are statistically significant in three out of four specifications. This
evidence supports our hypothesis that financial constraint is a channel through which
mandatory IFRS adoption motivates corporate innovation.
5. Feedback Channel
Another channel through which mandatory IFRS adoption could affect innovation is
managerial learning. Chen, Goldstein, and Jiang (2007) find that stock prices provide an
informational feedback effect and managers can learn from the information contained in stock
prices. Loureiro and Taboada (2015) find that mandatory IFRS adoption has increased
managers’ ability to learn from stock markets. In addition, uniformed financial reporting also
increases comparability across firms and allows managers to learn from their peers and make

20
better investment decisions. Thus, we expect that the feedback role of mandatory IFRS
adoption encourages innovation by stimulating managerial learning.
We measure managerial learning using the investment-to-price sensitivity. We first
replicate the analysis in Loureiro and Taboada (2015) in our sample of firms and find similar
results – IFRS adoption leads to a higher level of investment-to-price sensitivity. The results
are reported in Table A.1. If the managerial learning channel is able to explain our main
findings, we expect the effect of IFRS adoption on innovation to be stronger among industries
experiencing a larger improvement in managerial learning. To test this conjecture, we first need
to capture the effect of IFRS on managerial learning for each industry. We estimate the
following model for each industry (two-digit SIC) within each IFRS-adopting country:
Capexi,t/PPEi,t-1 = α + β1 Qi,t-1×Post_IFRS + β2 Qi,t-1 + β3 Log(Assetsi,t-1) + β4 Cashflowi,t/Assetsi,t-1 + Controls (3)
where Qi,t-1 is Tobin’s Q for firm i at year t-1, measured as market value of equity plus total
assets minus book value of equity scaled by total assets. Capexi,t/PPEi,t-1 is capital expenditures
scaled by lagged net PP&E for firm i at year t. Cashflowi,t/Assetsi,t-1 is net income plus
depreciation and amortization scaled by lagged total assets. Post_IFRS is defined as the same
as before. The coefficient estimate β1 thus captures the incremental investment-to-price
sensitivity after IFRS adoption, i.e. the extent to which managers learn from stock prices. We
require each industry to have at least 20 observations to estimate the coefficient. We identify
industries with β1 above the sample median as those experiencing greater improvement in
manager learning. We thus modify Equation (1) by adding an interaction term
Post_IFRS×Mandatory×Learn to capture the incremental IFRS adoption effect on innovation
among industries with improvement in managerial learning. If our conjecture is supported, we
expect to observe a positive and significant coefficient estimate. The results are reported in
Table 7. Consistent with the manager learning channel, we observe a positive coefficient on
Post_IFRS×Mandatory×Learn in most of the models.

21
6. Conclusion
In this paper, we examine the real effect of financial reporting. Using firm-level
innovation data for a large number of mandatory IFRS adopters from 24 countries as the
treatment and voluntary adopters from the same countries as well as non-adopters from 14 non-
IFRS adoption countries as two control groups, we document a positive effect of mandatory
IFRS adoption on corporate innovation. Our difference-in-differences results suggest that
financial reporting has positive real effects: firms that adopted IFRS become more innovative
in the long run – they generate more patents and patents with higher impact. We also establish
the financial constraint and feedback channels through which improvements in financial
reporting facilitate corporate innovation. Our paper complements the findings in Rajan and
Zingales (1998, 2003) and sheds new light on the real effects of financial reporting on economic
growth.

22
References
Acharya, V. V., and K. V. Subramanian. 2009. Bankruptcy Codes and Innovation. Review of Financial Studies 22: 4949-88.
Acs, Z. J., and D. B. Audretsch. 1988. Innovation in Large and Small Firms - an Empirical-Analysis. American Economic Review 78: 678-90.
Agarwal, V., R. Vashishtha, and M. Venkatachalam, 2016. Mutual Fund Transparency and Corporate Mypoia, Working Paper, Georgia State University.
Aghion, P., N. Bloom, R. Blundell, R. Griffith, and P. Howitt. 2005. Competition and innovation: An inverted-U relationship. Quarterly Journal of Economics 120: 701-28.
Aghion, P., J. Van Reenen, and L. Zingales. 2013. Innovation and Institutional Ownership. American Economic Review 103: 277-304.
Ashbaugh, H., and M. Pincus. 2001. Domestic Accounting Standards, International Accounting Standards, and the Predictability of Earnings. Journal of Accounting Research 39: 417-34.
Atanassov, J. 2013. Do Hostile Takeovers Stifle Innovation? Evidence from Antitakeover Legislation and Corporate Patenting. The Journal of Finance 68: 1097-131.
Ball, R., A. Robin, and J. S. Wu. 2003. Incentives versus standards: properties of accounting income in four East Asian countries. Journal of Accounting and Economics 36: 235-70.
Barry, C. B., and S. J. Brown. 1985. Differential Information and Security Market Equilibrium. Journal of Financial and Quantitative Analysis 20: 407-22.
Barth, M. E. 2007. Research, standard setting, and global financial reporting. Now Publishers Inc.
Bhojraj, S., and R. Libby. Captial market pressure, disclosure frequency-induced earnings/cash flow conflict, and managerial myopia. The Accounting Review 80: 1-20.
Bradshaw, M. T., B. J. Bushee, and G. S. Miller. 2004. Accounting Choice, Home Bias, and U.S. Investment in Non-U.S. Firms. Journal of Accounting Research 42: 795-841.
Brown, J. R., S. M. Fazzari, and B. C. Petersen. 2009. Financing Innovation and Growth: Cash Flow, External Equity, and the 1990s R&D Boom. Journal of Finance 64: 151-85.
Brown, J. R., G. Martinsson, and B. C. Petersen. 2012. Do financing constraints matter for R&D? European Economic Review 56: 1512-29.
Brown, J. R., G. Martinsson, and B. C. Petersen. 2013. Law, Stock Markets, and Innovation. Journal of Finance 68: 1517-49.
Burgstahler, D. C., L. Hail, and C. Leuz. 2006. The Importance of Reporting Incentives: Earnings Management in European Private and Public Firms. The Accounting Review 81: 983-1016.
Bushee, B. J. 1998. The Influence of Institutional Investors on Myopic R&D Investment Behavior. The Accounting Review 73: 305-33.
Byard, D., Y. Li, and Y. Yu. 2011. The Effect of Mandatory IFRS Adoption on Financial Analysts’ Information Environment. Journal of Accounting Research 49: 69-96.
Chan, K., V. Covrig, and L. Ng. 2005. What Determines the Domestic Bias and Foreign Bias? Evidence from Mutual Fund Equity Allocations Worldwide. Journal of Finance 60: 1495-534.

23
Chang, X., G. Hilary, J. Kang, and W. Zhang, 2016. Innovation, Managerial Myopia and Financial Reporting. Working Paper, Cambridge University.
Chen, L., J. Ng, and A. Tsang. 2014. The effect of mandatory IFRS adoption on international cross-listings. The Accounting Review forthcoming.
Chen, C., Young, D., and Zhuang, Z. 2014. Externalities of Mandatory IFRS Adoption: Evidence from Cross-Border Spillover Effects of Financial Information on Investment Efficiency. The Accounting Review 88: 881-914.
Chemmanur, T. J., E. Loutskina, and X. Tian. 2014. Corporate Venture Capital, Value Creation, and Innovation. Review of Financial Studies 27: 2434-73.
Christensen, H. B., L. Hail, and C. Leuz. 2013. Mandatory IFRS reporting and changes in enforcement. Journal of Accounting and Economics 56: 147-77.
Cornaggia, J., Y. Mao, X. Tian, and B. Wolfe. 2015. Does Banking Competition Affect Innovation? Journal of Financial Economics 115: 189-209.
Covrig, V. M., M. L. Defond, and M. Hung. 2007. Home Bias, Foreign Mutual Fund Holdings, and the Voluntary Adoption of International Accounting Standards. Journal of Accounting Research 45: 41-70.
Dai, L., R. Shen and B. Zhang, 2016. Does the Media Spotlight Burn or Spur Innovation? Working Paper, Australian National University.
Daske, H., L. Hail, C. Leuz, and R. Verdi. 2008. Mandatory IFRS Reporting around the World: Early Evidence on the Economic Consequences. Journal of Accounting Research 46: 1085-142.
———. 2013. Adopting a Label: Heterogeneity in the Economic Consequences Around IAS/IFRS Adoptions. Journal of Accounting Research 51: 495-547.
De Franco, G. U. S., S. P. Kothari, and R. S. Verdi. 2011. The Benefits of Financial Statement Comparability. Journal of Accounting Research 49: 895-931.
DeFond, M., X. Hu, M. Hung, and S. Li. 2011. The impact of mandatory IFRS adoption on foreign mutual fund ownership: The role of comparability. Journal of Accounting and Economics 51: 240-58.
Diamond, D. W., and R. E. Verrecchia. 1991. Disclosure, Liquidity, and the Cost of Capital. The Journal of Finance 46: 1325-59.
Djankov, S., R. La Porta, F. Lopez-de-Silanes, and A. Shleifer. 2008. The law and economics of self-dealing. Journal of Financial Economics 88: 430-65.
Fang, V., X. Tian, and S. Tice. 2014. Does Stock Liquidity Enhance or Impede Firm Innovation? Journal of Finance 69: 2085-2125.
Florou, A., and P. F. Pope. 2012. Mandatory IFRS Adoption and Institutional Investment Decisions. The Accounting Review 87: 1993-2025.
Goto, A., and K. Motohashi. 2007. Construction of a Japanese Patent Database and a first look at Japanese patenting activities. Research Policy 36: 1431-42.
Gupta, N., and K. Yuan. 2009. On the Growth Effect of Stock Market Liberalizations. Review of Financial Studies 22: 4715-52.
Hail, L., C. Leuz, and P. Wysocki. 2010a. Global Accounting Convergence and the Potential Adoption of IFRS by the U.S. (Part I): Conceptual Underpinnings and Economic Analysis. Accounting Horizons 24: 355-94.

24
———. 2010b. Global Accounting Convergence and the Potential Adoption of IFRS by the U.S. (Part II): Political Factors and Future Scenarios for U.S. Accounting Standards. Accounting Horizons 24: 567-88.
Hall, B. H., A. Jaffe, and M. Trajtenberg. 2001. The NBER Patent Citation Data File: Lessons, Insights and Methodological Tools. NBER Working Paper No. 8498.
———. 2005. Market value and patent citations. Rand Journal of Economics 36: 16-38. Holmstrom, B. 1989. Agency costs and innovation. Journal of Economic Behavior &
Organization 12: 305-27. He, J., and X. Tian. 2013. The dark side of analyst coverage: The case of innovation. Joural of
Financial Economics 109: 856-878. Hsu, P. H., X. Tian, and Y. Xu. 2014. Financial development and innovation: Cross-country
evidence. Journal of Financial Economics 112: 116-35. Kaufmann, D., A. Kraay, and M. Mastruzzi. 2009. Governance Matters VIII: Aggregate and
Individual Governance Indicators, 1996-2008. World Bank Policy Research Working Paper No. 4978.
Kedia, S., and T. Philippon. 2009. The economics of fraudulent accounting. Review of Financial Studies 22: 2169-2199.
Koh, P.-S., and D. Reeb. 2015. Missing R&D. Journal of Accounting & Economics 60 (1): 73-94.
Kothari, S. P. 2001. Capital markets research in accounting. Journal of Accounting and Economics 31: 105-231.
La Porta, R., F. Lopez-De-Silanes, and A. Shleifer. 2006. What Works in Securities Laws? The Journal of Finance 61: 1-32.
Lambert, R., C. Leuz, and R. E. Verrecchia. 2007. Accounting Information, Disclosure, and the Cost of Capital. Journal of Accounting Research 45: 385-420.
Leuz, C. 2010. Different approaches to corporate reporting regulation: How jurisdictions differ and why. Accounting and Business Research 40: 229-256.
Leuz, C., D. Nanda, and P. Wysocki. 2003. Earnings management and investor protection: an international comparison. Journal of Financial Economics 69: 505-527.
Li, S. 2010. Does Mandatory Adoption of International Financial Reporting Standards in the European Union Reduce the Cost of Equity Capital? The Accounting Review 85: 607-36.
Loureiro, G., and A. Taboada. Do improvements in the information environment enhance insiders’ ability to learn from outsiders? Journal of Accounting Research 53: 863-905.
Manso, G. 2011. Motivating Innovation. Journal of Finance 66: 1823-60. Nanda, R., and M. Rhodes-Kropf. 2013. Investment cycles and startup innovation. Journal of
Financial Economics 110: 403-18. Rajan, R. G., and L. Zingales. 1998. Financial dependence and growth. American Economic
Review 88: 559-86. Rajan, R. G., and L. Zingales. 2003. The great reversals: the politics of financial development
in the twentieth century. Journal of Financial Economics 69: 5-50. Rosenberg, N. 2004. Innovation and Economic Growth. OECD. Seru, A. 2014Firm Boundaries Matter: Evidence from Conglomerates and R&D Activity.
Journal of Financial Economics 111: 381-405.

25
Schleicher, T., Tahoun, A., and Walker, M. 2010. IFRS adoption in Europe and investment-cash flow sensitivity: outsider versus insider economies. The International Journal of Accounting 45: 143-168.
Shroff, N., Verdi, R., and Yu, G. 2014. Information environment and the investment decisions
of multinational corporations. The Accounting Review, 89(2): 759-790. Soderstrom, N. S., and K. J. Sun. 2007. IFRS Adoption and Accounting Quality: A Review.
European Accounting Review 16: 675-702. Solow, R. M. 1957. Technical Change and the Aggregate Production Function. Review of
Economics and Statistics 39: 312-20. Stein, J. 1989. Efficient capital markets, inefficient firms: A model of myopic corporate
behaviour. The Quarterly Journal of Economics 104: 655-669. Tian, X., and T. Y. Wang. 2014. Tolerance for Failure and Corporate Innovation. Review of
Financial Studies 27: 211-55. Webb, C., H. Dernis, D. Harhoff, and K. Hoisl. 2005. Analysing European and International
Patent Citations: A Set of EPO Patent Database Building Blocks. OECD Science, Technology and Industry Working Papers.
Yip, R. W. Y., and D. Young. 2012. Does Mandatory IFRS Adoption Improve Information Comparability? The Accounting Review 87: 1767-89.
26
Table 1: Sample distribution by country
This table reports sample composition by country. IFRS countries include those mandated IFRS adoption during our sample period, i.e. 2001-2009. Non-IFRS countries include those did not mandate IFRS adoption during our sample period. Mandatory adopters are firms that are domiciled in IFRS countries and first adopted IFRS at their country’s mandatory adoption date. Voluntary adopters are firms that are domiciled in IFRS countries and adopted IFRS earlier than their country’s mandatory adoption date. Non-adopters are firms that are domiciled in non-IFRS countries and did not adopt IFRS during our sample period.
Mandatory adopters Voluntary adopters Non-adopters
Country Adoption Date # Obs # Unique
firms # Obs # Unique firms Country # Obs # Unique
firms IFRS countries Non-IFRS countries AUSTRALIA 12/31/2005 6,119 914 61 13 BRAZIL 1,288 253 AUSTRIA 12/31/2005 23 3 198 27 CANADA 11,513 2,402 BELGIUM 12/31/2005 338 44 140 23 CHINA 10,943 1,724 CZECH REPUBLIC 12/31/2005 37 6 19 3 COLOMBIA 164 33 DENMARK 12/31/2005 476 59 119 18 INDIA 9,427 2,315 FINLAND 12/31/2005 759 91 50 8 INDONESIA 1,851 327 FRANCE 12/31/2005 2,688 333 310 42 JAPAN 29,232 4,218 GERMANY 12/31/2005 812 103 1,568 223 KOREA, SOUTH 9,542 1,896 GREECE 12/31/2005 1,561 224 74 15 MALAYSIA 6,052 916 HUNGARY 12/31/2005 45 6 79 10 MEXICO 726 125 ISRAEL 12/31/2008 765 174 177 42 RUSSIA 896 268 ITALY 12/31/2005 87 11 1,020 126 SAUDI ARABIA 423 88 NETHERLANDS 12/31/2005 628 77 58 9 THAILAND 2,687 418 NEW ZEALAND 12/31/2007 293 46 111 29 UNITED STATES 34,530 5,757 NORWAY 12/31/2005 736 102 19 3 POLAND 12/31/2005 564 80 122 21 PORTUGAL 12/31/2005 259 33 25 4 SLOVENIA 12/31/2005 59 7 63 10 SOUTH AFRICA 12/31/2005 1,037 132 74 16 SPAIN 12/31/2005 588 73 0 0 SWEDEN 12/31/2005 1,537 194 33 7 SWITZERLAND 12/31/2005 222 26 672 88

27
TURKEY 12/31/2008 142 24 727 161 UNITED KINGDOM 12/31/2005 3,497 455 93 18 Total 23,272 3,217 5,812 916 Total 119,274 20,740

28
Table 2: Sample distribution by year
This table reports sample composition by calendar year. IFRS countries include those mandated IFRS adoption during our sample period, i.e. 2001-2009. Non-IFRS countries include those did not mandate IFRS adoption during our sample period. Mandatory adopters are firms that are domiciled in IFRS countries and first adopted IFRS at their country’s mandatory adoption date. Voluntary adopters are firms that are domiciled in IFRS countries and adopted IFRS earlier than their country’s mandatory adoption date. Non-adopters are firms that are domiciled in non-IFRS countries and did not adopt IFRS during our sample period.
Mandatory adopters from IFRS countries
Non-adopters from non-IFRS countries
Voluntary adopters from IFRS countries
Year # Obs # Obs # Obs 2001 1,919 10,256 370
2002 2,258 11,434 440
2003 2,520 11,764 499
2004 2,716 12,236 634
2005 2,999 13,468 743
2006 2,930 14,748 790
2007 2,813 15,374 813
2008 2,644 15,446 776
2009 2,473 14,548 747
Total 23,272 119,274 5,812

29
Table 3: Summary statistics of regression variables
This table reports summary statistics of regressions variables. IFRS countries include those mandated IFRS adoption during our sample period, i.e. 2001-2009. Non-IFRS countries include those did not mandate IFRS adoption during our sample period. Mandatory adopters are firms that are domiciled in IFRS countries and first adopted IFRS at their country’s mandatory adoption date. Voluntary adopters are firms that are domiciled in IFRS countries and adopted IFRS earlier than their country’s mandatory adoption date. Non-adopters are firms that are domiciled in non-IFRS countries and did not adopt IFRS during our sample period. # Unique Patent and # Citation are unique patent count and citation count computed based on data from the Orbis database. Assets is total assets, converted into US dollars using fiscal year exchange rate. MTB is market value of equity at the fiscal year end divided by book value of equity. Leverage is total debt (short-term and long-term) to total assets. ROA is earnings before interest and taxes divided by total assets. Tangibility is net property, plant, and equity scaled by total assets. Capex is capital expenditure scaled by total assets. Insider Own% is the percentage of outstanding shares owned by insiders. Inst. Own% is the percentage of outstanding shares owned by institutional investors. # Analysts is the number of financial analysts following the firm. Herf is Herfindahl-Hirschman index.
Mandatory adopters from IFRS countries Non-adopters from non-IFRS countries Voluntary adopters from IFRS countries
Variable # Obs Mean Median Std Dev # Obs Mean Median Std Dev # Obs Mean Median Std Dev
# Unique Patent 23,272 0.315 0.000 2.698 119,274 6.397 0.000 84.501 5,812 1.975 0.000 12.381 # Citation 23,272 0.029 0.000 0.659 119,274 1.855 0.000 33.618 5,812 0.244 0.000 2.461 Assets ($billion) 23,272 0.609 0.106 1.949 119,274 0.981 0.145 2.984 5,812 1.250 0.229 2.634 MTB 23,272 2.577 1.627 3.632 119,274 2.785 1.453 4.796 5,812 2.191 1.499 2.418 Leverage 23,272 0.195 0.170 0.175 119,274 0.208 0.176 0.188 5,812 0.209 0.195 0.166 ROA 23,272 0.003 0.052 0.231 119,274 0.006 0.046 0.216 5,812 0.032 0.050 0.145 Tangibility 23,272 0.276 0.217 0.237 119,274 0.316 0.278 0.231 5,812 0.254 0.207 0.210 Capex 23,272 0.060 0.034 0.077 119,274 0.058 0.032 0.075 5,812 0.049 0.033 0.057 Insider Own% 23,272 0.335 0.309 0.291 119,274 0.258 0.190 0.268 5,812 0.393 0.436 0.305 Inst. Own% 23,272 0.087 0.022 0.126 119,274 0.158 0.010 0.279 5,812 0.091 0.048 0.110 # Analyst 23,272 2.432 1.000 3.770 119,274 2.308 0.000 4.195 5,812 3.889 1.000 5.284 Herf 23,272 0.359 0.292 0.242 119,274 0.128 0.072 0.163 5,812 0.384 0.311 0.260

30
Table 4: Difference-in-differences results on innovation
This table reports the regression results of Equation (1) using mandatory adopters from IFRS countries as the treatment and three different control groups. IFRS countries include those mandated IFRS adoption during our sample period, i.e. 2001-2009. Non-IFRS countries include those did not mandate IFRS adoption during our sample period. Mandatory adopters are firms that are domiciled in IFRS countries and first adopted IFRS at their country’s mandatory adoption date. Voluntary adopters are firms that are domiciled in IFRS countries and adopted IFRS earlier than their country’s mandatory adoption date. Non-adopters are firms that are domiciled in non-IFRS countries and did not adopt IFRS during our sample period. Mandatory is a binary variable with a value of one for mandatory adopters and zero otherwise. Post_IFRS is a binary variable with a value of one for fiscal years ending in or after the country’s mandatory adoption date and zero for fiscal years ending before the country’s mandatory adoption date. It is set as zero for all non-adopters domiciled in non-IFRS countries. # Unique Patent and # Citation are unique patent count and citation count computed based on data from the Orbis database. Assets is total assets, converted into US dollars using fiscal year exchange rate. MTB is market value of equity at the fiscal year end divided by book value of equity. Leverage is total debt (short-term and long-term) to total assets. ROA is earnings before interest and taxes divided by total assets. Tangibility is net property, plant, and equity scaled by total assets. Capex is capital expenditure scaled by total assets. Insider Own% is the percentage of outstanding shares owned by insiders. Inst. Own% is the percentage of outstanding shares owned by institutional investors. # Analysts is the number of financial analysts following the firm. Herf is Herfindahl-Hirschman index. Herf2 is the squared term of Herf. Log(GDP) is the logarithm of GDP per capita in 2005 US dollars. Market/GDP is total stock market capitalization scaled by total GDP. All regressions are estimated with firm and year fixed effects. Standard errors are clustered by country. ***, ** and * denote significance at the 1%, 5% and 10% levels, respectively.

31
Benchmark All non-adopters from non-IFRS countries
All non-adopters from non-IFRS countries ex. US
Voluntary adopters from IFRS countries
Log (1+Dep. Var.) # Unique Patent # Citation # Unique
Patent # Citation # Unique Patent # Citation
(1) (2) (3) (4) (5) (6) Post_IFRS*Mandatory 0.087*** 0.085*** 0.097** 0.036*** 0.033*** 0.015*** (2.91) (3.12) (2.25) (3.16) (5.51) (3.56) Post_IFRS -0.016 -0.007* (-1.56) (-2.01) Log(Assets) 0.035*** 0.022** 0.030*** 0.006** 0.011** 0.002 (4.70) (2.23) (3.21) (2.71) (2.27) (1.69) MTB 0.000 0.001 -0.002** -0.000 0.000 0.000 (0.06) (0.99) (-2.13) (-0.78) (0.57) (0.27) Leverage -0.031 -0.051** -0.008 -0.019 -0.031* -0.001 (-0.76) (-2.13) (-0.25) (-1.18) (-1.79) (-0.17) ROA -0.002 -0.019 -0.007 0.002 0.013 0.005 (-0.21) (-1.49) (-0.33) (0.74) (0.86) (1.07) Tangibility 0.016 0.012 0.004 0.003 0.001 0.003 (0.63) (0.73) (0.16) (0.34) (0.05) (0.51) Capex -0.039 0.016 -0.056 -0.009 0.030 0.008 (-0.65) (0.63) (-0.95) (-0.57) (1.04) (1.64) Insider Own% 0.033 0.024** 0.035 0.012 0.015 0.006* (1.33) (2.61) (1.11) (1.25) (1.26) (1.81) Inst. Own% -0.057 -0.118** -0.366 -0.093 0.000 -0.004 (-0.59) (-2.05) (-1.18) (-0.75) (0.02) (-0.34) Log (1+#Analyst) 0.001 -0.005 0.001 -0.003 -0.009 0.001 (0.05) (-0.75) (0.07) (-0.64) (-1.69) (0.80) Herf 0.125 0.112* 0.066 0.054** -0.020 0.001 (1.49) (1.81) (0.99) (2.06) (-0.36) (0.05)
Herf2 -0.089 -0.091* -0.039 -0.042* 0.013 -0.001
(-1.21) (-1.76) (-0.64) (-1.99) (0.29) (-0.07) Log(GDP) 0.685*** 0.284*** 0.693*** 0.161*** 0.048 0.049 (4.25) (3.31) (3.95) (3.87) (0.45) (1.64) Market/GDP -0.000 0.000 -0.000 -0.000 0.000** 0.000 (-1.00) (0.77) (-1.15) (-1.57) (2.49) (1.19) Fixed effects Year; Firm Year; Firm Year; Firm N 142,546 142,546 108,016 108,016 29,084 29,084
Adj. R-squared 80.0% 75.1% 74.2% 61.5% 73.9% 49.6%

32
Table 5: Results of dynamic model
This table reports the regression results of Equation (2) using mandatory adopters from IFRS countries as the treatment and three different control groups. IFRS countries include those mandated IFRS adoption during our sample period, i.e. 2001-2009. Non-IFRS countries include those did not mandate IFRS adoption during our sample period. Mandatory adopters are firms that are domiciled in IFRS countries and first adopted IFRS at their country’s mandatory adoption date. Voluntary adopters are firms that are domiciled in IFRS countries and adopted IFRS earlier than their country’s mandatory adoption date. Non-adopters are firms that are domiciled in non-IFRS countries and did not adopt IFRS during our sample period. Mandatory is a binary variable with a value of one for mandatory adopters and zero otherwise. Pre_IFRSt-2,t-1 is defined as one for observations from the IFRS countries and with fiscal year ends between years t – 2 (>=Month -24) and t – 1 (<Month 0). Post_IFRSt,t+1 is defined as one for observations from the IFRS countries and with fiscal year ends between year t (>=Month 0) and year t+1 (<Month +24). Post_IFRS>=t+2 is defined as one for observations from the IFRS countries and with fiscal year ends in or after year t+2 (>= Month 24). Month 0 is defined as the calendar month of the mandatory adoption date. The above variables are set as zero for all non-adopters domiciled in non-IFRS countries. # Unique Patent and # Citation are unique patent count and citation count computed based on data from the Orbis database. All control variables are the same as in Table 4. All regressions are estimated with firm and year fixed effects. Robust standard errors in parentheses are clustered by country. ***, ** and * denote significance at the 1%, 5% and 10% levels, respectively.
Benchmark All non-adopters from non-IFRS countries
All non-adopters from non-IFRS countries ex.
US
Voluntary adopters from IFRS countries
Log (1+Dep. Var.) # Unique Patent # Citation # Unique
Patent # Citation # Unique Patent # Citation
(1) (2) (3) (4) (5) (6)
Pre_IFRSt-2, t-1 -0.004 0.001 (-0.48) (0.26) Post_IFRSt, t+1 -0.010 -0.002 (-0.71) (-0.38) Post_IFRS>=t+2 -0.071*** -0.015*
(-3.77) (-1.80) Pre_IFRSt-2, t-1*Mandatory 0.012 0.029 0.006 -0.001 0.005 0.003 (0.56) (1.33) (0.19) (-0.10) (0.45) (0.66) Post_IFRSt, t+1*Mandatory 0.069** 0.080*** 0.072 0.027** 0.014* 0.012** (2.28) (2.74) (1.49) (2.46) (1.90) (2.49) Post_IFRS>=t+2*Mandatory 0.125*** 0.128*** 0.140** 0.046*** 0.064*** 0.024*** (3.02) (2.78) (2.14) (2.75) (4.56) (2.95) F-test [p-value]:
Post_IFRSt, t+1*Mandatory
=Pre_IFRSt-2, t-1*Mandatory [0.02] [0.00] [0.03] [0.01] [0.30] [0.01]
Post_IFRSt,t+1*Mandatory
=Post_IFRS>=t+2*Mandatory [0.02] [0.01] [0.02] [0.03] [0.00] [0.01]
Post_IFRS>=t+2*Mandatory
=Pre_IFRSt-2,t-1*Mandatory [0.01] [0.00] [0.01] [0.01] [0.00] [0.00]
All controls included All controls included All controls included
Fixed effects Year; Firm Year; Firm Year; Firm

33
N 142,546 142,546 108,016 108,016 29,084 29,084 Adj. R-squared 80.0% 75.1% 74.2% 61.5% 73.9% 49.6%
34
Table 6: Financial reporting, external finance dependence, and innovation
Panel A: Cross-sectional analysis in pre-IFRS adoption period (1996-2004)
This table reports the regression results of Equation (3) using data from 1996-2004. Transparency is a country-level transparency score, measured as the additive inverse of the opacity score from Leuz, Nanda, and Wysocki (2003) and updated by Leuz (2010). External dependence is an industry-level measure for dependence on external finance as defined in Rajan and Zingales (1998): we first use all US firms with non-missing annual data on capital expenditures and cash flows from operations as covered by Compustat North America during our sample period, i.e. 1996-2004. External financing is calculated as the fraction of total capital expenditures not financed with cash flow from operations, i.e. total capital expenditures minus total cash flow from operations scaled by total capital expenditures. We first calculate this ratio for each firm across the sample period and then take the industry medians. Market/GDP is market capitalization divided by GDP at the country-year level obtained from World Bank database. # Unique Patent and # Citation are unique patent count and citation count aggregated at country-industry (2-digit SIC) level for each year. Other control variables are defined as in Table 4. For firm-level variables, we use the industry average in the regressions. All regressions are estimated with industry, country, and year fixed effects. Robust standard errors in parentheses are clustered by country. ***, ** and * denote significance at the 1%, 5% and 10% levels, respectively.
Log (1+Var.t+2) # Unique Patents # Citations
(1) (2) (3) (4)
Transparency *External dependence 0.052* 0.053** 0.026** 0.026**
(1.88) (2.16) (2.29) (2.55) Herf -2.124** -2.169** -1.076** -1.096**
(-2.62) (-2.67) (-2.29) (-2.33)
Herf2 1.497** 1.585** 0.806* 0.841**
(2.21) (2.29) (2.02) (2.07) Log(GDP) 0.012 -0.199 0.084 0.023
(0.07) (-1.10) (1.41) (0.33) Market/GDP 0.000*** 0.000** 0.000*** 0.000**
(3.03) (2.38) (3.29) (2.25) Log(Assets) 0.042** 0.014
(2.13) (1.38) MTB -0.003 -0.001
(-0.70) (-0.33) Leverage -0.480** -0.221**
(-2.50) (-2.36) ROA -0.551** -0.211*
(-2.41) (-1.69) Tangibility -0.093 -0.046
(-0.90) (-1.16) Capex 0.534 0.275
(1.44) (1.59) Insider Own% -0.015 -0.001
(-0.38) (-0.03) Inst. Own% -0.054 -0.141
(-0.18) (-1.05) Log (1+#Analyst) 0.094*** 0.040***

35
(3.79) (2.91)
Fixed effects Year; Industry; Country Year; Industry; Country N 10,215 10,215 10,215 10,215
Adj. R-squared 43.6% 44.7% 33.9% 34.6%

36
Panel B: Subsample analysis on IFRS adoption effect (1999-2009)
This table reports the regression results of Equation (1) using subsamples of firms operating in industries (2-digit SIC) with high and low external financing dependence. We follow a similar methodology in Rajan and Zingales (1998) to identify industries’ external financing dependence: we first use all US firms with non-missing annual data on capital expenditures and cash flows from operations as covered by Compustat North America during our sample period, i.e. 2001-2009. External financing is calculated as the fraction of total capital expenditures not financed with cash flow from operations, i.e. total capital expenditures minus total cash flow from operations scaled by total capital expenditures. We first calculate this ratio for each firm across the sample period and then take the industry medians. Industries fall into the top 50% of the entire sample are classified as having high external financing dependence and the bottom 50% are classified as having low external financing dependence. IFRS countries include those mandated IFRS adoption during our sample period, i.e. 2001-2009. Non-IFRS countries include those did not mandate IFRS adoption during our sample period. Mandatory adopters are firms that are domiciled in IFRS countries and first adopted IFRS at their country’s mandatory adoption date. Voluntary adopters are firms that are domiciled in IFRS countries and adopted IFRS earlier than their country’s mandatory adoption date. Non-adopters are firms that are domiciled in non-IFRS countries and did not adopt IFRS during our sample period. Mandatory is a binary variable with a value of one for mandatory adopters and zero otherwise. Post_IFRS is a binary variable with a value of one for fiscal years ending in or after the country’s mandatory adoption date and zero for fiscal years ending before the country’s mandatory adoption date. It is set as zero for all non-adopters domiciled in non-IFRS countries. # Unique Patent and # Citation are unique patent count and citation count computed based on data from the Orbis database. All control variables are the same as in Table 4. All regressions are estimated with firm and year fixed effects. Robust standard errors in parentheses are clustered by country. ***, ** and * denote significance at the 1%, 5% and 10% levels, respectively.
Benchmark All non-adopters from non-IFRS countries ex. US Voluntary adopters from IFRS countries
Log (1+Dep. Var.) # Unique Patents # Citations # Unique Patents # Citations High Low High Low High Low High Low Post_IFRS*Mandatory 0.123** 0.059** 0.048*** 0.018** 0.052*** -0.016 0.019*** 0.006 (2.14) (2.14) (3.27) (2.48) (5.03) (-0.94) (3.07) (1.05) Post_IFRS -0.028* 0.014 -0.009* -0.002 (-1.94) (1.05) (-1.96) (-0.42) Test difference: High vs. Low [p-value] Post_IFRS*Mandatory [0.04] [0.00] [0.00] [0.12] Fixed effects Year; Firm Year; Firm Year; Firm Year; Firm
All controls included All controls included N 67,215 40,784 67,215 40,784 18,833 10,251 18,833 10,251 Adj. R-squared 75.3% 70.1% 62.3% 57.5% 75.6% 69.8% 51.0% 47.6%

37
Table 7: Financial reporting, manager learning, and innovation
This table reports the regression results of Equation (1) by adding an additional interaction term Post_IFRS*Mandatory*Learn. Learn is an indicator variable defined as one for industries with equal to or above median value of manager learning, and zero otherwise. Manager learning is captured using β1 coefficient in Equation (4) for each two-digit SIC industry within each IFRS-adopting countries. Firm-level data from 2001-2009 are used for this estimation. We require each country-industry to have at least 20 observations to estimate Equation (4). Mandatory is a binary variable with a value of one for mandatory adopters and zero otherwise. Post_IFRS is a binary variable with a value of one for fiscal years ending in or after the country’s mandatory adoption date and zero for fiscal years ending before the country’s mandatory adoption date. It is set as zero for all non-adopters domiciled in non-IFRS countries. # Unique Patent and # Citation are unique patent count and citation count computed based on data from the Orbis database. All control variables are the same as in Table 4. All regressions are estimated with firm and year fixed effects. Robust standard errors in parentheses are clustered by country. ***, ** and * denote significance at the 1%, 5% and 10% levels, respectively.
Benchmark No benchmark: mandatory adopters only
All non-adopters from non-IFRS countries
Voluntary adopters from IFRS countries
Log (1+Dep. Var.) # Unique Patent # Citation # Unique
Patent # Citation # Unique Patent # Citation
(1) (2) (3) (4) (5) (6) Post_IFRS*Mandatory 0.000 0.002 0.085*** 0.086*** 0.028*** 0.014***
(0.04) (0.86) (2.81) (2.94) (3.82) (2.91) Post_IFRS*Mandatory*Learn 0.018** 0.003*** 0.015*** 0.003 0.017*** 0.003
(2.84) (2.94) (2.76) (0.40) (2.84) (1.38) Post_IFRS -0.006 -0.004
(-0.47) (-0.86) Test: Post_IFRS*Mandatory+Post_IFRS*Mandatory*Learn=0
p-value [0.06] [0.03] [0.00] [0.00] [0.00] [0.00]
Fixed effects Year; Firm Year; Firm Year; Firm N 13,391 13,391 132,665 132,665 19,203 19,203
Adj. R-squared 68.5% 38.5% 80.2% 75.3% 77.9% 52.1%

38
Table A.1.: Effect of IFRS adoption on manager learning
This table reports the results of IFRS adoption on investment-price sensitivity, our measure for manager learning. Q is Tobin’s Q, measured as market value of equity plus total assets minus book value of equity scaled by total assets. Cashflow/Assets is net income plus depreciation and amortization scaled by lagged total assets. Capex/PPE is capital expenditures scaled by lagged net PP&E. Mandatory is a binary variable with a value of one for mandatory adopters and zero otherwise. Post_IFRS is a binary variable with a value of one for fiscal years ending in or after the country’s mandatory adoption date and zero for fiscal years ending before the country’s mandatory adoption date. It is set as zero for all non-adopters domiciled in non-IFRS countries. In Column (1), the sample includes firms from IFRS and non-IFRS adoption countries. In Column (2), the sample includes firms from IFRS countries and voluntary adopters are used as the control group. In Column (3), the sample includes only mandatory adopters from IFRS countries. The sample period is 2001-2009. All regressions are estimated with firm and year fixed effects. Standard errors are clustered by country. ***, ** and * denote significance at the 1%, 5% and 10% levels, respectively.
Dep. Var.: Capext/PPEt-1
Benchmark All non-adopters from non-IFRS
countries
Voluntary adopters from
IFRS countries
No benchmark: mandatory
adopters only
(1) (2) (3)
Qt-1*Post_IFRS*Mandatory 0.032** 0.116*** 0.068*** (2.57) (4.06) (3.13)
Qt-1*Post_IFRS -0.072*** (-3.67) Post_IFRS*Mandatory 0.014 -0.044 -0.135*
(0.50) (-0.94) (-2.04)
Qt-1 0.064*** 0.125*** 0.115***
(4.58) (7.69) (6.52)
Log(Assetst-1) -0.156*** -0.275*** -0.326***
(-4.49) (-7.54) (-8.22)
Cashflowt/Assetst-1 0.031 0.204 0.188
(0.43) (1.29) (1.02)
Fixed effects Year; Firm Year; Firm Year; Firm N 129,242 27,255 21,714
Adj. R-squared 36.7% 33.8% 33.8%