Embed Size (px)
Citation preview
Journal of Great Lakes Research 38 (2012) 6–13
Contents lists available at SciVerse ScienceDirect
Journal of Great Lakes Research
j ourna l homepage: www.e lsev ie r .com/ locate / jg l r
Review
The rapid eutrophication of Lake Winnipeg: Greening under global change
David W. Schindler a,⁎, Robert E. Hecky b,1, Gregory K. McCullough c,2
a Department of Biological Sciences, University of Alberta, Edmonton, AB, Canada T6G 2E9b Large Lakes Observatory, University of Minnesota Duluth, 2205 E 5th Street, Duluth, MN 55812, USAc Centre for Earth Observations Science, Department of Environment and Geography, 482 Wallace Building, University of Manitoba, Winnipeg, Canada R3T 2N2
⁎ Corresponding author. Tel.: +1 780 492 1291.E-mail addresses: [email protected] (D.W. Sch
(R.E. Hecky), [email protected] (G.K. McCullough1 Tel.: +1 218 726 9726.2 Tel.: +1 204 474 9980.
0380-1330/$ – see front matter © 2012 International Adoi:10.1016/j.jglr.2012.04.003
a b s t r a c t
a r t i c l e i n f oArticle history:Received 12 January 2012Accepted 23 April 2012Available online 19 May 2012
Communicated by Ram Yerubandi
Keywords:Climate changeFloodingPhosphorusAgricultureCyanobacteria blooms
Nuisance blooms of heterocystous Cyanobacteria in Lake Winnipeg have nearly doubled in size since the mid1990s. The increases are the result of a recent rapid increase in loading and concentration of phosphorus. Therapid increase in phosphorus is largely the result of two factors. The first factor is the result of rapidly in-creased livestock production and use of synthetic fertilizer in the Red River Valley, with smaller contributionsof phosphorus from the city of Winnipeg and other human development in the Red and Winnipeg river ba-sins. The second factor is the increased frequency and intensity of spring floods in the Red River watershed inrecent years, which have greatly enhanced the transfer of phosphorus from the landscape to the lake, as wellas slower increases in nitrogen. Because the low ratio of nitrogen to phosphorus in the increased inputs fa-vors nitrogen fixing species of Cyanobacteria, these nuisance forms account for most of the increase in phy-toplankton. Recovery of the lake will require reducing both agricultural and major urban sources ofphosphorus and, if possible, the frequency and intensity of flooding in the Red River watershed. Floodingwill be increasingly difficult to control if modeled predictions for increased precipitation under climatewarming materialize. Even with targeted reductions in phosphorus inputs of 50% and measures to controlflooding, recovery of the lake is expected to be slow because of phosphorus recycled from sediments andthe climatic sensitivity of this shallow lake and the flooding of the Red River.
© 2012 International Association for Great Lakes Research. Published by Elsevier B.V. All rights reserved.
Contents
Introduction . . . . . . . . . . . . . . . . . . . . . . . . . . . . . . . . . . . . . . . . . . . . . . . . . . . . . . . . . . . . . . . . . 6Changes to the watershed of Lake Winnipeg . . . . . . . . . . . . . . . . . . . . . . . . . . . . . . . . . . . . . . . . . . . . . . . . . . 7Increasing nutrient sources . . . . . . . . . . . . . . . . . . . . . . . . . . . . . . . . . . . . . . . . . . . . . . . . . . . . . . . . . . 8Climate change and basin modification as amplifiers of nutrient loading . . . . . . . . . . . . . . . . . . . . . . . . . . . . . . . . . . . . . 9Nutrients to control: phosphorus and/or nitrogen? . . . . . . . . . . . . . . . . . . . . . . . . . . . . . . . . . . . . . . . . . . . . . . . 10Looking ahead . . . . . . . . . . . . . . . . . . . . . . . . . . . . . . . . . . . . . . . . . . . . . . . . . . . . . . . . . . . . . . . . 11Acknowledgments . . . . . . . . . . . . . . . . . . . . . . . . . . . . . . . . . . . . . . . . . . . . . . . . . . . . . . . . . . . . . . 12References . . . . . . . . . . . . . . . . . . . . . . . . . . . . . . . . . . . . . . . . . . . . . . . . . . . . . . . . . . . . . . . . . . 12
Introduction
Between 1990 and 2000 the phosphorus concentration of LakeWinnipeg doubled (McCullough et al., 2012) and algal blooms, dom-inated by nitrogen fixing Cyanobacteria, proliferated (Kling et al.,
indler), [email protected]).
ssociation for Great Lakes Research.
2011). Although much of the lake's catchment had been convertedto agriculture and the human population had been slowly increasingover the previous century, the rapid eutrophication late in the 20thcentury was unforeseen, and how to reverse it is controversial. In re-cent years, several other great lakes such as tropical Lake Victoria(Hecky et al., 2010) and lakes Huron and Michigan (Evans et al.,2011) have also undergone rapid, unpredicted changes in trophiccondition, as a result of changing inputs of nutrients and invasive spe-cies, causing concern for their long term sustainable use. Significantchanges in nutrient concentrations in these large lakes have occurredin less than a decade, clearly illustrating that lake size alone provideslittle protection to lake condition. Such rapid changes challenge
Published by Elsevier B.V. All rights reserved.
7D.W. Schindler et al. / Journal of Great Lakes Research 38 (2012) 6–13
aquatic science for explanation. The papers in this volume, many gen-erated throughmajor federal and provincial studies that responded topublic concern about the future of Lake Winnipeg, illustrate manychanges to the lake following the rapid eutrophication since theearly 1990s. Here, we synthesize the findings of some of these studiesand other recent research to assess the relative contributions of sew-age, land use change and climatic variability to the rapid eutrophica-tion, and to identify possible actions that might reverse the recenteutrophication of Lake Winnipeg.
When one of us (DWS) first studied LakeWinnipeg in 1969 as partof a team of scientists from the now defunct Fisheries Research Boardof Canada (FRBC), the lake was already moderately eutrophic, (sum-marized by Brunskill, 1973; and in unpublished data reports), andbiologically altered from the initial observations on the lake in the1920s (Bajkov, 1934; Patalas and Salki, 1992). At the time, we de-duced that the Red River watershed was yielding more nutrientsthan it had under pristine conditions, because most of the basin hadbeen transformed from long grass prairie to agricultural land withinthe 20th century, but it was not clear how much the nutrient inputhad increased over natural background.
Unfortunately, following the demise of the FRBC in the 1970sand despite the construction in 1977 of a control structure whichcontrols the lake level and the outflow of the lake for hydroelectricpurposes, little research attention was paid to Lake Winnipeg(Fig. 1; McCullough et al., 2012), resulting in a long hiatus in realtime observation. When surveys were resumed in the early 1990s,it first appeared that the lake had changed very little in the inter-vening two decades. However, rapid increases in nutrient inputs
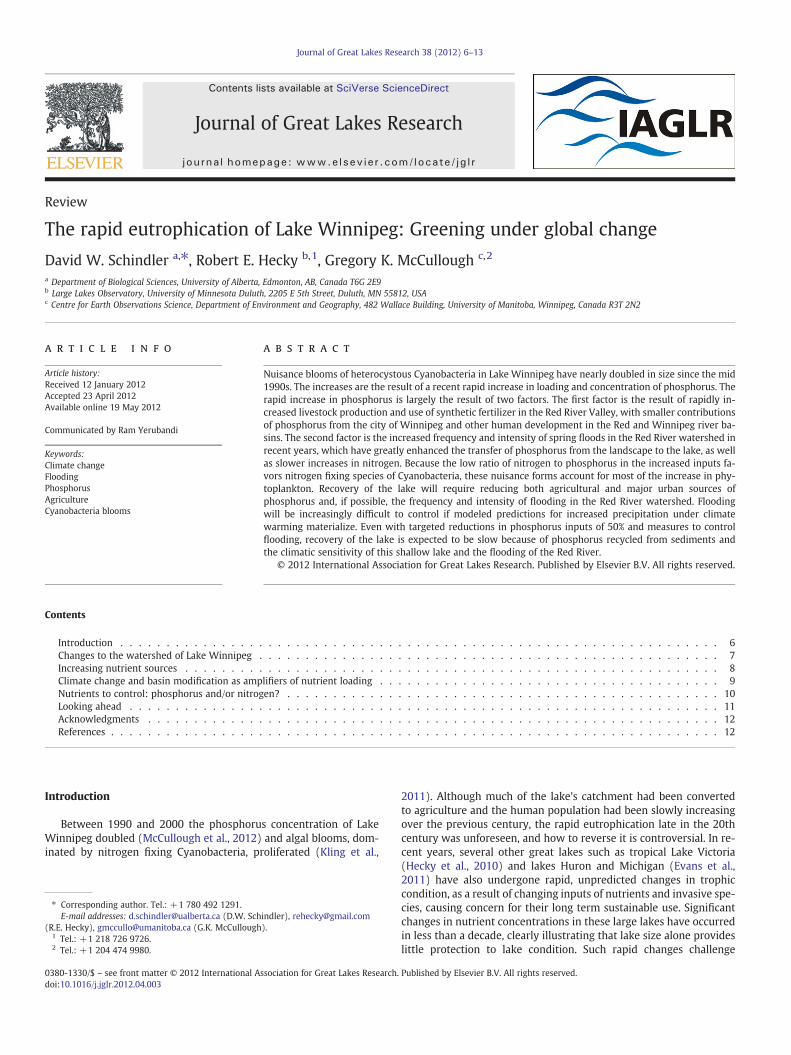
Fig. 1. A map of Lake Winnipeg showing major watersheds, inflows and outflows. The shadesnowmelt. The inset box also has a partial thick black line on the bottom. Inflow points to th4. Winnipeg River; 5. Bloodvein River. Several smaller rivers on the eastern side of the Lakewatershed in North America.
and associated symptoms of increasing eutrophication began tooccur by the mid-1990s.
Paleolimnological studies using nutrient concentrations and algalremains in lake sediments have filled in the early history of the lakeand provide a baseline against which to evaluate the recent observedchanges since the early 1990s. These paleolimnological studies con-cluded that, like many lakes of the western prairies, Lake Winnipegwas mildly eutrophic in its natural state (Bunting et al., 2011;Kling, 1998; Kling et al., 2011; Mayer et al., 2006) as a consequenceof phosphorus-rich soils in the western and southern parts of thelake's catchment. Increasing clearing of the basin for agricultureand inputs of synthetic fertilizers andmanure during the 20th centu-ry and a slowly increasing human population caused a slow increasein the lake's phytoplankton abundance over time. However, eutro-phication increased very rapidly after the mid-1990s (Armstrongand McCullough, 2011; Kling et al., 2011; Figs. 2 and 3) as the resultof the combination of factors reviewed below.
Changes to the watershed of Lake Winnipeg
Since the mid 20th century, several large reservoirs have beenbuilt on the Saskatchewan River, which was once the largest sourceof water to the lake (Fig. 1). The river drains a large, semi-arid areaof Alberta and Saskatchewan. The reservoirs serve as traps for nutri-ents and silt, as well as sites of increased evaporation. The Saskatchewanwatershed had warmed over 2 °C since the mid 20th century, mostly inwinter and spring. The watershed has shown a strong trend to lessprecipitation, less snow, and earlier spring melts than it once had
d area in the Red River watershed shows the portion flooded frequently during springe lake are numbered as follows: 1. Saskatchewan River; 2. Dauphin River; 3. Red River;are included in the watershed shown for the Bloodvein. Inset shows the position of the
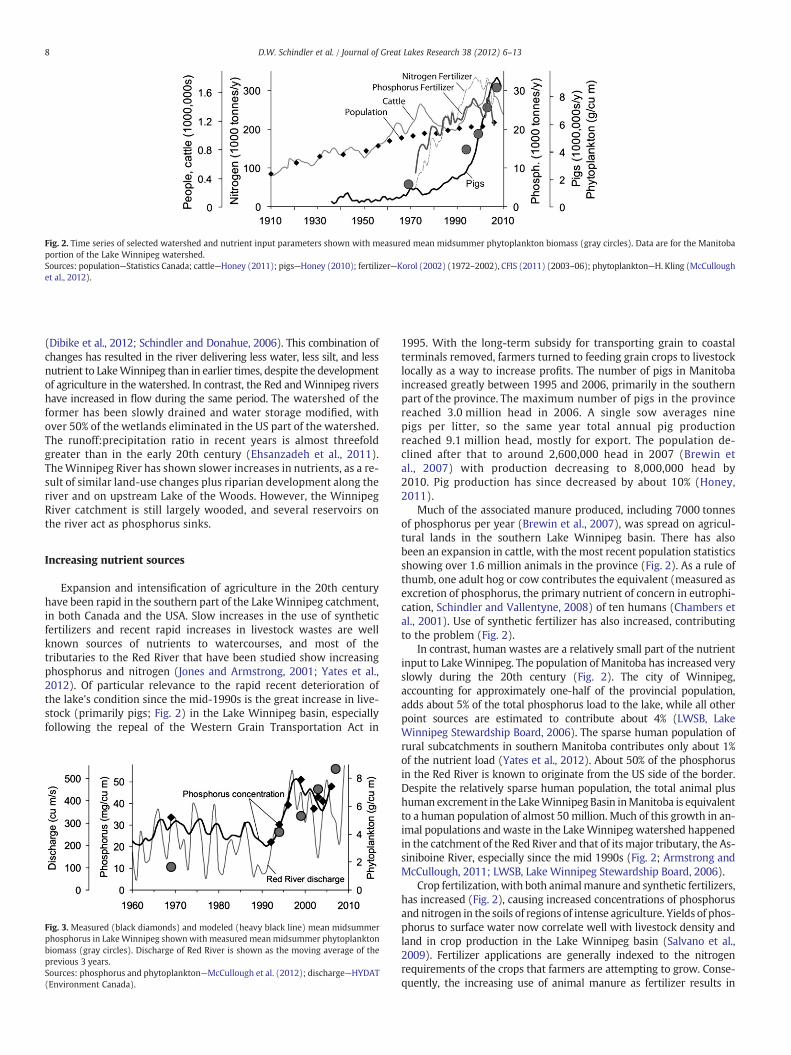
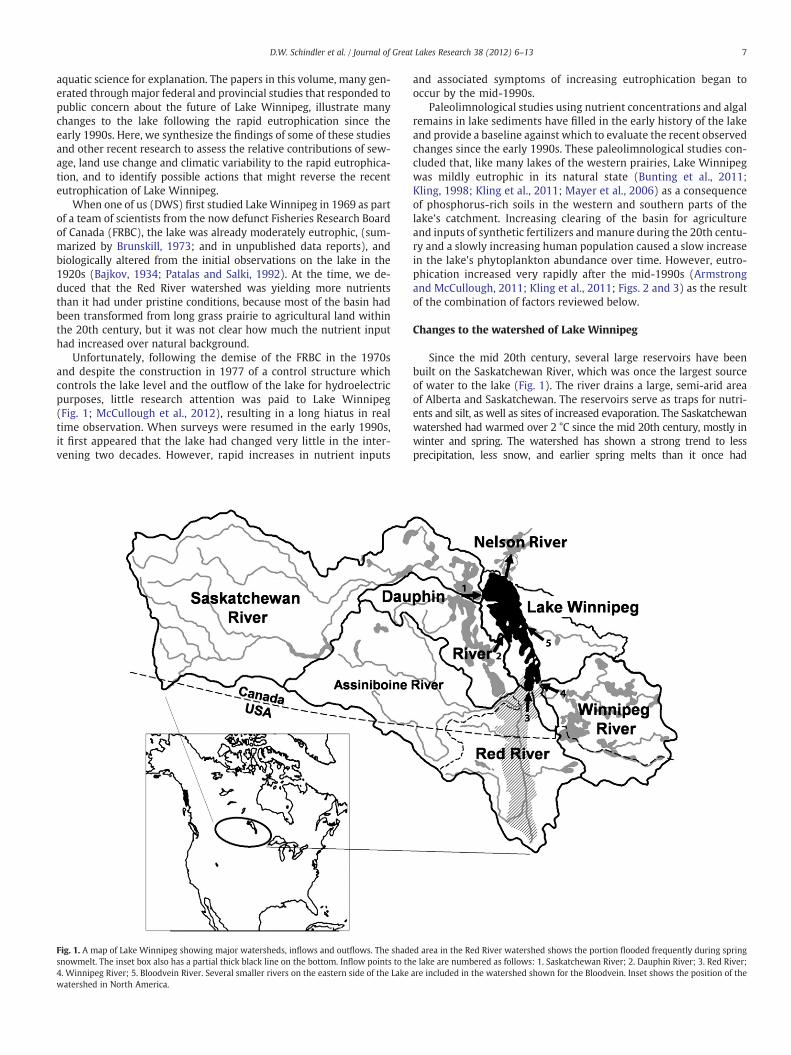
Fig. 2. Time series of selected watershed and nutrient input parameters shown with measured mean midsummer phytoplankton biomass (gray circles). Data are for the Manitobaportion of the Lake Winnipeg watershed.Sources: population—Statistics Canada; cattle—Honey (2011); pigs—Honey (2010); fertilizer—Korol (2002) (1972–2002), CFIS (2011) (2003–06); phytoplankton—H. Kling (McCulloughet al., 2012).
8 D.W. Schindler et al. / Journal of Great Lakes Research 38 (2012) 6–13
(Dibike et al., 2012; Schindler and Donahue, 2006). This combination ofchanges has resulted in the river delivering less water, less silt, and lessnutrient to LakeWinnipeg than in earlier times, despite the developmentof agriculture in the watershed. In contrast, the Red andWinnipeg rivershave increased in flow during the same period. The watershed of theformer has been slowly drained and water storage modified, withover 50% of the wetlands eliminated in the US part of the watershed.The runoff:precipitation ratio in recent years is almost threefoldgreater than in the early 20th century (Ehsanzadeh et al., 2011).TheWinnipeg River has shown slower increases in nutrients, as a re-sult of similar land-use changes plus riparian development along theriver and on upstream Lake of the Woods. However, the WinnipegRiver catchment is still largely wooded, and several reservoirs onthe river act as phosphorus sinks.
Increasing nutrient sources
Expansion and intensification of agriculture in the 20th centuryhave been rapid in the southern part of the LakeWinnipeg catchment,in both Canada and the USA. Slow increases in the use of syntheticfertilizers and recent rapid increases in livestock wastes are wellknown sources of nutrients to watercourses, and most of thetributaries to the Red River that have been studied show increasingphosphorus and nitrogen (Jones and Armstrong, 2001; Yates et al.,2012). Of particular relevance to the rapid recent deterioration ofthe lake's condition since the mid-1990s is the great increase in live-stock (primarily pigs; Fig. 2) in the Lake Winnipeg basin, especiallyfollowing the repeal of the Western Grain Transportation Act in
Fig. 3. Measured (black diamonds) and modeled (heavy black line) mean midsummerphosphorus in LakeWinnipeg shown with measured meanmidsummer phytoplanktonbiomass (gray circles). Discharge of Red River is shown as the moving average of theprevious 3 years.Sources: phosphorus and phytoplankton—McCullough et al. (2012); discharge—HYDAT(Environment Canada).
1995. With the long-term subsidy for transporting grain to coastalterminals removed, farmers turned to feeding grain crops to livestocklocally as a way to increase profits. The number of pigs in Manitobaincreased greatly between 1995 and 2006, primarily in the southernpart of the province. The maximum number of pigs in the provincereached 3.0 million head in 2006. A single sow averages ninepigs per litter, so the same year total annual pig productionreached 9.1 million head, mostly for export. The population de-clined after that to around 2,600,000 head in 2007 (Brewin etal., 2007) with production decreasing to 8,000,000 head by2010. Pig production has since decreased by about 10% (Honey,2011).
Much of the associated manure produced, including 7000 tonnesof phosphorus per year (Brewin et al., 2007), was spread on agricul-tural lands in the southern Lake Winnipeg basin. There has alsobeen an expansion in cattle, with the most recent population statisticsshowing over 1.6 million animals in the province (Fig. 2). As a rule ofthumb, one adult hog or cow contributes the equivalent (measured asexcretion of phosphorus, the primary nutrient of concern in eutrophi-cation, Schindler and Vallentyne, 2008) of ten humans (Chambers etal., 2001). Use of synthetic fertilizer has also increased, contributingto the problem (Fig. 2).
In contrast, human wastes are a relatively small part of the nutrientinput to LakeWinnipeg. The population of Manitoba has increased veryslowly during the 20th century (Fig. 2). The city of Winnipeg,accounting for approximately one-half of the provincial population,adds about 5% of the total phosphorus load to the lake, while all otherpoint sources are estimated to contribute about 4% (LWSB, LakeWinnipeg Stewardship Board, 2006). The sparse human population ofrural subcatchments in southern Manitoba contributes only about 1%of the nutrient load (Yates et al., 2012). About 50% of the phosphorusin the Red River is known to originate from the US side of the border.Despite the relatively sparse human population, the total animal plushuman excrement in the LakeWinnipeg Basin inManitoba is equivalentto a human population of almost 50 million. Much of this growth in an-imal populations and waste in the LakeWinnipeg watershed happenedin the catchment of the Red River and that of itsmajor tributary, the As-siniboine River, especially since the mid 1990s (Fig. 2; Armstrong andMcCullough, 2011; LWSB, Lake Winnipeg Stewardship Board, 2006).
Crop fertilization, with both animalmanure and synthetic fertilizers,has increased (Fig. 2), causing increased concentrations of phosphorusand nitrogen in the soils of regions of intense agriculture. Yields of phos-phorus to surface water now correlate well with livestock density andland in crop production in the Lake Winnipeg basin (Salvano et al.,2009). Fertilizer applications are generally indexed to the nitrogenrequirements of the crops that farmers are attempting to grow. Conse-quently, the increasing use of animal manure as fertilizer results in
9D.W. Schindler et al. / Journal of Great Lakes Research 38 (2012) 6–13
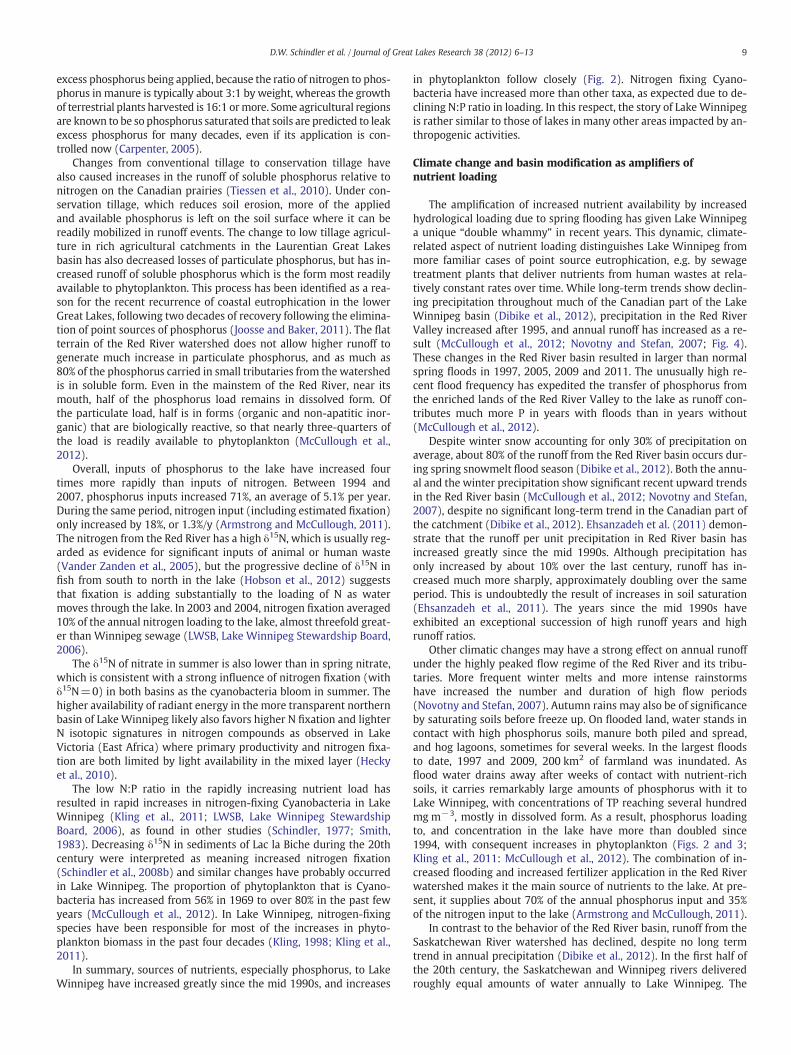
excess phosphorus being applied, because the ratio of nitrogen to phos-phorus in manure is typically about 3:1 by weight, whereas the growthof terrestrial plants harvested is 16:1 ormore. Some agricultural regionsare known to be so phosphorus saturated that soils are predicted to leakexcess phosphorus for many decades, even if its application is con-trolled now (Carpenter, 2005).
Changes from conventional tillage to conservation tillage havealso caused increases in the runoff of soluble phosphorus relative tonitrogen on the Canadian prairies (Tiessen et al., 2010). Under con-servation tillage, which reduces soil erosion, more of the appliedand available phosphorus is left on the soil surface where it can bereadily mobilized in runoff events. The change to low tillage agricul-ture in rich agricultural catchments in the Laurentian Great Lakesbasin has also decreased losses of particulate phosphorus, but has in-creased runoff of soluble phosphorus which is the form most readilyavailable to phytoplankton. This process has been identified as a rea-son for the recent recurrence of coastal eutrophication in the lowerGreat Lakes, following two decades of recovery following the elimina-tion of point sources of phosphorus (Joosse and Baker, 2011). The flatterrain of the Red River watershed does not allow higher runoff togenerate much increase in particulate phosphorus, and as much as80% of the phosphorus carried in small tributaries from the watershedis in soluble form. Even in the mainstem of the Red River, near itsmouth, half of the phosphorus load remains in dissolved form. Ofthe particulate load, half is in forms (organic and non-apatitic inor-ganic) that are biologically reactive, so that nearly three-quarters ofthe load is readily available to phytoplankton (McCullough et al.,2012).
Overall, inputs of phosphorus to the lake have increased fourtimes more rapidly than inputs of nitrogen. Between 1994 and2007, phosphorus inputs increased 71%, an average of 5.1% per year.During the same period, nitrogen input (including estimated fixation)only increased by 18%, or 1.3%/y (Armstrong and McCullough, 2011).The nitrogen from the Red River has a high δ15N, which is usually reg-arded as evidence for significant inputs of animal or human waste(Vander Zanden et al., 2005), but the progressive decline of δ15N infish from south to north in the lake (Hobson et al., 2012) suggeststhat fixation is adding substantially to the loading of N as watermoves through the lake. In 2003 and 2004, nitrogen fixation averaged10% of the annual nitrogen loading to the lake, almost threefold great-er than Winnipeg sewage (LWSB, Lake Winnipeg Stewardship Board,2006).
The δ15N of nitrate in summer is also lower than in spring nitrate,which is consistent with a strong influence of nitrogen fixation (withδ15N=0) in both basins as the cyanobacteria bloom in summer. Thehigher availability of radiant energy in the more transparent northernbasin of Lake Winnipeg likely also favors higher N fixation and lighterN isotopic signatures in nitrogen compounds as observed in LakeVictoria (East Africa) where primary productivity and nitrogen fixa-tion are both limited by light availability in the mixed layer (Heckyet al., 2010).
The low N:P ratio in the rapidly increasing nutrient load hasresulted in rapid increases in nitrogen-fixing Cyanobacteria in LakeWinnipeg (Kling et al., 2011; LWSB, Lake Winnipeg StewardshipBoard, 2006), as found in other studies (Schindler, 1977; Smith,1983). Decreasing δ15N in sediments of Lac la Biche during the 20thcentury were interpreted as meaning increased nitrogen fixation(Schindler et al., 2008b) and similar changes have probably occurredin Lake Winnipeg. The proportion of phytoplankton that is Cyano-bacteria has increased from 56% in 1969 to over 80% in the past fewyears (McCullough et al., 2012). In Lake Winnipeg, nitrogen-fixingspecies have been responsible for most of the increases in phyto-plankton biomass in the past four decades (Kling, 1998; Kling et al.,2011).
In summary, sources of nutrients, especially phosphorus, to LakeWinnipeg have increased greatly since the mid 1990s, and increases
in phytoplankton follow closely (Fig. 2). Nitrogen fixing Cyano-bacteria have increased more than other taxa, as expected due to de-clining N:P ratio in loading. In this respect, the story of LakeWinnipegis rather similar to those of lakes in many other areas impacted by an-thropogenic activities.
Climate change and basin modification as amplifiers ofnutrient loading
The amplification of increased nutrient availability by increasedhydrological loading due to spring flooding has given Lake Winnipega unique “double whammy” in recent years. This dynamic, climate-related aspect of nutrient loading distinguishes Lake Winnipeg frommore familiar cases of point source eutrophication, e.g. by sewagetreatment plants that deliver nutrients from human wastes at rela-tively constant rates over time. While long-term trends show declin-ing precipitation throughout much of the Canadian part of the LakeWinnipeg basin (Dibike et al., 2012), precipitation in the Red RiverValley increased after 1995, and annual runoff has increased as a re-sult (McCullough et al., 2012; Novotny and Stefan, 2007; Fig. 4).These changes in the Red River basin resulted in larger than normalspring floods in 1997, 2005, 2009 and 2011. The unusually high re-cent flood frequency has expedited the transfer of phosphorus fromthe enriched lands of the Red River Valley to the lake as runoff con-tributes much more P in years with floods than in years without(McCullough et al., 2012).
Despite winter snow accounting for only 30% of precipitation onaverage, about 80% of the runoff from the Red River basin occurs dur-ing spring snowmelt flood season (Dibike et al., 2012). Both the annu-al and the winter precipitation show significant recent upward trendsin the Red River basin (McCullough et al., 2012; Novotny and Stefan,2007), despite no significant long-term trend in the Canadian part ofthe catchment (Dibike et al., 2012). Ehsanzadeh et al. (2011) demon-strate that the runoff per unit precipitation in Red River basin hasincreased greatly since the mid 1990s. Although precipitation hasonly increased by about 10% over the last century, runoff has in-creased much more sharply, approximately doubling over the sameperiod. This is undoubtedly the result of increases in soil saturation(Ehsanzadeh et al., 2011). The years since the mid 1990s haveexhibited an exceptional succession of high runoff years and highrunoff ratios.
Other climatic changes may have a strong effect on annual runoffunder the highly peaked flow regime of the Red River and its tribu-taries. More frequent winter melts and more intense rainstormshave increased the number and duration of high flow periods(Novotny and Stefan, 2007). Autumn rains may also be of significanceby saturating soils before freeze up. On flooded land, water stands incontact with high phosphorus soils, manure both piled and spread,and hog lagoons, sometimes for several weeks. In the largest floodsto date, 1997 and 2009, 200 km2 of farmland was inundated. Asflood water drains away after weeks of contact with nutrient-richsoils, it carries remarkably large amounts of phosphorus with it toLake Winnipeg, with concentrations of TP reaching several hundredmg m−3, mostly in dissolved form. As a result, phosphorus loadingto, and concentration in the lake have more than doubled since1994, with consequent increases in phytoplankton (Figs. 2 and 3;Kling et al., 2011: McCullough et al., 2012). The combination of in-creased flooding and increased fertilizer application in the Red Riverwatershed makes it the main source of nutrients to the lake. At pre-sent, it supplies about 70% of the annual phosphorus input and 35%of the nitrogen input to the lake (Armstrong and McCullough, 2011).
In contrast to the behavior of the Red River basin, runoff from theSaskatchewan River watershed has declined, despite no long termtrend in annual precipitation (Dibike et al., 2012). In the first half ofthe 20th century, the Saskatchewan and Winnipeg rivers deliveredroughly equal amounts of water annually to Lake Winnipeg. The
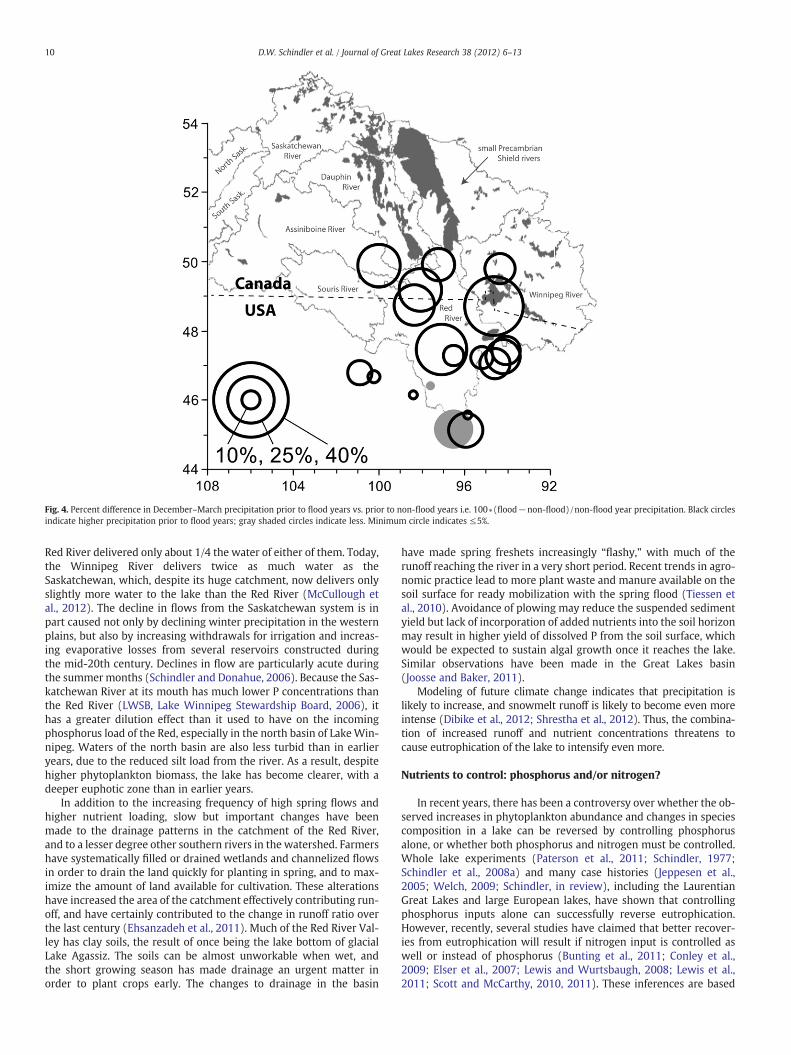
Fig. 4. Percent difference in December–March precipitation prior to flood years vs. prior to non-flood years i.e. 100∗(flood−non-flood)/non-flood year precipitation. Black circlesindicate higher precipitation prior to flood years; gray shaded circles indicate less. Minimum circle indicates ≤5%.
10 D.W. Schindler et al. / Journal of Great Lakes Research 38 (2012) 6–13
Red River delivered only about 1/4 the water of either of them. Today,the Winnipeg River delivers twice as much water as theSaskatchewan, which, despite its huge catchment, now delivers onlyslightly more water to the lake than the Red River (McCullough etal., 2012). The decline in flows from the Saskatchewan system is inpart caused not only by declining winter precipitation in the westernplains, but also by increasing withdrawals for irrigation and increas-ing evaporative losses from several reservoirs constructed duringthe mid-20th century. Declines in flow are particularly acute duringthe summermonths (Schindler and Donahue, 2006). Because the Sas-katchewan River at its mouth has much lower P concentrations thanthe Red River (LWSB, Lake Winnipeg Stewardship Board, 2006), ithas a greater dilution effect than it used to have on the incomingphosphorus load of the Red, especially in the north basin of LakeWin-nipeg. Waters of the north basin are also less turbid than in earlieryears, due to the reduced silt load from the river. As a result, despitehigher phytoplankton biomass, the lake has become clearer, with adeeper euphotic zone than in earlier years.
In addition to the increasing frequency of high spring flows andhigher nutrient loading, slow but important changes have beenmade to the drainage patterns in the catchment of the Red River,and to a lesser degree other southern rivers in the watershed. Farmershave systematically filled or drained wetlands and channelized flowsin order to drain the land quickly for planting in spring, and to max-imize the amount of land available for cultivation. These alterationshave increased the area of the catchment effectively contributing run-off, and have certainly contributed to the change in runoff ratio overthe last century (Ehsanzadeh et al., 2011). Much of the Red River Val-ley has clay soils, the result of once being the lake bottom of glacialLake Agassiz. The soils can be almost unworkable when wet, andthe short growing season has made drainage an urgent matter inorder to plant crops early. The changes to drainage in the basin
have made spring freshets increasingly “flashy,” with much of therunoff reaching the river in a very short period. Recent trends in agro-nomic practice lead to more plant waste and manure available on thesoil surface for ready mobilization with the spring flood (Tiessen etal., 2010). Avoidance of plowing may reduce the suspended sedimentyield but lack of incorporation of added nutrients into the soil horizonmay result in higher yield of dissolved P from the soil surface, whichwould be expected to sustain algal growth once it reaches the lake.Similar observations have been made in the Great Lakes basin(Joosse and Baker, 2011).
Modeling of future climate change indicates that precipitation islikely to increase, and snowmelt runoff is likely to become even moreintense (Dibike et al., 2012; Shrestha et al., 2012). Thus, the combina-tion of increased runoff and nutrient concentrations threatens tocause eutrophication of the lake to intensify even more.
Nutrients to control: phosphorus and/or nitrogen?
In recent years, there has been a controversy over whether the ob-served increases in phytoplankton abundance and changes in speciescomposition in a lake can be reversed by controlling phosphorusalone, or whether both phosphorus and nitrogen must be controlled.Whole lake experiments (Paterson et al., 2011; Schindler, 1977;Schindler et al., 2008a) and many case histories (Jeppesen et al.,2005; Welch, 2009; Schindler, in review), including the LaurentianGreat Lakes and large European lakes, have shown that controllingphosphorus inputs alone can successfully reverse eutrophication.However, recently, several studies have claimed that better recover-ies from eutrophication will result if nitrogen input is controlled aswell or instead of phosphorus (Bunting et al., 2011; Conley et al.,2009; Elser et al., 2007; Lewis and Wurtsbaugh, 2008; Lewis et al.,2011; Scott and McCarthy, 2010, 2011). These inferences are based
11D.W. Schindler et al. / Journal of Great Lakes Research 38 (2012) 6–13
on smaller scale, short term nutrient enrichment experiments,paleoecological correlations where causation is inferred, and flawedlogic (Schindler, in review). In fact, no ecosystem-scale study hasdemonstrated that reducing nitrogen can cause decreased algal pro-duction or biomass. Only one whole lake experiment has deliberatelytested reducing inputs of nitrogen without reducing phosphorus as away to control eutrophication (Paterson et al., 2011; Schindler et al.,2008a). It showed that reducing nitrogen inputs while maintainingphosphorus inputs did not reduce the blooms of phytoplankton sig-nificantly. Instead, the result was an increase in the prevalence ofnitrogen-fixing Cyanobacteria, and in the annual magnitude of nitro-gen fixation. Both consequences are undesirable.
Hecky and Kilham (1988) and Vitousek et al. (2010) have previ-ously pointed out that proximate nutrient limitation, as obtained inshort-term, small scale bottle or mesocosm experiments, is not neces-sarily a reliable predictor of ultimate (long term) ecological responseto a nutrient limitation. Short-term experiments in Moses Lake USAshowed nitrogen limitation in short, small scale experiments after nu-trient loading was cut, but in the long-term, algal biomass respondedin proportion to declines in phosphorus (Welch, 2009). Short term in-cubations cannot allow for adjustments in algal community composi-tion or the biogeochemical cycles of lakes that would eventually occurin response to a nutrient stress. Nitrogen fixation by heterocystousCyanobacteria is a good example of such a process that can occur ifa nitrogen stress is imposed on an algal community. In brief, theLake 227 and Moses Lake histories suggest that short-term nitrogenlimitation indicate that a lake is overfertilized with phosphorus, rath-er than that nitrogen must be controlled.
Some of the advocates for nitrogen control have argued that Nfixation is generally observed to be only a small fraction of the totaldaily N demand and therefore, cannot be important in allowing aphytoplankton community to overcome an imposed deficiency. Thisignores the fact that much of the nitrogen fixed daily from theatmosphere is retained and recycled in lakes over longer periods oftime. Mugidde et al. (2003) demonstrated that even though N fixa-tion was less than 20% of daily N demand by phytoplankton in LakeVictoria, it accounted for nearly 80% of the annual total N loading.On a daily basis, recycled nitrogen dominated N uptake; but N fixa-tion by heterocystous N fixers enabled them to overcome any dailylimitation of N and allowed them to outcompete other algal groupsfor other limiting nutrients. However, these daily additions of newlyfixed nitrogen to the total N pool when summed over the year werefour times greater than all external sources of nitrogen compoundsto Lake Victoria. Over ecological time scales of seasons to years, thecombination of nitrogen fixation and net retention of recycled nitro-gen allows phytoplankton to grow in proportion to phosphorus con-centration and supply (Schindler, 1977; Schindler et al., 1987).
Some recent papers have observed that increasing inputs of nitro-gen in lakes already saturated with phosphorus have caused nitrogenfixers to decline, being replaced by Microcystis or Planktothrix(Bunting et al., 2007; Paerl et al., 2011). It has been proposed thatsuch changes are about to occur in Lake Winnipeg (Bunting et al.,2011). However, such changes appear to occur only in very eutrophiclakes where turbidity is high and where P concentrations and algalbiomass are also high because of historic increases in P loading. Insuch circumstances, when algal biomass is high and consequentlylight penetration is low, nitrogen fixation is not favored and adapta-tion of phytoplankton growth to low light conditions may be moreimportant than competition for N. Phosphorus and chlorophyll con-centrations in all of Lake Winnipeg except the south basin are stillmuch lower than in the lakes described in the above studies. Thereis no evidence so far that Lake Winnipeg has reached such a thresh-old, where declines in N fixing species and replacement byMicrocystisor Planktothrix might be occurring. In fact, Microcystis is scarcely pre-sent in the large north basin of the lake, and almost all of the increasesin algae are by nitrogen-fixing species (Kling et al., 2011 and pers.
comm. March, 2012) even in the south basin. In Lake Winnipeg, theappropriate action to abate eutrophication is to reduce P loading be-fore such a critical condition is reached.
To summarize, in the four decades for which nutrient informationis available for Lake Winnipeg, phosphorus has increased much morerapidly than nitrogen. Increased phytoplankton abundance has oc-curred almost entirely from Cyanobacteria (Kling, 1998; Kling et al.,2011; McCullough et al., 2012), among which nitrogen fixing specieshave accounted for most of the increase. Consequently, we concludethat controlling nitrogen inputs would contribute little to reversingeutrophication in Lake Winnipeg. The many successful whole-lakeexperiments and case histories where lakes have been recovered bydecreasing inputs of phosphorus alone indicate the most likely pathto successfully reducing eutrophication of the lake. A recent modelof the responses of phytoplankton in Lake Winnipeg to phosphoruscontrol is in good agreement (Zhang and Rao, 2012). As shown bySchindler et al. (2008a) and Paterson et al. (2011) discussed bySchindler (in review), attempts to control N inputs can actuallyaggravate a eutrophic situation by selecting for the very N fixingspecies that are the major cause of concern in Lake Winnipeg.
Cost must also be a consideration. The removal of nitrogen fromnutrient sources such as sewage treatment plants is quite costly,when compared to the removal of phosphorus alone. For example,to retrofit the City of Winnipeg's north end waste water treatmentplant to remove both phosphorus and nitrogen using biologicalnutrient removal and denitrification has been estimated to cost$400 million, while to remove phosphorus alone, plus nitrifyingammonium, is estimated to cost less than $100 million, while easilymeeting provincial water quality standards. The more expensivealternative would only reduce nitrogen inputs to the lake by 1.3%(N. Szoke, Stantec Engineering, pers. comm.). Similarly, for the BalticSea, Håkanson (2009) estimates that removing phosphorus alonewould cost 400 million Euros, while removing both elements wouldrequire 3300 million Euros. The latter cost is so great that smallerBaltic countries will probably not be able to afford it. In summary,removing both nutrients is several times more costly than removingphosphorus alone. The provincial policy commitment to reducephosphorus input to Lake Winnipeg by 50% is ambitious, butnecessary to address the eutrophication problem, and it should bethe main focus of costs to the public.
Looking ahead
For the most part, Lake Winnipeg is well mixed, as the result of itshuge area and shallow depth. However, Wassenaar (2012) and Zhaoet al. (2012) report occasional periods of stratification, whenhypolimnetic oxygen declines to b2.6 mg/L, in both summer andwinter. In large lakes, such events are predicted to increase infrequency and duration under climate warming as they alreadyhave in the St. Lawrence Great Lakes (Magnuson et al., 1997). Thedensity of water declines rapidly with each degree of temperatureincrease above 4 °C so that as surface waters warm, additional workby wind is required to mix the water column. Thus, warmingincreases the probability of stratification occurring, unless there arecompensatory increases in wind velocity.
Increasing nutrients cause increased productivity, which will alsointensify rates of oxygen consumption by decomposition of algalmaterial. As a result, oxygen could be depleted to even lower valuesthan present minima, and become depleted more quickly as algalproduction increases. Together, increased stratification and increasednutrient loading can promote eutrophication by intensifying internalphosphorus loading. Hypoxia also favors denitrification, with the neteffect that stratification will reduce the N:P ratio of nutrientregeneration (Hecky et al., 1996).
Lake Winnipeg's recovery from eutrophication is likely to be slow,even if the 50% target for reducing input of phosphorus is reached. In
12 D.W. Schindler et al. / Journal of Great Lakes Research 38 (2012) 6–13
morphometry, it is similar to Lac la Biche, Alberta where land-usechange, cottage development and a growing urban population have in-creased inputs of phosphorus to the lake (Schindler et al., 2008b). Bothlakes are polymictic, withweak stratification developing during periodsof calm weather. In Lac la Biche, during periods of even weak stratifica-tion anoxia develops quickly, and phosphorus is released from sedi-ments. When windy conditions return, the stratification is broken andphosphorus is swept into the euphotic zone. Such events can occur sev-eral times a summer, keeping phosphorus, and thus algal densities high(Schindler, unpublished data). In lakes with such high internalrecycling, recovery will be delayed until internal sources of phosphorusare buried or washed out of the lake. Studies in the USA and Europe in-dicate that a decade or more may be required for a lake to reach a newsteady state after loading is reduced (Edmondson and Lehman, 1981;Jeppesen et al., 2005; Stich and Brinker, 2010; Welch, 2009). The rateof recovery in the lower Great Lakes was similar. The rate of recoverywill not improve if nitrogen inputs are controlled. In fact, the occurrenceof nuisance blooms of nitrogen fixing Cyanobacteria might increase be-cause they are selectively favored when ionic nitrogen is low relative tophosphorus (Paterson et al., 2011; Schindler et al., 2008a).
Regional climate models connected to global models predict that bythe mid-21st century, temperatures in the LakeWinnipeg basin will be2.1–2.8°warmer than the 1980s and precipitationwill increase by 5.5 to7.7% (Dibike et al., 2012; Shrestha et al., 2012). Such changes wouldcertainly exacerbate the spring flooding that has been observed inrecent years, thus compounding the eutrophication problem. The RedRiver catchment is so flat that it would be impossible to use dams tocontrol floods and flow rates. This suggests to us that aggressive controlof phosphorus applied to land is the most likely measure to reduceeutrophication of the lake. Restoration of wetlands and drainagepatterns would also assist by slowing the rate of runoff.
Although the eutrophication problem has been brought into betterfocus and to greater public attention by recent studies, the solutionswill be challenging andother threats to the ecosystemhealth and stabilityof Lake Winnipeg, such as invasion by new exotic species includingdreissenid mussels (Sheppard et al., 2012), are on the horizon. So far,only a few invaders have reached the lake, in contrast to the hundredsof invasive alien species in theGreat Lakes (Ricciardi andMacIsaac, 2000).
Common carp, Cyprinus carpiowere introduced to LakeWinnipeg byEuropean immigrants in the late 1880s. There is a thriving population inthe delta of the Red River, and the species is common in the south basinof the lake. White bassMorone chrysopswere observed in the Red Riverin 1963, following stocking in Lake Ashtabula, a reservoir on the tribu-tary Sheyenne River. The species is now abundant in the lake, andmany of the inflowing rivers. Rainbow smelt Osmerus mordax werefirst caught in the lake in 1990. The species was found earlier in Lakeof the Woods, and it probably entered via the Winnipeg River. It isnow widespread in the lake, where it competes with other forage fish.Other invaders so far include two species of crayfish, the Asian carptapeworm, and the cladoceran Eubosmina coregoni. The spiny waterflea Bythotrephes has recently been found in Lake of the Woods, andzebra mussel Dreissena polymorpha veliger larvae were recently foundin the Red River. The Souris River diversion threatens to allow speciesfrom the Mississippi–Missouri drainage to enter Lake Winnipeg aswell. It appears that a major invasion of aquatic species to the lake isstarting. As found in the Great Lakes (Evans et al., 2011), these maygreatly change the lake's future trophic status via changes to the path-ways for recycling of nutrients even though loading of nutrients is notchanged (Carpenter et al., 1985; Elser et al., 2000; Hecky et al., 2004).
Lake Winnipeg may be unique among culturally eutrophied largelakes for two aspects: its enormous watershed and low contributionof human wastes to its nutrient enrichment. Lake Winnipeg has adrainage area to lake area ratio of 42:1, much larger than any otherlarge lake in the world; but the population density in this hugebasin is low. Winnipeg contributes only 5% to the phosphorus load,and all other point sources an estimated 4% (LWSB, Lake Winnipeg
Stewardship Board, 2006). Rural populations supply less than 1% ofthe nutrient yield to the catchment, even in its most populous catch-ment, the Red River basin (Yates et al., 2012). In the Laurentian GreatLakes prior to P reduction targets imposed by the international agree-ment under the Great Lakes Water Quality Agreement, point sources(largely waste treatment plants) accounted for much of the P loading,e.g. nearly 50% in Lake Erie. The Great Lakes recovered rapidly afterthese point sources met mandated P emission standards. Howeverthe non-point sources of P were not regulated (Schindler andVallentyne, 2008) and there is now increasing concern that agricul-turally impacted regions of the Great Lakes basin may be causingeutrophication to increase again (Joosse and Baker, 2011).
Easy to control point sources are few and nearly insignificant tothe basin scale P loading to Lake Winnipeg. The Province of Manitobahas risen to the challenge by recently announcing a goal of reducing Ploading to the lake by 50% but the complex details of how to accom-plish this goal remain to be defined. Added to this challenge are thepossible roles of climate change and watershed hydrological modifi-cations in imposing higher nutrient loading on the lake, as we havedescribed above. Climatic factors are beyond the control by the prov-ince or any single jurisdiction in the world, and their importance islikely magnified by the extreme low slope of these prairie basinswhich exhibit non-linear responses in runoff to even modest changesin precipitation. However, the sensitivity of the lake to nutrient load-ing is clear and the need for action imperative.
As politicians procrastinate, taking little meaningful action to helpcurb climate warming, predictions based on science indicate that itwill be difficult to keep the condition of LakeWinnipeg fromworsening.From the evidence that we reviewed, reducing the eutrophication ofLake Winnipeg will require reducing both nutrient application in thewatershed and flooding of the overfertilized Red River watershed. Theincreased flooding in recent years appears to be the result of higher run-off due to increased precipitation since the 1990s aggravated by a priorhistory of channelization, wetland destruction, and perhaps modifica-tion of drainage patterns by roads and urbanization (Ehsanzadeh etal., 2011). Restoration ofwetlands and drainage patternsmust thereforebe a part of the recovery plan for the lake, as well as better phosphorusmanagement by the agricultural sector.
Acknowledgments
Nick Szoke of Stantec Engineering kindly shared costs and environ-mental evaluations of various options for treating sewage Winnipeg'sNorth End Water Pollution Control Center. Hedy Kling provided recentinformation on the abundance and taxonomic composition of phyto-plankton in the lake. Kimberley Rondeau andMargaret Foxcroft assistedwith production of the final manuscript and figures.
References
Armstrong, N., McCullough, G.K., 2011. Nutrient loading to Lake Winnipeg. Section 7.In: Lévesque, L., Page, E. (Eds.), State of Lake Winnipeg: 1999–2007, EnvironmentCanada and Manitoba Water Stewardship Report, http://www.gov.mb.ca/waterstewardship/water_quality/state_lk_winnipeg_report/pdf/state_of_lake_winnipeg_rpt_technical_low_resolution.pdf.
Bajkov, A.D., 1934. The plankton of Lake Winnipeg drainage system. Int. Rev. GesamtenHydrobiol. 31 (3/4), 239–272.
Brewin, D., Honey, J., Young, J., 2007. Statistics for Manitoba pig industry. In: Flaten, D.,Wittenberg, K., Zhang, Q. (Eds.), A Report on Current Knowledge of Key Environ-mental Issues Related to Hog Production in Manitoba. Commissioned by ManitobaClean Environment Commission, pp. 1–12.
Brunskill, G.J., 1973. Rates of supply of nitrogen and phosphorus to Lake Winnipeg,Manitoba, Canada. Verh. Int. Ver. Theor. Angew. Limnol. 18, 1755–1759.
Bunting, L., Leavitt, P.R., Gibson, C.E., McGee, E.J., Hall, V.A., 2007. Degradation of waterquality in Lough Neagh, Northern Ireland, by diffuse nitrogen flux from aphosphorus-rich catchment. Limnol. Oceanogr. 52, 354–369.
Bunting, L., Leavitt, P.R., Wissel, B., Laird, K.R., Cumming, B.F., St. Amand, A.,Engstrom, D.R., 2011. Sudden ecosystem state change in Lake Winnipeg,Canada, caused by eutrophication arising from crop and livestock productionduring the 20th century. Report to the Government of Manitoba, http://www.
13D.W. Schindler et al. / Journal of Great Lakes Research 38 (2012) 6–13
gov.mb.ca/waterstewardship/water_quality/lake_winnipeg/pdf/report_lake_wpg_paleolimnology_2011.pdf2011.
Carpenter, S.R., 2005. Eutrophication of aquatic ecosystems: bistability and soil phos-phorus. Proc. Natl. Acad. Sci. 102, 10002–10005.
Carpenter, S.R., Kitchell, J.F., Hodgson, J.R., 1985. Cascading trophic interactions andlake productivity. Bioscience 35, 634–639.
CFIS, S. Canadian Fertilizer Information System, Canadian Fertilizer Institute, http://www.cfi.ca/_documents/uploads/elibrary/2006_(June30th)_Retail_Stats_Report_(revised_June_12_2007)%5B1%5D.pdf (Accessed July 2011).
Chambers, P.A., Guy, M., Roberts, E.S., Charlton, M.N., Kent, R., Gagnon, C., Grove, G.,Foster, N., 2001. Nutrients and their impact on the Canadian environment. Agricul-ture and Agri-Food Canada, Environment Canada, Fisheries and Oceans Canada.Health Canada and Natural Resources Canada. (241 p.).
Conley, D.J., Paerl, H.W., Howarth, R.W., Boesch, D.F., Seitzinger, S.P., Havens, K.E.,Lancelot, C., Likens, G.E., 2009. Response to letters. Science 324, 724–725.
Dibike, Y., Prowse, T., Shrestha, R., Ahmed, R., 2012. Observed trends and future projec-tions of precipitation and air temperature in the Lake Winnipeg watershed. J. GreatLakes Res. 38 (Suppl. 3), 72–82.
Edmondson, W.T., Lehman, J.T., 1981. The effect of changes in the nutrient income onthe condition of Lake Washington. Limnol. Oceanogr. 26, 1–29.
Ehsanzadeh, E., van der Kamp, G., Spence, C., 2011. The impact of climatic variabilityand change in the hydroclimatology of Lake Winnipeg watershed. Hydrol. Process.,http://dx.doi.org/10.1002/hyp.8327
Elser, J.J., Sterner, R.W., Galford, A.E., Chrzanowski, T.H., Findlay, D.L., Mills, K.H.,Paterson, M.J., Stainton, M.P., Schindler, D.W., 2000. Pelagic C:N:P stoichiometryin a eutrophied lake: responses to a whole-lake food-web manipulation. Ecosys-tems 3, 293–307.
Elser, J.J., Bracken, M.E.S., Cleland, E.E., Gruner, D.S., Harpole, W.S., Hillebrand, H., Ngai, J.T.,Seabloom, E.W., Shurin, J.B., Smith, J.E., 2007. Global analysis of nitrogen and phospho-rus limitation of primary producers in freshwater, marine and terrestrial ecosystems.Ecol. Lett. 10, 1135–1142.
Evans,M.E., Fahnestiel, G., Scavia, D., 2011. Incidental oligotrophication of North AmericanGreat Lakes. Environ. Sci. Technol. 45, 3297–3303.
Håkanson, L., 2009. Modeling nutrient fluxes to, within and from the Kattegat to findan optimal, cost-efficient Swedish remedial strategy. Geotryckeriet, Villav. 16,752 36 Uppsala, Sweden. 978-91-633-4819-8.
Hecky, R.E., Kilham, P., 1988. Nutrient limitation in freshwater and marine environ-ments: a review of recent evidence on the effects of enrichment. Limnol. Oceanogr.33 (4 part 2), 796–822.
Hecky, R.E., Bootsma, H.A., Mugidde, R., Bugenyi, F.W.B., 1996. Phosphorus pumps,nitrogen sinks, silicon drains: plumbing nutrients in the African Great Lakes.In: Johnson, T.C., Odada, E. (Eds.), The Limnology, Climatology and Paleoclimatologyof the East African Lakes. Gordon and Breach, Toronto, pp. 205–224.
Hecky, R.E., Smith, R.E.H., Barton, D.R., Guildford, S.J., Taylor, W.D., Charlton, M.N.,Howell, R., 2004. The near shore phosphorus shunt: a consequence of ecosystemengineering by dreissenids in the Laurentian Great Lakes. Can. J. Fish. Aquat. Sci.61, 1285–1293.
Hecky, R.E., Mugidde, R., Ramlal, P.S., Talbot, M.R., Kling, G.W., 2010. Multiple stressorscause rapid ecosystem change in Lake Victoria. Freshw. Biol. 55 (Suppl. 1), 19–42.
Hobson,K.A., Ofukany,A., Soto, D.X.,Wassenaar,W.I., 2012. An isotopic baseline (δ13C, δ15N)for fishes of Lake Winnipeg: implications for investigating impacts of eutrophicationand invasive species. J. Great Lakes Res. 38 (Suppl. 3), 58–65.
Honey, J., 2010. Manitoba Pig and Pork Industry, 2009. Report Prepared for the Depart-ment of Agribusiness and Agricultural Economics. University of Manitoba.
Honey, J., 2011. Manitoba Cattle and Beef Industry 2010. Report Prepared for the Depart-ment of Agribusiness and Agricultural Economics. University of Manitoba, http://www.umanitoba.ca/afs/agric_economics/staff/Manitobapigandporkprofile2010.pd.
HYDAT, http://www.ec.gc.ca/rhc-wsc/(Accessed July 2011).Jeppesen, E., Jensen, J.P., Søndergaard, M., Lauridsen, T., 2005. Response of fish and
plankton to nutrient loading reduction in 8 shallow Danish lakes with special em-phasis on seasonal dynamics. Freshwater Biol. 50, 1616–1627.
Jones, G., Armstrong, N., 2001. Long-term trends in total nitrogen and total phosphorusconcentrations in Manitoba streams. Water Quality Management Section, WaterBranch, Manitoba Conservation, Winnipeg, MB. Manitoba Conservation ReportNo. 2001–07. (154 pp.).
Joosse, P.J., Baker, D.B., 2011. Context for re-evaluating agricultural source phosphorusloadings to the Great Lakes. Can. J. Soil Sci. 91, 317–327.
Kling, H.J., 1998. A summary of past and recent plankton of Lake Winnipeg, Canadausing algal fossil remains. J. Paleolimnol. 19, 297–307.
Kling, H.J., Watson, S.B., McCullough, G.K., Stainton, M.P., 2011. Bloom developmentand phytoplankton succession in Lake Winnipeg: a comparison of historical re-cords with recent data. Aquat. Ecosyst. Health Manage. 14, 219–224.
Korol, M., 2002. Canadian Fertilizer Consumption, Shipments and Trade 2001/2002. Agri-culture and Agri-Food Canada Report, http://www.cfi.ca/_documents/uploads/elibrary/cf01_02_e%5B1%5D.pdf2002(accessed August 11, 2011).
Lewis Jr., W.M., Wurtsbaugh, W.A., 2008. Control of lacustrine phytoplankton by nutri-ents: erosion of the phosphorus paradigm. Int. Rev. Hydrobiol. 93, 446–465.
Lewis Jr., W.M., Wurtsbaugh, W.A., Paerl, H.W., 2011. Rationale for control of anthropo-genic nitrogen and phosphorus to reduce eutrophication of inland waters. Environ.Sci. Technol. 45, 10300–10305.
LWSB (Lake Winnipeg Stewardship Board), 2006. Reducing Nutrient Loading to LakeWinnipeg and its Watershed—our Collective Responsibility and Commitment toAction, http://www.gov.mb.ca/waterstewardship/water_quality/lake_winnipeg/lwsb2007-12_final_rpt.pdf (Accessed 19 March 2012).
Magnuson, J.J., Assel, R.A., Bouser, C.J., Dillon, P.J., Eaton, J.G., Evans, H.E., Fee, E.J., Hall,R.I., Mortsch, L.R., Schindler, D.W., Quinn, F.H., Webster, K.H., 1997. Potential effectsof climate change on aquatic systems: Laurentian Great Lakes and Precambrianshield region. Hydrol. Process. 11, 825–872.
Mayer, T., Simpson, S.L., Thorleifson, L.H., Lockhart, W.L., Wilkinson, P., 2006. Phospho-rus geochemistry of recent sediments in the South Basin of Lake Winnipeg. Aquat.Ecosyst. Health Manage. 9, 307–318.
McCullough, G.K., Page, S., Hesslein, R.H., Stainton, M.P., Kling, H.J., Salki, A., Barber, D.G.,2012. Hydrological forcing of a recent trophic surge in Lake Winnipeg. J. Great LakesRes. 38 (Suppl. 3), 95–105.
Mugidde, R., Hecky, R.E., Hendzel, L., Taylor, W.D., 2003. Pelagic nitrogen fixation inLake Victoria, Uganda. J. Great Lakes Res. 29, 76–88.
Novotny, E.V., Stefan, H.G., 2007. Stream flow in Minnesota: indicator of climatechange. J. Hydrol. 334, 319–333.
Paerl, H.W., Xu, H., McCarthy, M.J., Zhu, G., Qin, B., Li, Y., Gardner, W.S., 2011. Controllingharmful cyanobacterial blooms in a hyper-eutrophic lake (Lake Taihu, China): theneed for a dual nutrient (N & P) management strategy. Water Res. 45, 1973–1983.
Patalas, K., Salki, A., 1992. Crustacean plankton in Lake Winnipeg: variation in spaceand time as a function of lake morphology, geology, and climate. Can. J. Fish.Aquat. Sci. 49, 1035–1059.
Paterson, M.J., Schindler, D.W., Hecky, R.E., Findlay, D.L., Rondeau, K.J., 2011. Comment:Lake 227 shows clearly that controlling inputs of nitrogen will not reduce or pre-vent eutrophication of lakes. Limnol. Oceanogr. 56, 1545–1547.
Ricciardi, A., MacIsaac, H.J., 2000. Recent mass invasion of the North American GreatLakes by Ponto-Caspian species. Tree 15, 62–65.
Salvano, E., Flaten, D.N., Rousseau, A.N., Quilbe, R., 2009. Are current phosphorus riskindicators useful to predict the quality of surface waters in southern Manitoba,Canada? J. Environ. Qual. 38, 2096–2105.
Schindler, D.W., 1977. Evolution of phosphorus limitation in lakes: natural mecha-nisms compensate for deficiencies of nitrogen and carbon in eutrophied lakes. Sci-ence 195, 260–262.
Schindler, D.W., in review. The dilemma of controlling cultural eutrophication. Proc.Roy. Soc. B.
Schindler, D.W., Donahue, W.F., 2006. An impending water crisis in Canada's westernprairie provinces. Proc. Natl. Acad. Sci. 103, 7210–7216.
Schindler, D.W., Vallentyne, J.R., 2008. The Algal Bowl: Overfertilization of the World'sLakes and Estuaries. University of Alberta Press, Edmonton.
Schindler, D.W., Hesslein, R.H., Turner, M.A., 1987. Exchange of nutrients between sed-iments and water after 15 years of experimental eutrophication. Can. J. Fish. Aquat.Sci. 44 (Suppl. 1), 26–33.
Schindler, D.W., Hecky, R.E., Findlay, D.L., Stainton, M.P., Parker, B.R., Paterson, M.,Beaty, K.G., Lyng, M., Kasian, S.E.M., 2008a. Eutrophication of lakes cannot be con-trolled by reducing nitrogen input: results of a 37 year whole ecosystem experi-ment. Proc. Natl. Acad. Sci. 105, 11254–11258.
Schindler, D.W., Wolfe, A.P., Vinebrooke, R., Crowe, A., Blais, J.M., Miskimmin, B., Freed,R., Perren, B., 2008b. The cultural eutrophication of Lac la Biche: a paleoecologicalstudy. Can. J. Fish. Aquat. Sci. 65, 2211–2223.
Scott, J.T., McCarthy, M.J., 2010. Nitrogen fixation may not balance the nitrogen pool inlakes over timescales relevant to eutrophication management. Limnol. Oceanogr.55, 1265–1270.
Scott, J.T., McCarthy, M.J., 2011. Response to comment: nitrogen fixation has not offsetdeclines in the Lake 227 nitrogen pool and shows that nitrogen control deservesconsideration in aquatic ecosystems. Limnol. Oceanogr. 56, 1548–1550.
Sheppard, K.T., Olynyk, A.J., Davoren, G.K., Hann, B.J., 2012. Summer diet analysis of theinvasive rainbow smelt (Osmerus mordax) in Lake Winnipeg, Manitoba. J. GreatLakes Res. 38 (Suppl. 3), 66–71.
Shrestha, R.R., Dibike, Y.B., Prowse, T.D., 2012. Modelling of climate-induced hydro-logic changes in the Lake Winnipeg watershed. J. Great Lakes Res. 38 (Suppl. 3),83–94.
Smith, V.H., 1983. Low nitrogen to phosphorus ratios favor dominance by blue-greenalgae in lake phytoplankton. Science 221, 669–670.
Stich, H.H., Brinker, A., 2010. Oligotrophication outweighs effects of global warming ina large, deep, stratified lake ecosystem. Glob. Chang. Biol. 16, 877–888.
Tiessen, K.H.D., Elliott, J.A., Yarotski, J., Lobb, D.A., Flaten, D.N., Glozier, N.E., 2010. Con-ventional and conservation tillage: Influence on seasonal runoff, sediment, and nu-trient losses in the Canadian prairies. J. Environ. Qual. 39, 964-698.
Vander Zanden, M.J., Vadeboncoeur, Y., Diebel, M.W., Jeppesen, E., 2005. Primary con-sumer stable nitrogen isotopes as indicators of nutrient source. Environ. Sci.Technol. 39, 7509–7515.
Vitousek, P.M., Porder, S., Houlton, B.Z., Chadwick, O.A., 2010. Terrestrial phosphoruslimitation: mechanisms, implications, and nitrogen–phosphorus interactions.Ecol. Appl. 20, 5–15.
Wassenaar, L.I., 2012. Dissolved oxygen status of LakeWinnipeg: spatio-temporal and isoto-pic (δ18O–O2) patterns. J. Great Lakes Res. 38 (Suppl. 3), 123–134.
Welch, E.B., 2009. Should nitrogen be reduced to manage eutrophication if it is growthlimiting? Evidence from Moses Lake. Lake Reservoir Manage. 25, 401–409.
Yates, A.G., Culp, J.M., Chambers, P.A., 2012. Estimating nutrient production fromhuman activities in subcatchments of the Red River, Manitoba. J. Great Lakes Res.38 (Suppl. 3), 106–114.
Zhang,W., Rao, Y.R., 2012. Application of a eutrophicationmodel for assessingwater qual-ity in Lake Winnipeg. J. Great Lakes Res. 38 (Suppl. 3), 158–173.
Zhao, J., Rao, Y.R., Wassenaar, L.I., 2012. Numerical modeling of hydrodynamics andtracer dispersion during ice-free period in Lake Winnipeg. J. Great Lakes Res. 38(Suppl. 3), 147–157.