Embed Size (px)
Citation preview
International Journal of
Environmental Research
and Public Health
Article
The Quality of Work Index and the Quality ofEmployment Index: A Multidimensional Approach ofJob Quality and Its Links to Well-Being at Work
Georges Steffgen * , Philipp E. Sischka and Martha Fernandez de Henestrosa
Department of Behavioural and Cognitive Sciences, Institute for Health and Behavior, University of Luxembourg,L-4366 Esch-sur-Alzette, Luxembourg; [email protected] (P.E.S.); [email protected] (M.F.d.H.)* Correspondence: [email protected]; Tel.: +352-46-66-44-6644
Received: 3 September 2020; Accepted: 22 October 2020; Published: 23 October 2020�����������������
Abstract: (1) Background: Job quality is a multidimensional and elusive concept that is back in vogueamong social scientists and policymaker. The current study proposes a new job quality approach that iscompared with the European Working Conditions Survey framework and structured with the help ofthe Job Demands-Resources model. Two new measures of job quality, the Quality of Work Index (QoW)and the Quality of Employment Index (QoE) are developed and validated in three different languages(German, French, Luxembourgish). The QoW is composed of 43 items, focusing on four areas ofwork—work intensity, job design, social conditions, and physical conditions (subdivided in elevencomponents)—which are particularly important for employees’ well-being. The QoE is composed of13 items that cover training opportunities, career advancement, job security, employability, work lifeconflict, and income satisfaction. (2) Methods: Data were collected via computer-assisted telephoneinterviews in a representative sample of 1522 employees working in Luxembourg (aged 17–67 years;57.2% male). (3) Results: Confirmatory factor analysis confirmed the proposed factors structure andscalar measurement invariance for the three different language versions. Internal consistencies weresatisfactory for all subscales (Cronbach’s α between 0.70 and 0.87). Correlations and hierarchicalregression analyses with different psychological health measures (i.e., burnout, general well-being,psychosomatic complaints, work satisfaction, vigor) and subjective work performance confirmedthe construct validity of the new instruments. (4) Conclusions: The QoW and the QoE are globallyand on the level of the sub-categories effective tools to measure job quality, which could be used tocompare job quality between organizations and different countries. Furthermore, the current studyconfirms associations between the different components of the QoW and QoE and employees’ health.
Keywords: quality of work index; quality of employment; well-being; indicators; composite index
1. Introduction
In recent decades, the labor market has undergone many changes that were shaped by digitalization,delocalization of production and an increase of non-permanent and part-time work. These changeshad also an influence on the working conditions and well-being of employees. The European Unionhas drawn up different directives (e.g., Europe 2020) that are intended to foster high quality jobs andpromote a qualified and healthy labor force that can deal with these new labor market challenges [1–4].In order to monitor these labor market changes and their effects on working conditions and well-being ofemployees and to evaluate the effectiveness of policy interventions it is necessary to develop job qualityindicators that also contain psychosocial working conditions indicators. As recent job quality indicatorsmainly focused on economic aspects [5], there is a need for a new job quality approach. To capture jobquality a multidimensional approach is necessary [5–8]. Governments regulate conditions affecting job
Int. J. Environ. Res. Public Health 2020, 17, 7771; doi:10.3390/ijerph17217771 www.mdpi.com/journal/ijerph
Int. J. Environ. Res. Public Health 2020, 17, 7771 2 of 31
quality (health and safety, extension of the work week, paid vacations, etc.) for decades. Improving ourknowledge about the dimensions of job quality and integrating what is known in a unified approachseems to be a task well worth to be done [8]. Amongst others it is important to have reliable and validindicators of job quality.
In the following, we will discuss different job quality approaches with the distinction betweenquality of work and quality of employment, mainly based on the current research in social sciences onjob quality. With the help of empirical data, we will present two new measures that cover quality ofwork and quality of employment. The different components of the Quality of Work Index (QoW) andthe Quality of Employment Index (QoE), with its links to different aspects of well-being and health atwork will be investigated. In this way, we follow recent calls to reinvigorate the quality of working liferesearch [9].
1.1. Definition and Conceptualization of Job Quality, Quality of Work, and Quality of Employment
There exists no accepted definition of job quality in the scientific literature [8,10,11]. However,many social scientists agree that job quality refers to every aspect of the job that is related to thewell-being of the employees. Therefore, job quality can be seen as a multidimensional and elusiveconcept [8]. Perhaps because of this inherent multidimensionality and elusiveness, there are multipleand relatively diffuse concepts that have been developed in parallel and that tap into the domain of jobquality, such as quality of working life, decent work, employment quality, and quality of work [9–17].To make things even more complicated, authors (from different disciplines) referring to the sameconcept often mean different things (e.g., employment quality [10,13]) and some authors seem to use afew terms interchangeably [12,14,15]. Moreover, different approaches for conceptualizing job qualityare documented in the literature [8,11,15]. A first approach proposes to use job satisfaction reported byemployees, due to the difficulty of identifying all the aspects affecting job quality and their relativeimportance. This approach has some important limitations, for instance job satisfaction represents therelationship between the job quality of an employee’s present job and the employee’s idea of what canbe reasonably be expected from a job. Thus, employees may get used to poor working conditions and,therefore, have a higher level of job satisfaction compared to employees with better working conditionsbut also higher expectations regarding their job [10]. Moreover, job satisfaction provides no informationon specific working conditions, limiting its use for policy purposes [8]. Thus, job satisfaction is oftenused as one of other criteria to test the constructed job quality instrument [7]. A second approachuses employees’ surveys to select the components of job quality considered important by themselves.This approach has also some important drawbacks, for instance if employees select different workingconditions as being important, comparability can be seriously affected [8,10]. Moreover, employees’opinion might be conditioned by their current jobs. Therefore, this approach might be useful to identifyworking conditions that are particularly relevant for a certain working sector, however, it cannot be thesole base to generate a global job quality index. Finally, the third approach considers the theoreticalwork of social scientists (e.g., economists, sociologists, psychologists) on job quality as a route map toselect the relevant dimensions [8]. However, there are different foci between different social sciencedisciplines. While economists emphasize the importance of employment conditions (e.g., wages,career advancement), sociologists and psychologists tend to focus on non-economic work factors suchas intrinsically meaningful or challenging work, and in particular on the ‘goodness’ of work whenconsidering job quality [7,8]. These different approaches resulted in a plethora of initiatives aiming atmeasuring job quality [8,16,17]. Munoz de Bustillo et al. and others [8,13] decompose job quality intotwo broad areas: quality of work and quality of employment. Quality of work refers to the ways andconditions under which the activity of work can affect the well-being of employees, often focusing onthe job content, the work conditions and environment. Quality of employment describes all aspects ofa job that are related to the employment relation (e.g., career advancement, work life balance [8]).
Int. J. Environ. Res. Public Health 2020, 17, 7771 3 of 31
1.2. Approaches to Measure Job Quality
1.2.1. Existing Job Quality Indicators
Muñoz de Bustillo and colleagues [8,18,19] and others [20] presented overviews of the majorinternational frameworks on job quality indicators. They showed that these different indicatorsare designed based on different research tradition and from scientists from different disciplines(e.g., Sociology, Political Science, Economics), and are, thus, quite diverse. They vary regarding thenumber of indicators (from six to over one hundred) [21,22], the focus of the indicators (work quality,employment quality) [23–25], the design (cross-sectional, longitudinal) [21,26–28]. Further, Muñozde Bustillo et al. [19], as well as Cazes et al. [20] presented a more extensive summary of the majornational and international frameworks, for example from the European Commission [29], UNICE [30],Leschke et al. (ETUI) [23], EMCO [31], ILO [32], Eurofound [4,33], and UNECE [34]. These differentframeworks apprehend 4–11 different areas, where the nature of the indicators is mostly objectivewith only few self-reported, subjective indicators. Often a composite index is not available. Thus,most of these frameworks cover multiple dimensions and rely on numerous indicators of differentnature. Additionally, different national initiatives, as for example l’Enquête Conditions de Travailof the French Ministry of Labour, the National Working Condition Survey (NES) in the Netherlandsand the Belgian Four-A model [35] show the same problems [20,36]. Additionally, different Europeansurveys providing information on job quality (European Social Survey; International Social SurveyProgramme; Eurobarometer; Gallup Work Poll; European Quality of Life Survey; EU-LFS AHMs;see [20]) comprise mainly the same components. These components are used by different researchersto define specific indices using the same data set but choosing and analyzing different dimensions orvariables of one or more surveys [19,24].
Moreover, many authors have emphasized the outstanding role of the European WorkingConditions Survey (EWCS) and its indicators in the context of job quality research [8,19,37]. In the 6thwave of the EWCS Eurofound [33] defined job quality as composition of seven dimensions, representinglargely the most important job aspects for well-being of the employees: (1) work intensity (quantitativedemands, pace determinants and interdependency, emotional demands), (2) working time quality(duration, atypical working time, working time arrangements, flexibility), (3) physical environment(posture related, ambient, biological, and chemical), (4) social environment (adverse social behavior,social support, management quality), (5) skills and discretion (cognitive dimensions, decision latitude,organizational participation, training), (6) prospects (employment status, career prospects, job security,downsizing) and (7) earnings. From a conceptual perspective, the EWCS is the most convincing andextensive concept. The conceptual framework of the EWCS aims to cover a maximum of areas andindicators of job quality identified in research. The dimensions were selected based on their provenimpact on health and well-being of employees [33].
1.2.2. Limitations of Existing Job Quality Indicators
As documented in this overview there exists a multitude of conceptualizations and approaches tomeasure job quality. However, up to now there is still no general agreement about the dimensionsor the measurement of the single dimensions of job quality. Muñoz de Bustillo et al. [8,18,19] notedsome limitations of the previous job quality indicators. Some of them mixed job quality and labormarket indicators in a global measure that might lead to misinterpretations. Furthermore, they notedthat certain working conditions that had been identified as important determinants of employee’swell-being (e.g., work intensity/time pressure) are not assessed in most of their reviewed indicators.Moreover, some indices mix job components with possible outcomes, e.g., job satisfaction. Additionally,as job quality is often not clearly defined, the aim of a job quality index is also often not clearly stated.For instance, does it include working conditions that are mainly related to employees’ performance orworking conditions that are mainly related to well-being?

Int. J. Environ. Res. Public Health 2020, 17, 7771 4 of 31
However, besides the conceptual issues of many job quality instruments mentioned in theoverviews, additional problems of these instruments may be pointed out that in part also apply to theEWCS [16]. First, many job quality questionnaires have been developed relatively atheoretically, thus,restricting theoretical progress. Second, many of these questionnaires are lacking profound tests ofpsychometric properties (e.g., test of factor structure or criterion validity). Moreover, Piasna et al. [16](p. 176) emphasized that “(i) n the literature on job quality, there has been little discussion of the mosteconomical or ‘short-form’ way to measure it on a large scale”. Third, most of these instruments werenot tested for measurement invariance across different language versions, a required condition to allowfor meaningful comparisons across different language contexts [38].
The discussion of the existing job quality indicators has revealed that despite the current availabilityof several indices of job quality, there is still a need of a worker-oriented, individually constructedand theoretically grounded job quality indicator with measurement invariant language versions thatadapts the conceptual framework of the EWCS in order to measure and monitor the evolution of jobquality [8,18]. Thus, the aim of the current study was to develop two new job quality indices thatfulfil these criteria. As psychosocial working conditions play an important role regarding well-being,job quality approaches should also consider work psychology theories and studies that emphasizethe importance of psychosocial working conditions. For instance, Humphrey et al. [39] employed ameta-analysis to test the influence of different working characteristics on well-being (anxiety, stress,burnout, overload) amongst others. They found that motivational characteristics (e.g., skill variety),social characteristics (e.g., social support) and work context characteristics (e.g., physical demands)explained a substantial amount of variance in different well-being dimensions (R2 between 0.20and 0.64).
1.3. A New Job Quality Approach
1.3.1. Theoretical Foundation
In work psychology there exists a multitude of theories that try to explain the link betweenworking conditions and different well-being dimensions. However, many of them include only arestricted number of working conditions, such as the job demand control model [40] that only includeswork overload and autonomy, although it was later expanded to also include social support [41].The job demands resources (JD-R) model [42] on the other hand does not limit its focus on specificworking conditions [42]. It divides work characteristics into two broad categories, i.e., job demands andjob resources [42,43]. Job demands refer to all “physical, psychological, social, or organizational aspectsof the job that require sustained physical and/or psychological (cognitive and emotional) effort orskills” [42] (p. 312) and are, thus, related with psychological and/or physiological costs. Job resources,on the other hand, refer to all physical, psychological, social, or organizational aspects of the jobthat reduce job demands and/or their related psychological/physiological costs, stimulate learning,development and personal growth, are functional to achieve work goals [42,43]. Therefore, resources arenot only needed to deal with job demands, but also valued in their own right, as they allow employeesto achieve or protect other resources [42]. In addition, they can be located at four different levels:(a) organization at a large level (e.g., career opportunities), (b) interpersonal level (e.g., supervisorand co-worker support), (c) organization of work (e.g., participation in decision making), and (d)organization of task (e.g., performance feedback) [44]. The JD–R model makes predictions aboutpositive and negative health outcomes based on certain job characteristics. Moreover, model proposesthat two distinct psychological process underlie the development of job strain and motivation [42,43].Whereas job demands are presumed to initiate a health-impairment process, thereby leading toemployees’ exhaustion and burnout, job resources are expected to have a motivational potential,leading to high work-engagement and increased performance (i.e., motivational process [42,43]).Previous research identified work-home interference, work overload, harassment, emotional demandsand physical demands as the most detrimental job demands, whereas relationship with supervisor,

Int. J. Environ. Res. Public Health 2020, 17, 7771 5 of 31
social support, feedback and autonomy have been found to be the most beneficial job resources interms of well-being [42,43,45,46]. Thus, a good system of job quality indicators should assess the mostimportant job demands and job resources that employees encounter at work.
1.3.2. Methodological Choices
A set of methodological choices that have been made prior to the process of the selection of thedimensions to be included in the indices will be presented first [19]. Thus, the modelling of the two jobquality indices (i.e., Quality of Work and Quality of Employment) were guided by the following criteria:
• The selection of working conditions is based on the theoretical and empirical work ofsocial scientists.
• The indicators are defined, constructed and anonymously computed at the individual level,• Only indicators that are relevant for all working sectors were included,• A composite index is created based on a system of aggregated indicators (on the basis of
equal weights),• The interference with the central, tailor-made concept EWCS [33] is given (see Table 1),• The collected data is based on self-assessments of employees (self-reported, mostly subjective),• The main job aspects contribute clearly and directly to employees’ well-being (outcome of
job quality),• The theoretically based differentiation between job demands and job resources is respected,• Only issues which are related to job quality (eliminating labor market access, the distribution of
disposable income, etc.) were considered.
Table 1. Areas and dimensions of the Quality of Work Index Luxembourg in comparison with jobquality (EWCS; Eurofound, 2016).
Job Quality (EWCS; Eurofound, 2016) QoW and QoE
Area Dimension Area Dimension
Skills and discretion
Cognitive dimensionDecision latitudeOrganizational participationTraining
Job design (resources)ParticipationFeedbackAutonomy
Work intensity
Quantitative demandsPace determinantsand interdependencyEmotional demands
Work intensity (demands)Mental demandsTime pressureEmotional demands
Social environmentAdverse social behaviorSocial supportManagement quality
Social conditionsSocial supportCompetitionMobbing
Physical environmentPosture relatedAmbientBiological & chemical
Physical conditions Physical burdenRisk of accident
Working time quality(objective)
DurationAtypical working timeWorking time arrangementsFlexibility
Working time index Items
Prospects
Employment statusCareer prospectsJob securityDownsizing
Quality of employment
Training opportunitiesCareer advancementJob securityEmployability
Earnings (objective) wages Income satisfaction
Int. J. Environ. Res. Public Health 2020, 17, 7771 6 of 31
The scientific literature was screened for job characteristics that (a) are in line with the most recentconceptualization of job quality, (b) affect employee’s well-being and/or health, and (c) are in linewith the assumptions of the JD-R model. This approach ensures that the instrument covers the mostimportant job characteristics that affect well-being and/or health while at the same time being concise.The development of the instrument was carried out in collaboration with experts from the LuxembourgChamber of Labor (see Appendix A Tables A1–A4 for all items).
1.3.3. Quality of Work
The QoW is compiled of four different areas of quality of work subdivided in two tothree dimensions:
(a) Job design (participation, feedback, autonomy);(b) Work intensity (mental demands, time pressure, emotional demands);(c) Social conditions (social support, competition, mobbing); and(d) Physical conditions (risk of accidents, physical burden).
The different dimensions of job design can be regarded as job resources. Participation refers tothe involvement of employees in decision-making processes. Previous research has shown that thisform of participation is linked with less role stress (e.g., role conflict, role ambiguity) [47], perceivedsupervisor and organizational support [48], job satisfaction, and skill use and skill enhancement [49].Feedback reflects the degree to which other organizational members (i.e., colleagues, supervisors)provide information about the work output. It has been meta-analytically linked with burnout andengagement [50]. Autonomy reflects if an employee has ample opportunities to do his/her workautonomous (i.e., decide when and how to do the work as well as the content and order of tasks).It is one of the most often researched job resources [51] and has been meta-analytically linked withburnout [52] and work engagement [53].
The different dimensions of work intensity are job demands that are also related to employee’swell-being. High mental demands can decrease well-being, when no recovery takes place [54]. It hasbeen linked with psychological ill health [55]. Time pressure has been meta-analytically linked toreduced well-being [56], also on a day-to-day level [57] and might also lead to a lack of psychologicaldetachment [58]. Emotional demands has been meta-analytically linked with reduced well-being andjob attitudes [59,60].
Additionally, a plethora of studies has shown that social conditions have a strong influence onemployee’s health, attitude and behavior. One of the most often studied condition is social support [51].Social support represents a job resource that reflects the degree to which an employee gets advice andassistance from others when needed. Social support has various effects of well-being as it reducesthe experienced strain, mitigates perceived stressors and buffers the stressor-strain relationship [61].In contrast, competition and mobbing can be seen as special job demands. Competition has been linkedto workaholism [62], and, thus, might also have an influence on employee’s well-being. Workplacemobbing refers to a situation, where the employee is being exposed to repeated negative and/orhostile acts from people at work that are experienced as annoying and difficult to defend against [63].Meta-analytical results showed various detrimental effects for the targeted employees’ well-being andwork-related attitudes and behavior [64].
Finally, physical conditions can be seen as job demands that are related to well-being and health.Risk of accidents and physical burden have been linked to well-being and physical health [65–67].
1.3.4. Quality of Employment
Different employment conditions (training opportunities, career advancement, job security,employability, work life conflict, income satisfaction) were measured to get an indicator of thequality of employment. Training opportunities have been linked with job satisfaction [68], increasedwork engagement [69], and reduced turnover intentions [70]. Career advancement has been linked

Int. J. Environ. Res. Public Health 2020, 17, 7771 7 of 31
with higher job satisfaction [71], higher affective commitment and higher work engagement [72],as well as reduced turnover [73]. Job insecurity has been meta-analytically linked to various negativeoutcomes [74]. Furthermore, employability is also linked to well-being [75]. Moreover, low worklife balance (i.e., work life conflict) has been found to be related with strain and poor psychologicalhealth [76,77]. Finally, income is an important concern for employees. However, what seems to be moreimportant for well-being and job satisfaction than income is satisfaction with income that is affectedby the discrepancy of income that employees think they should receive and their actual income [78].Indeed, research has shown that high income does not improve emotional well-being [79] and thatrank of income, not income per se, affects life satisfaction [80]. Therefore, income satisfaction can beseen as key contributor to job satisfaction [78].
1.3.5. Well-Being Dimensions
To validate the newly developed instrument we assessed different well-being and health measures,work satisfaction, vigor and subjective work performance. We used three measures of well-being andhealth that are interrelated but tap into different aspects of well-being. These are burnout, generalwell-being, and subjective physiological health problems. Burnout is a work-related well-beingconstruct that is related to several negative consequences (e.g., anxiety, depression, health problems)and is also associated with turnover intentions, organizational commitment, and work satisfaction [52].Job demands and resources have often been linked to burnout [52]. Furthermore, as work plays a centralrole in many employee’s life, job quality may also have an influence on the general well-being [81].Moreover, we included a measure of physiological health problems as job dimensions can also have aninfluence on physical health symptoms [82]. We also included work satisfaction that is sometimes usedas an overall indicator of job quality [8] and that is strongly interrelated with lateness, absenteeism,turnover, organizational commitment, performance, and well-being [83–85]. Additionally, we includedvigor that has been considered as direct opposite of the burnout subdimension of exhaustion [86]. Thus,we captured the full continuum of employee’s energy and mental resilience [87]. Finally, we assessed(subjective) work performance, to extend the nomological network of the new questionnaire.
2. Methods
2.1. Measures
The items of the QoW and QoE were mainly newly developed, but we also used some existingitems (e.g., [88]) or oriented us on existing questionnaires (e.g., the Work Design Questionnaire [89];Copenhagen Psychosocial Questionnaire [90]) and adapted the original wording to fit the context of aCATI survey better. During the development of the items, we followed several principals. We sought tocreate items that reflected the construct definition but were also distinct enough from other constructs.Furthermore, we choose response scales with only five answer categories to reduce cognitive demandsof the interviews [91]. Additionally, as our aim was to keep our instrument as short as possible, we onlydeveloped between two and five items for each scale. Short scales have the advantage to put lessburden on respondents [92] and give researchers the opportunity to assess more constructs [93]. Lately,many researchers have called for short scales to assess specific constructs for general survey researchand there are many examples for well-validated ultra-short scales [92].
2.1.1. Quality of Work Index
Unless specified, a five-point Likert response format ranging from 1 (= to a very low extent) to5 (= to a very large extent) was used. The area job design contained three dimensions. Participationwas measured by two items reflecting if an employee has ample opportunities to be involved in thedecision-making process. Feedback was measured by two items reflecting if an employee receivesfeedback from his/her superior and colleagues. Autonomy was measured by four items reflecting if anemployee has ample opportunities to do his/her work autonomously/or in an autonomous manner.

Int. J. Environ. Res. Public Health 2020, 17, 7771 8 of 31
The area work intensity also included three dimensions. Mental demands was measured by twoitems reflecting if an employee is doing intellectually demanding work. Time pressure was measuredby two items asking if work is done under pressure. Emotional demands was measured by twoitems reflecting if an employee is doing emotionally demanding work. For the items measuring timepressure and emotional demands a five-point Likert scale ranging from 1 (= never) to 5 (= (almost)always) was applied.
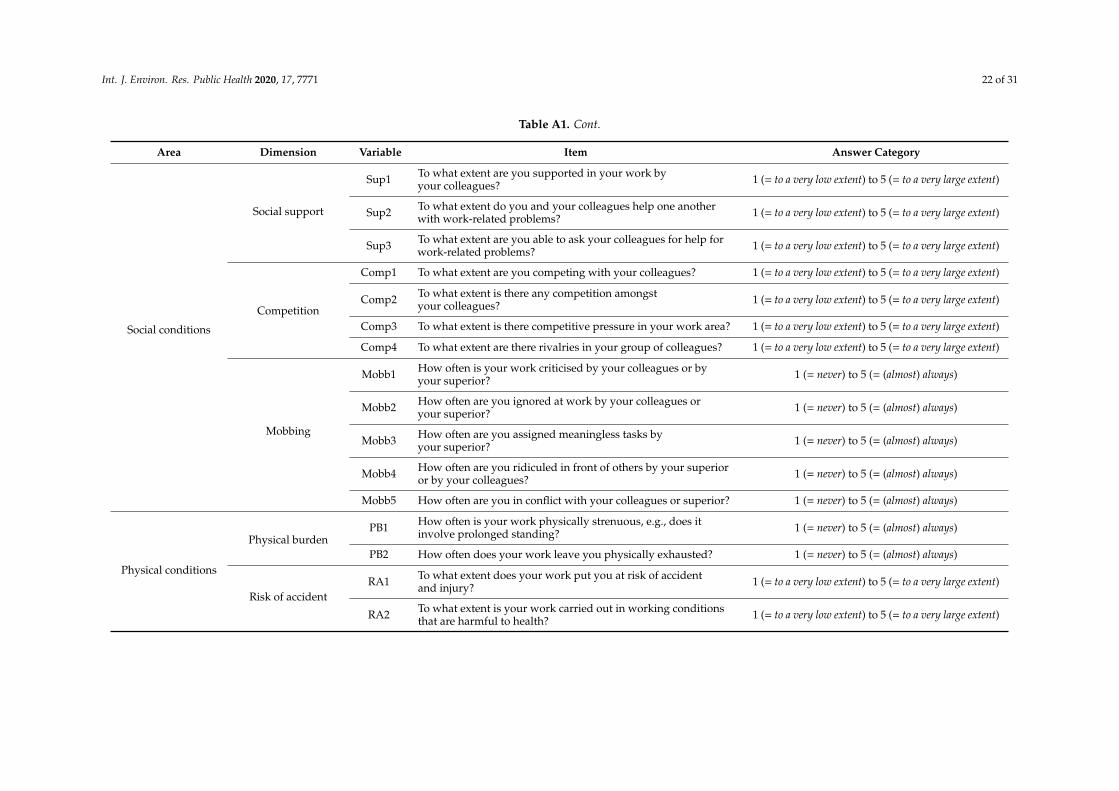
The area social conditions also comprised three dimensions. Social support was assessed bythree items measuring if an employee gets social support from others at work. Competition wasassessed by four items measuring if an employee competes with others at work. Mobbing was assessedwith the Luxembourg Workplace Mobbing Scale (LWMS) [94,95] that contains five items (“criticized”,“ignored”, “absurd duties”, “ridiculed”, “conflicts”). Employees were asked to indicate how often theyencounter each situation on a five-point Likert scale, ranging from 1 (= never) to 5 (= (almost) always).
The area physical conditions consisted of two dimensions. Physical burden was measured bytwo items asking if employees are confronted with physical burden. More specifically, participantswere asked to indicate the degree to which each item applied to them on a five-point Likert scale,ranging from 1 (= never) to 5 (= (almost) always). Risk of accident was measured by two items asking ifemployees are confronted with a risk of accident at the workplace.
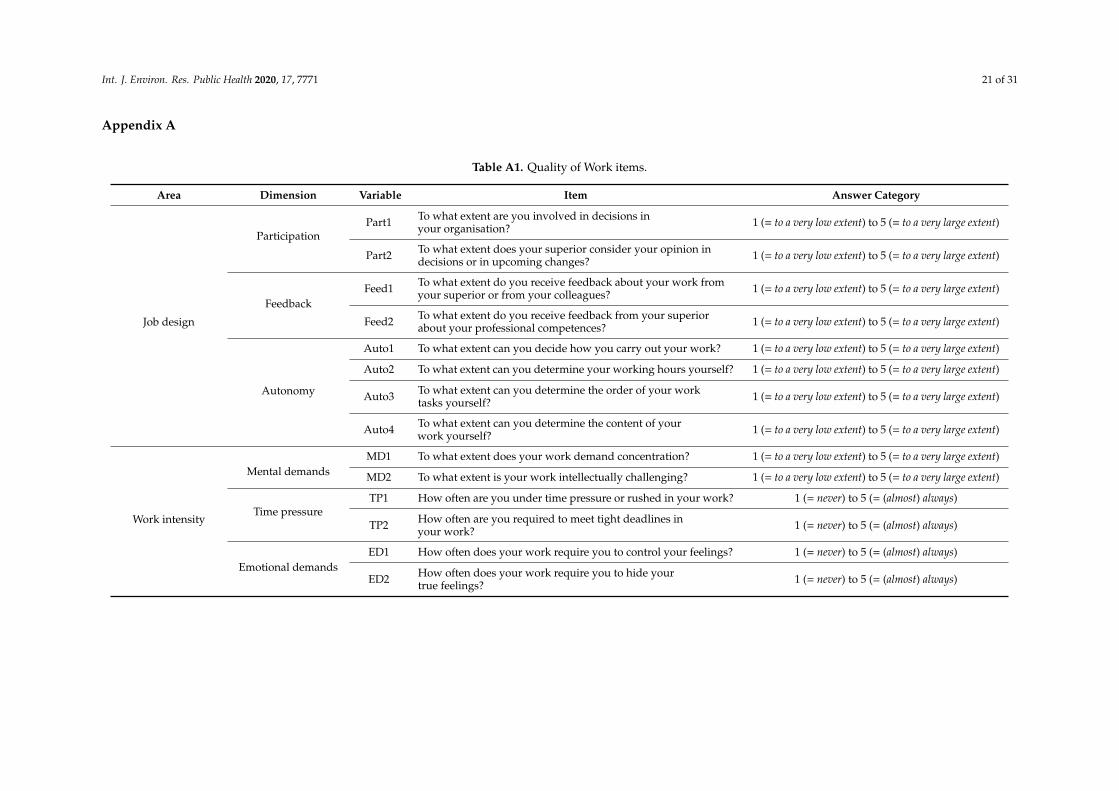
To calculate the QoW, the scales mental demands, time pressure, emotional demands, competition,mobbing, physical burden and risk of accident were recoded so that higher levels correspond to morefavorable working conditions (e.g., less mobbing exposure). The QoW is then created by calculatingthe mean of each eleven scales. All QoW items can be found in Table A1 in the Appendix A.
2.1.2. Quality of Employment Index
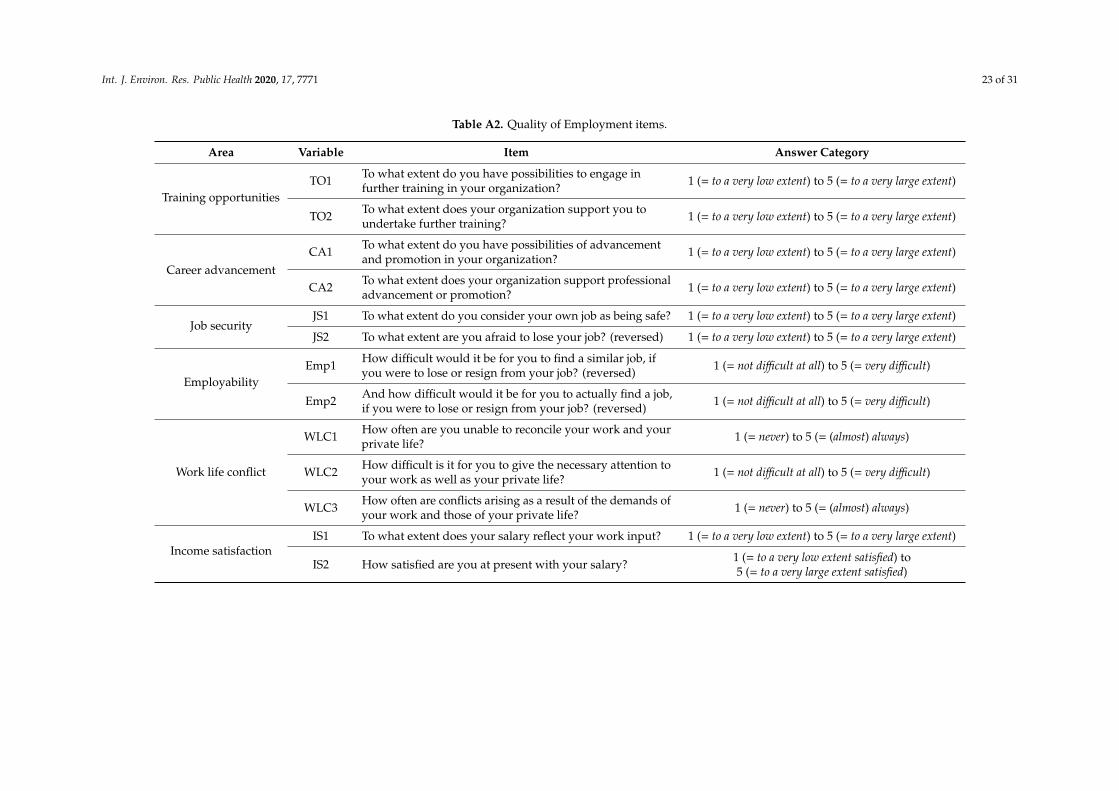
Again, unless specified, a five-point Likert response format ranging from 1 (= to a very low extent)to 5 (= to a very large extent) was used. Training opportunities was measured by two items askingif employees are involved in formation. Career advancement was measured by two items asking ifemployees are getting promoted by the employer. Job security was measured by two items asking theextent to which employees consider their job to be safe. Employability was measured by two items.Participants were asked to indicate on a five-point Likert scale how difficult they would considerfinding a new job (1 = not difficult at all, 5 = very difficult). Work life conflict was measured by threeitems (1 = never/not difficult at all, 5 = (almost) always/very difficult). Finally, income satisfaction wasmeasured by two items asking if employees are satisfied with their income (1 = to a very low extentsatisfied, 5 = to a very large extent satisfied).
We also calculated a Quality of Employment index (QoE). The scale work life conflict was recodedso that higher levels correspond to less experienced work life conflicts. The QoE is then created bycalculating the mean of each six scales. The QoE items can be found in Table A2 in the Appendix A.
2.1.3. Long Work Week and Atypical Working Hours
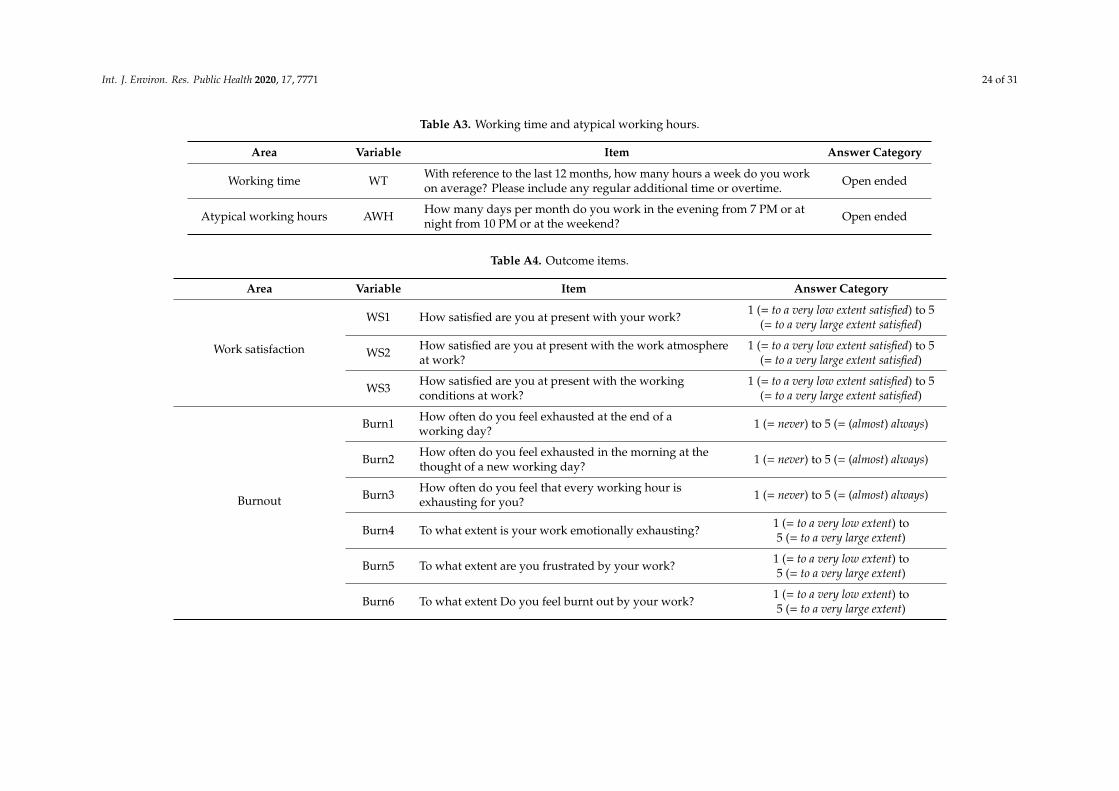
Working hours per week and atypical working hours were assessed with two open-endedquestions. We used the cutoff criteria from the EWCS and coded employees, which worked 48 or morehours per week, as having a long work week (=1) and employees, which worked 47 or less hours perweek, as not having a long work week (=0). Furthermore, if an employee stated that (s)he workedmore than four days a month in the evening, at night, or at the weekend (s)he is coded as havingatypical working hours (=1) and 0 otherwise (see Appendix A Table A3).
2.1.4. Well-Being Dimensions
In order to investigate whether the quality of work and quality of employment dimensions canbe used to predict employees work satisfaction, well-being and performance, we applied differentoutcome measures. In line with previous research, we focused on three well-being dimensions: burnout,general well-being and subjective physiological health problems. Performance measures comprised

Int. J. Environ. Res. Public Health 2020, 17, 7771 9 of 31
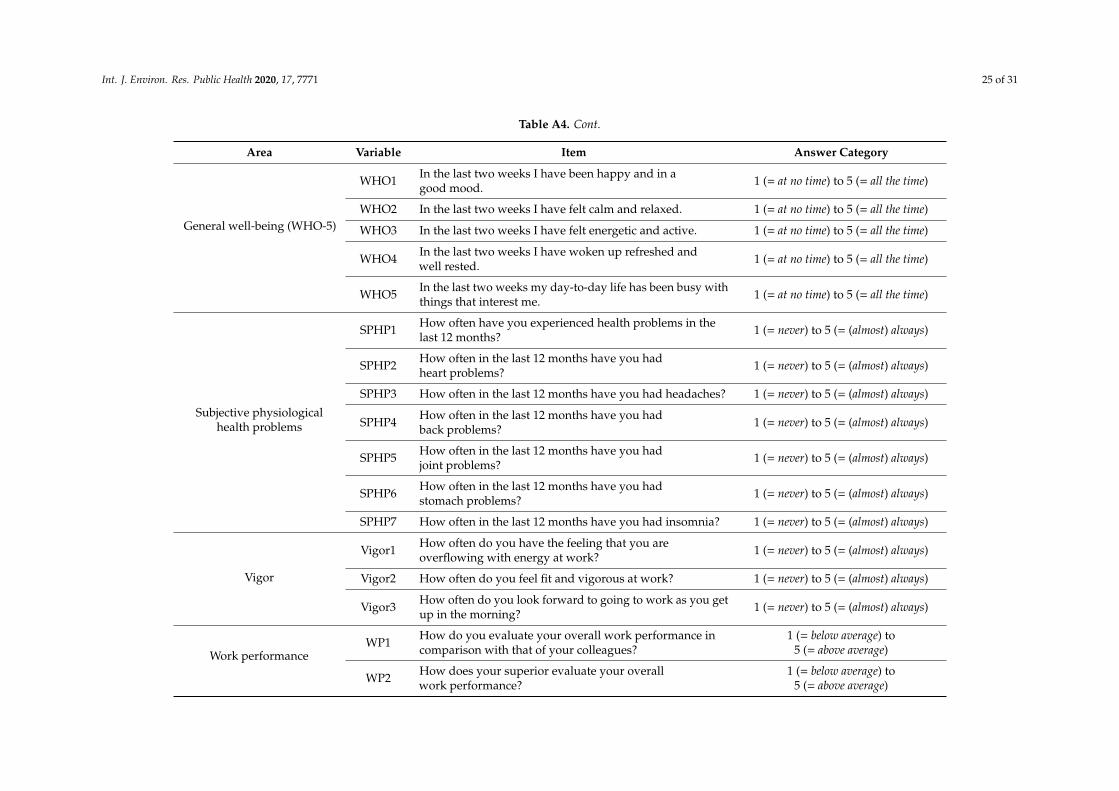
vigor and subjective work performance. The respective items are included in the Appendix A Table A4.The three-item work satisfaction scale assessed global judgment of work satisfaction, as well asemployee’s satisfaction with important work characteristics, such as work climate and workingconditions. The response scale was a five-point Likert scale ranging from 1 (= to a very low extentsatisfied) to 5 (= to a very large extent satisfied). Burnout was assessed with six items of the work-relatedburnout subscale of the Copenhagen Burnout Inventory [96]. This subscale taps into the domain ofwork-related emotional exhaustion [96]. The response scale was a five-point Likert scale rangingfrom 1 (= never/to a very low extent) to 5 (= (almost) always/to a very large extent). We assessed generalwell-being with the WHO-5 wellbeing index, a well-validated, brief, general index of subjectivepsychological well-being [97–99]. The response format ranged from 1 (= at no time) to 6 (= all thetime). Subjective physiological health problems were assessed with a seven-item index (i.e., generalhealth problems, headaches, heart problems, back problems, joint problems, stomach pain, sleepingproblems). The response scale ranged from 1 (= never) to 5 (= (almost) always). Vigor was assessedwith the three-item subscale of the short Utrecht Work Engagement Scale (UWES-9) [86]. Vigor wasincluded as it represents the direct opposite of the core burnout dimension of exhaustion [86] that isassessed with the Copenhagen Burnout Inventory [96]. The response format ranged from 1 (= never)to 5 (= (almost) always). Finally, subjective work performance was assessed with a two-item scale.The response format ranged from 1 (= never) to 5 (= (almost) always).
2.2. Translation Process
The questionnaire was developed in three languages (Luxembourgish, French, Germany). First,the items were developed in Luxembourgish by two native speakers, who were also proficient in Frenchand in German (i.e., trilinguals). In a second step, they created the French and the German versionsfrom the original Luxembourgish items. With this approach, we followed several recommendationsoutlining the importance of taking into account the cultural context during the translation process [100].Likewise, our aim was to avoid, biases a single translator might have introduced [101]. After theinitial translation the questionnaire was tested for comprehension and semantic meaning by five nativespeakers (in each language). They discussed and refined the translation and generated the final versionof the questionnaire.
2.3. Data Collection Procedure
In a next step, the questionnaire was tested in a representative sample of employees working inLuxembourg. Data for the present research were entailed via computer-assisted telephone interviews(CATI) in 2017. A dual-frame approach of landline and mobile phone numbers [102] were usedto contact employees working in Luxembourg (i.e., Luxembourgish residents and commuters fromFrance, Belgium and Germany). The survey was conducted according to the Declaration of Helsinki(i.e., voluntary participation, participants were free to withdraw their consent at any time throughoutthe interviews without negative consequences for them). All data reported in the present research arecross-sectional. This project was implemented by the University of Luxembourg in collaboration withthe Luxembourg Chamber of Labor [103].
2.4. Sample
The sample consisted of 1522 employees working in Luxembourg. Included were Luxembourgresidents (60.0%, n = 913) and commuters from France (19.8%, n = 301), Belgium (10.4%, n = 159),and Germany (9.8%; n = 149), who received wages for work with at least 10 h of work per week.People doing unpaid voluntary work or internships were excluded from the sample. The sampleis representative in terms of employees’ state of residency in Luxembourg. About 43.5% (n = 662)answered the Luxembourgish, 42.6% (n = 649) the French and 11.3% (n = 172) the German version ofthe questionnaire. The interviewees’ age ranged from 17 to 67 years (M = 46.2, SD = 9.0). About 37.3%(n = 567) of participants had an academic degree. Most participants worked as professionals (28.3%,

Int. J. Environ. Res. Public Health 2020, 17, 7771 10 of 31
n = 426) followed by technicians and associate professionals (25.0%, n = 377), clerical support workers(12.4%, n = 186), craft and related trades workers (10.0%, n = 151), service and sales workers (9.7%,n = 146), managers (5.0%, n = 75), plant and machine operators (4.3%, n = 64), elementary occupations(4.3%, n = 64), skilled agricultural, forestry and fishery workers (0.9%, n = 14), and armed forcesoccupations (0.1%, n = 2). Table 2 shows the sample characteristics differentiated for the languageversions. While the subsamples have similar characteristics to the total sample, there are somedifferences. As expected, there are differences regarding the nationalities of the employees who havechosen to answer the different language versions of the questionnaire.
Table 2. Sample characteristics.
n (%) TotalLanguage Version
DifferencesLuxembourgish French German
Gender Men 871 (57.2) 340 (51.4) 399 (61.5) 106 (61.6)χ2
(2) = 15.406 **Women 651 (42.8) 322 (48.6) 250 (38.5) 66 (38.4)
Age M (SD) 46.2 (9.0) 45.8 (9.7) 46.3 (8.4) 47.5 (8.4) F(1, 1481) = 4.801 *
Nationality
Luxembourgish 606 (39.9) 580 (87.7) 20 (3.1) 6 (3.5)
χ2(8) = 2332.5 ***
French 372 (24.5) 18 (2.7) 352 (54.3) 2 (1.2)
German 156 (10.3) 4 (0.6) 1 (0.2) 151 (87.8)
Belgian 185 (12.2) 12 (1.8) 166 (25.6) 7 (4.1)
Other 201 (13.2) 47 (7.1) 109 (16.8) 6 (3.5)
Residence
Luxembourg 913 (60) 643 (97.1) 209 (32.2) 24 (14)
χ2(6) = 1781.6 ***
France 301 (19.8) 12 (1.8) 289 (44.5) 0 (0)
Germany 149 (9.8) 0 (0) 7 (1.1) 140 (81.4)
Belgium 159 (10.4) 7 (1.1) 144 (22.2) 8 (4.7)
Education
ISCED 1 46 (3) 13 (2) 29 (4.5) 2 (1.2)
χ2(14) = 49.895 ***
ISCED 2 142 (9.4) 68 (10.3) 50 (7.7) 11 (6.4)
ISCED 3 549 (36.2) 279 (42.4) 201 (31) 65 (37.8)
ISCED 4 106 (7) 45 (6.8) 43 (6.6) 16 (9.3)
ISCED 5 108 (7.1) 34 (5.2) 57 (8.8) 15 (8.7)
ISCED 6 236 (15.5) 105 (16) 110 (16.9) 16 (9.3)
ISCED 7 303 (20) 101 (15.3) 148 (22.8) 43 (25)
ISCED 8 28 (1.8) 13 (2) 11 (1.7) 4 (2.3)
Work sector (Isco-08)
Armed forces 2 (0.1) 2 (0.3) 0 (0) 0 (0)
χ2(18) = 62.008 ***
Managers 75 (5) 30 (4.6) 36 (5.6) 6 (3.5)
Professional 426 (28.3) 184 (28.2) 179 (27.8) 52 (30.2)
Technicians 377 (25) 189 (28.9) 134 (20.8) 48 (27.9)
Clerical support worker 186 (12.4) 95 (14.5) 70 (10.9) 21 (12.2)
Service and sales 146 (9.7) 62 (9.5) 66 (10.3) 15 (8.7)
Agricultural 14 (0.9) 10 (1.5) 3 (0.5) 1 (0.6)
Craft and relatedtrades workers 151 (10) 47 (7.2) 73 (11.4) 25 (14.5)
Plant andmachine operators 64 (4.3) 16 (2.5) 42 (6.5) 2 (1.2)
Elementary occupations 64 (4.3) 18 (2.8) 40 (6.2) 2 (1.2)
* p < 0.05, ** p < 0.01, *** p < 0.001.
2.5. Statistical Analyses
At first, the item characteristics (mean, standard deviation, skewness, kurtosis, percent missing)were analyzed. For further analyses (except for the confirmatory factor analysis), multiple imputation(with five imputed datasets) with predictive mean matching [104] was used to account for missingvalues. Parcel summaries of scales [105] and all other analysis variables were included in the imputation

Int. J. Environ. Res. Public Health 2020, 17, 7771 11 of 31
model with the assumption that missing values are missing at random. Analyses run on each imputeddataset were pooled according to Rubin’s rules [106] and the D1 (multivariate Wald test) statistic wasused for multi-parameter inference [104]. Given that the indicators’ multivariate distribution has astrong influence on confirmatory factor analyses’ (CFAs) estimation results, we calculated Mardia’smultivariate skewness and kurtosis. Subsequently, the factorial structure of the scales was tested withCFA. The measurement model contained 17 factors (i.e., participation, feedback, autonomy, mentaldemands, time pressure, emotional demands, social support, competition, mobbing, physical burden,risk of accident, training opportunities, career advancement, job security, employability, work lifeconflict, and income satisfaction) that were allowed to correlate. We tested the factorial structurefor each subgroup separately to see if the factor model adequately fitted across all subgroups inorder to evaluate more stringent measurement invariance models in the next steps [107]. The MLRχ2-test statistic with robust standard errors [108] was calculated because it provides more accurateparameter estimations for items with five answer categories and for distortion from univariate andmultivariate normality [109]. We fixed the factor variance to 1 and the factor mean to 0 for scale setting.We calculated the root mean squared error of approximation (RMSEA), standardized root mean squareresidual (SRMR), comparative fit index (CFI), and Tucker–Lewis index (TLI) to gauge model fit. For theRMSEA values between 0.05 and 0.08 indicate acceptable and values between 0.02 and 0.05 indicategood model fit. For the CFI and TLI values between 0.90 and 0.95 indicate acceptable and valuesbetween 0.95 and 0.99 indicate good model fit [110]. We used multigroup CFA (MGCFA) [110] totest for MI between the different language versions. Again, the fixed-factor method was used forscale setting as it has been found to be the best method to identify non-invariant indicators [111].For the first group the factor mean is fixed to 0 and the factor variance is fixed to 1 while both arefreed in all other groups in the metric and scalar invariance models. The ∆CFI was used to assessgoodness of fit of MI models as it has been found to perform reasonably well in detecting (lack of)measurement invariance [112–114]. A ∆CFI > −0.01 between a baseline model and the resulting modelindicates measurement invariance [110]. Full information maximum likelihood was used to accountfor missing values in CFA [115]. Criterion validity was assessed with intercorrelations (Pearson’s r).Furthermore, hierarchical regression analyses were used to investigate the predictive power of theQoW and QoE scales on the different forms of employees’ well-being. We included the variables ina stepwise manner in order to evaluate the incremental validity of the new scales. The first modelincluded only demographic variables as control variables. In a next step, working time conditions wereincluded as a second block of control variables. The third step included the QoE and the fourth step theQoW scales. We opted for this order because the first job quality indices mainly contained quality ofemployment measures [5]. Thus, we wanted to investigate the incremental contribution of the qualityof work measures. R version 4.0.2 [116] was used for data analyses. Particularly, the mice package [117]was used for multiple imputation and the miceadds [118] and the naniar [119] packages for additionalmissing value analyses. The lavaan [120] and semTools [121] packages were used for the CFA andmeasurement invariance analyses. Finally, graphs were created with the ggplot2 package [122].
3. Results
3.1. Preliminary Analysis
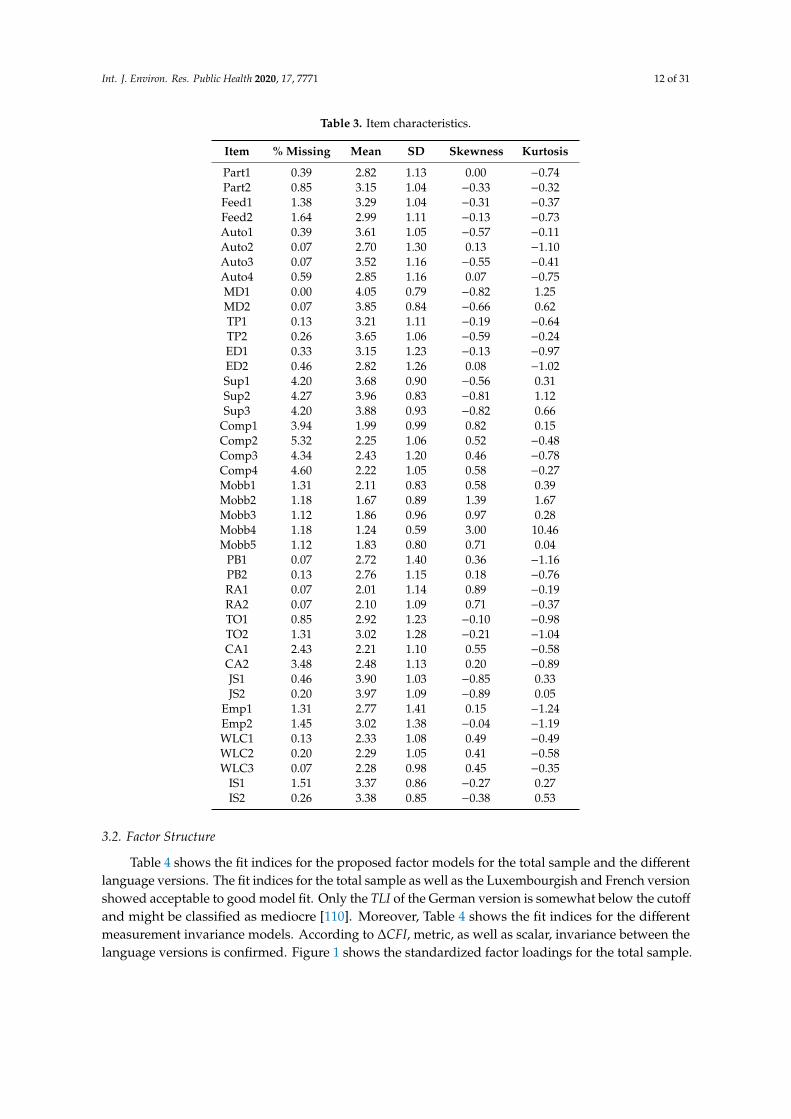
Table 3 shows coefficients that describe the univariate distribution of each item. Item meansranged from 1.24 to 4.05 (SD between 0.59 and 1.41), skewness between −0.82 and 3.00, and kurtosisbetween −1.19 and 10.46. The percentage of missing values ranged from 0.07 to 5.32. Furthermore,items violated multivariate normality (Mardia’s multivariate skewness: γ̂1,43 = 116.4; χ2 = 29,526.40;p < 0.001; Mardia’s multivariate kurtosis: γ̂2,43 = 2224.78; z = 90.86; p < 0.001).
Int. J. Environ. Res. Public Health 2020, 17, 7771 12 of 31
Table 3. Item characteristics.
Item % Missing Mean SD Skewness Kurtosis
Part1 0.39 2.82 1.13 0.00 −0.74Part2 0.85 3.15 1.04 −0.33 −0.32Feed1 1.38 3.29 1.04 −0.31 −0.37Feed2 1.64 2.99 1.11 −0.13 −0.73Auto1 0.39 3.61 1.05 −0.57 −0.11Auto2 0.07 2.70 1.30 0.13 −1.10Auto3 0.07 3.52 1.16 −0.55 −0.41Auto4 0.59 2.85 1.16 0.07 −0.75MD1 0.00 4.05 0.79 −0.82 1.25MD2 0.07 3.85 0.84 −0.66 0.62TP1 0.13 3.21 1.11 −0.19 −0.64TP2 0.26 3.65 1.06 −0.59 −0.24ED1 0.33 3.15 1.23 −0.13 −0.97ED2 0.46 2.82 1.26 0.08 −1.02Sup1 4.20 3.68 0.90 −0.56 0.31Sup2 4.27 3.96 0.83 −0.81 1.12Sup3 4.20 3.88 0.93 −0.82 0.66
Comp1 3.94 1.99 0.99 0.82 0.15Comp2 5.32 2.25 1.06 0.52 −0.48Comp3 4.34 2.43 1.20 0.46 −0.78Comp4 4.60 2.22 1.05 0.58 −0.27Mobb1 1.31 2.11 0.83 0.58 0.39Mobb2 1.18 1.67 0.89 1.39 1.67Mobb3 1.12 1.86 0.96 0.97 0.28Mobb4 1.18 1.24 0.59 3.00 10.46Mobb5 1.12 1.83 0.80 0.71 0.04
PB1 0.07 2.72 1.40 0.36 −1.16PB2 0.13 2.76 1.15 0.18 −0.76RA1 0.07 2.01 1.14 0.89 −0.19RA2 0.07 2.10 1.09 0.71 −0.37TO1 0.85 2.92 1.23 −0.10 −0.98TO2 1.31 3.02 1.28 −0.21 −1.04CA1 2.43 2.21 1.10 0.55 −0.58CA2 3.48 2.48 1.13 0.20 −0.89JS1 0.46 3.90 1.03 −0.85 0.33JS2 0.20 3.97 1.09 −0.89 0.05
Emp1 1.31 2.77 1.41 0.15 −1.24Emp2 1.45 3.02 1.38 −0.04 −1.19WLC1 0.13 2.33 1.08 0.49 −0.49WLC2 0.20 2.29 1.05 0.41 −0.58WLC3 0.07 2.28 0.98 0.45 −0.35
IS1 1.51 3.37 0.86 −0.27 0.27IS2 0.26 3.38 0.85 −0.38 0.53
3.2. Factor Structure
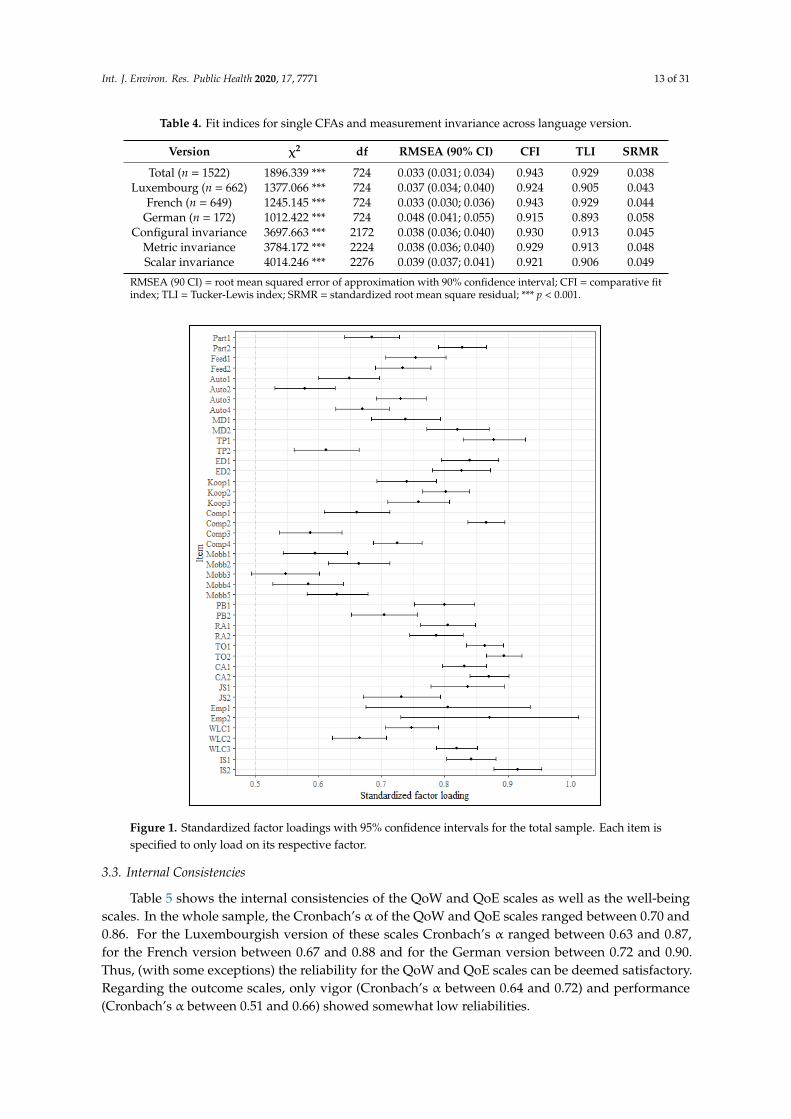
Table 4 shows the fit indices for the proposed factor models for the total sample and the differentlanguage versions. The fit indices for the total sample as well as the Luxembourgish and French versionshowed acceptable to good model fit. Only the TLI of the German version is somewhat below the cutoff
and might be classified as mediocre [110]. Moreover, Table 4 shows the fit indices for the differentmeasurement invariance models. According to ∆CFI, metric, as well as scalar, invariance between thelanguage versions is confirmed. Figure 1 shows the standardized factor loadings for the total sample.
Int. J. Environ. Res. Public Health 2020, 17, 7771 13 of 31
Table 4. Fit indices for single CFAs and measurement invariance across language version.
Version χ2 df RMSEA (90% CI) CFI TLI SRMR
Total (n = 1522) 1896.339 *** 724 0.033 (0.031; 0.034) 0.943 0.929 0.038Luxembourg (n = 662) 1377.066 *** 724 0.037 (0.034; 0.040) 0.924 0.905 0.043
French (n = 649) 1245.145 *** 724 0.033 (0.030; 0.036) 0.943 0.929 0.044German (n = 172) 1012.422 *** 724 0.048 (0.041; 0.055) 0.915 0.893 0.058
Configural invariance 3697.663 *** 2172 0.038 (0.036; 0.040) 0.930 0.913 0.045Metric invariance 3784.172 *** 2224 0.038 (0.036; 0.040) 0.929 0.913 0.048Scalar invariance 4014.246 *** 2276 0.039 (0.037; 0.041) 0.921 0.906 0.049
RMSEA (90 CI) = root mean squared error of approximation with 90% confidence interval; CFI = comparative fitindex; TLI = Tucker-Lewis index; SRMR = standardized root mean square residual; *** p < 0.001.
Int. J. Environ. Res. Public Health 2020, 17, 7771 13 of 30
between the language versions is confirmed. Figure 1 shows the standardized factor loadings for the
total sample.
Table 4. Fit indices for single CFAs and measurement invariance across language version.
Version χ2 df RMSEA (90% CI) CFI TLI SRMR
Total (n = 1522) 1896.339 *** 724 0.033 (0.031; 0.034) 0.943 0.929 0.038
Luxembourg (n = 662) 1377.066 *** 724 0.037 (0.034; 0.040) 0.924 0.905 0.043
French (n = 649) 1245.145 *** 724 0.033 (0.030; 0.036) 0.943 0.929 0.044
German (n = 172) 1012.422 *** 724 0.048 (0.041; 0.055) 0.915 0.893 0.058
Configural invariance 3697.663 *** 2172 0.038 (0.036; 0.040) 0.930 0.913 0.045
Metric invariance 3784.172 *** 2224 0.038 (0.036; 0.040) 0.929 0.913 0.048
Scalar invariance 4014.246 *** 2276 0.039 (0.037; 0.041) 0.921 0.906 0.049
RMSEA (90 CI) = root mean squared error of approximation with 90% confidence interval; CFI =
comparative fit index; TLI = Tucker-Lewis index; SRMR = standardized root mean square residual; ***
p < 0.001.
Figure 1. Standardized factor loadings with 95% confidence intervals for the total sample. Each item
is specified to only load on its respective factor.
3.3. Internal Consistencies
Table 5 shows the internal consistencies of the QoW and QoE scales as well as the well-being
scales. In the whole sample, the Cronbach’s α of the QoW and QoE scales ranged between 0.70 and
0.86. For the Luxembourgish version of these scales Cronbach’s α ranged between 0.63 and 0.87, for
the French version between 0.67 and 0.88 and for the German version between 0.72 and 0.90. Thus,
(with some exceptions) the reliability for the QoW and QoE scales can be deemed satisfactory.
Figure 1. Standardized factor loadings with 95% confidence intervals for the total sample. Each item isspecified to only load on its respective factor.
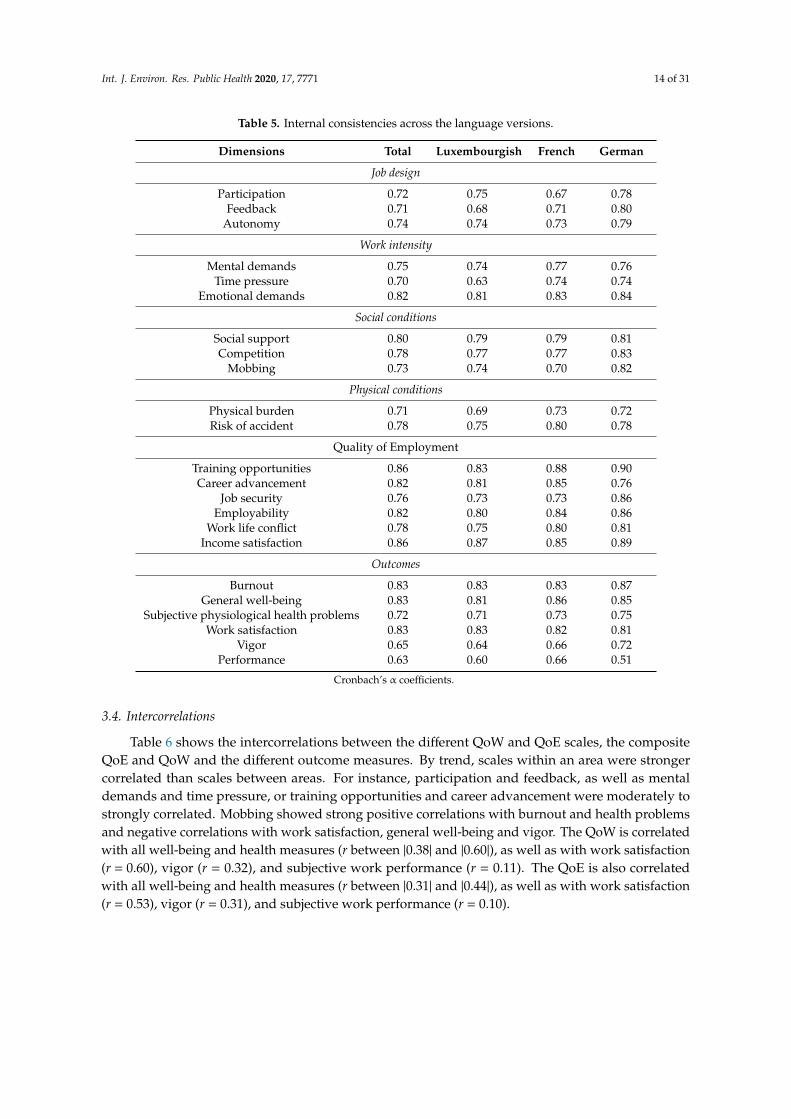
3.3. Internal Consistencies
Table 5 shows the internal consistencies of the QoW and QoE scales as well as the well-beingscales. In the whole sample, the Cronbach’s α of the QoW and QoE scales ranged between 0.70 and0.86. For the Luxembourgish version of these scales Cronbach’s α ranged between 0.63 and 0.87,for the French version between 0.67 and 0.88 and for the German version between 0.72 and 0.90.Thus, (with some exceptions) the reliability for the QoW and QoE scales can be deemed satisfactory.Regarding the outcome scales, only vigor (Cronbach’s α between 0.64 and 0.72) and performance(Cronbach’s α between 0.51 and 0.66) showed somewhat low reliabilities.
Int. J. Environ. Res. Public Health 2020, 17, 7771 14 of 31
Table 5. Internal consistencies across the language versions.
Dimensions Total Luxembourgish French German
Job design
Participation 0.72 0.75 0.67 0.78Feedback 0.71 0.68 0.71 0.80
Autonomy 0.74 0.74 0.73 0.79
Work intensity
Mental demands 0.75 0.74 0.77 0.76Time pressure 0.70 0.63 0.74 0.74
Emotional demands 0.82 0.81 0.83 0.84
Social conditions
Social support 0.80 0.79 0.79 0.81Competition 0.78 0.77 0.77 0.83
Mobbing 0.73 0.74 0.70 0.82
Physical conditions
Physical burden 0.71 0.69 0.73 0.72Risk of accident 0.78 0.75 0.80 0.78
Quality of Employment
Training opportunities 0.86 0.83 0.88 0.90Career advancement 0.82 0.81 0.85 0.76
Job security 0.76 0.73 0.73 0.86Employability 0.82 0.80 0.84 0.86
Work life conflict 0.78 0.75 0.80 0.81Income satisfaction 0.86 0.87 0.85 0.89
Outcomes
Burnout 0.83 0.83 0.83 0.87General well-being 0.83 0.81 0.86 0.85
Subjective physiological health problems 0.72 0.71 0.73 0.75Work satisfaction 0.83 0.83 0.82 0.81
Vigor 0.65 0.64 0.66 0.72Performance 0.63 0.60 0.66 0.51
Cronbach’s α coefficients.
3.4. Intercorrelations
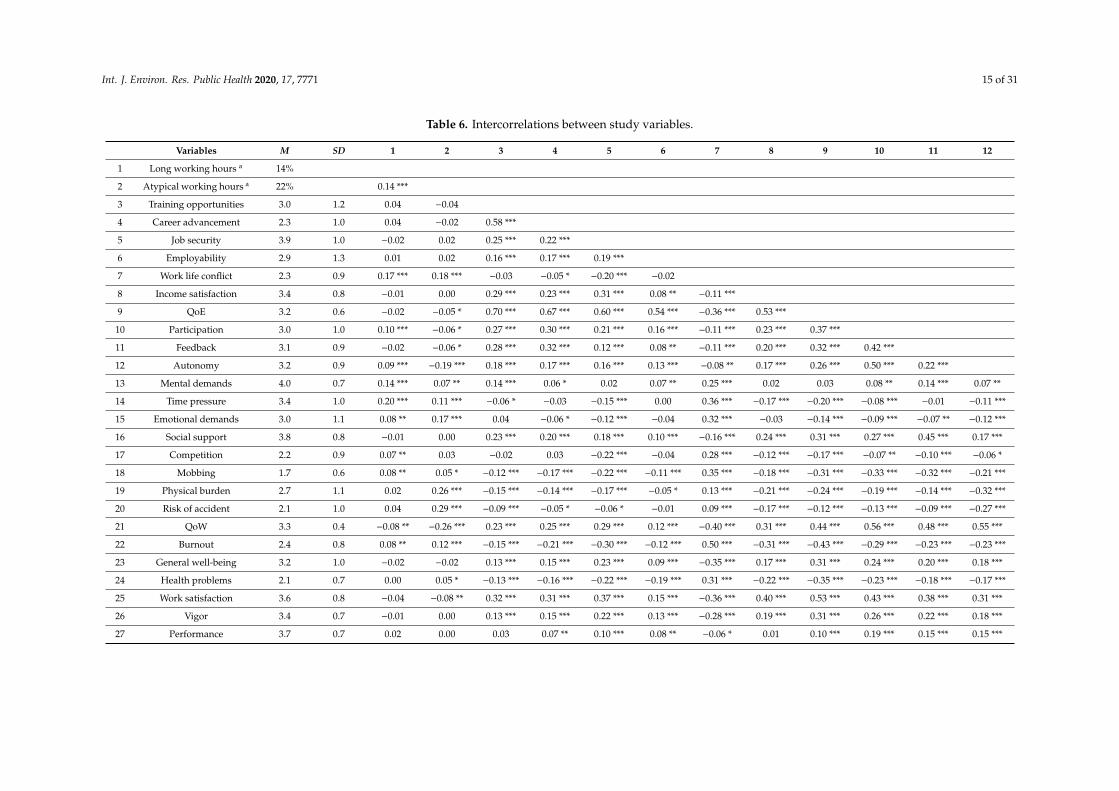
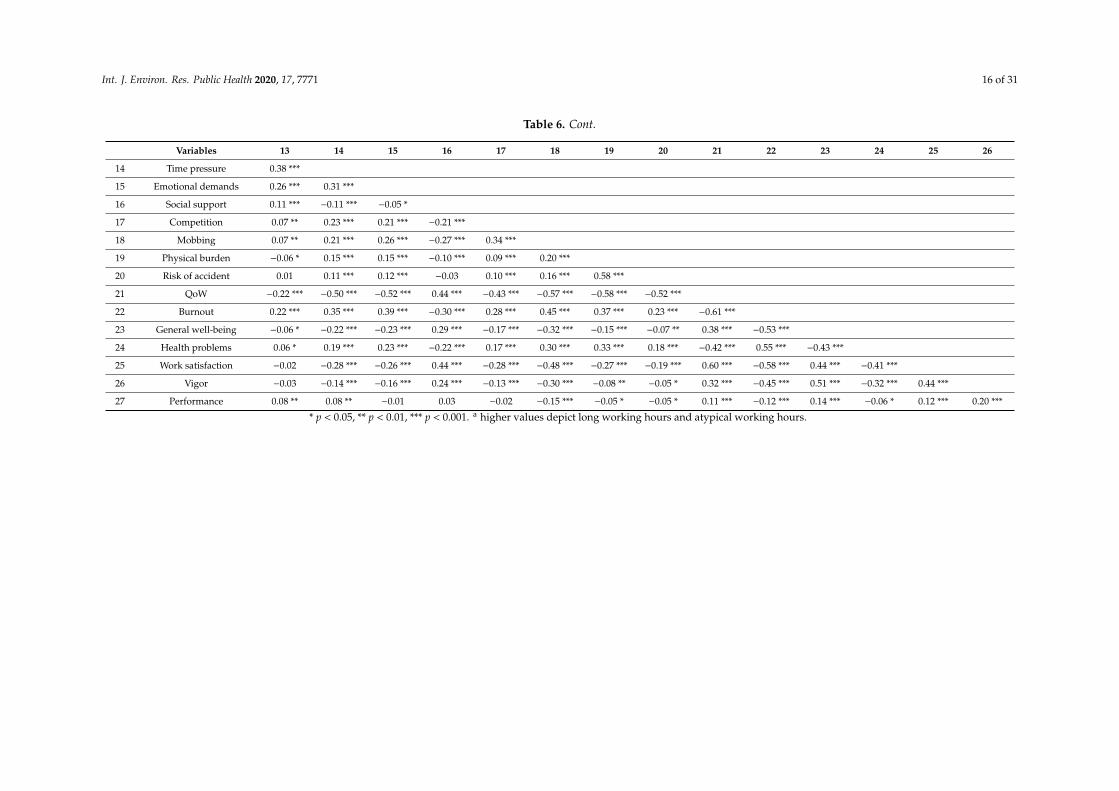
Table 6 shows the intercorrelations between the different QoW and QoE scales, the compositeQoE and QoW and the different outcome measures. By trend, scales within an area were strongercorrelated than scales between areas. For instance, participation and feedback, as well as mentaldemands and time pressure, or training opportunities and career advancement were moderately tostrongly correlated. Mobbing showed strong positive correlations with burnout and health problemsand negative correlations with work satisfaction, general well-being and vigor. The QoW is correlatedwith all well-being and health measures (r between |0.38| and |0.60|), as well as with work satisfaction(r = 0.60), vigor (r = 0.32), and subjective work performance (r = 0.11). The QoE is also correlatedwith all well-being and health measures (r between |0.31| and |0.44|), as well as with work satisfaction(r = 0.53), vigor (r = 0.31), and subjective work performance (r = 0.10).
Int. J. Environ. Res. Public Health 2020, 17, 7771 15 of 31
Table 6. Intercorrelations between study variables.
Variables M SD 1 2 3 4 5 6 7 8 9 10 11 12
1 Long working hours a 14%
2 Atypical working hours a 22% 0.14 ***
3 Training opportunities 3.0 1.2 0.04 −0.04
4 Career advancement 2.3 1.0 0.04 −0.02 0.58 ***
5 Job security 3.9 1.0 −0.02 0.02 0.25 *** 0.22 ***
6 Employability 2.9 1.3 0.01 0.02 0.16 *** 0.17 *** 0.19 ***
7 Work life conflict 2.3 0.9 0.17 *** 0.18 *** −0.03 −0.05 * −0.20 *** −0.02
8 Income satisfaction 3.4 0.8 −0.01 0.00 0.29 *** 0.23 *** 0.31 *** 0.08 ** −0.11 ***
9 QoE 3.2 0.6 −0.02 −0.05 * 0.70 *** 0.67 *** 0.60 *** 0.54 *** −0.36 *** 0.53 ***
10 Participation 3.0 1.0 0.10 *** −0.06 * 0.27 *** 0.30 *** 0.21 *** 0.16 *** −0.11 *** 0.23 *** 0.37 ***
11 Feedback 3.1 0.9 −0.02 −0.06 * 0.28 *** 0.32 *** 0.12 *** 0.08 ** −0.11 *** 0.20 *** 0.32 *** 0.42 ***
12 Autonomy 3.2 0.9 0.09 *** −0.19 *** 0.18 *** 0.17 *** 0.16 *** 0.13 *** −0.08 ** 0.17 *** 0.26 *** 0.50 *** 0.22 ***
13 Mental demands 4.0 0.7 0.14 *** 0.07 ** 0.14 *** 0.06 * 0.02 0.07 ** 0.25 *** 0.02 0.03 0.08 ** 0.14 *** 0.07 **
14 Time pressure 3.4 1.0 0.20 *** 0.11 *** −0.06 * −0.03 −0.15 *** 0.00 0.36 *** −0.17 *** −0.20 *** −0.08 *** −0.01 −0.11 ***
15 Emotional demands 3.0 1.1 0.08 ** 0.17 *** 0.04 −0.06 * −0.12 *** −0.04 0.32 *** −0.03 −0.14 *** −0.09 *** −0.07 ** −0.12 ***
16 Social support 3.8 0.8 −0.01 0.00 0.23 *** 0.20 *** 0.18 *** 0.10 *** −0.16 *** 0.24 *** 0.31 *** 0.27 *** 0.45 *** 0.17 ***
17 Competition 2.2 0.9 0.07 ** 0.03 −0.02 0.03 −0.22 *** −0.04 0.28 *** −0.12 *** −0.17 *** −0.07 ** −0.10 *** −0.06 *
18 Mobbing 1.7 0.6 0.08 ** 0.05 * −0.12 *** −0.17 *** −0.22 *** −0.11 *** 0.35 *** −0.18 *** −0.31 *** −0.33 *** −0.32 *** −0.21 ***
19 Physical burden 2.7 1.1 0.02 0.26 *** −0.15 *** −0.14 *** −0.17 *** −0.05 * 0.13 *** −0.21 *** −0.24 *** −0.19 *** −0.14 *** −0.32 ***
20 Risk of accident 2.1 1.0 0.04 0.29 *** −0.09 *** −0.05 * −0.06 * −0.01 0.09 *** −0.17 *** −0.12 *** −0.13 *** −0.09 *** −0.27 ***
21 QoW 3.3 0.4 −0.08 ** −0.26 *** 0.23 *** 0.25 *** 0.29 *** 0.12 *** −0.40 *** 0.31 *** 0.44 *** 0.56 *** 0.48 *** 0.55 ***
22 Burnout 2.4 0.8 0.08 ** 0.12 *** −0.15 *** −0.21 *** −0.30 *** −0.12 *** 0.50 *** −0.31 *** −0.43 *** −0.29 *** −0.23 *** −0.23 ***
23 General well-being 3.2 1.0 −0.02 −0.02 0.13 *** 0.15 *** 0.23 *** 0.09 *** −0.35 *** 0.17 *** 0.31 *** 0.24 *** 0.20 *** 0.18 ***
24 Health problems 2.1 0.7 0.00 0.05 * −0.13 *** −0.16 *** −0.22 *** −0.19 *** 0.31 *** −0.22 *** −0.35 *** −0.23 *** −0.18 *** −0.17 ***
25 Work satisfaction 3.6 0.8 −0.04 −0.08 ** 0.32 *** 0.31 *** 0.37 *** 0.15 *** −0.36 *** 0.40 *** 0.53 *** 0.43 *** 0.38 *** 0.31 ***
26 Vigor 3.4 0.7 −0.01 0.00 0.13 *** 0.15 *** 0.22 *** 0.13 *** −0.28 *** 0.19 *** 0.31 *** 0.26 *** 0.22 *** 0.18 ***
27 Performance 3.7 0.7 0.02 0.00 0.03 0.07 ** 0.10 *** 0.08 ** −0.06 * 0.01 0.10 *** 0.19 *** 0.15 *** 0.15 ***
Int. J. Environ. Res. Public Health 2020, 17, 7771 16 of 31
Table 6. Cont.
Variables 13 14 15 16 17 18 19 20 21 22 23 24 25 26
14 Time pressure 0.38 ***
15 Emotional demands 0.26 *** 0.31 ***
16 Social support 0.11 *** −0.11 *** −0.05 *
17 Competition 0.07 ** 0.23 *** 0.21 *** −0.21 ***
18 Mobbing 0.07 ** 0.21 *** 0.26 *** −0.27 *** 0.34 ***
19 Physical burden −0.06 * 0.15 *** 0.15 *** −0.10 *** 0.09 *** 0.20 ***
20 Risk of accident 0.01 0.11 *** 0.12 *** −0.03 0.10 *** 0.16 *** 0.58 ***
21 QoW −0.22 *** −0.50 *** −0.52 *** 0.44 *** −0.43 *** −0.57 *** −0.58 *** −0.52 ***
22 Burnout 0.22 *** 0.35 *** 0.39 *** −0.30 *** 0.28 *** 0.45 *** 0.37 *** 0.23 *** −0.61 ***
23 General well-being −0.06 * −0.22 *** −0.23 *** 0.29 *** −0.17 *** −0.32 *** −0.15 *** −0.07 ** 0.38 *** −0.53 ***
24 Health problems 0.06 * 0.19 *** 0.23 *** −0.22 *** 0.17 *** 0.30 *** 0.33 *** 0.18 *** −0.42 *** 0.55 *** −0.43 ***
25 Work satisfaction −0.02 −0.28 *** −0.26 *** 0.44 *** −0.28 *** −0.48 *** −0.27 *** −0.19 *** 0.60 *** −0.58 *** 0.44 *** −0.41 ***
26 Vigor −0.03 −0.14 *** −0.16 *** 0.24 *** −0.13 *** −0.30 *** −0.08 ** −0.05 * 0.32 *** −0.45 *** 0.51 *** −0.32 *** 0.44 ***
27 Performance 0.08 ** 0.08 ** −0.01 0.03 −0.02 −0.15 *** −0.05 * −0.05 * 0.11 *** −0.12 *** 0.14 *** −0.06 * 0.12 *** 0.20 ***
* p < 0.05, ** p < 0.01, *** p < 0.001. a higher values depict long working hours and atypical working hours.
Int. J. Environ. Res. Public Health 2020, 17, 7771 17 of 31
3.5. Multiple Regression Analyses
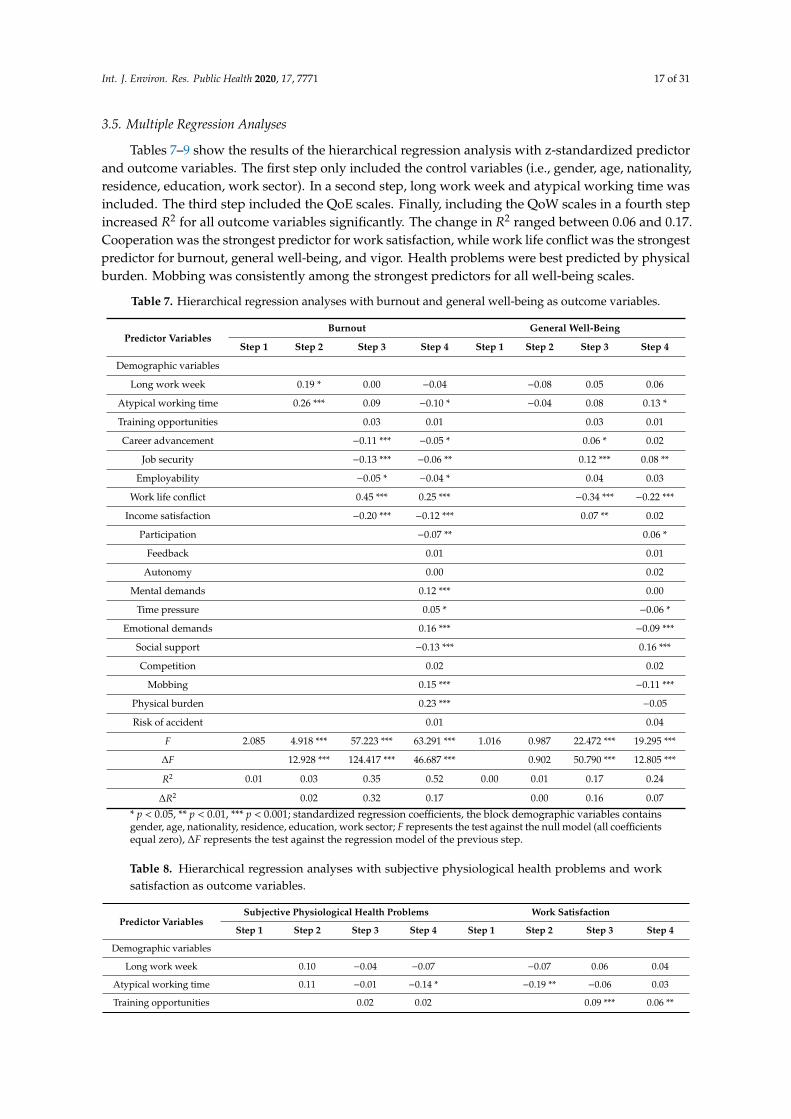
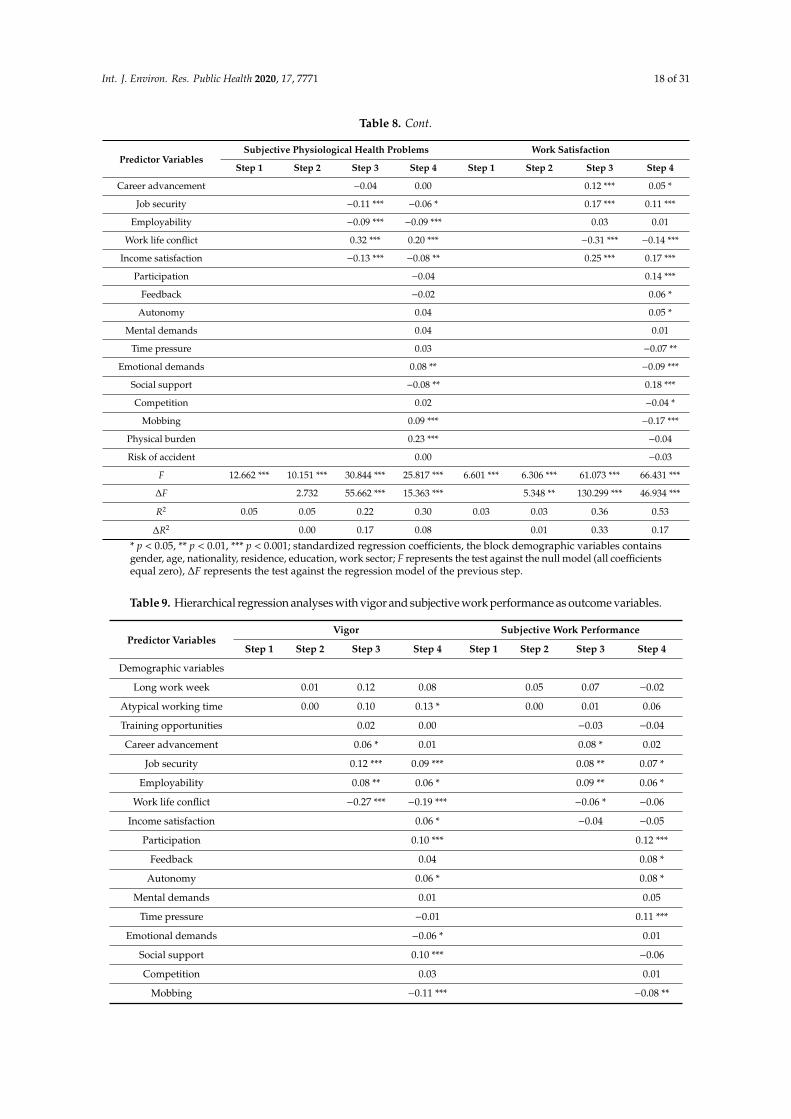
Tables 7–9 show the results of the hierarchical regression analysis with z-standardized predictorand outcome variables. The first step only included the control variables (i.e., gender, age, nationality,residence, education, work sector). In a second step, long work week and atypical working time wasincluded. The third step included the QoE scales. Finally, including the QoW scales in a fourth stepincreased R2 for all outcome variables significantly. The change in R2 ranged between 0.06 and 0.17.Cooperation was the strongest predictor for work satisfaction, while work life conflict was the strongestpredictor for burnout, general well-being, and vigor. Health problems were best predicted by physicalburden. Mobbing was consistently among the strongest predictors for all well-being scales.
Table 7. Hierarchical regression analyses with burnout and general well-being as outcome variables.
Predictor VariablesBurnout General Well-Being
Step 1 Step 2 Step 3 Step 4 Step 1 Step 2 Step 3 Step 4
Demographic variables
Long work week 0.19 * 0.00 −0.04 −0.08 0.05 0.06
Atypical working time 0.26 *** 0.09 −0.10 * −0.04 0.08 0.13 *
Training opportunities 0.03 0.01 0.03 0.01
Career advancement −0.11 *** −0.05 * 0.06 * 0.02
Job security −0.13 *** −0.06 ** 0.12 *** 0.08 **
Employability −0.05 * −0.04 * 0.04 0.03
Work life conflict 0.45 *** 0.25 *** −0.34 *** −0.22 ***
Income satisfaction −0.20 *** −0.12 *** 0.07 ** 0.02
Participation −0.07 ** 0.06 *
Feedback 0.01 0.01
Autonomy 0.00 0.02
Mental demands 0.12 *** 0.00
Time pressure 0.05 * −0.06 *
Emotional demands 0.16 *** −0.09 ***
Social support −0.13 *** 0.16 ***
Competition 0.02 0.02
Mobbing 0.15 *** −0.11 ***
Physical burden 0.23 *** −0.05
Risk of accident 0.01 0.04
F 2.085 4.918 *** 57.223 *** 63.291 *** 1.016 0.987 22.472 *** 19.295 ***
∆F 12.928 *** 124.417 *** 46.687 *** 0.902 50.790 *** 12.805 ***
R2 0.01 0.03 0.35 0.52 0.00 0.01 0.17 0.24
∆R2 0.02 0.32 0.17 0.00 0.16 0.07
* p < 0.05, ** p < 0.01, *** p < 0.001; standardized regression coefficients, the block demographic variables containsgender, age, nationality, residence, education, work sector; F represents the test against the null model (all coefficientsequal zero), ∆F represents the test against the regression model of the previous step.
Table 8. Hierarchical regression analyses with subjective physiological health problems and worksatisfaction as outcome variables.
Predictor VariablesSubjective Physiological Health Problems Work Satisfaction
Step 1 Step 2 Step 3 Step 4 Step 1 Step 2 Step 3 Step 4
Demographic variables
Long work week 0.10 −0.04 −0.07 −0.07 0.06 0.04
Atypical working time 0.11 −0.01 −0.14 * −0.19 ** −0.06 0.03
Training opportunities 0.02 0.02 0.09 *** 0.06 **
Int. J. Environ. Res. Public Health 2020, 17, 7771 18 of 31
Table 8. Cont.
Predictor VariablesSubjective Physiological Health Problems Work Satisfaction
Step 1 Step 2 Step 3 Step 4 Step 1 Step 2 Step 3 Step 4
Career advancement −0.04 0.00 0.12 *** 0.05 *
Job security −0.11 *** −0.06 * 0.17 *** 0.11 ***
Employability −0.09 *** −0.09 *** 0.03 0.01
Work life conflict 0.32 *** 0.20 *** −0.31 *** −0.14 ***
Income satisfaction −0.13 *** −0.08 ** 0.25 *** 0.17 ***
Participation −0.04 0.14 ***
Feedback −0.02 0.06 *
Autonomy 0.04 0.05 *
Mental demands 0.04 0.01
Time pressure 0.03 −0.07 **
Emotional demands 0.08 ** −0.09 ***
Social support −0.08 ** 0.18 ***
Competition 0.02 −0.04 *
Mobbing 0.09 *** −0.17 ***
Physical burden 0.23 *** −0.04
Risk of accident 0.00 −0.03
F 12.662 *** 10.151 *** 30.844 *** 25.817 *** 6.601 *** 6.306 *** 61.073 *** 66.431 ***
∆F 2.732 55.662 *** 15.363 *** 5.348 ** 130.299 *** 46.934 ***
R2 0.05 0.05 0.22 0.30 0.03 0.03 0.36 0.53
∆R2 0.00 0.17 0.08 0.01 0.33 0.17
* p < 0.05, ** p < 0.01, *** p < 0.001; standardized regression coefficients, the block demographic variables containsgender, age, nationality, residence, education, work sector; F represents the test against the null model (all coefficientsequal zero), ∆F represents the test against the regression model of the previous step.
Table 9. Hierarchical regression analyses with vigor and subjective work performance as outcome variables.
Predictor VariablesVigor Subjective Work Performance
Step 1 Step 2 Step 3 Step 4 Step 1 Step 2 Step 3 Step 4
Demographic variables
Long work week 0.01 0.12 0.08 0.05 0.07 −0.02
Atypical working time 0.00 0.10 0.13 * 0.00 0.01 0.06
Training opportunities 0.02 0.00 −0.03 −0.04
Career advancement 0.06 * 0.01 0.08 * 0.02
Job security 0.12 *** 0.09 *** 0.08 ** 0.07 *
Employability 0.08 ** 0.06 * 0.09 ** 0.06 *
Work life conflict −0.27 *** −0.19 *** −0.06 * −0.06
Income satisfaction 0.06 * −0.04 −0.05
Participation 0.10 *** 0.12 ***
Feedback 0.04 0.08 *
Autonomy 0.06 * 0.08 *
Mental demands 0.01 0.05
Time pressure −0.01 0.11 ***
Emotional demands −0.06 * 0.01
Social support 0.10 *** −0.06
Competition 0.03 0.01
Mobbing −0.11 *** −0.08 **
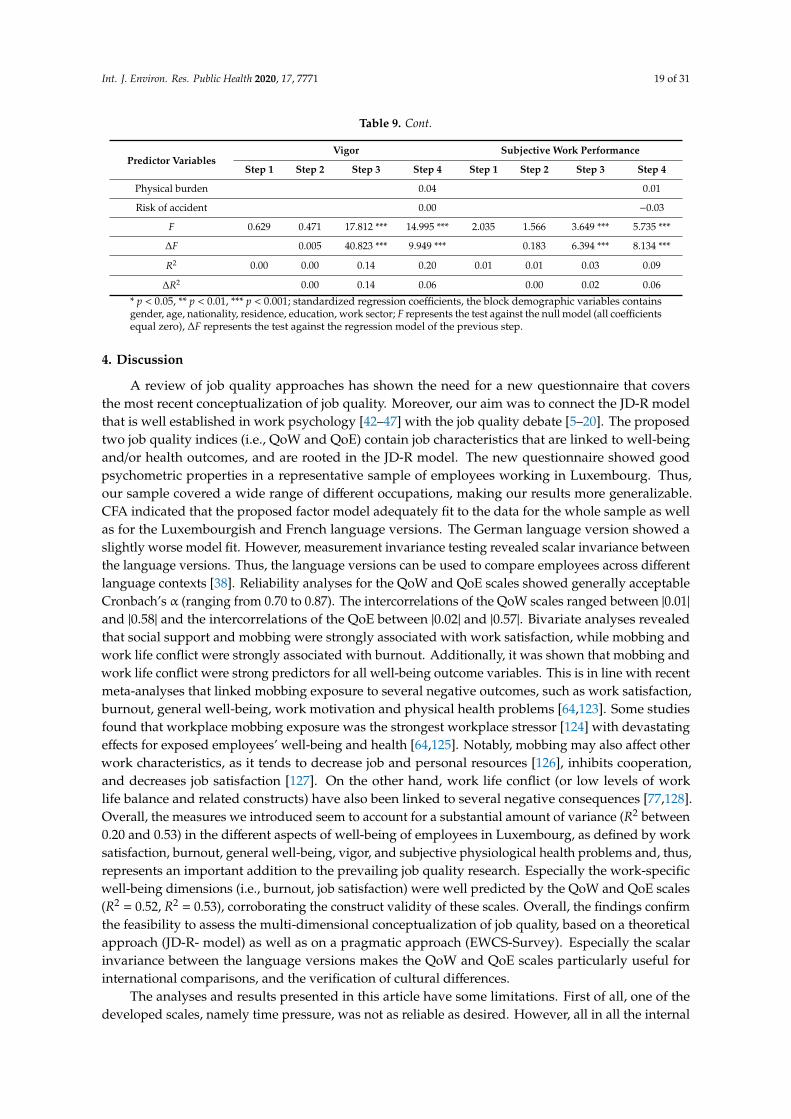
Int. J. Environ. Res. Public Health 2020, 17, 7771 19 of 31
Table 9. Cont.
Predictor VariablesVigor Subjective Work Performance
Step 1 Step 2 Step 3 Step 4 Step 1 Step 2 Step 3 Step 4
Physical burden 0.04 0.01
Risk of accident 0.00 −0.03
F 0.629 0.471 17.812 *** 14.995 *** 2.035 1.566 3.649 *** 5.735 ***
∆F 0.005 40.823 *** 9.949 *** 0.183 6.394 *** 8.134 ***
R2 0.00 0.00 0.14 0.20 0.01 0.01 0.03 0.09
∆R2 0.00 0.14 0.06 0.00 0.02 0.06
* p < 0.05, ** p < 0.01, *** p < 0.001; standardized regression coefficients, the block demographic variables containsgender, age, nationality, residence, education, work sector; F represents the test against the null model (all coefficientsequal zero), ∆F represents the test against the regression model of the previous step.
4. Discussion
A review of job quality approaches has shown the need for a new questionnaire that coversthe most recent conceptualization of job quality. Moreover, our aim was to connect the JD-R modelthat is well established in work psychology [42–47] with the job quality debate [5–20]. The proposedtwo job quality indices (i.e., QoW and QoE) contain job characteristics that are linked to well-beingand/or health outcomes, and are rooted in the JD-R model. The new questionnaire showed goodpsychometric properties in a representative sample of employees working in Luxembourg. Thus,our sample covered a wide range of different occupations, making our results more generalizable.CFA indicated that the proposed factor model adequately fit to the data for the whole sample as wellas for the Luxembourgish and French language versions. The German language version showed aslightly worse model fit. However, measurement invariance testing revealed scalar invariance betweenthe language versions. Thus, the language versions can be used to compare employees across differentlanguage contexts [38]. Reliability analyses for the QoW and QoE scales showed generally acceptableCronbach’s α (ranging from 0.70 to 0.87). The intercorrelations of the QoW scales ranged between |0.01|
and |0.58| and the intercorrelations of the QoE between |0.02| and |0.57|. Bivariate analyses revealedthat social support and mobbing were strongly associated with work satisfaction, while mobbing andwork life conflict were strongly associated with burnout. Additionally, it was shown that mobbing andwork life conflict were strong predictors for all well-being outcome variables. This is in line with recentmeta-analyses that linked mobbing exposure to several negative outcomes, such as work satisfaction,burnout, general well-being, work motivation and physical health problems [64,123]. Some studiesfound that workplace mobbing exposure was the strongest workplace stressor [124] with devastatingeffects for exposed employees’ well-being and health [64,125]. Notably, mobbing may also affect otherwork characteristics, as it tends to decrease job and personal resources [126], inhibits cooperation,and decreases job satisfaction [127]. On the other hand, work life conflict (or low levels of worklife balance and related constructs) have also been linked to several negative consequences [77,128].Overall, the measures we introduced seem to account for a substantial amount of variance (R2 between0.20 and 0.53) in the different aspects of well-being of employees in Luxembourg, as defined by worksatisfaction, burnout, general well-being, vigor, and subjective physiological health problems and, thus,represents an important addition to the prevailing job quality research. Especially the work-specificwell-being dimensions (i.e., burnout, job satisfaction) were well predicted by the QoW and QoE scales(R2 = 0.52, R2 = 0.53), corroborating the construct validity of these scales. Overall, the findings confirmthe feasibility to assess the multi-dimensional conceptualization of job quality, based on a theoreticalapproach (JD-R- model) as well as on a pragmatic approach (EWCS-Survey). Especially the scalarinvariance between the language versions makes the QoW and QoE scales particularly useful forinternational comparisons, and the verification of cultural differences.
The analyses and results presented in this article have some limitations. First of all, one of thedeveloped scales, namely time pressure, was not as reliable as desired. However, all in all the internal
Int. J. Environ. Res. Public Health 2020, 17, 7771 20 of 31
consistencies of the QoW and QoE scales were above the often expressed cutoff value of 0.70 [129,130].It is also important to note that the performance scale had a quite low internal consistency, especiallyfor the German language version. Thus, the results of the correlation and regression analysis shouldbe regarded with cautious regarding this outcome variable as performance showed a high standarderror of measurement. Second, because of the cross-sectional design of the study, all correlationsbetween the QoW scales and the different well-being measures cannot be interpreted in a causalmanner. It is possible that employees with low levels of well-being perceived their working conditionsworse than employees with high levels of well-being [131]. Third, it is important to note, that the modeof data collection can have an impact on factor structure, internal consistencies and intercorrelationsof multi-item measures [132]. Thus, it is important that future studies investigate the psychometricproperties of these scales for other data collection modes (e.g., online surveys, paper-pencil) andtest its measurement invariance [132,133]. Future research might also expand the investigation onthe reliability and validity of the QoW and QoE scales (e.g., test-retest-reliability, expansion of thenomological net). Moreover, longitudinal data with information about quality of work as well asquality of employment and health outcomes across time would be helpful to further validate the twocomposite indices in this respect. Future studies might also apply the new questionnaire within othercountries to enable cross-national research.
5. Conclusions
A literature review revealed that despite the current availability of several indices of job quality,there is still a need of a worker-oriented, individually constructed and theoretically grounded job qualityindex. The new developed questionnaire shows great potential in measuring working conditionslinked to well-being. So far it has been shown that it can identify important predictors of employees’well-being and that it can be used to map the current job quality of employees. Two meaningfulaggregate indices are now accessible, which are based on a system of well-defined measures of differentattributes of work that have an impact on the well-being of employees.
Author Contributions: Conceptualization, G.S. and P.E.S.; methodology, P.E.S.; software, P.E.S.; validation, G.S.,P.E.S. and M.F.d.H.; formal analysis, G.S., P.E.S. and M.F.d.H.; investigation, G.S., P.E.S. and M.F.d.H.; resources,G.S., P.E.S. and M.F.d.H.; data curation, P.E.S.; writing—original draft preparation, P.E.S., G.S. and M.F.d.H.;writing—review and editing, P.E.S., G.S. and M.F.d.H.; visualization, P.E.S.; supervision, G.S. and P.E.S.; projectadministration, P.E.S. and G.S.; funding acquisition, G.S. and P.E.S. All authors have read and agreed to thepublished version of the manuscript.
Funding: This research was supported by a grant from the Luxembourg Chamber of Labor.
Acknowledgments: The authors would like to thank Sylvain Hoffmann and David Büchel.
Conflicts of Interest: The authors declare no conflict of interest. The funders had no role in the design of thestudy; in the collection, analyses, or interpretation of data; in the writing of the manuscript; or in the decision topublish the results.
Int. J. Environ. Res. Public Health 2020, 17, 7771 21 of 31
Appendix A
Table A1. Quality of Work items.
Area Dimension Variable Item Answer Category
Job design
ParticipationPart1 To what extent are you involved in decisions in
your organisation? 1 (= to a very low extent) to 5 (= to a very large extent)
Part2 To what extent does your superior consider your opinion indecisions or in upcoming changes? 1 (= to a very low extent) to 5 (= to a very large extent)
FeedbackFeed1 To what extent do you receive feedback about your work from
your superior or from your colleagues? 1 (= to a very low extent) to 5 (= to a very large extent)
Feed2 To what extent do you receive feedback from your superiorabout your professional competences? 1 (= to a very low extent) to 5 (= to a very large extent)
Autonomy
Auto1 To what extent can you decide how you carry out your work? 1 (= to a very low extent) to 5 (= to a very large extent)
Auto2 To what extent can you determine your working hours yourself? 1 (= to a very low extent) to 5 (= to a very large extent)
Auto3 To what extent can you determine the order of your worktasks yourself? 1 (= to a very low extent) to 5 (= to a very large extent)
Auto4 To what extent can you determine the content of yourwork yourself? 1 (= to a very low extent) to 5 (= to a very large extent)
Work intensity
Mental demandsMD1 To what extent does your work demand concentration? 1 (= to a very low extent) to 5 (= to a very large extent)
MD2 To what extent is your work intellectually challenging? 1 (= to a very low extent) to 5 (= to a very large extent)
Time pressureTP1 How often are you under time pressure or rushed in your work? 1 (= never) to 5 (= (almost) always)
TP2 How often are you required to meet tight deadlines inyour work? 1 (= never) to 5 (= (almost) always)
Emotional demandsED1 How often does your work require you to control your feelings? 1 (= never) to 5 (= (almost) always)
ED2 How often does your work require you to hide yourtrue feelings? 1 (= never) to 5 (= (almost) always)
Int. J. Environ. Res. Public Health 2020, 17, 7771 22 of 31
Table A1. Cont.
Area Dimension Variable Item Answer Category
Social conditions
Social support
Sup1 To what extent are you supported in your work byyour colleagues? 1 (= to a very low extent) to 5 (= to a very large extent)
Sup2 To what extent do you and your colleagues help one anotherwith work-related problems? 1 (= to a very low extent) to 5 (= to a very large extent)
Sup3 To what extent are you able to ask your colleagues for help forwork-related problems? 1 (= to a very low extent) to 5 (= to a very large extent)
Competition
Comp1 To what extent are you competing with your colleagues? 1 (= to a very low extent) to 5 (= to a very large extent)
Comp2 To what extent is there any competition amongstyour colleagues? 1 (= to a very low extent) to 5 (= to a very large extent)
Comp3 To what extent is there competitive pressure in your work area? 1 (= to a very low extent) to 5 (= to a very large extent)
Comp4 To what extent are there rivalries in your group of colleagues? 1 (= to a very low extent) to 5 (= to a very large extent)
Mobbing
Mobb1 How often is your work criticised by your colleagues or byyour superior? 1 (= never) to 5 (= (almost) always)
Mobb2 How often are you ignored at work by your colleagues oryour superior? 1 (= never) to 5 (= (almost) always)
Mobb3 How often are you assigned meaningless tasks byyour superior? 1 (= never) to 5 (= (almost) always)
Mobb4 How often are you ridiculed in front of others by your superioror by your colleagues? 1 (= never) to 5 (= (almost) always)
Mobb5 How often are you in conflict with your colleagues or superior? 1 (= never) to 5 (= (almost) always)
Physical conditions
Physical burdenPB1 How often is your work physically strenuous, e.g., does it
involve prolonged standing? 1 (= never) to 5 (= (almost) always)
PB2 How often does your work leave you physically exhausted? 1 (= never) to 5 (= (almost) always)
Risk of accidentRA1 To what extent does your work put you at risk of accident
and injury? 1 (= to a very low extent) to 5 (= to a very large extent)
RA2 To what extent is your work carried out in working conditionsthat are harmful to health? 1 (= to a very low extent) to 5 (= to a very large extent)
Int. J. Environ. Res. Public Health 2020, 17, 7771 23 of 31
Table A2. Quality of Employment items.
Area Variable Item Answer Category
Training opportunitiesTO1 To what extent do you have possibilities to engage in
further training in your organization? 1 (= to a very low extent) to 5 (= to a very large extent)
TO2 To what extent does your organization support you toundertake further training? 1 (= to a very low extent) to 5 (= to a very large extent)
Career advancementCA1 To what extent do you have possibilities of advancement
and promotion in your organization? 1 (= to a very low extent) to 5 (= to a very large extent)
CA2 To what extent does your organization support professionaladvancement or promotion? 1 (= to a very low extent) to 5 (= to a very large extent)
Job securityJS1 To what extent do you consider your own job as being safe? 1 (= to a very low extent) to 5 (= to a very large extent)
JS2 To what extent are you afraid to lose your job? (reversed) 1 (= to a very low extent) to 5 (= to a very large extent)
EmployabilityEmp1 How difficult would it be for you to find a similar job, if
you were to lose or resign from your job? (reversed) 1 (= not difficult at all) to 5 (= very difficult)
Emp2 And how difficult would it be for you to actually find a job,if you were to lose or resign from your job? (reversed) 1 (= not difficult at all) to 5 (= very difficult)
Work life conflict
WLC1 How often are you unable to reconcile your work and yourprivate life? 1 (= never) to 5 (= (almost) always)
WLC2 How difficult is it for you to give the necessary attention toyour work as well as your private life? 1 (= not difficult at all) to 5 (= very difficult)
WLC3 How often are conflicts arising as a result of the demands ofyour work and those of your private life? 1 (= never) to 5 (= (almost) always)
Income satisfactionIS1 To what extent does your salary reflect your work input? 1 (= to a very low extent) to 5 (= to a very large extent)
IS2 How satisfied are you at present with your salary? 1 (= to a very low extent satisfied) to5 (= to a very large extent satisfied)
Int. J. Environ. Res. Public Health 2020, 17, 7771 24 of 31
Table A3. Working time and atypical working hours.
Area Variable Item Answer Category
Working time WT With reference to the last 12 months, how many hours a week do you workon average? Please include any regular additional time or overtime. Open ended
Atypical working hours AWH How many days per month do you work in the evening from 7 PM or atnight from 10 PM or at the weekend? Open ended
Table A4. Outcome items.
Area Variable Item Answer Category
Work satisfaction
WS1 How satisfied are you at present with your work? 1 (= to a very low extent satisfied) to 5(= to a very large extent satisfied)
WS2 How satisfied are you at present with the work atmosphereat work?
1 (= to a very low extent satisfied) to 5(= to a very large extent satisfied)
WS3 How satisfied are you at present with the workingconditions at work?
1 (= to a very low extent satisfied) to 5(= to a very large extent satisfied)
Burnout
Burn1 How often do you feel exhausted at the end of aworking day? 1 (= never) to 5 (= (almost) always)
Burn2 How often do you feel exhausted in the morning at thethought of a new working day? 1 (= never) to 5 (= (almost) always)
Burn3 How often do you feel that every working hour isexhausting for you? 1 (= never) to 5 (= (almost) always)
Burn4 To what extent is your work emotionally exhausting? 1 (= to a very low extent) to5 (= to a very large extent)
Burn5 To what extent are you frustrated by your work? 1 (= to a very low extent) to5 (= to a very large extent)
Burn6 To what extent Do you feel burnt out by your work? 1 (= to a very low extent) to5 (= to a very large extent)
Int. J. Environ. Res. Public Health 2020, 17, 7771 25 of 31
Table A4. Cont.
Area Variable Item Answer Category
General well-being (WHO-5)
WHO1 In the last two weeks I have been happy and in agood mood. 1 (= at no time) to 5 (= all the time)
WHO2 In the last two weeks I have felt calm and relaxed. 1 (= at no time) to 5 (= all the time)
WHO3 In the last two weeks I have felt energetic and active. 1 (= at no time) to 5 (= all the time)
WHO4 In the last two weeks I have woken up refreshed andwell rested. 1 (= at no time) to 5 (= all the time)
WHO5 In the last two weeks my day-to-day life has been busy withthings that interest me. 1 (= at no time) to 5 (= all the time)
Subjective physiologicalhealth problems
SPHP1 How often have you experienced health problems in thelast 12 months? 1 (= never) to 5 (= (almost) always)
SPHP2 How often in the last 12 months have you hadheart problems? 1 (= never) to 5 (= (almost) always)
SPHP3 How often in the last 12 months have you had headaches? 1 (= never) to 5 (= (almost) always)
SPHP4 How often in the last 12 months have you hadback problems? 1 (= never) to 5 (= (almost) always)
SPHP5 How often in the last 12 months have you hadjoint problems? 1 (= never) to 5 (= (almost) always)
SPHP6 How often in the last 12 months have you hadstomach problems? 1 (= never) to 5 (= (almost) always)
SPHP7 How often in the last 12 months have you had insomnia? 1 (= never) to 5 (= (almost) always)
Vigor
Vigor1 How often do you have the feeling that you areoverflowing with energy at work? 1 (= never) to 5 (= (almost) always)
Vigor2 How often do you feel fit and vigorous at work? 1 (= never) to 5 (= (almost) always)
Vigor3 How often do you look forward to going to work as you getup in the morning? 1 (= never) to 5 (= (almost) always)
Work performanceWP1 How do you evaluate your overall work performance in
comparison with that of your colleagues?1 (= below average) to
5 (= above average)
WP2 How does your superior evaluate your overallwork performance?
1 (= below average) to5 (= above average)
Int. J. Environ. Res. Public Health 2020, 17, 7771 26 of 31
References
1. Balliester, T.; Elsheikhi, A. The Future of Work: A Literature Review. Available online: https://www.ilo.org/wcmsp5/groups/public/---dgreports/---inst/documents/publication/wcms_625866.pdf (accessed on23 October 2020).
2. Trends in Job Quality in Europe; Publications Office of the European Union: Luxembourg, 2012.3. Burchell, B.; Ladipo, D.; Wilkinson, F. (Eds.) Job Insecurity and Work Intensification; Routledge: London,
UK, 2002.4. Fifth European Working Conditions Survey—Overview Report; Publications Office of the European Union:
Luxembourg, 2012. Available online: https://www.eurofound.europa.eu/de/publications/report/2012/working-conditions/fifth-european-working-conditions-survey-overview-report (accessed on 23 October 2020).
5. Clark, A.E. Your money or your life: Changing job quality in OECD countries. Br. J. Ind. Relat. 2005, 43,377–400. [CrossRef]
6. Green, F. Work intensification, discretion, and the decline in well-being at work. East. Econ. J. 2004, 30,615–626.
7. Kalleberg, A.L.; Vaisey, S. Pathways to a good job: Perceived work quality among the machinists in NorthAmerica. Br. J. Ind. Relat. 2005, 43, 431–454. [CrossRef]
8. De Bustillo, R.M.; Fernández-Macías, E.; Esteve, F.; Antón, J.I. E pluribus unum? A critical survey of jobquality indicators. Socio Econ. Rev. 2011, 9, 447–475. [CrossRef]
9. Grote, G.; Guest, D. The case for reinvigorating quality of working life research. Hum. Relat. 2017, 70,149–167. [CrossRef]
10. Burchell, B.; Sehnbruch, K.; Piasna, A.; Agloni, N. The quality of employment and decent work: Definitions,methodologies, and ongoing debates. Camb. J. Econ. 2014, 38, 459–477. [CrossRef]
11. Findlay, P.; Kalleberg, A.L.; Warhurst, C. The challenge of job quality. Hum. Relat. 2013, 66, 441–451.[CrossRef]
12. Gallie, D. Production regimes and the quality of employment in Europe. Annu. Rev. Sociol. 2007, 33, 85–104.[CrossRef]
13. Van Aerden, K.; Puig-Barrachina, V.; Bosmans, K.; Vanroelen, C. How does employment quality relate tohealth and job satisfaction in Europe? A typological approach. Soc. Sci. Med. 2016, 158, 132–140. [CrossRef]
14. Gallie, D. The quality of working life: Is Scandinavia different? Eur. Sociol. Rev. 2003, 19, 61–79. [CrossRef]15. Gallie, D. Production regimes, employment regimes, and the quality of work. In Employment Regimes and the
Quality of Work; Gallie, D., Ed.; Oxford University Press: Oxford, UK, 2007; pp. 1–33.16. Piasna, A.; Burchell, B.; Sehnbruch, K.; Agloni, N. Job quality: Conceptual and methodological challenges for
comparative analysis. In Making Work More Equal; Grimshaw, D., Fagan, C., Hebson, G., Tavora, I., Eds.;Manchester University Press: Manchester, UK, 2017; pp. 168–187.
17. Steffgen, G.; Kohl, D.; Reese, G.; Happ, C.; Sischka, P. Quality of work: Validation of a new instrument inthree languages. Int. J. Environ. Res. Public Health 2015, 12, 14988–15006. [CrossRef] [PubMed]
18. Muñoz de Bustillo, R.; Fernandez-Macias, E.; Antón, J.I.; Esteve, F. Indicators of Job Quality in theEuropean Union. Available online: https://www.europarl.europa.eu/document/activities/cont/201107/
20110718ATT24284/20110718ATT24284EN.pdf (accessed on 23 October 2020).19. De Bustillo, R.M.; Fernandez-Macias, E.; Antón, J.I.; Esteve, F. Measuring more than Money: The Social Economics
of Job Quality; Edward Elgar: Cheltenham, UK, 2011.20. Cazes, S.; Hijzen, A.; Saint-Martin, A. Measuring and assessing job quality. The OECED job quality framework.
Oecd Soc. Employ. Migr. Work. Pap. 2015, 174. [CrossRef]21. Ritter, J.A.; Anker, R. Good jobs, bad jobs: Workers’ evaluations in five countries. Int. Labour Rev. 2002, 141,
331–358. [CrossRef]22. Sixth European Working Conditions Survey—Technical Report. Available online: http://www.eurofound.
europa.eu/sites/default/files/ef_survey/field_ef_documents/6th_ewcs_-_technical_report.pdf (accessed on23 October 2020).
23. Leschke, J.; Watt, A.; Finn, M. Putting a Number on Job Quality? Constructing a European Job Quality Index.Available online: https://library.fes.de/pdf-files/gurn/00367.pdf (accessed on 23 October 2020).
24. Leschke, J.; Watt, A. Challenges in constructing a multi-dimensional European job quality index.Soc. Indic. Res. 2014, 118, 1–31. [CrossRef]
Int. J. Environ. Res. Public Health 2020, 17, 7771 27 of 31
25. Holler, M.; Krüger, T.; Mußmann, F. Die Weiterentwicklung des DGB-Index Gute Arbeit. Z. Für Arb. 2014, 68,163–174. [CrossRef]
26. European Commission (Ed.) Employment in Europe 2008; Office for Official Publications of the EuropeanCommunities: Luxembourg, 2008.
27. Jackson, A.; Kumar, P. Measuring and monitoring the quality of jobs and the work environment in Canada.In Proceedings of the CSLS Conference on the State of Living Standards and the Quality of Life, Centre forthe Study of Living Standards, Ottawa, ON, Canada, 31 October 1998.
28. Caprile, M.; Potrony, J. IQT. Objetivos y metodología. In Anuario Sociolaboral de la UGT de Catalunya; UGT,Ed.; UGT and CRESC: Barcelona, Spain, 2005; Volume 2, pp. 53–63.
29. European Commission. Employment and Social Policy: A Framework for Investing in Quality; Communicationfrom the Commission to the European Parliament, the Economic and Social Committee and the Committeeof the Regions, COM: Brussels, Belgium, 2001; p. 313.
30. Union of Industrials and Employers’ Confederations of Europe (UNICE). UNICE Position Paper on theCommission Communication “Employment and Social Policies: A Framework for Investing in Quality”.Available online: http://www.businesseurope.eu (accessed on 23 October 2020).
31. Employment Committee (EMCO). Quality in Work—Thematic Review 2010; Employment Committee (EMCO):Brussels, Belgium, 2010.
32. International Labour Organization (ILO). Decent Work Indicators: Concepts and Definitions; ILO Manual:Geneva, Sweden, 2012.
33. Sixth European Working Conditions Survey—Overview Report; Publications Office of the European Union:Luxembourg, 2016.
34. United Nations Economic Commission for Europe (UNECE). Handbook on Measuring Quality of Employment.A Statistical Framework; United Nations Economic Commission for Europe: New York, NY, USA, 2015.
35. Vandenbrande, T.; Vandekerckhove, S.; Vendramin, P.; Valenduc, G.; Huys, R.; Van Hootegem, G.; De Witte, H.Quality of Work and Employment in Belgium; Eurofound: Dublin, Ireland, 2013.
36. Díaz-Chao, Á.; Ficapal-Cusí, P.; Torrent Sellens, J. Workplace or Working Environment? Job Quality andEconomic Crisis in Spain; Internet Interdisciplinary Institute, Open University of Catalonia (UOC): Barcelona,Spain, 2014.
37. Hauff, S.; Kirchner, S. Cross-National Differences and Trends in Job Quality. A Literature Review and ResearchAgenda; Universität Hamburg: Hamburg, Germany, 2014.
38. Vandenberg, R.J.; Lance, C.E. A review and synthesis of the measurement invariance literature: Suggestions,practices, and recommendations for organizational research. Organ. Res. Methods 2000, 3, 4–70. [CrossRef]
39. Humphrey, S.E.; Nahrgang, J.D.; Morgeson, F.P. Integrating motivational, social, and contextual work designfeatures: A meta-analytic summary and theoretical extension of the work design literature. J. Appl. Psychol.2007, 92, 1332–1356. [CrossRef]
40. Karasek, R.A. Job demands, job decision latitude, and mental strain: Implications for job redesign. Adm. Sci. Q1979, 24, 285–308. [CrossRef]
41. Johnson, J.V.; Hall, E.M. Job strain, work place social support, and cardiovascular disease: A cross-sectionalstudy of a random sample of the Swedish working population. Am. J. Public Health 1988, 78, 1336–1342.[CrossRef]
42. Bakker, A.B.; Demerouti, E. The job demands-resources model: State of the art. J. Manag. Psychol. 2007, 22,309–328. [CrossRef]
43. Bakker, A.B.; Demerouti, E. Job demands–resources theory: Taking stock and looking forward. J. Occup.Health Psychol. 2017, 22, 273–285. [CrossRef]
44. Bakker, A.B.; Demerouti, E.; De Boer, E.; Schaufeli, W.B. Job demands and job resources as predictors ofabsence duration and frequency. J. Vocat. Behav. 2003, 62, 341–356. [CrossRef]
45. Bakker, A.B.; Demerouti, E.; Euwema, M.C. Job resources buffer the impact of job demands on burnout.J. Occup. Health Psychol. 2005, 10, 170–180. [CrossRef] [PubMed]
46. Llorens, S.; Bakker, A.B.; Schaufeli, W.; Salanova, M. Testing the robustness of the job demands-resourcesmodel. Int. J. Stress Manag. 2006, 13, 378–391. [CrossRef]
47. Jackson, S.E. Participation in decision making as a strategy for reducing job-related strain. J. Appl. Psychol.1983, 68, 3–19. [CrossRef]
Int. J. Environ. Res. Public Health 2020, 17, 7771 28 of 31
48. Reeves, D.W.; Walsh, B.M.; Tuller, M.D.; Magley, V.J. The positive effects of participative decision making formidlevel correctional management. Crim. Justice Behav. 2012, 39, 1361–1372. [CrossRef]
49. Gallie, D. Direct participation and the quality of work. Hum. Relat. 2013, 66, 453–473. [CrossRef]50. Crawford, E.R.; LePine, J.A.; Rich, B.L. Linking job demands and resources to employee engagement and
burnout: A theoretical extension and meta-analytic test. J. Appl. Psychol. 2010, 95, 834–848. [CrossRef]51. Nielsen, K.; Nielsen, M.B.; Ogbonnaya, C.; Känsälä, M.; Saari, E.; Isaksson, K. Workplace resources to improve
both employee well-being and performance: A systematic review and meta-analysis. Work Stress 2017, 31,101–120. [CrossRef]
52. Alarcon, G.M. A meta-analysis of burnout with job demands, resources, and attitudes. J. Vocat. Behav. 2011,79, 549–562. [CrossRef]
53. Halbesleben, J.R. A meta-analysis of work engagement: Relationships with burnout, demands, resources,and consequences. In Work Engagement: A Handbook of Essential Theory and Research; Bakker, A.B., Leiter, M.P.,Eds.; Psychology Press: Hove, UK, 2010; pp. 102–117.
54. Meijman, T.F.; Mulder, G. Psychological aspects of workload. In Handbook of Work and OrganizationalPsychology, Volume 2, Work psychology, 2nd ed.; Drenth, P.J.D., Thierry, H., Wolff, C.J.D., Eds.; PsychologyPress: Hove, UK, 1998; pp. 5–39.
55. Michélsen, H.; Bildt, C. Psychosocial conditions on and off the job and psychological ill health: Depressivesymptoms, impaired psychological wellbeing, heavy consumption of alcohol. Occup. Environ. Med. 2003, 60,489–496. [CrossRef]
56. LePine, J.A.; Podsakoff, N.P.; LePine, M.A. A meta-analytic test of the challenge stressor–hindrance stressorframework: An explanation for inconsistent relationships among stressors and performance. Acad. Manag. J.2005, 48, 764–775. [CrossRef]
57. Ilies, R.; Dimotakis, N.; De Pater, I.E. Psychological and physiological reactions to high workloads:Implications for well-being. Pers. Psychol. 2010, 63, 407–436. [CrossRef]
58. Sonnentag, S.; Arbeus, H.; Mahn, C.; Fritz, C. Exhaustion and lack of psychological detachment from workduring off-job time: Moderator effects of time pressure and leisure experiences. J. Occup. Health Psychol.2014, 19, 206–216. [CrossRef]
59. Hülsheger, U.R.; Schewe, A.F. On the costs and benefits of emotional labor: A meta-analysis of three decadesof research. J. Occup. Health Psychol. 2011, 16, 361–389. [CrossRef]
60. Zapf, D. Emotion work and psychological well-being: A review of the literature and some conceptualconsiderations. Hum. Resour. Manag. Rev. 2002, 12, 237–268. [CrossRef]
61. Viswesvaran, C.; Sanchez, J.I.; Fisher, J. The role of social support in the process of work stress: A meta-analysis.J. Vocat. Behav. 1999, 54, 314–334. [CrossRef]
62. Keller, A.C.; Spurk, D.; Baumeler, F.; Hirschi, A. Competitive climate and workaholism: Negative sides offuture orientation and calling. Personal. Individ. Differ. 2016, 96, 122–126. [CrossRef]
63. Agervold, M.; Mikkelsen, E.G. Relationships between bullying, psychosocial work environment andindividual stress reactions. Work Stress 2004, 18, 336–351. [CrossRef]
64. Nielsen, M.B.; Einarsen, S. Outcomes of exposure to workplace bullying: A meta-analytic review. Work Stress2012, 26, 309–332. [CrossRef]
65. Nahrgang, J.D.; Morgeson, F.P.; Hofmann, D.A. Safety at work: A meta-analytic investigation of the linkbetween job demands, job resources, burnout, engagement, and safety outcomes. J. Appl. Psychol. 2011, 96,71–94. [CrossRef] [PubMed]
66. Bailey, T.S.; Dollard, M.F.; McLinton, S.S.; Richards, P.A. Psychosocial safety climate, psychosocial andphysical factors in the aetiology of musculoskeletal disorder symptoms and workplace injury compensationclaims. Work Stress 2015, 29, 190–211. [CrossRef]
67. Burr, H.; Pohrt, A.; Rugulies, R.; Holtermann, A.; Hasselhorn, H.M. Does age modify the association betweenphysical work demands and deterioration of self-rated general health? Scand. J. Work. Health 2017, 43,241–249. [CrossRef] [PubMed]
68. Schmidt, S.W. The relationship between satisfaction with workplace training and overall job satisfaction.Hum. Resour. Dev. Q 2007, 18, 481–498. [CrossRef]
69. Bakker, A.B. An evidence-based model of work engagement. Curr. Dir. Psychol. Sci. 2011, 20, 265–269. [CrossRef]70. Koster, F.; De Grip, A.; Fouarge, D. Does perceived support in employee development affect personnel
turnover? Int. J. Hum. Resour. Manag. 2011, 22, 2403–2418. [CrossRef]
Int. J. Environ. Res. Public Health 2020, 17, 7771 29 of 31
71. Kalleberg, A.L. Work values and job rewards: A theory of job satisfaction. Am. Sociol. Rev. 1977, 42, 124–143.[CrossRef]
72. Poon, J.M. Relationships among perceived career support, affective commitment, and work engagement.Int. J. Psychol. 2013, 48, 1148–1155. [CrossRef]
73. Kraimer, M.L.; Seibert, S.E.; Wayne, S.J.; Liden, R.C.; Bravo, J. Antecedents and outcomes of organizationalsupport for development: The critical role of career opportunities. J. Appl. Psychol. 2011, 96, 485–500. [CrossRef]
74. Sverke, M.; Hellgren, J.; Näswall, K. No security: A meta-analysis and review of job insecurity and itsconsequences. J. Occup. Health Psychol. 2002, 7, 242–264. [CrossRef]
75. De Cuyper, N.; Bernhard-Oettel, C.; Berntson, E.; Witte, H.D.; Alarco, B. Employability and employees’well-being: Mediation by job insecurity. Appl. Psychol. 2008, 57, 488–509. [CrossRef]
76. Lunau, T.; Bambra, C.; Eikemo, T.A.; Van der Wel, K.A.; Dragano, N. A balancing act? Work–life balance,health and well-being in European welfare states. Eur. J. Public Health 2014, 24, 422–427. [CrossRef] [PubMed]
77. Nohe, C.; Meier, L.L.; Sonntag, K.; Michel, A. The chicken or the egg? A meta-analysis of panel studies ofthe relationship between work–family conflict and strain. J. Appl. Psychol. 2015, 100, 522–536. [CrossRef][PubMed]
78. Williams, M.L.; McDaniel, M.A.; Nguyen, N.T. A meta-analysis of the antecedents and consequences of paylevel satisfaction. J. Appl. Psychol. 2006, 91, 392–413. [CrossRef] [PubMed]
79. Kahneman, D.; Deaton, A. High income improves evaluation of life but not emotional well-being. Proc. Natl.Acad. Sci. USA 2010, 107, 16489–16493. [CrossRef] [PubMed]
80. Boyce, C.J.; Brown, G.D.; Moore, S.C. Money and happiness: Rank of income, not income, affects lifesatisfaction. Psychol. Sci. 2010, 21, 471–475. [CrossRef]
81. Hakanen, J.J.; Schaufeli, W.B.; Ahola, K. The job demands-resources model: A three-year cross-lagged studyof burnout, depression, commitment, and work engagement. Work Stress 2008, 22, 224–241. [CrossRef]
82. Nixon, A.E.; Mazzola, J.J.; Bauer, J.; Krueger, J.R.; Spector, P.E. Can work make you sick? A meta-analysis ofthe relationships between job stressors and physical symptoms. Work Stress 2011, 25, 1–22. [CrossRef]
83. Bowling, N.A.; Eschleman, K.J.; Wang, Q. A meta-analytic examination of the relationship between jobsatisfaction and subjective well-being. J. Occup. Organ. Psychol. 2010, 83, 915–934. [CrossRef]
84. Harrison, D.A.; Newman, D.A.; Roth, P.L. How important are job attitudes? Meta-analytic comparisons ofintegrative behavioral outcomes and time sequences. Acad. Manag. J. 2006, 49, 305–325. [CrossRef]
85. Tett, R.P.; Meyer, J.P. Job satisfaction, organizational commitment, turnover intention, and turnover:Path analyses based on meta-analytic findings. Pers. Psychol. 1993, 46, 259–293. [CrossRef]
86. Schaufeli, W.B.; Bakker, A.B.; Salanova, M. The measurement of work engagement with a short questionnaire:A cross-national study. Educ. Psychol. Meas. 2006, 66, 701–716. [CrossRef]
87. González-Romá, V.; Schaufeli, W.B.; Bakker, A.B.; Lloret, S. Burnout and work engagement: Independentfactors or opposite poles? J. Vocat. Behav. 2006, 68, 165–174. [CrossRef]
88. Leymann, H. Handanleitung für den LIPT-Fragebogen; [Leymann Inventory of Psychological Terror]; DeutscheGesellschaft für Verhaltenstherapie Verlag: Tübingen, Germany, 1996.
89. Morgeson, F.P.; Humphrey, S.E. The Work Design Questionnaire (WDQ): Developing and validating acomprehensive measure for assessing job design and the nature of work. J. Appl. Psychol. 2006, 91, 1321–1339.[CrossRef]
90. Burr, H.; Berthelsen, H.; Moncada, S.; Nübling, M.; Dupret, E.; Demiral, Y.; Oudyk, J.; Kristensen, T.S.;Llorens, C.; Navarro, A.; et al. The third version of the Copenhagen Psychosocial Questionnaire.Safety Health Work 2019, 10, 482–503. [CrossRef]
91. Tourangeau, R.; Rips, L.J.; Rasinski, K. The Psychology of Survey Response; University Press: Cambridge,UK, 2000.
92. Rammstedt, B.; Beierlein, C. Can’t we make it any shorter? J. Individ. Differ. 2014, 35, 212–220. [CrossRef]93. Fisher, G.G.; Matthews, R.A.; Gibbons, A.M. Developing and investigating the use of single-item measures
in organizational research. J. Occup. Health Psychol. 2016, 21, 3–23. [CrossRef]94. Steffgen, G.; Sischka, P.; Schmidt, A.F.; Kohl, D.; Happ, C. The Luxembourg workplace mobbing scale.
Psychometric properties of a short instrument in three different languages. Eur. J. Psychol. Assess. 2019, 35,164–171. [CrossRef]
95. Sischka, P.E.; Schmidt, A.F.; Steffgen, G. Further evidence for criterion validity and measurement invarianceof the Luxembourg Workplace Mobbing Scale. Eur. J. Psychol. Assess. 2020, 36, 32–43. [CrossRef]

Int. J. Environ. Res. Public Health 2020, 17, 7771 30 of 31
96. Kristensen, T.S.; Borritz, M.; Villadsen, E.; Christensen, K.B. The copenhagen burnout inventory: A new toolfor the assessment of burnout. Work Stress 2005, 19, 192–207. [CrossRef]
97. World Health Organization (WHO). Well-Being Measures in Primary Health Care: The DepCare Project; WHORegional Office for Europe: Copenhagen, Denmark, 1998.
98. Topp, C.W.; Østergaard, S.D.; Søndergaard, S.; Bech, P. The WHO-5 Well-Being Index: A systematic reviewof the literature. Psychother. Psychosom. 2015, 84, 167–176. [CrossRef] [PubMed]
99. Sischka, P.E.; Costa, A.P.; Steffgen, G.; Schmidt, A.F. The WHO-5 Well-Being Index—Validation basedon item response theory and the analysis of measurement invariance across 35 countries. 2020;Unpublished manuscript.
100. Ercikan, K.; Lyons-Thomas, J. Adapting tests for use in other languages and cultures. In APA Handbookof Testing and Assessment in Psychology, Vol. 3: Testing and Assessment in School Psychology and Education;Geisinger, K.F., Bracken, B.A., Carlson, J.F., Hansen, J.I.C., Kuncel, N.R., Reise, S.P., Rodriguez, M.C., Eds.;American Psychological Association: Washington, DC, USA, 2013; pp. 545–569.
101. Van Widenfelt, B.M.; Treffers, P.D.; De Beurs, E.; Siebelink, B.M.; Koudijs, E. Translation and cross-culturaladaptation of assessment instruments used in psychological research with children and families. Clin. ChildFamily Psychol. Rev. 2005, 8, 135–147. [CrossRef] [PubMed]
102. Schneiderat, G.; Schlinzig, T. Mobile-and landline-onlys in dual-frame-approaches: Effects on sample quality.In Telephone Surveys in Europe; Häder, S., Häder, M., Kühne, M., Eds.; Springer: Berlin, Germany, 2012;pp. 121–143.
103. Sischka, P.; Steffgen, G. Quality of Work-Index. 5. Forschungsbericht zur Weiterentwicklung des Arbeitsqualitätsindexesin Luxembourg; Universität Luxemburg: Luxembourg, 2019.
104. Van Buuren, S. Flexible Imputation of Missing Data, 2nd ed.; CRC Press: Boca Raton, FL, USA, 2018.105. Eekhout, I.; De Vet, H.C.; De Boer, M.R.; Twisk, J.W.; Heymans, M.W. Passive imputation and parcel
summaries are both valid to handle missing items in studies with many multi-item scales. Stat. MethodsMed. Res. 2018, 27, 1128–1140. [CrossRef]
106. Rubin, D.B. Multiple Imputation for Nonresponse in Surveys; John Wiley & Sons: New York, NY, USA, 1987.107. Sass, D.A. Testing measurement invariance and comparing latent factor means within a confirmatory factor
analysis framework. J. Psychoeduc. Assess. 2011, 29, 347–363. [CrossRef]108. Yuan, K.H.; Bentler, P.M. Three likelihood-based methods for mean and covariance structure analysis with
nonnormal missing data. Sociol. Methodol. 2000, 30, 165–200. [CrossRef]109. Finney, S.J.; DiStefano, C. Nonnormal and categorical data in structural equation modeling. In Structural
Equation Modeling—A Second Course, 2nd ed.; Hancock, G.R., Mueller, R.O., Eds.; Information Age Publishing:Charlotte, NC, USA, 2013; pp. 439–492.
110. Little, T.D. Longitudinal Structural Equation Modeling; Guilford Press: New York, NY, USA, 2013.111. Lee, J.; Little, T.D.; Preacher, K.J. Methodological issues in using structural equation models for testing
differential item functioning. In Cross-Cultural Data Analysis: Methods and Applications; Davidov, E., Schmidt, P.,Billiet, J., Eds.; Routledge: New York, NY, USA, 2011; pp. 55–84.
112. Cheung, G.W.; Rensvold, R.B. Evaluating goodness-of-fit indexes for testing measurement invariance.Struct. Equ. Modeling 2002, 9, 233–255. [CrossRef]
113. Chen, F.F. Sensitivity of goodness of fit indexes to lack of measurement invariance. Struct. Equ. Model. 2007,14, 464–504. [CrossRef]
114. Meade, A.W.; Johnson, E.C.; Braddy, P.W. Power and sensitivity of alternative fit indices in tests ofmeasurement invariance. J. Appl. Psychol. 2008, 93, 568–592. [CrossRef]
115. Enders, C.K.; Bandalos, D.L. The relative performance of full information maximum likelihood estimationfor missing data in structural equation models. Struct. Equ. Model. 2001, 8, 430–457. [CrossRef]
116. R Core Team. R: A Language and Environment for Statistical Computing; R Foundation for Statistical Computing:Vienna, Austria, 2020.
117. Van Buuren, S.; Groothuis-Oudshoorn, K. Mice: Multivariate imputation by chained equations in R.J. Stat. Softw. 2011, 45, 1–67. [CrossRef]
118. Robitsch, A.; Grund, S.; Henke, T. miceadds. Some Additional Multiple Imputation Functions, Especially for‘Mice’, Version 3.10-28, R Package. 2020. Available online: https://cran.r-project.org/web/packages/miceadds/index.html (accessed on 23 October 2020).

Int. J. Environ. Res. Public Health 2020, 17, 7771 31 of 31
119. Tierney, N.; Cook, D.; McBain, M.; Fay, C.; O’Hara-Wild, M.; Hester, J.; Smith, L. Naniar: Data Structures,Summaries, and Visualisations for Missing Data, Version 0.6.0, R package. 2020. Available online:https://cran.r-project.org/web/packages/naniar/index.html (accessed on 23 October 2020).
120. Rosseel, Y. lavaan: An r package for structural equation modeling. J. Stat. Softw. 2012, 48, 1–36. [CrossRef]121. Jorgensen, T.D.; Pornprasertmanit, S.; Schoemann, A.M.; Rosseel, Y.; Miller, P.; Quick, C.; Ben-Shachar, M.S.
semTools: Useful Tools for Structural Equation Modeling, Version 0.5-3, R package. 2020. Available online:https://cran.r-project.org/web/packages/semTools/index.html (accessed on 23 October 2020).
122. Wickham, H.; Chang, W.; Henry, L.; Pedersen, T.L.; Takahashi, K.; Wilke, C.; Woo, K.; Yutani, H.;Dunnington, D. RStudio. ggplot2: Create Elegant Data Visualisations Using the Grammar of Graphics,Version 3.3.1, R Package. 2020. Available online: https://cran.r-project.org/web/packages/ggplot2/index.html(accessed on 23 October 2020).
123. Verkuil, B.; Atasayi, S.; Molendijk, M.L. Workplace bullying and mental health: A meta-analysis oncross-sectional and longitudinal data. PLoS ONE 2015, 10, e0135225. [CrossRef]
124. Hauge, L.J.; Skogstad, A.; Einarsen, S. The relative impact of workplace bullying as a social stressor at work.Scand. J. Psychol. 2010, 51, 426–433. [CrossRef] [PubMed]
125. Hansen, A.M.; Hogh, A.; Persson, R.; Karlson, B.; Garde, A.H.; Orbaek, P. Bullying at work, health outcomes,and physiological stress response. J. Psychosom. Res. 2006, 60, 63–72. [CrossRef]
126. Tuckey, M.R.; Neall, A.M. Workplace bullying erodes job and personal resources: Between-and within-personperspectives. J. Occup. Health Psychol. 2014, 19, 413–424. [CrossRef]
127. Vega, G.; Comer, D.R. Sticks and stones may break your bones, but words can break your spirit: Bullying inthe workplace. J. Bus. Ethics 2005, 58, 101–109. [CrossRef]
128. Amstad, F.T.; Meier, L.L.; Fasel, U.; Elfering, A.; Semmer, N.K. A meta-analysis of work–family conflict andvarious outcomes with a special emphasis on cross-domain versus matching-domain relations. J. Occup.Health Psychol. 2011, 16, 151–169. [CrossRef]
129. Nunnally, J.C.; Bernstein, I.H. Psychometric Theory, 3rd ed.; McGraw-Hill: New York, NY, USA, 1994.130. Streiner, D.L. Starting at the beginning: An introduction to coefficient alpha and internal consistency.
J. Personal. Assess. 2003, 80, 99–103. [CrossRef]131. Elovainio, M.; Heponiemi, T.; Jokela, M.; Hakulinen, C.; Presseau, J.; Aalto, A.M.; Kivimäki, M. Stressful
work environment and wellbeing: What comes first? J. Occup. Health Psychol. 2015, 20, 289–300. [CrossRef]132. Weigold, A.; Weigold, I.K.; Russell, E. Examination of the equivalence of self-report survey-based
paper-and-pencil and internet data collection methods. Psychol. Methods 2013, 18, 53–70. [CrossRef] [PubMed]133. Lang, F.R.; John, D.; Lüdtke, O.; Schupp, J.; Wagner, G.G. Short assessment of the Big Five: Robust across
survey methods except telephone interviewing. Behav. Res. Methods 2011, 43, 548–567. [CrossRef] [PubMed]
Publisher’s Note: MDPI stays neutral with regard to jurisdictional claims in published maps and institutionalaffiliations.
© 2020 by the authors. Licensee MDPI, Basel, Switzerland. This article is an open accessarticle distributed under the terms and conditions of the Creative Commons Attribution(CC BY) license (http://creativecommons.org/licenses/by/4.0/).